Article

Development of Drop Size Distribution Model for Dropwise Condensation on a Superhydrophobic Surface

by
Gerald Jo C. Denoga
1,
Juvy A. Balbarona
1,* and
Hernando S. Salapare III
2,3,4,*
1
Department of Mechanical Engineering, College of Engineering, University of the Philippines Diliman, Quezon City 1101, Philippines
2
Faculty of Education, University of the Philippines Open University, Los Baños 4030, Philippines
3
Air Link International Aviation College, Pasay City 1709, Philippines
4
Université de Haute-Alsace, CNRS, IS2M, UMR 7361, 68100 Mulhouse, France
*
Authors to whom correspondence should be addressed.
Colloids Interfaces 2023, 7(3), 53; https://doi.org/10.3390/colloids7030053
Submission received: 5 April 2023 / Revised: 26 July 2023 / Accepted: 31 July 2023 / Published: 3 August 2023

Abstract

:
This study presents a mathematical model of drop size distribution during dropwise condensation on a superhydrophobic surface. The model is developed by combining a power law growth model, an exponentially decaying population model, and a Gaussian probability model for growth variations. The model is validated against experiment data, with correlations ranging from 88% to 94%. The growth model is shown to sufficiently describe the growth of drops from 0.02 mm to 0.1 mm but may be extrapolated to describe the growth of even smaller drops. The experiment data show that drop size distribution or frequency distribution of drops of different sizes varies significantly with time and may be considered pseudo-cyclic. The developed model, together with the sweep rate of drops, sufficiently describes this behavior and, consequently, may also be used to better estimate the heat transfer rate due to dropwise condensation.

1. Introduction

Condensation is a ubiquitous heat transfer process that involves large amounts of thermal energy. Two forms of condensation may be observed as it occurs on a surface–film-wise condensation and dropwise condensation. Heat transfer rate during dropwise condensation has been shown to be superior compared to its film-wise counterpart, partly due to the higher mobility of condensate when in droplet form. Superhydrophobicity has been shown to initiate dropwise condensation on surfaces whose surface energy has been modified. Various surface modification techniques have been widely studied over the past years, and more sophisticated ones are now made more available with advancements in nanotechnology [1,2,3,4,5,6]. Heat transfer rate due to dropwise condensation is computed by evaluating the heat flux from a condensing surface through a single drop and then evaluating the sum of heat flux through all the drops on the surface using a distribution that gives the number of drops in a given size range in a given surface area [7,8,9]. This approach assumes that drops of various sizes are steadily distributed over the condensing surface at randomly located nucleation sites. It also assumes that the droplet formed is a section of a sphere and that natural convection governs the heat transfer in the vapor phase, and that the temperature of the condensing surface is uniform. Heat transfer through a single drop is highly dependent on the surface energy of the condensing surface as expressed by the contact angle θ as well as the drop size.
Droplets nucleate in random nucleation sites, grow, coalesce, and sweep down the surface. And without delay, new generations of droplets nucleate in the region swept clean by large drops, and the cycle of growth, coalescence, and sweeping repeats. Generations after generations, the incessant droplet growth activities occur at a rate that can be attributed to various factors, including surface properties [10,11,12], surface orientation [13,14,15,16,17], and subcooling temperature [18,19,20]. Because of multiple coalescence that takes place simultaneously, droplets from multiple generations at various sizes may be present on the surface at any point during condensation. This makes it even more challenging to model drop size distribution. To accurately quantify heat transfer during dropwise condensation, various models have been developed to describe drop size distribution [8,21,22,23,24,25,26]. Fatica and Katz [21] proposed a heat transfer model, where they assumed that drops on a given area are of the same size and are uniformly spaced. They also assumed that the drops grow by condensation only. Their model became the starting point in modeling the growth of the first generation of drops. Graham and Griffith [8] used drop size and heat flux measurements from experiments to derive an expression for drop size distribution. The derived equation plus the measured drop sizes from the images was used to evaluate the heat transfer rate. They concluded that at atmospheric pressure, drop conduction resistance was significant, whereas, at lower pressure, interfacial heat transfer was equally as dominant as conduction through the drop. The conclusion presented in their study is intuitive in that at low pressure, interfacial resistance is high, and thus the growth of drops is slower. However, the drop size distribution they used for smaller drops is based only on whichever distribution matched the heat flux for the given temperature difference used in the experiment. Rose and Glicksman [26] presented a theoretical drop size distribution model with the assumption that each generation occupies a constant fraction of the total area irrespective of the stage of its development and that the area available for later generations of drops remains constant. They used a computer program to model the growth of a generation using an initial configuration of non-overlapping circles in a plane that were increased in size incrementally, from which they derived a value for a fraction of available area. Further, they derived a fractional area coverage by idealizing a generation of drops of the same size arranged in an equilateral triangular array and from there, modeled the maximum radius, which may be attained by a drop of the succeeding generation. Wu and Maa [24] developed the population balance model, which assumes that there is a conservation of the number of drops in a given size range. Their assumption of steady drop size distribution implies that there is no accumulation of drops and that the number rate of drops entering a given size range is equal to the number rate leaving. The derivation is simplified by considering the drop to be hemispherical and that the only resistance to drop growth is the temperature difference due to heat conduction through the drop. The population balance model was later on improved by Maa [22] by considering both small drops that grow via direct condensation and drops that grow by coalescence. Using the same concept, Abu-Orabi [23] presented a new expression for the drop size distribution of small drops by incorporating all the resistance to heat transfer due to the drop and the promoter layer. He further showed that an overestimation of heat flux results from considering only the heat conduction through the drop. And as such, the predicted population density of small drops is underestimated. Wu et al. [25] presented a random fractal model to describe drop size and spatial distribution of drops. This stems from the observation that dropwise condensation appears to have self-similarity, and the spatial distribution exhibits randomicity. This served as the basis for the direct numerical simulation of dropwise condensation heat transfer. The results of their study agreed well with the bulk of existing experimental data, mostly published in the 1970s.
The studies cited have established the importance of accurately determining the drop size distribution as it provides important information on the evolution of drops during condensation. Droplet growth rate, coalescence, and eventual detachment from the surface, either by jumping or by sweep effect, significantly affect the number of drops present on the surface at any given time. Due to the dynamic nature of drop growth and evolution, drops of varying sizes may exist simultaneously at any time during dropwise condensation. Thus, the drop size distribution model should adequately model this behavior to improve the calculation of the amount of heat flux and, consequently, to quantify any heat transfer enhancement due to dropwise condensation. The objective of the study is to present a drop size distribution model that describes the spatiotemporal behavior of drops during condensation and validate the model against experiment data on superhydrophobic copper samples.

2. Materials and Methods

2.1. Fabrication of Superhydrophobic Copper

The samples used in the condensation experiment are industrial-grade copper sheets that were subjected to a two-step process resulting in the modification of surface wetting characteristics. The two-step process begins with oxygen plasma treatment at fixed irradiation time and varying power. The second step involves immersion in an ethanol solution of n-octadecyl mercaptan, where a self-assembled monolayer is formed. The resulting surfaces were found to be superhydrophobic with water contact angles ranging from 150° to 160°. Actual condensation experiments were conducted where operating parameters such as steam conditions and cooling water flow rate were fixed while cooling water temperatures were varied. Details of the surface fabrication technique and the condensation experiment are presented in a separate work [27,28].

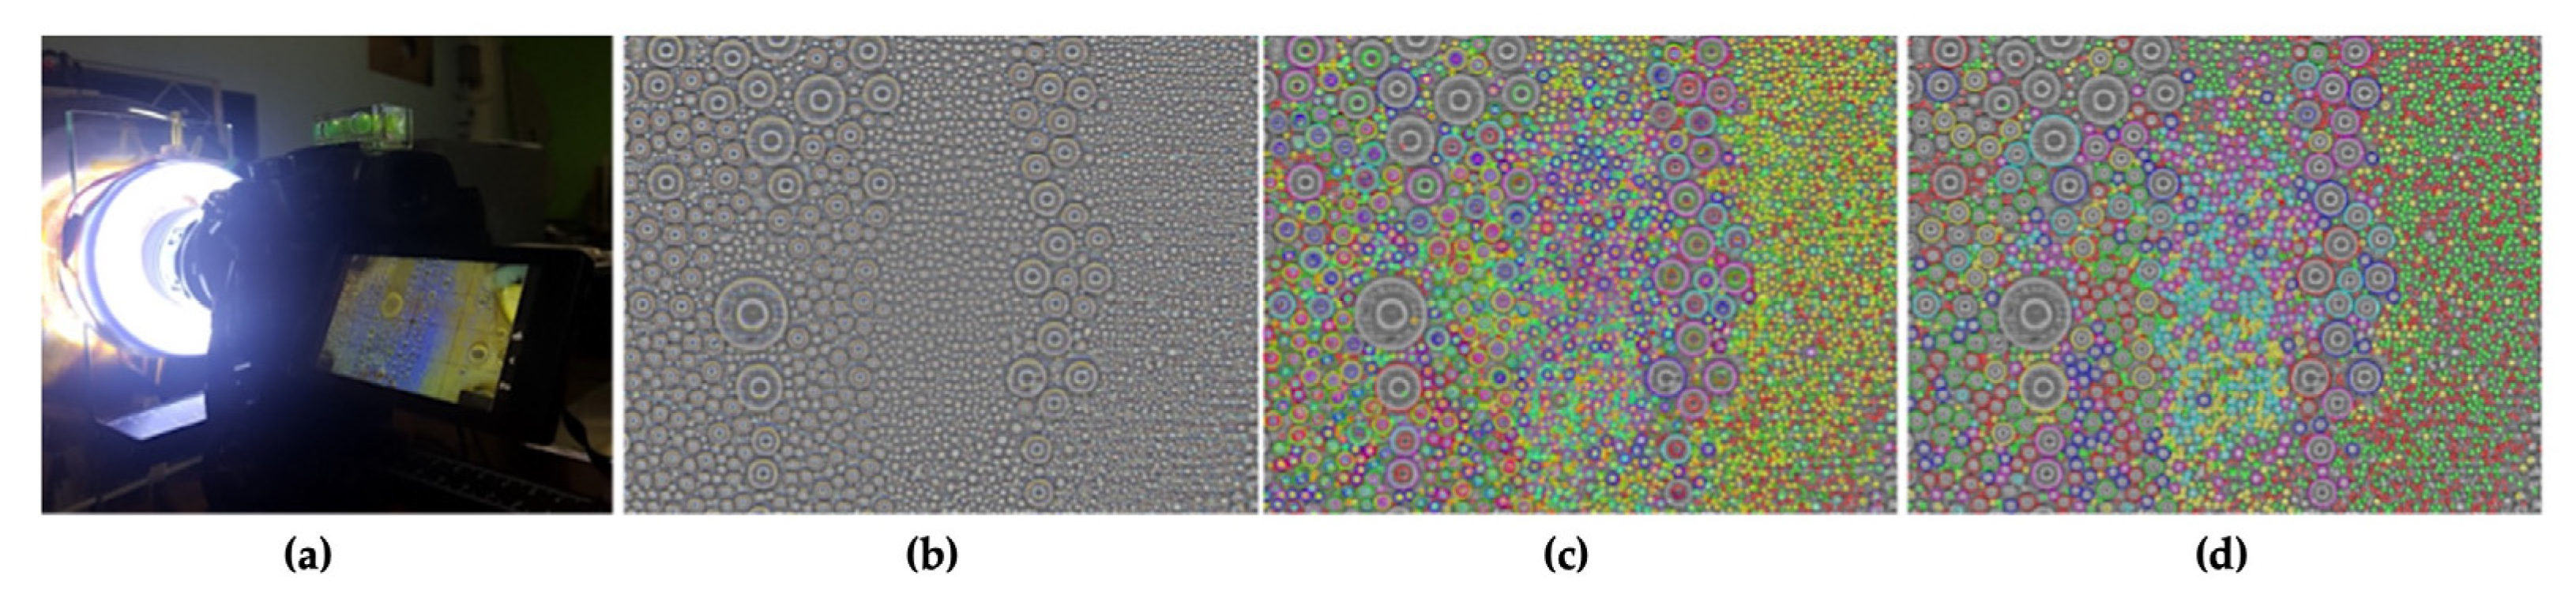
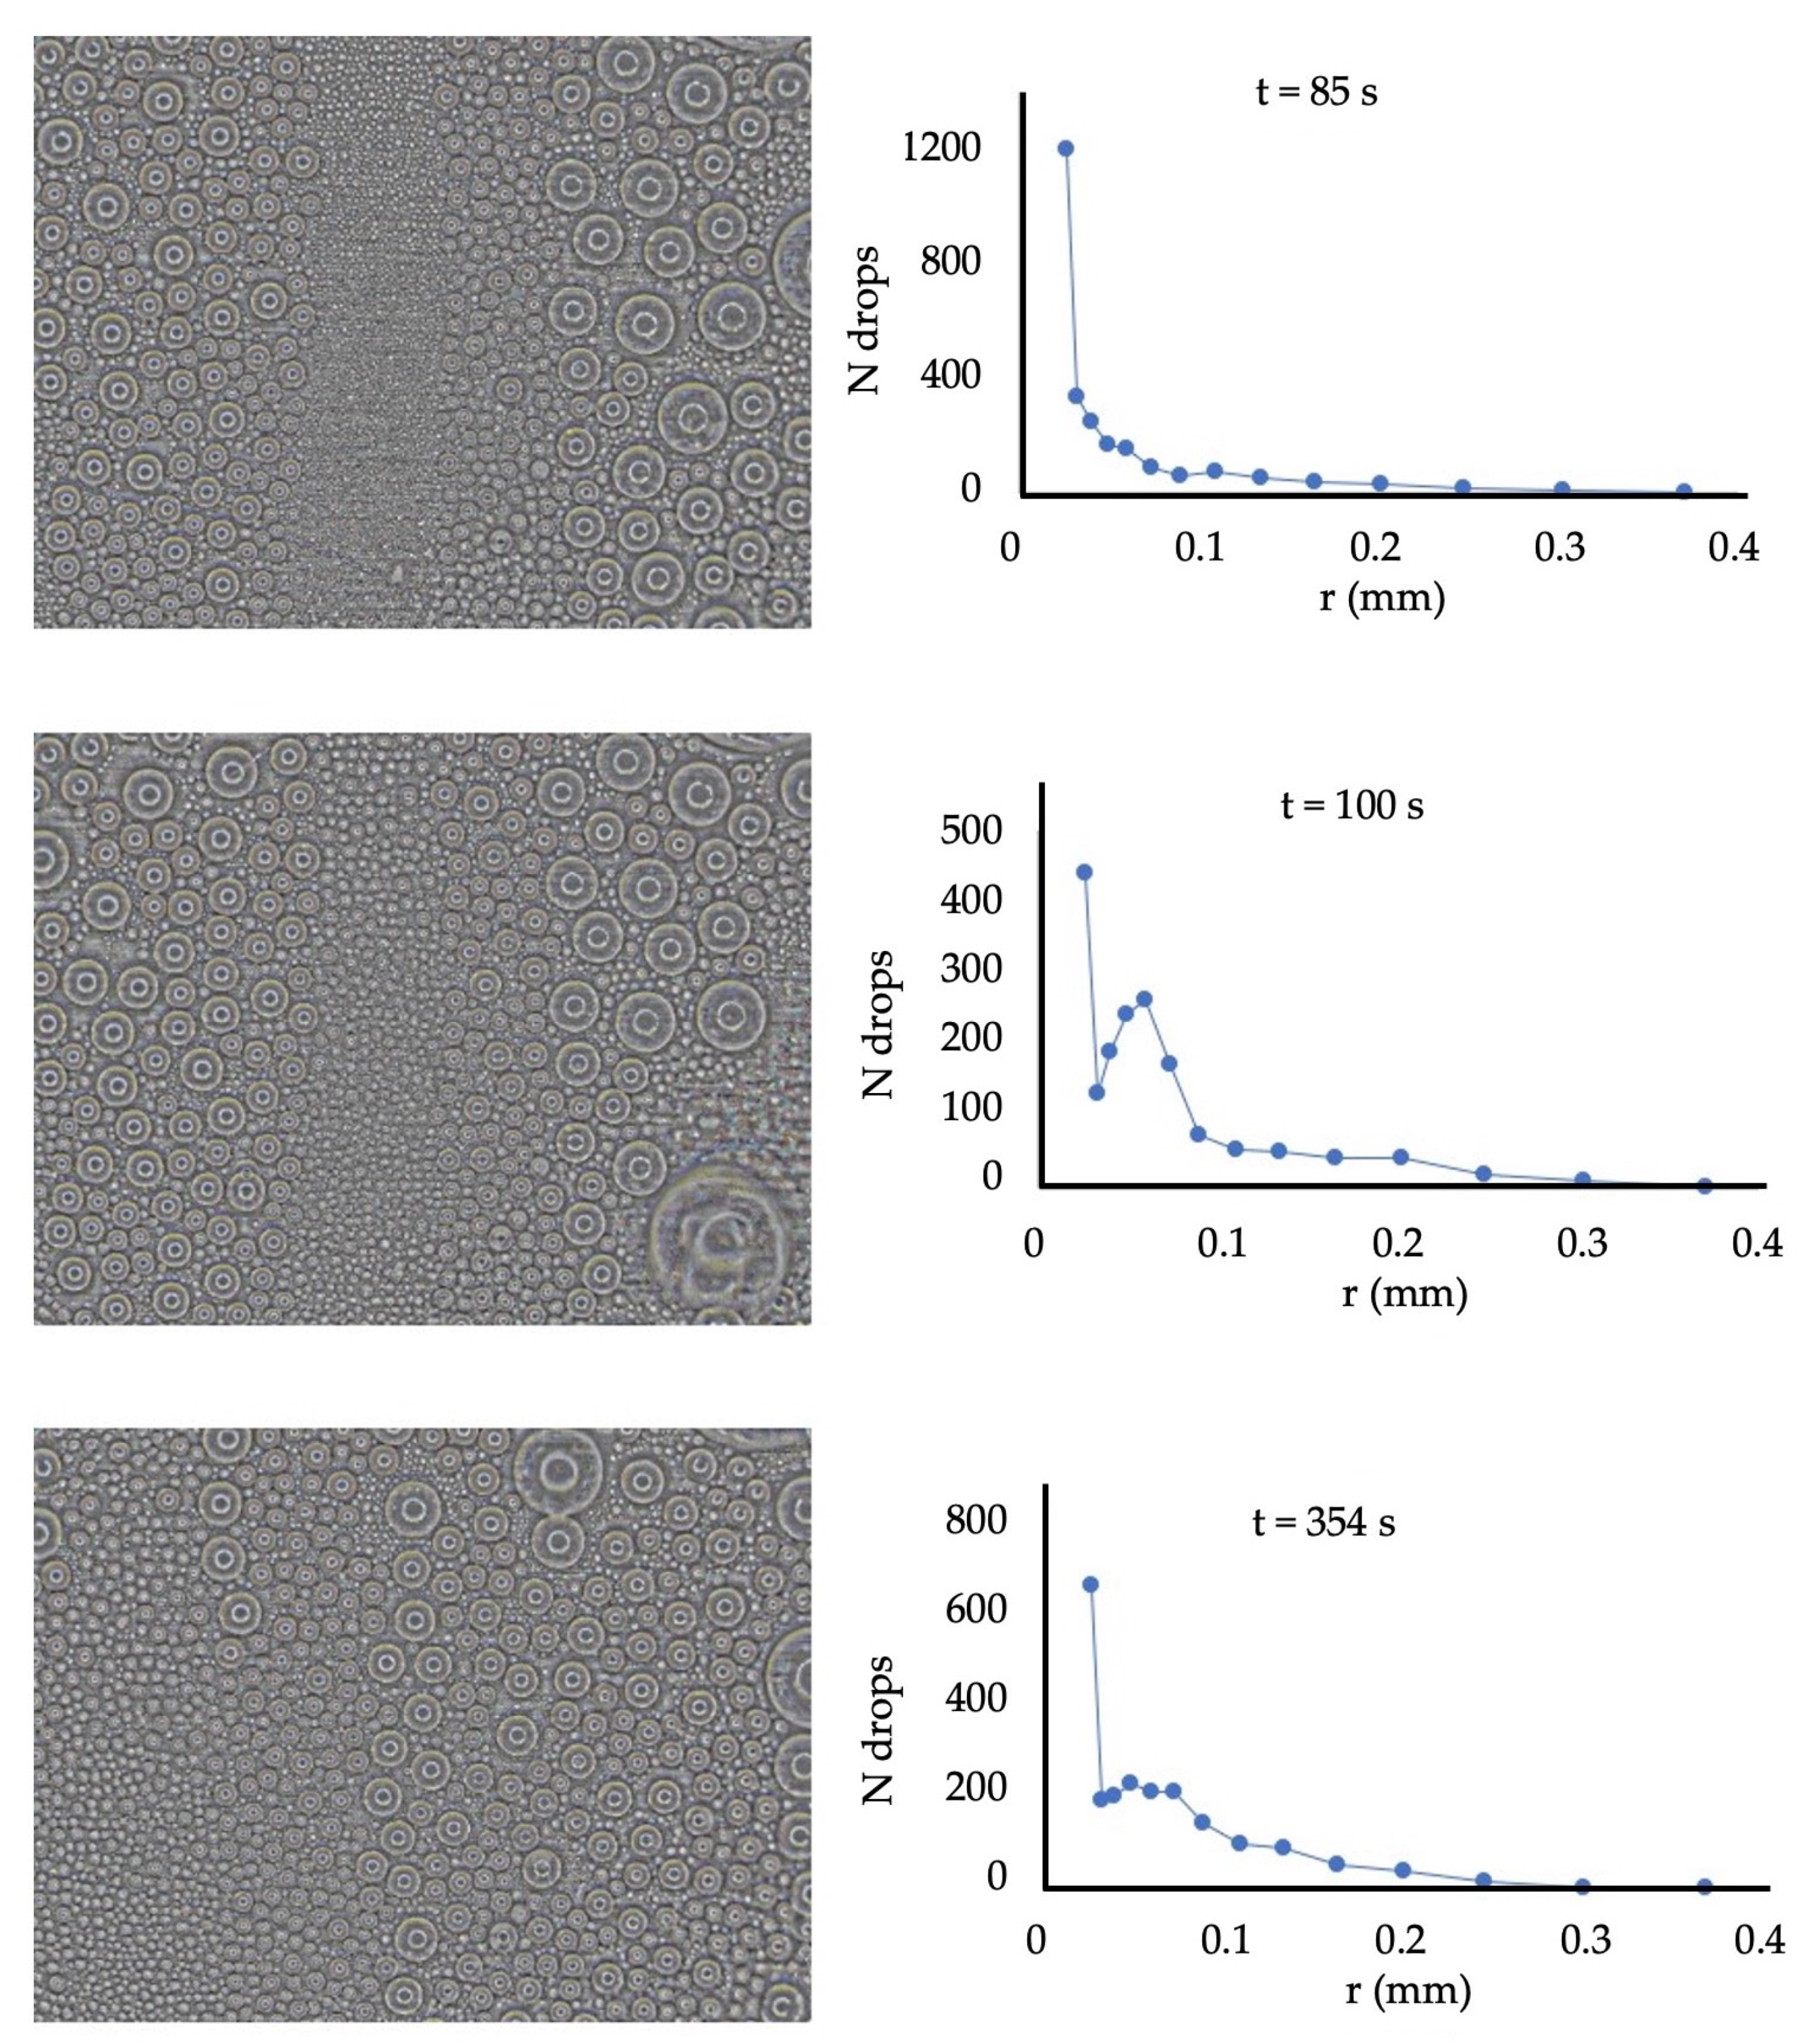
2.2. Image Processing

Dropwise condensation on the samples is recorded using the 6K photo mode of the imaging system used in the experiment. This records 6K videos, from which individual still images at 30 fps may be extracted in-camera at 18 Mp resolution. The images are preprocessed using the open-source image processing program ImageJ. An additional feature of the program is used to eliminate any vibration that would have been captured. The drops are then segmented using the image processing toolbox in MATLAB. The detected drops are filtered to remove false positives and overlaps. The images of the hemispherical drops show concentric circles due to the ring light used in the experiment. This is corrected in the algorithm where it looks for the largest of the concentric circles and disregards the smaller ones inside to prevent over-estimation. A MATLAB routine records the radius of the drops and counts the drops according to size at each frame. The corresponding surface area coverage of individual drops is also computed. Because of the high frame rate and image resolution, droplet growth can be clearly observed for successive frames. The images analyzed correspond to 14 to 15 s of continuous dropwise condensation. Figure 1 shows the image processing sequence for one frame, which measures 10 mm × 7.5 mm. This is performed for all copper samples, for a total of 17,290 frames. Image resolutions range from 0.35 to 0.44 pixels per micron, with the smallest detectable drop radius being 22.7 microns.

2.3. Model Development

The recorded images captured the complete life cycle of drops from nucleation to departure. For each of the copper samples, images are recorded for cooling water temperatures at 30 °C, 35 °C, 40 °C, 45 °C and 50 °C. At 30 frames per second, 420 to 450 frames are analyzed per cooling water temperature per sample. Figure 2 shows the drop size distribution at different time frames. The number of drops at different size ranges varies with time due to multiple coalescences, regeneration, and sweeping events occurring simultaneously.
Figure 3 presents processed images, where droplets are color-coded according to size, alongside the plot of surface coverage. Surface coverage, expressed as percent area, refers to the percentage of the analyzed area that is occupied by drops of a given size. Surface coverage varies with time, just like the drop size distribution. As small droplets grow, the surface area occupied by these drops also increases, and the mean separation between the droplets is reduced. Over time, coalescence ensues, and the number of droplets is reduced as droplets merge. Surface coverage is also reduced as droplets merge, leaving vacant areas where a new generation of drops emerges with no delay. The plots in Figure 3 show how significantly surface coverage changes with time, in that at a particular time, the plot is bimodal, and at another, the plot only has one peak. The multi-modality of surface coverage with time is a result of the dynamic behavior of drops throughout condensation.
Drop size distribution and surface coverage at each time frame do not lend themselves useful for modeling purposes as they vary significantly with time. Averaging the data over time also does not provide useful information as it diminishes information that could describe the dynamic nature of dropwise condensation. Additionally, surface coverage over time and drop count over time do not present any new information except that a rise and fall is observed for both, which is what is expected of a dynamic system.
Figure 4 shows the plot of surface coverage of drops and drop size over time on superhydrophobic copper at an irradiation power of 500 W and cooling water temperature of 30 °C. Drop size refers to the drop radius measured in pixels. For the still images recorded, the drop count ranges from 1500 to 4000 at varying drop sizes. The data recorded were binned with respect to drop size using 13 bins for better data visualization. The bin size increases with a geometric ratio of 1.33, with the smallest bin representing a drop radius of 10 pixels. Binning drop sizes allows for a manageable way of presenting the data from which significant information may be deduced. Binning also inherently smooths out unavoidable segmentation errors and compensates for time aliasing.
The 3D surface plot of surface coverage appears to have ridges and furrows, which correspond to high and low values, respectively. These distinct ridges are more visible when the plot is viewed from the top, showing drop size vs. time where the color scheme represents surface coverage, as in Figure 4b. The same ridges are visible in the plot of drop size vs. time, where the color scheme represents drop count, Figure 4c. These ridges are observed on all the surface plots for all the samples. The ridges appear to follow droplet growth trends presented in previous studies [29,30,31,32,33] but exhibit variation across samples that are treated at different irradiation powers. The surface plot also resembles an undulating surface where the peak values in the percent area and drop size plane move with time and follows a curve that may be described by droplet growth trends. These observations reveal the spatiotemporal nature of drop size distribution and warrant the need to create a model that captures this droplet lifecycle.
The proposed mathematical model in this study is based on the observed behavior of surface coverage and drop count during the transient condensation process. The drop size distribution is modeled as the number of drops in each radius bin (r + dr) at each time frame. The Gaussian probability model for growth variations describes how the number of drops of a given generation varies with respect to radius size at a given time. This model assumes that the number of drops is normally distributed and that the mean value represents the central value whose corresponding size is denoted as r = Rridge. The exponentially decaying population model represents the continuous decrease in the population of one generation of drops over time due to coalescence. The proposed models are as follows:
R r i d g e = 0.001 R K t R p
N t o t a l = N o e ( N p R r i d g e )
S r i d g e = S K ( R r i d g e ) S p
Rridge follows a power law with respect to time and represents the radius of the ridge at time t. Ntotal is the total number of drops at a certain Rridge, which from the previous equations, also means for a given time t. Sridge is the standard deviation or the spread of the number of drops relative to Rridge and shows how the individual drops closely match the average drop size at a given time. This takes into consideration the statistical variations in growth rate due to the probabilistic coalescence events. Ntotal consists of a normal component where the parameters Rridge and Sridge represent the mean and standard distribution, respectively. The coefficients of the model are determined by curve fitting using the curve fitting toolbox in Matlab.
It is important to note that the time scale at which the condensation occurs is such that it does not render much value in tracking individual drops and coalescence events. As such, droplet growth, as modeled in the study, does not distinguish between growth due to vapor accretion and growth due to coalescence. Previous models of drop size distribution are expressed in terms of ratios of physical parameters such as drop radius and critical droplet radius. While these have limiting assumptions, the present study takes wisdom in these models by incorporating a power law model to describe droplet growth or growth of mean droplet size, as presented in the review paper by Meakin [34]. The proposed model of drop size distribution, while different in form, is like the model proposed by Meakin [34] in that the number of objects of a given size s at time t can be expressed as a homogeneous function of the cluster size s and the mean cluster size. While droplet patterns at different time frames demonstrate scaling symmetry which is the basis of Meakin’s model, scaling symmetry alone may not be able to capture the droplet behavior that is hypothesized, in this study, to be distinct for surfaces that have varying surface characteristics. Even so, the proposed model may theoretically be scaled up to represent drop size distribution in a larger surface area.

3. Results and Discussion

The superhydrophobic copper sheets used in the condensation experiment had water contact angles ranging from 150° to 160°. Multiple droplet growth cycles are captured in the recorded images corresponding to 14 to 15 s of dropwise condensation. Because of the size of the area analyzed, droplets of multiple sizes were present at any point in time. Multiple coalescence events are observed to occur simultaneously at random locations as well as sweeping events that leave a swath of vacant surface on its trail. The dynamic nature of droplet growth, coalescence, departure, and regeneration results in a distribution of drops of varying sizes that also vary with time.

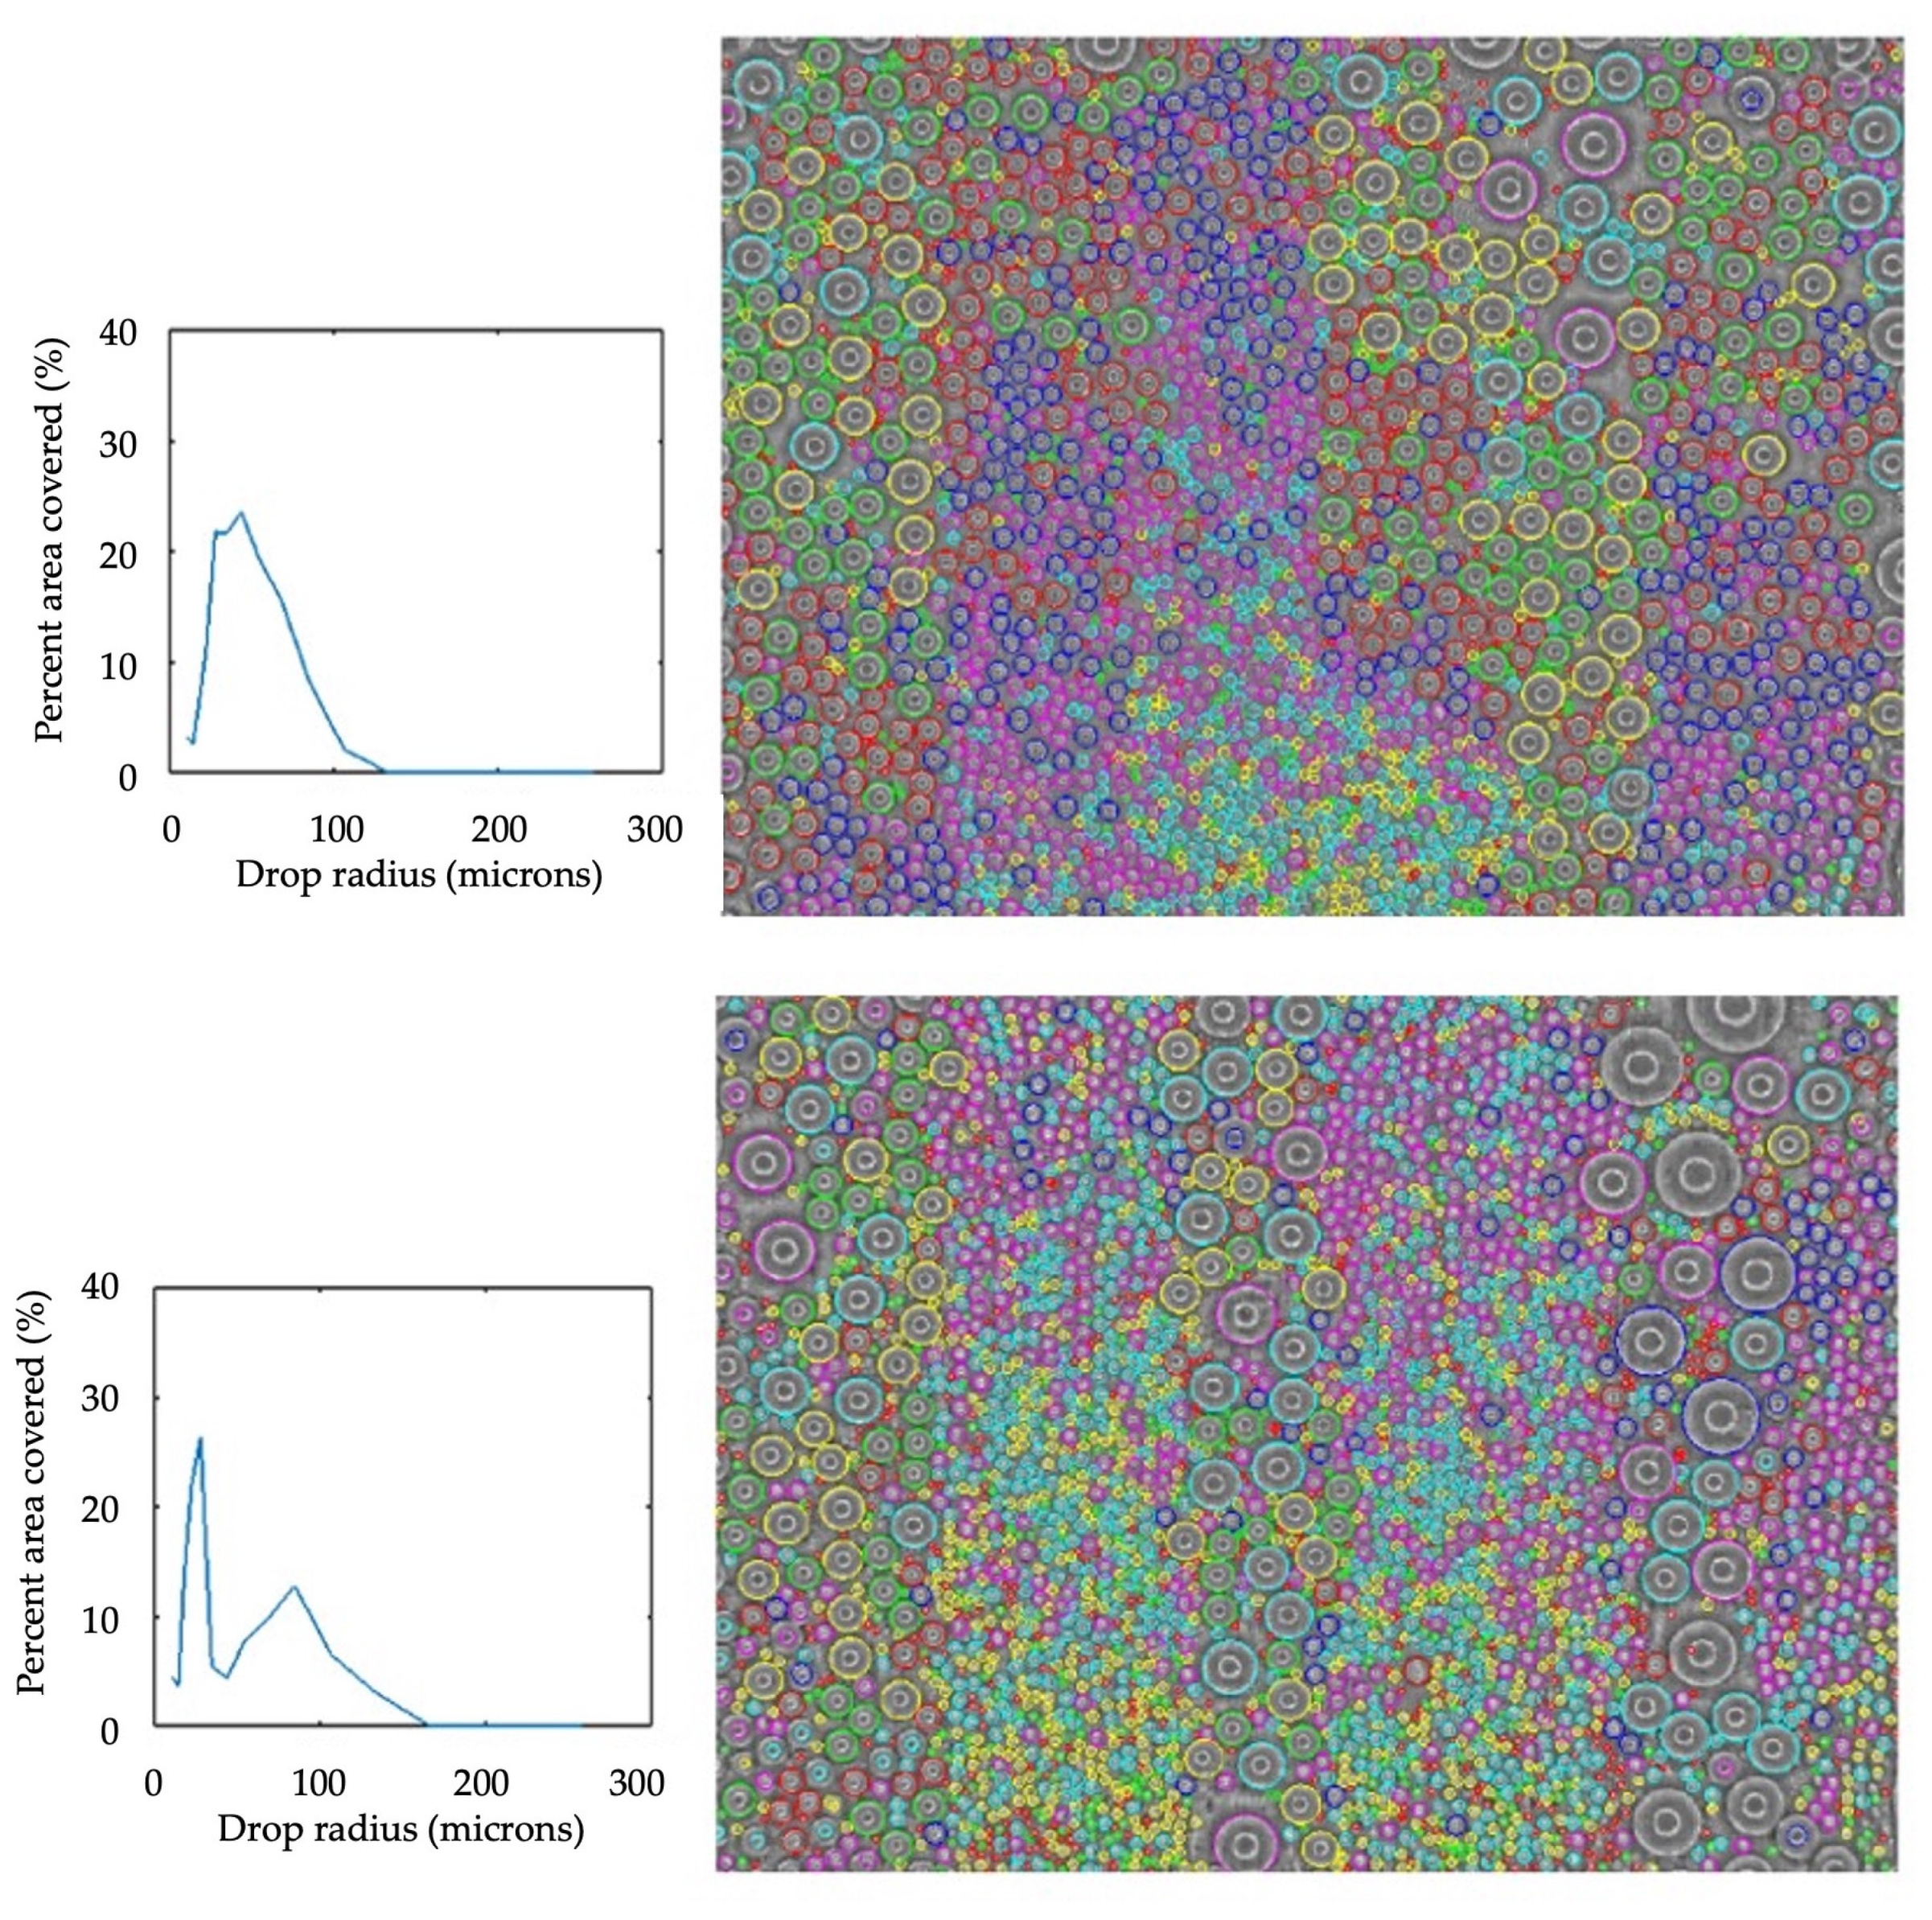
3.1. Area Coverage of Drops on Different Samples
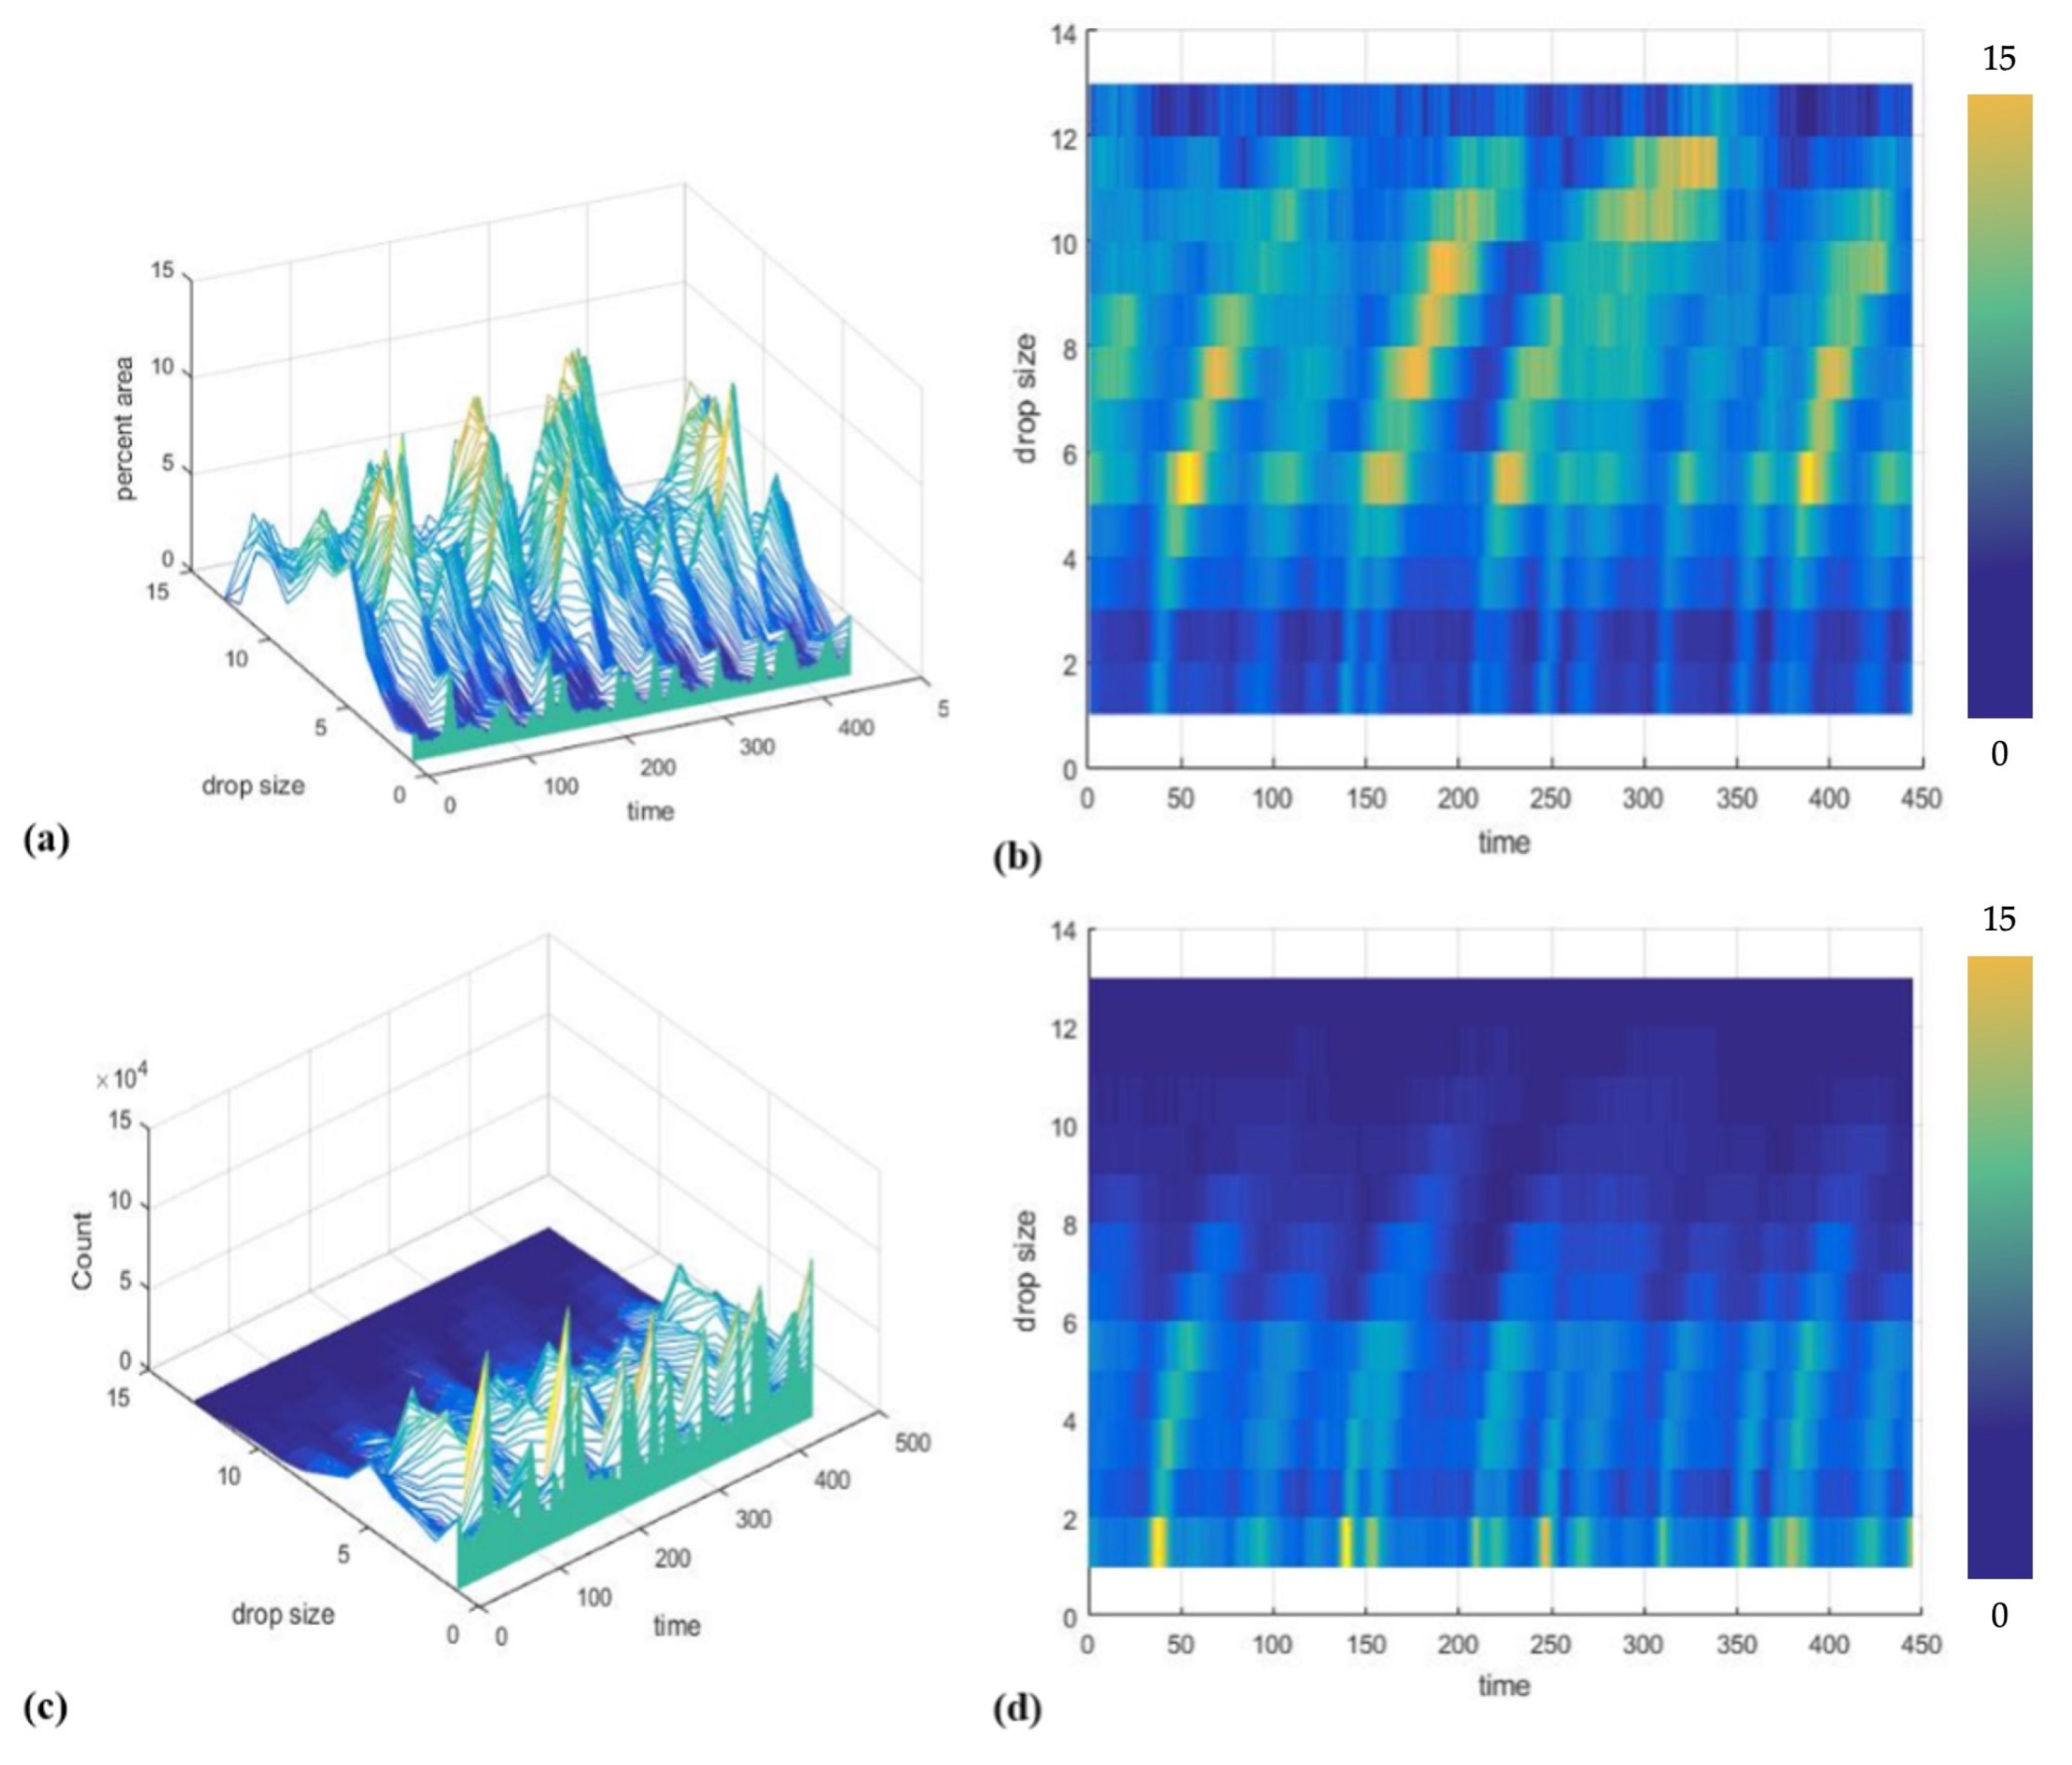
Area coverage is the total area occupied by drops of a given size, which are presented as radius bins. Figure 5 gives the area coverage for copper at a cooling water temperature of 35 °C. The plot shows distinct ridges, which indicate how the drops grow at the same rate. The thickness of the ridge measured vertically reflects how some drops start growing earlier or later than the bulk of the drops in the area. The width of the ridge also captures the growth of drops at individual bins and the subsequent decay as drops grow to a size corresponding to the adjacent bin radius. Visually, the ridges between the two images are different. The ridges in Figure 5a appear to grow slowly compared to the ridges in Figure 5b, primarily because these two are from samples that are treated at different irradiation powers and hence have different surface characteristics. This observation is quantified and supported by the result of the curve fit of the proposed drop growth model against the experiment data, where a high correlation is achieved. More importantly, the ridges represent the growth of individual generations of drops that emerge either after sweeping events or coalescence.

3.2. Sweep Events

Sweep events refer to the sweeping action of departing drops coming from outside the area of interest and by drops that grew within the area of interest until departure. The departing drop sweeps away all the other drops along its path, leaving a swath of fresh surface area for a new generation of drops. Figure 6 gives a better representation of the effect of sweeping events. The plot of area coverage against time (A-T plot) is only for the first radius bin, wherein new generations are manifested as an increase in area coverage in the direction of time. The green vertical lines correspond to sweep events that are observed from the recorded images. Sweep events generally coincide with dips or minimum points in the A-T plot. These are followed by peaks due to new generations in the newly swept area. Depending on the interval between sweeps, some peaks may be more prominent than others, and some may be jagged. Coalescence events are also captured in the A-T plot as minute ripples between peaks. This is evident in consecutive sweeping events with large time intervals in between. Peaks a and b are the corresponding peaks that result from such sweeps, and in between sweeps, only coalescence and minute regenerations are observed. The time interval between sweeps is also shown in the plot of radius against time, where the color scheme represents area coverage. Prominent ridges are seen when the sweep interval is large, or several sweeps occur in quick succession. This means that a large area is swept clean, and a new large area is available for the generation of drops that can grow without interruption, such as the ridge corresponding to peak b. Prominent ridges may also result from multiple sweeps prior, such as the ridge corresponding to peak a, where four sweep events are observed prior to it. The observed decrease in drop count between peaks a and b is mainly due to coalescence between neighboring drops. While some ridges may be faint, and others may be shorter, the characteristics of these ridges are generally similar. This only implies that the drop growth rate is not affected by sweeping events.

3.3. Model Validation

Curve fitting allows for the compensation of errors in the segmentation of drops. Some of the ridges are faint and fall below the chosen threshold value. As such, only the prominent peaks are modeled. Figure 7 and Figure 8 present the comparison of actual area coverage against simulated data based on the result of curve fitting. Table 1, Table 2, Table 3 and Table 4 show the coefficients determined by curve fitting for copper samples irradiated at 300 W to 600 W of power, at 100 W increments, and at different cooling water temperatures.
The developed models, validated against all samples, are found to agree well with experiment data, with correlations ranging from 88% to 94%. The growth model can sufficiently describe the growth of drops from 0.02 mm to 0.1 mm but may be extrapolated to describe the growth of even smaller drops. The coefficients shown in Table 1, Table 2, Table 3 and Table 4 are intended to characterize the behavior of the droplets as affected by cooling water temperature and surface properties such as roughness and water contact angle. With this perspective, the developed unifying model that is mathematically tractable but complex enough to realistically capture the dynamics of droplet growth is achieved by this study. However, further studies will need to be conducted to elucidate the direct impact of these factors on droplet growth rate and drop size distribution.
Figure 9 illustrates the life stages of a generation of drops using the developed drop size distribution model and the constant coefficients presented in Table 1. Comparison of drop distribution at time frame t = 20 s and t = 30 s shows a shift in the peak of the curve, suggesting an increase in drop radius due to combined accretion of vapor molecules and multiple coalescence. Noting that drops from multiple generations can exist simultaneously at a given time, Figure 10 shows one such scenario which gives a more appropriate presentation of drop size distribution at a given time.
An interesting observation during dropwise condensation is that as one generation of drops goes through its cycle, another generation starts without delay. And that as soon as a surface area is vacated, a new drop emerges and becomes part of another generation of drops. It is also worth noting that depending on the succeeding sweep incident, the distribution of drops may be altered significantly but does not necessarily affect the growth rate of drops.

3.4. Drop Growth and Cooling Water Temperature

Drop growth is driven by the temperature difference between the steam and the cooling surface. Thermal resistance network analysis of a single condensate droplet on a substrate shows the relevant resistances that dictate the rate at which a single drop grows. Various studies have demonstrated how these resistances vary with drop size and contact angle. As the size of the drop increases, the conduction thermal resistance through the drop also increases, and the temperature of the surface of the drop approaches steam temperature. This results in lower vapor accretion to the surface of the drop despite having a larger surface area. And thus, the heat transfer rate is decreased as the drop reaches a size where it is considered large [7,8,26,35].
During the experiment, direct measurement of the condenser surface could not be made without interfering with the thermal network between the substrate and the cooling block. Instead, the cooling water temperature is monitored and changed from 30 to 50 at increments of 5 degrees. Theoretically, the drop growth rate should decrease as the cooling water temperature increases. This is corroborated by previous studies both numerically and experimentally [7,20,36,37]. This same result is observed in this study, as shown in Figure 11. The general trend is that the growth of drops is highest at Tcw = 30 °C and lowest at Tcw = 50 °C at t = 30 s.
The growth rate of drops also affects the number of drops at a given time. Note that the proposed model accounts for growth due to direct condensation and coalescence between drops; as such, there is no need to distinguish between “small” and “large” drops. The decrease in the number of drops is significantly faster at low cooling water temperatures. This is because, as explained in the preceding discussion, drop growth rate is higher at low cooling water temperature and decreases significantly as cooling water temperature is increased. A high growth rate of drops means a faster coalescence rate, which also means that the rate at which the number of drops is reduced is also high. Figure 12 gives the corresponding total number of drops at t = 30 s for all the samples. Generally, there are fewer drops at Tcw = 30 °C compared to Tcw = 50 °C.

3.5. Heat Transfer Applications

The visualization of droplet dynamic behavior and the mathematical model developed can be used to estimate the rate of heat transfer during condensation. Condensation heat transfer rate may be expressed as
d Q d t = h f g ρ w d V ( R , θ ) d t
where ρ w is the density of liquid condensate, and d V ( R , θ ) d t is the rate of change in condensate volume. The shape of the droplet is assumed to be a spherical cap, and its volume is a function of droplet radius and contact angle, given as
V = π r 3 3 2 3 cos θ + cos 3 θ
The rate of change in condensate volume may then be expressed as
d V d t = π r 2 2 3 cos θ + cos 3 θ d r d t
Because the drops are relatively small, they may be assumed to have constant contact angles all throughout their growth. However, there is no proof that this is true for the drops recorded in the experiment, as the experiment setup is designed only for recording growth in terms of radius size. But given the time scale at which drops grow and evolve, the approximation of constant contact angle may give a conservative value. Thus, the rate of heat transfer during dropwise condensation may be expressed as
d Q d t = h f g ρ w π r 2 2 3 cos θ + cos 3 θ d r d t
Hence, given a relatively constant contact angle, density, and latent heat of vaporization, the heat transfer rate is proportional to r 2 d r d t or the rate of change in the total condensate volume. Figure 13 gives the rate of change in total volume for one generation of drops for all the surfaces at cooling water temperatures Tcw = 35 °C. These were generated using the developed mathematical model and the corresponding constant coefficients. The general trend shows a bell curve where the increase in condensate volume between successive time frames is a manifestation of droplet growth. As the drops grow, coalescence is inevitable. Thus, the number of drops eventually declines as the drops grow due to multiple coalescence. Drops on the copper sample irradiated at 600 W display faster volumetric growth, as shown in Figure 13. This is followed by drops on copper samples irradiated at 500 W, then 400 W, and lastly, 300 W. The model can be used to distinguish between the resulting droplet behavior as influenced by the parameter in the chosen fabrication method.
Figure 13 represents how the heat transfer rate will behave with the rate of change in condensate volume. The peak in the curve represents the optimal rate of condensate volume change and, consequently, the peak heat transfer rate. Beyond this peak, the drops continue to increase in volume but impede the heat transfer process. The continuous growth of a generation of drops results in a penalty in the heat transfer rate. This corroborates the findings of many other studies, which point out how droplet radius strongly influences heat flux through a drop [7,8,9]. It should be noted that the plot does not focus on one drop only but instead looks at the distribution of drops of a given generation and how the drops grow with time. Sweep events given as average sweep intervals are also included in the plot to represent the frequency with which drops are replenished by a new generation of drops. The average sweep interval models the interval between successive drop generations. Sweep events introduce a steep reduction in drop count and, consequently, a drop in heat transfer too. But both parameters recover without delay when the new generation of drops begins to form on the surface that is swept vacant by a departing drop. Thus, all throughout the condensation process, drop size distribution varies with time and is influenced by the mobility or frequency of drop departure and sweep events. This implies that the rate of change in condensate volume and, consequently, the heat transfer rate also varies with time [16,38,39,40,41].

4. Conclusions

In this study, we presented a new approach to analyzing the behavior of drops during dropwise condensation. The transient behavior was observed by appropriately stacking the data sequentially and presenting the data as a 3-dimensional surface plot. A mathematical model of drop size distribution was then developed and was found to agree well with experiment data, with correlations ranging from 88% to 94%.
Drop growth, coalescence, departure, and generation of new drops occur simultaneously without delay during dropwise condensation. Drop size distribution or frequency distribution of drops of different sizes varies significantly with time and may be considered pseudo-cyclic. This behavior of drops is captured in the developed mathematical model, which combines a power law growth model, an exponentially decaying population model, and a Gaussian probability model for growth variation. The developed model can characterize the varying dropwise condensation behaviors on the samples that were treated at different irradiation power and hence have different surface characteristics.
Sweep interval refers to the time interval between droplet departures that sweeps all the other drops along its path. The shorter the sweep interval, the higher the rate at which a significant portion of the surface area is vacated, where new generations of drops will grow. Sweep interval thus affects drop size distribution, but it does not affect the growth rate of drops.

Author Contributions

Conceptualization, G.J.C.D. and J.A.B.; methodology: J.A.B., G.J.C.D. and H.S.S.III; formal analysis: J.A.B., G.J.C.D. and H.S.S.III; investigation: J.A.B. and G.J.C.D.; writing—original draft preparation: G.J.C.D., J.A.B. and H.S.S.III; visualization: G.J.C.D., J.A.B. and H.S.S.III; supervision: G.J.C.D. and H.S.S.III; funding acquisition: J.A.B. All authors have read and agreed to the published version of the manuscript.

Funding

This research was funded by the Engineering Research and Development for Technology (ERDT) scholarship, Science Education Institute (SEI)—Department of Science and Technology (DOST), Philippines.

Data Availability Statement

The data presented in this study are available on request from the corresponding authors. The data are not publicly available due to privacy restrictions.

Conflicts of Interest

The authors declare no conflict of interest.

References

  1. Ma, M.; Hill, R.M.; Minglin, M.H.; Randal, M. Superhydrophobic Surfaces; CRC Press Taylor & Francis Group: Boca Raton, FL, USA, 2006; Volume 11. [Google Scholar]
  2. Roach, P.; Shirtcliffe, N.J.; Newton, M.I. Progess in superhydrophobic surface development. Soft Matter 2008, 4, 224–240. [Google Scholar] [PubMed]
  3. Abdulhussein, A.T.; Kannarpady, G.K.; Wright, A.B.; Ghosh, A.; Biris, A.S. Current trend in fabrication of complex morphologically tunable superhydrophobic nano scale surfaces. Appl. Surf. Sci. 2016, 384, 311–332. [Google Scholar]
  4. Sanjay, S.L.; Annaso, B.G.; Chavan, S.M.; Rajiv, S.V. Recent progress in preparation of superhydrophobic surfaces: A review. J. Surf. Eng. Mater. Adv. Technol. 2012, 2012, 76–94. [Google Scholar]
  5. Yan, Y.Y.; Gao, N.; Barthlott, W. Mimicking natural superhydrophobic surfaces and grasping the wetting process: A review on recent progress in preparing superhydrophobic surfaces. Adv. Colloid Interface Sci. 2011, 169, 80–105. [Google Scholar] [PubMed]
  6. Nakajima, A. Design of hydrophobic surfaces for liquid droplet control. NPG Asia Mater. 2011, 3, 49–56. [Google Scholar] [CrossRef] [Green Version]
  7. Kim, S.; Kim, K.J. Dropwise Condensation Modeling Suitable for Superhydrophobic Surfaces. J. Heat Transf. 2011, 133, 081502. [Google Scholar] [CrossRef]
  8. Graham, C.; Griffith, P. Drop size distributions and heat transfer in dropwise condensation. Int. J. Heat Mass Transf. 1973, 16, 337–346. [Google Scholar] [CrossRef]
  9. Mikic, B.B. On mechanism of dropwise condensation. Int. J. Heat Mass Transf. 1969, 12, 1311–1323. [Google Scholar] [CrossRef]
  10. Rose, J.W. Effect of condenser tube material on heat transfer during dropwise condensation of steam. Int. J. Heat Mass Transf. 1978, 21, 835–840. [Google Scholar] [CrossRef]
  11. Aksan, S.N.; Rose, J.W. Dropwise Condensation—The Effect Thermal Properties of the Condenser Material. Int. J. Heat Mass Transf. 1973, 16, 461–467. [Google Scholar] [CrossRef]
  12. Griffith, P.; Lee, M.S. The Effect of Surface Thermal Properties and Finish on Dropwise Condensation. Int. J. Heat Mass Transf. 1967, 10, 697–707. [Google Scholar] [CrossRef]
  13. Berndt, V.; Zunft, S. Theoretical and Experimental Study on Dropwise Condensation in Plate Heat Exchanger. In Proceedings of the 5th European Thermal-Sciences Conference, Eindhoven, The Netherlands, 18–22 May 2008. [Google Scholar]
  14. Bonner, R.R.W. Correlation for dropwise condensation heat transfer: Water, organic fluids, and inclination. Int. J. Heat Mass Transf. 2013, 61, 245–253. [Google Scholar] [CrossRef]
  15. Kim, Y.H.; Kim, K.; Jeong, J.H. Determination of the adhesion energy of liquid droplets on a hydrophobic flat surface considering the contact area. Int. J. Heat Mass Transf. 2016, 102, 826–832. [Google Scholar] [CrossRef]
  16. Sikarwar, B.S.; Muralidhar, K.; Khandekar, S. Effect of drop shape on heat transfer during dropwise condensation underneath inclined surfaces. Interface Phenom. Heat Transf. 2013, 1, 3–6. [Google Scholar] [CrossRef] [Green Version]
  17. Reza, H.; Bahrami, T.; Saffari, H. Theoretical study of stable dropwise condensation on an inclined micro/nano-structured tube. Int. J. Refrig. 2017, 75, 141–154. [Google Scholar]
  18. Kananeh, A.B.; Rausch, M.H.; Fröba, A.P.; Leipertz, A. Experimental study of dropwise condensation on plasma-ion implanted stainless steel tubes. Int. J. Heat Mass Transf. 2006, 49, 5018–5026. [Google Scholar] [CrossRef]
  19. Wen, R.; Li, Q.; Wu, J.; Wu, G.; Wang, W.; Chen, Y.; Ma, X.; Zhao, D.; Yang, R. Hydrophobic copper nanowires for enhancing condensation heat transfer. Nano Energy 2017, 33, 177–183. [Google Scholar] [CrossRef] [Green Version]
  20. Liu, X.; Cheng, P. Dropwise condensation theory revisited Part II. Droplet nucleation density and condensation heat flux. Int. J. Heat Mass Transf. 2015, 83, 842–849. [Google Scholar] [CrossRef]
  21. Fatica, N.; Katz, D.L. Dropwise Condensation. Chem. Eng. Prog. 1949, 45, 661–674. [Google Scholar]
  22. Maa, J.R. Drop Size Distribution and Heat-Flux of Dropwise Condensation. Chem. Eng. J. Biochem. Eng. J. 1978, 16, 171–176. [Google Scholar] [CrossRef]
  23. Abu-Orabi, M. Modeling of heat transfer in dropwise condensation. Int. J. Heat Mass Transf. 1998, 41, 81–87. [Google Scholar] [CrossRef]
  24. Wu, W.H.; Maa, J.R. On the Heat Transfer in Dropwise Condensation. Chem. Eng. J. 1976, 12, 225–231. [Google Scholar]
  25. Wu, Y.T.; Yang, C.X.; Yuan, X.G. Drop distributions and numerical simulation of dropwise condensation heat transfer. Int. J. Heat Mass Transf. 2001, 44, 4455–4464. [Google Scholar] [CrossRef]
  26. Rose, J.W.; Glicksman, L.R. Dropwise condensation—The distribution of drop sizes. Int. J. Heat Mass Transf. 1973, 16, 411–425. [Google Scholar] [CrossRef]
  27. Balbarona, J.A.; Denoga, G.J.C.; Salapare, H.S., III. Influence of surface modification on droplet mobility during dropwise condensation. Materialwiss. Werkstofftech. 2022, 53, 750–761. [Google Scholar] [CrossRef]
  28. Salapare, H.S., III; Balbarona, J.A.; Clerc, L.; Bassoleil, P.; Zenerino, A.; Amigoni, S.; Guittard, F. Cupric oxide nanostructuress from plasma surface modification of copper. Biomimetics 2019, 4, 42. [Google Scholar] [CrossRef] [Green Version]
  29. Leach, R.N.; Stevens, F.; Langford, S.C.; Dickinson, J.T. Dropwise Condensation: Experiments and Simulations of Nucleation and Growth of Water Drops in a Cooling System. Langmuir 2006, 3, 8864–8872. [Google Scholar] [CrossRef] [PubMed] [Green Version]
  30. Ucar, I.O.; Erbil, H.Y. Dropwise condensation rate of water breath figures on polymer surfaces having similar surface free energies. Appl. Surf. Sci. 2012, 259, 515–523. [Google Scholar] [CrossRef]
  31. Miljkovic, N.; Enright, R.; Wang, E.N. Effect of Droplet Morphology on Growth Dynamics and Heat Transfer during Condensation on Superhydrophobic Nanostructured Surfaces. ACS Nano 2012, 6, 1776–1785. [Google Scholar] [CrossRef]
  32. Lo, C.W.; Wang, C.C.; Lu, M.C. Scale Effect on Dropwise Condensation on Superhydrophobic Surfaces. ACS Appl. Mater. Interface 2014, 6, 14353–14359. [Google Scholar] [CrossRef]
  33. Narhe, R.D.; Beysens, D.A. Growth Dynamics of Water Drops on a Square-Pattern Rough Hydrophobic Surface. Langmuir 2007, 23, 6486–6489. [Google Scholar] [CrossRef]
  34. Meakin, P. Droplet deposition growth and coalescence. Rep. Prog. Phys. 1992, 55, 157–240. [Google Scholar] [CrossRef]
  35. McCormick, J.L.; Westwater, J.W. Nucleation sites for dropwise condensation. Chem. Eng. Sci. 1965, 20, 1021–1036. [Google Scholar] [CrossRef]
  36. Miljkovic, N.; Enright, R.; Wang, E.N. Modeling and Optimization of Superhydrophobic Condensation. J. Heat Transf. 2013, 135, 111004. [Google Scholar] [CrossRef]
  37. Qi, B.; We, J.; Zhang, L.; Xu, H. A fractal dropwise condensation heat transfer model including the effects of contact angle and drop size distribution. Int. J. Heat Mass Transf. 2015, 83, 259–272. [Google Scholar] [CrossRef]
  38. Meng, K.; Fan, W.; Wang, H. Dynamic scenario simulation of dropwise condensation on a superhydrophobic surface with droplet jumping. Appl. Therm. Eng. 2019, 148, 316–323. [Google Scholar] [CrossRef]
  39. Sikarwar, B.S.; Khandekar, S.; Muralidhar, K. Mathematical modelling of dropwise condensation on textured surfaces. Sadhana-Acad. Proc. Eng. Sci. 2013, 38, 1135–1171. [Google Scholar] [CrossRef] [Green Version]
  40. Zheng, S.; Eimann, F.; Philipp, C.; Fieback, T.; Gross, U. Modeling of heat and mass transfer for dropwise condensation of moist air and the experimental validation. Int. J. Heat Mass Transf. 2018, 120, 879–894. [Google Scholar] [CrossRef]
  41. Xu, W.; Lan, Z.; Liu, Q.; Du, B.; Ma, X. Droplet size distributions in dropwise condensation heat transfer: Consideration of droplet overlapping and multiple re-nucleatio. Int. J. Heat Mass Transf. 2018, 127, 44–54. [Google Scholar] [CrossRef]
Figure 1. Image processing sequence: (a) image recording, (b) image pre-processing, (c) segmentation, and (d) filtering.
Colloids 07 00053 g001
Figure 2. Raw image of drops and corresponding drop size distribution at different time frames.
Colloids 07 00053 g002
Figure 3. Surface coverage and processed image for a copper sample at two different time frames.
Colloids 07 00053 g003
Figure 4. Surface plots for copper at 500 W of irradiation power and T = 30 °C. (a) Surface coverage vs. drop size vs. time, (b) top view showing drop size against time, (c) drop count vs. drop size vs. time, and (d) top view showing drop size against time.
Colloids 07 00053 g004
Figure 5. Area coverage at Tcw = 35 °C for copper irradiated at (a) 300 W and (b) 400 W.
Colloids 07 00053 g005
Figure 6. (a) Surface plot of area coverage for copper at Tcw = 30 °C and (b) the corresponding area coverage vs. time (A-T) plot for radius bin 1. The blue triangles are the area coverage peaks at different times.
Colloids 07 00053 g006
Figure 7. Area coverage. (a) actual and (b) simulation result (300 W and Tcw = 35 °C).
Colloids 07 00053 g007
Figure 8. Area coverage. (a) actual and (b) simulation result (600 W and Tcw = 30 °C).
Colloids 07 00053 g008
Figure 9. Simulated drop count at different time frames.
Colloids 07 00053 g009
Figure 10. Simulated drop size distribution of multiple generations of drops occurring simultaneously at different time frames using the developed model; (a) t = 20 s, (b) t = 30 s.
Colloids 07 00053 g010
Figure 11. The general trend of drop growth in terms of the size of Rridge against cooling water temperature (at time t = 30 s).
Colloids 07 00053 g011
Figure 12. Drop count at time t = 30 s vs. cooling water temperature.
Colloids 07 00053 g012
Figure 13. Change in total condensate volume at cooling water temperature of 35 °C.
Colloids 07 00053 g013
Table 1. Table of constant coefficients at 300 W of power.
Temperature (°C)3035404550
Correlation93.066%93.504%91.631%91.495%87.768%
PointC300aC300bC300cC300dC300e
Rk1.92621.00520.55900.25260.2277
Rp0.81050.99241.00001.19661.2077
Np43.499143.574326.561528.293242.7155
Sp1.39821.35601.10861.18711.2679
Table 2. Table of constant coefficients at 400 W of power.
Temperature (°C)3035404550
Correlation90.990%91.190%90.322%84.363%85.191%
Point90039006900790099010
Rk0.20380.30970.32620.28560.4810
Rp1.49221.34371.33211.30101.0714
Np42.275732.517440.428445.386040.5393
Sp1.41671.15011.27311.18431.3633
Table 3. Table of constant coefficients at 500 W of power.
Temperature (°C)3035404550
Correlation95.685%94.270%89.083%92.288%89.845%
Point14521455146014621465
Rk1.22680.56100.95590.22710.1233
Rp1.00001.22061.04531.43691.5692
Np44.628535.047649.591628.092740.9657
Sp1.43481.12861.51150.96401.1503
Table 4. Table of constant coefficients at 600 W of power.
Temperature (°C)3035404550
Correlation88.730%90.382%87.746%91.383%90.608%
Point50075008500950115012
Rk4.21091.11231.80261.40541.0330
Rp0.83861.14291.02231.06931.1004
Np28.032925.788827.737933.282032.7673
Sp1.26580.86841.31621.30741.0510
Disclaimer/Publisher’s Note: The statements, opinions and data contained in all publications are solely those of the individual author(s) and contributor(s) and not of MDPI and/or the editor(s). MDPI and/or the editor(s) disclaim responsibility for any injury to people or property resulting from any ideas, methods, instructions or products referred to in the content.

