Article

Rheology of Suspensions of Solid Particles in Liquids Thickened by Starch Nanoparticles

by
Ghazaleh Ghanaatpishehsanaei
and
Rajinder Pal
*
Department of Chemical Engineering, University of Waterloo, Waterloo, ON N2L 3G1, Canada
*
Author to whom correspondence should be addressed.
Colloids Interfaces 2023, 7(3), 52; https://doi.org/10.3390/colloids7030052
Submission received: 13 June 2023 / Revised: 4 July 2023 / Accepted: 19 July 2023 / Published: 24 July 2023
(This article belongs to the Special Issue Rheology of Complex Fluids and Interfaces)

Abstract

:
The rheology of suspensions of solid particles in aqueous matrix liquids thickened by starch nanoparticles (SNP) was investigated. The SNP concentration varied from 9.89 to 34.60 wt% based on the aqueous matrix phase. The solids concentration of suspensions varied from 0 to 47 wt% (0 to 56 vol%). The suspensions at any given SNP concentration were generally Newtonian at low solids concentrations. At high solids concentrations, the suspensions were non-Newtonian shear-thinning. With the increase in the SNP concentration, the suspensions become non-Newtonian at a lower solids concentration. The rheological behavior of non-Newtonian suspensions could be described adequately with a power-law model. The consistency index of the suspension increased with the increase in solids concentration of the suspension at any given SNP concentration. The flow behavior index of suspensions was well below unity at high solids concentrations, indicating non-Newtonian shear-thinning behavior. The value of the flow behavior index decreased with the increase in solids concentration indicating an enhancement of shear-thinning in suspensions. The experimental viscosity and consistency data for Newtonian and non-Newtonian suspensions showed good agreement with the predictions of the Pal viscosity model for suspensions.

1. Introduction

Suspensions consist of solid particles dispersed in a liquid. They are ubiquitous in daily life and in industrial processes [1,2]. Industries where suspensions are encountered extensively include food, cosmetics, paints, ceramics, pulp and paper, petroleum, construction, pharmaceutical, mineral processing, polymers, biotechnology, biomedicine, and many more. Some examples of suspensions are mixture of flour and water, blood, waste slurries, drilling fluids, etc. The design, selection, and operation of the equipment involved in mixing, processing, storage, and pumping of suspensions require a good understanding of the rheological behavior of suspensions [1].
Suspensions are prone to instabilities such as creaming and sedimentation under the influence of gravity due to difference in the densities of particles and suspending medium (matrix or continuous phase) [3,4]. When the particles are lighter than the suspending medium, the suspension undergoes creaming in that the particles rise to the top of the sample. When the particles are heavier than the suspending medium, the suspension undergoes sedimentation in that the particles settle at the bottom of the sample. Creaming and sedimentation in suspensions are undesirable instabilities as they affect the shelf-life of the suspension product. Rheological modifiers (thickeners) are often added to the suspending medium of suspension to minimize creaming and sedimentation effects. It follows from the celebrated Stokes law given below that the rise velocity of lighter particles or the settling velocity of heavier particles is inversely related to the viscosity of the suspending medium:
V = g D 2 ρ p ρ 18 η m
where V is the terminal velocity of the particle, g is acceleration due to gravity, D is particle diameter, ρ p is particle density, ρ is fluid density, and η m   is the viscosity of the suspending medium. Note that when ρ p ρ > 0 , that is, the particles are heavier than the suspending medium, the particles undergo settling or sedimentation effect. For particles lighter than the suspending medium, ρ p ρ < 0 , and therefore the particles undergo creaming effect.
Thus, creaming and/or sedimentation in suspensions can be minimized by modifying the rheology (increasing the viscosity) of the suspending fluid or matrix phase. The rheology of the matrix phase of suspensions is often modified by incorporating additives such as polymers, surfactants, and clays. More recently, nanoparticles are receiving considerable attention as rheological modifiers of the matrix fluid of suspensions and emulsions [5].
In this article, we report new results on the rheology of suspensions of solid particles in liquids thickened by starch nanoparticles over a broad range of nanoparticle and solids concentrations. Starch nanoparticles (SNP) are receiving considerable attention in various fields of science and technology due to their unique properties at the nanoscale. Furthermore, SNP are low-cost, renewable, biocompatible, and biodegradable nanomaterials with the perspective of sustainable development [6,7,8]. SNPs are used as Pickering emulsion stabilizers, bioplastic fillers, encapsulating agents, fat replacers, and antimicrobial agents [6]. They are also suitable for use as carriers to mimic lipid micelles and to facilitate the transport of bioactive molecules. Furthermore, they can be used to improve the mechanical, thermal, and barrier properties of polymeric films [8].
The rheology of suspension of solid particles in liquids has been studied extensively in literature [9,10,11,12,13,14,15,16] since the seminal publication of Einstein [9,10]. A good number of articles have also been published on the rheology of suspensions thickened by polymeric materials [17]. However, little or no work has been reported on the rheology of suspensions of solid particles thickened by starch nanoparticles.

2. Materials and Methods

2.1. Materials

The solid particles used in the preparation of suspensions were commercially available SG hollow spheres (also referred to as extendospheres) supplied by Sphere One, Inc., Chattanooga, Tennessee. The particles are low-density, high-strength, hollow ceramic spheres used extensively as lightweight additives for most resin systems. They replace heavier, more expensive additives and reduce material costs as well as density. They are used in specialty cements, cementitious coatings, grouts, insulating roofing materials, and high-strength anchoring compounds. They are also used in adhesives, mastics, industrial coatings, and thermoset coatings.
The nanoparticles used for the thickening of the matrix liquid were experimental grade starch biopolymer nanoparticles supplied by EcoSynthetix Inc. (Burlington, ON, Canada). They are manufactured through reactive extrusion by modifying native starch. The surfactant used in the experiments was Triton X-100, a commercially available non-ionic surfactant manufactured by Dow Chemical Company. The water used throughout the experiments was deionized.

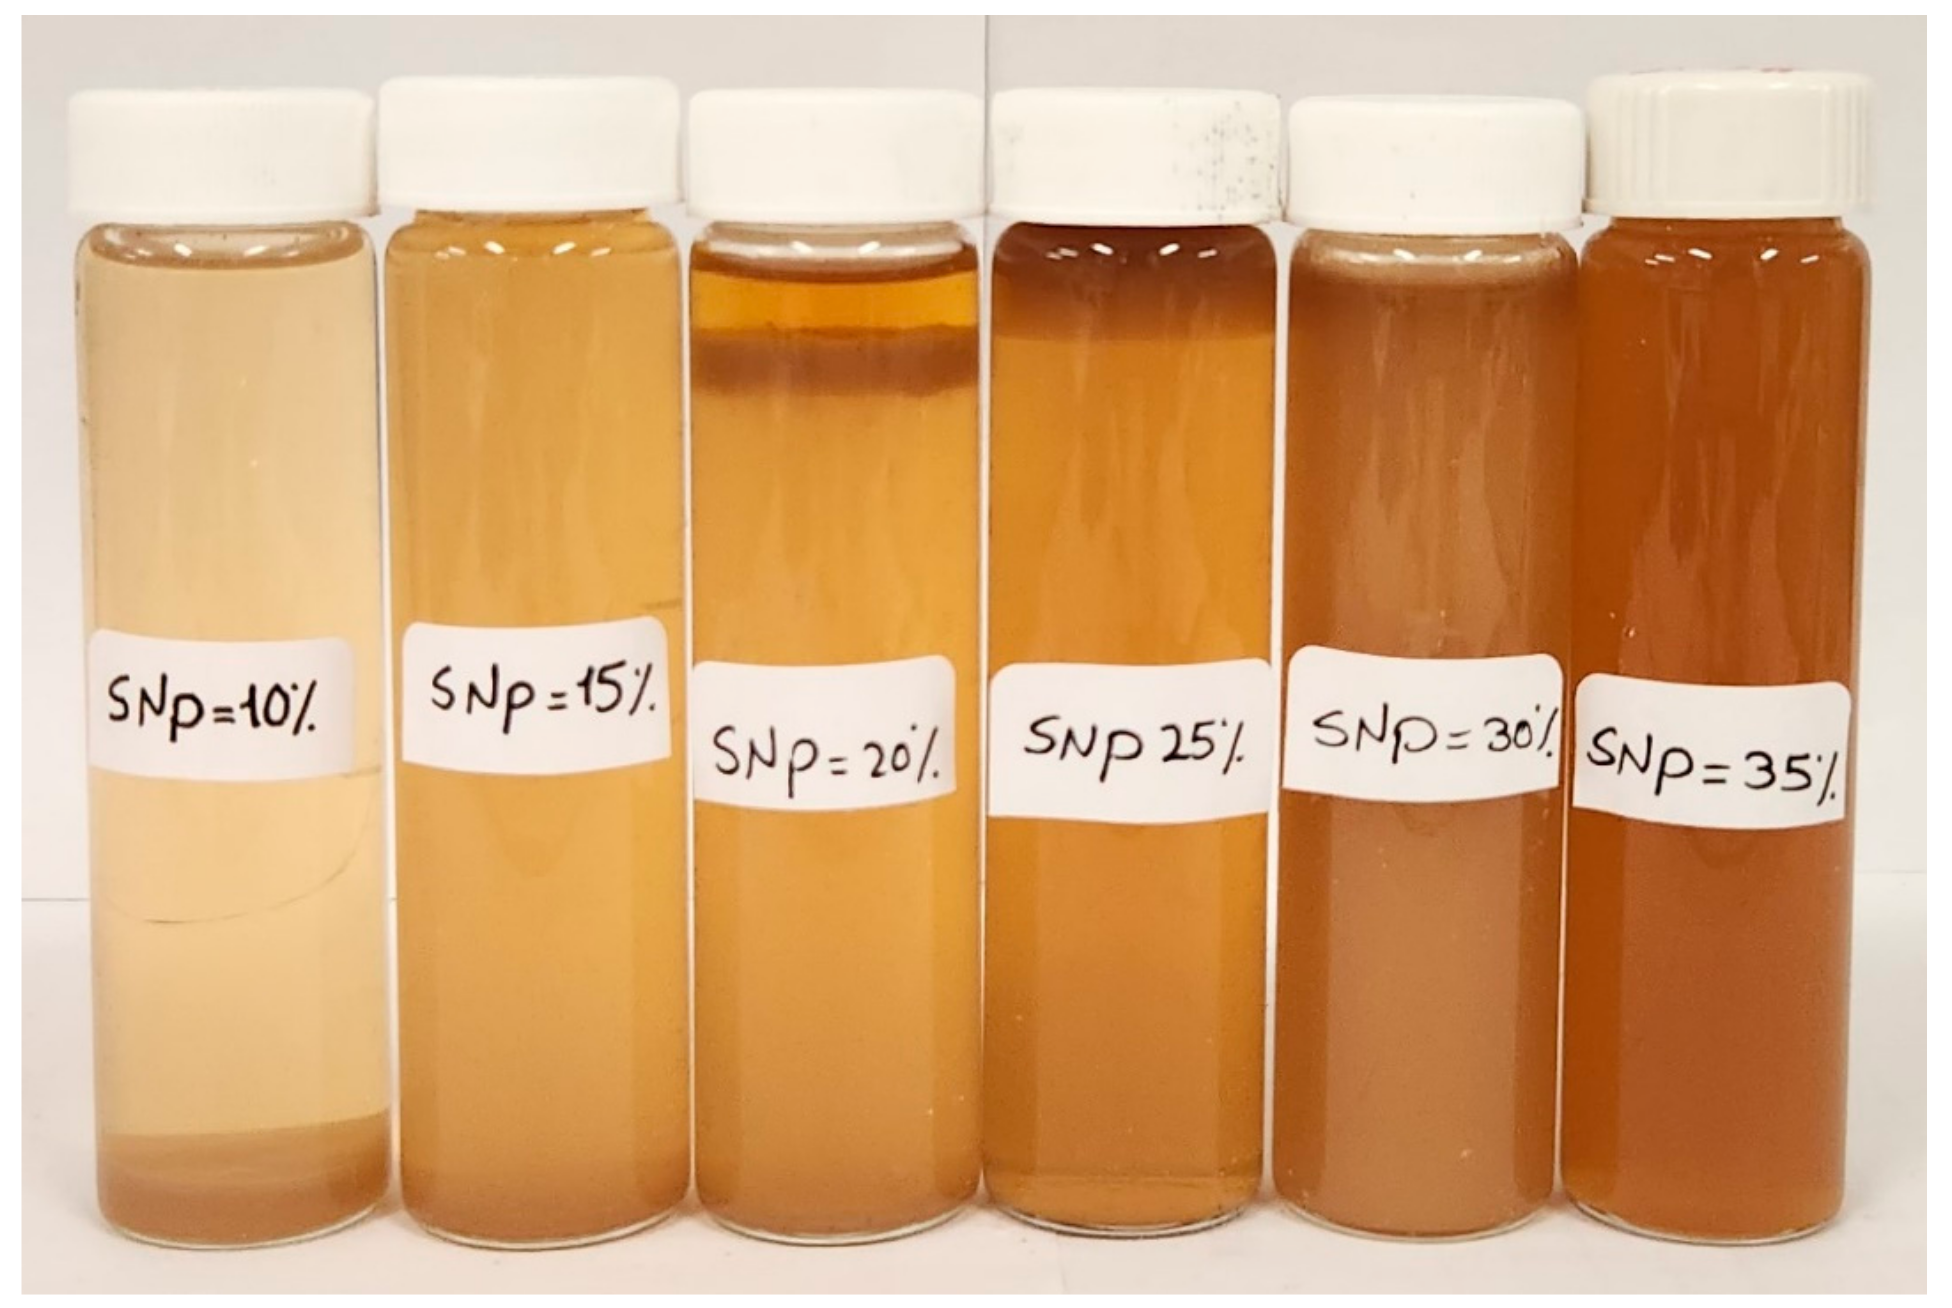
2.2. Preparation of SNP Dispersions

The SNP dispersions were prepared at room temperature (≈22 °C). A known amount of starch nanoparticles was added to a known amount of aqueous phase slowly while maintaining mixing of the dispersion with a homogenizer (Gifford-Wood, model 1L, NOV process and flow technologies, Dayton, OH, USA). The aqueous phase of the dispersion consisted of a non-ionic surfactant (Triton X-100) solution in deionized water. The surfactant concentration was approximately 1 wt% based on the SNP dispersion. A small amount of biocide (Thor Acticide GA, Thor Specialties, Inc., Shelton, CT, USA) was also added to the SNP dispersion to prevent any bacterial growth in the dispersion. The biocide concentration was 0.15 wt% based on the SNP dispersion. The SNP dispersion was agitated in the homogenizer at high speed for approximately 45 min until the starch powder was fully dispersed. The SNP dispersion thus prepared was left overnight to remove air entrapped during the mixing process. Six dispersions with SNP concentrations of approximately 10, 15, 20, 25, 30, and 35 wt% were prepared. Note that the term “dispersion” is used for mixtures of SNP and aqueous phase without any solid particles whereas the term “suspension” is used for mixtures of solid particles and SNP dispersion.

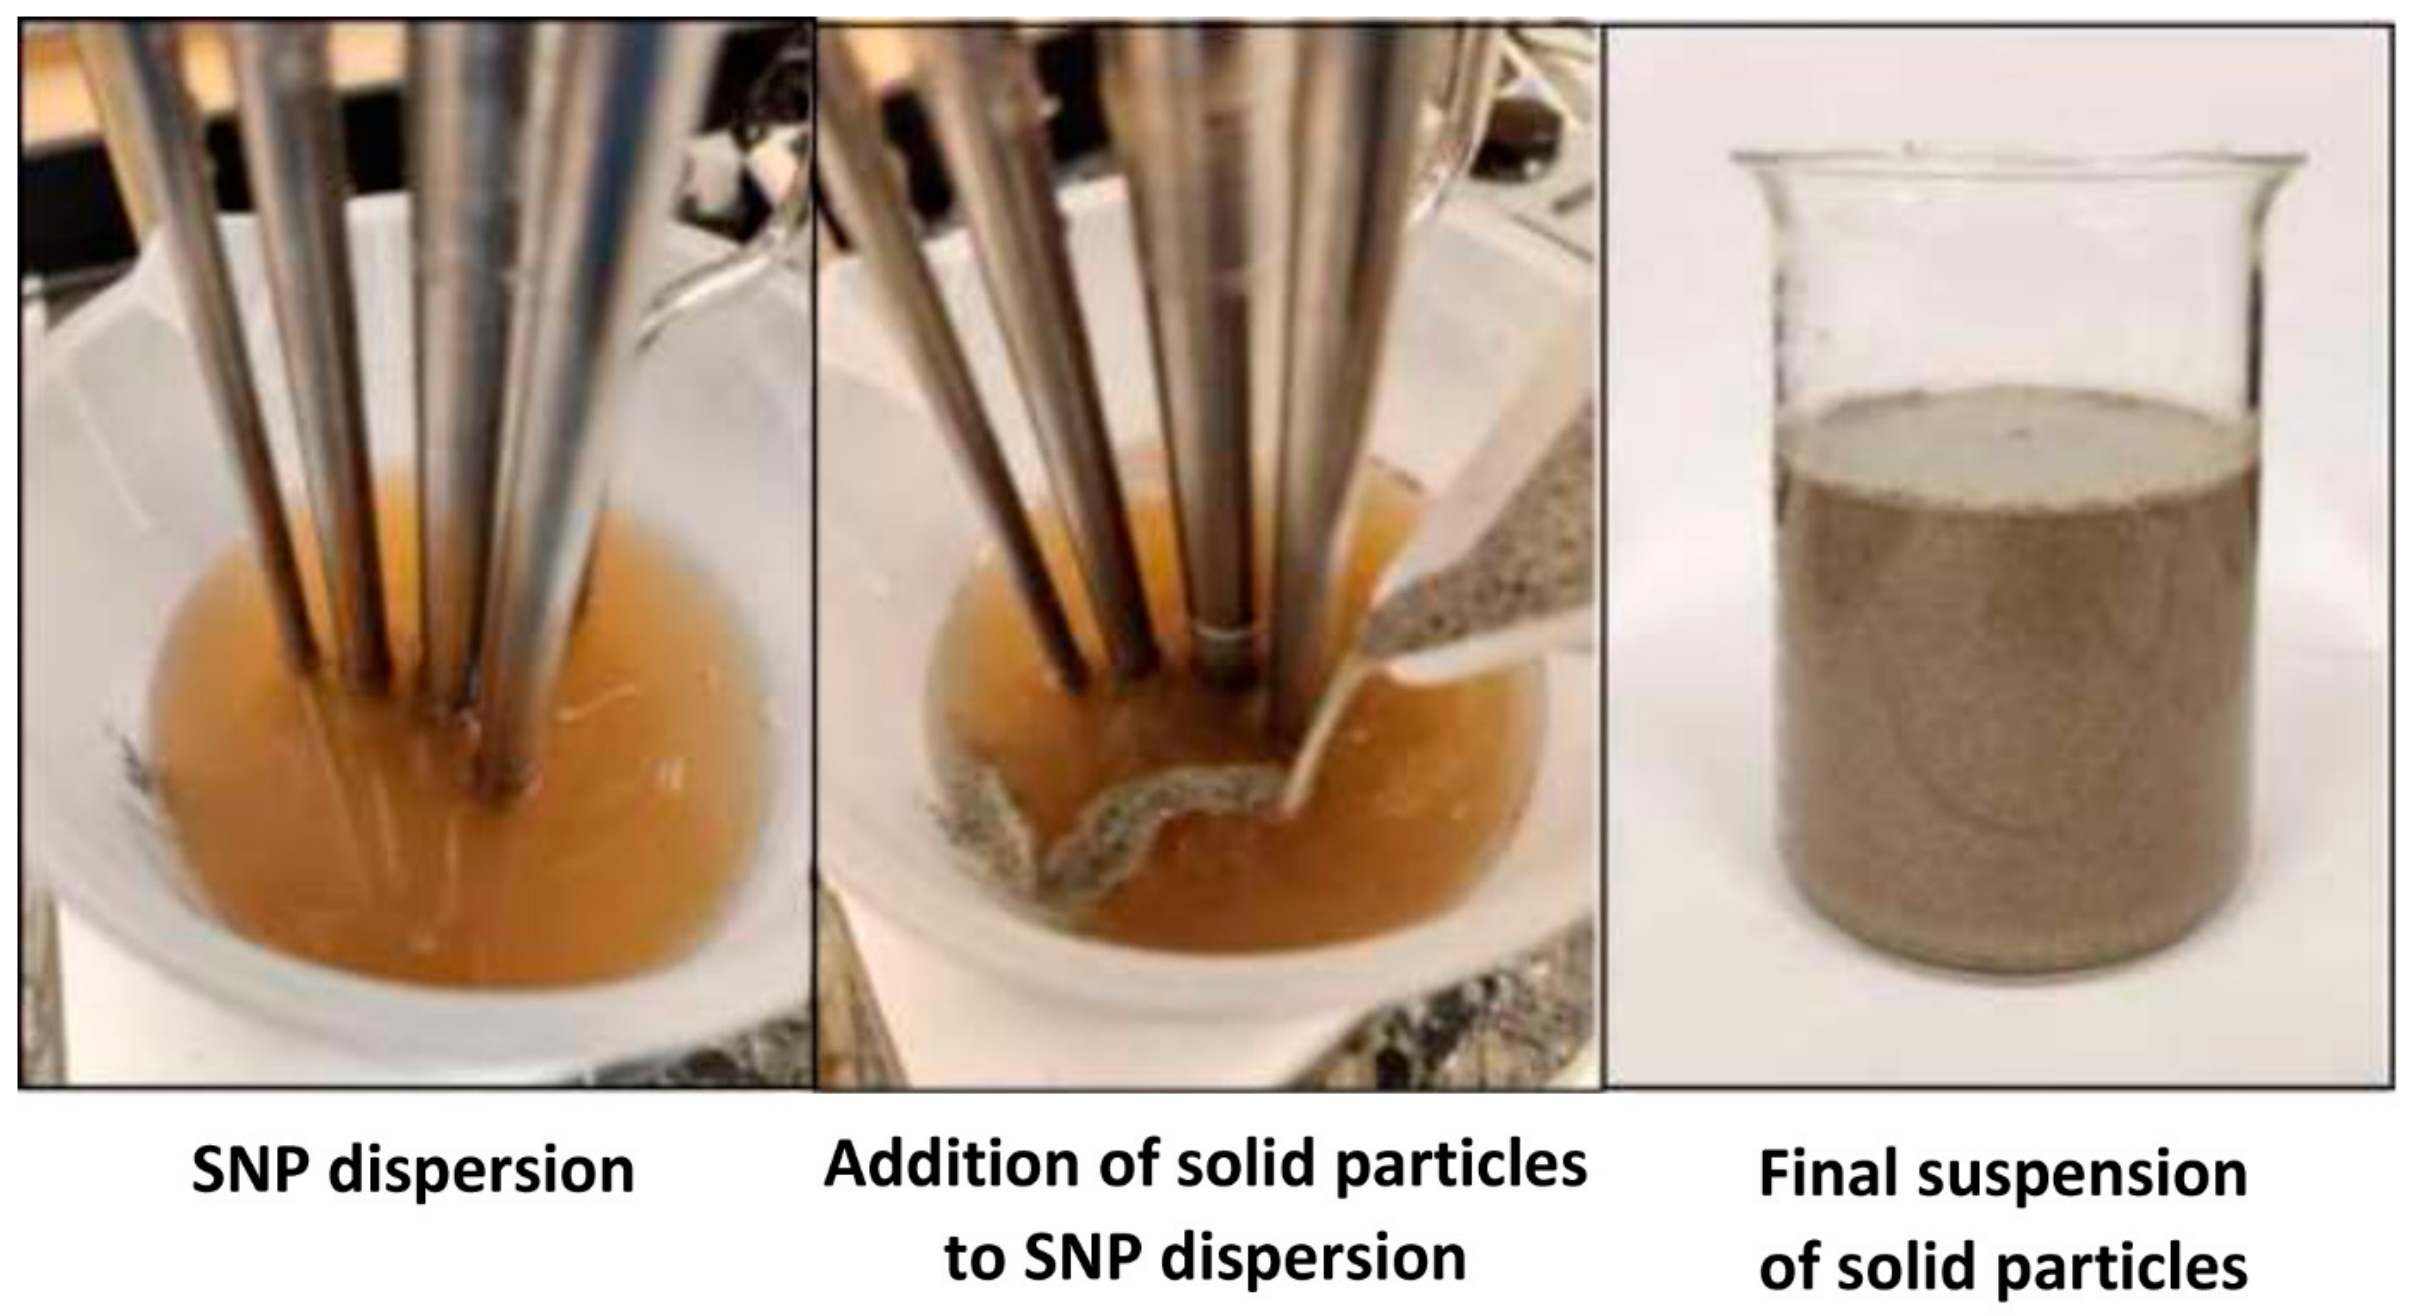
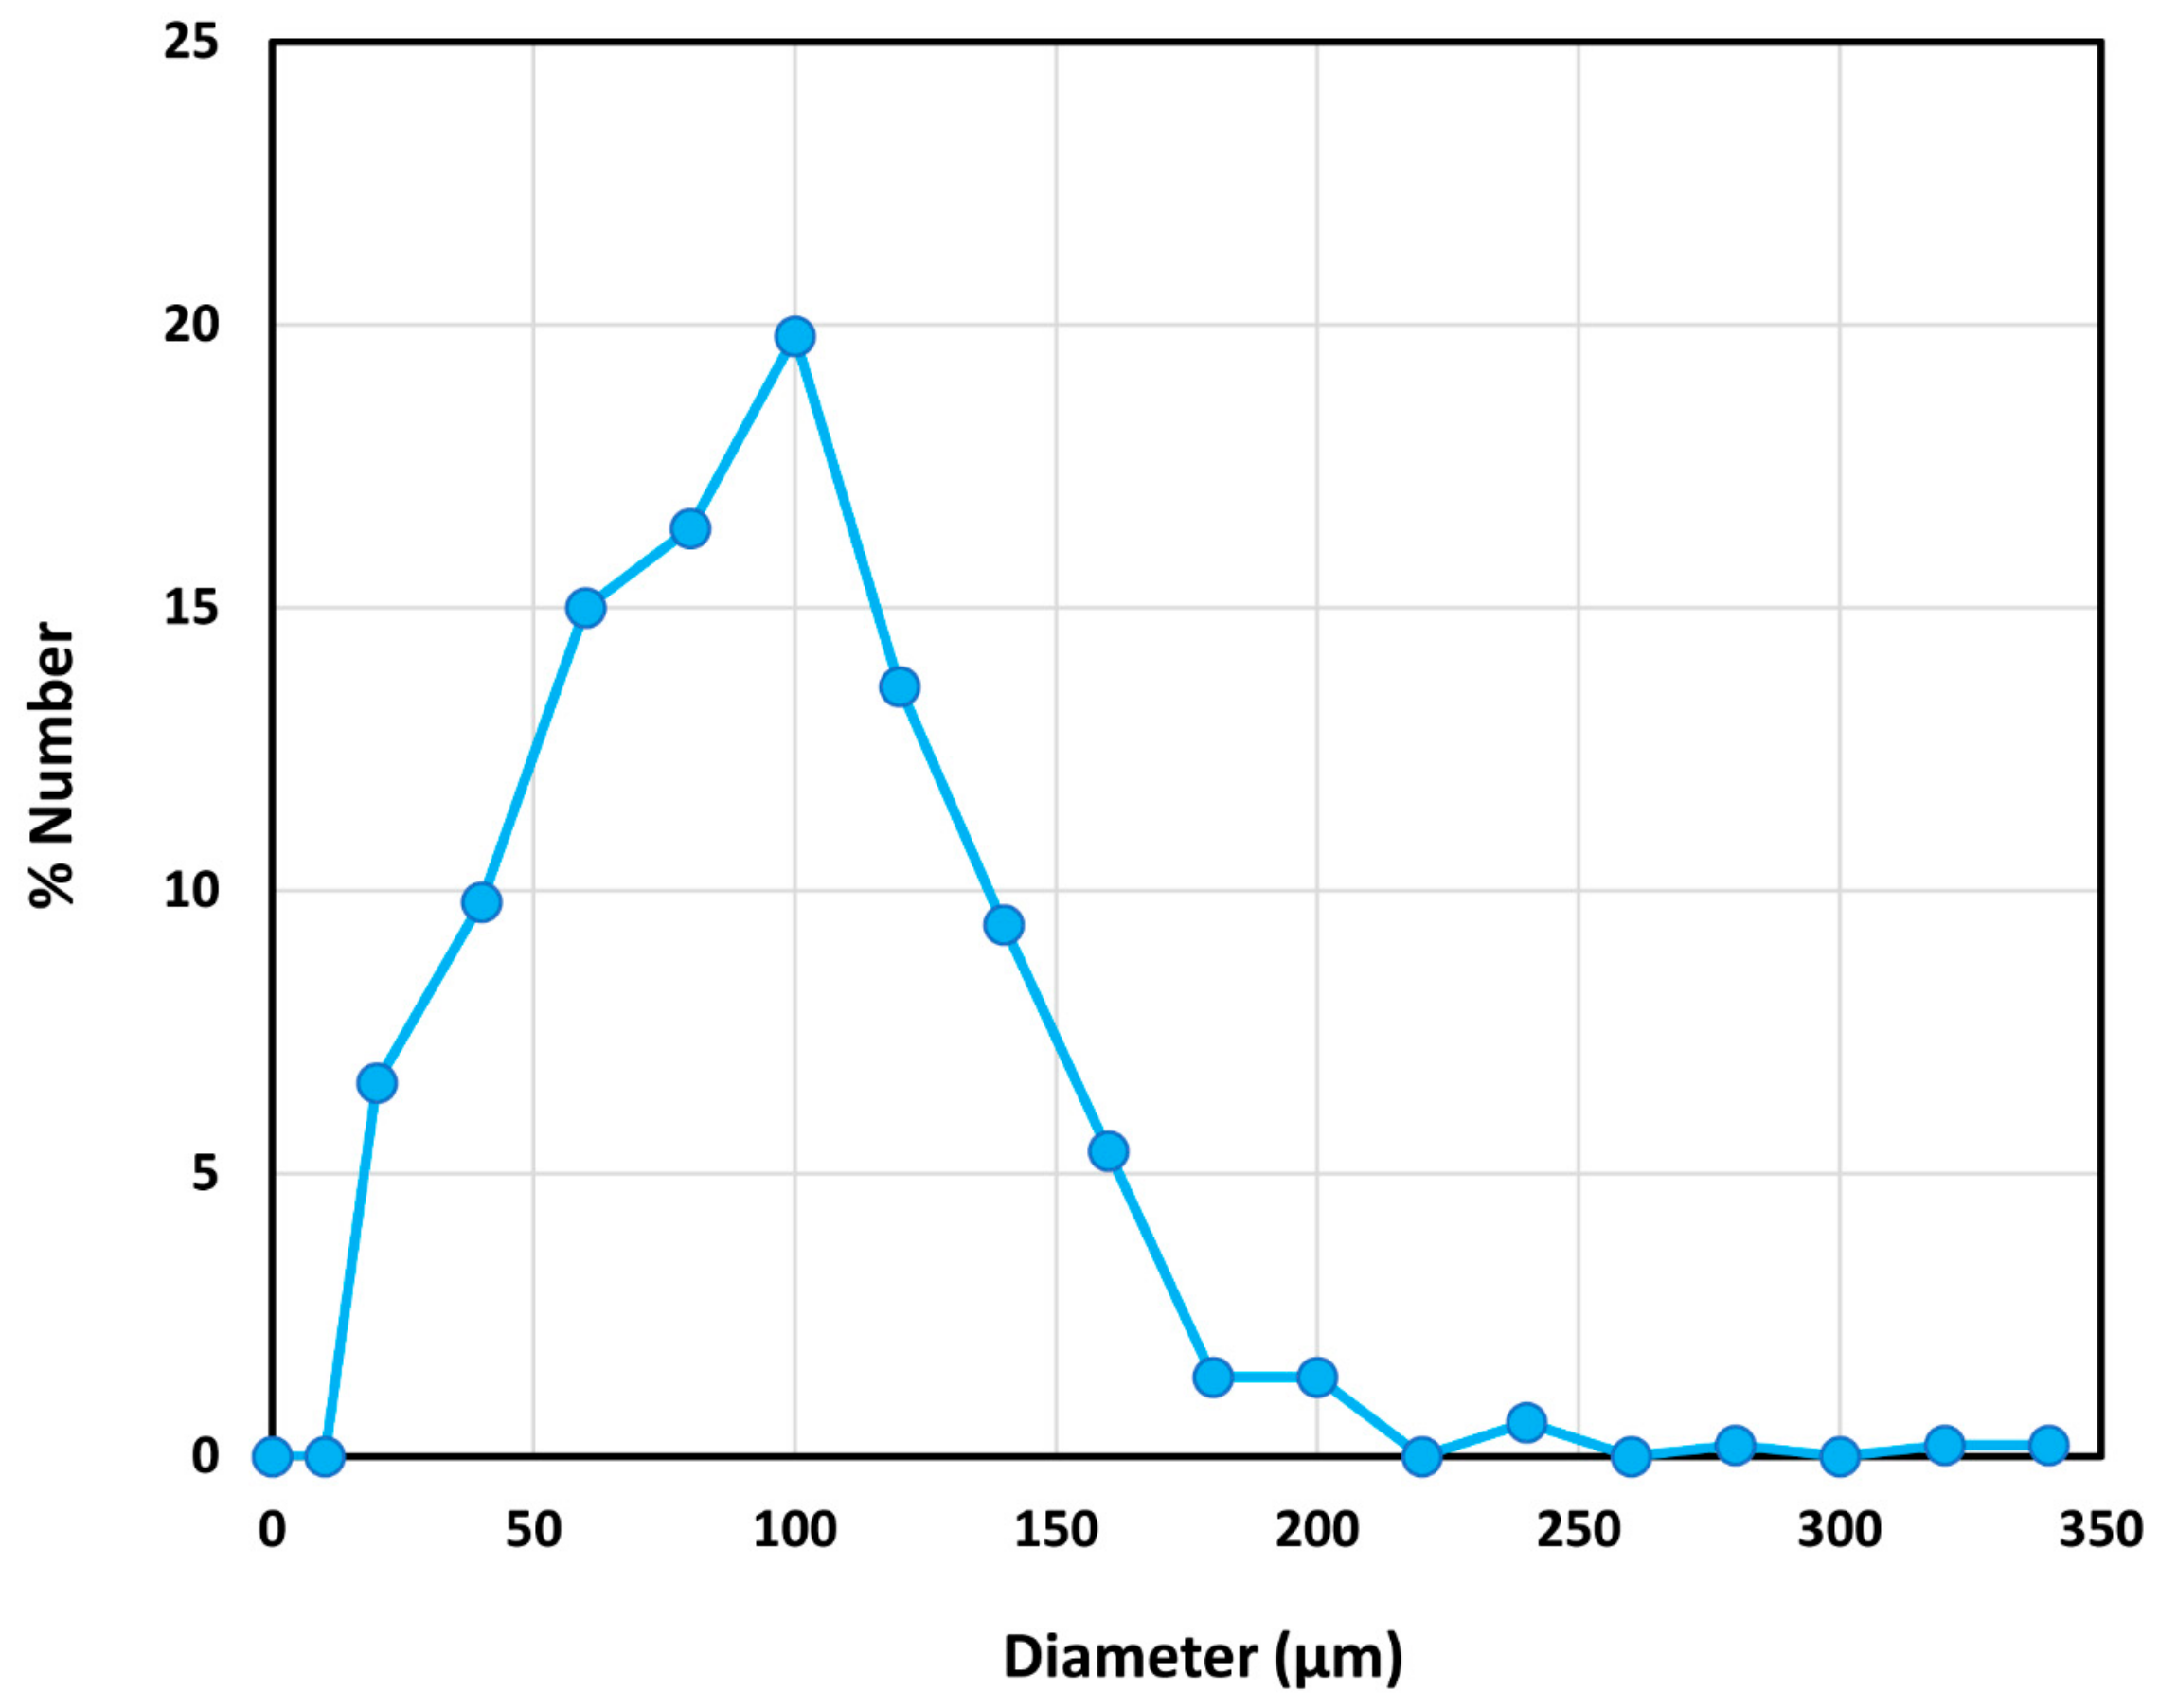
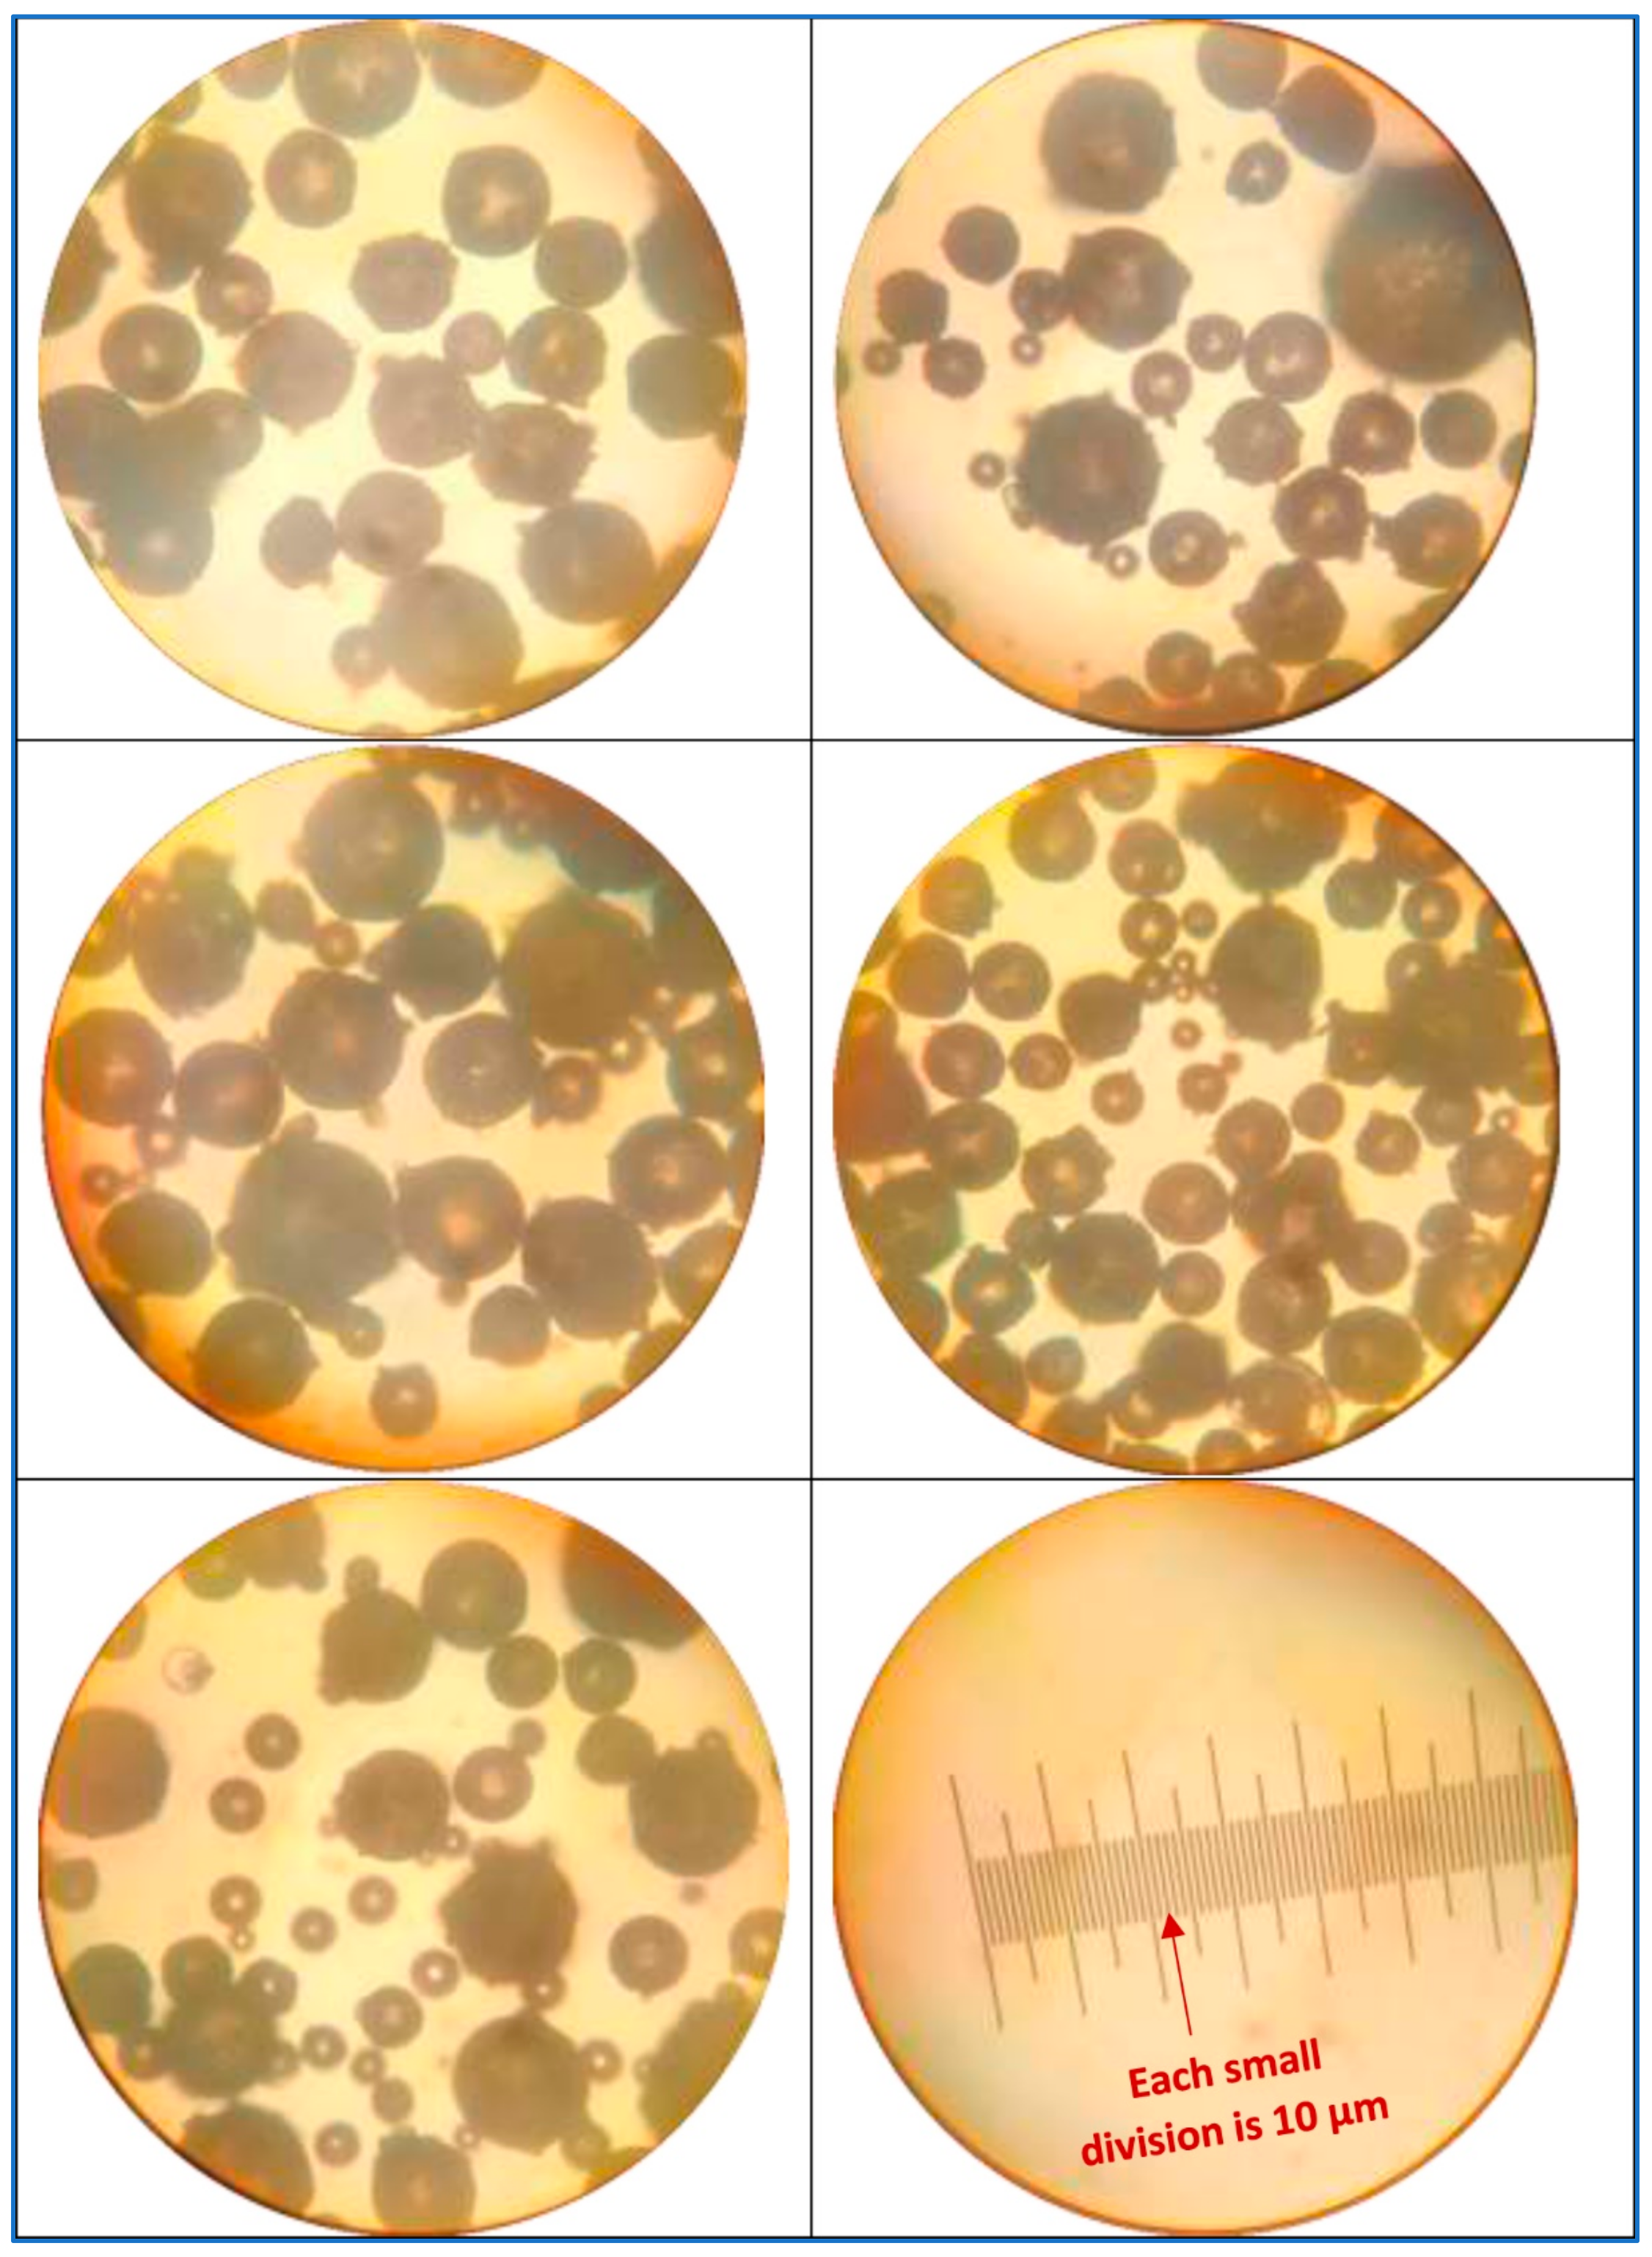
2.3. Preparation of Suspensions of Solid Particles in SNP Dispersion

Suspensions of solid particles (SG hollow spheres) in SNP dispersion were prepared at room temperature (≈22 °C) by slowly adding a known amount of solid particles to a known amount of SNP dispersion while maintaining gentle mixing of the fluids using a homogenizer. After addition of the required amount of solid particles, the mixture were sheared in the homogenizer at high speed for at least 30 min. Figure 1 shows the process of suspension preparation. The suspension thus prepared was left overnight to remove any air that was entrapped during the homogenization process. To prepare a higher solids concentration suspension, a known amount of solids was added slowly to an existing lower concentration suspension while maintaining gentle mixing of the mixture in the homogenizer. After the addition of solid particles, the mixture was sheared in the homogenizer at high speed for approximately 30 min.
The complete information about the compositions of the suspensions investigated in this study is given in Table 1. The matrix phase of the suspensions consisted of dispersion of starch nanoparticles in aqueous surfactant solution.

2.4. Measurements

Fann and Haake co-axial cylinder-type viscometers were used to perform the rheological measurements. To cover a broad range of viscosities, two Fann viscometers with different torsion spring constants and Haake viscometer with two different bobs (inner cylinders) were used. Table 2 gives the relevant dimensions of the viscometers used in this study. In the case of the Fann viscometer, the outer cylinder rotated while the inner cylinder was kept stationary. The rotational speed could be varied from 0.9 to 600 rpm. In the Haake viscometer, the outer cylinder was kept stationary while the inner cylinder rotated. The rotational speed could be varied from 0.01 to 512 rpm. Calibration of the viscometers was conducted using viscosity standards of known viscosities. All measurements of viscosities were carried out at room temperature (≈22 °C).
The size distribution and mean diameter of the solid particles (SG hollow spheres) were determined from photomicrographs taken using a Zeiss optical microscope with transmitted light. The suspension samples were diluted with deionized water before observing under the microscope.

3. Results and Discussion

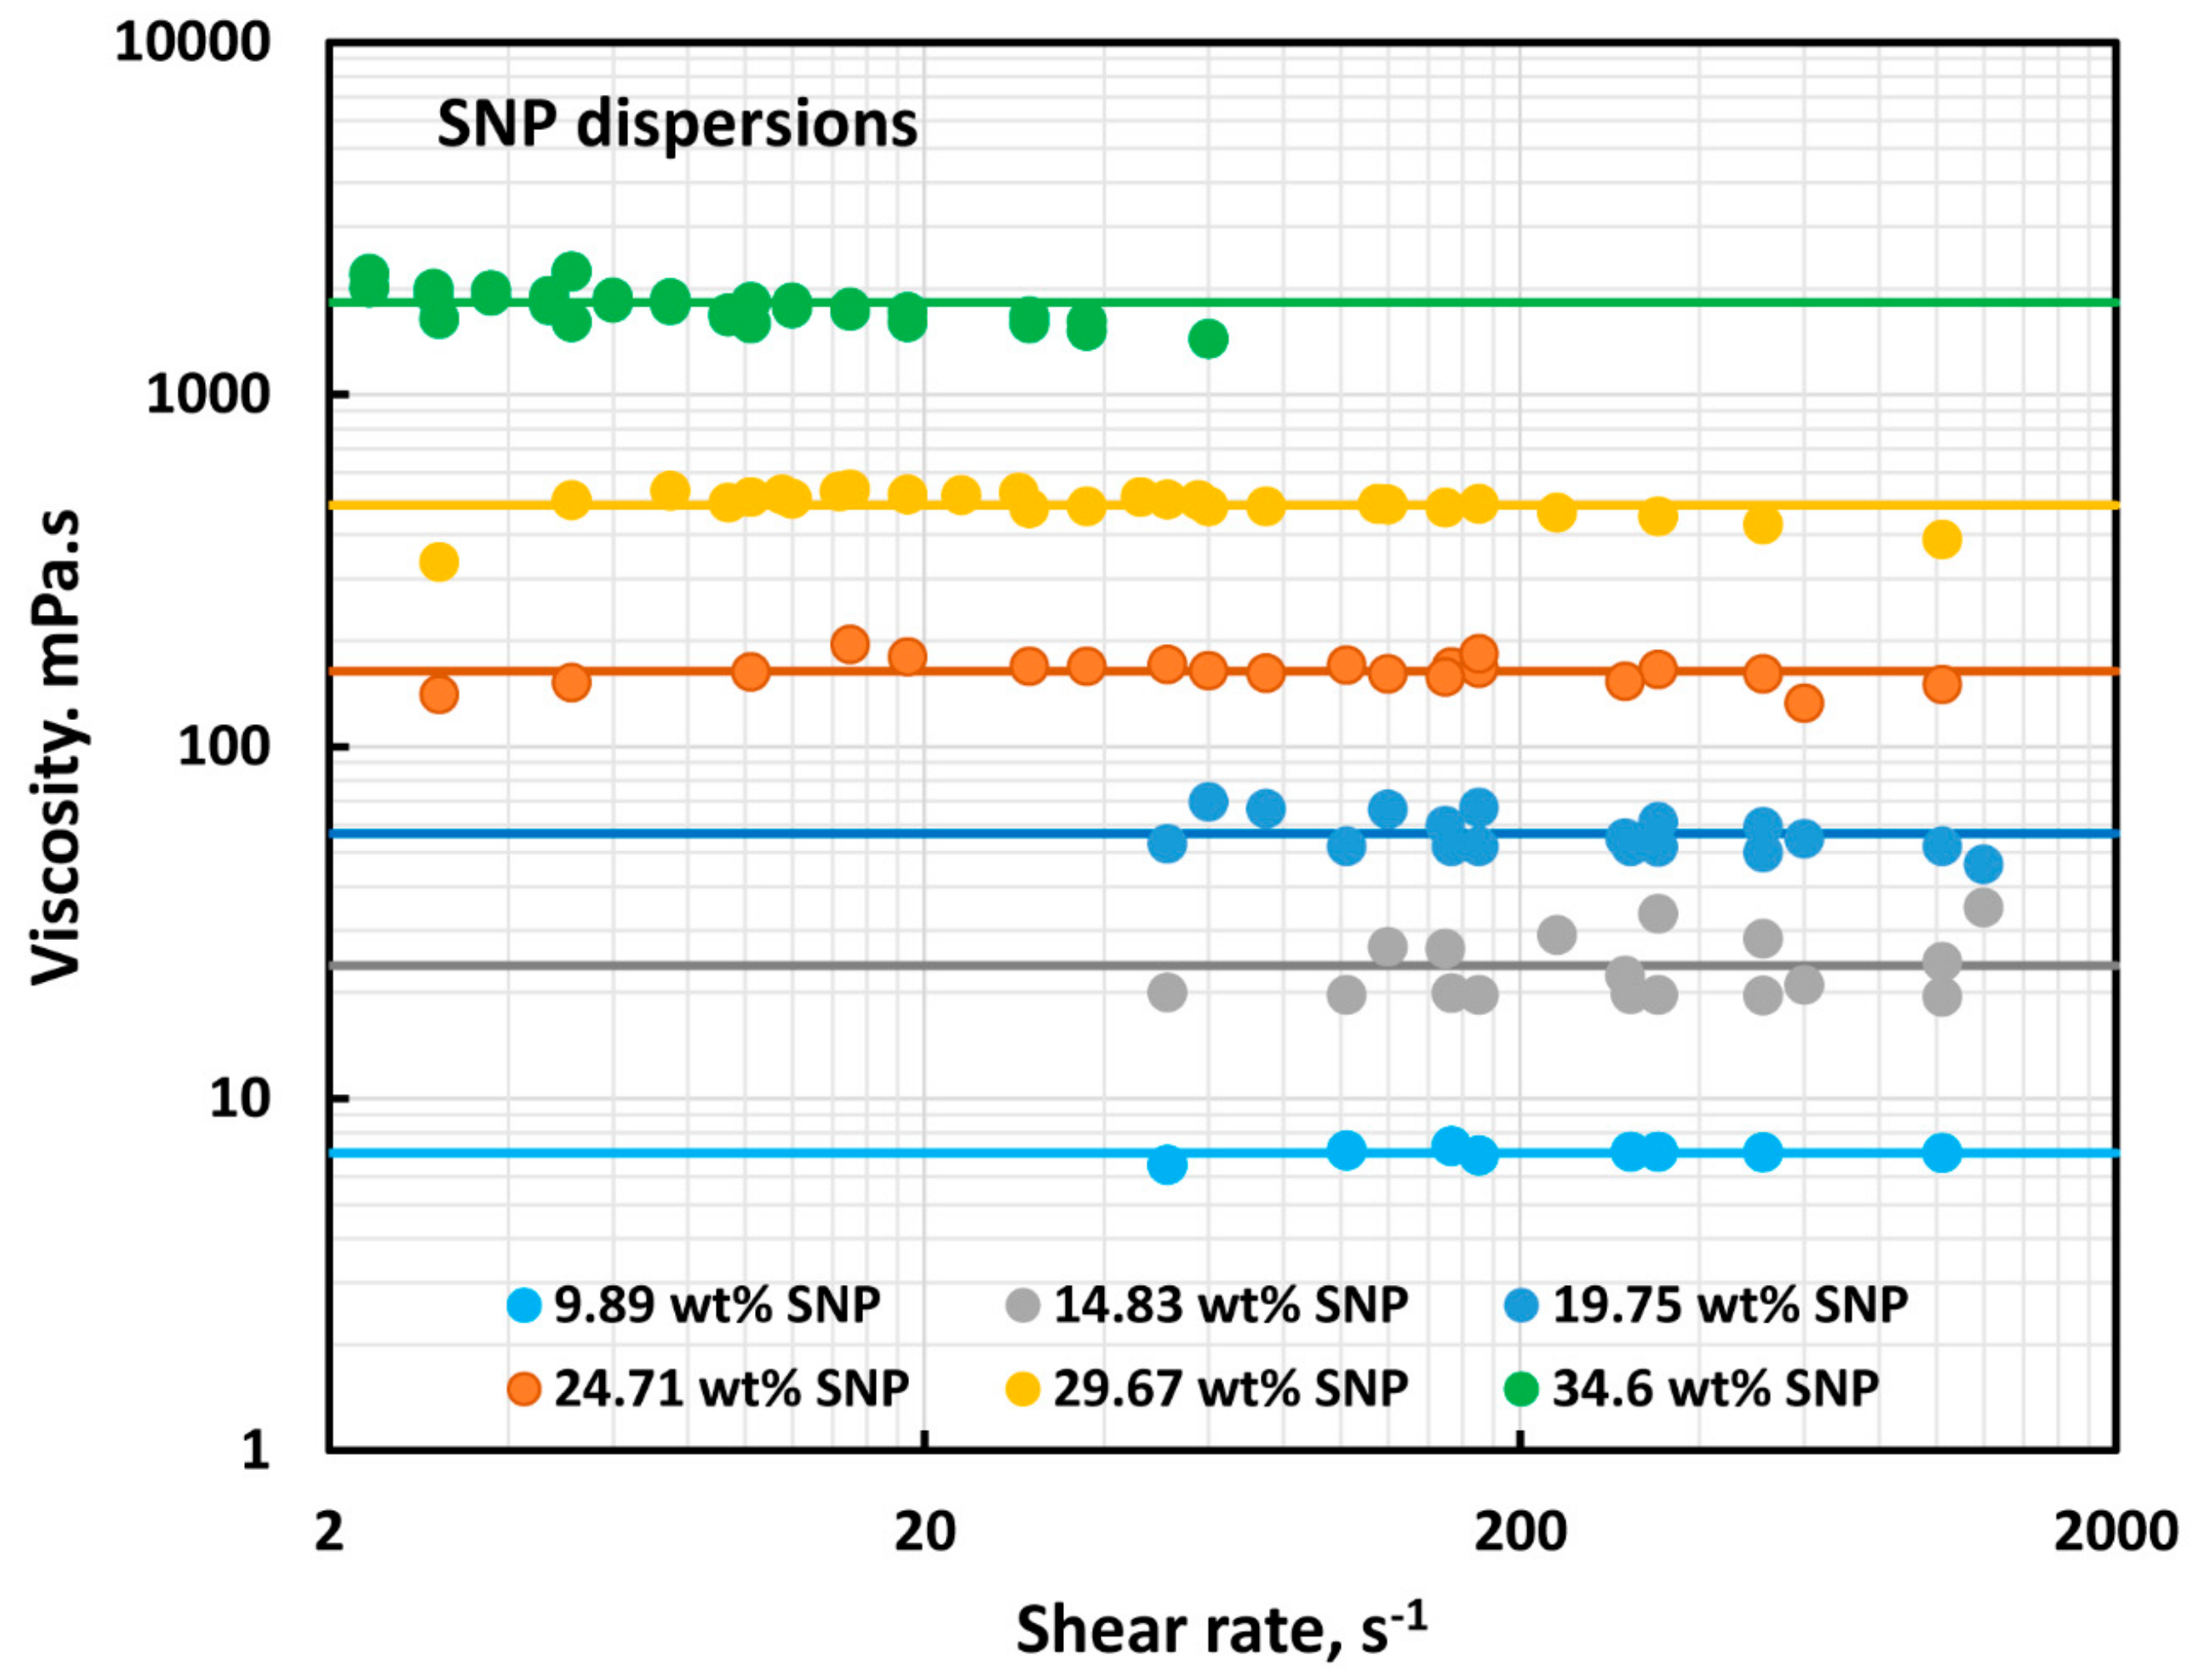
3.1. Rheology of SNP Dispersions

Figure 2 shows the samples of SNP dispersions at concentrations ranging from approximately 10 to 35 wt%. The starch nanoparticles are well homogenized, giving uniform dispersions.
The mean diameter of the starch nanoparticles in SNP dispersions was approximately 21 nm. Figure 3 shows the particle size distribution of starch nanoparticles obtained by DLS measurement in our earlier publication [18].
Figure 4 shows the viscosity versus shear rate plots of SNP dispersions. The SNP dispersions are Newtonian over the full range of SNP concentration (9.89 to 34.6 wt%) investigated. The viscosity of any SNP dispersion is constant independent of the shear rate. However, the viscosity increases with the increase in SNP concentration.

3.2. Rheology of Suspensions of Solid Particles in SNP Dispersions

The size distribution of the particles (SG hollow spheres) of suspension is shown in Figure 5. The particle size ranged from 10 to 340 µm. Overall, 500 particles were counted to determine the particle size distribution. The Sauter mean diameter of the particles is 138 µm. Figure 6 shows the typical photomicrographs of the particles of suspension.
Figure 7, Figure 8, Figure 9, Figure 10, Figure 11 and Figure 12 show the flow curves (viscosity versus shear rate plots) of suspensions of solid particles in SNP dispersions. In each figure, the SNP concentration is fixed but the particle concentration is varied. From the figures, the following important characteristics of suspensions of solid particles in SNP dispersions should be noted:
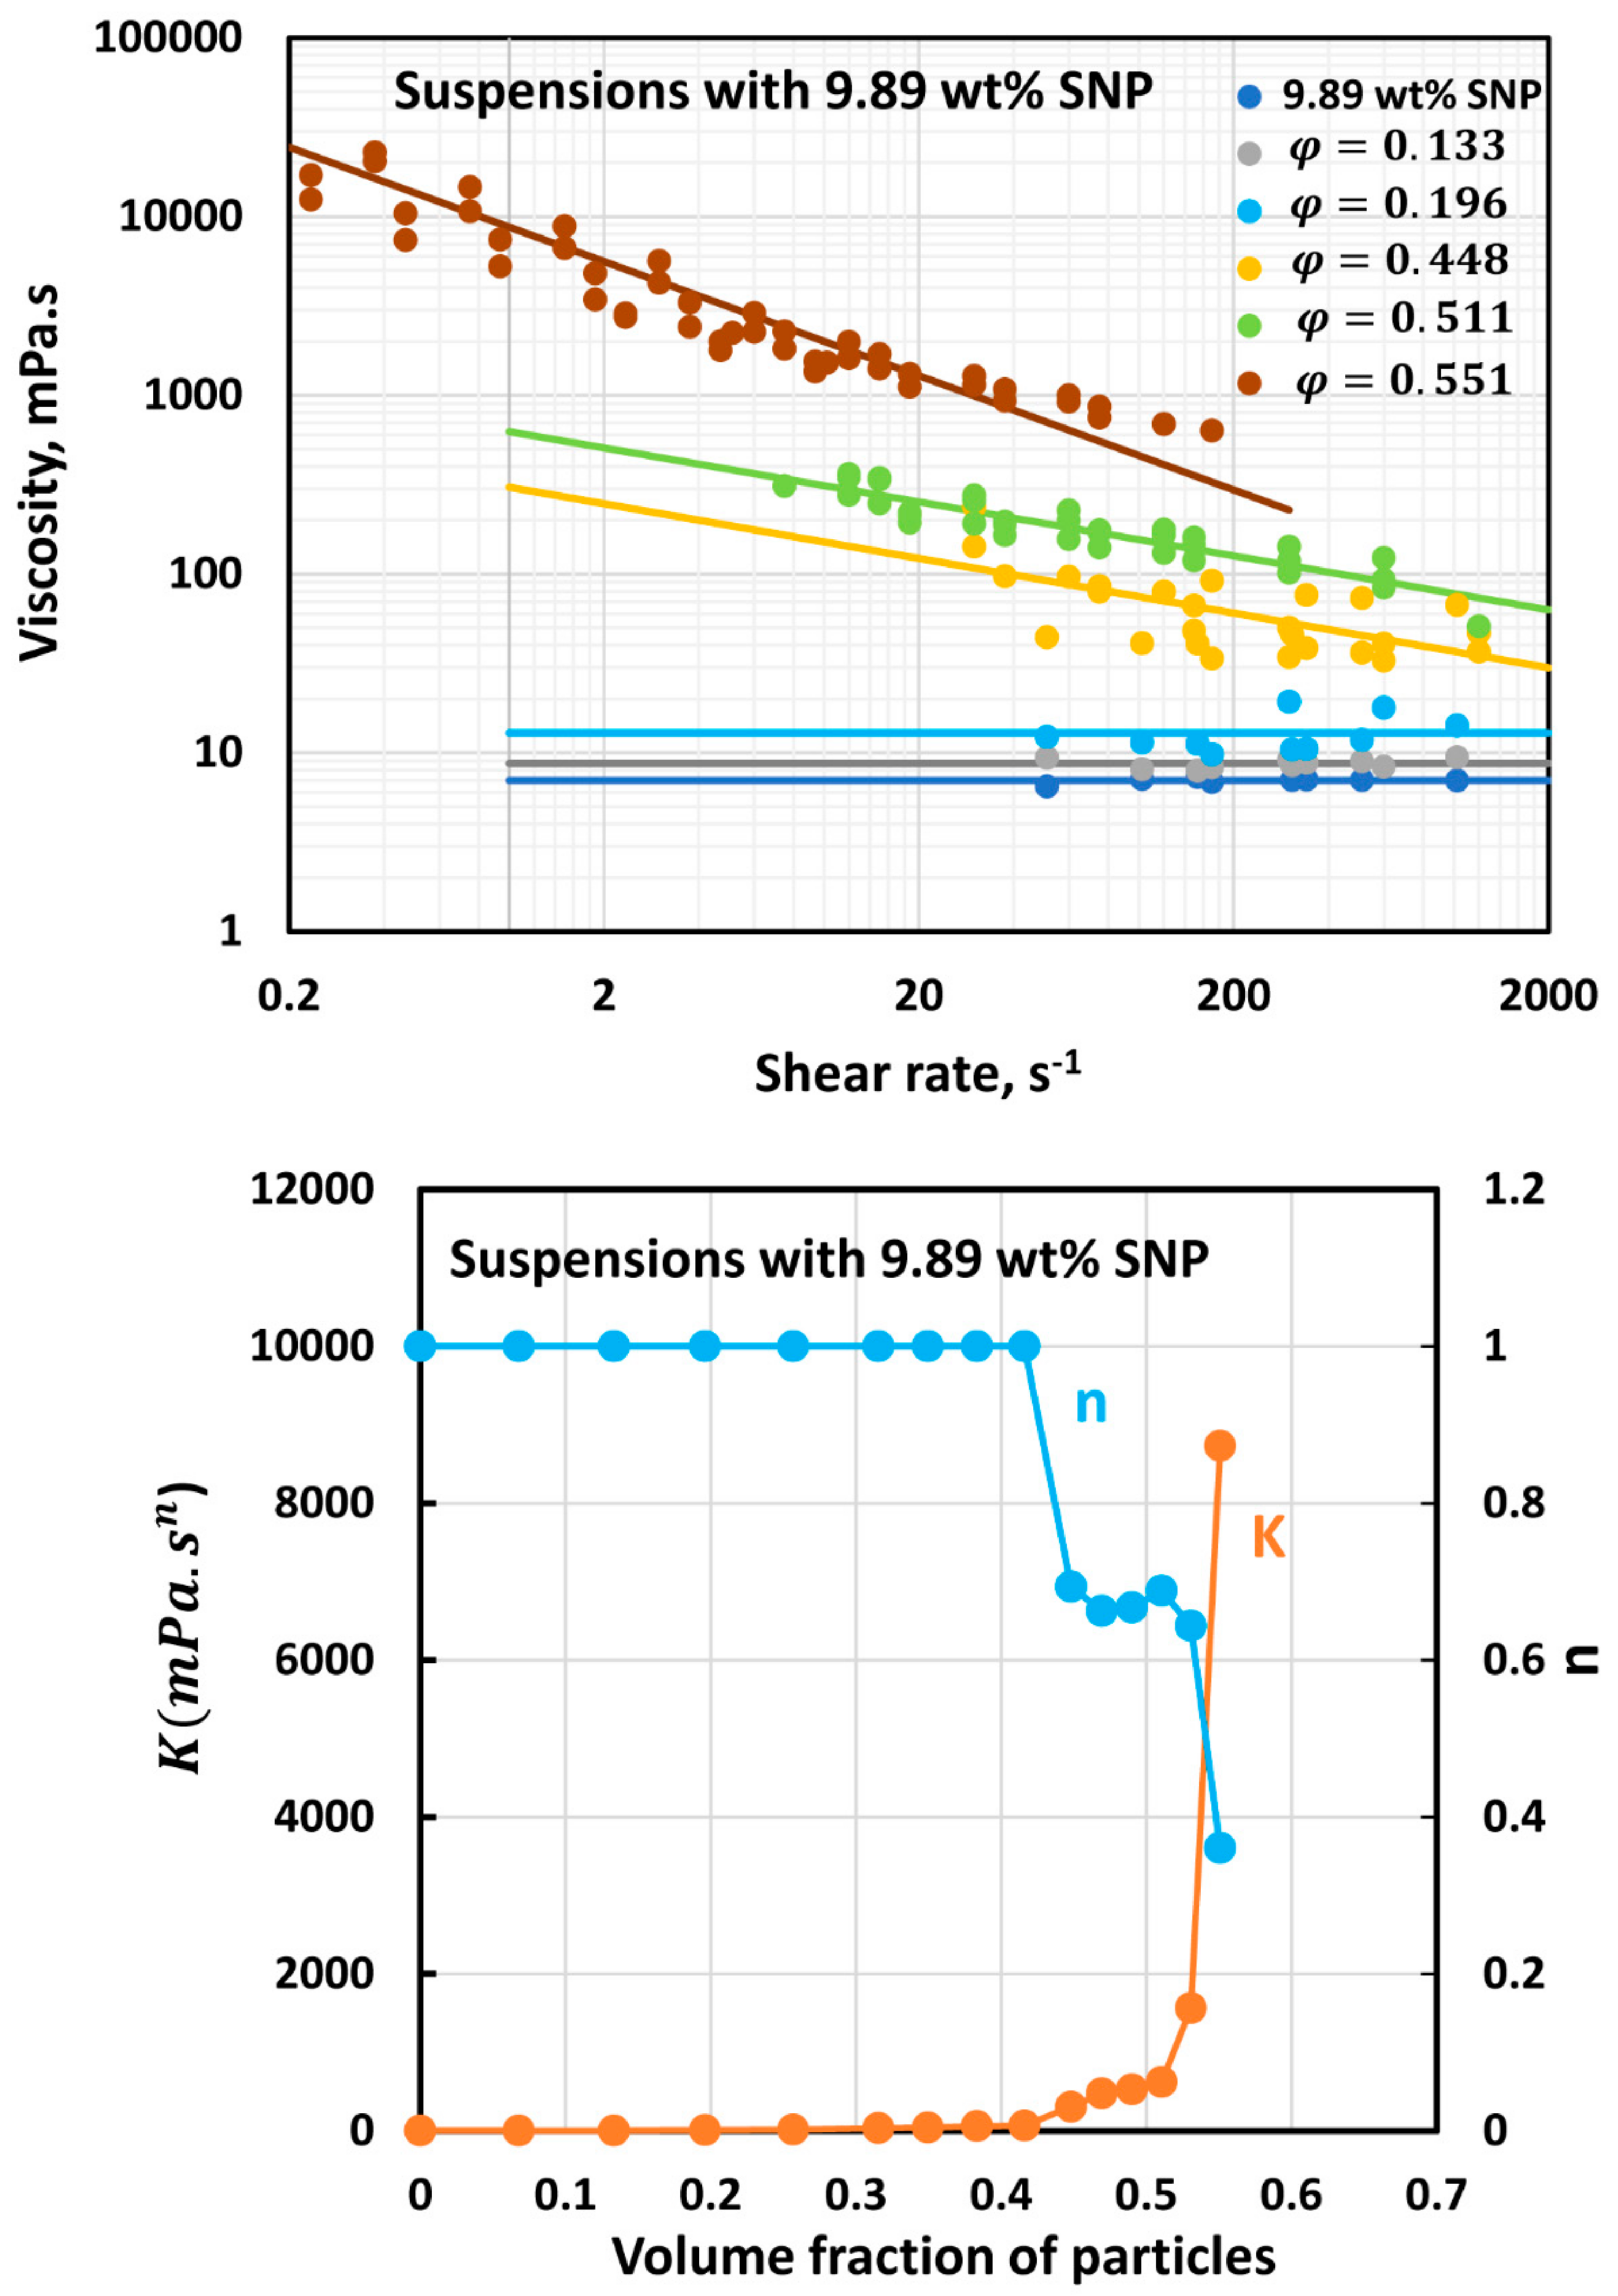
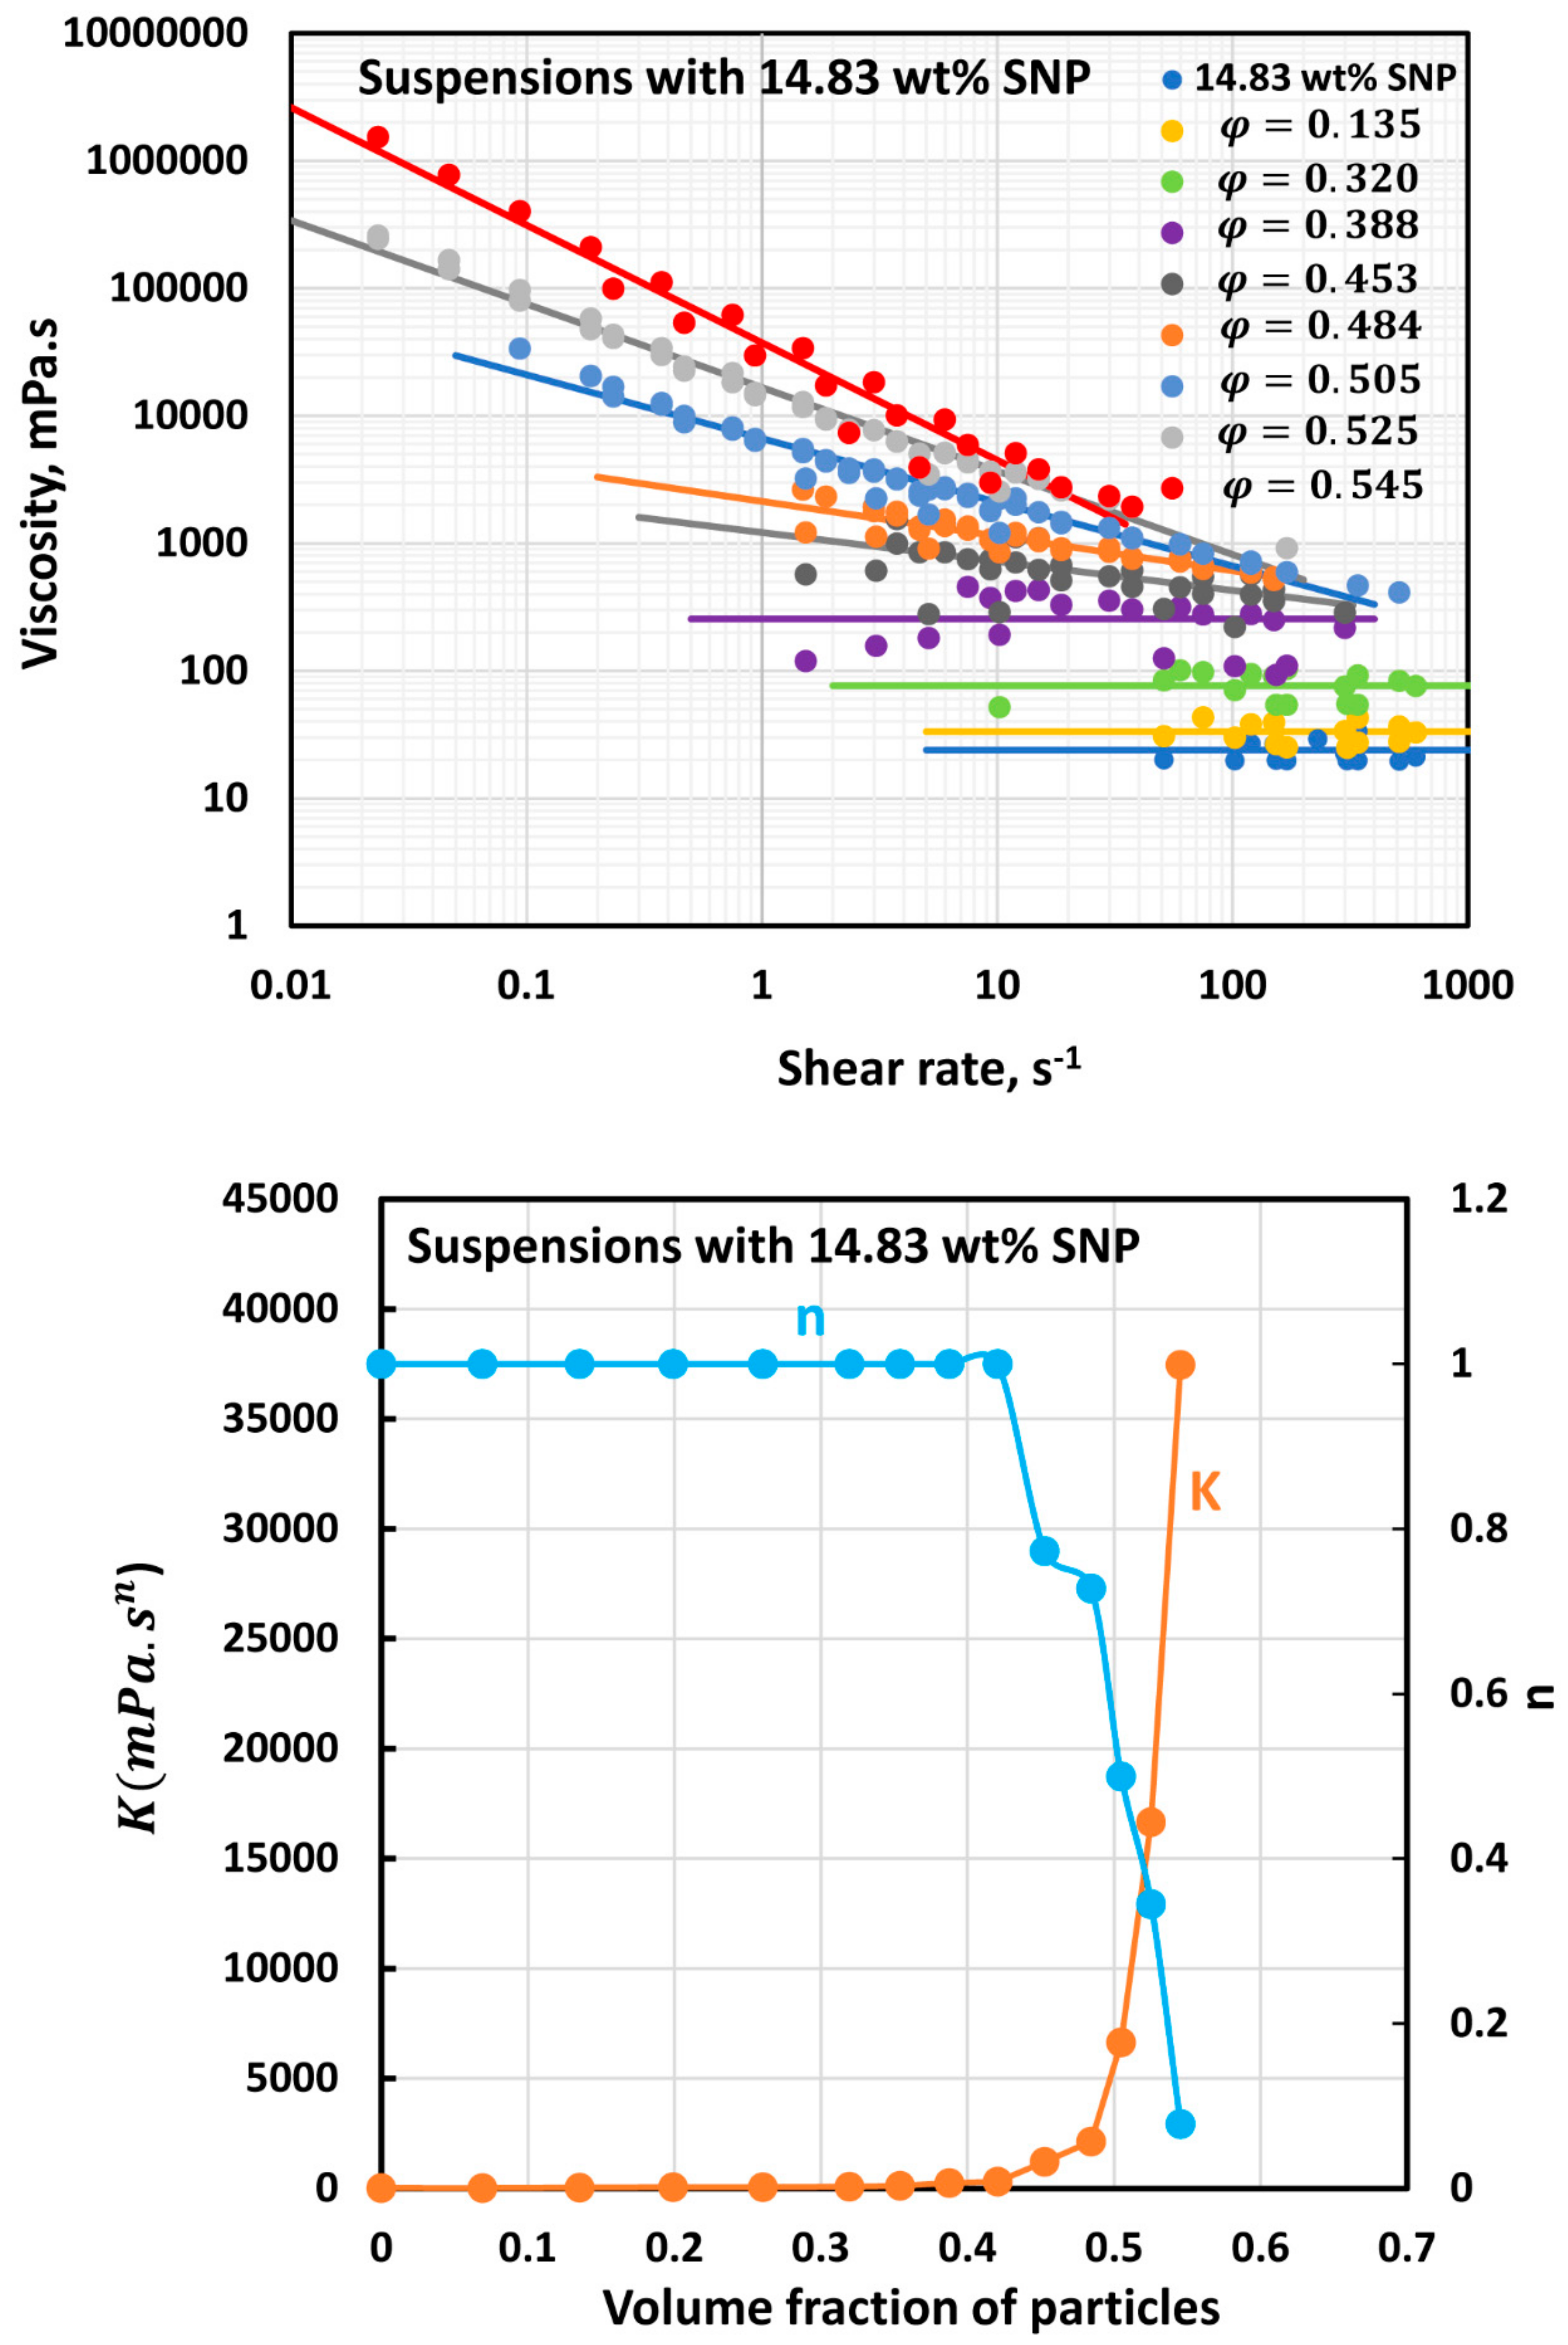
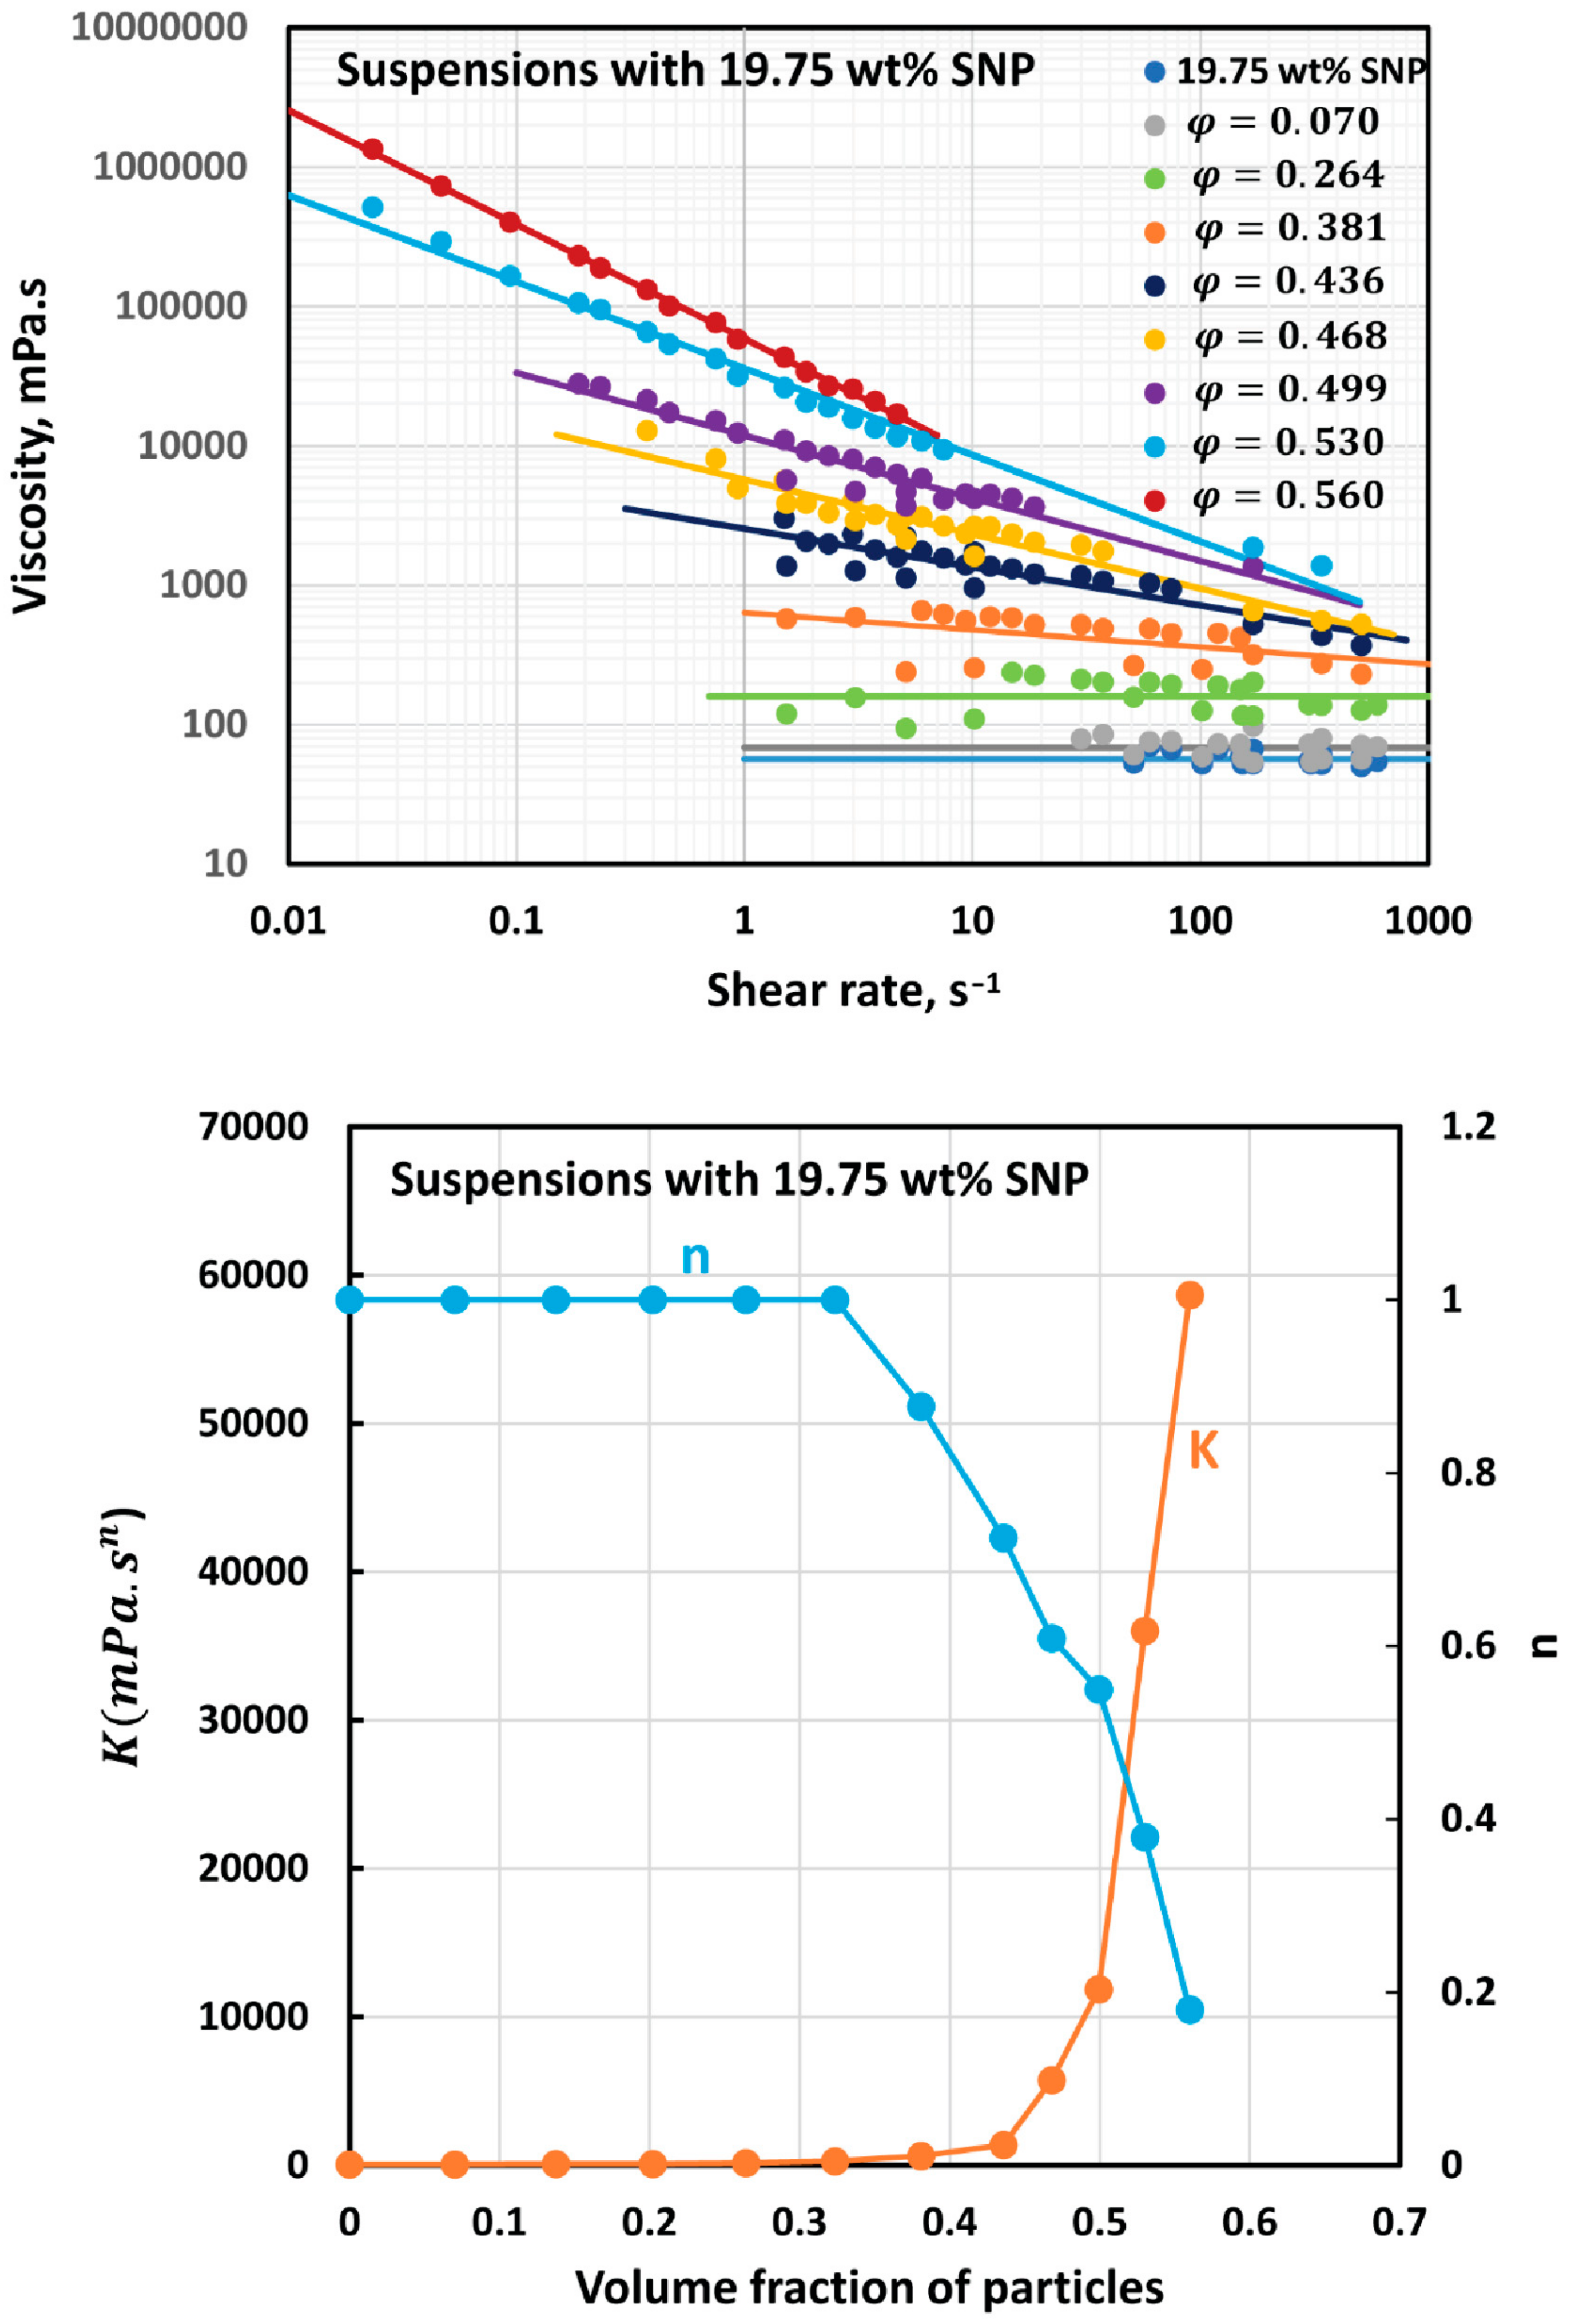
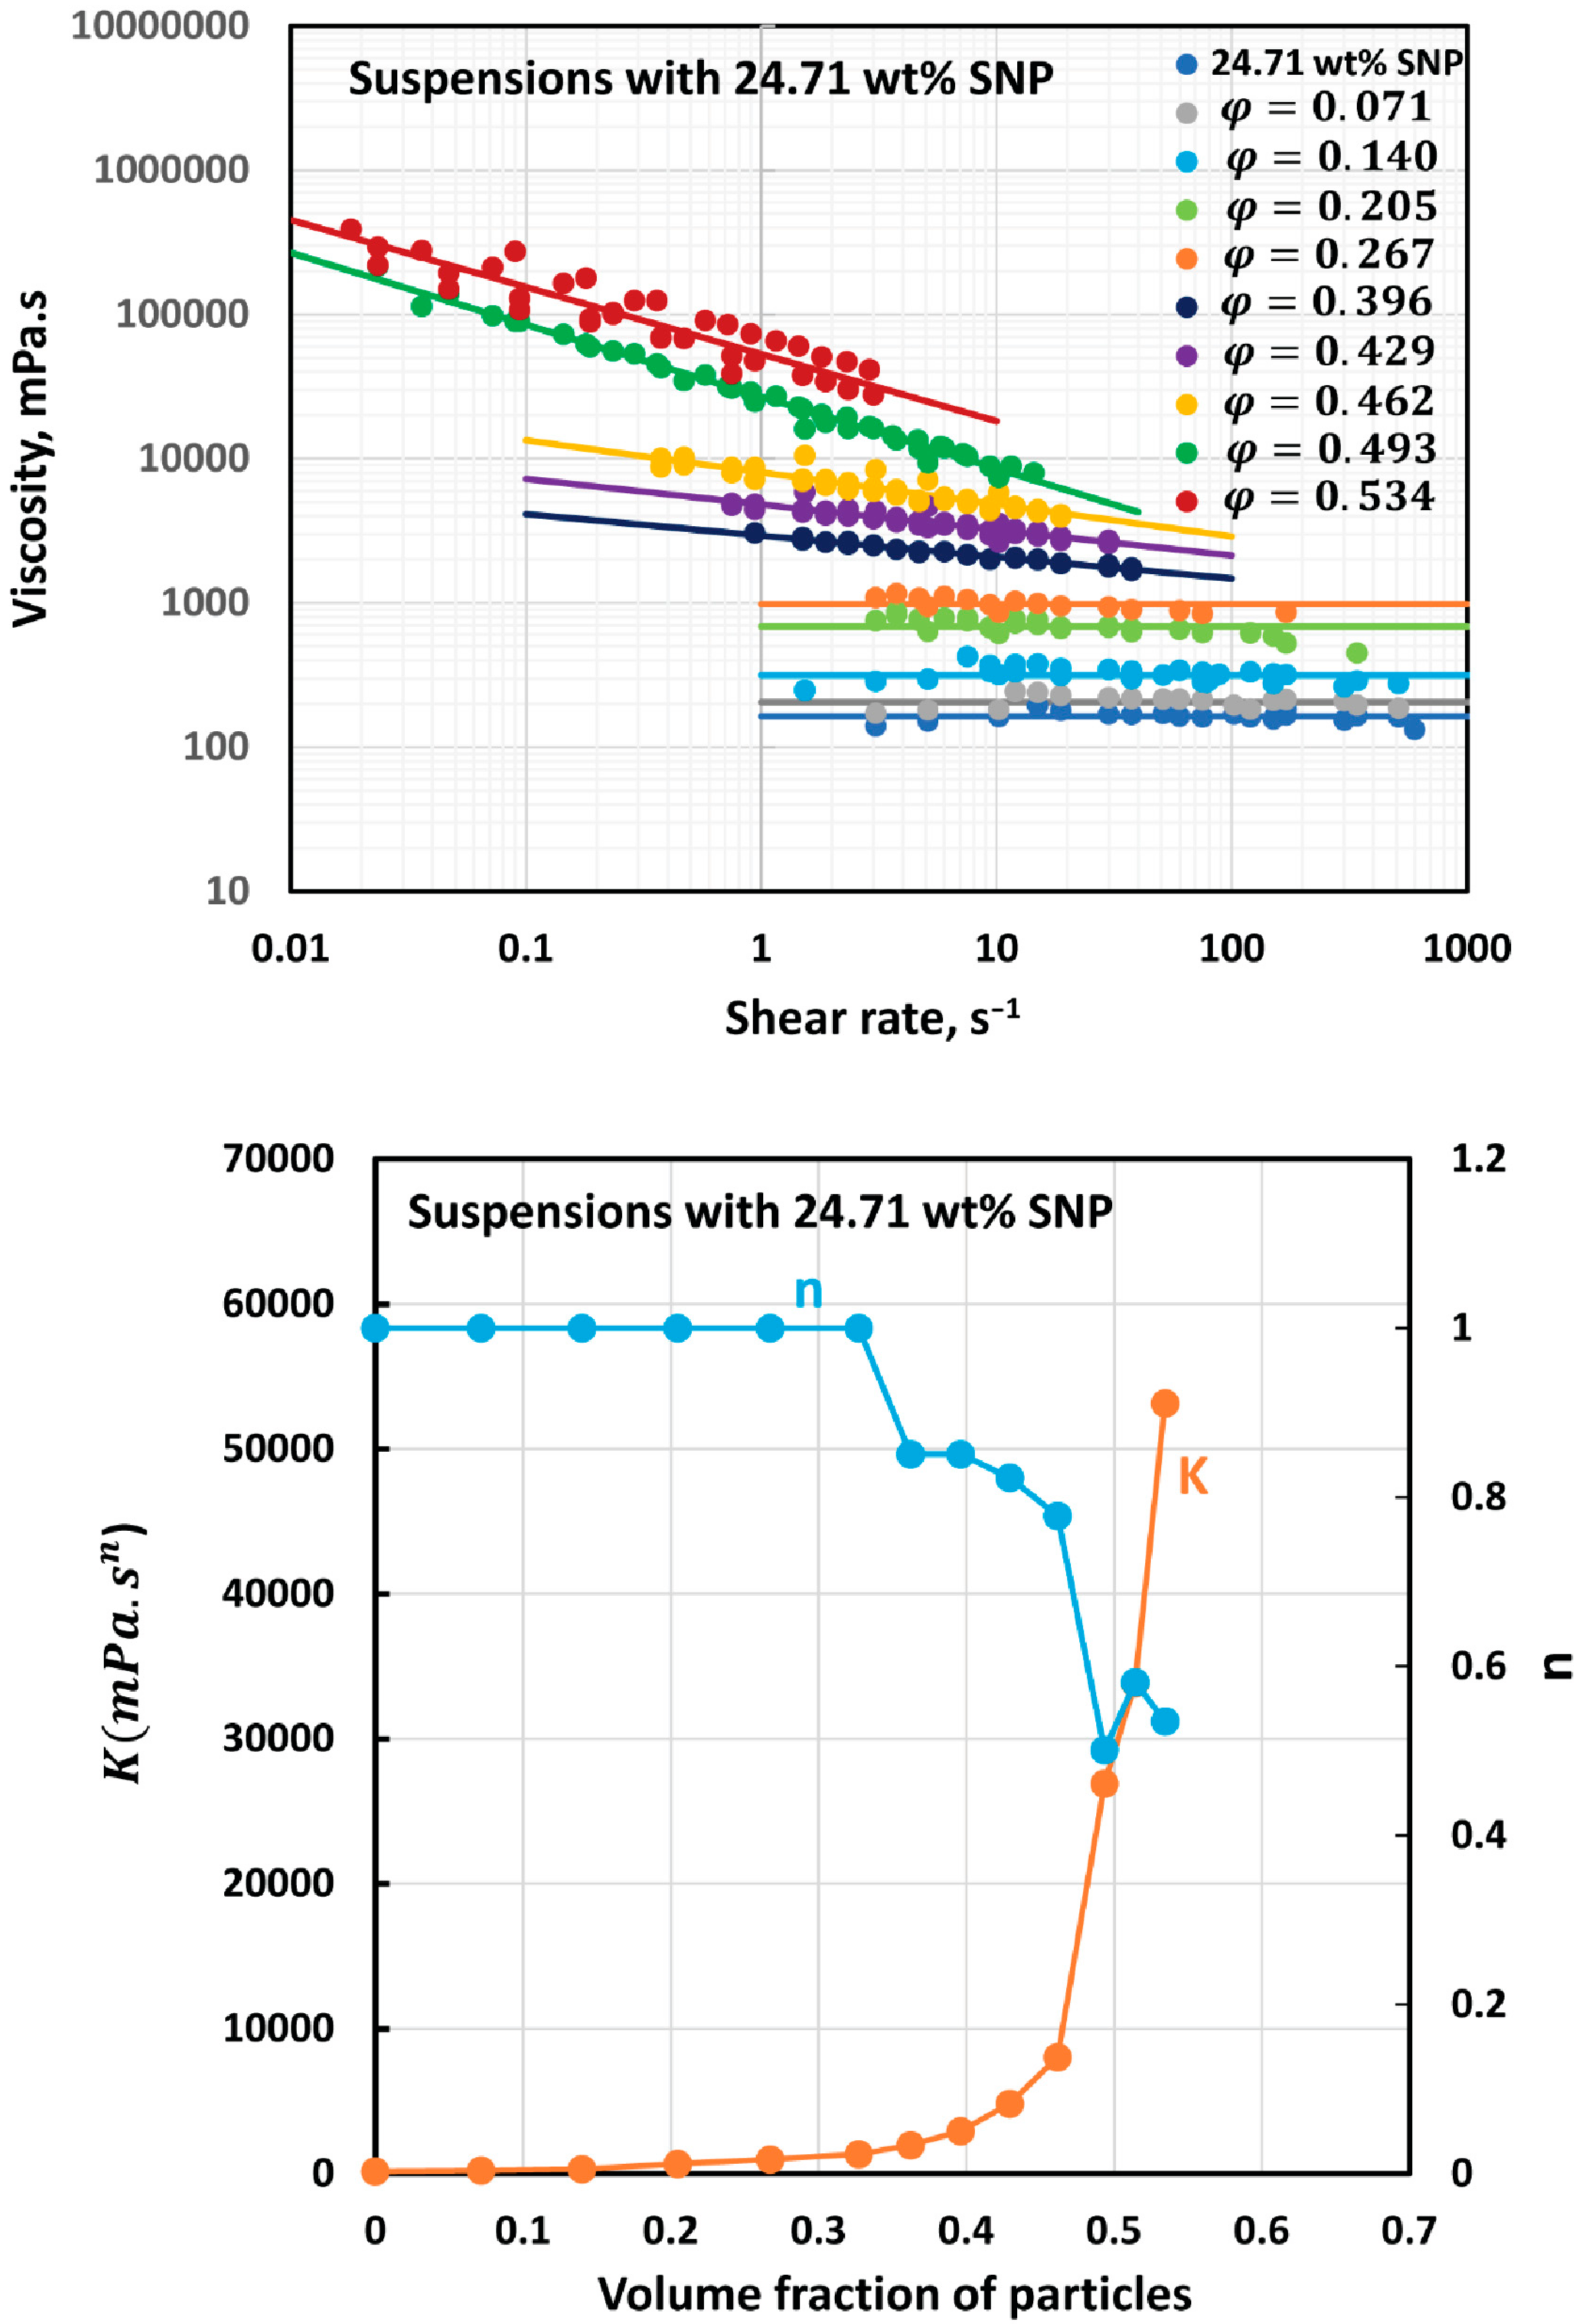
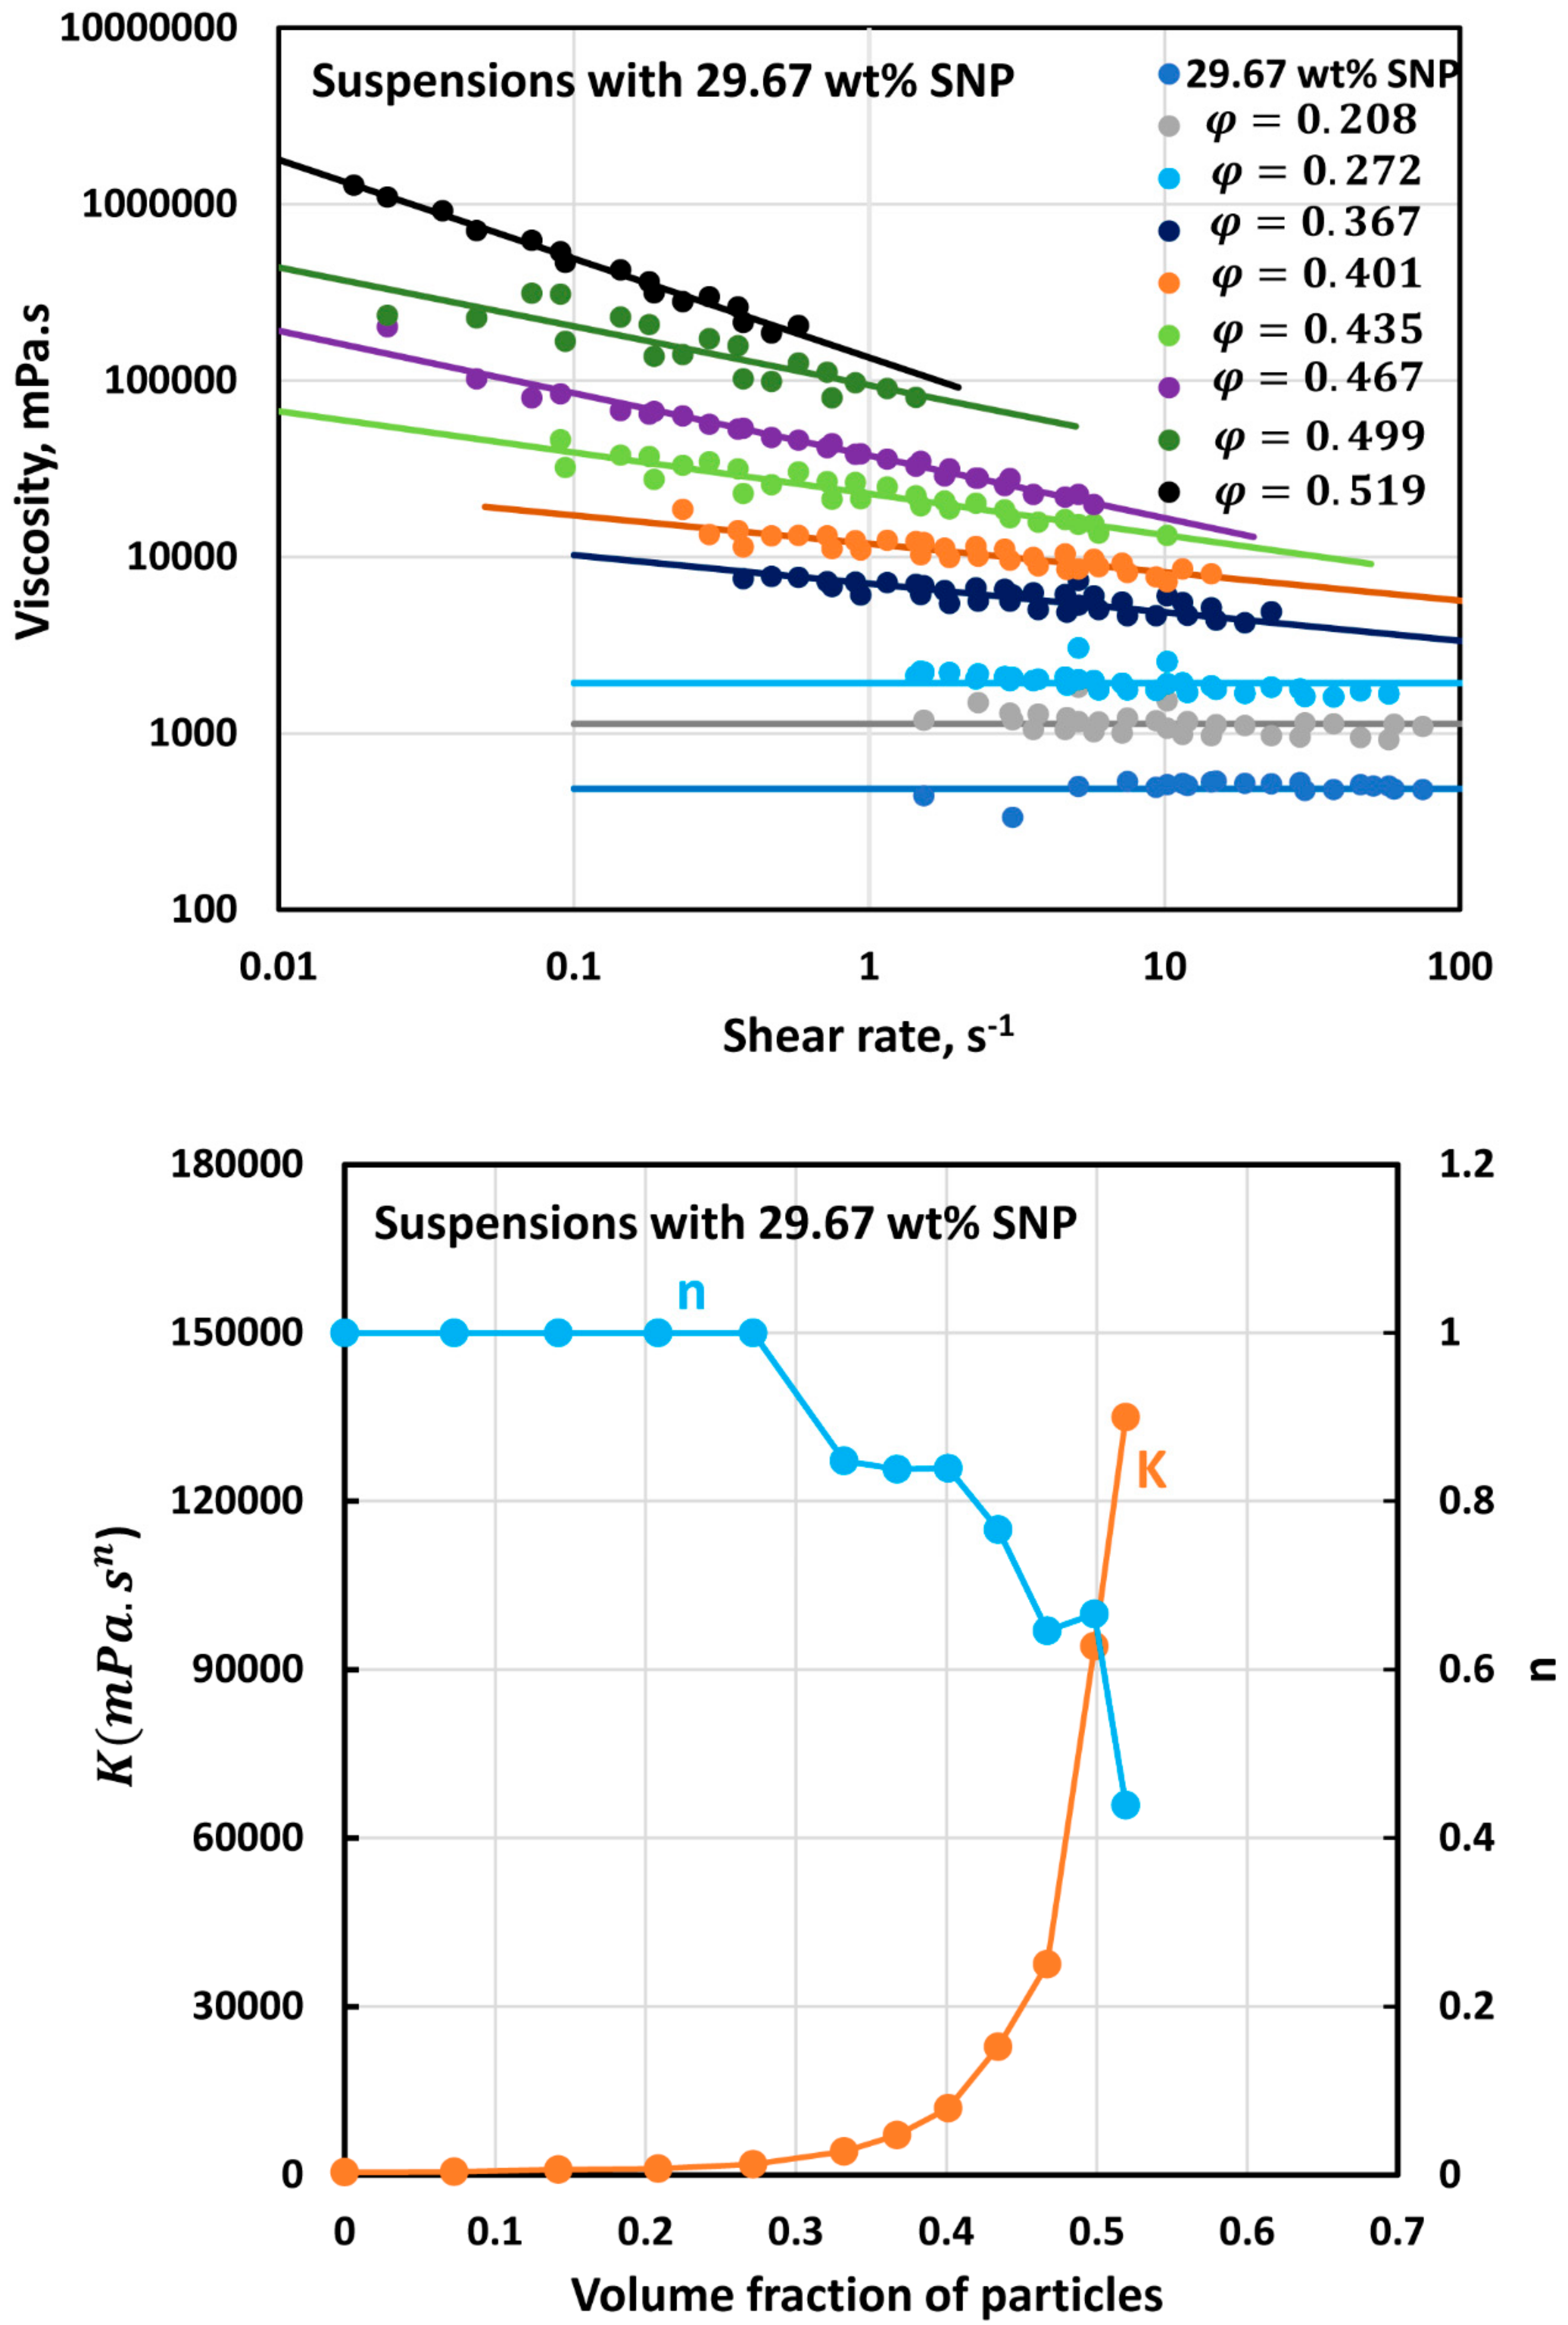
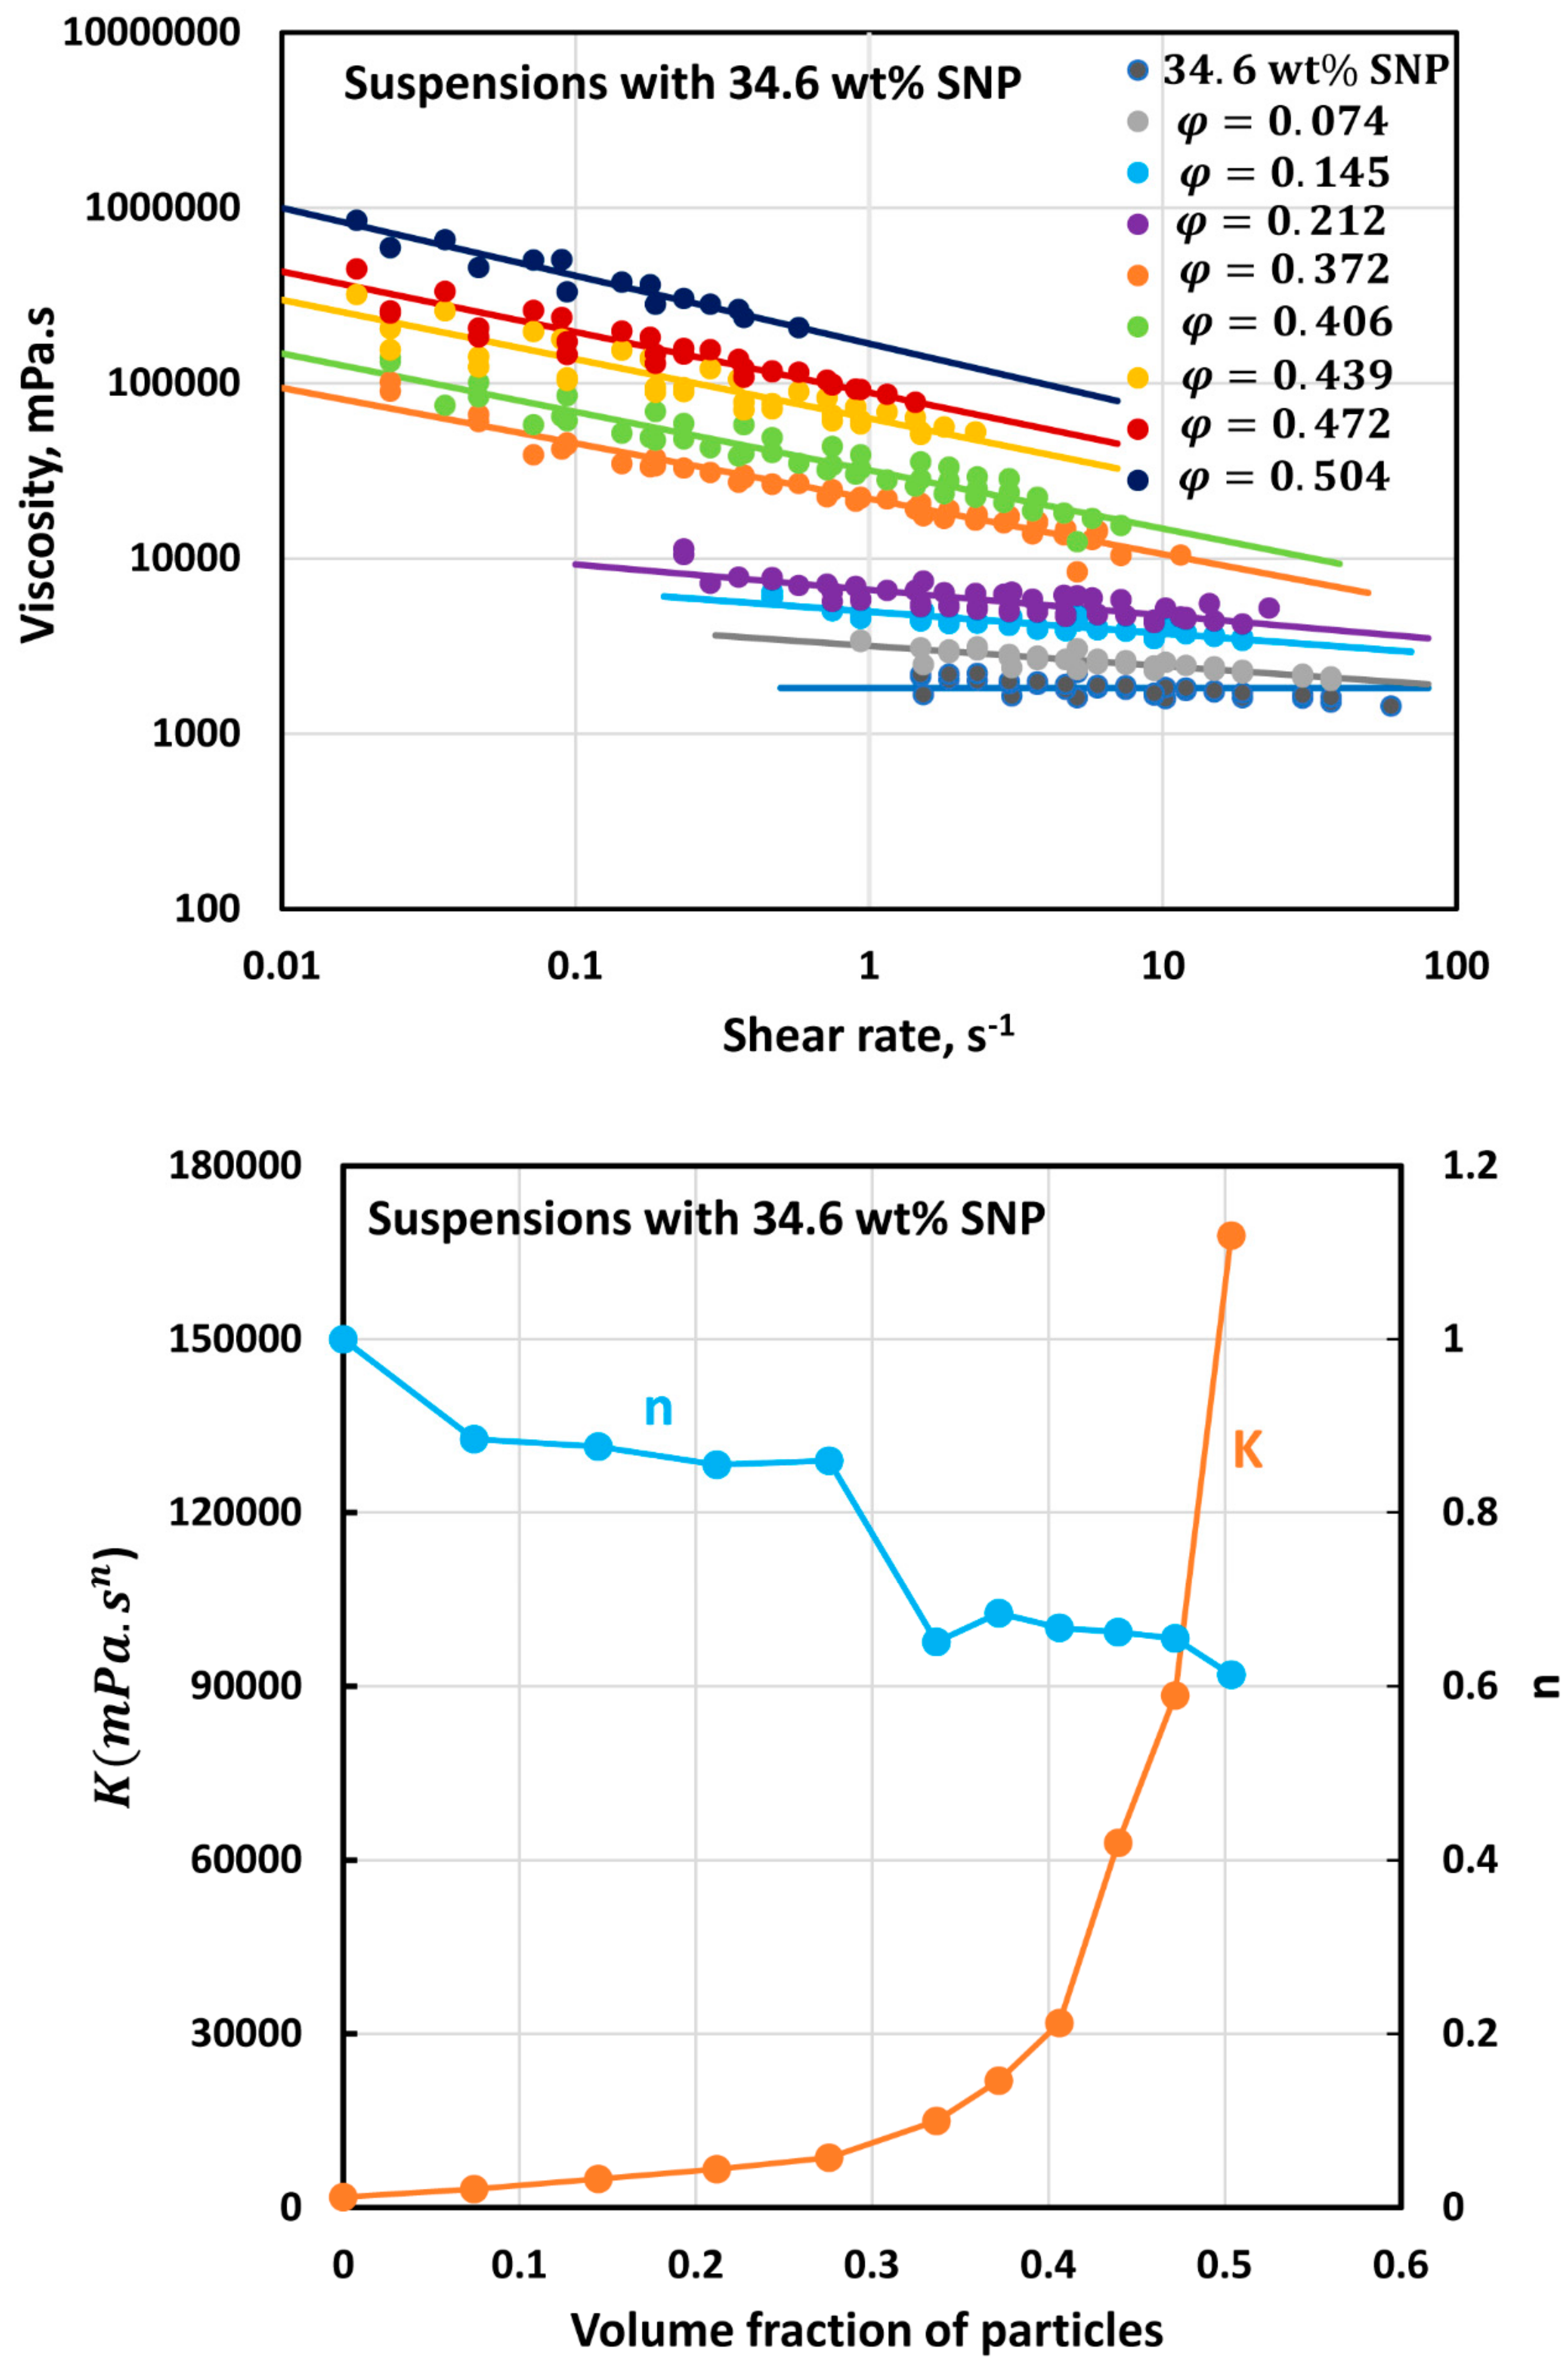
  • At any given SNP concentration, suspensions are generally Newtonian at low solids concentrations. Suspensions become shear-thinning non-Newtonian, that is, viscosity decreases with the increase in shear rate, at high solids concentrations. The shear-thinning in suspensions at high solids concentrations can be explained in terms of shear-induced collision, aggregation, and subsequent break-up of aggregates.
  • As the SNP concentration is increased, suspensions become shear-thinning non-Newtonian at a lower solids concentration. For example, at a high SNP concentration of 34.6 wt%, the suspensions become non-Newtonian at a low solids volume fraction of 0.074. This indicates that starch nanoparticles play a role in structure build-up in these suspensions. With the increase in SNP concentration, the starch nanoparticles probably form bridges between the neighboring solid particles.
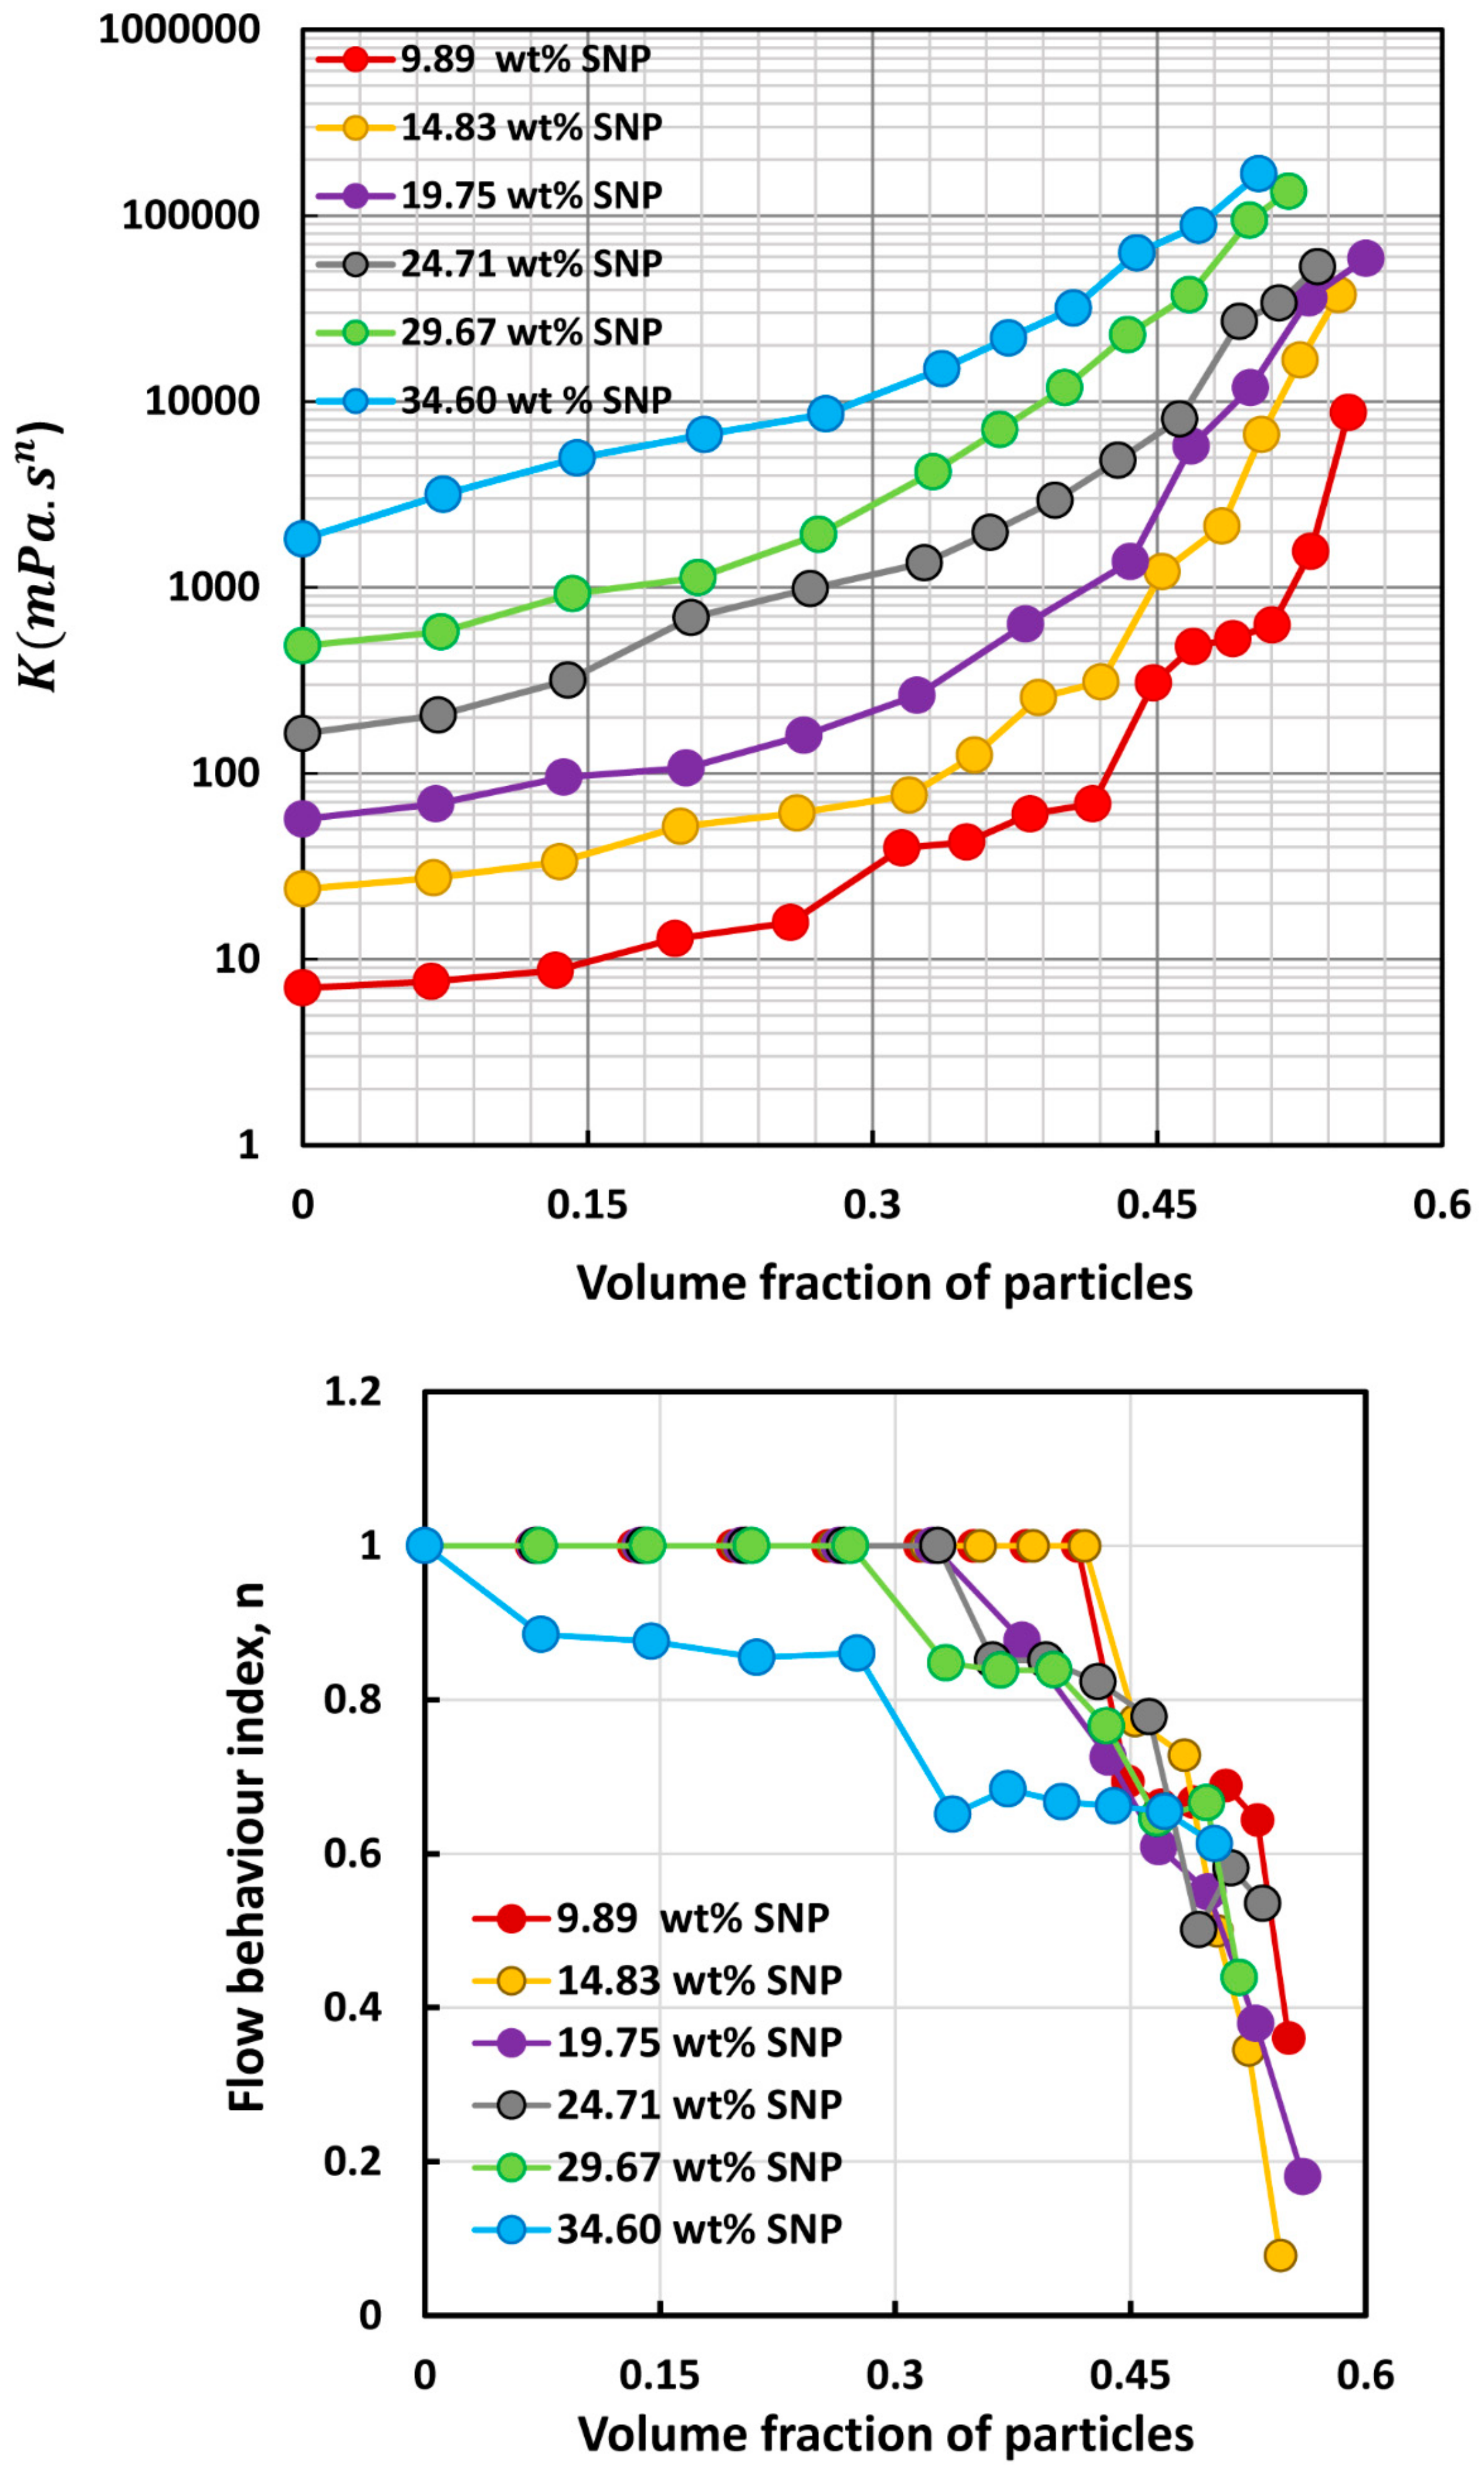
  • The flow behavior of suspensions can be described adequately using the following power law model:
τ = K γ ˙ n
η = τ / γ ˙ = K γ ˙ n 1
where τ is the shear stress, γ ˙ is the shear rate, K is the consistency index, n is the flow-behavior index, and η is the viscosity.
  • According to the power law model (Equation (2) or Equation (3)), the decrease in viscosity with the increase in shear rate is a linear relationship on a log-log plot, as observed experimentally. The power-law constants, n   and   K , are determined from the slope and intercept of this linear relationship.
  • The consistency index K increases with the increase in solids volume fraction at any given SNP concentration.
  • The flow behavior index n of suspensions is well-below a value of unity at high solids volume fractions, indicating shear-thinning in suspensions.
Figure 13 compares the consistency index K and flow behavior index n values for suspensions of solid particles in SNP dispersions with different concentrations of SNP. The consistency index of suspension increases with the increase in volume fraction of particles at any given SNP concentration. The consistency index of suspension also increases with the increase in SNP concentration at a fixed volume fraction of solid particles. The flow behavior index n of suspension at any given SNP concentration is unity up to a certain volume fraction of particles indicating Newtonian behavior. At higher volume fractions of particles, the flow behavior index drops sharply below a value of unity indicating shear-thinning behavior of suspensions. The transition from Newtonian to non-Newtonian behavior occurs at a lower volume fraction of particles as the SNP concentration is increased.
The increase in consistency index with the increase in volume fraction of particles is expected as the particles act as obstacles to flow resulting in an increase in flow resistance and consistency. Increasing the SNP concentration of suspension at a fixed volume fraction of particles, the viscosity of the matrix fluid is increased (see Figure 4). It is well-known that the viscosity of suspension is directly proportional to the viscosity of matrix fluid [1]. Therefore, the viscosity and hence consistency index K of suspension increases accordingly.
With the increase in volume fraction of particles, the enhancement of shear-thinning and a decrease in flow behavior index n of suspension is likely due to the formation and break-up of aggregates of particles in shear flow [19]. At low shear rates, collision of particles results in the formation of aggregates of particles. When aggregates are formed, the matrix fluid is entrapped within the aggregates resulting in higher viscosity of suspension. With the increase in shear rate, the effective concentration of particles is decreased due to break-up of aggregates and hence the viscosity decreases.

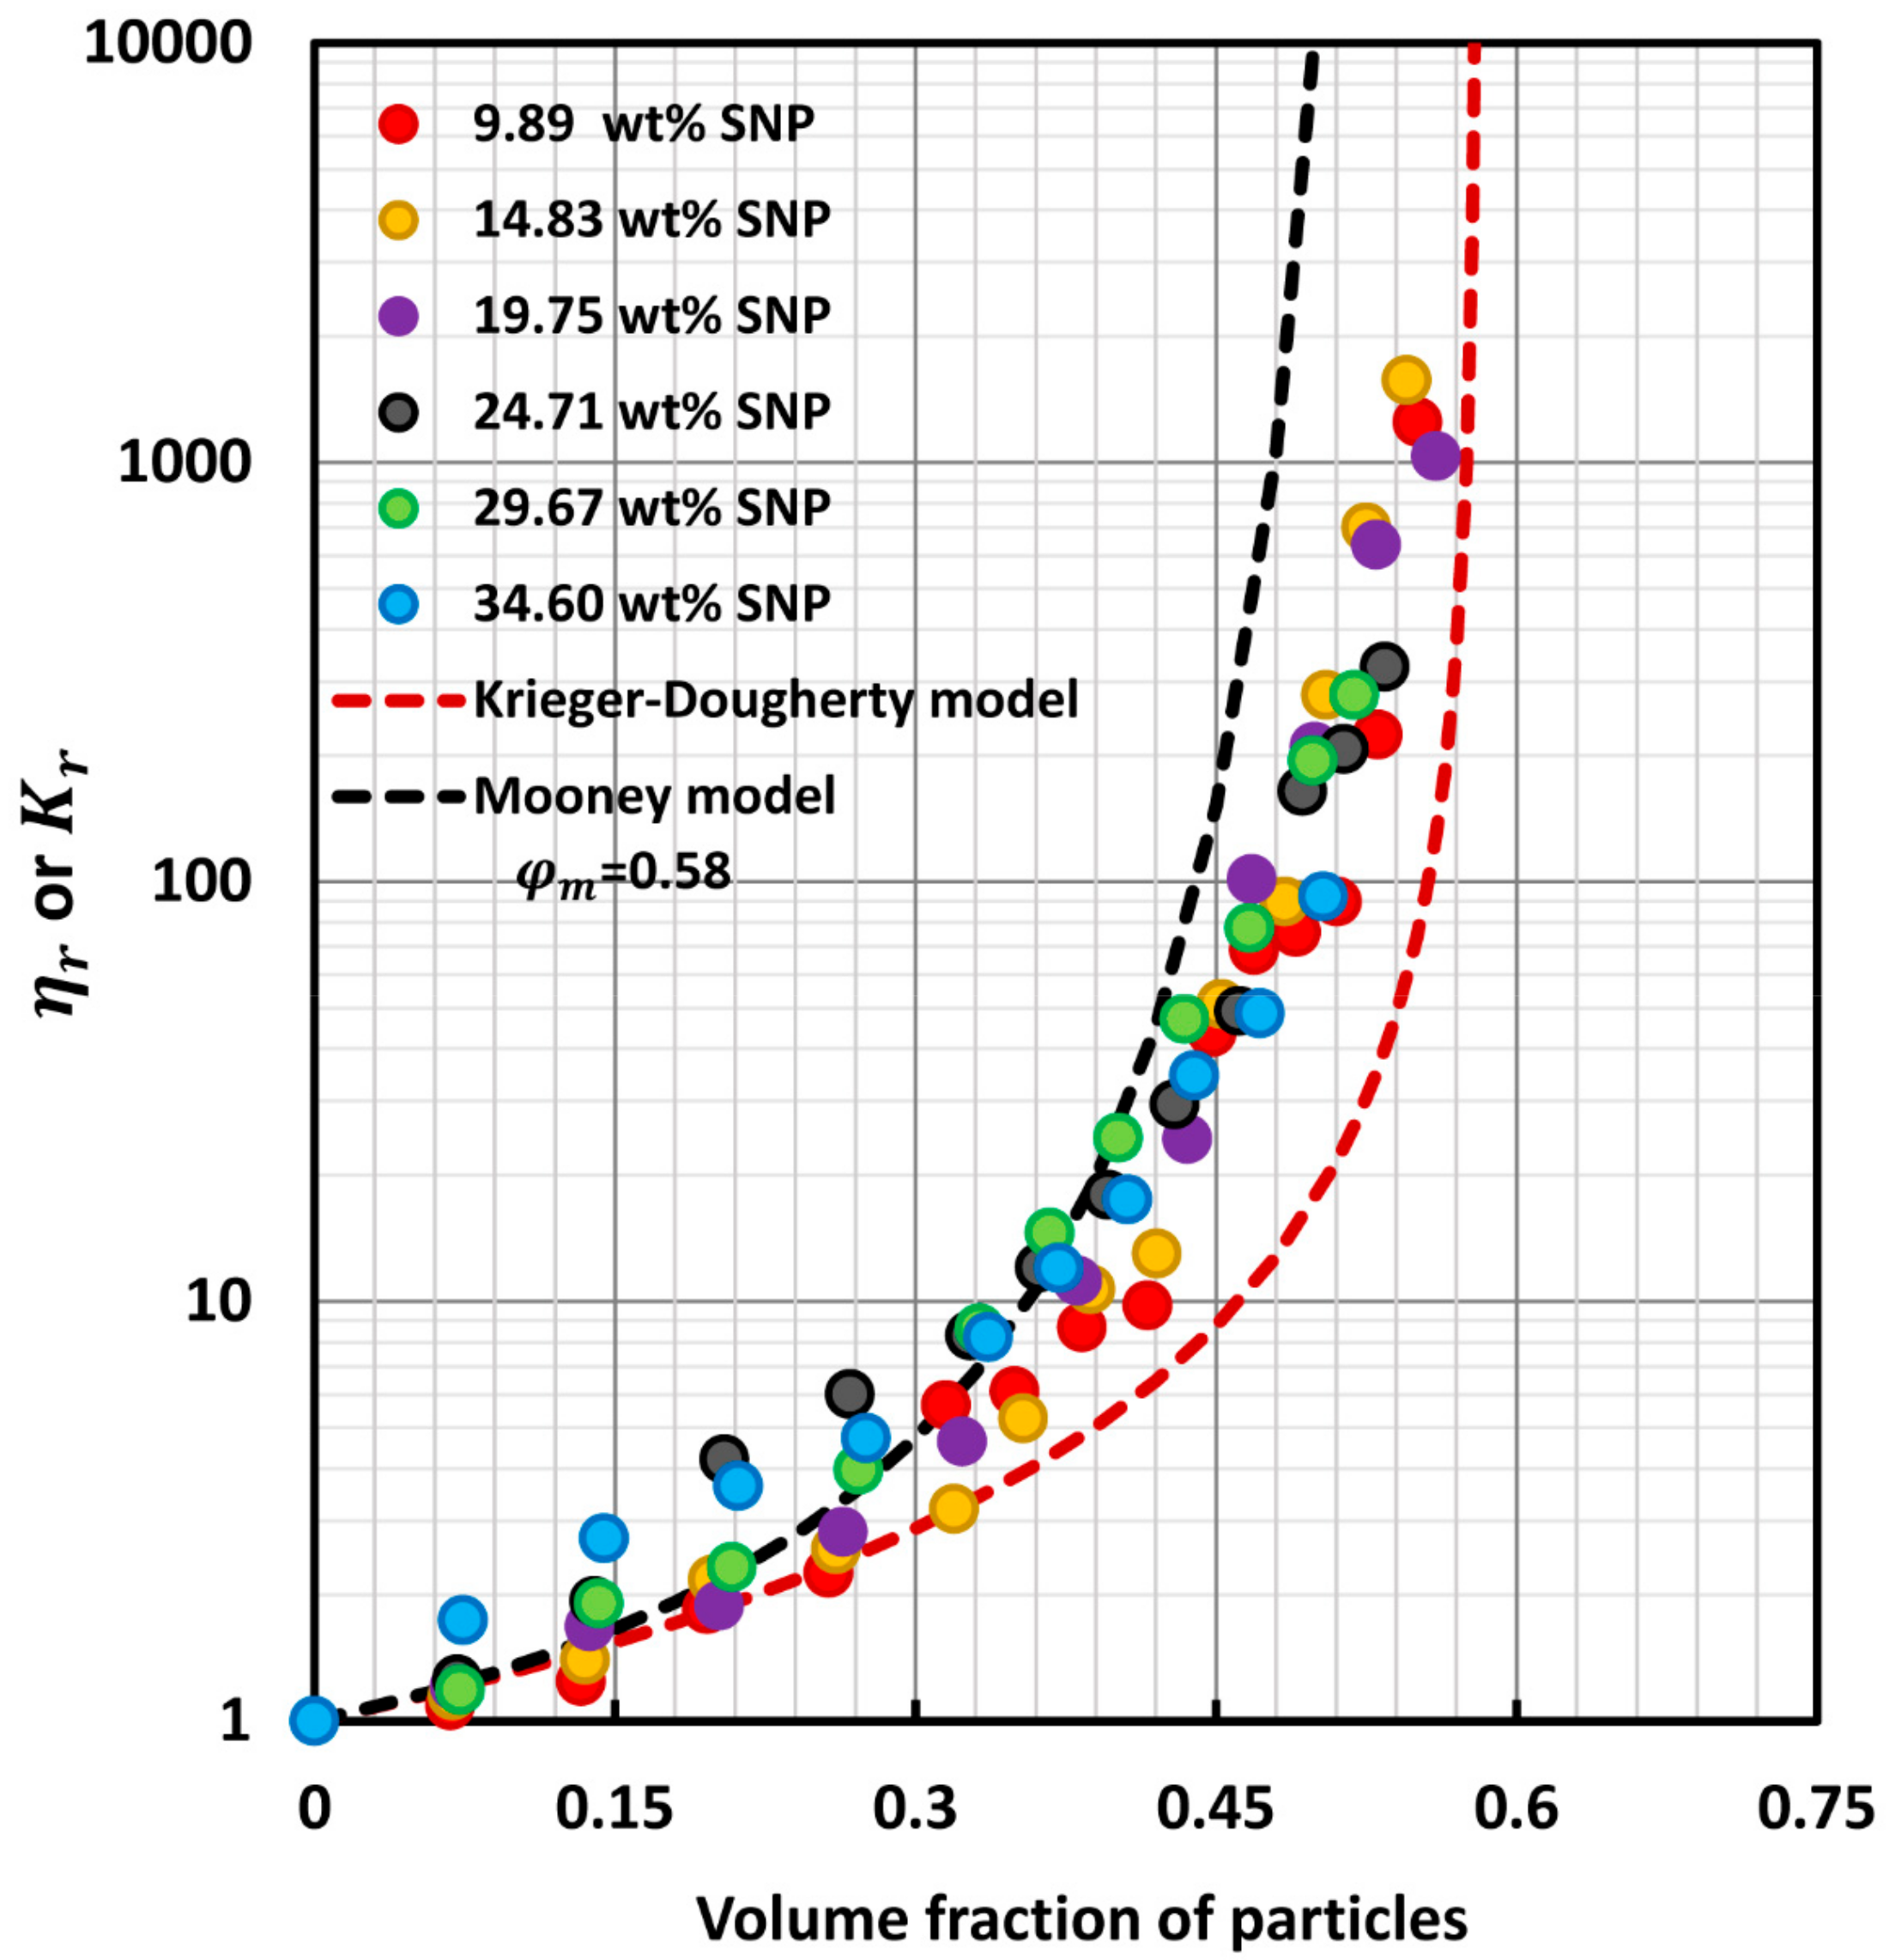
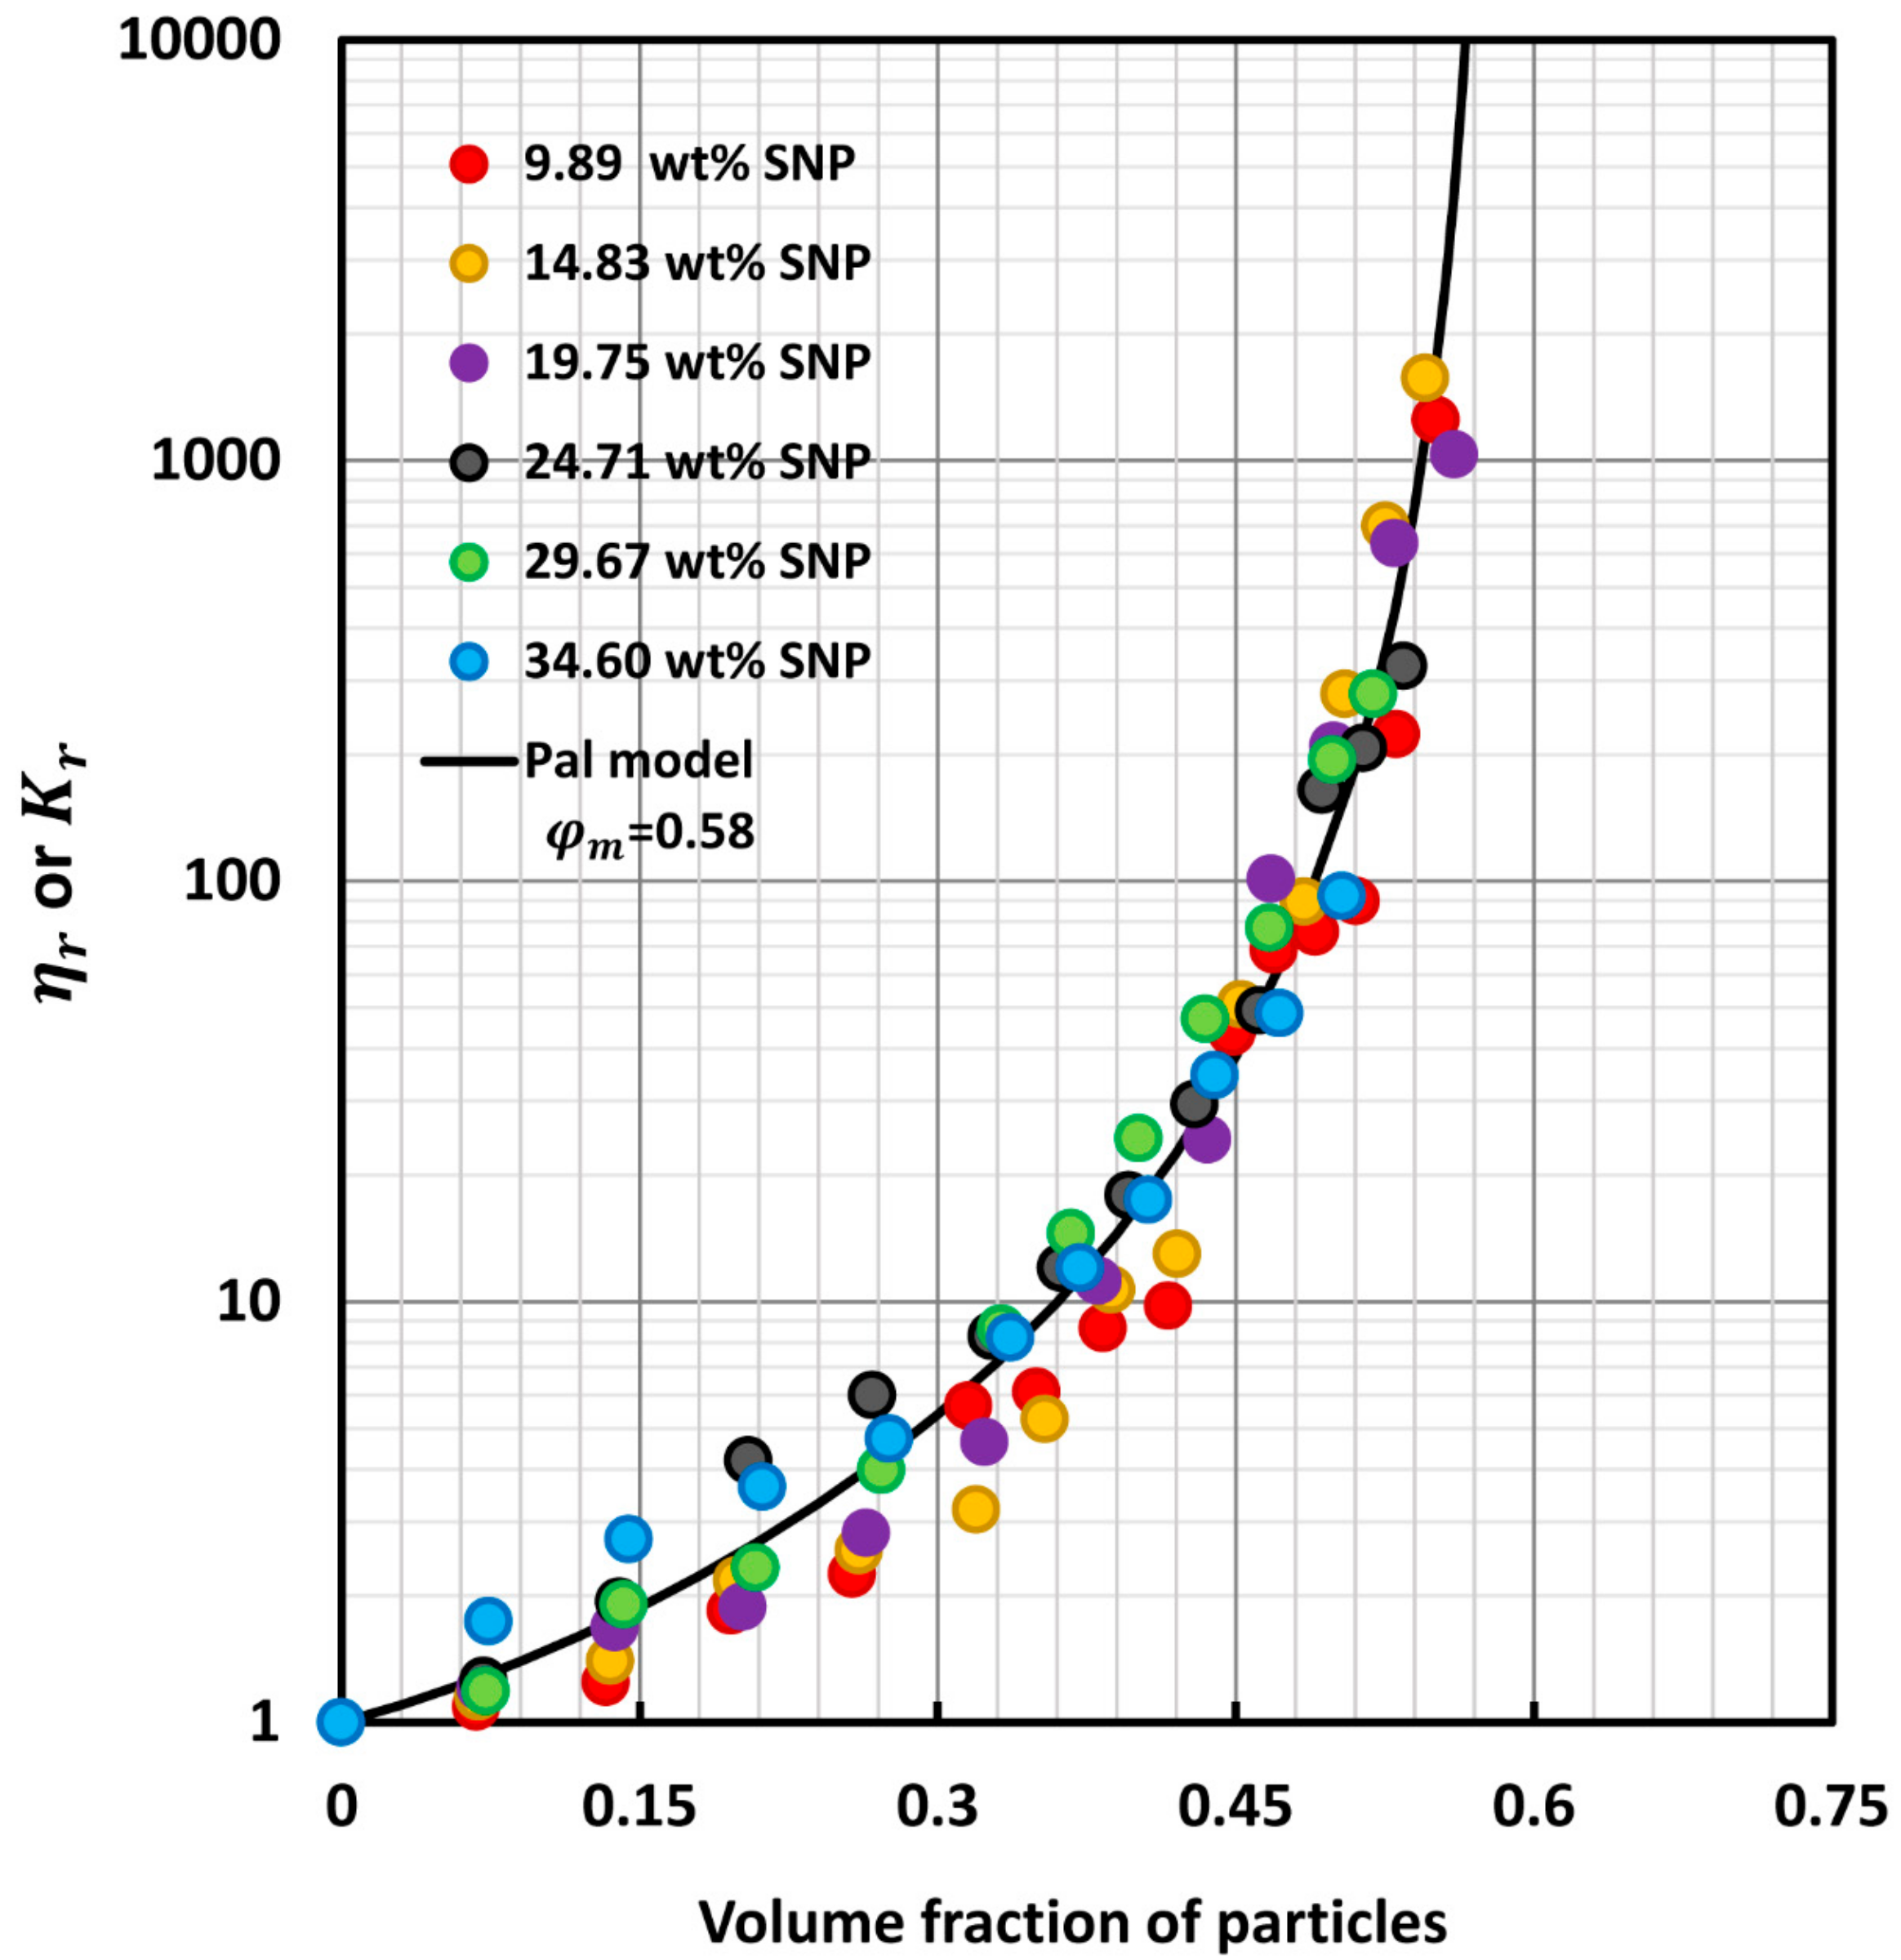
3.3. Comparison of Experimental Data with Model Predictions

For concentrated suspensions of solid particles, Mooney [11] and Krieger–Dougherty [12] models are used extensively in the literature to correlate the relative viscosity versus particle volume fraction data. The models are given as follows:
η r = η η m = e x p 2.5 φ 1 φ φ m
η r = η η m = 1 φ φ m 2.5 φ m
Equation (4) is the celebrated Mooney equation and Equation (5) is the celebrated Krieger–Dougherty equation. η r is the relative viscosity of suspension defined as a ratio of suspension viscosity η to matrix fluid viscosity η m , φ is the volume fraction of particles, and φ m is the maximum packing volume fraction of particles. φ m is often taken as 0.58 corresponding to glass transition volume fraction of hard spheres.
Figure 14 shows the plot of our experimental data for Newtonian and non-Newtonian suspensions of particles (SG hollow spheres) in SNP dispersions. For Newtonian suspensions, the relative viscosity η r is plotted as a function of volume fraction of particles φ . For non-Newtonian suspensions, the relative consistency index K r is plotted as a function of φ where K r is defined as the ratio of consistency index K to matrix fluid viscosity η m .
Interestingly, all the experimental data for both Newtonian and non-Newtonian suspensions of particles in SNP dispersions fall on the same curve. However, neither the Mooney equation (Equation (4)) nor the Krieger–Dougherty equation (Equation (5)) describes the data satisfactorily. The data generally fall in between the predictions of the Mooney and Krieger–Dougherty equations (above the Krieger–Dougherty equation and below the Mooney equation).
Pal [20] recently developed the following semi-empirical model for the relative viscosity of suspensions:
η r = 1 1 + 1 φ m φ m 1 φ m φ φ m 2 φ 2.5
This model was successfully applied to describe the viscosity of asphaltene suspensions in various solvents.
Figure 15 shows the comparison of the Pal model prediction with the experimental data for Newtonian and non-Newtonian suspensions of this study. For non-Newtonian emulsions, the relative consistency index K r is used instead of relative viscosity η r in the model. The model describes the experimental data reasonably well. The average percent error of model prediction is approximately 10 percent. The model tends to overpredict the relative viscosities.

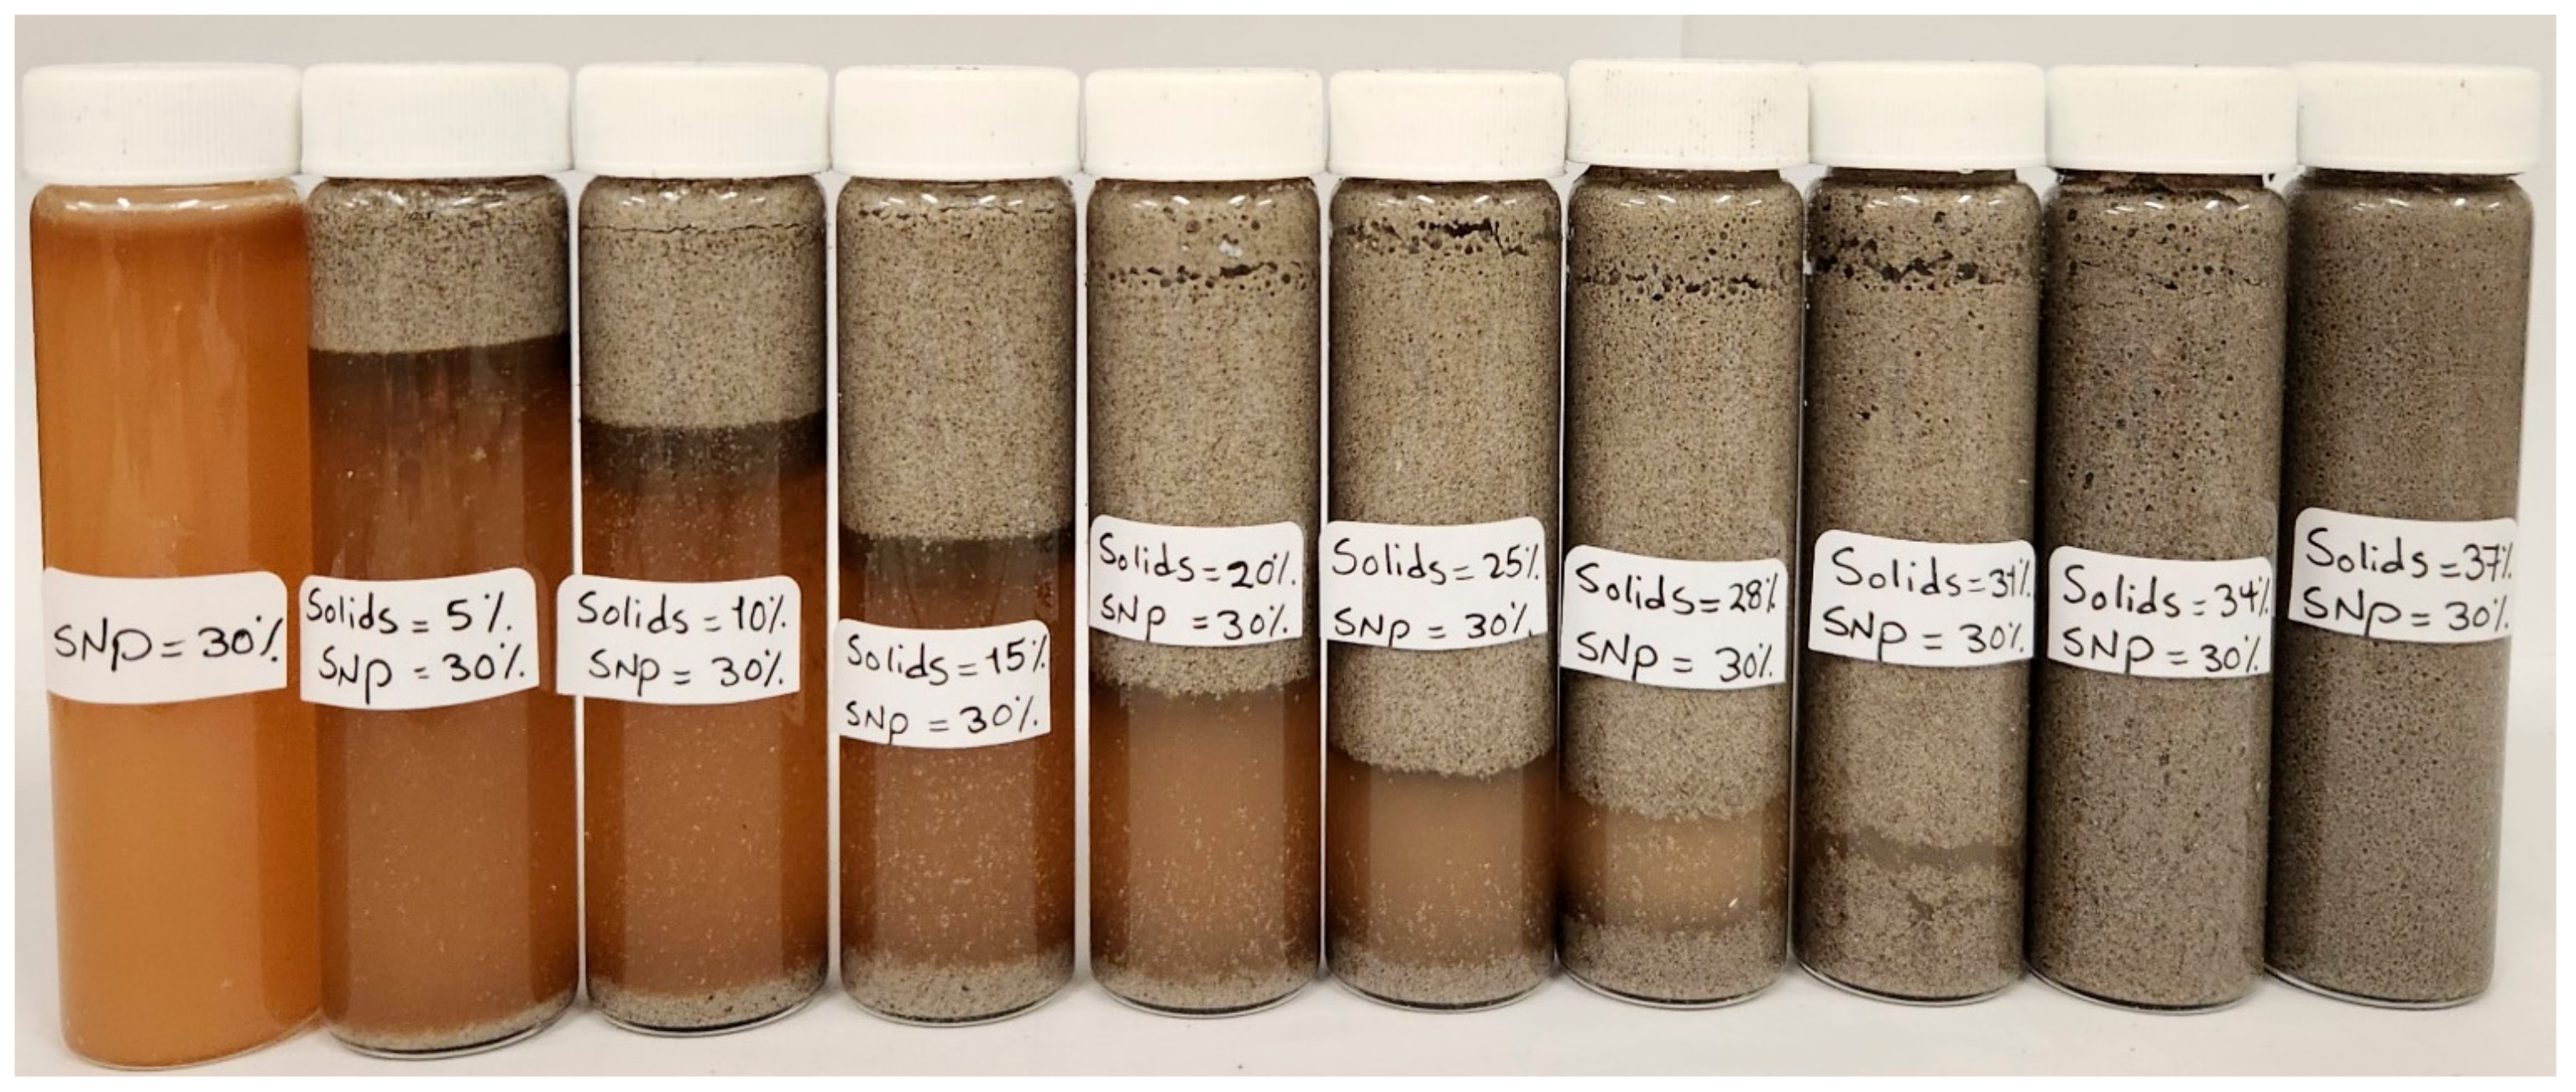
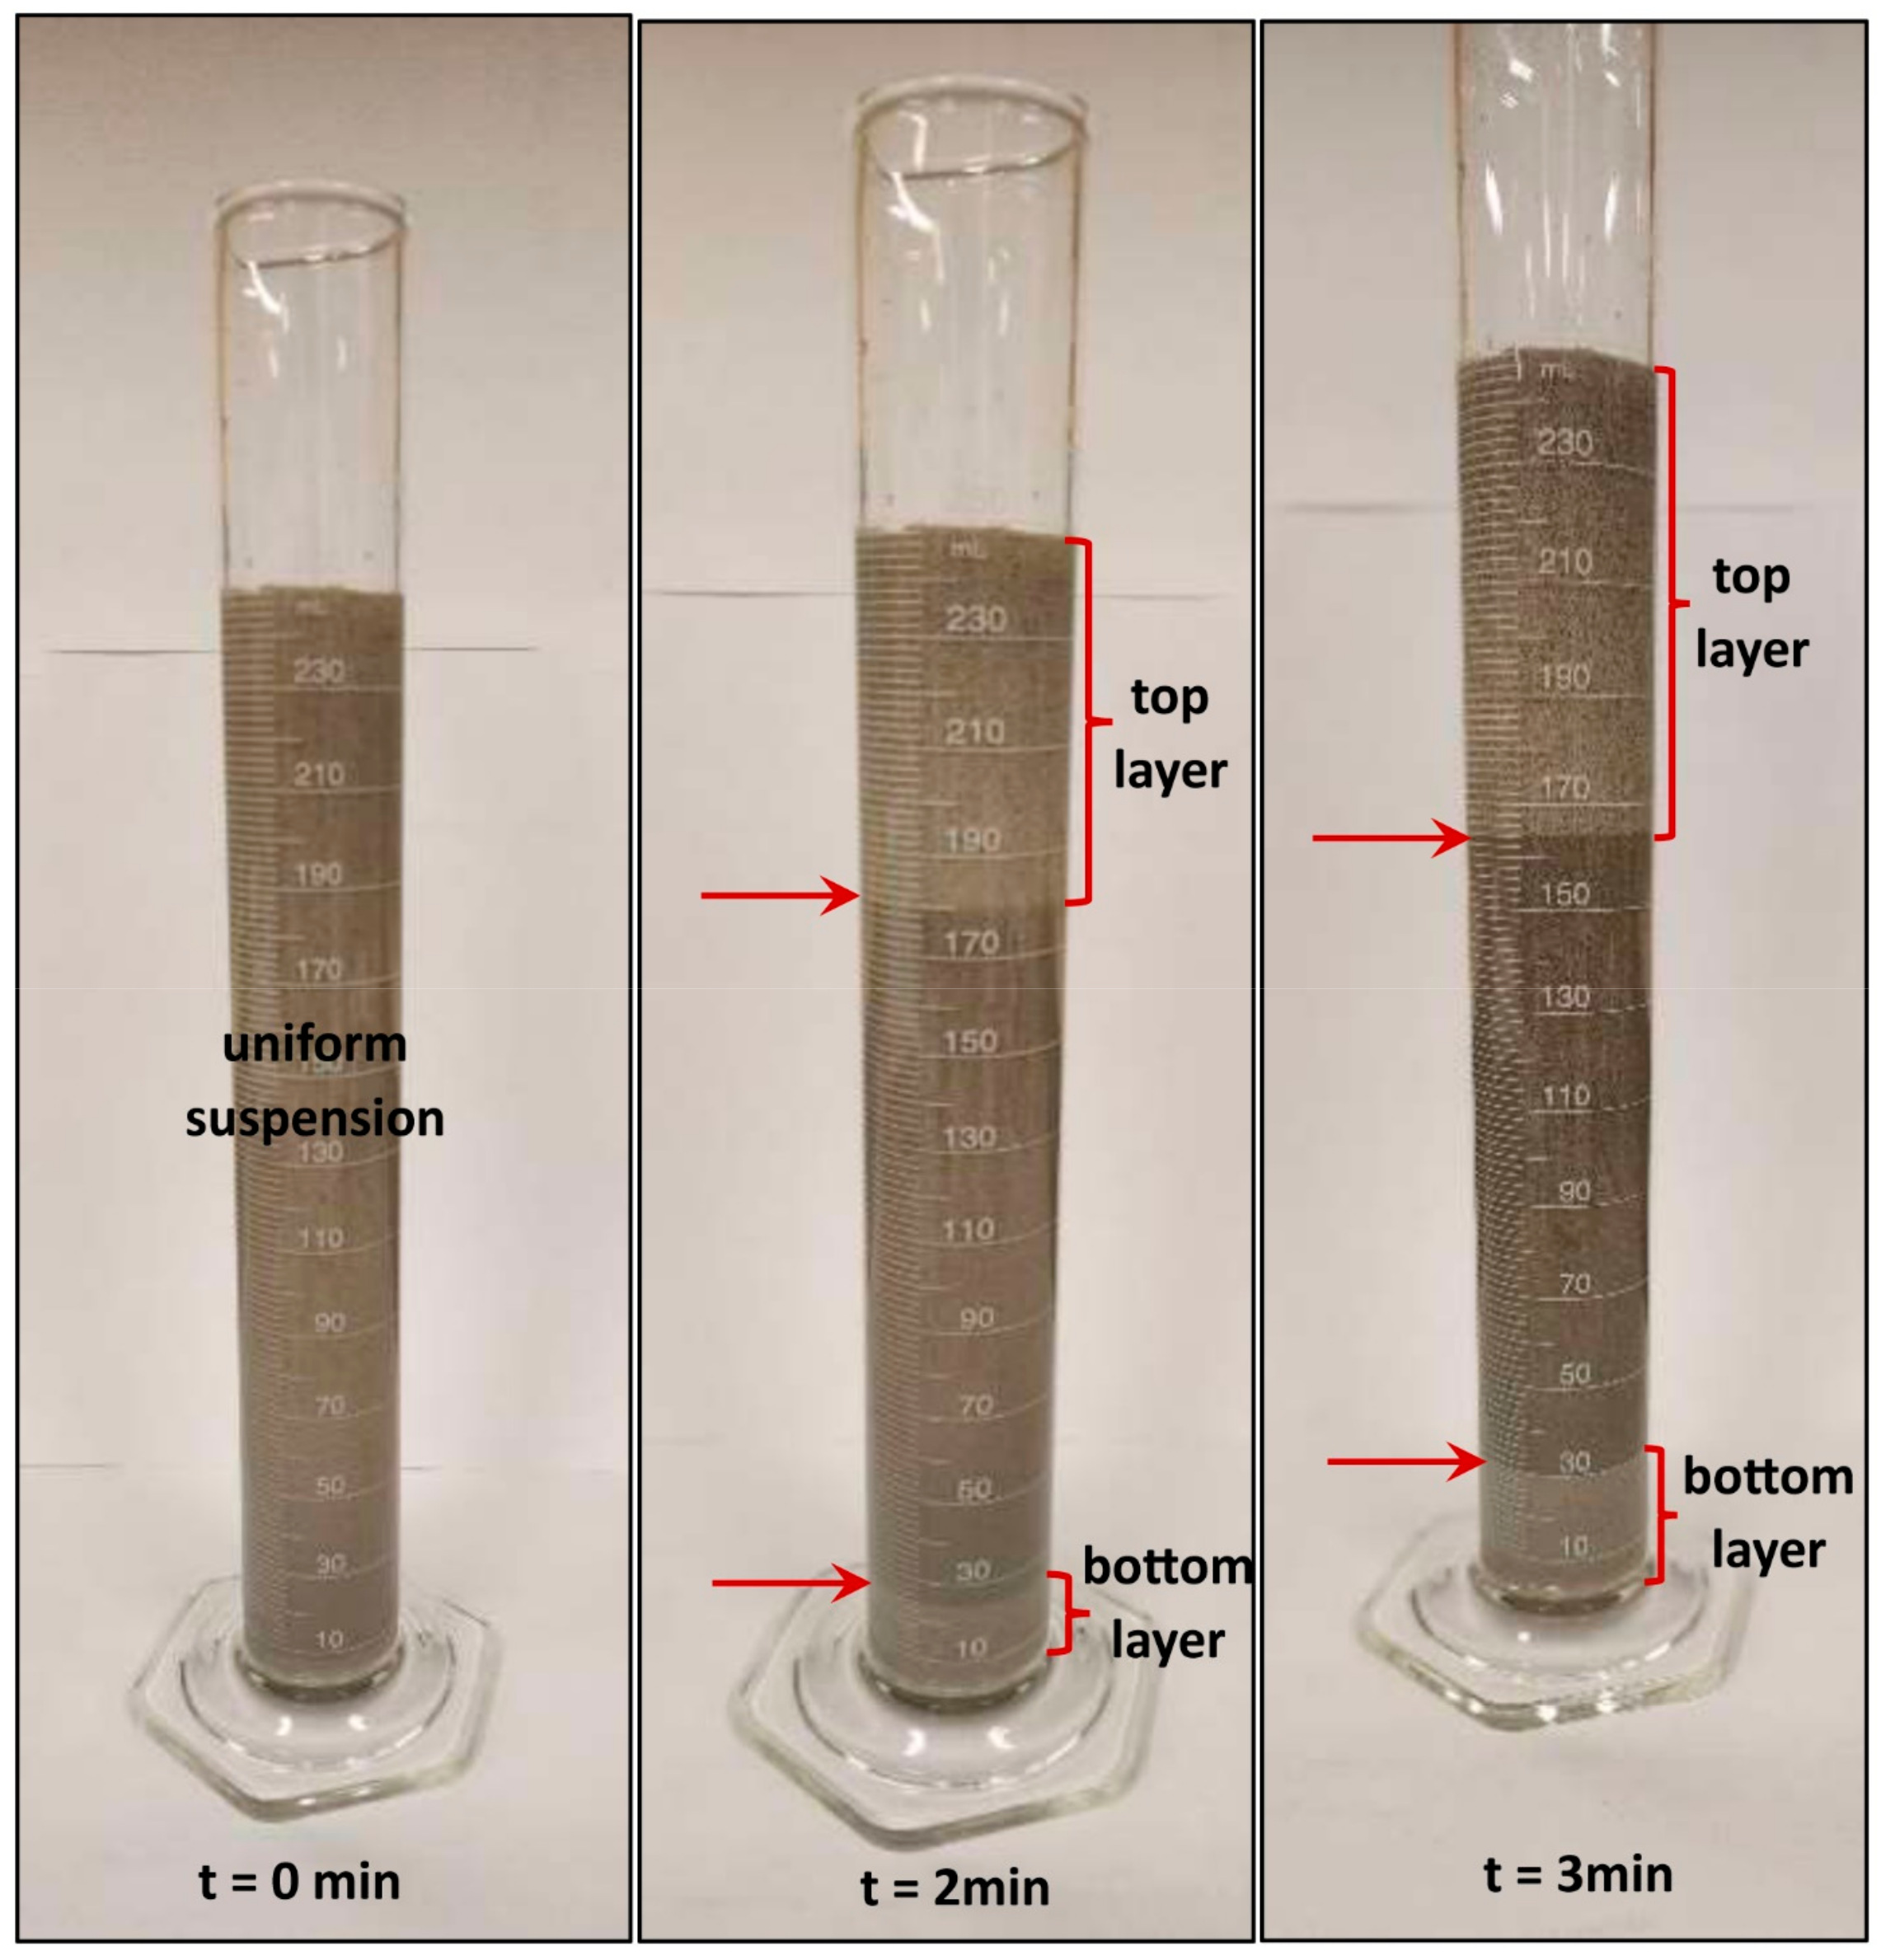
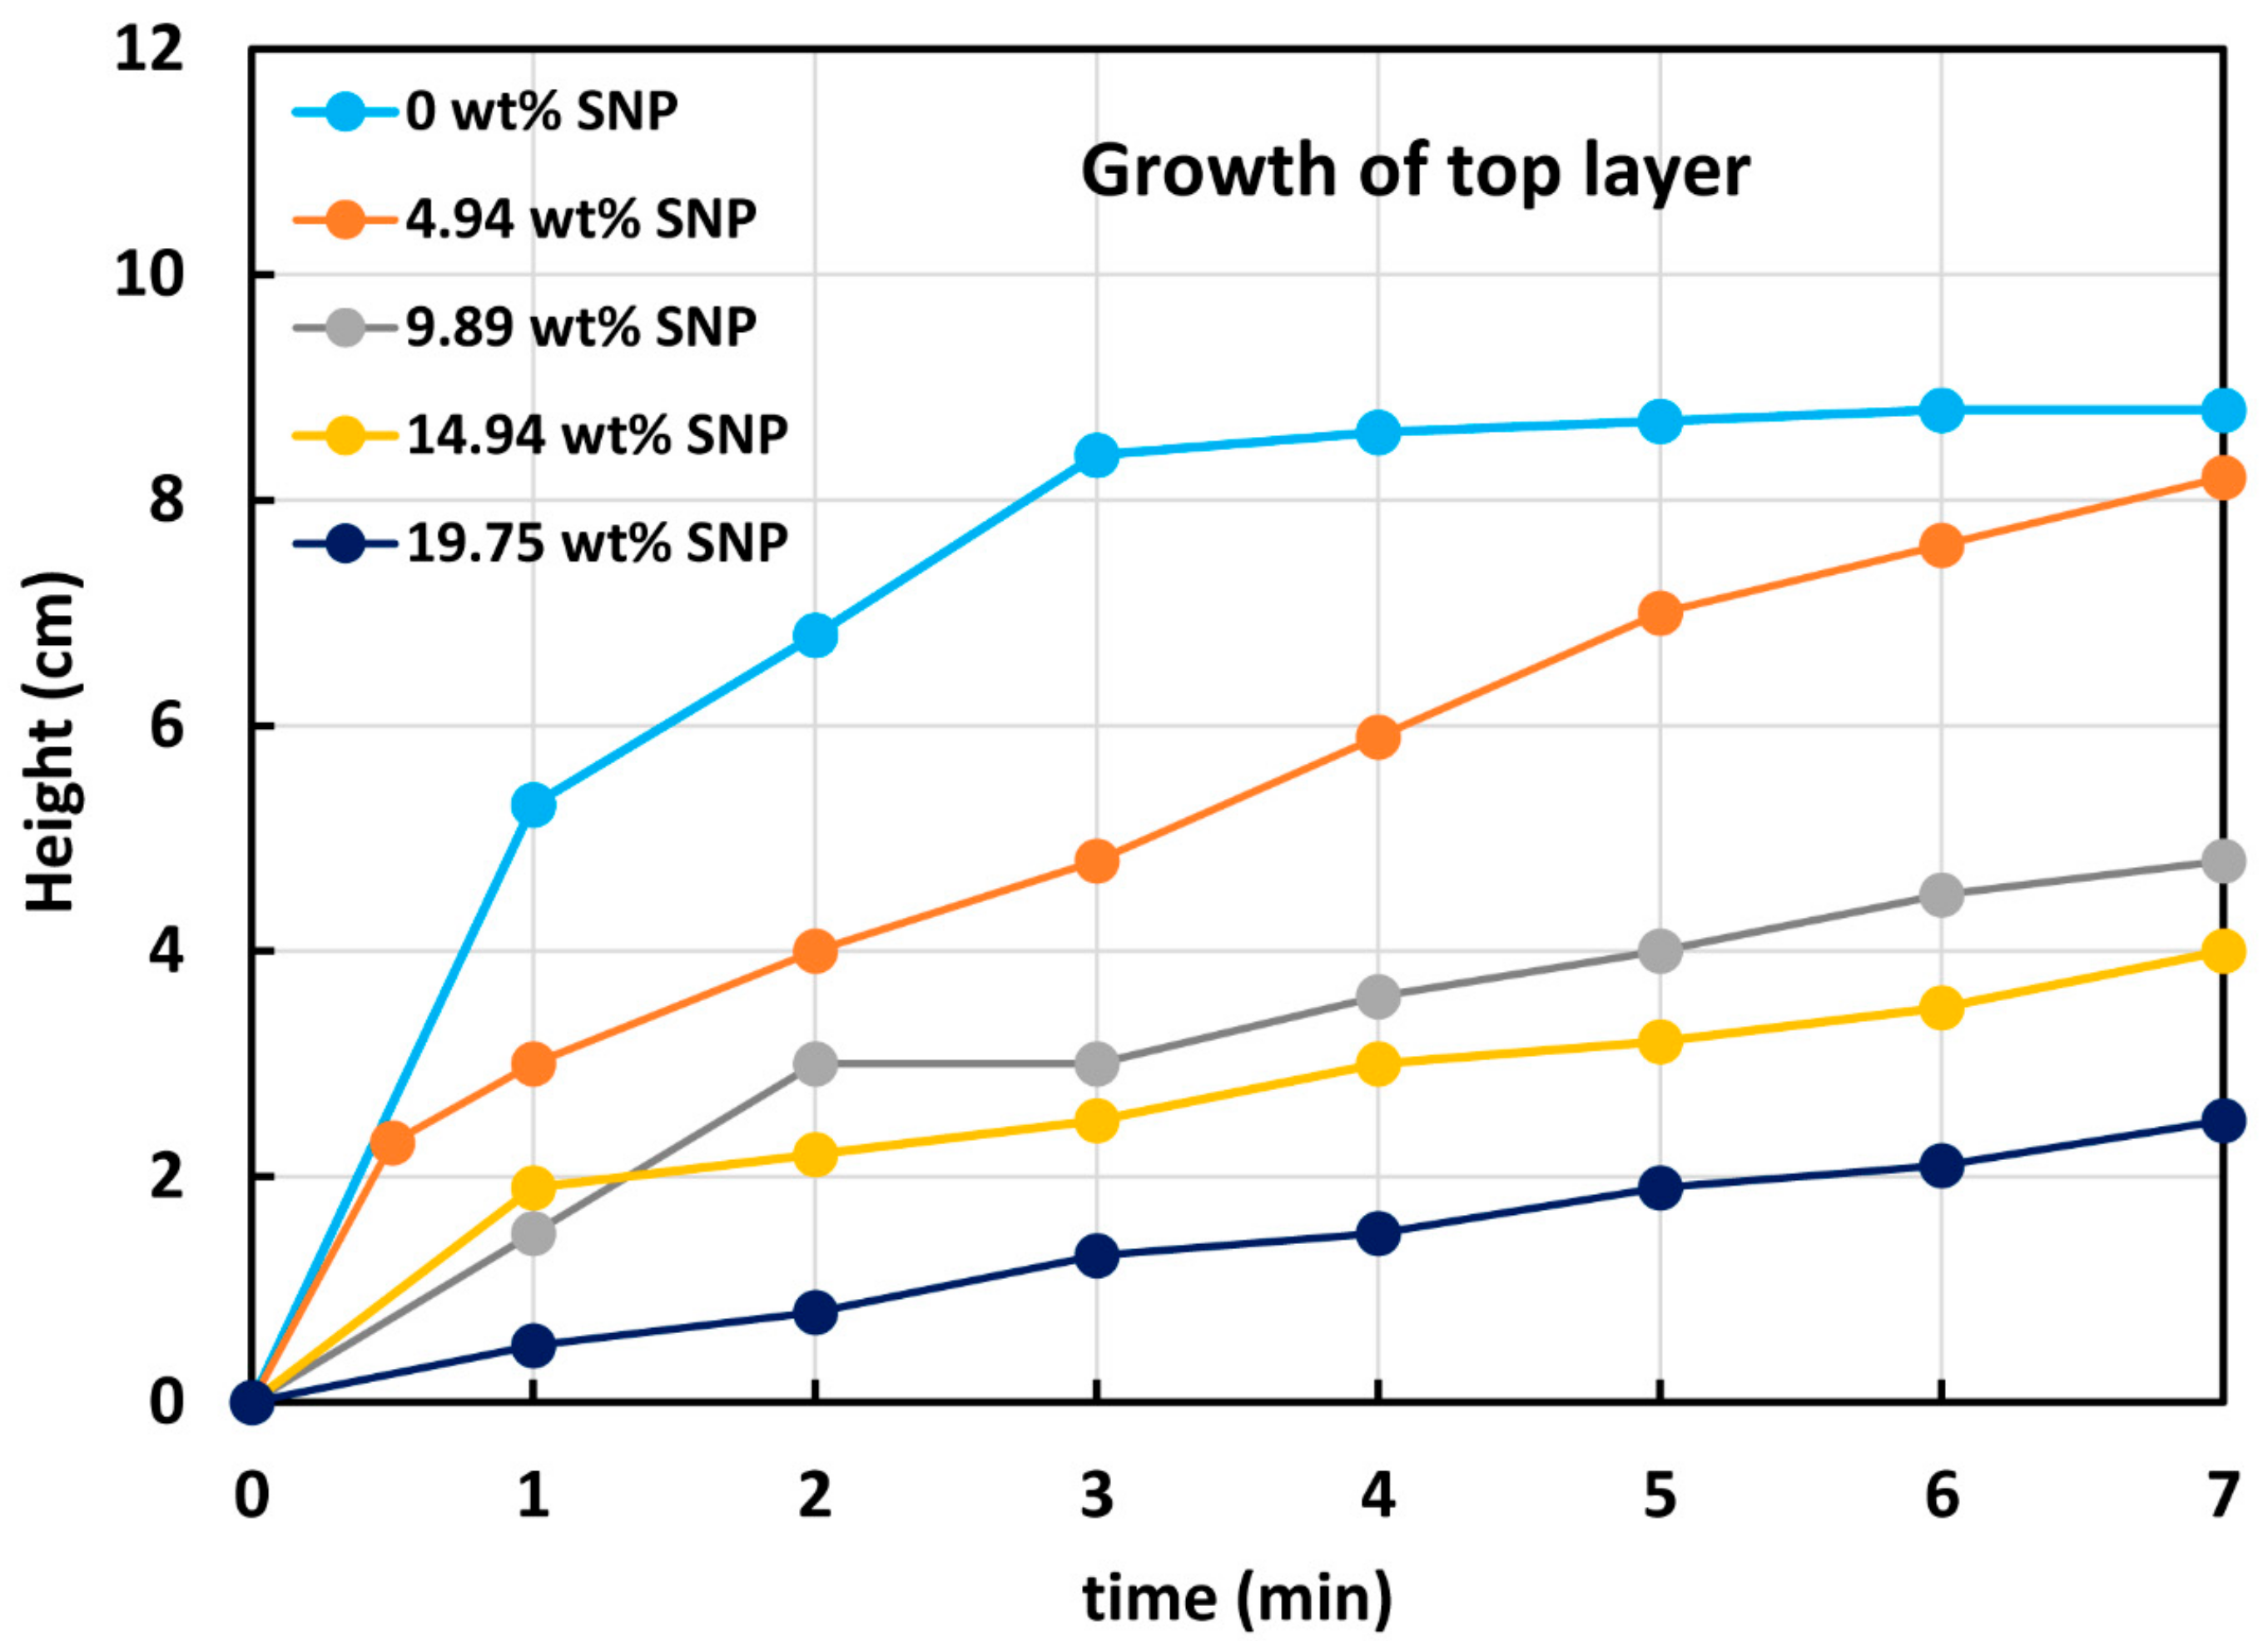
3.4. Stability of Suspensions

As the density of suspended particles (SG hollow spheres) of suspensions was different from that of the matrix phase, the suspensions were subject to creaming and sedimentation effects. The average density of the SG hollow spheres was 0.7486 g/L and the density of the matrix phase varied with the SNP content. The density of matrix at 0% SNP was 0.9988 g/L and at 35 wt% SNP, it was 1.139 g/L. As the particles were lighter than that of the matrix phase, the creaming effect (upward rise of particles) was expected.
Figure 16 shows the samples of suspensions left unstirred for more than two months. For the samples shown, the SNP concentration of the matrix phase is approximately 30 wt%. The concentration of particles (SG hollow spheres) varies from 0 wt% in the left most bottle to 37 wt% in the right most bottle. As expected, the particles rise to the top of the sample and form a layer of highly concentrated suspension at the top. With the increase in the particle concentration, the top layer of highly concentrated suspension grows. Interestingly, some particles also settle at the bottom of the bottles, indicating that some particles are heavier than that of the matrix phase. It is likely that not all the particles present in the suspension are hollow particles and some may be fully solid particles with high density.
Figure 17 shows the formation of the top layer of light particles and bottom layer of heavy particles with time. At t = 0, the suspension consisting of 25 wt% SG hollow particles in aqueous phase without any SNP is uniform. As time progresses, the top layer of light particles and a bottom layer of heavy particles appear and grow. The creaming and sedimentation effects are strongly affected by the addition of SNP to the matrix phase. The addition of SNP to the matrix phase increases the viscosity of the matrix phase and therefore the creaming/sedimentation of particles is reduced. This can be seen clearly in Figure 18 where the growth of the top creamed layer of particles is shown as a function of time. At 0 wt% SNP, the top layer grows rapidly with time. As the SNP concentration of the matrix phase of the suspension is increased, the growth of the top layer of light particles slows down considerably. The upward rise of light particles, that is, the creaming of particles, is reduced because the viscosity of the matrix phase is increased with the increase in SNP concentration. In accordance with the Stokes law (Equation (1)), the velocity of particles is inversely related to the viscosity of the matrix phase.

4. Conclusions

Based on the experimental work and data analysis of this study, the following conclusions can be reached:
  • Dispersions of SNP are Newtonian over the full concentration range of 9.89 to 34.60 wt% SNP investigated in this study.
  • The suspensions of particles (SG hollow spheres) in SNP dispersions are generally Newtonian at low particle concentrations.
  • The suspensions become non-Newtonian shear-thinning at high particle concentrations.
  • The suspensions become non-Newtonian at a lower particle concentration when the SNP concentration of the matrix phase is increased. For example, at a low SNP concentration of 9.89 wt%, the suspension becomes non-Newtonian at a particle volume fraction of about 0.45, whereas at a high SNP concentration of 34.6 wt%, the suspension becomes non-Newtonian at a much lower particle volume fraction of 0.074.
  • The rheological behavior of non-Newtonian suspensions of particles in SNP dispersions can be described adequately by a power-law model.
  • The consistency index increases whereas the flow behavior index decreases with the increase in particle concentration at any given SNP concentration.
  • The experimental viscosity and consistency index data for Newtonian and non-Newtonian suspensions are in agreement with the predictions of the Pal model [20] over the full range of particle concentration investigated.
  • The creaming/sedimentation effects in suspensions of particles is greatly reduced with the thickening of matrix liquid with starch nanoparticles.

Author Contributions

Conceptualization, R.P.; methodology, G.G. and R.P.; validation, G.G. and R.P.; formal analysis, R.P.; investigation, G.G. and R.P.; resources, R.P.; data curation, G.G. and R.P.; writing—original draft preparation, R.P.; writing—review and editing, R.P.; visualization, R.P.; supervision, R.P.; project administration, R.P.; funding acquisition, R.P. All authors have read and agreed to the published version of the manuscript.

Funding

This research was funded by Discovery Grant awarded to R.P. by Natural Sciences and Engineering Research Council of Canada.

Data Availability Statement

The data presented in this study are available on request from the corresponding author.

Conflicts of Interest

The authors declare no conflict of interest.

References

  1. Pal, R. Rheology of Particulate Dispersions and Composites; CRC Press: Boca Raton, FL, USA, 2007. [Google Scholar]
  2. Tadros, T.F. Suspension Concentrates: Preparation, Stability and Industrial Applications; De Gruyter: Berlin, Germany; Boston, MA, USA, 2017. [Google Scholar]
  3. Pal, R. Modeling of Sedimentation and creaming in suspensions and Pickering emulsions. Fluids 2019, 4, 186. [Google Scholar] [CrossRef] [Green Version]
  4. Zhu, Z.; Li, F. A simple laboratory experiment of the hindered settling process of high concentration sediment suspension. Water Supply 2019, 19, 1144–1151. [Google Scholar] [CrossRef]
  5. Pal, A.; Pal, R. Rheology of emulsions thickened by starch nanoparticles. Nanomaterials 2022, 12, 2391. [Google Scholar] [CrossRef] [PubMed]
  6. Marta, H.; Rizki, D.I.; Mardawati, E.; Djali, M.; Mohammad, M.; Chayana, Y. Starch nanoparticles: Preparation, properties and applications. Polymers 2023, 15, 1167. [Google Scholar] [CrossRef] [PubMed]
  7. Bloembergen, S.; Vanegdom, E.; Wildi, R.; Mclennan, I.J.; Lee, D.I.; Klass, C.P.; Van Leeuwen, J. Biolatex binders for paper and paperboard applications. J. Pulp Paper Sci. 2010, 36, 151–161. [Google Scholar]
  8. Campelo, P.H.; Sant’Ana, A.S.; Clerici, M.T.P.S. Starch nanoparticles: Production methods, structure, and properties for food applications. Curr. Opin. Food Sci. 2020, 33, 136–140. [Google Scholar] [CrossRef]
  9. Einstein, A. Eine neue Bestimmung der Molekuldimension. Ann. Physik 1906, 19, 289–306. [Google Scholar] [CrossRef] [Green Version]
  10. Einstein, A. Berichtigung zu meiner Arbeit: Eine neue Bestimmung der Molekuldimension. Ann. Physik 1911, 34, 591–592. [Google Scholar] [CrossRef] [Green Version]
  11. Mooney, M. The viscosity of a concentrated suspension of spherical particles. J. Colloid Sci. 1951, 6, 162–170. [Google Scholar] [CrossRef]
  12. Krieger, I.M.; Dougherty, T.J. Mechanism for non-Newtonian flow in suspensions of rigid particles. Trans. Soc. Rheol. 1959, 3, 137–152. [Google Scholar] [CrossRef]
  13. Jeffrey, D.J.; Acrivos, A. The rheological properties of suspensions of rigid particles. AIChE J. 1976, 22, 417–432. [Google Scholar] [CrossRef]
  14. Stickel, J.J.; Powell, R.L. Fluid mechanics and rheology of dense suspensions. Annu. Rev. Fluid Mech. 2005, 37, 127–149. [Google Scholar] [CrossRef]
  15. Denn, M.M.; Morris, J.F. Rheology of non-Brownian suspensions. Annu. Rev. Chem. Biomol. Eng. 2014, 5, 203–228. [Google Scholar] [CrossRef] [PubMed]
  16. Pal, R. Modeling the viscosity concentrated nanoemulsions and nanosuspensions. Fluids 2016, 1, 11. [Google Scholar] [CrossRef] [Green Version]
  17. Metzner, A.B. Rheology of Suspensions in Polymeric Liquids. J. Rheol. 1985, 29, 739–775. [Google Scholar] [CrossRef]
  18. Ogunlaja, S.; Pal, R.; Sarikhani, K. Effects of starch nanoparticles on phase inversion of Pickering emulsions. Can. J. Chem. Eng. 2018, 96, 1089–1097. [Google Scholar] [CrossRef]
  19. Graham, A.L.; Bird, R.B. Particle clusters in concentrated suspensions. 1. Experimental observations of particle clusters. Ind. Eng. Chem. Fundam. 1984, 23, 406–410. [Google Scholar] [CrossRef]
  20. Pal, R. A new model for the viscosity of asphaltene solutions. Can. J. Chem. Eng. 2015, 93, 747–755. [Google Scholar] [CrossRef]
Figure 1. Preparation of suspension of solid particles (SG hollow spheres) in SNP dispersion.
Colloids 07 00052 g001
Figure 2. Samples of SNP dispersions in the order of increasing SNP concentration from approximately 10 to 35 wt%.
Colloids 07 00052 g002
Figure 3. Size distribution of starch nanoparticles [18].
Colloids 07 00052 g003
Figure 4. Viscosity versus shear rate plots of SNP dispersions.
Colloids 07 00052 g004
Figure 5. Particle size distribution of SG hollow spheres.
Colloids 07 00052 g005
Figure 6. Typical photomicrographs of the particles (SG hollow spheres).
Colloids 07 00052 g006
Figure 7. Viscous flow behavior of suspensions at different volume fractions of solids ( φ )   at a fixed SNP concentration of 9.89 wt%.
Colloids 07 00052 g007
Figure 8. Viscous flow behavior of suspensions at different volume fractions of solids ( φ )   at a fixed SNP concentration of 14.83 wt%.
Colloids 07 00052 g008
Figure 9. Viscous flow behavior of suspensions at different volume fractions of solids ( φ )   at a fixed SNP concentration of 19.75 wt%.
Colloids 07 00052 g009
Figure 10. Viscous flow behavior of suspensions at different volume fractions of solids ( φ )   at a fixed SNP concentration of 24.71 wt%.
Colloids 07 00052 g010
Figure 11. Viscous flow behavior of suspensions at different volume fractions of solids ( φ )   at a fixed SNP concentration of 29.67 wt%.
Colloids 07 00052 g011
Figure 12. Viscous flow behavior of suspensions at different volume fractions of solids ( φ )   at a fixed SNP concentration of 34.6 wt%.
Colloids 07 00052 g012
Figure 13. Comparison of consistency index ( K ) and flow behavior index ( n ) of suspensions of solid particles in SNP dispersions with different concentrations of SNP.
Colloids 07 00052 g013
Figure 14. Comparison of experimental data for Newtonian and non-Newtonian suspensions of particles in SNP dispersions with the predictions of Mooney and Krieger–Dougherty models.
Colloids 07 00052 g014
Figure 15. Comparison of experimental data for Newtonian and non-Newtonian suspensions of particles in SNP dispersions with the predictions of Pal model (Equation (6)).
Colloids 07 00052 g015
Figure 16. Creaming/sedimentation in suspensions of particles (SG hollow spheres) in SNP dispersion when left unstirred for more than two months. The SNP concentration of the matrix phase is approximately 30 wt%. The particle concentration varies from 0 to 37 wt%.
Colloids 07 00052 g016
Figure 17. Separation of particles (SG hollow spheres) in a suspension (25 wt% particles, 0 wt% SNP) with time.
Colloids 07 00052 g017
Figure 18. Growth of top creamed layer of SG hollow spheres with time in a suspension (25 wt% particles) with different SNP concentrations of the matrix phase.
Colloids 07 00052 g018
Table 1. Compositions of suspensions investigated in this study.
SNP Concentration of Matrix Phase (wt%)Solids Concentration of Suspension (wt%)Solids Concentration of Suspension (vol%)
9.89Fourteen concentrations: 5, 10, 15, 20, 25, 28, 31, 34, 37, 39, 41, 43, 45, 47Fourteen concentrations: 6.78, 13.32, 19.62, 25.69, 31.55, 34.97, 38.32, 41.60, 44.82, 46.93, 49.01, 51.06, 53.08, 55.08
14.83Thirteen concentrations: 5, 10, 15, 20, 25, 28, 31, 34, 37, 40, 42, 44, 46Thirteen concentrations: 6.90, 13.53, 19.91, 26.04, 31.95, 35.39, 38.76, 42.05, 45.27, 48.43, 50.49, 52.53, 54.54
19.75Eleven concentrations: 5, 10, 15, 20, 25, 30, 35, 38, 41, 44, 47Eleven concentrations: 7.02, 13.75, 20.21, 26.40, 32.36, 38.08, 43.59, 46.79, 49.93, 53.00, 56.00
24.71Twelve concentrations: 5, 10, 15, 20, 25, 28, 31, 34, 37, 40, 42, 44Twelve concentrations: 7.15, 13.98, 20.46, 26.73, 32.73, 36.22, 39.62, 42.94, 46.18, 49.34, 51.41, 53.44
29.67Eleven concentrations: 5, 10, 15, 20, 25, 28, 31, 34, 37, 40, 42Eleven concentrations: 7.28, 14.22, 20.84, 27.16, 33.21, 36.71, 40.12, 43.45, 46.70, 49.86, 51.93
34.60Ten concentrations: 5, 10, 15, 20, 25, 28, 31, 34, 37, 40.01Ten concentrations: 7.41, 14.46, 21.17, 27.56, 33.65, 37.17, 40.60, 43.94, 47.19, 50.36
Table 2. Relevant dimensions of viscometers used in this study.
Viscometer Inner   Cylinder   Radius ,   R i Outer   Cylinder   Radius ,   R o Length of Inner CylinderGap Width
Fann 35A/SR-12 (low torsion spring constant)1.72 cm1.84 cm3.8 cm0.12 cm
Fann 35A (high torsion spring constant)1.72 cm1.84 cm3.8 cm0.12 cm
Haake Roto- visco RV 12 with MV I2.00 cm2.1 cm6.0 cm0.10 cm
Haake Roto- visco RV 12 with MV II1.84 cm2.1 cm6.0 cm0.26 cm
Disclaimer/Publisher’s Note: The statements, opinions and data contained in all publications are solely those of the individual author(s) and contributor(s) and not of MDPI and/or the editor(s). MDPI and/or the editor(s) disclaim responsibility for any injury to people or property resulting from any ideas, methods, instructions or products referred to in the content.

