Article

Effects of Various Types of Vacuum Cold Plasma Treatment on the Chemical and Functional Properties of Whey Protein Isolate with a Focus on Interfacial Properties

by
Elham Ommat Mohammadi
1,2,
Samira Yeganehzad
1,*,
Mohammad Ali Hesarinejad
1,
Mohsen Dabestani
1,
Emanuel Schneck
2 and
Reinhard Miller
2
1
Department of Food Processing, Research Institute of Food Science and Technology (RIFST), Km 12, Mashhad-Quchan Highway, Mashhad 91895, Iran
2
Institute of Soft Matter Physics, Technical University Darmstadt, 64287 Darmstadt, Germany
*
Author to whom correspondence should be addressed.
Colloids Interfaces 2023, 7(3), 54; https://doi.org/10.3390/colloids7030054
Submission received: 5 June 2023 / Revised: 24 July 2023 / Accepted: 26 July 2023 / Published: 4 August 2023

Abstract

:
Vacuum cold plasma (VCP), a novel non-thermal processing technology used to modify the physicochemical properties and functionalities of food materials, was applied to whey protein isolate (WPI). The treatment affects the protein chemistry and, as a result, leads to differences in the behavior in solution and at interfaces. To minimize the undesirable effects of high oxidation and to increase the effectiveness of reactive species, the VCP treatment was applied at low pressure using different types of gases (air, combination of argon and air, and sulfur hexafluoride (SF6)). The treatment led to a decrease in the sulfur content and an increase in the carbonyl content, evidenced by oxidation reactions and enhanced disulfide bond formation, as well as cross-linking of protein molecules. Fluorescence-based indicators suggest that the hydrophobicity of the proteins as well as their aggregation increase after VCP treatment with an argon–air gas mixture; however, it decreases after VCP treatments with air and SF6. The chemical modifications further lead to changes in the pH of aqueous WPI solutions, as well as the average size and ζ-potential of WPI aggregates. Moreover, the dynamic surface tension, surface dilational elasticity, and the thickness of the WPI adsorption layers at the air/water interface depend on the VCP type. SF6 plasma treatment leads to a significant decrease in pH and an increase in the ζ-potential, and consequently to a significant increase in the aggregate size. The dynamic surface tension as well as the adsorption rates increase after SF6VCP treatment, but decrease after air–VCP and argon–air–VCP treatments. The adsorbed WPI aggregates form strong viscoelastic interfacial layers, the thickness of which depends on the type of VCP treatment.

1. Introduction

For several years, the development of non-thermal technologies for protein modifications has attracted particular attention. High hydrostatic pressure [1], ultrasound [2], pulsed electric fields [3], ozone [4], irradiation [5], and treatment with cold plasma using air [6] are examples of these technologies. Apart from the antimicrobial effect of cold plasma, the modification can involve the chemical properties of proteins, which in turn may affect the functional and biological properties of food. Of particular relevance for food technology is the capability of proteins to create and/or maintain gel-like networks, films, foams, emulsions, and sols [7]. This ability depends on the proteins’ shape, size, folding configuration, and surface chemistry, since these characteristics determine how they interact with other food components [8].
Cold plasma (CP) is of increasing interest for food industries and biotechnology [9] because it enables the decontamination and sterilization of food ingredients [10] while minimizing the loss of food quality, which is typical of heat-based treatments. In fact, loss of nutrients, high energy consumption, changes in color and texture, and heat generation are examples of the disadvantages of conventional industrial technologies [11]. Lately, the special features of the CP technique, such as cost-effectiveness, ability to attain a moderate temperature in vacuum-free systems, flexibility in processing, and ability to change the physico-chemical properties of food compounds, have attracted the attention of food industries.
Plasma is a gas or a mixture of gases which is partially ionized via an electric field [9]. The resulting active species in plasma are UV photons, chemically reactive free radicals like O˙ and OH˙, and free atoms or molecules in metastable form [12]. Various types of plasma can be produced by applying different types of gases with diverse process parameters, such as frequency, time and power. The advantages of cold plasma for the modification of proteins are mainly attributed to the activity of reactive oxygen species (ROS) and reactive nitrogen species (RNS), depending on the type of gases used (oxygen, nitrogen, etc.) [13]. Examples of RNS and ROS are NO2, NO, OH, O3, O2, and O. These species are produced by exposing the gas or mixture of gases to an electric field, which in turn accelerates the charged particles. The production of heavy species (e.g., ions or particles) [14] leads to collisions, oxidizing the most sensitive amino acid residues of the protein and changing the secondary and tertiary structures of enzymes. All of these interactions can change the physico-chemical properties of proteins [15,16]. Most researchers assume that during the CP process, reactive species, in particular reactive oxygen and nitrogen species (ROS and RNS), are created and modify the protein chemistry [13] through chemical reactions like dimerization, oxidation, deamination, nitration, sulfoxidation, dehydrogenation, and hydroxylation [14]. These, in turn, can change the proteins’ physicochemical properties [15,16]. The effectiveness of CP applications for the intended modification of proteins is controlled by several factors, which are primarily associated with particular process parameters [17,18,19,20,21,22]. Thus, different types of CP treatments can cause different chemical modifications.
Vacuum cold plasma (VCP) offers a wide range of options for surface modifications for packaging materials that are suitable for numerous industrial purposes. Surface functionalization entails the addition of specific chemical (“functional”) groups to decrease the permeation of gases (oxygen and carbon dioxide) into packaging materials, to retain more flavor and aroma molecules, or to improve mechanical properties (glazing, adhesion, sealability, wettability, dye-up-take, etc.) [20,21,23]. However, there are also a few studies regarding the effect of CP on the properties of protein layers at the solution/air interface [20].
The requirements of only small amounts of gas, the large quantities of produced reactive species, and the absence of electrodes to avoid the risk of sample ignition are well-accepted advantages of the CP method [21].
Despite several studies that have investigated the influence of CP on the solution and interfacial properties of proteins [14,23,24], the impact of the type of plasma in terms of the utilized gases has not yet been systematically explored. Sulfur hexafluoride (SF6) is commonly used as an etching/etching-aid gas in the fabrication of sub-micrometer features of modern integrated circuits due to its high fluorine content and unique effect on microbial contamination, as well as on the surface properties of solid materials [25]. Argon, on the other hand, is a non-toxic, inert gas that constitutes 1% of the atmosphere. Because oxidation reactions in foods must be kept to a minimum, it can be helpful to increase the content of argon in atmospheric gas, thereby decreasing its oxygen content, and thus reducing possible oxidation reactions [26,27].
Moreover, the lower conductivity of argon avoids the undesirable effects of increased sample temperature during cold plasma treatment. Therefore, introducing other suitable gases to create a mixture that contributes to the desired features is a versatile approach to the optimization of the cold plasma methodology.
Applying the VCP technique to enhance the desired functional qualities in the food industry, such as foaming and emulsion stability, requires a better understanding of the impact of VCP on the proteins’ chemistry, and in turn, on the resulting physico-chemical properties of aqueous solutions, such as their aggregation behavior and their adsorption behavior at the water/air or water/oil interfaces.
Whey protein isolate (WPI), due to its high protein content, its unique functional characteristics, and its cost-effectiveness, is the most frequently used ingredient in food formulations [7]. The present study therefore evaluates the impact of various types of VCP on the bulk and surface properties of WPI. At first, several analytical methods were applied to assess the chemical modifications of the WPI proteins caused by the different VCP treatments. Subsequently, the resulting physico-chemical and surface properties of treated WPI were evaluated.

2. Materials and Methods

2.1. Materials

All experiments were performed with commercial-grade WPI powder (Ingredia Co., Arras, France) containing ≈91.9 wt% protein (59.4 wt% β-lactoglobulin, 27.6 wt% α-lactoalbumin, and 2.9 wt% bovine serum albumin), 1.9 wt% non-protein nitrogen, 2.3 wt% lactose, 1.8 wt% ash, 3.2 wt% water, and a negligible amount of fat. All other chemicals used in this study, such as urea of an extra pure grade, disodium hydrogen phosphate, and monosodium di-hydrogen phosphate (purity ˃ 99.55%), were of analytical quality and were purchased from Merck Chemical Co. (Darmstadt, Germany). Purified water was obtained from a Milli-Q Ultrapure water purification system (Millipore Corp., Bedford, MA, USA).

2.2. Cold Plasma Treatments

The WPI powder was treated by cold plasma using a vacuum system (Femto Science Co., Ltd., Hwaseong, Republic of Korea) with a 80 W supply power at a flow rate of 15 mL/s (7 mL/s for argon gas and 8 mL/s for air gas, based on density) and a frequency of 13.5 MHz. Plasmas based on air (AVCP), with a 1:1 combination of argon and air (ARAVCP), and on SF6 (SF6VCP) were generated in this way. The samples were placed in an open glass container with a narrow neck, which was continuously turned (3 rpm) during the plasma process in order for the plasma species to contact all the powder. The total duration of the VCP treatment was 15 min, which was subdivided into three cycles of 5 min each, with 2 min intervals as rest times to avoid any substantial temperature increases with potentially undesirable effects on the proteins. When the treatment time exceeds 20 min, a high level of oxidation can occur, which in turn can lead to unwanted changes in the structure of the protein. In some cases, even essential amino acids can be destroyed.

2.3. pH Measurement

Aqueous dispersions of WPI (2 wt%) were prepared by adding treated or untreated WPI powder to distilled water. The resulting solutions were homogenized with a magnetic stirrer for 30 min at 25 °C, and then kept in the fridge overnight. The pH of the solutions was measured with a pH-meter at 25 °C (Thermo scientific Orion 2-star, Benchtop, Thermo Fisher, Waltham, MA, USA). The chosen concentration of 2 wt% appeared to be the optimum for the present studies, because at a higher WPI content, the solution’s viscosity increases, and at lower concentrations, the generated foams become unstable.

2.4. Carbonyl Group Quantification

The number of carbonyl groups was measured according to Levine et al. 1990 [28] based on a Schiff base formation. For this purpose, 0.3 mL of the WPI dispersion was mixed with 0.4 mL of 2,4-dinitrophenyl hydrazine (DNPH, 10 mM in 2 M HCl) and incubated for 60 min. The resulting mixture was treated with 0.7 mL of trichloroacetic acid (10% final concentration) and centrifuged at 11,000× g for 3 min. To remove the excess dinitrophenyl hydrazine, the resulting precipitates were washed three times with an ethanol:acetate (1:1) mixture. Subsequently, the WPI was dissolved in a 0.5 mL guanidine hydrochloride solution (6 M). The supernatant (protein hydrazones) absorption was measured at 370 nm.

2.5. Determination of Free Sulfhydryl Groups

The free sulfhydryl groups (SH) were measured according to the colorimetric method using the water-soluble Ellman reagent (5′, 5-dithiobis (2-nitrobenzoic acid), DTNB) [29]. To develop the color, 0.5 mL of the WPI solution was added to 2.5 mL of 8 M urea in Tris-Glycine buffer (pH 8.0) and 0.02 mL of Ellman reagent (4 mg/mL DTNB in Tris-glycine buffer), and kept at room temperature for 15 min. The absorbance was then read at 412 nm. The concentration of the free sulfhydryl groups (µM SH/g) was determined via the equation SH [μM⁄g] = (73.53 × A412 × D)/C, where A412 is the absorbance at 412 nm, C is the concentration of the WPI solution (mg/mL), D is the dilution factor, and 73.53 is a factor resulting from 106/(1.36 × 104). The term 1.36 × 10⁴ is the molar absorption coefficient of the protein [30].

2.6. Fluorescence Spectroscopy

Fluorescence measurements were performed using a spectrofluorometer (STB-25R-Faratel). For the “intrinsic fluorescence” measurement of tryptophan, an excitation wavelength of 295 nm was used. The fluorescence intensity, as a function of the emission wavelength between 285 and 450 nm, was measured with a 0.05 wt% protein dispersion. Due to energy-transfer and quenching phenomena, the quantum yield of tryptophan is much higher when it is exposed to a polar aqueous environment than when it is buried inside the protein [31]. As a consequence, a high intrinsic fluorescence correlates with the surface exposure of hydrophobic amino acids, such as tryptophan, which is, therefore, a measure of the protein’s hydrophobicity.
“Extrinsic fluorescence” measurements were taken according to the modified method proposed by Kato and Nakai [32]. This measurement uses an 8-anilino-1-naphthalenesulfonate (ANS) probe that exhibits fluorescence and preferentially binds to the solvent-accessible hydrophobic parts of the proteins, where it exhibits much higher quantum yield than in aqueous solution [33]. The fluorescence intensity correlates, therefore, to the surface hydrophobicity of the protein. A 2 wt% protein stock solution was prepared in phosphate buffer solution (pH 7.2, 0.01 M), and then further diluted to 0.05 wt%, 0.1 wt%, 0.15 wt%, and 0.2 wt%, respectively. For the fluorescence measurements, 80 μL of an ANS solution (8 mM) was added to 1.6 mL of each of the dilutions, mixed for 15 s, and then incubated for 15 min in a dark environment. As controls, ANS- free samples were used, while for a blank test we used a buffer–ANS mixture sample. The excitation and emission wavelengths were 390 nm and 490 nm, respectively. The slope of the sample’s net fluorescence emission as a function of protein concentration served as an empirical “hydrophobicity” indicator.

2.7. Determination of Aggregate Size and ζ-Potential

The hydrodynamic radius (RH) and polydispersity index (PDI) of WPI were determined at a concentration of 0.01 wt% via dynamic light scattering (DLS) using a zetasizer (Nano-ZS, Malvern Instruments, West Lafayette, UK). The light scattering angle was adjusted to 173°, and the temperature set to 25 °C. As refractive indices for the protein and the dispersion medium, we used 1.456 and 1.33, respectively [34]. PDI and RH were calculated by a cumulative analysis of the autocorrelation function, while the particles were assumed to be spherical [35]. The size distributions of the aggregated particles were determined on the basis of scattered intensity.
The ζ-potential was determined by light scattering at 25 °C in an alternating electrical field using disposable capillary cells. The protein concentration was 0.01 wt% and the ζ-potential was calculated from the Smoluchowski equation [36]. The uncertainty of the measurement was ±5 mV.

2.8. Infrared Spectrometry by FT-IR

The IR transmission of the WPI samples was recorded in the range between 400 and 4000 cm−1 (mid-IR) using the KBr-pellet method [37,38]. By mixing 5 mg of WPI powder with 295 mg of dry potassium bromide (3 wt%), a respective dilution of the powder samples was made. In a pellet press, a pressure of 100 kg/cm2 was applied for roughly two minutes to create KBr pellets (Perkin-Elmer, Beaconsfield, Bucks., UK). The IR spectra of these pellets were recorded with a Nicolet Avatar 360 FTIR E.S.P. spectrometer (Thermo Scientific, Waltham, MA, USA) using the software OMNIC. The spectra were captured with a resolution of 2 cm−1 at room temperature.

2.9. Dynamic Surface Tension and Surface Interfacial Visco-Elasticity

An automated pendant drop analysis tensiometer (PAT, Sinterface Technologies, Berlin) was applied to record the dynamic surface tension γ(t) of the protein solutions [39]. Measurements were performed with pendant drops (15 μL) of WPI solutions of various concentrations formed in a cuvette at constant temperature (23 ± 1 °C). Each drop was allowed to stand for 10,800 s, which was sufficient to reach the adsorption equilibrium at the air/water interface, i.e., to determine the equilibrium surface tension γeq.
To measure the surface dilational visco-elasticity, sinusoidal interfacial compressions and expansions were performed by decreasing and increasing the drop volume, and hence, the drop surface area A, with a 7% strain amplitude (ΔA/A) and various frequencies (f), 0.005, 0.01, 0.02, 0.04, 0.08, 0.1, 0.14, and 0.20 Hz. The resulting γ (t) curves were used to determine the dilational visco-elasticity modulus (real Er and imaginary part Ev) via a Fourier analysis, provided by the PAT1 software. Preliminary work showed that area oscillations with a 7% strain amplitude were within the linear visco-elastic regime for all samples and frequencies [40].

2.10. Ellipsometry Measurements

The equivalent thickness δ of the absorbed WPI layer at the air/water interface in terms of the protein volume per area, δ = Γvp, was measured by an Optrel Multiskop (Berlin, Germany) ellipsometer at room temperature. Here, Γ is the amount of adsorbed proteins per unit area and vp is the volume per protein molecule. In this measurement, the angle of the incident light was set at 58°, and the obtained ellipsometry parameters Δ and Ψ were used to calculate the surface layer’s thickness using a layer model with refractive indices of 1.33, 1.58, and 1.0 for the phosphate buffer solution as sub-phase, WPI solution, and air phase, respectively [41,42]. The measurements were taken after 60 s and 24 h after gently pouring the 0.1 wt% WPI solution into a round glass dish with dimension of 77 mm diameter and 1.1 mm height.

2.11. Static Water Contact Angle of WPI Tablets

WPI powder tablets were pressed at a pressure of 200 bar. The tablet was placed in a contact angle measurement system (Adecco instrument with 20× zoom microscope), a 4 µL drop of water was deposited on it, and the contact angle was determined from the profile of the sessile drop [43].

2.12. Statistical Analysis

The data were analyzed via one-way ANOVA statistical software at a significance level of p < 0.05 using the program MINITAB (version 2.10, Michigan State University, East Lansing, MI, USA). The graphs were prepared with Microsoft Excel.

3. Results

At first, we present the results of the chemical modification of WPI by VCP. The utilized methods included the determination of the number of carbonyl and free sulfhydryl groups, the estimation of protein hydrophobicity via measurements of the intrinsic and extrinsic fluorescence, and vibrational spectroscopy. Subsequently, the results regarding aggregation, adsorption at the air/water interface, and the visco-elastic properties of the formed adsorption layers are discussed, which were obtained with DLS, zeta-potential measurements, surface ellipsometry, surface tensiometry, and dilational rheology.

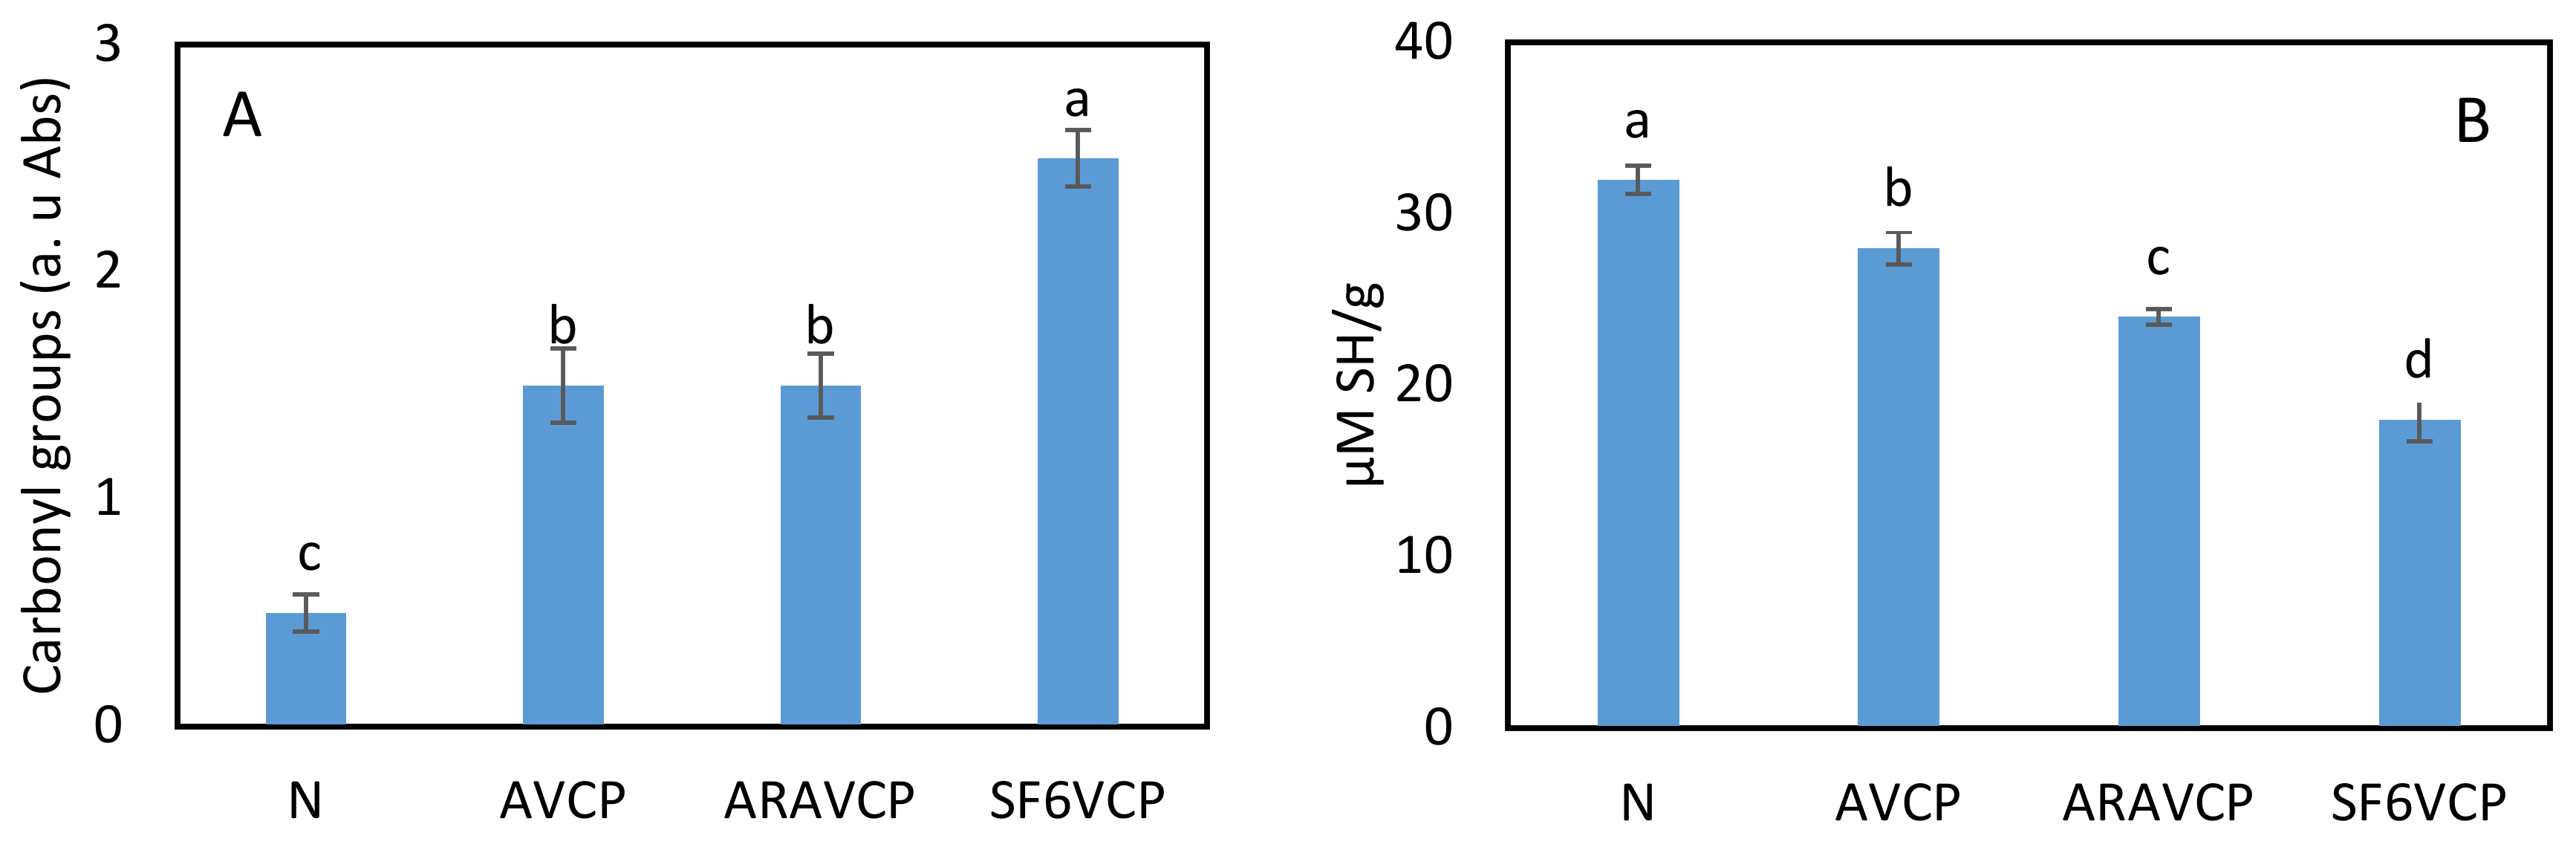
3.1. Effect of VCP on the Numbers of Carbonyl and Sulfhydryl Groups

The numbers of carbonyl and sulfhydryl groups in the protein molecules are the most general indicators and by far the most commonly used markers for protein oxidation [44]. Carbonyl and disulfide bonds generated by oxidation of amino acids lead to the denaturation and aggregation of proteins, resulting in changes to their secondary and tertiary structures [45]. Figure 1A shows the number of carbonyl groups for all studied WPI samples. It can be seen that the VCP treatment had a significant effect on the carbonyl amount (p < 0.05), which generally increased. Moreover, SF6VCP-treated WPI contained significantly more carbonyl groups (2.5 a.u) than the AVCP- or ARAVCP-treated samples, which exhibited similar amounts of 1.4 a.u and 1.5 a.u., respectively.
Earlier studies have demonstrated that the formation of carbonyl groups could be related to the breakage of peptide bonds and changes in several amino acid side chains, mainly with NH- or NH2 groups [13]. It has therefore been concluded that the dissociation of C-O and hydrogen removal causes a series of C-O bond cleavage reactions [46]. Moreover, Cui et al. [47] reported that the formation of carbonyl groups in proteins is a temperature-dependent process. Thus, both reactive species produced during protein oxidation by plasma and the simultaneous temperature rise likely contributes to the formation of carbonyl groups. A similar observation was reported by Stadman et al. [48], who claimed that an increase in the number of carbonyl groups reflects the level of oxidation in proteins. In our study, the temperature was raised up to only 40 °C after a VCP treatment of 15 min.
Another significant change caused by the VCP treatments was a decrease in the amount of free sulfhydryl (-SH) groups [44]. Figure 1B compares the amount of free sulfhydryl groups between VCP-treated samples and non-treated WPI (N) as the control. The amount of SH decreased due to the application of VCP. The smallest amount (19.6 μM/g) remained after treatment with SF6VCP. The reduction in SH groups (thiol) was consistent with the above observations concerning the carbonyl groups. The side chains of aromatic and sulfur-containing amino acids are particularly susceptible to oxidation. The thiol groups in the protein may quickly scavenge more radical groups, such as hydroperoxyl and superoxide radicals [49]. Cysteine and methionine, as two hydrophobic amino acids bearing sulfur, are frequently found in the interior of the hydrophobic protein core [50] and are very sensitive to oxidation [51,52].
In conclusion, according to the results of this study and previous observations [51,52], it can be argued that a VCP treatment may cause the elimination of -SH groups from the cysteine and methionine amino acids found in the protein structure, depending on the type of gas used.

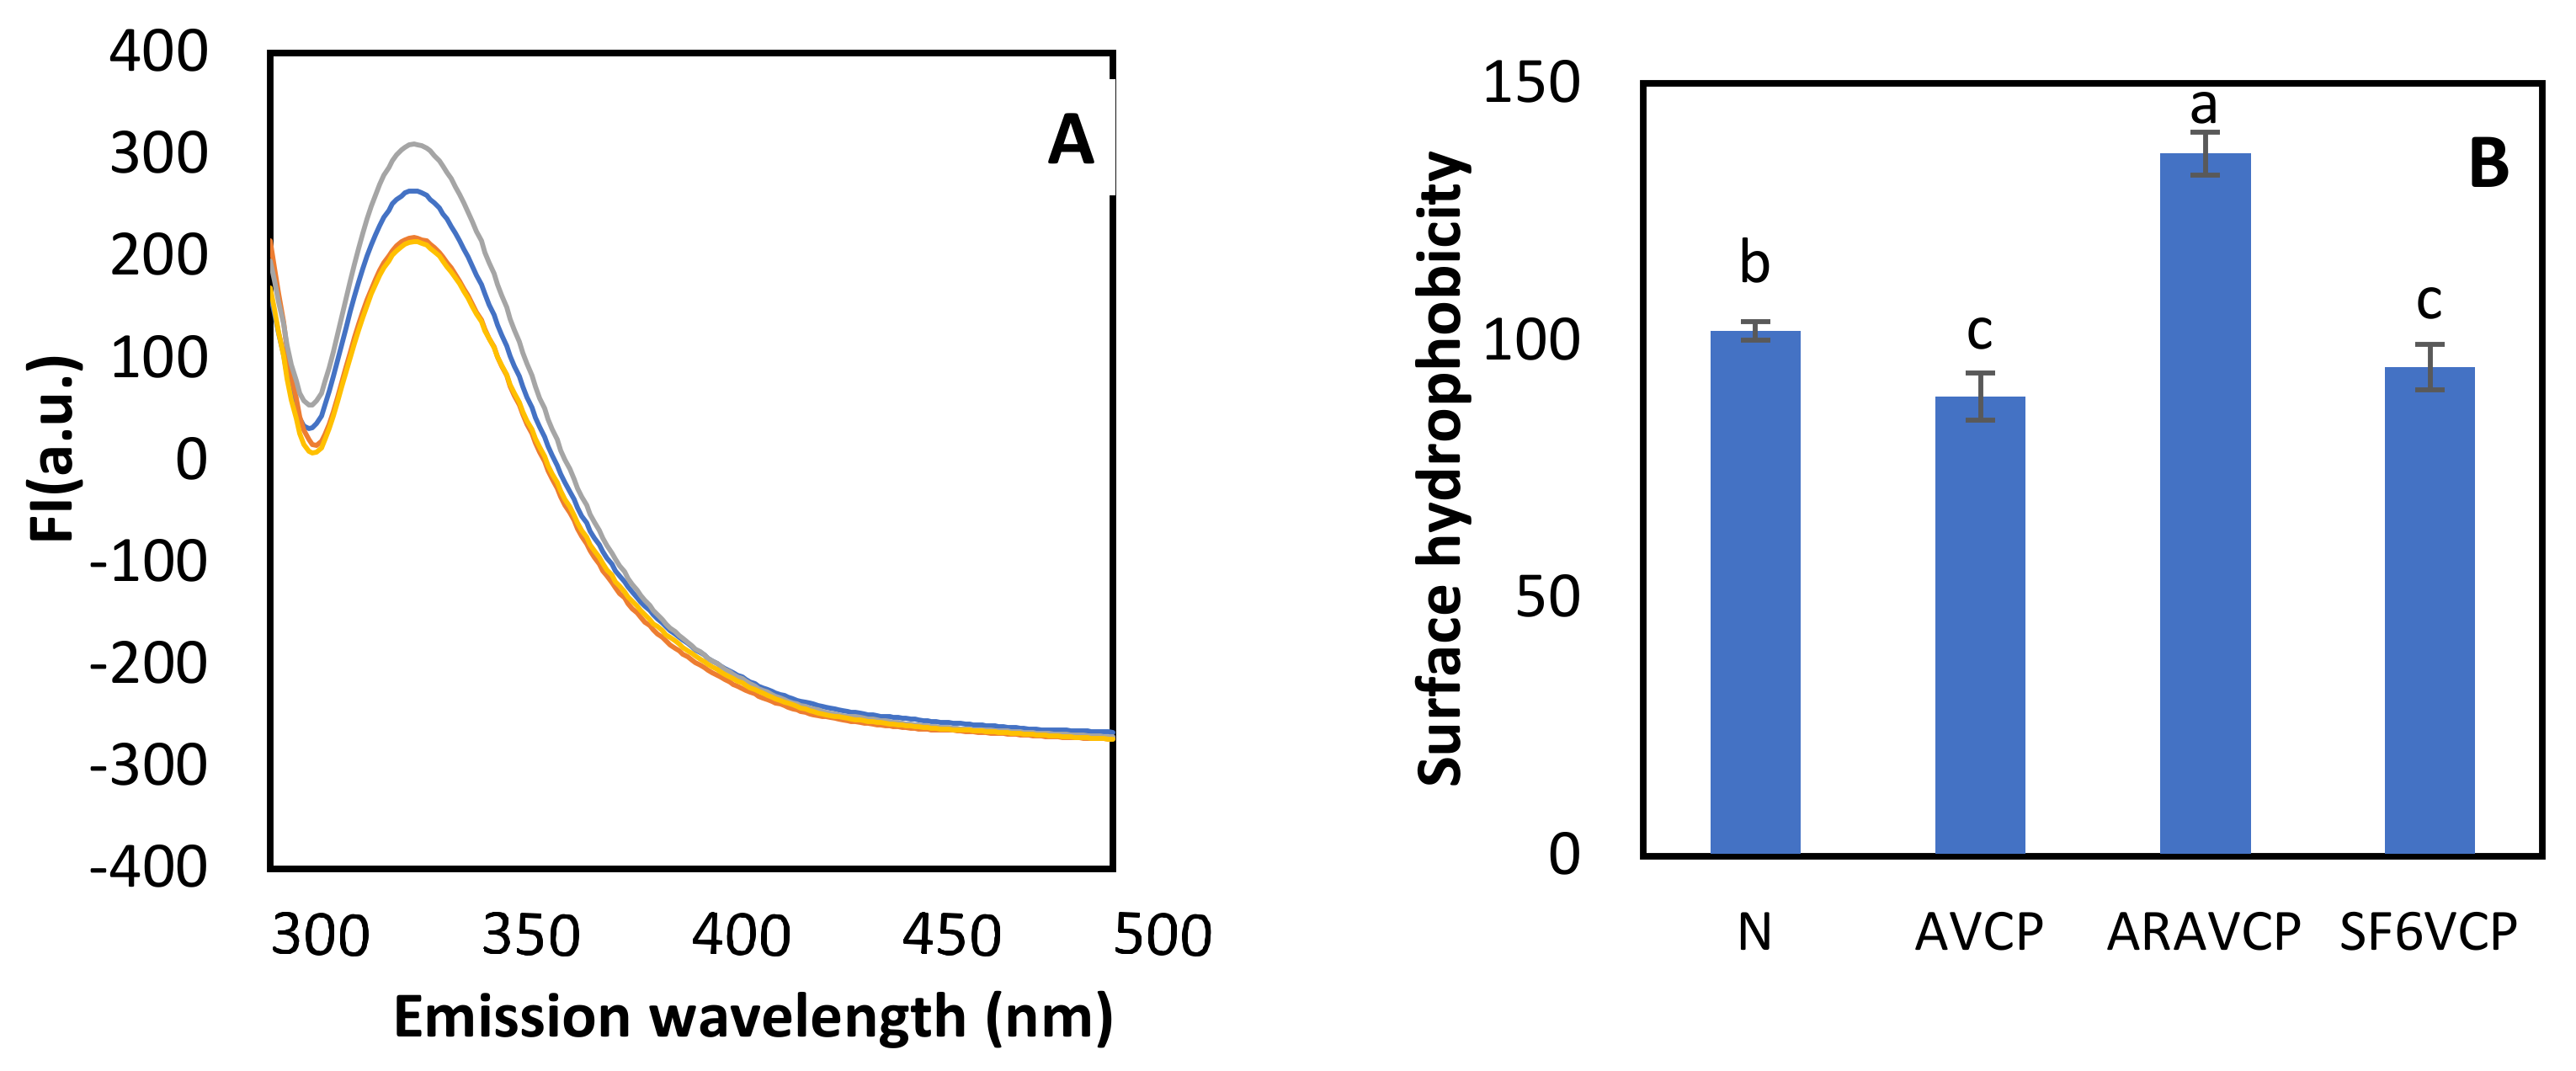
3.2. Influence of VCP on Hydrophobicity of WPI

The exposure of hydrophobic amino acids affects the functionality of protein in terms of interfacial adsorption, foamability, and foam stability [34]. Measurements of the so-called intrinsic and extrinsic fluorescence can provide meaningful estimates of the surface hydrophobicity of proteins [53].
Natural fluorophores, such as aromatic amino acid residues, enable the use of label-free investigations in biological systems [54]. Intrinsic fluorescence measurements, using natural fluorophores, have been extensively employed to ascertain the spatial configuration of proteins because of the sensitivity of the quantum yield to the local environment [55]. The hydrophobic amino acids tryptophan, tyrosin, and phenylalanin are the three major aromatic fluorophores in WPI, and contribute to the intrinsic fluorescence. The fluorescence yield of tryptophan increases strongly when exposed to the polar environment at the protein surface [56]. Thus, the fluorescence intensity correlates well with the exposure of hydrophobic groups to the surface, i.e., with the protein surface hydrophobicity resulting from denaturation.
As shown in Figure 2A, an increase in the maximum fluorescence intensity is observed when WPI is treated with ARAVCP. In contrast, a decrease results after treatment with AVCP or SF6VCP. Differences between the fluorescence intensity of VCP-treated protein show the changes in the structural conformation of protein molecules, along with more exposure of amino acids to the surface in ARAVCP-treated WPI.
The extrinsic fluorescence was the second measurement used to estimate the hydrophobicity and denaturation of the protein molecules. It revealed similar trends as the intrinsic fluorescence measurements (Figure 2B). The highest surface hydrophobicity was observed for ARAVCP-treated WPI, which may be attributed to oxidation, partial unfolding, and denaturation effects, resulting in the movement of more hydrophobic groups to the protein surface. Similar effects were previously reported for proteins treated with ozone [52] or atmospheric cold plasma [30].
Exposing the hydrophobic groups to the surface of the protein could promote more protein–protein interactions in the surface layer, which may, in turn, affect the protein aggregation and the visco-elasticity of WPI adsorption layers. SF6VCP-treated protein showed the lowest fluorescent intensity, as well as a longer λmax (500 nm), than other proteins (497 nm). As discussed further below in Section 3.4, the pH of SF6VCP-treated WPI solutions shifted to lower values, resulting in a possible conformational change and unfolding of the protein molecules in the solution. Consequently, the hydrophobic sites were anticipated to turn into the interiors of the proteins, lowering the possibility of interaction of –ANS with hydrophobic patches of the WPI molecules. However, the increase in the aggregate size might be evidence for WPI molecular interactions, which typically happen via hydrophobic groups. These interactions may screen the hydrophobic patches and prevent hydrophobic interactions with the fluorescent probe. Thus, the intrinsic fluorescence also depends on the secondary and tertiary structures of the protein [57].
On the other hand, the reduction in the fluorescence intensity caused by AVCP and SF6VCP treatments could also be attributed to the destruction of aromatic amino acids, as proposed by Takai et al. [14], who investigated the effect of CP on the 20 natural amino acids. They reported a noticeable fluorescence reduction in methionine, cysteine, and aromatic amino acids after CP treatment. Faure and Lafond [44] also reported such a reduction. This reduction could be related to the excessive oxidation of amino acids related to the reaction between these proteins and OH- to destroy its aromatic groups. This could be the reason for the lower fluorescence obtained after SF6VCP and AVCP treatments. However, no shift was observed in the FTIR spectra caused by VCP-treatment (Figure 3), suggesting no strong modification of the functional groups in the protein molecules.

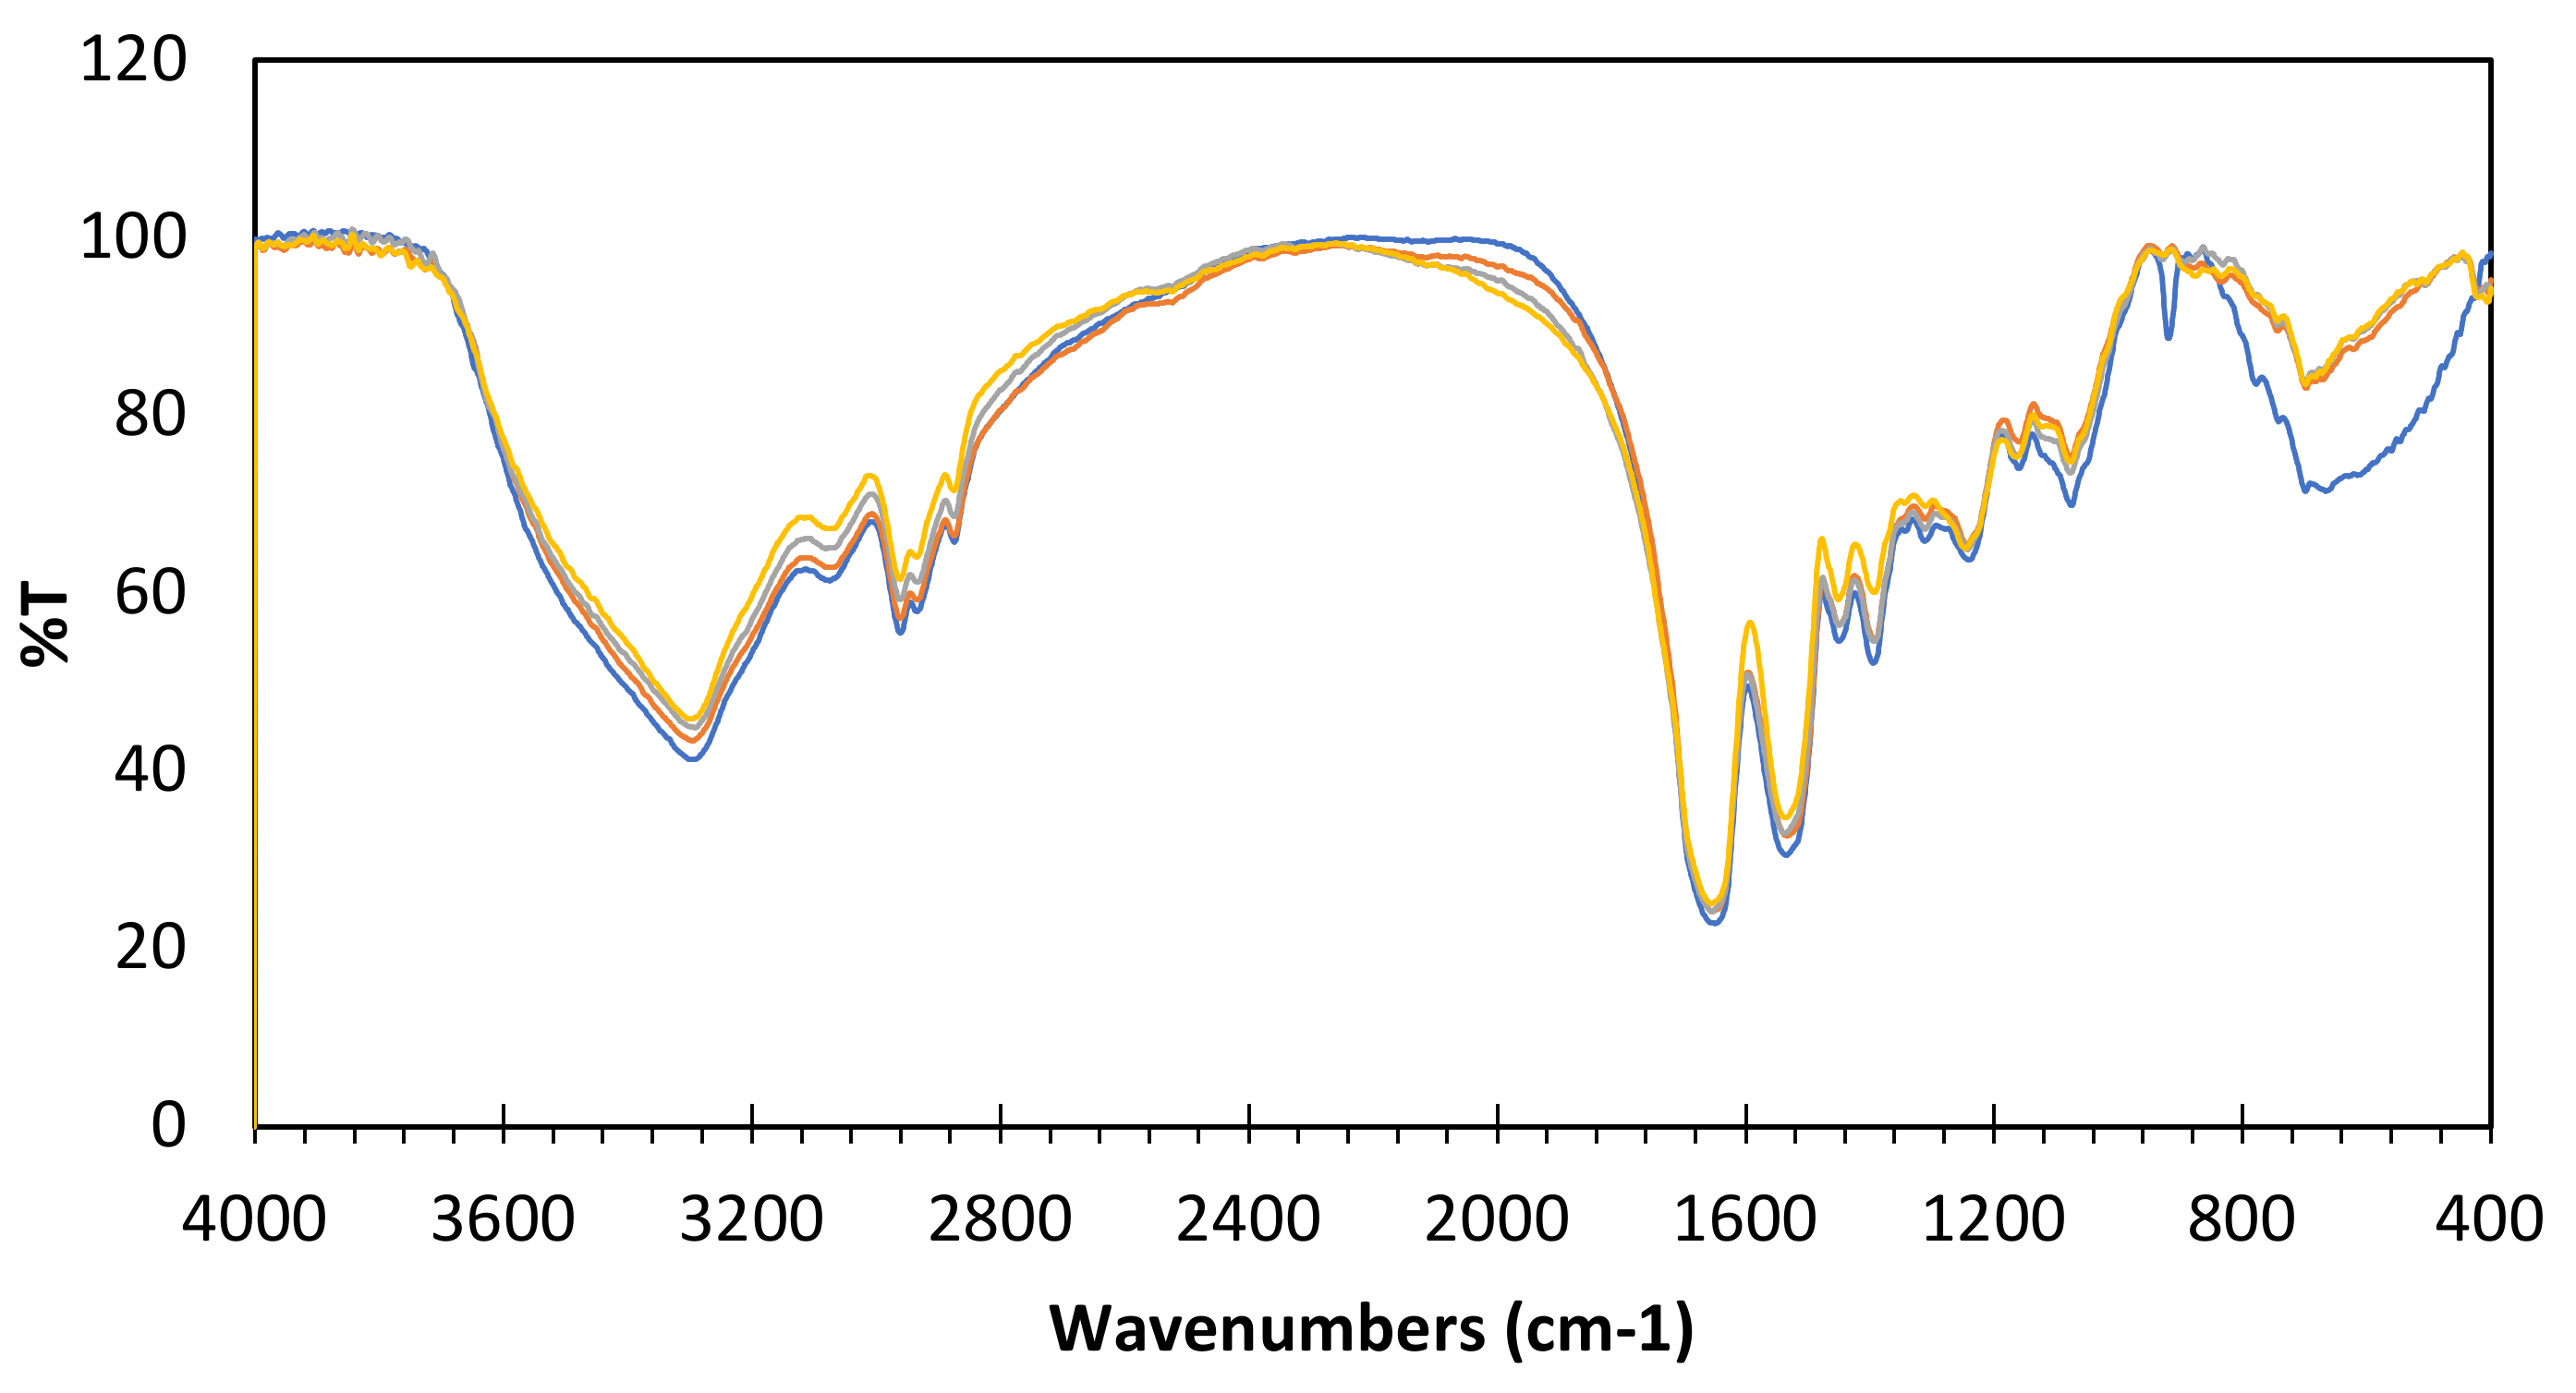
3.3. Influence on IR Spectra

The infrared spectrum of a protein is characteristic of its chemical structure and conformation. The major bands in the FTIR spectrum of a protein are known as amide I (1600– 1700 cm−1) and amide II (1510–1580 cm−1). Amide I is the most intense band due to C=O stretching vibrations, while amide II is due to the N-H bending vibration and C-N stretching vibrations [58].
Figure 3 compares the FTIR spectra of the untreated (N) and VCP-treated WPI samples. Although the intensity of these peaks varied, there was no significant shift toward higher wavelengths in the major bands (amide I and amide II), and the principal helical structures of the protein molecules remained more or less unchanged. Earlier studies are in line with this finding [16], and it has also been mentioned that IR spectroscopy is not sensitive enough to detect chemical changes in the thin surface layers of plasma-treated powders [59]. It appears as if the peak intensities are all increased by the same factor, suggesting an increase in sample concentration. ATR measurements have shown that the amount of sample should not make a difference, as long as the pressure on the probe is the same. Maybe the larger signal is just related to the fact that the sample becomes softer so that in general, better contact between the ATR crystal and the sample is established. However, it is suggested that cold plasma treatment generally only modifies organic materials to a depth of 10–40 nm [60].

3.4. Influence of VCP on the pH of Aqueous WPI Solutions

Table 1 displays the pH values of 2 wt% solutions of non-treated and VCP-treated WPI. Except for AVCP, a significant pH decrease was observed after the plasma treatment, particularly for SF6VCP, for which a decrease to pH 4.12 (p < 0.05) occurred. Zhang et al. [61] reported the isoelectric point of non-treated WPI to be less than 4.5.
According to the results from previous studies [30,62,63] the protein solutions exhibited the same acidification when exposed to atmospheric cold plasma as a liquid. The authors attributed this pH decrease to the formation of nitrous acid (HNO2) and nitric acid (HNO3) from NO and H3O+ ions, which in turn are reaction products of water molecules with hydrogen peroxide (H2O2). Additionally, in these studies, variations in the pH values were related to the buffering capacity of the solution and the plasma.
In the present study, we found that the addition of argon to air leads to a stronger pH decrease. Chen et al. [64] reported that argon plasma leads to considerably higher ROS and RNS concentrations than nitrogen plasma. The differences in RNS and ROS concentrations could be explained by the magnitude of the electron density difference between argon (2.2 × 1012 cm−3) and nitrogen (2.2 × 1011 cm−3) plasma.
One of the reported limitations of plasma treatments of protein is the increase in acidity [65]. This increase may be due to the presence of water molecules (as vapor or liquid) in the environment surrounding the protein during the CP treatment, which produces more acidic soluble ions and molecules. A promising finding in this study is that changes in the pH values during VCP treatment were minimal, with the exception of SF6VCP. Many factors affect the influence of a CP treatment on pH. Solid and liquid food matrices interact differently with reactive species, as most liquids can vaporize during the treatment and can take part in subsequent reactions [21].
Earlier findings and our present results suggest that the type of gas which is utilized is one of the most critical factors for the observed pH changes. It was reported that during SF6 decomposition by CP, primary and secondary products were formed, such as SO2F2, SOF2, SOF4, SO2, S2F10, S2OF10, S2O2F10, SF4, and HF [66]. Thus, the reason for the significantly lower pH after SF6VCP treatment could be attributed to F-radicals. Reacting with the hydrogen of the organic material in the protein, it results in the production of HF. Furthermore, during this reaction, some acidic inorganic compounds, such as SO4, SO2, and HF, could also be produced.

3.5. Influence of VCP on the Aggregation Behavior and ζ-Potential

In Table 1, the mean particle size and the polydispersity index (PDI), as obtained by DLS measurements on aqueous WPI solutions, are summarized. The VCP treatment influenced the size and PDI of aggregates. An increase in the mean particle size was obtained when WPI is treated with SF6VCP or ARAVCP. The stronger increase in the mean particle size caused by SF6VCP treatment can be attributed to the resulting low pH (4.1), which brought the protein molecules close to their isoelectric point (<4.5) so that the reduced electrostatic repulsion would promote stronger aggregation. The observed increase in the particle size may further be related to disulfide bonds between the proteins, which is suggested by the observation that SF6VCP treatment leads to a decrease in the amount of free SH thiol groups [67,68,69].
The moderate increase in the aggregate size by the ARAVCP treatment, which does not reduced pH may be related to changes in the protein conformation, which are suggested by the fluorescence and free sulfhydryl groups measurements. The aggregation may be promoted here via the increased hydrophobic interaction. Thus, the ARAVCP treatment seems to lead to more flexible structures without a strong network of disulfide bonds [70,71,72].
The ζ-potential values (see Table 1) show no differences between the samples, except for the one treated with SF6VCP. Here, the ζ-potential becomes slightly positive (+12 mV), which is in line with the substantial reduction in the solution pH. The low absolute value of the ζ-potential reflects the decrease in the total net charge during the pH decrease, which demonstrates once more the reduction of repulsive forces between the particles and the resulting tendency for flocculation of particles in solution [67].

3.6. VCP Influence on the WPI Adsorption at Air/Water Interface

The functional properties of proteins, such as the foamability and stabilization of emulsions and foams, strongly depend on the ability of the proteins to adsorb at the corresponding surfaces/interfaces and the decrease in surface/interfacial tension. Moreover, the initial adsorption of proteins is the most important step in foam formation. Therefore, we investigated the formation of WPI interfacial layers for different VCP treatments.
a.
Surface pressure
Figure 4A shows the dynamic surface pressure Π(t) of a 0.01 wt% WPI solution as a function of time for untreated and VCP-treated WPI. The SF6VCP treatment leads to the highest equilibrium surface pressure values, followed by non-, AVCP-, and ARAVCP-treated protein. As mentioned above, the SF6VCP treatment decreases the pH of the protein solution to around 4.2. The higher surface pressure, as well as its rapid increase for WPI after SF6VCP treatment, can be attributed to the lower pH resulting in lower repulsions between the adsorbed molecules, which facilitates the formation of a dense adsorption layer. Similar observations were also made earlier with protein solutions at different pH values [69,70]. The physical basis of these findings is the impact of protein’s net charge on the adsorption kinetics in general, which can be connected to the variations in the surface activity of the proteins and the presence of an electrostatic adsorption barrier. Thus, the SF6VCP-treated protein carries a lower net charge (|Z| = 12.9) than the other samples (|Z| = 27.9) (Table 1), induces a higher adsorption rate, and hence promotes WPI adsorption at the surface [69].
b.
 Surface dilational visco-elasticity
To determine the mechanical surface properties of the adsorbed layer of untreated and VCP-treated WPI, the surface dilational elasticity was measured using the oscillation drop method. Figure 4B, C show that with increasing frequency, the elasticity modulus (Er) gradually increased. This behavior is typical for proteins at the water/air surface. At a frequency of 0.01 Hz, the adsorbed layer of SF6VCP-treated WPI exhibited the highest elasticity value (Er = 43 ± 1 mN/m) compared to the other samples. The higher visco-elastic moduli of this WPI sample can again be attributed to the effect of the lower pH resulting in the formation of more densely packed layers, as well as possible disulfide bonds strengthening the interfacial network [67].
c.
 Thickness of adsorbed WPI layers
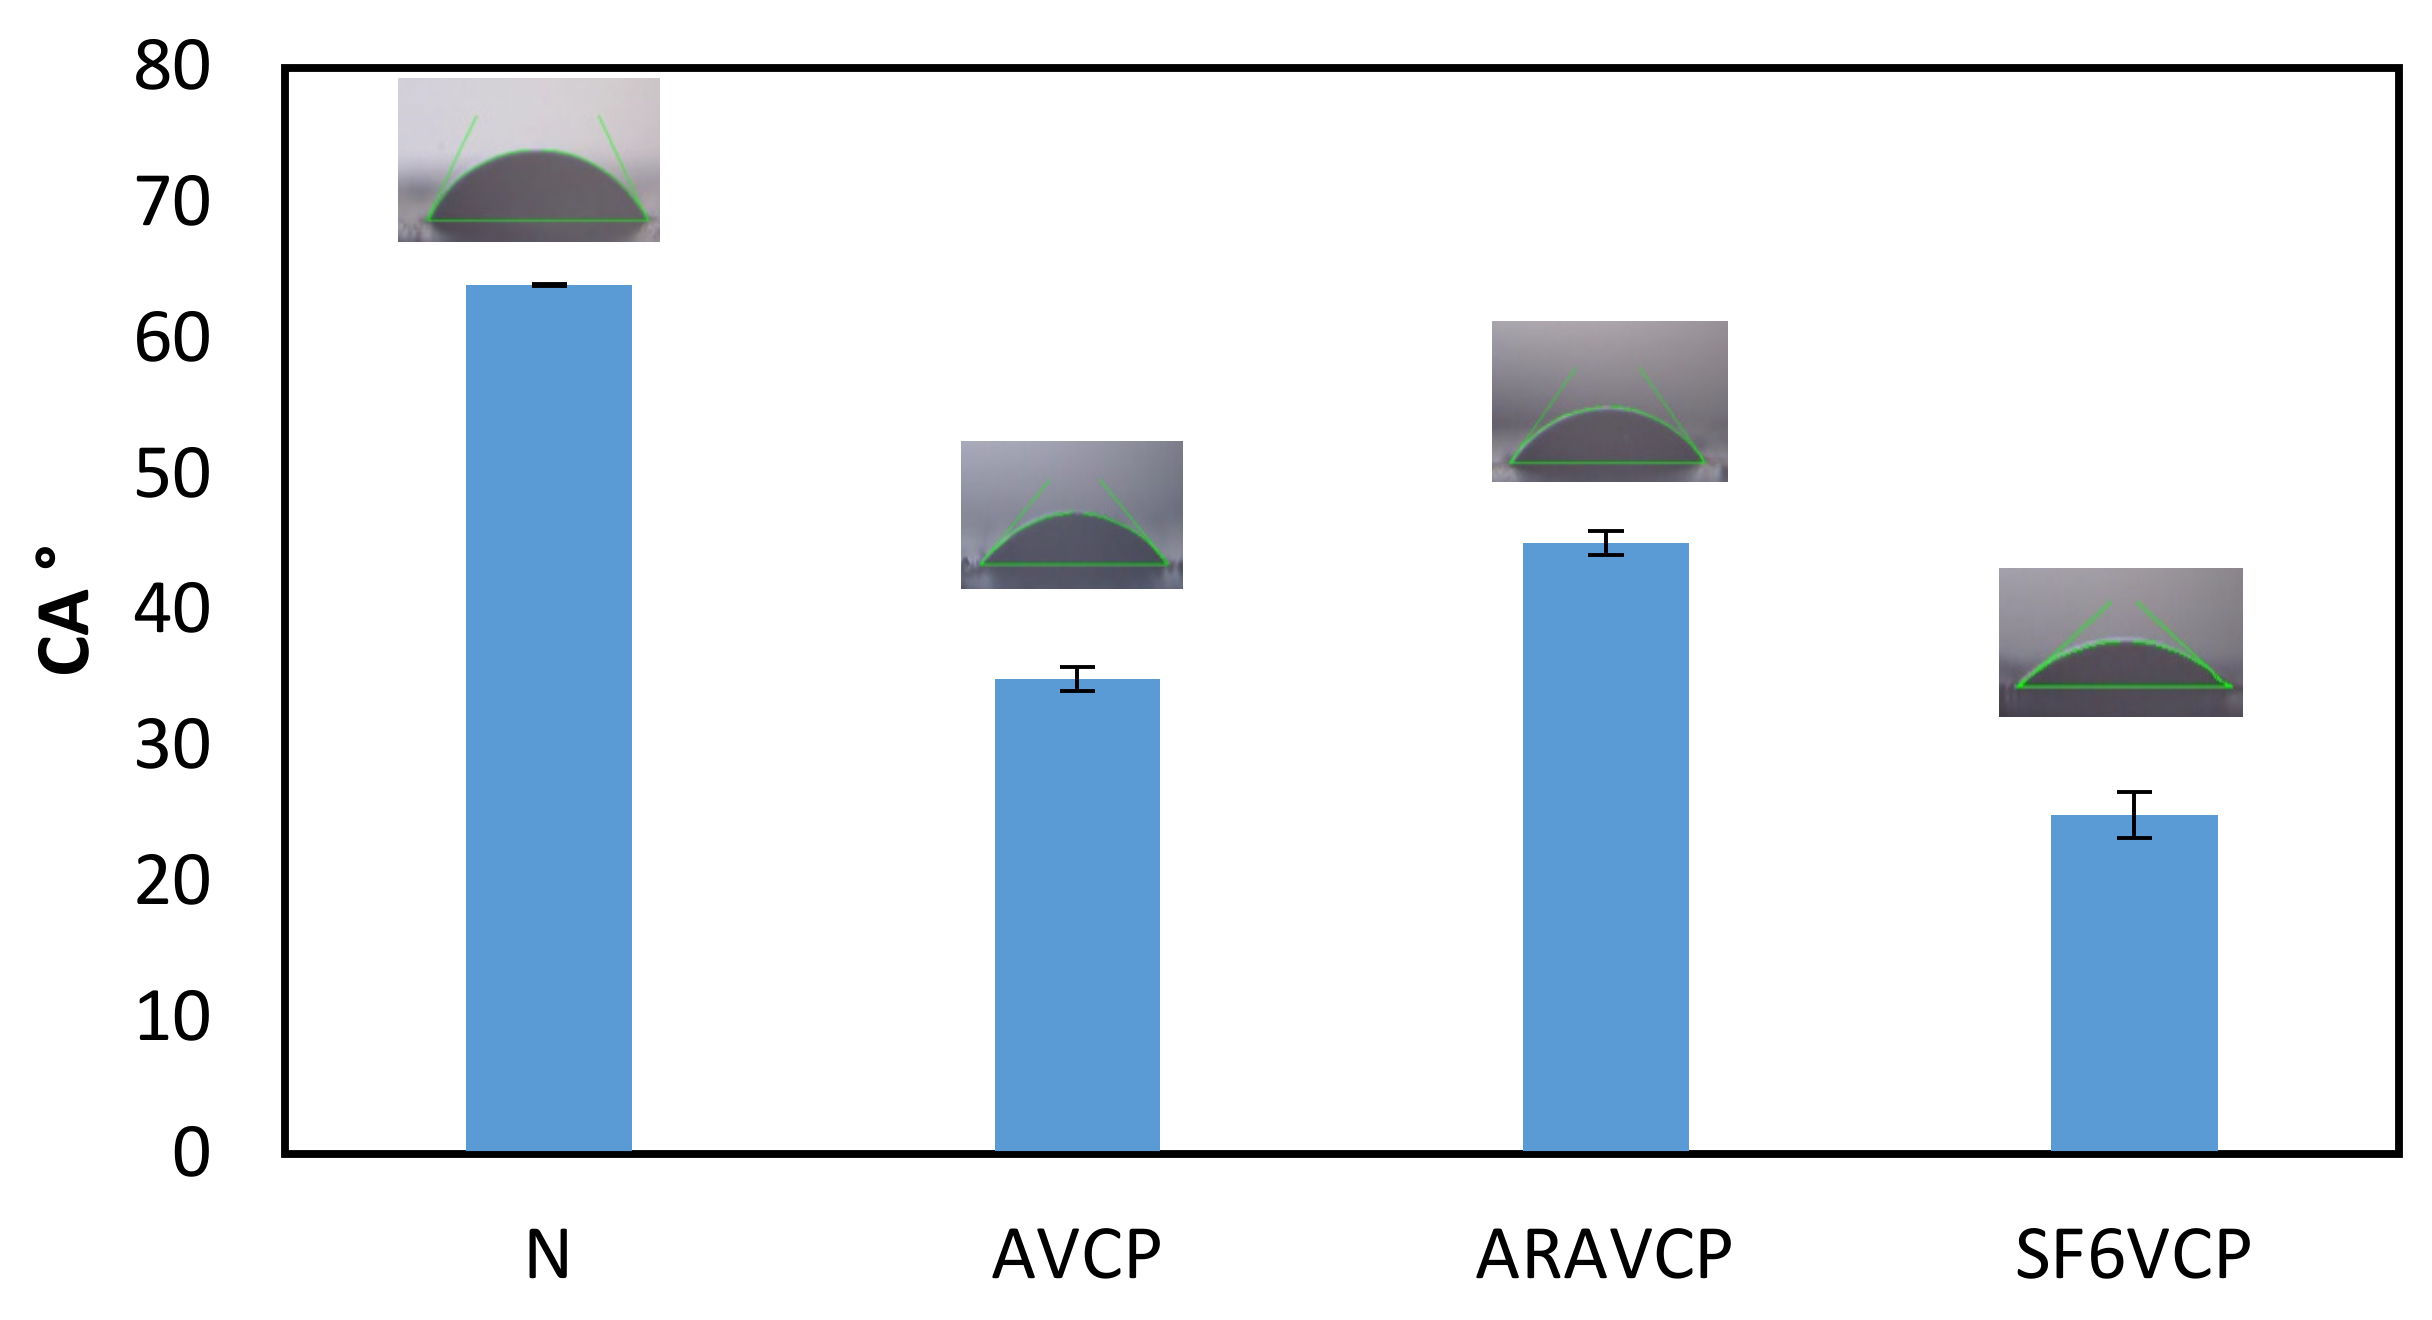
Figure 4D shows the equivalent protein layer thickness δeq after equilibration (24 h), as determined by surface ellipsometry. The δeq for SF6VCP-treated WPI (δeq ≈ 3.9 nm) is higher than for the other protein samples (δeq = 2.1–2.3 nm), evidencing that this treatment results in the highest protein volume per area at the interface. These results are consistent with the higher surface pressure and dilational elasticity values, as explained above. As the mechanical strength of the interfacial layers is related to their thickness, packing density, and degree of network ordering, the increasing elasticity could be explained by the increase in the layer thickness.

3.7. Contact Angle

The contact angle of water drops was measured on pressed tablets of non-treated and VCP-treated WPI powders (Figure 5). We used these tablets because it was experimentally not possible without pressure to produce a flat homogeneous sample (film) of the micro-scaled powders for the wettability measurements. Notably, the powder became extremely fine after it was treated by VCP.
The contact angle for the non-treated WPI (N) amounted to 64°, which is consistent with the value of 61° reported earlier by Mossavi et al. [73]. This value decreased significantly as a result of the VCP treatment, reaching 36° for AVCP-, 49° for ARAVCP-, and 25.5° for SF6VCP-treated WPI. This indicates increased wettability. Results from previous studies have confirmed the increased wettability after 10 min of treatment with cold plasma [20,59,73,74]. In those studies, it was suggested that the exposure of WPI to CP results in the creation of polar functional groups at the protein surfaces and in a reduction in the amount of C-H groups, in turn leading to an increase in the polarity of the treated whey protein.
According to Figure 5, the application of VCP decreased the hydrophobicity of the protein, which is in contradiction with the hydrophobicity measurements discussed above. The possible reason may be related to the different methods which were applied, which measured different qualities of hydrophobicity. With the contact angle method, a solid tablet of protein powder produced under high pressure is in interaction with a drop of water. Hence, the measured contact angle is related to the solid surface of the WPI powder tablet pressed at a high pressure of 200 bar [59]. In contrast, in the fluorescence-based hydrophobicity measurements, we studied the protein molecules in an aqueous solution. Interestingly, the observed contact angle of the tablet after ARAVCP treatment of the WPI powder was higher (49°) than for the other samples (36° for AVCP and 25.5° for SF6VCP), indicating higher hydrophobicity. Thus, at least the contact angle changes show the same trend as the results obtained from intrinsic and extrinsic hydrophobicity studies of the protein molecules.
However, since the results from contact angle measurements mainly concern the wettability of solid surfaces, our findings could be useful for WPI films applied in food packaging applications. The compression of the VCP-treated powder to form the tablets is associated with some difficulties, because the WPI powder after plasma treatment has a lower bulk density than the non-treated protein. Having a homogenous surface without cracks or holes is one of the most important prerequisites for the accuracy of this measurement.

4. Conclusions

In this study, information was obtained about the physico-chemical properties of WPI treated with VCP using different gases, namely, air, argon-enriched air, and SF6. The results show that VCP plasma generated oxidative effects in WPI, depending on the type of the gas that is used. Moreover, the interactions of whey proteins with reactive species produced by the plasma led to an increase in the surface hydrophobicity of the molecules, a decrease in pH of the aqueous WPI solutions, and an increase in the size of the formed aggregates. Given these results, we found that the reactive species required for each application can be selectively generated by the respective plasma gas species. The results obtained in this study advance our knowledge on the effect of cold plasma on the physico-chemical properties of WPI both in solution and at the surface, and the function of the utilized gases. Moreover, the findings could be considered as advantages for the food industry, enabling us to modify proteins at low temperatures as basic ingredients in food formulations, and to achieve desired features of the final products on a commercial scale. However, due to the complexity of the protein structure, as well as of the applied cold plasma technology, a more accurate interpretation will require more investigations. Therefore, respective considerations are required to exclude the diverse effects attributed to cold plasma technology in the food industry under different applied conditions.
Notably, although SF6 is known as a greenhouse gas, some studies have been performed with this gas as it has a significant effect on the biodegradable packaging of proteins and on the decrease of fungal microbial contamination in food ingredients. We used cold plasma at very low voltage and under vacuum conditions with a high flow rate, because the most dangerous materials are produced at high voltage. Nevertheless, the negative environmental effects of SF6 should be considered when it is used in food applications.

Author Contributions

Conceptualization: E.O.M., S.Y. and R.M.; methodology: E.O.M., S.Y., M.A.H., M.D. and R.M.; formal analysis: S.Y., M.A.H., R.M. and E.S.; investigation: E.O.M.; resources: S.Y. and E.S.; data curation: E.O.M., M.A.H. and M.D.; writing—original draft preparation: E.O.M.; writing—review and editing: E.O.M., S.Y., M.A.H., M.D., E.S. and R.M. All authors have read and agreed to the published version of the manuscript.

Funding

The authors wish to express their profound gratitude sincerely to the Research Institute of Food Science and Technology in Mashhad for financial support of this project. Many thanks go to the TU-Darmstadt for providing laboratory equipment for experiments of this research.

Data Availability Statement

The data presented in this study are available on request from the corresponding author.

Conflicts of Interest

The authors declare no conflict of interest.

References

  1. Huang, H.-W.; Wu, S.-J.; Lu, J.-K.; Shyu, Y.-T.; Wang, C.-Y. Current status and future trends of high-pressure processing in food industry. Food Control 2017, 72, 1–8. [Google Scholar] [CrossRef]
  2. Arvanitoyannis, I.S.; Kotsanopoulos, K.V.; Savva, A.G. Use of ultrasounds in the food industry—Methods and effects on quality, safety, and organoleptic characteristics of foods: A review. Crit. Rev. Food Sci. Nutr. 2017, 57, 109–128. [Google Scholar] [CrossRef] [PubMed]
  3. Barba, F.J.; Parniakov, O.; Pereira, S.A.; Wiktor, A.; Grimi, N.; Boussetta, N.; Saraiva, J.A.; Raso, J.; Martin-Belloso, O.; Witrowa-Rajchert, D.; et al. Current applications and new opportunities for the use of pulsed electric fields in food science and industry. Food Res. Int. 2015, 77, 773–798. [Google Scholar] [CrossRef]
  4. Guzel-Seydim, Z.B.; Greene, A.K.; Seydim, A. Use of ozone in the food industry. LWT 2004, 37, 453–460. [Google Scholar] [CrossRef]
  5. Li, X.; Farid, M. A review on recent development in non-conventional food sterilization technologies. J. Food Eng. 2016, 182, 33–45. [Google Scholar] [CrossRef]
  6. Bourke, P.; Ziuzina, D.; Boehm, D.; Cullen, P.J.; Keener, K. The Potential of Cold Plasma for Safe and Sustainable Food Production. Trends Biotechnol. 2018, 36, 615–626. [Google Scholar] [CrossRef] [Green Version]
  7. Foegeding, E.A.; Davis, J.P. Food protein functionality: A comprehensive approach. Food Hydrocoll. 2011, 25, 1853–1864. [Google Scholar] [CrossRef]
  8. Haque, M.A.; Timilsena, Y.P.; Adhikari, B. Food Proteins, Structure, and Function; In Reference Module in Food Science; Elsevier: Amsterdam, the Netherlands, 2016. [Google Scholar]
  9. Tolouie, H.; Mohammadifar, M.A.; Ghomi, H.; Hashemi, M. Cold atmospheric plasma manipulation of proteins in food systems. Crit. Rev. Food Sci. Nutr. 2017, 58, 2583–2597. [Google Scholar] [CrossRef] [Green Version]
  10. Boudam, M.K.; Moisan, M.; Saoudi, B.; Popovici, C.; Gherardi, N.; Massines, F. Bacterial spore inactivation by atmospheric-pressure plasmas in the presence or absence of UV photons as obtained with the same gas mixture. J. Phys. D Appl. Phys. 2006, 39, 3494–3507. [Google Scholar] [CrossRef]
  11. Bußler, S.; Ehlbeck, J.; Schlüter, O.K. Pre-drying treatment of plant related tissues using plasma processed air: Impact on enzyme activity and quality attributes of cut apple and potato. Innov. Food Sci. Emerg. Technol. 2017, 40, 78–86. [Google Scholar] [CrossRef]
  12. Takamatsu, T.; Uehara, K.; Sasaki, Y.; Miyahara, H.; Matsumura, Y.; Iwasawa, A.; Ito, N.; Azuma, T.; Kohno, M.; Okino, A. Investigation of reactive species using various gas plasmas. RSC Adv. 2014, 4, 39901–39905. [Google Scholar] [CrossRef] [Green Version]
  13. Jiang, Y.-H.; Cheng, J.-H.; Sun, D.-W. Effects of plasma chemistry on the interfacial performance of protein and polysaccharide in emulsion. Trends Food Sci. Technol. 2020, 98, 129–139. [Google Scholar] [CrossRef]
  14. Takai, E.; Kitamura, T.; Kuwabara, J.; Ikawa, S.; Yoshizawa, S.; Shiraki, K.; Kawasaki, H.; Arakawa, R.; Kitano, K. Chemical modification of amino acids by atmospheric-pressure cold plasma in aqueous solution. J. Phys. D Appl. Phys. 2014, 47, 285403. [Google Scholar] [CrossRef]
  15. Afshari, R.; Hosseini, H. Non-thermal plasma as a new food preservation method, Its present and future prospect. Arch. Adv. Biosci. 2014, 5, 116–120. [Google Scholar] [CrossRef]
  16. Pankaj, S.; Bueno-Ferrer, C.; Misra, N.; O’Neill, L.; Tiwari, B.; Bourke, P.; Cullen, P. Physicochemical characterization of plasma-treated sodium caseinate film. Food Res. Int. 2014, 66, 438–444. [Google Scholar] [CrossRef]
  17. Ekezie, F.-G.C.; Sun, D.-W.; Cheng, J.-H. A review on recent advances in cold plasma technology for the food industry: Current applications and future trends. Trends Food Sci. Technol. 2017, 69, 46–58. [Google Scholar] [CrossRef]
  18. Misra, N.N.; Martynenko, A.; Chemat, F.; Paniwnyk, L.; Barba, F.J.; Jambrak, A.R. Thermodynamics, transport phenomena, and electrochemistry of external field-assisted nonthermal food technologies. Crit. Rev. Food Sci. Nutr. 2017, 58, 1832–1863. [Google Scholar] [CrossRef] [Green Version]
  19. Pankaj, S.K.; Bueno-Ferrer, C.; Misra, N.N.; Milosavljević, V.; O’donnell, C.P.; Bourke, P.; Keener, K.M.; Cullen, P.J. Applications of cold plasma technology in food packaging. Trends Food Sci. Technol. 2014, 35, 5–17. [Google Scholar] [CrossRef]
  20. Thiry, D.; Konstantinidis, S.; Cornil, J.; Snyders, R. Plasma diagnostics for the low-pressure plasma polymerization process: A critical review. Thin Solid Films 2016, 606, 19–44. [Google Scholar] [CrossRef]
  21. Gong, W.; Guo, X.-L.; Huang, H.-B.; Li, X.; Xu, Y.; Hu, J.-N. Structural characterization of modified whey protein isolates using cold plasma treatment and its applications in emulsion oleogels. Food Chem. 2021, 356, 129703. [Google Scholar] [CrossRef]
  22. Sharma, S.; Singh, R.K. Effect of atmospheric pressure cold plasma treatment time and composition of feed gas on properties of skim milk. LWT 2021, 154, 112747. [Google Scholar] [CrossRef]
  23. Chang, R.; Lu, H.; Tian, Y.; Li, H.; Wang, J.; Jin, Z. Structural modification and functional improvement of starch nanoparticles using vacuum cold plasma. Int. J. Biol. Macromol. 2019, 145, 197–206. [Google Scholar] [CrossRef] [PubMed]
  24. Han, Y.; Manolach, S.O.; Denes, F.; Rowell, R.M. Cold plasma treatment on starch foam reinforced with wood fiber for its surface hydrophobicity. Carbohydr. Polym. 2011, 86, 1031–1037. [Google Scholar] [CrossRef]
  25. Mangindaan, D.; Kuo, W.-H.; Wang, Y.-L.; Wang, M.-J. Experimental and Numerical Modeling of the Controllable Wettability Gradient on Polypropylene Created by SF6 Plasma. Plasma Process. Polym. 2010, 7, 754–765. [Google Scholar] [CrossRef]
  26. Martusevich, A.K.; Surovegina, A.V.; Bocharin, I.V.; Nazarov, V.V.; Minenko, I.A.; Artamonov, M.Y. Cold Argon Athmospheric Plasma for Biomedicine: Biological Effects, Applications and Possibilities. Antioxidants 2022, 11, 1262. [Google Scholar] [CrossRef]
  27. Tolouie, H.; Mohammadifar, M.A.; Ghomi, H.; Hashemi, M. Argon and nitrogen cold plasma effects on wheat germ lipolytic enzymes: Comparison to thermal treatment. Food Chem. 2020, 346, 128974. [Google Scholar] [CrossRef]
  28. Levine, R.L.; Garland, D.; Oliver, C.N.; Amici, A.; Climent, I.; Lenz, A.G.; Ahn, B.W.; Shaltiel, S.; Stadtman, E.R. Determination of carbonyl content in oxidatively modified proteins. Methods Enzymol. 1990, 186, 464–478. [Google Scholar]
  29. Beveridge, T.; Toma, S.; Nakai, S. Determination of sh- and ss-groups in some food proteins using ellman’s reagent. J. Food Sci. 1974, 39, 49–51. [Google Scholar] [CrossRef]
  30. Segat, A.; Misra, N.; Cullen, P.; Innocente, N. Atmospheric pressure cold plasma (ACP) treatment of whey protein isolate model solution. Innov. Food Sci. Emerg. Technol. 2015, 29, 247–254. [Google Scholar] [CrossRef]
  31. Eftink, M.R. Intrinsic fluorescence of proteins. In Topics in Fluorescence Spectroscopy: Protein Fluorescence; Springer: New York, NY, USA, 2000; Volume 6, pp. 1–15. [Google Scholar]
  32. Kato, A.; Nakai, S. Hydrophobicity determined by a fluorescence probe method and its correlation with surface properties of proteins. Biochim. Biophys. Acta (BBA)—Protein Struct. 1980, 624, 13–20. [Google Scholar] [CrossRef]
  33. Xiang, B. Effects of Pulsed Electric Fields on Structural Modification and Rheological Properties for Selected Food Proteins. Ph.D. Thesis, McGill University, Montréal, QC, Canada, 2009. [Google Scholar]
  34. Lazidis, A.; Hancocks, R.D.; Spyropoulos, F.; Kreuß, M.; Berrocal, R.; Norton, I.T. Whey protein fluid gels for the stabilisation of foams. Food Hydrocoll. 2016, 53, 209–217. [Google Scholar] [CrossRef] [Green Version]
  35. Koppel, D.E. Analysis of Macromolecular Polydispersity in Intensity Correlation Spectroscopy: The Method of Cumulants. J. Chem. Phys. 1972, 57, 4814–4820. [Google Scholar] [CrossRef]
  36. Hunter, R.J. Zeta Potential in Colloid Science: Principles and Applications; Academic Press: Cambridge, MA, USA, 2013. [Google Scholar]
  37. Rubens, P.; Heremans, K. Pressure–temperature gelatinization phase diagram of starch: An in situ Fourier transform infrared study. Biopolym. Orig. Res. Biomol. 2000, 54, 524–530. [Google Scholar] [CrossRef]
  38. Seshadri, S.; Khurana, R.; Fink, A.L. Fourier transform infrared spectroscopy in analysis of protein deposits. In Methods Enzymology; Elsevier: Amsterdam, The Netherlands, 1999; pp. 559–576. [Google Scholar]
  39. Loglio, G.; Pandolfini, P.; Miller, R.; Makievski, A.V.; Ravera, F.; Ferrari, M.; Liggieri, L. Drop and bubble shape analysis as tool for dilational rheology studies of interfacial layers. In Novel Methods to Study Interfacial Layers; Elsevier Science: Amsterdam, The Netherlands, 2001; pp. 439–484. [Google Scholar]
  40. Rühs, P.A.; Affolter, C.; Windhab, E.J.; Fischer, P. Shear and dilational linear and nonlinear subphase controlled interfacial rheology of β-lactoglobulin fibrils and their derivatives. J. Rheol. 2013, 57, 1003–1022. [Google Scholar] [CrossRef]
  41. Gochev, G.G.; Scoppola, E.; Campbell, R.A.; Noskov, B.A.; Miller, R.; Schneck, E. β-Lactoglobulin adsorption layers at the water/air surface: 3. Neutron reflectometry study on the effect of pH. J. Phys. Chem. B 2019, 123, 10877–10889. [Google Scholar] [CrossRef]
  42. Delahaije, R.J.; Gruppen, H.; Giuseppin, M.L.; Wierenga, P.A. Quantitative description of the parameters affecting the adsorption behaviour of globular proteins. Colloids Surf. B Biointerfaces 2014, 123, 199–206. [Google Scholar] [CrossRef]
  43. Aditya, N.P.; Hamilton, I.E.; Nortoh, I.T. Amorphous nano-curcumin stabilized oil in water emulsion: Physico chemical characterization. J. Food Chem. 2017, 224, 191–200. [Google Scholar] [CrossRef]
  44. Faure, P.; Lafond, J.-L. Measurement of plasma sulfhydryl and carbonyl groups as a possible indicator of protein oxidation. In Analysis of Free Radicals in Biological Systems; Springer: Basel, Switzerland, 1995; pp. 237–248. [Google Scholar]
  45. Feng, X.; Li, C.; Ullah, N.; Cao, J.; Lan, Y.; Ge, W.; Hackman, R.M.; Li, Z.; Chen, L. Susceptibility of whey protein isolate to oxidation and changes in physicochemical, structural, and digestibility characteristics. J. Dairy Sci. 2015, 98, 7602–7613. [Google Scholar] [CrossRef] [Green Version]
  46. Scheiner, S.; Kar, T. Analysis of the Reactivities of Protein C−H Bonds to H Atom Abstraction by OH Radical. J. Am. Chem. Soc. 2010, 132, 16450–16459. [Google Scholar] [CrossRef]
  47. Cui, X.; Xiong, Y.L.; Kong, B.; Zhao, X.; Liu, N. Hydroxyl Radical-Stressed Whey Protein Isolate: Chemical and Structural Properties. Food Bioprocess Technol. 2011, 5, 2454–2461. [Google Scholar] [CrossRef]
  48. Stadtman, E.R. Protein oxidation and aging. Free. Radic. Res. 2006, 40, 1250–1258. [Google Scholar] [CrossRef] [PubMed] [Green Version]
  49. Di Simplicio, P.; Cheeseman, K.H.; Slater, T.F. The Reactivity of the Sh Group of Bovine Serum Albumin with Free Radicals. Free. Radic. Res. Commun. 1991, 14, 253–262. [Google Scholar] [CrossRef] [PubMed]
  50. Brosnan, J.T.; Brosnan, M.E. The sulfur-containing amino acids: An overview. J. Nutr. 2006, 136, 1636S–1640S. [Google Scholar] [CrossRef] [PubMed] [Green Version]
  51. Davies, M.J. The oxidative environment and protein damage. Biochim. Biophys. Acta (BBA)—Proteins Proteom. 2005, 1703, 93–109. [Google Scholar] [CrossRef]
  52. Segat, A.; Misra, N.; Fabbro, A.; Buchini, F.; Lippe, G.; Cullen, P.J.; Innocente, N. Effects of ozone processing on chemical, structural and functional properties of whey protein isolate. Food Res. Int. 2014, 66, 365–372. [Google Scholar] [CrossRef]
  53. Nakai, S. Measurement of Protein Hydrophobicity. Curr. Protoc. Food Anal. Chem. 2003, 9, B5.2.1–B5.2.13. [Google Scholar] [CrossRef]
  54. Ghisaidoobe, A.B.T.; Chung, S.J. Intrinsic Tryptophan Fluorescence in the Detection and Analysis of Proteins: A Focus on Förster Resonance Energy Transfer Techniques. Int. J. Mol. Sci. 2014, 15, 22518–22538. [Google Scholar] [CrossRef] [Green Version]
  55. Lakowicz, J.R. Principles of Fluorescence Spectroscopy; Springer: Berlin/Heidelberg, Germany, 2006. [Google Scholar]
  56. Efremov, R.G.; Feofanov, A.V.; Nabiev, I.R. Effect of hydrophobic environment on the resonance Raman spectra of tryptophan residues in proteins. J. Raman Spectrosc. 1992, 23, 69–73. [Google Scholar] [CrossRef]
  57. Faure, P.; Lafond, J.-L.; Coudray, C.; Rossini, E.; Halimi, S.; Favier, A.; Blache, D. Zinc prevents the structural and functional properties of free radical treated-insulin. Biochim. Biophys. Acta (BBA)—Protein Struct. Mol. Enzym. 1994, 1209, 260–264. [Google Scholar] [CrossRef]
  58. Khan, S.A.; Khan, S.B.; Khan, L.U.; Farooq, A.; Akhtar, K.; Asiri, A.M. Fourier transform infrared spectroscopy: Fundamentals and application in functional groups and nanomaterials characterization. In Handbook of Materials Characterization; Springer: Berlin/Heidelberg, Germany, 2018; pp. 317–344. [Google Scholar]
  59. Bormashenko, E.; Bormashenko, Y.; Legchenkova, I.; Eren, N.M. Cold plasma hydrophilization of soy protein isolate and milk protein concentrate enables manufacturing of surfactant-free water suspensions. Part I: Hydrophilization of food powders using cold plasma. Innov. Food Sci. Emerg. Technol. 2021, 72, 102759. [Google Scholar] [CrossRef]
  60. Rich, S.A.; Leroy, P.; Dufour, T.; Wehbe, N.; Houssiau, L.; Reniers, F. In-depth diffusion of oxygen into LDPE exposed to an Ar-O2 atmospheric post-discharge: A complementary approach between AR-XPS and Tof-SIMS techniques. Surf. Interface Anal. 2014, 46, 164–174. [Google Scholar] [CrossRef] [Green Version]
  61. Zhang, Z.; Dalgleish, D.; Goff, H. Effect of pH and ionic strength on competitive protein adsorption to air/water interfaces in aqueous foams made with mixed milk proteins. Colloids Surfaces B Biointerfaces 2004, 34, 113–121. [Google Scholar] [CrossRef]
  62. Oehmigen, K.; Hähnel, M.; Brandenburg, R.; Wilke, C.; Weltmann, K.-D.; von Woedtke, T. The Role of Acidification for Antimicrobial Activity of Atmospheric Pressure Plasma in Liquids. Plasma Process. Polym. 2010, 7, 250–257. [Google Scholar] [CrossRef]
  63. Traylor, M.J.; Pavlovich, M.J.; Karim, S.; Hait, P.; Sakiyama, Y.; Clark, D.S.; Graves, D.B. Long-term antibacterial efficacy of air plasma-activated water. J. Phys. D Appl. Phys. 2011, 44, 472001. [Google Scholar] [CrossRef] [Green Version]
  64. Chen, Z.; Cheng, X.; Lin, L.; Keidar, M. Cold atmospheric plasma discharged in water and its potential use in cancer therapy. J. Phys. D Appl. Phys. 2016, 50, 15208. [Google Scholar] [CrossRef] [Green Version]
  65. Thirumdas, R.; Sarangapani, C.; Annapure, U.S. Cold Plasma: A novel Non-Thermal Technology for Food Processing. Food Biophys. 2015, 10, 1–11. [Google Scholar] [CrossRef]
  66. van Brunt, R.J.; Herron, J.T. Plasma chemical model for decomposition of SF6in a negative glow corona discharge. Phys. Scr. 1994, 9. [Google Scholar] [CrossRef] [Green Version]
  67. Esteghlal, S.; Gahruie, H.H.; Niakousari, M.; Barba, F.J.; Bekhit, A.E.-D.; Mallikarjunan, K.; Roohinejad, S. Bridging the Knowledge Gap for the Impact of Non-Thermal Processing on Proteins and Amino Acids. Foods 2019, 8, 262. [Google Scholar] [CrossRef] [Green Version]
  68. Nikmaram, N.; Keener, K.M. The effects of cold plasma technology on physical, nutritional, and sensory properties of milk and milk products. LWT 2021, 154, 112729. [Google Scholar] [CrossRef]
  69. Ulaganathan, V.; Retzlaff, I.; Won, J.; Gochev, G.; Gehin-Delval, C.; Leser, M.; Noskov, B.; Miller, R. β-Lactoglobulin adsorption layers at the water/air surface: 1. Adsorption kinetics and surface pressure isotherm: Effect of pH and ionic strength. Colloids Surfaces A Physicochem. Eng. Asp. 2016, 519, 153–160. [Google Scholar] [CrossRef]
  70. McClements, D.J.; Jafari, S.M. Improving emulsion formation, stability and performance using mixed emulsifiers: A review. Adv. Colloid Interface Sci. 2017, 251, 55–79. [Google Scholar] [CrossRef] [PubMed]
  71. Grossmann, L.; Beicht, M.; Reichert, C.; Weiss, J. Foaming properties of heat-aggregated microparticles from whey proteins. Colloids Surfaces A Physicochem. Eng. Asp. 2019, 579, 123572. [Google Scholar] [CrossRef]
  72. Olatunde, O.O.; Hewage, A.; Dissanayake, T.; Aluko, R.E.; Karaca, A.C.; Shang, N.; Bandara, N. Cold atmospheric plasma-induced protein modification: Novel nonthermal processing technology to improve protein quality, functionality, and allergenicity reduction. Compr. Rev. Food Sci. Food Saf. 2023, 22, 2197–2234. [Google Scholar] [CrossRef]
  73. Moosavi, M.H.; Khani, M.R.; Shokri, B.; Hosseini, S.M.; Shojaee-Aliabadi, S.; Mirmoghtadaie, L. Modifications of protein-based films using cold plasma. Int. J. Biol. Macromol. 2020, 142, 769–777. [Google Scholar] [CrossRef]
  74. Pankaj, S.; Bueno-Ferrer, C.; Misra, N.; O’Neill, L.; Tiwari, B.; Bourke, P.; Cullen, P. Dielectric barrier discharge atmospheric air plasma treatment of high amylose corn starch films. LWT 2015, 63, 1076–1082. [Google Scholar] [CrossRef]
Figure 1. Effect of VCP treatment on the carbonyl content and number of free sulfhydryl groups in the whey protein isolates (WPI) samples. (A): Protein carbonyl groups defined as absorbance of protein hydrazones at 370 nm (a. u.) as measured by spectrophotometry. (B): Free sulfhydryl groups (μM SH/g) as a function of the VCP treatment. All values represent the mean of 3 replicates. Columns with the same letter are not significantly different (p > 0.05). N: non-treated, AVCP: air plasma; ARAVCP: argon–air mixed plasma; SF6VCP: SF6 plasma.
Colloids 07 00054 g001
Figure 2. (A): Fluorescence spectra of tryptophan (a.u.) in 0.05 wt% WPI solutions after different VCP treatments, represented by fluorescence intensity (Fl) as a function of the emission wavelength (nm): (blue (N), red (AVCP), gray (ARAVCP), and yellow (SF6VCP)). (B): Surface hydrophobicity (a.u./gmL−1) measured using an ANS fluorescence probe for WPI solutions as a function of the VCP treatment. Values represent the means of 3 replicates. Columns marked with the same letter are not significantly different (p > 0.05).
Colloids 07 00054 g002
Figure 3. Vibrational IR-spectra of non-treated and VCP-treated WPI with different gases: blue (N), red (AVCP), gray (ARAVCP), and yellow (SF6VCP)).
Colloids 07 00054 g003
Figure 4. (A): Dynamic surface pressure Π(t) versus time. (B): Frequency dependence of real part of dilational modulus Er. (C): Surface dilational elasticity () and surface pressure () of a 0.01 wt% WPI solution at a frequency of 0.01 Hz after equilibration. (D): Adsorption layer thickness δ of a 0.1 wt% WPI solution after () 60 s and (Δ) 24 h, respectively.
Colloids 07 00054 g004
Figure 5. Contact angle of a sessile water drop positioned on the surface of a tablet formed from various WPI powder samples.
Colloids 07 00054 g005
Table 1. The mean size, polydispersity index (PDI), ζ-potential, and pH of WPI solutions.
Treatment* Size (nm)PDIζ-Potential (mV)pH
N230 0.3 ± 0.1 −27.9 ± 2.3 a6.6 a
AVCP300 0.4 ± 0.4 −29.46 ± 1.2 a6.5 a
ARAVCP390 0.4 ± 0.2 −26.7 ± 1.4 a6.2 b
SF6VCP2400 0.8 ± 0.2 +12.96 ± 0.4 b4.1 c
All values represent the mean of 3 replicates. Values with the same superscript in a column are not significantly different from each other (p > 0.05). * Analysis without quality criteria due to high polydispersity.
Disclaimer/Publisher’s Note: The statements, opinions and data contained in all publications are solely those of the individual author(s) and contributor(s) and not of MDPI and/or the editor(s). MDPI and/or the editor(s) disclaim responsibility for any injury to people or property resulting from any ideas, methods, instructions or products referred to in the content.

