Article

Influence of the Triglyceride Composition, Surfactant Concentration and Time–Temperature Conditions on the Particle Morphology in Dispersions

Karlsruhe Institute of Technology, Institute of Process Engineering in Life Sciences—Food Process Engineering, 76131 Karlsruhe, Germany
*
Author to whom correspondence should be addressed.
Colloids Interfaces 2023, 7(1), 22; https://doi.org/10.3390/colloids7010022
Submission received: 24 February 2023 / Revised: 9 March 2023 / Accepted: 13 March 2023 / Published: 17 March 2023
(This article belongs to the Special Issue Food Colloids II)

Abstract

:
Many applications for crystalline triglyceride-in-water dispersions exist in the life sciences and pharmaceutical industries. The main dispersion structures influencing product properties are the particle morphology and size distribution. These can be set by the formulation and process parameters, but temperature fluctuations may alter them afterwards. As the dispersed phase often consists of complex fats, there are many formulation variables influencing these product properties. In this study, we aimed to gain a better understanding of the influence of the dispersed-phase composition on the crystallization and melting behavior of these systems. We found that different particle morphologies can be obtained by varying the dispersed-phase composition. Droplets smaller than 1 µm were obtained after melting due to self-emulsification (SE), but these changes and coalescence events were only partly influenced by the melting range of the fat. With increasing surfactant concentration, the SE tendency increased. The smallest x50,3 of 3 µm was obtained with a surfactant concentration of 0.5 wt%. We attributed this to different mechanisms leading to the droplets’ breakup during melting, which we observed via thermo-optical microscopy. In addition, SE and coalescence are a function of the cooling and heating profiles. With slow heating (0.5 K/min), both phenomena are more pronounced, as the particles have more time to undergo the required mechanisms.

1. Introduction

Many products in the pharmaceutical and life sciences industries consist of emulsified triglycerides (TAGs) stabilized by short-chain surfactants [1,2,3,4]. These must remain stable for several months to years without losing their product functionality. The fat phase may consist of complex fats such as anhydrous milk fat (AMF) or cocoa butter (CB), pure TAGs or more defined mixtures thereof. AMF is composed of about 97% TAGs. The remaining 3% contains sterols, glycerophospholipids, fat-soluble vitamins, mono- and diacylglycerols, free fatty acids and flavor compounds. On average, milk fat consists of 4% lauric acid (C12:0), 9.5% myristic acid (C14:0), 26.3% palmitic acid (C16:0), 14.6% stearic acid (C18:0) and 29.8% oleic acid (C18:1) [5]. CB mainly consists of 26% palmitic acid (C16:0), 34% stearic acid (C18:0) and 35% oleic acid (C18:1) [6]. The fatty acid composition and their spatial distribution in triacylglycerols influence taste, smell and especially the melting and crystallization behavior of the fat. To obtain crystalline dispersions (crystallized fat in a liquid continuous phase), these fats are typically emulsified via hot emulsification at a temperature above their melting range. The emulsification step is applied to adjust the droplet size to the desired range, and afterwards, the product is cooled to crystallize the fat phase. Ideally, each droplet crystallizes in the original size and shape set by the chosen process parameters [7]. However, droplets can remain as supercooled liquid droplets or crystallize in different crystalline structures [4], and they can even break their shape symmetry crystallizing into non-spherical particles [8,9,10,11,12,13]. The resulting particle morphology and size greatly influence the dispersions’ physical stability against aggregation and creaming [14,15] as well as physicochemical properties such as mouthfeel and rheology [16]. Crystalline dispersions are thermodynamically unstable systems and can therefore undergo instability phenomena such as creaming, Ostwald ripening, phase inversion and partial or full coalescence [17,18]. Additionally, iso-mass recrystallization and polymorphic transitions may lead to morphological changes and alter the dispersion viscosity [16,19,20]. Temperature fluctuations exceeding the melting temperature of the dispersed phase may also alter the particle morphology and droplet size distribution [21]. Every change in particle size and distribution greatly influences the physical stability and may accelerate creaming and thus aggregation, leading to changes or the total loss of product characteristics and applicability [14,15]. To exploit or prevent these phenomena in order to increase the shelf-life of, e.g., milk fat crystalline dispersions, it is crucial to understand the underlying mechanisms and influencing parameters.
The crystallization of dispersed droplets is a stochastic and individual process, which differs from droplet to droplet and occurs over a wide temperature range [22,23]. Compared to bulk fat crystallization, higher supercooling is needed for droplet crystallization, which increases with decreasing droplet size [24,25]. In addition, TAGs are polymorphous, i.e., they crystallize in different modifications, whereby a distinction is generally made between α, β’ and β modifications. Depending on the hydrocarbon-chain packing of the polymorphic form, these can be in double- or triple-layer lamellar structures [26]. In an emulsion, the polymorphic transitions occur faster than in bulk, and their course may be altered [27,28,29]. One reason for the different transition behavior between bulk and emulsion is the different nucleation mechanisms of the systems [30]. Different proportions of α, β’ and β forms are found in emulsions, depending on the applied cooling rate, supercooling and droplet size [4,19,31]. Additionally, the molecular structure of the TAG and the surfactant can play an important role [32,33,34]. Nanometer-sized solid triacylglycerol particles are also known to change their shape from spherical to ellipsoid or other platelets due to polymorphic transitions, or even solidify in ellipsoid shapes when crystallizing directly into ß polymorphs [19,35].
Products consisting of emulsified and crystallized triacylglycerols or milk fat with a long shelf-life are not necessarily refrigerated during storage and transport, exposing the product to temperature fluctuations potentially exceeding the melting range of some fat fractions or the complete fat phase. Here, crucial instability phenomena such as partial coalescence and complete coalescence are promoted [15,36]. Partial coalescence occurs when solid particles are present in the dispersed phase. When a few crystals protrude from a particle into the continuous phase, they can pierce the interfacial layer of another partially crystalline particle or liquid oil droplet upon collision. Thus, a network of particles may be formed. Upon melting, these networks fully coalesce to one big oil droplet. Furthermore, the spontaneous disintegration of particles into smaller droplets by self-emulsification (SE) is possible [37]. SE has been reported to occur when crystalline dispersed triacylglycerols or alkanes are heated to temperatures above their melting point and even after some hours at isothermal conditions below the melting point of the triacylglycerols [38,39]. As we investigate possible phenomena during the melting of crystalline particles, the latter mechanism will not be considered and discussed further. In the case of alkanes, SE in form of platelet bursting, melt-crystal fragmentation and capillary instabilities due to self-shaping phenomena may occur [38,40]. Capillary instabilities were reported during the melting of long fibers, which are assumed to be the result of a Rayleigh–Plateau type of hydrodynamic instability. Platelet bursting occurs when very thin platelets start to melt, and the liquid film becomes too thin to be stable. This leads to film ruptures, which results in the formation of several smaller droplets. On the other hand, melt-crystal fragmentation describes the mechanism where flat platelets fragment into numerous small particles in the moment of their melting, which is believed to be controlled by the de-wetting of crystal domains from the just-molten lipid. In this mechanism, the newly formed droplets could be traced to the individual alkane crystal domains [40]. For triacylglycerols, SE by cold-burst was reported, which differs from platelet bursting and melt-crystal fragmentation. The underlying mechanism of cold-burst is believed to be caused by the emergence of void channels due to α → β recrystallization, which are then filled with the continuous phase and surfactant [39,41,42]. This leads to swelling of the particles, which can be observed microscopically, and then, upon further melting, to complete separation of the crystal domains into numerous small individual droplets. However, not every swelling event leads to SE; sometimes the crystal domains coalesce back together during melting, trapping some of the continuous phase in the droplets forming water-in-oil-in-water (W/O/W) double emulsions. It is believed that the formation of double emulsions or SE depends on the ability of the aqueous surfactant solution to wet the crystal domains of the solid particles forming void channels during melting [39,42]. Additionally, it was reported for complex fats that a broad melting temperature range is advantageous for SE. Upon heating, some regions inside the particle melt first and are ejected as small droplets from the mother droplet [39]. This is supposed to make the SE even more efficient. The majority of these (instability) phenomena result in changing particle sizes and/or morphologies and may occur in parallel during storage and transport while leading to superimposed effects influencing the product properties in both desirable and undesirable ways.
To date, less research has been conducted on emulsified triacylglycerol mixtures than in bulk mixtures [43]. The properties of these mixtures may differ greatly from the properties of their single components and their complexity still prohibits comprehension. It was shown that for some mixed-acid TAGs, β’ is the most stable crystal form and no β polymorph is formed [44]. As the proposed mechanism for SE is based on polymorphic transitions, we expect an influence of the fatty acid composition on crystallization and melting behavior of the dispersions, i.e., on SE and the stability against coalescence and partial coalescence. Additionally, as SE gets more efficient in complex fats with a broader melting temperature range [39], we expect that in binary mixtures of triacylglycerols, which have increasing differences in the carbon number (Cn) of their fatty acids, and thus a broader temperature range of melting, self-emulsification will be more pronounced. Furthermore, we assume that the surfactant concentration and temperature profile play important roles for the stabilization and destabilization of crystalline dispersions during temperature fluctuations. Thus, in this article, we assess the particle morphology and SE tendency of two complex fats, cocoa butter (CB) and anhydrous milk fat (AMF). The influence of the melting temperature range on crystallization and melting behavior, i.e., particle morphology and SE, respectively, was investigated using dispersed phases consisting of defined binary mixtures of TAGs. Furthermore, TAG droplets consisting of only one FA were used to correlate the surfactant concentration with particle swelling during melting and SE efficiency. Additionally, the SE and coalescence tendency were assessed as a function of the applied heating and cooling rate. The presented results may help generate a better understanding of possible instability mechanisms occurring in crystalline commercial fat dispersions, allowing manufacturers to increase the shelf-life of long-term stable products by adjusting their process or formulation.

2. Materials and Methods

2.1. Raw Materials

Glyceryl trilaurate (trilaurin, purity 98%), glyceryl tripalmitate (tripalmitin, purity 99%) and glyceryl trioleate (triolein, purity 99%) were purchased from Thermo Fisher Scientific Inc. (Waltham, MA, USA). Glyceryl trimyristate (trimyristin, purity 98%) and glyceryl tristearate (tristearin, purity 98%) were kindly provided by IOI Oleo GmbH (Hamburg, Germany). Melting temperatures (ϑmelt) of the pure TAGs are stated in Table 1. Anhydrous milk fat (AMF) and cocoa butter (CB) were purchased at a local grocery store. Polyoxyethylene-20-sorbitanmonolaurat (Tween® 20) was purchased from Carl Roth (Karlsruhe, Germany). Water was purified using a MicroPureTM water purification system by Thermo Fisher Scientific Inc. (Waltham, MA, USA).

2.2. Emulsion Preparation

During and after preparation, the dispersed phase consisted of fully molten TAGs. After crystallization, it is possible that part of the dispersed phase is still present as supercooled liquid droplets. Thus, prior to crystallization the systems are called “emulsions” and after crystallization, “dispersions”.
The samples consisted of 1 wt% dispersed phase, 0.5 wt% surfactant and 98.5 wt% purified water as the continuous phase if not stated otherwise. Mixed dispersed phases consisted of a 1:1 (wt:wt) mixture of two triacyclglycerols. In experiments with different surfactant concentrations (0.5 wt%, 0.25 wt% and 0.1 wt%), the dispersed phase was kept constant at 1 wt%. Emulsification was carried out via premix membrane emulsification to ensure a very narrow, monomodal droplet-size distribution (DSD). In cases where larger droplets were needed for better visualization of the occurring phenomena, rotor-stator homogenization was used.

2.2.1. Premix Membrane Emulsification

For premix membrane emulsification, the surfactant was dissolved in heated purified water at a temperature 10 K above the melting temperature of the dispersed phase (ϑmelt,DP) and then transferred to a disposable B.Braun Omnifix® syringe in a volume of 10 mL (B. Braun SE, Melsungen, Germany). The dispersed phase was molten at the same temperature and inserted into a second syringe. Both syringes were constantly kept at 10 K above ϑmelt,DP by the application of a hot air stream to prevent early crystallization. The syringes were connected with a Luer-Lock adapter and a pre-emulsion was produced by pushing the liquids five times back and forth between the syringes. Afterwards, a hydrophilic syringe filter was inserted between the syringes as illustrated in Figure 1.
Membrane melt emulsification (ϑ > ϑmelt,DP) was carried out by pushing the liquids back and forth between the syringes. To ensure a reproducible production, we used a pneumatic process with the customized apparatus as depicted in Figure 2. In pre-trials, the temperature of the liquid inside a syringe was monitored to determine the parameters of the hot air to keep the temperature for melt emulsification constantly at 10 K above ϑmelt,DP. Emulsions were produced using the hydrophilic Acrodisc® syringe filter with a pore size of 10 µm (Pall Corporation, New York, NY, USA), an inlet pressure of 1.5 bar and 6 passages through the membrane. The filter membrane consists of a hydrophilic acrylic copolymer on a nonwoven support with a diameter of 25 mm and an effective filtration area of 3.9 cm2. After the emulsification, all samples were kept at 10 K above ϑmelt,DP until further analysis to prevent early crystallization.

2.2.2. Rotor-Stator Emulsification

For better visualization of AMF particle melting, emulsions with larger droplets were produced by rotor-stator homogenization. The process was executed at 10 K above ϑmelt,DP, analogous to membrane emulsification. Homogenization was carried out with a tooth-rim dispersing machine (IKA® T25 digital, ULTRA-TURRAX®, Staufen im Breisgau, Germany) at 2.3 m/s tangential speed (3400 rpm, 13 mm rotor outer diameter) for 10 min in the closed-loop operation mode.

2.3. Characterization of Crystallization and Melting Behavior

In general, droplet crystallization and melting were investigated at a constant cooling/heating rate of 0.5 K/min in the temperature range from 10 K above the melting temperature of the TAG to 0 °C. Samples consisting of binary mixtures were heated to 10 K above the melting temperature of the higher melting fraction. Systems with pure trilaurin (L) as the dispersed phase were additionally treated with different combinations of slow and fast cooling rates. Table 2 shows the different cooling and heating procedures applied to emulsions in detail.
Droplet crystallization and melting behavior were observed thermo-optically by means of a polarization microscope (Eclipse LV100ND, Nikon, Shinagawa, Tokyo, Japan) equipped with an optically accessible temperature-controlled stage (LTS 420, Linkam Scientific, Tadworth, UK), where liquid and crystalized phases can be distinguished by different colors. Sample preparation was carried out according to Abramov et al. [44]. In short, 25 µL of emulsion was pipetted between two microscope cover glasses glued onto a microscope object slide and covered with a third cover glass. The object slides and cover glasses were tempered to ensure no crystallization occurred prior to thermo-optical analysis. During the thermo-optical cooling procedure, the number-based crystallization index CIN for triacylglycerol mixtures was determined as a function of temperature/supercooling according to Abramov et al. [44]. The crystallization index is defined as the relation of the number of crystallized droplets, named particles (Np), to the total number of droplets and particles (Nd + Np):
C I N = number   of   particles total   number   of   droplets   and   particles   = N p N d + N p
At CIN = 0, all particles are liquid; at CIN = 1, all particles are crystalline.
Changes in the droplet size distribution due to crystallization and melting of the particles were investigated in a bulk sample and measured by laser diffraction (see below). For the application of time–temperature profiles, a temperature controlled double-gap geometry (Physica MCR 301, Anton Paar Germany GmbH, Ostfildern-Scharnhausen, Germany) was used with a sample volume of 3.8 mL. The geometry was chosen to ensure fast uniform tempering of the sample, which was collected afterwards for DSD measurements.

2.4. Laser Diffraction Analysis

The DSD of emulsions directly after preparation and after thermal treatment was determined by laser diffraction particle analysis (HORIBA LA-940, Retsch Technology, Haan, Germany) in a stirred fraction cell. The refractive index used was 1.44 + 0.000i. No sample dilution was necessary for the measurements.

2.5. DSD Analysis

The particle size distributions are stated either as the cumulative volume size distribution Q0(x) or Q3(x). The size distribution Q0(x) is based on the particle count, whereas Q3(x) is based on the particle volume. In cases where changes to the small particles, i.e., a shift to smaller particles due to SE, was particularly of interest, the number-based size distribution Q0(x) was chosen. Q3(x) was selected when both shifts to smaller and larger particles were of interest, i.e., to also detect possible coalescence events. As a measure of the smallest and biggest particle sizes in the collectives, x ¯ 10 , 3 , x ¯ 50 , 3 and x ¯ 90 , 3 percentiles were determined. The x10,3 (x50,3 or x90,3) is defined as the volume-based diameter of a sphere, at which 10% (50% or 90%) of the measured particles are smaller.

2.6. Statistical Analysis

All samples were prepared at least three times independently. All tests were performed at least three times, if not stated otherwise. Uncertainty was calculated using Origin 2022b (OriginLab Corporation, Northampton, MA, USA) and is expressed as standard deviation.

3. Results and Discussion

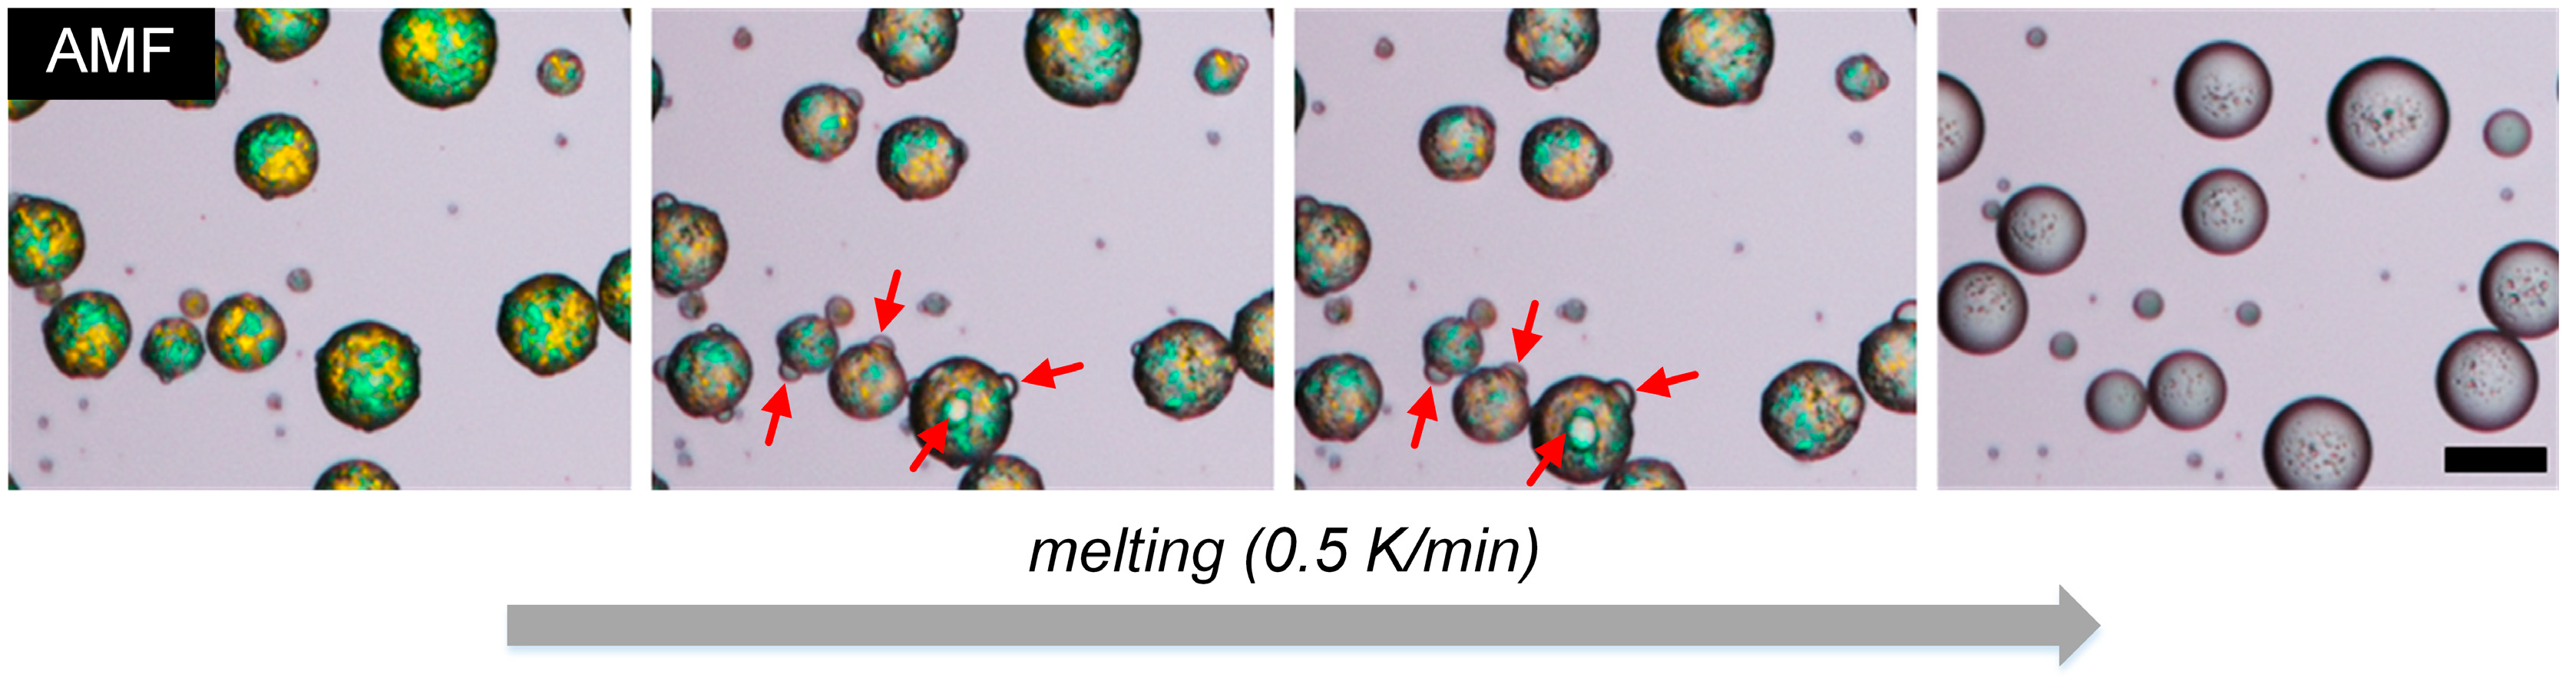
3.1. Crystallization and Melting Behavior of CB and AMF

The cumulative sum distribution Q0(x) of CB and AMF emulsions directly after preparation and after crystallization and melting are depicted in Figure 3. The initial AMF particles directly after emulsification are slightly smaller than CB particles. This difference may be the result of viscosity differences between AMF and CB or the overall dispersion stability to coalescence. In CB samples, smaller droplets, compared with the original droplet size (see Figure 3a), were measured after temperature treatment, indicating some form of droplet disintegration during melting. In contrast, a shift to larger droplets compared to the initial sample was observed in the DSD of AMF samples. The larger droplets most likely are the result of cluster formation due to partial coalescence and aggregation and then full coalescence upon melting. However, the change in DSD is less pronounced than the change in DSD with CB as the dispersed phase. It is likely that the effects leading to a decrease and the effects leading to an increase in DSD superimpose each other in this case. Additionally, no mechanisms leading to a decrease in droplet size might occur in this sample. This might explain the slight overlap of the curves in Figure 3b.
To gain a better understanding of the underlying mechanisms, the particle morphology obtained after slow cooling to 0 °C and the melting behavior (0.5 K/min) were visualized thermo-optically. The corresponding microscopic images obtained after cooling are depicted in Figure 4.
In both emulsions, we observed full crystallization, which means all visible particles appeared green. All CB droplets underwent self-shaping, as reported for different dispersed phases such as n-alkanes and TAGs [8,11]. During cooling, the droplets spontaneously break their shape symmetry until crystallizing mainly as icosahedra. Only some self-shaping of droplets to icosahedra was observed in AMF samples; most particles crystallized in spherical shapes. It was shown that self-shaping requires a frozen monolayer of surfactants at the droplet interface, which forms at a temperature above the fats’ bulk melting point [11,12,13]. As CB and AMF both are complex fats consisting of different fatty acids, they also differ in their melting behavior [5,6]. Therefore, the crystallization of Tween® 20 did not occur at high enough temperatures to induce AMF self-shaping. A different surfactant may be able to provide the necessary frozen monolayer and lead to self-shaping of all AMF droplets.
During the melting of CB particles, previously reported melt-crystal fragmentation [38,40] was observed by means of thermo-optical imaging (data not shown). Here, non-spherical platelets fragmented into numerous small droplets during melting, which is one possible mechanism leading to SE. This explains the shift in DSD to smaller droplets after crystallization and melting. AMF particles showed a very different melting behavior. Little droplets formed at the interface of most particles with rising temperature. This phenomenon occurred independently of the particle size. For better visualization, this is depicted for larger particles in Figure 5.
The formation of droplets at the interface started when the particles were still partly crystalline. These small drops are apparently liquid, as they appear grey transparent under the polarized microscope. They are slowly ejected from the inside of each particle and grow larger (cf. Figure 5; red arrows). Upon further melting, the droplets were not completely ejected but coalesced back with the mother particle, resulting in one oil droplet of its initial size. This explains why no formation of smaller droplets was detected in DSD measurements, as no extensive SE was observed. Additional to this mechanism, some partial and full coalescence events were observed, explaining the small shift to larger droplets after crystallization and melting. These observations explain the overlap of DSD distributions before and after crystallization and melting of AMF samples.
The investigated samples only differed in their dispersed-phase composition, while the process and initial DSD were the same. This clearly shows that the composition of the dispersed phase greatly influences the particle morphology during cooling, as well as the melting behavior and changes in DSD. In this case, the difference in melting behavior is clearly a result of the difference in particle morphology. The CB platelets are very thin and flat compared with the spherical AMF particles. Upon melting, this thin platelet becomes (partly) liquid, and this unstable film is prone to destabilization. However, the composition of both fats is very complex. Therefore, we next performed experiments in which we systematically the dispersed-phase composition to investigate the influence of TAG composition on the crystallization and melting behavior of emulsified fats in more detail.

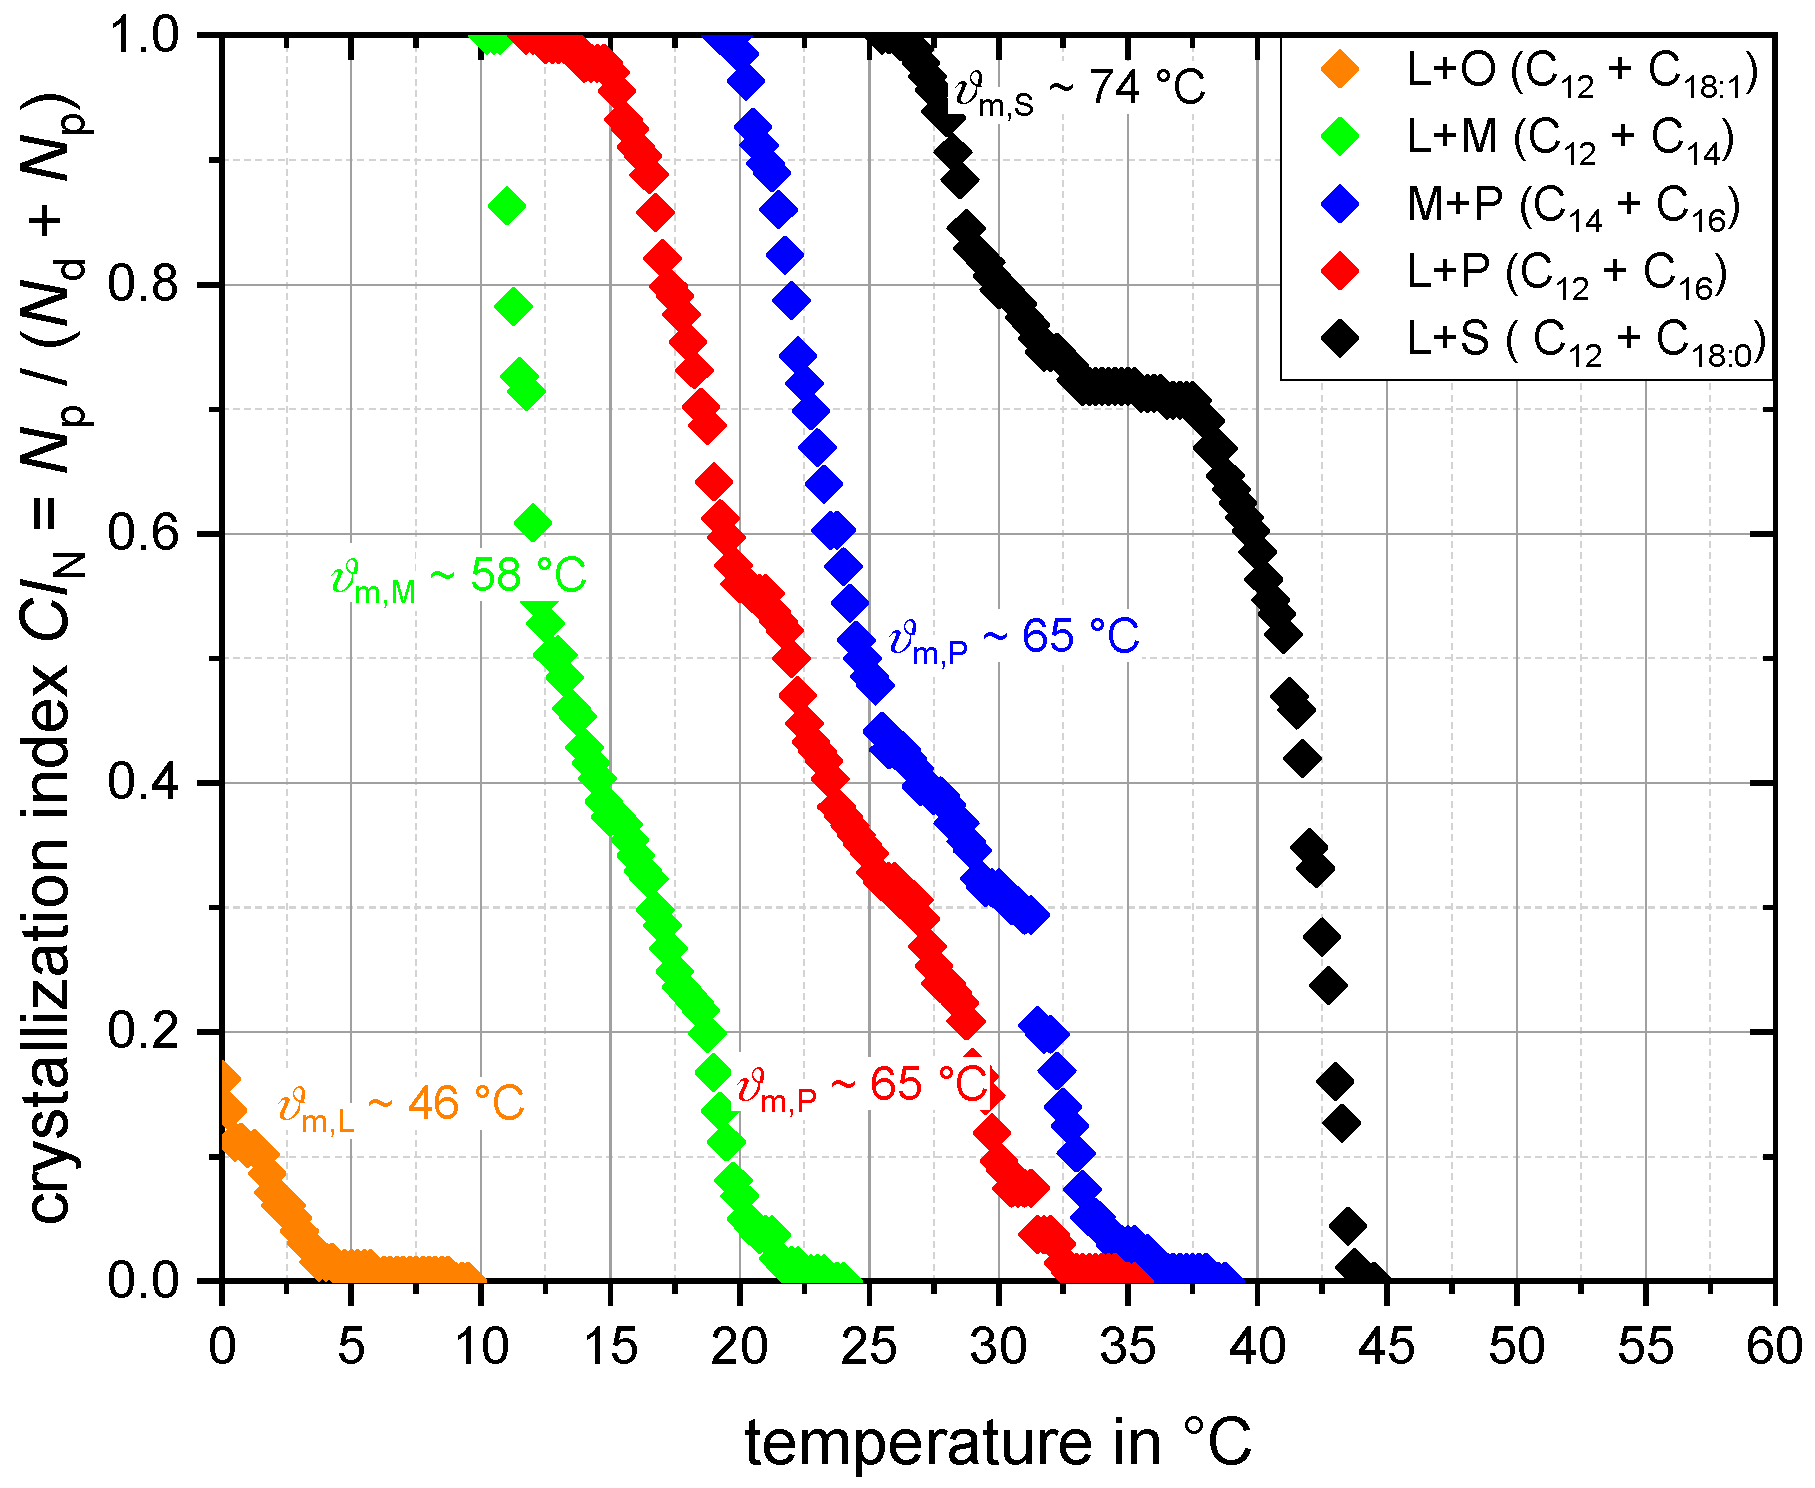
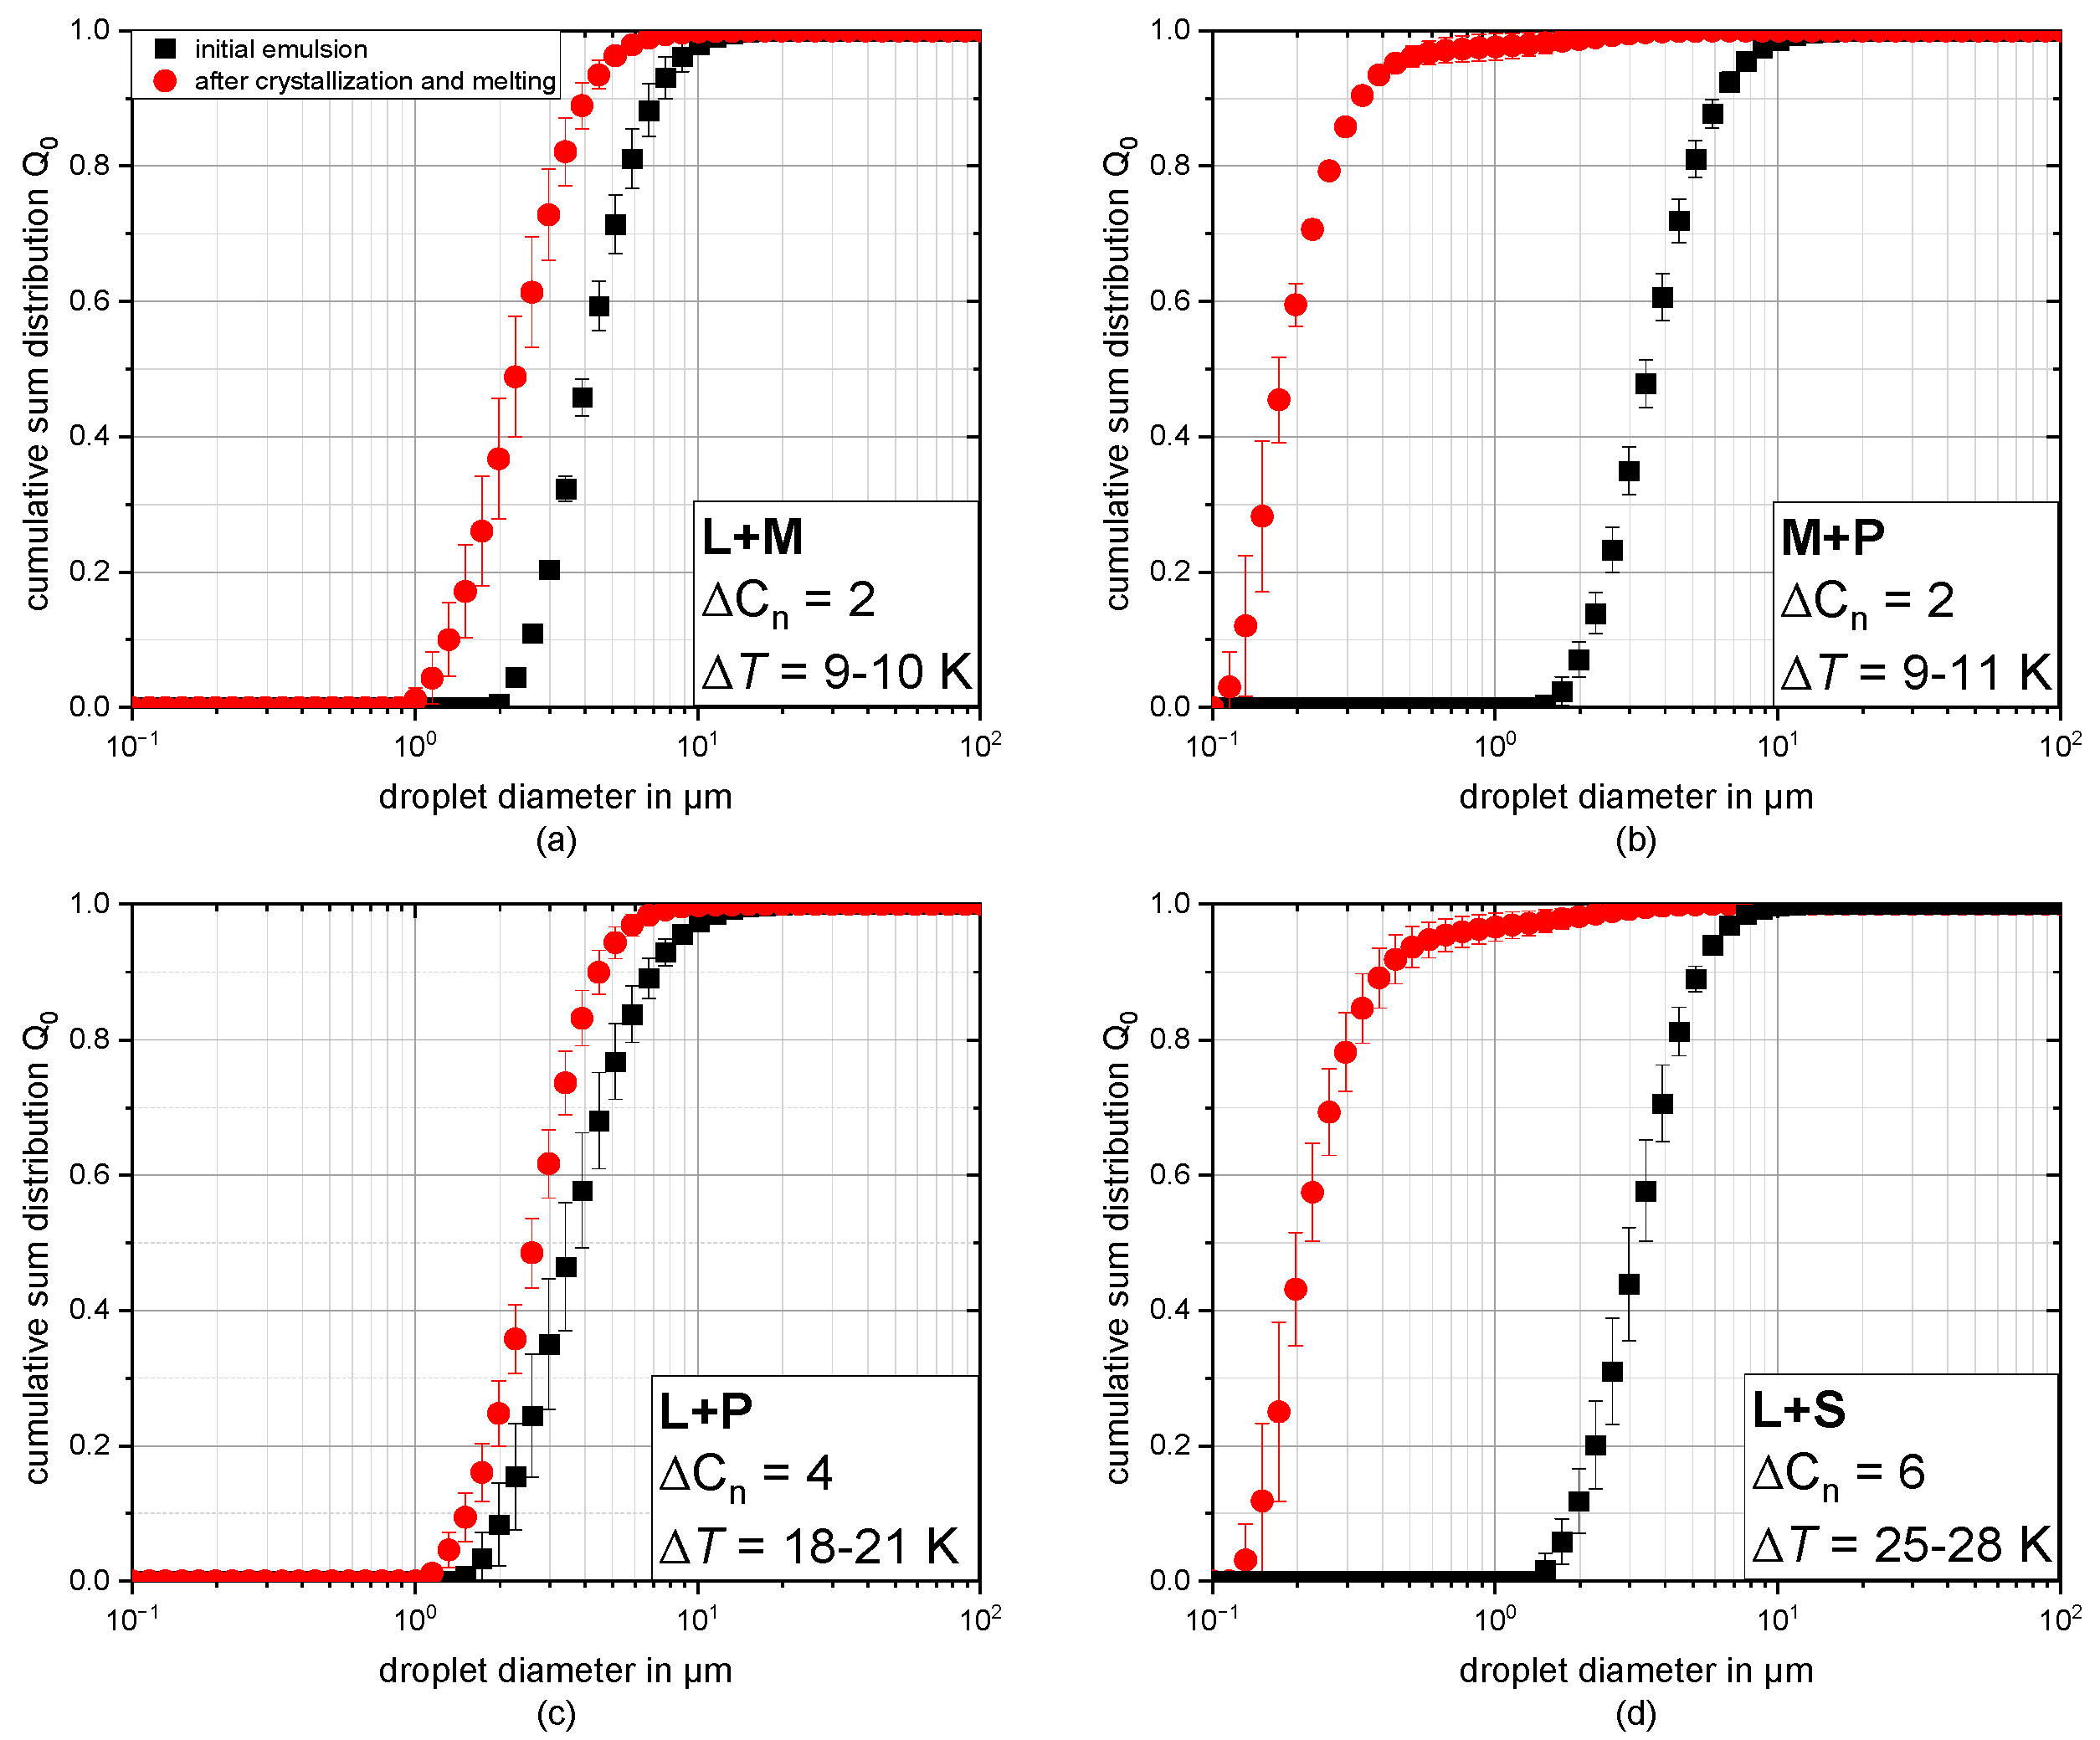
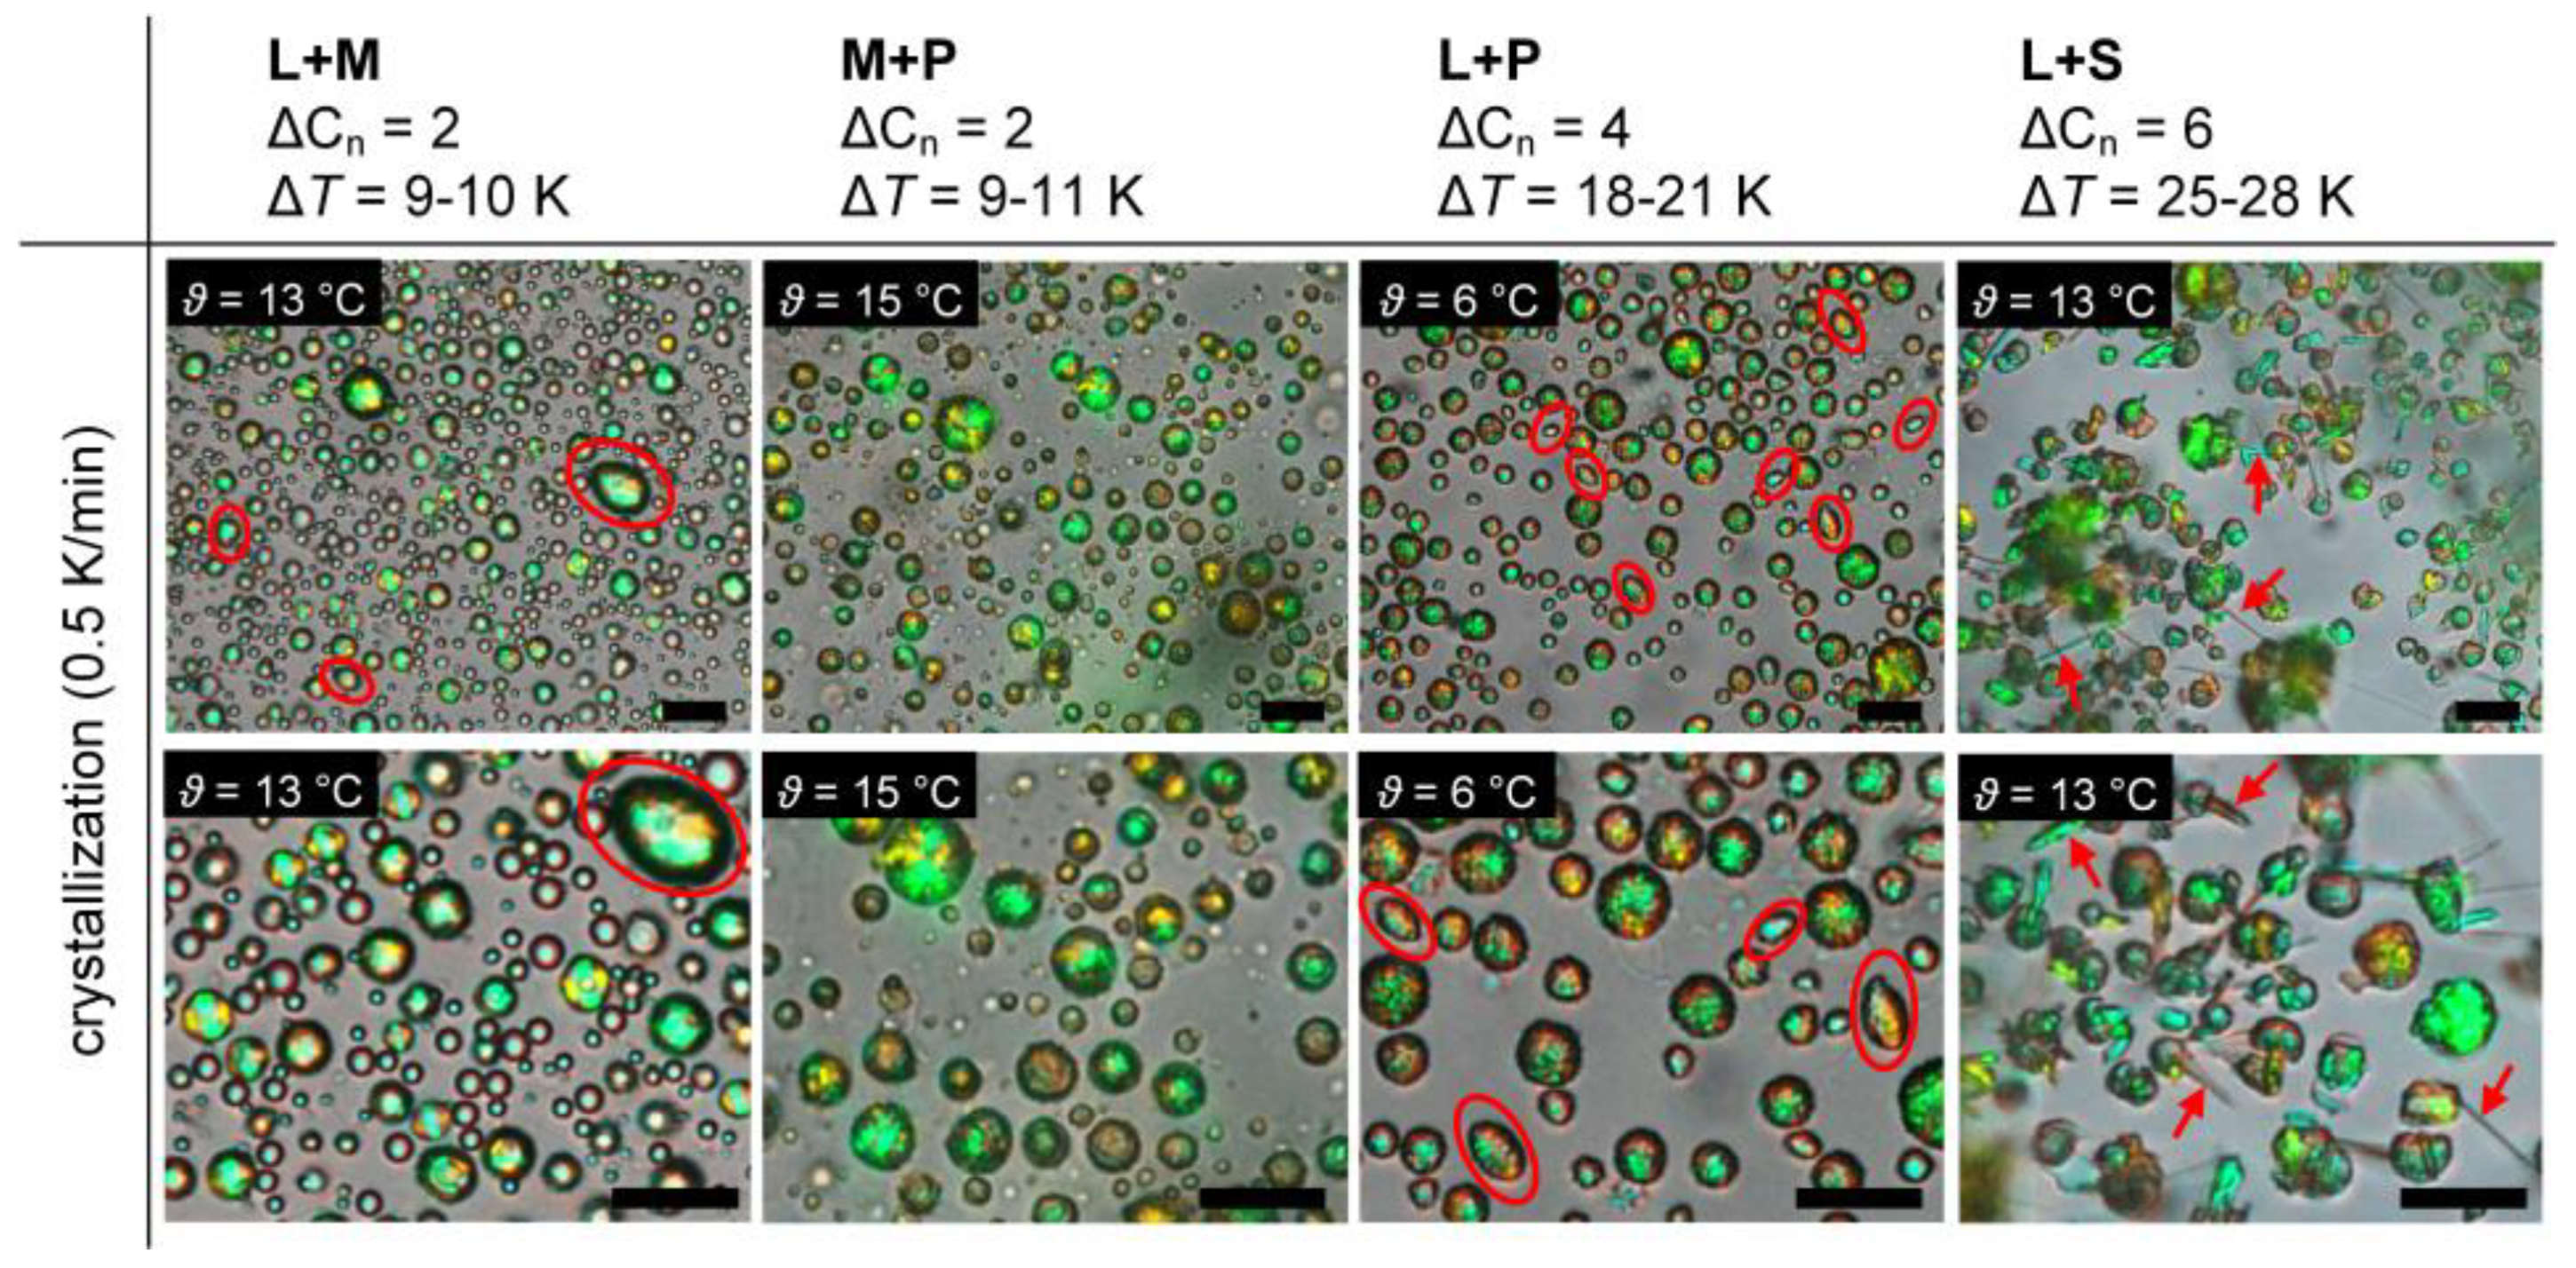
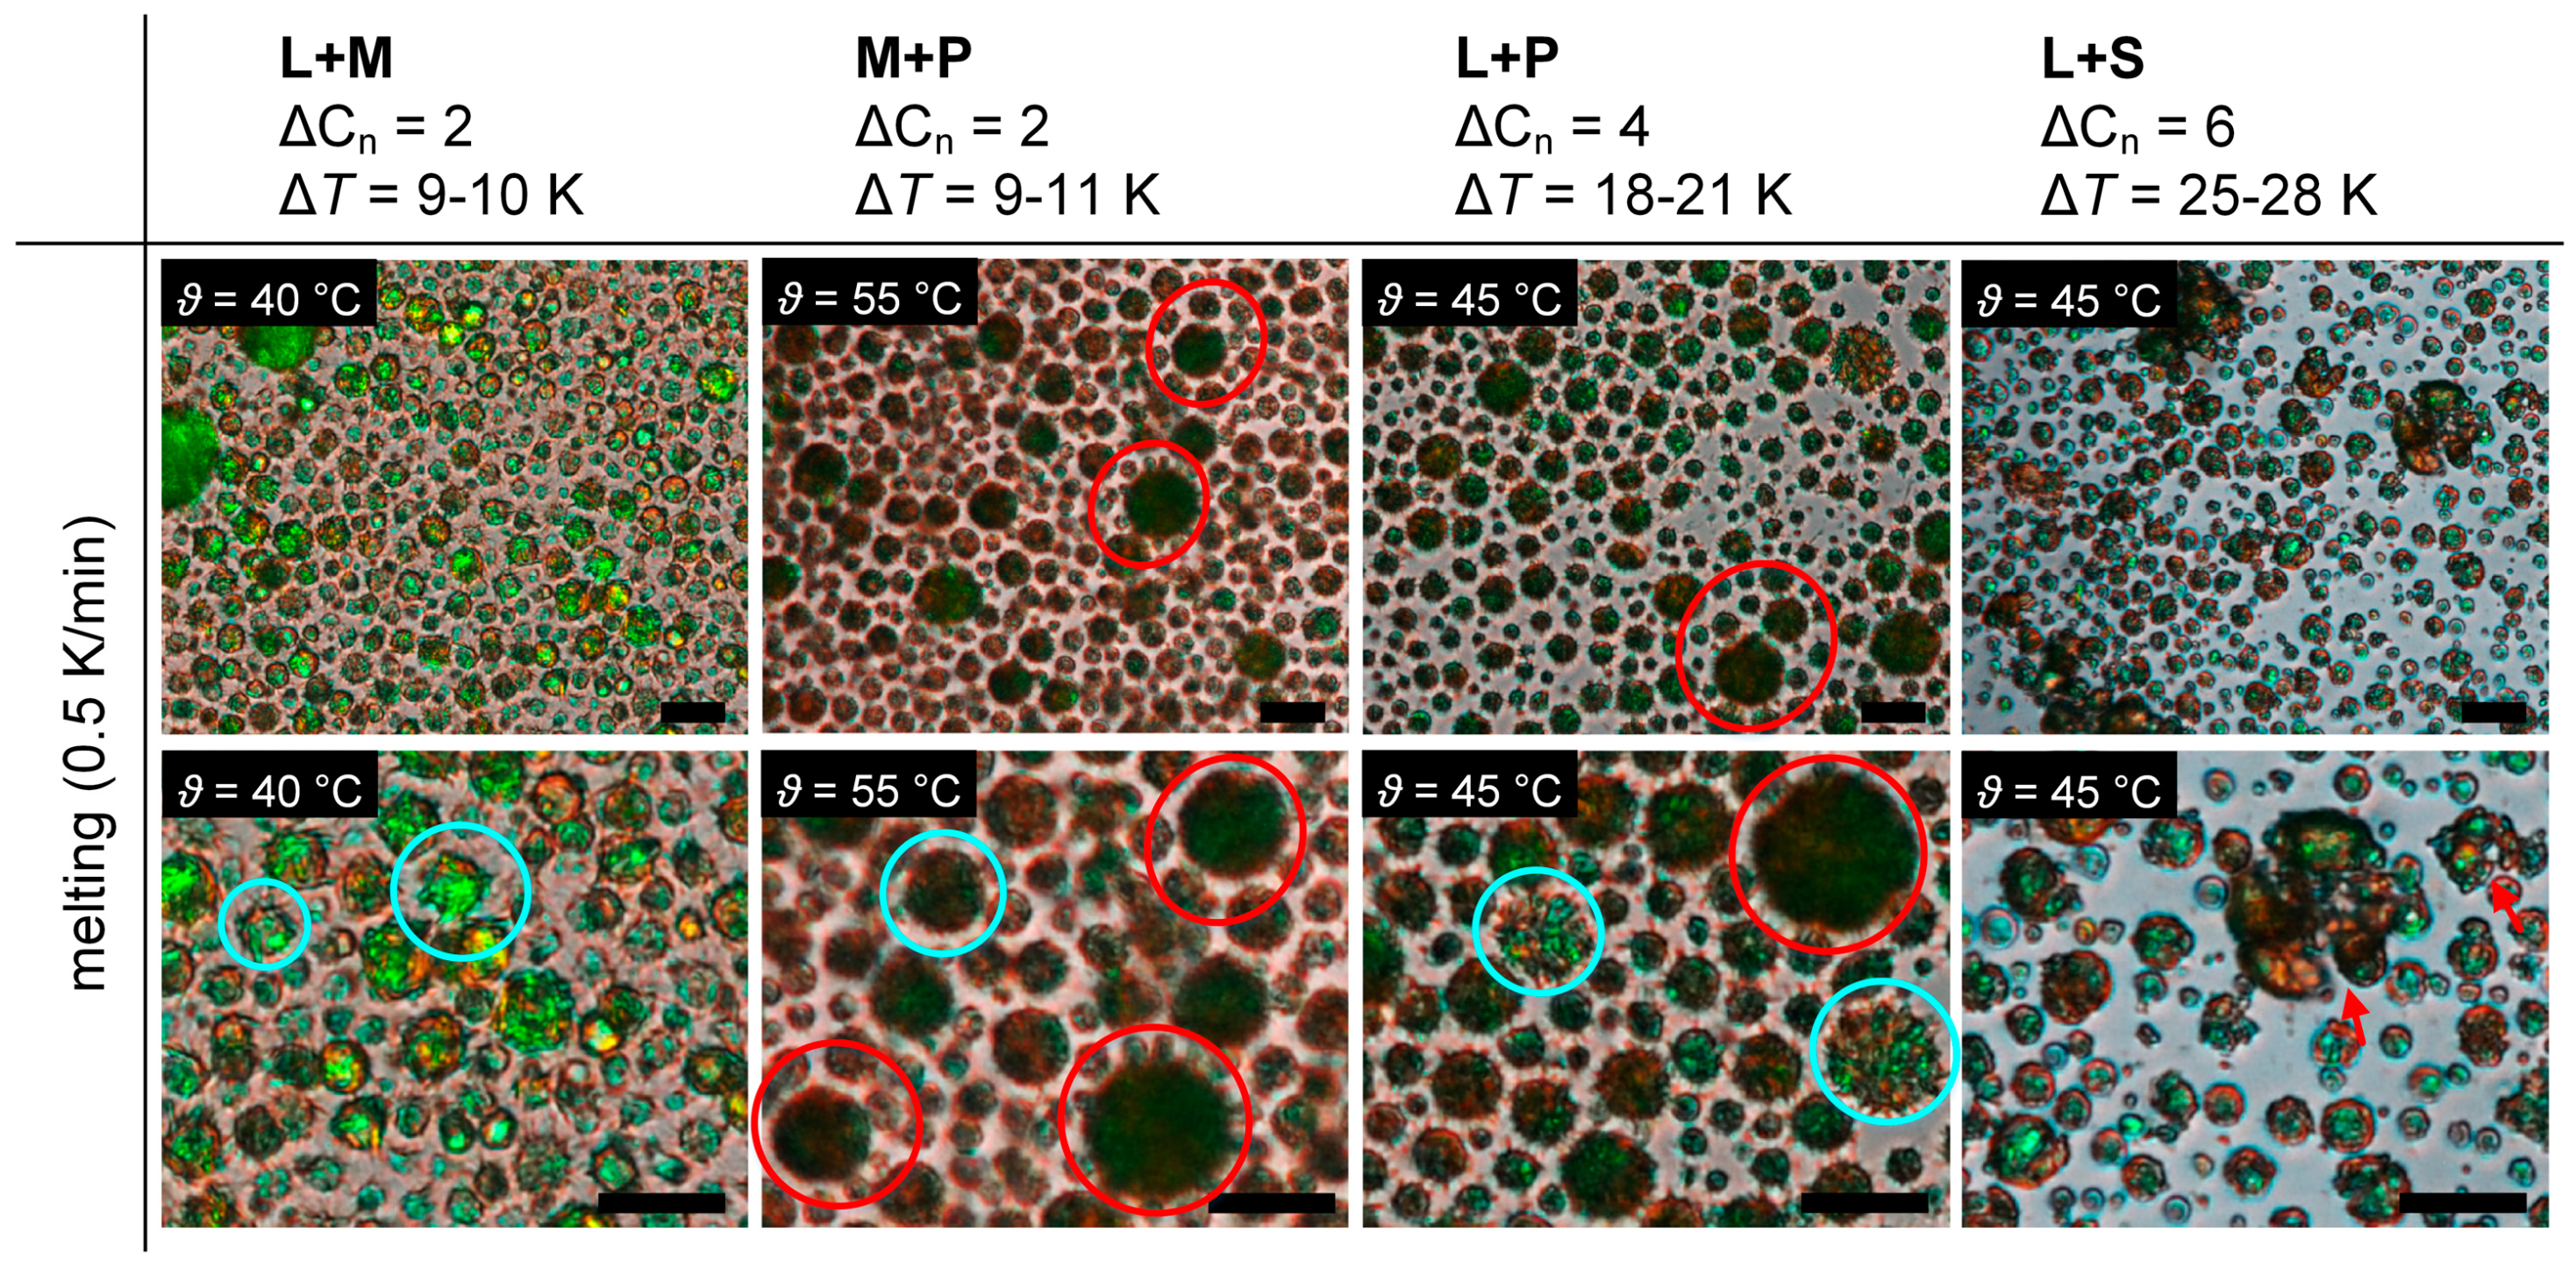
3.2. Dependence of Crystallization and Melting Behavior of Emulsified TAGs on Dispersed-Phase Composition

The nucleation and crystallization behavior of TAGs can greatly differ depending ontheir composition. Therefore, we assessed the dependence of crystallinity on the dispersed TAG composition during cooling. The crystallization index (CIN) as a function of temperature is depicted in Figure 6. With decreasing temperature, i.e., increasing supercooling, the number of crystalline particles increases. A crystallization index of CIN = 1 was reached in all samples except for the mixture trilaurin + triolein (L+O).
In all cases, comparably high supercooling was needed for the crystallization. As expected, with increasing melting temperature of a TAG used and increasing carbon number Cn of their respective TAGs, the crystallization started at higher temperatures. Droplets consisting of L+S, the mixture containing the highest melting TAG, started crystallizing around 44 °C, which is approximately 30 K below ϑmelt,S. The CIN reaches a plateau around 37 °C and increases again around 32 °C. We assume that the two regimes in this curve correlate with the crystallization of the two TAG fractions. Such a plateau was not observed for the other dispersed-phase compositions. Surprisingly, systems with L+M and L+P are fully crystallized at approximately the same temperature, 12 °C and 11 °C, respectively. This is the case even though the crystallization of L+P started around 33 °C, whereas the crystallization of L+M started 10 K lower, at around 22 °C. As ϑmelt,P is 9–11 K higher than ϑmelt,M (cf. Table 1), we expected full crystallization of L+M at lower temperatures. Fatty acids in L+M only differ by two carbons, and miscible phase behavior was reported for metastable α and β’ forms, while β polymorphs even exhibited eutectic phases [45]. This could be the reason for a faster and more uniform crystallization in these mixtures. In L+O samples, only 20% of droplets crystallized, even though 50% of the dispersed phase consisted of a TAG with a melting point of 47 °C. Cooling to 0 °C did not provide enough supercooling for crystallization. The fact that less than 50% of droplets crystallized indicates an inhibitory effect of triolein on the trilaurin nucleation and crystallization that exceeds a dilutional effect. Similar behavior was found in mixtures of sunflower oil and a high-melting milkfat fraction, where sunflower oil inhibition of milkfat nucleation was suggested to be primarily caused by true inhibition, rather than by a decrease in the driving force for crystallization [46]. Due to the low crystallinity, this sample was not included in further experiments. All samples where full crystallization was observed were molten, and changes in DSD were quantified.
The cumulative size distributions Q0(x) for varying dispersed-phase compositions are depicted in Figure 7. Black squares represent the initial emulsion directly after preparation; red circles represent the emulsion after full crystallization and melting.
The Q0(x) distribution was shifted to smaller droplets in all cases after melting. It has been reported that in particles with a broad melting temperature range, SE is more efficient due to the co-existence of solid lipids and melted oil [39]. Thus, we expected a shift to smaller droplet sizes in binary mixtures, with a broader melting range (larger difference in carbon number Cn). In our experiments, the SE efficiency was largest for the binary mixture L+S (∆Cn = 6) with the largest melting temperature range, compared with L+M (∆Cn = 2) and L+P (∆Cn = 4). However, comparably small droplets were also obtained in dispersions consisting of M+P (∆Cn = 2), where the melting range is much smaller compared to L+S. Additionally, the difference in melting temperature (∆T), and thus, melting range does not significantly differ between M+P (∆T = 9–11 K) and L+M (∆T = 9–10 K); only the absolute values vary. According to the assumption that the melting range influences the SE efficiency, similar droplet sizes should be obtained for these samples. However, much smaller droplets were obtained with M+P compared to L+M, so there must be another reason for the SE efficiency in this case.
To gain a better understanding and possible explanation for these results, the crystallization and melting behavior were assessed thermo-optically. The particle morphology after crystallization is depicted in Figure 8. The samples consisting of either L+M (∆Cn = 2) or M+P (∆Cn = 2) as the dispersed phase mainly crystallized in almost spherical shapes with smooth particle surfaces. Most particles consisting of L+P (∆Cn = 4) were spherical, with more irregular surfaces compared with L+M and M+P. Additionally, some self-shaping to ellipsoidal particles was observed, especially for L+M and L+P (cf. Figure 8; red ellipses). The ellipsoidal deformation started after crystallization within the droplet. We assume that the crystal growth itself led to the deformation of spheres to ellipsoids. However, no self-shaping to polygonal platelets as observed for CB (cf. Figure 4) and as previously reported for linear alkanes and some TAGs [47,48,49] was found.
Samples consisting of L+S (∆Cn = 6) as the dispersed phase showed a significantly different behavior than the rest of the samples. First, droplets started crystallizing in spherical shapes at 44–45 °C. With decreasing temperature, more droplets crystallized. At approximately 36–37 °C, where the CIN reaches its plateau, the growth of sharp crystals protruding the particle surface (cf. Figure 8; red arrows) and the burst of spherical particles into non-spherical, irregular particles were observed (see Figure A1). Some of these irregular particles even divided into two or more. Compared with the other binary mixtures, very irregular shapes were obtained with L+S.
For binary mixtures of bulk TAGs, where Cn of FAs differed by four and six (L+P, L+S), immiscible mixtures of all polymorphic forms were reported [47]. The reason for this might be the irregularity of methyl-end packing in the binary mixtures. The irregularity, and thus incompatibility, of TAGs may even increase with an increasing difference in carbon number. This can be one reason for the irregular surfaces in L+P particles and the break-up of sphericity in L+S particles. Here, the polymorphs of the single TAGs might not be able to stack properly to thus fit in the prior adjusted droplet volume. In contrast, where there is a difference of two carbons (as in L+M and M+P), miscible phase behavior was reported for metastable α and β’ forms, and even eutectic phases for β polymorph were observed [47]. This might be the reason for the smooth surfaces and mostly spherical particles we observed in the L+M and M+P systems.
After crystallization, we observed the melting behavior of the dispersed particles of the TAG mixtures, which is depicted in Figure 9.
In all samples, small sharp crystals were visible at the particle interface during melting, especially in L+P dispersions (cf. Figure 9; blue circles). Some particle swelling occurred in L+P samples and was most pronounced for M+P particles (cf. Figure 9; red circles). In some cases, swelling of the particles then led to disintegration of larger particles into smaller droplets, especially in M+P samples. Particles consisting of L+P mostly did not disintegrate during melting. L+S particles only showed some swelling, which was even less pronounced in L+M samples. This is in good accordance with DSD measurements, where the smallest droplets were observed after melting of M+P particles. However, systems consisting of L+S exhibited a similar shift in DSD, even though swelling and the resulting disintegration only occurred to a small extent. As L+S droplets exhibited different crystallization behavior compared to the other samples, the total loss of particle sphericity and particle break-up during crystallization (cf. Figure 9; red arrows) may be the reason for the formation of smaller droplets in this case.

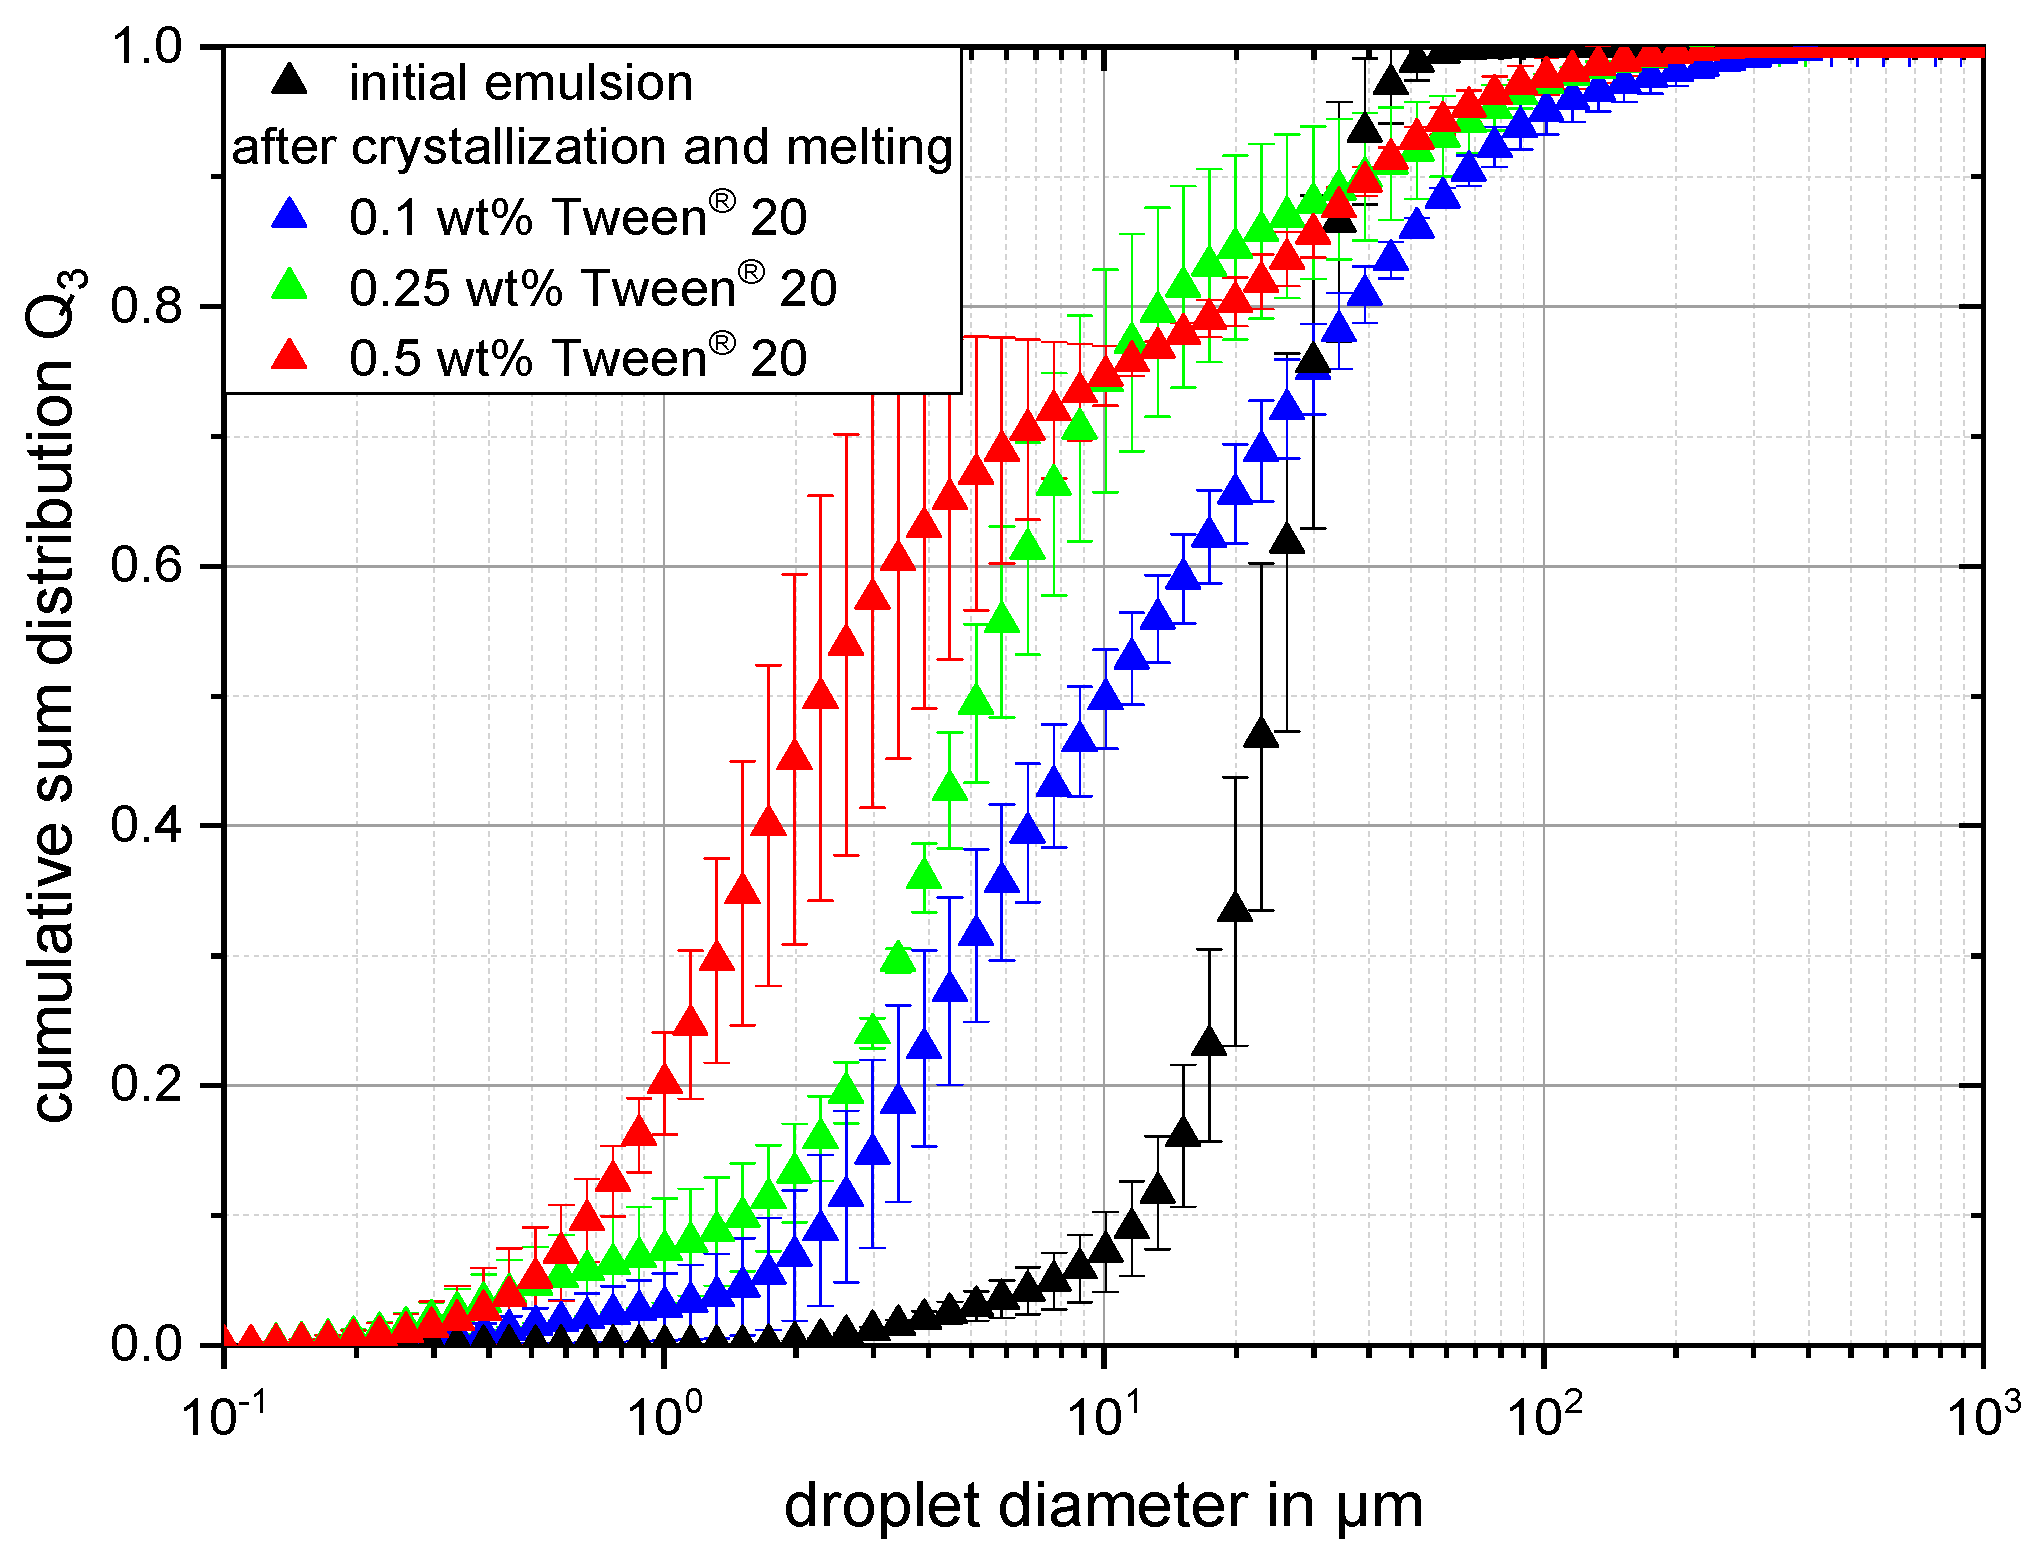
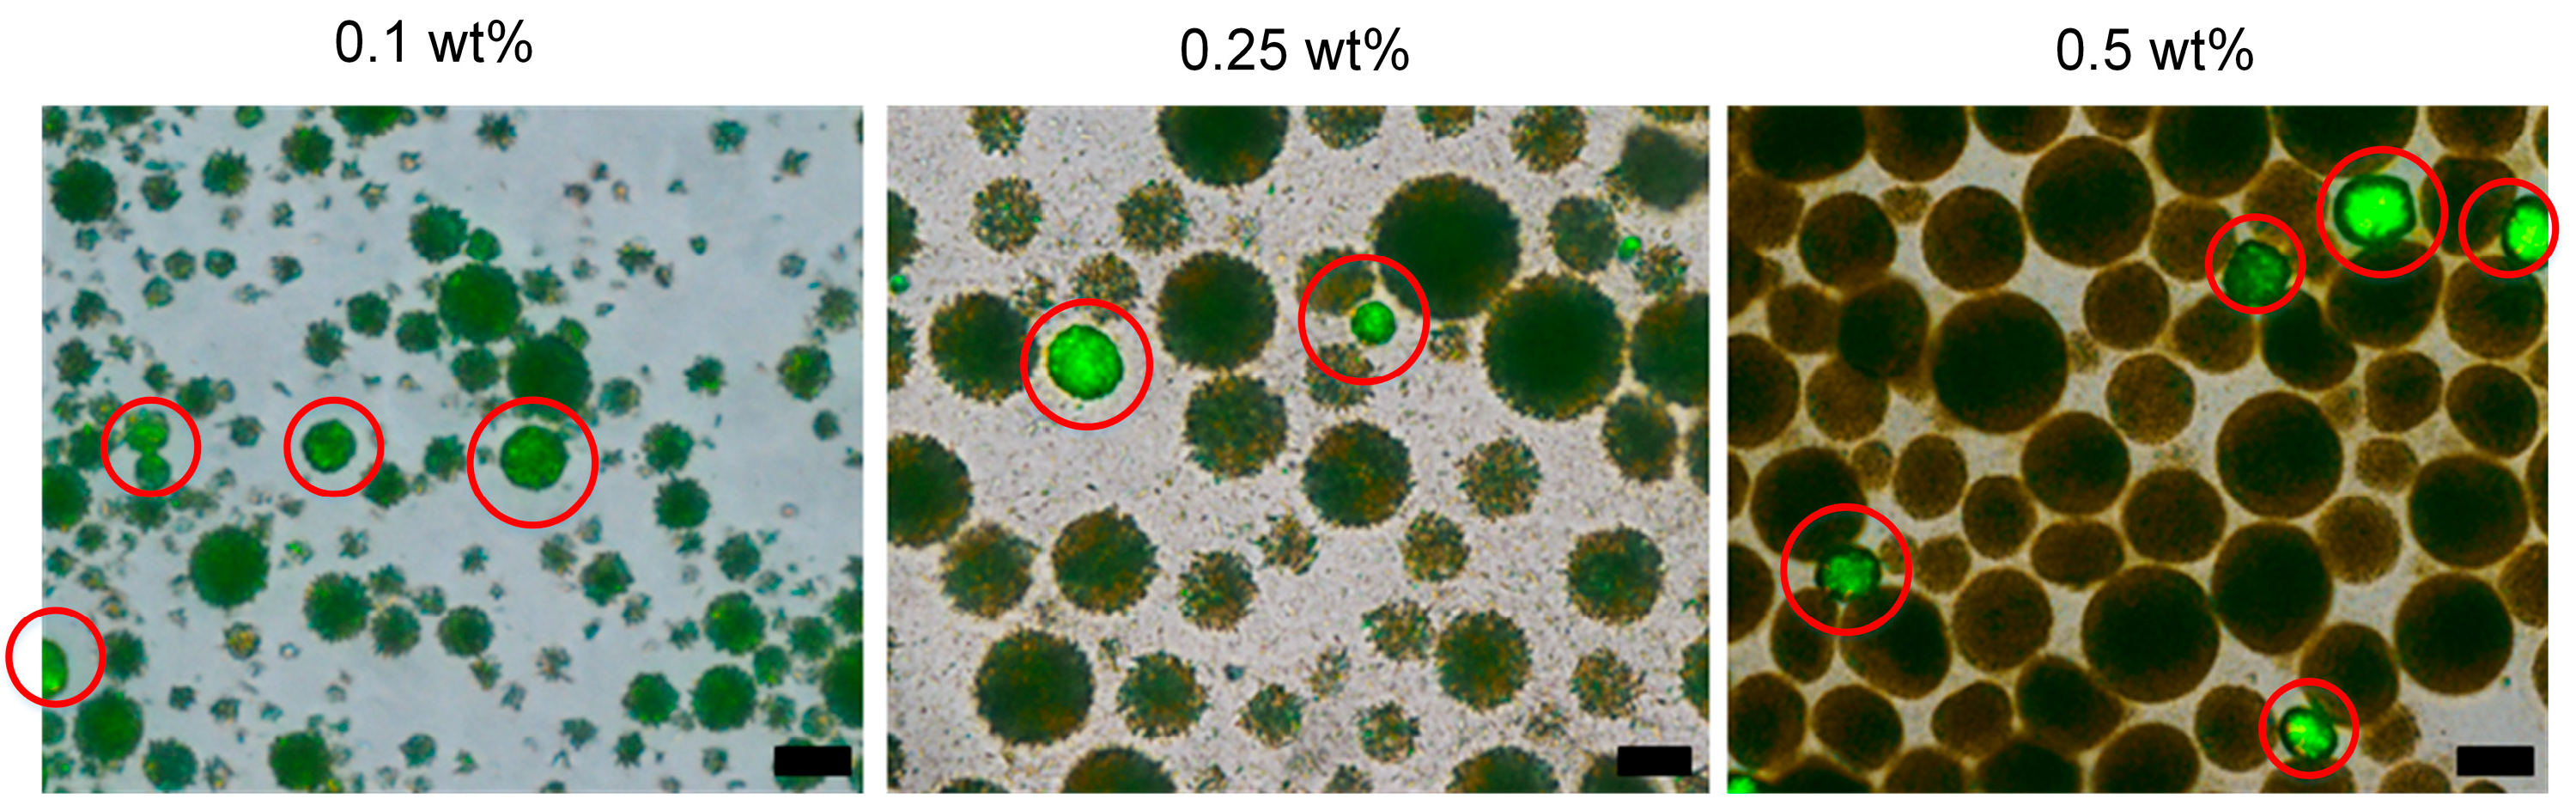
3.3. Influence of Surfactant Concentration on the Change of Droplet Size Distribution after Crystallization and Melting of Dispersed Trilaurin

Besides the dispersed-phase composition, the surfactant type and concentration greatly influence the particle morphology [9,11,21]. Therefore, we expect a difference in the melting behavior and change in DSD with different Tween® 20 concentrations. While SE was expected in all cases, coalescence was expected to increase with decreasing Tween® 20 concentration. The cumulative volume size distributions Q3(x) of droplets in the initial emulsion and after full crystallization and melting in relation to surfactant concentration are depicted in Figure 10. DSD changes occurred for all investigated Tween® 20 concentrations. The distribution of the initial emulsion was narrow and monomodal (Figure 10; black triangle), whereas the distributions after crystallization and melting are much broader and multimodal (Figure 10; blue, green and red triangles).
First, a shift to larger droplets (up to 200 µm) occurred in all samples. The increase in droplet size upon melting most probably results from the coalescence of single particles or of particle agglomerates. As expected, a higher surfactant concentration stabilized the particles slightly better against these instability mechanisms. The x ¯ 10 , 3 , x ¯ 50 , 3 and x ¯ 90 , 3 of the initial emulsion and after crystallization and cooling in relation to the Tween® 20 concentration are stated in Table 3. The increase in x ¯ 90 , 3 was most pronounced in samples containing the smallest surfactant concentration. However, no surfactant concentration was sufficient to prevent coalescence. Second, a significant shift to smaller droplets, even below 1 µm, was observed in all cases. This shift is more pronounced with increasing surfactant concentration (cf. Table 3). One reason could be that only at higher surfactant concentrations is there is enough surfactant present to fully cover all the newly formed interfaces. Another reason could be that the surfactant concentration influences the SE efficiency. To gain a better understanding of the underlying mechanisms, microscopic images were taken during the melting of droplets, which are depicted in Figure 11.
The swelling of particles was found in all samples and was most pronounced at the highest Tween® 20 concentration studied. With 0.25 wt% Tween® 20 present, swelling and some melt-crystal fragmentation was observed. Samples containing 0.1 wt% show almost no swelling, but rather melt-crystal fragmentation of some of the particles. This mechanism was described for alkane platelets, where crystal domains in the platelet melt individually and are then stabilized by the surfactant [38,40]. One reason for the more intense swelling with higher surfactant concentrations may be the presence of more and/or larger micellar surfactant aggregates in the aqueous solution. These were reported to particularly increase the efficiency of cold-bursting [39] and could therefore also influence the swelling behavior of a particle. The concentration of certain fractions of minor oil-soluble components also increases with increasing Tween® 20 concentration, as these commercially available surfactants are partially contaminated. When more oil-soluble components are present, improved wetting of the lipid nanovoids may occur, and thus more continuous phase may enter these voids. Additionally, the formation of nanovoids due to polymorphic transitions may be influenced by the surfactant, which has yet to be investigated. To date, nanovoids have only been studied for pure TAGs [50,51]. As the droplet size decreases with increasing surfactant concentration, swelling seems to be more effective than the melt-crystal fragmentation at disintegrating the particles into very small droplets.
In all samples, a few particles were present where no swelling and SE were observed (cf. Figure 11; red circles). After crystallization, these particles already optically differed from the ones exhibiting SE. In microscopic images, they appear as luminous green particles, whereas the rest of the particles exhibit birefringent Maltese-cross patterns, which is indicative of spherulitic growth (cf. Figure A2). The luminous green particles are ellipsoidal rather than spherical, and very tiny crystals are visible. During melting, they are still visible as luminous green (cf. Figure 11; red circles) and do not exhibit any swelling or fragmentation. They melt into one droplet of its initial size. As these luminous green particles do not swell during melting, we assume that no nanovoid formation and/or entering of the continuous phase takes place. One reason may be the lack of polymorphic transition during heating. Additionally, the different appearance of the particles not swelling and the ones that do (cf. Figure A2), suggests that they had already crystallized in a different polymorph. This finding supports the importance of the polymorph for any mechanisms leading to a change in particle size during crystallization and melting.

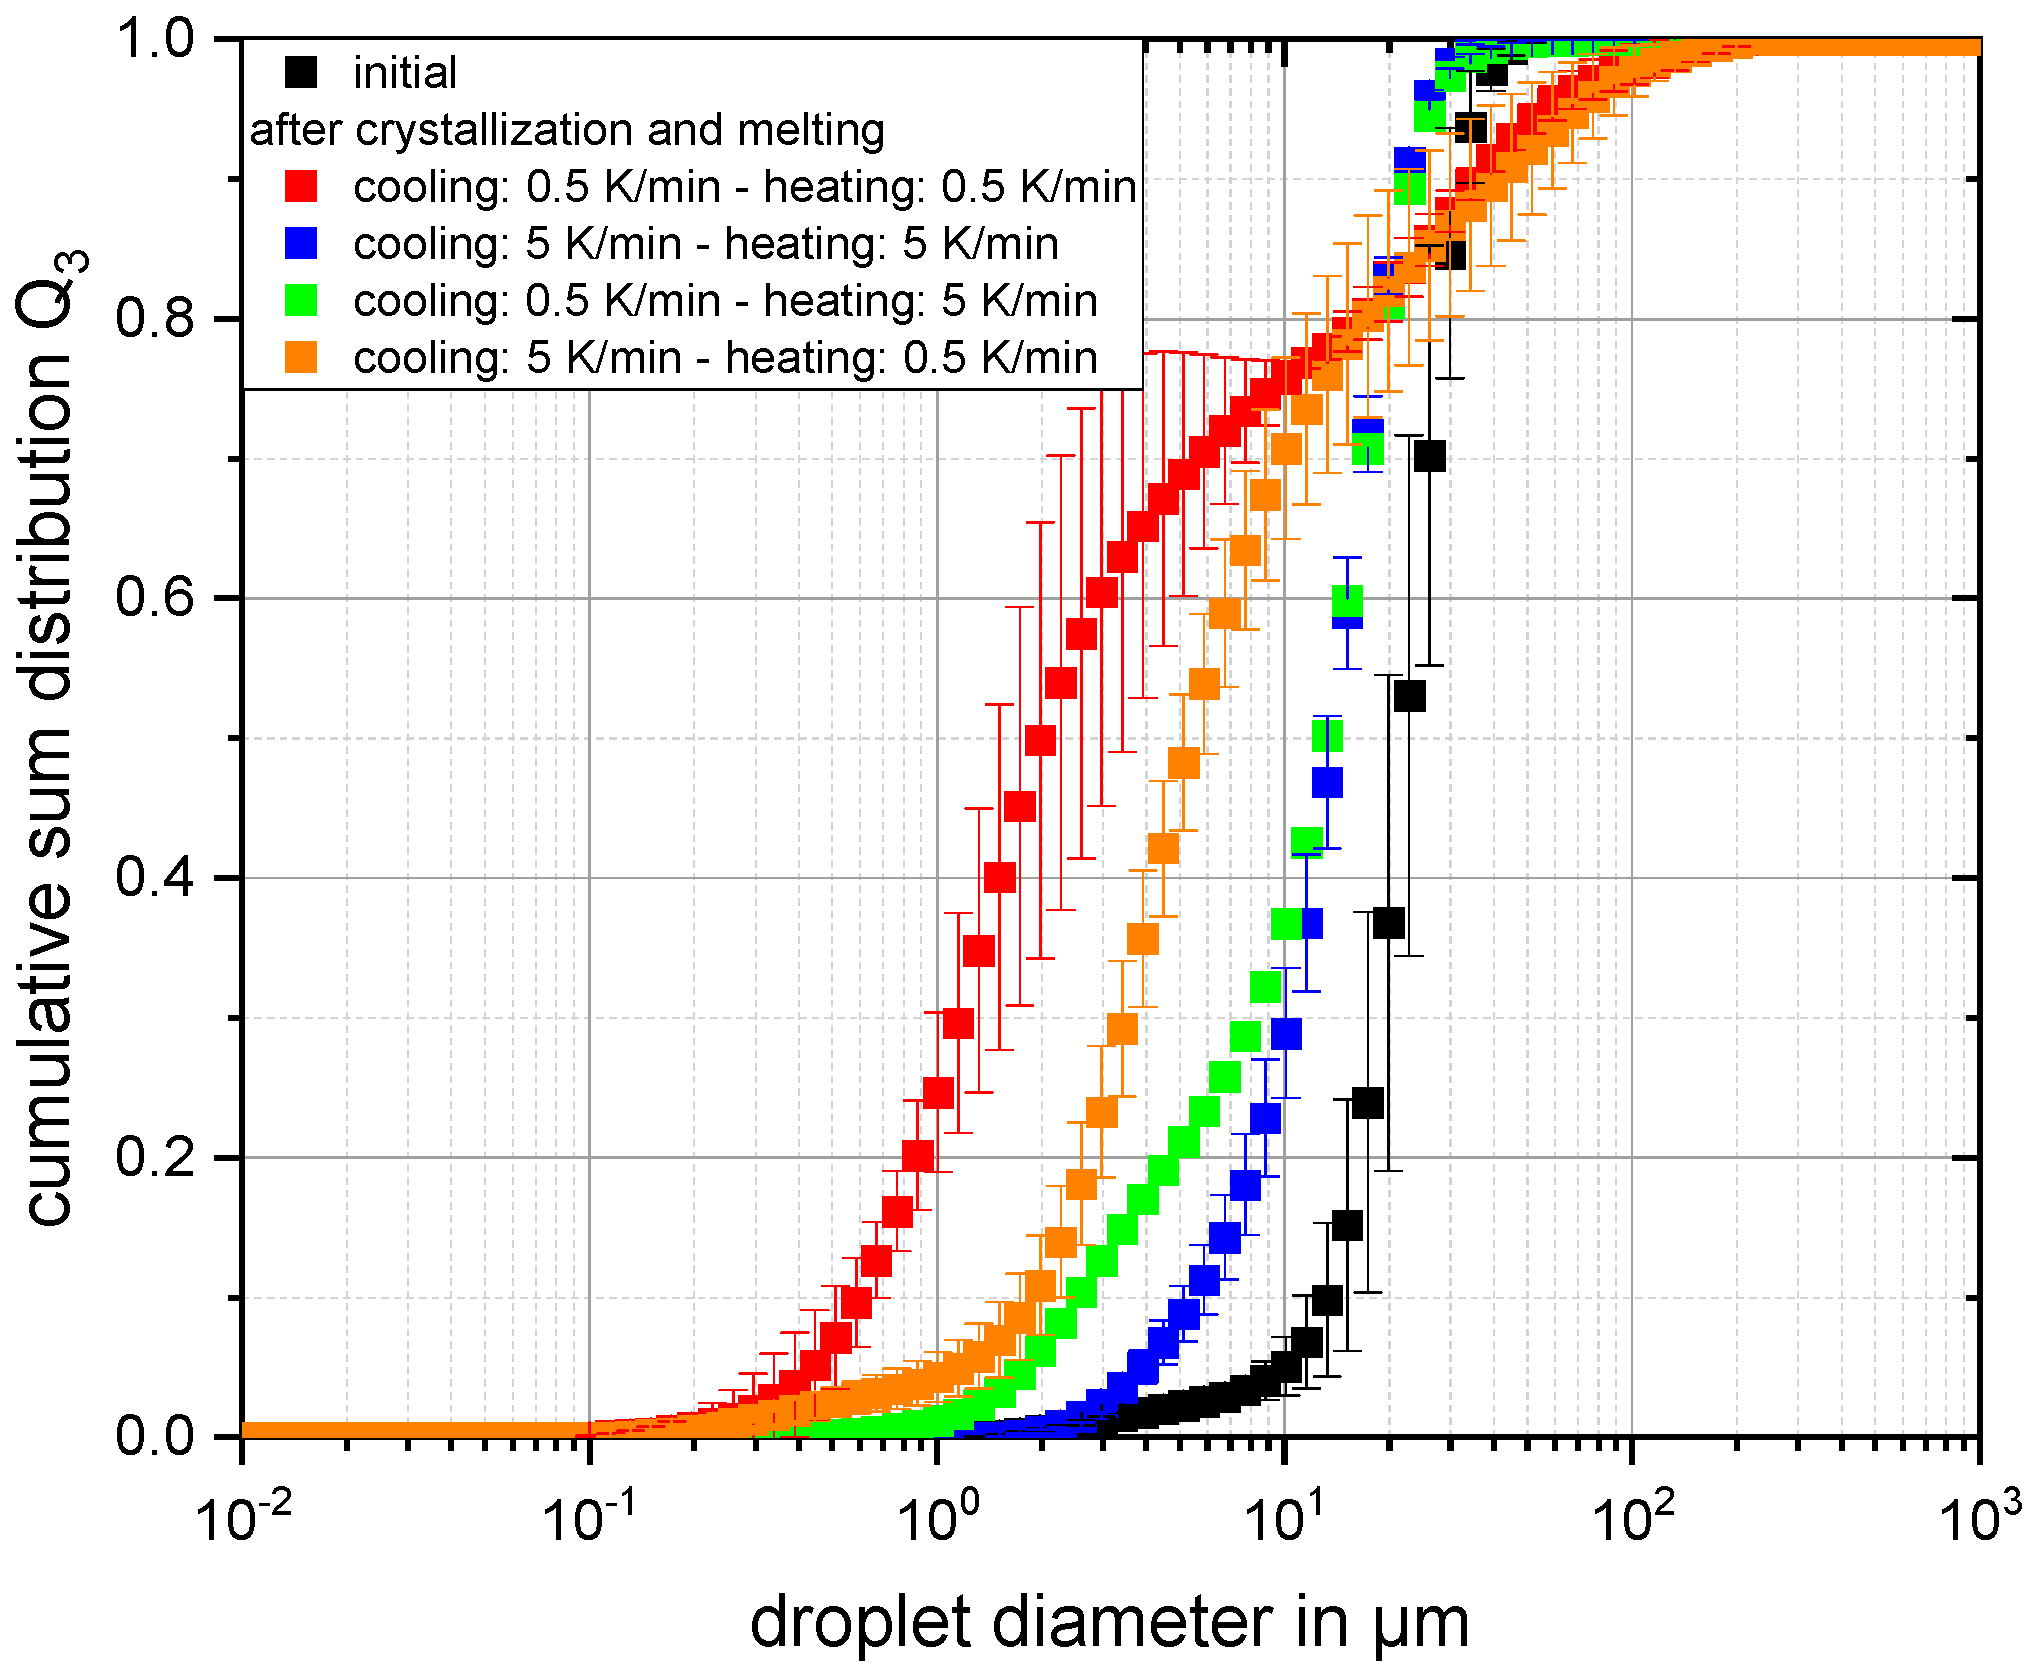
3.4. Influence of Cooling/Heating Procedure on the Change of Droplet Size Distribution after Crystallization and Melting of Dispersed Trilaurin

The cooling and heating rate is known to influence the polymorph in TAGs and its transitions [19,43]. As the polymorphic transition is crucial for the formation of nanovoids and thus SE efficiency, we investigated the change in DSD in relation to the applied temperature profile. The cumulative volume size distribution Q3(x) of trilaurin samples directly after emulsification and after full crystallization and melting with different cooling–heating procedures are depicted in Figure 12. In all samples, a shift to smaller droplet sizes due to SE was observed. When slow cooling and heating was applied, the largest shift was observed, and thus the smallest droplets were obtained (cf. Figure 12; red squares). The smallest shift in Q3(x) was observed in samples treated with fast cooling and fast heating rates (blue squares), with only a small difference compared with slow cooling and fast heating (green squares).
Droplets under 1 µm were only obtained when slow cooling was applied. Slow heating leaves the particles enough time to undergo the required polymorphic transitions, swelling and disintegration [39]. In contrast to other findings in the literature, we obtained the smallest droplets with slow cooling and slow heating. It was reported that rapid cooling followed by slow heating was most efficient for particle disintegration [39,42]. In these papers, rapid cooling was carried out at 15 K/s, which is much faster than in our experiments (5 K/min), where rates were limited due to equipment. Those authors reported that fewer and larger crystal domains formed during slow cooling (<2 K/min) and concluded that this must be the reason for larger droplets after slow cooling compared with fast cooling. As our experiments do not confirm these results, we assume that the underlying polymorphic transitions differ between the investigated systems due to differences in their composition, i.e., type of TAG and surfactant and surfactant concentration. Clearly, this shows the importance of understanding the relationship between formulation and process parameters for each system in order to predict possible behavior.
In addition to SE, we observed the formation of larger droplets in samples which exhibited slow heating procedures. No significant increase in droplet size was observed at fast heating rates. The increase in droplet size upon melting most probably results due to coalescence of single particles or of particle agglomerates. During slow heating, the temperature range where melting of the fat occurs is passed more slowly, and particles which partially melt increase the probability of partial coalescence. Thus, slow heating gives the particles more time to coalesce partially. As soon as cluster formation due to partial coalescence occurs, these clusters will always fully coalesce upon melting.

4. Conclusions

The particle size and morphology greatly influence the physicochemical properties of a crystalline dispersion and its physical stability. Thus, it is crucial to understand the underlying mechanisms and influencing parameters. In this study, the crystallization and melting behavior of the complex fats cocoa butter (CB) and anhydrous milk fat (AMF), as well as pure triacylglycerols and different binary mixtures thereof, were studied. More precisely, the particle morphology, their size distributions and the crystallization index were measured, and the influence of surfactant concentration and heating/cooling velocity were considered.
Different particle morphologies were obtained during crystallization of the emulsified complex fats. Self-shaping was observed in CB, whereas AMF mostly crystallized in spherical shapes. Additionally, a shift to smaller droplets after melting compared with the initial droplet size distribution (DSD) occurred in CB dispersion, whereas AMF particles behaved differently. Liquid drops started to form on the surface of AMF particles during melting, which were not ejected fully but coalesced back with the mother droplet. This behavior has not been reported yet in the literature.
The investigated binary mixtures of TAGs mostly crystallized in spherical shapes; however, with increasing difference in the carbon number (Cn) of fatty acid chains, the irregularity in particle shape increased. The least spherical and most irregular particles were found for the binary mixture with the largest difference in melting temperature of 25–25 K, i.e., trilaurin and tristearin. SE was observed in all samples, but it was not possible to correlate the SE efficiency with the dispersed-phase composition. In addition, the surfactant concentration and heating/cooling rate had an influence on the SE efficiency and coalescence tendency. The smallest x50,3 of 3 µm was obtained with 0.5 wt% Tween® 20, which was the highest surfactant concentration studied. SE and coalescence were most pronounced with slow heating of 0.5 K/min, resulting in droplets smaller than 1 µm and larger than 100 µm, respectively.
Importantly, we acknowledge some limitations in this study. First, the physical chemistry and underlying molecular structures and changes were not part of our study. Future research should attempt to gain a deeper understanding of the processes at the molecular level. In our study, the observed changes in droplet size distribution and the difference in melting behavior were most probably often the result of superimposed effects, making it particularly difficult to draw definitive conclusions. Second, our pilot study focused on changes of structural properties such as the particle morphology and size, and changes thereof. We did not investigate the correlated dispersion property changes.
In summary, we demonstrated that, besides other factors, the dispersed-phase composition plays an important role in the formation of different particle morphologies during crystallization. Our results add additional data and thus will help gain further knowledge on the evolution of crystalline particle morphology during cooling, as well as instability phenomena such as coalescence and SE in TAG dispersions. As every change in particle size and morphology may greatly influence the physical stability and product properties, our results help to identify important formulation and process parameters influencing both. This is crucial to gain further knowledge about the underlying mechanisms to produce crystalline dispersions with increased colloidal stability, or even to exploit phenomena such as SE to produce very small particle sizes.

Author Contributions

Conceptualization, J.R., V.G. and H.P.K.; methodology, J.R.; formal analysis, D.M., F.O., L.H. and J.R.; investigation, J.R.; resources, H.P.K.; data curation, D.M., F.O., L.H. and J.R.; writing—original draft preparation, J.R.; writing—review and editing, V.G. and H.P.K.; visualization, D.M., F.O. and J.R.; supervision, V.G. and H.P.K.; funding acquisition, H.P.K. All authors have read and agreed to the published version of the manuscript.

Funding

This research was conducted within the framework of IGF Project no. 21099 N of the FEI and was supported via AiF within the program for promoting the Industrial Collective Research (IGF) of the German Ministry of Economic Affairs and Energy (BMWi), based on a resolution of the German Parliament.

Data Availability Statement

The datasets generated for this study are available on request to the corresponding author.

Acknowledgments

We acknowledge support by the KIT-Publication Fund of the Karlsruhe Institute of Technology. The authors also thank IOI Oleo GmbH (Hamburg, Germany) for providing glyceryl trimyristate and glyceryl tristearate. We thank Goran Vladisavljevic for his advice and scientific expertise in premix membrane emulsification. Furthermore, we would like to thank Markus Fischer and Jürgen Kraft for assisting with the conceptualization of the pneumatic membrane emulsification system and the manufacturing of certain parts.

Conflicts of Interest

The authors declare no conflict of interest.

Appendix A

Figure A1. Exemplary microscopic images of trilaurin + tristearin (L+S) droplets stabilized with Tween® 20. From left to right: decreasing temperature, starting from 38 °C. Red circles show the first irregular particles; red arrows point to sharp long crystal growths. Length of the scale bar is 25 µm.
Colloids 07 00022 g0a1
Figure A2. Crystalline trilaurin particles obtained after cooling in the same sample: (a) particle showing a Maltese-cross pattern, (b) luminous green particle, where fine crystals seem to be visible. Length of the scale bar is 25 µm.
Colloids 07 00022 g0a2

References

  1. Müller, R.H.; Shegokar, R.; Keck, C.M. 20 years of lipid nanoparticles (SLN and NLC): Present state of development and industrial applications. Curr. Drug Discov. Technol. 2011, 8, 207–227. [Google Scholar] [CrossRef]
  2. Müller, R.H.; Petersen, R.D.; Hommoss, A.; Pardeike, J. Nanostructured lipid carriers (NLC) in cosmetic dermal products. Adv. Drug Deliv. Rev. 2007, 59, 522–530. [Google Scholar] [CrossRef]
  3. Pardeike, J.; Hommoss, A.; Müller, R.H. Lipid nanoparticles (SLN, NLC) in cosmetic and pharmaceutical dermal products. Int. J. Pharm. 2009, 366, 170–184. [Google Scholar] [CrossRef] [PubMed]
  4. McClements, D.J. Crystals and crystallization in oil-in-water emulsions: Implications for emulsion-based delivery systems. Adv. Colloid Interface Sci. 2012, 174, 1–30. [Google Scholar] [CrossRef]
  5. Töpel, A. Chemie und Physik der Milch; Behr’s Verlag DE: Hamburg, Germany, 2015; ISBN 9783954683604. [Google Scholar]
  6. Gunstone, F. The Chemistriy of Oils and Fats: Sources, Composition, Properties and Uses; John Wiley & Sons: Hoboken, NJ, USA, 2009. [Google Scholar]
  7. Kesisoglou, F.; Panmai, S.; Wu, Y. Nanosizing–oral formulation development and biopharmaceutical evaluation. Adv. Drug Deliv. Rev. 2007, 59, 631–644. [Google Scholar] [CrossRef]
  8. Denkov, N.; Tcholakova, S.; Lesov, I.; Cholakova, D.; Smoukov, S.K. Self-shaping of oil droplets via the formation of intermediate rotator phases upon cooling. Nature 2015, 528, 392. [Google Scholar] [CrossRef] [Green Version]
  9. Cholakova, D.; Denkov, N.; Tcholakova, S.; Lesov, I.; Smoukov, S.K. Control of drop shape transformations in cooled emulsions. Adv. Colloid Interface Sci. 2016, 235, 90–107. [Google Scholar] [CrossRef] [PubMed] [Green Version]
  10. Lesov, I.; Valkova, Z.; Vassileva, E.; Georgiev, G.S.; Ruseva, K.; Simeonov, M.; Tcholakova, S.; Denkov, N.D.; Smoukov, S.K. Bottom-Up Synthesis of Polymeric Micro- and Nanoparticles with Regular Anisotropic Shapes. Macromolecules 2018, 51, 7456–7462. [Google Scholar] [CrossRef]
  11. Guttman, S.; Ocko, B.M.; Deutsch, M.; Sloutskin, E. From faceted vesicles to liquid icoshedra: Where topology and crystallography meet. Curr. Opin. Colloid Interface Sci. 2016, 22, 35–40. [Google Scholar] [CrossRef] [Green Version]
  12. Guttman, S.; Sapir, Z.; Ocko, B.M.; Deutsch, M.; Sloutskin, E. Temperature-Tuned Faceting and Shape Changes in Liquid Alkane Droplets. Langmuir 2017, 33, 1305–1314. [Google Scholar] [CrossRef]
  13. Guttman, S.; Sapir, Z.; Schultz, M.; Butenko, A.V.; Ocko, B.M.; Deutsch, M.; Sloutskin, E. How faceted liquid droplets grow tails. Proc. Natl. Acad. Sci. USA 2016, 113, 493–496. [Google Scholar] [CrossRef] [PubMed] [Green Version]
  14. Boode, K.; Bisperink, C.; Walstra, P. Destabilization of O/W emulsions containing fat crystals by temperature cycling. Colloids Surf. 1991, 61, 55–74. [Google Scholar] [CrossRef]
  15. Boode, K.; Walstra, P. Partial coalescence in oil-in-water emulsions 1. Nature of the aggregation. Colloids Surf. A Physicochem. Eng. Asp. 1993, 81, 121–137. [Google Scholar] [CrossRef]
  16. Helgason, T.; Awad, T.S.; Kristbergsson, K.; McClements, D.J.; Weiss, J. Influence of Polymorphic Transformations on Gelation of Tripalmitin Solid Lipid Nanoparticle Suspensions. J. Am. Oil Chem. Soc. 2008, 85, 501–511. [Google Scholar] [CrossRef]
  17. Walstra, P. Overview of Emulsion and Foam Stability. In Food Emulsions and Foams: Interfaces, Interactions and Stability; Dickinson, E., Ed.; Woodhead Publishing Ltd.: Cambridge, UK, 1987; pp. 242–257. ISBN 978-1-85573-785-3. [Google Scholar]
  18. Vanapalli, S.A.; Palanuwech, J.; Coupland, J.N. Stability of emulsions to dispersed phase crystallization: Effect of oil type, dispersed phase volume fraction, and cooling rate. Colloids Surf. A Physicochem. Eng. Asp. 2002, 204, 227–237. [Google Scholar] [CrossRef]
  19. Awad, T.S.; Helgason, T.; Kristbergsson, K.; Decker, E.A.; Weiss, J.; McClements, D.J. Effect of Cooling and Heating Rates on Polymorphic Transformations and Gelation of Tripalmitin Solid Lipid Nanoparticle (SLN) Suspensions. Food Biophys. 2008, 3, 155–162. [Google Scholar] [CrossRef]
  20. Reiner, J.; Ly, T.T.; Liu, L.; Karbstein, H.P. Melt Emulsions: Influence of the Cooling Procedure on Crystallization and Recrystallization of Emulsion Droplets and their Influence on Dispersion Viscosity upon Storage. Chem. Ing. Tech. 2022, 94, 356–364. [Google Scholar] [CrossRef]
  21. Reiner, J.; Walter, E.M.; Karbstein, H.P. Assessment of droplet self-shaping and crystallization during temperature fluctuations exceeding the melting temperature of the dispersed phase. Colloids Surf. A Physicochem. Eng. Asp. 2023, 656, 130498. [Google Scholar] [CrossRef]
  22. Günther, E.; Schmid, T.; Mehling, H.; Hiebler, S.; Huang, L. Subcooling in hexadecane emulsions. Int. J. Refrig. 2010, 33, 1605–1611. [Google Scholar] [CrossRef]
  23. McClements, D.J.; Dungan, S.R.; German, J.B.; Simoneau, C.; Kinsella, J.E. Droplet Size and Emulsifier Type Affect Crystallization and Melting of Hydrocarbon-in-Water Emulsions. J. Food Sci. 1993, 58, 1148–1151. [Google Scholar] [CrossRef]
  24. Abramov, S.; Ahammou, A.; Karbstein, H.P. Influence of external forces during supercooling on dispersion stability during melt emulsification. Chem. Eng. Technol. 2018, 41, 768–775. [Google Scholar] [CrossRef]
  25. Abramov, S.; Shah, K.; Weißenstein, L.; Karbstein, H. Effect of Alkane Chain Length on Crystallization in Emulsions during Supercooling in Quiescent Systems and under Mechanical Stress. Processes 2018, 6, 6. [Google Scholar] [CrossRef] [Green Version]
  26. Garti, N.; Sato, K. Crystallization and Polymorphism of Fats and Fatty Acids; Dekker, M., Ed.; OpenLibrary: New York, NY, USA, 1988. [Google Scholar]
  27. Westesen, K.; Siekmann, B.; Koch, M.H.J. Investigations on the physical state of lipid nanoparticles by synchrotron radiation X-ray diffraction. Int. J. Pharm. 1993, 93, 189–199. [Google Scholar] [CrossRef]
  28. Siekmann, B.; Westesen, K. Thermoanalysis of the recrystallization process of melt-homogenized glyceride nanoparticles. Colloids Surf. B Biointerfaces 1994, 3, 159–175. [Google Scholar] [CrossRef]
  29. Complex fats as matrix constitutions in lipid nanoparticles. In Proceedings of the 1st World Meeting of APGI/APV, Budapest, Hungary, 9–11 May 1995.
  30. Coupland, J.N. Crystallization in emulsions. Curr. Opin. Colloid Interface Sci. 2002, 7, 445–450. [Google Scholar] [CrossRef]
  31. Bunjes, H.; Koch, M.H.J.; Westesen, K. Effect of Particle Size on Colloidal Solid Triglycerides. Langmuir 2000, 16, 5234–5241. [Google Scholar] [CrossRef]
  32. Bunjes, H.; Koch, M.H.J.; Westesen, K. Effects of surfactants on the crystallization and polymorphism of lipid nanoparticles. In Molecular Organisation on Interfaces; Lagaly, G., Ed.; Springer: Berlin/Heidelberg, Germany, 2006; pp. 7–10. ISBN 978-3-540-43637-9. [Google Scholar]
  33. Aronhime, J.S.; Sarig, S.; Garti, N. Dynamic control of polymorphic transformation in triglycerides by surfactants: The button syndrome. J. Am. Oil Chem. Soc. 1988, 65, 1144–1150. [Google Scholar] [CrossRef]
  34. Bunjes, H.; Koch, M.H.J.; Westesen, K. Influence of emulsifiers on the crystallization of solid lipid nanoparticles. J. Pharm. Sci. 2003, 92, 1509–1520. [Google Scholar] [CrossRef] [Green Version]
  35. Gordillo-Galeano, A.; Mora-Huertas, C.E. Solid lipid nanoparticles and nanostructured lipid carriers: A review emphasizing on particle structure and drug release. Eur. J. Pharm. Biopharm. 2018, 133, 285–308. [Google Scholar] [CrossRef]
  36. Fredrick, E.; Walstra, P.; Dewettinck, K. Factors governing partial coalescence in oil-in-water emulsions. Adv. Colloid Interface Sci. 2010, 153, 30–42. [Google Scholar] [CrossRef]
  37. Cholakova, D.; Vinarov, Z.; Tcholakova, S.; Denkov, N.D. Self-emulsification in chemical and pharmaceutical technologies. Curr. Opin. Colloid Interface Sci. 2022, 59, 101576. [Google Scholar] [CrossRef]
  38. Valkova, Z.; Cholakova, D.; Tcholakova, S.; Denkov, N.; Smoukov, S.K. Mechanisms and Control of Self-Emulsification upon Freezing and Melting of Dispersed Alkane Drops. Langmuir 2017, 33, 12155–12170. [Google Scholar] [CrossRef] [PubMed]
  39. Cholakova, D.; Glushkova, D.; Tcholakova, S.; Denkov, N. Cold-Burst Method for Nanoparticle Formation with Natural Triglyceride Oils. Langmuir 2021, 37, 7875–7889. [Google Scholar] [CrossRef] [PubMed]
  40. Tcholakova, S.; Valkova, Z.; Cholakova, D.; Vinarov, Z.; Lesov, I.; Denkov, N.; Smoukov, S.K. Efficient self-emulsification via cooling-heating cycles. Nat. Commun. 2017, 8, 15012. [Google Scholar] [CrossRef] [PubMed] [Green Version]
  41. Cebula, D.J.; McClements, D.J.; Povey, M.J.W. Small angle neutron scattering from voids in crystalline trilaurin. J. Am. Oil Chem. Soc. 1990, 67, 76–78. [Google Scholar] [CrossRef]
  42. Cholakova, D.; Glushkova, D.; Tcholakova, S.; Denkov, N. Nanopore and Nanoparticle Formation with Lipids Undergoing Polymorphic Phase Transitions. ACS Nano 2020, 14, 8594–8604. [Google Scholar] [CrossRef] [PubMed]
  43. Bunjes, H.; Westesen, K.; Koch, M.H.J. Crystallization tendency and polymorphic transitions in triglyceride nanoparticles. Int. J. Pharm. 1996, 129, 159–173. [Google Scholar] [CrossRef]
  44. Sato, K. Crystallization behaviour of fats and lipids—A review. Chem. Eng. Sci. 2001, 56, 2255–2265. [Google Scholar] [CrossRef]
  45. Takeuchi, M.; Ueno, S.; Sato, K. Synchrotron Radiation SAXS/WAXS Study of Polymorph-Dependent Phase Behavior of Binary Mixtures of Saturated Monoacid Triacylglycerols. Cryst. Growth Des. 2003, 3, 369–374. [Google Scholar] [CrossRef]
  46. Martini, S.; Herrera, M.L.; Hartel, R.W. Effect of cooling rate on crystallization behavior of milk fat fraction/sunflower oil blends. J. Am. Oil Chem. Soc. 2002, 79, 1055–1062. [Google Scholar] [CrossRef]
  47. Cholakova, D.; Valkova, Z.; Tcholakova, S.; Denkov, N.; Smoukov, S.K. “Self-Shaping” of Multicomponent Drops. Langmuir 2017, 33, 5696–5706. [Google Scholar] [CrossRef] [PubMed]
  48. Denkov, N.; Cholakova, D.; Tcholakova, S.; Smoukov, S.K. On the Mechanism of Drop Self-Shaping in Cooled Emulsions. Langmuir 2016, 32, 7985–7991. [Google Scholar] [CrossRef]
  49. Guttman, S.; Kesselman, E.; Jacob, A.; Marin, O.; Danino, D.; Deutsch, M.; Sloutskin, E. Nanostructures, Faceting, and Splitting in Nanoliter to Yoctoliter Liquid Droplets. Nano Lett. 2019, 19, 3161–3168. [Google Scholar] [CrossRef]
  50. Peyronel, F.; Quinn, B.; Marangoni, A.G.; Pink, D.A. Ultra Small Angle X-Ray Scattering for Pure Tristearin and Tripalmitin: Model Predictions and Experimental Results. Food Biophys. 2014, 9, 304–313. [Google Scholar] [CrossRef]
  51. Peyronel, F.; Pink, D.A.; Marangoni, A.G. Triglyceride nanocrystal aggregation into polycrystalline colloidal networks: Ultra-small angle X-ray scattering, models and computer simulation. Curr. Opin. Colloid Interface Sci. 2014, 19, 459–470. [Google Scholar] [CrossRef] [Green Version]
Figure 1. Schematic illustration of two syringes connected by a Luer-Lock connection with a syringe filter.
Colloids 07 00022 g001
Figure 2. General arrangement of the pneumatic membrane emulsification process.
Colloids 07 00022 g002
Figure 3. Cumulative sum distribution Q0(x) of cocoa butter (CB, (a)) and anhydrous milk fat (AMF, (b)) droplets stabilized with Tween® 20 of the initial emulsion (black squares) and after full crystallization and melting (red circles) at a heating/cooling rate of 0.5 K/min.
Colloids 07 00022 g003
Figure 4. Exemplary microscopic images of fully crystallized 1 wt% cocoa butter (CB) and anhydrous milk fat (AMF) emulsions stabilized with Tween® 20. Cooling was carried out with 0.5 K/min. Length of the scale bar is 25 µm.
Colloids 07 00022 g004
Figure 5. Exemplary microscopic images of anhydrous milk fat (AMF) particles stabilized with Tween® 20 during melting (from left to right). The red arrows point to examples of ejected droplets. Length of the scale bar is 25 µm.
Colloids 07 00022 g005
Figure 6. Number-based crystallization index CIN as a function of temperature related to the highest melting fraction of dispersions differing in their dispersed-phase composition. The melting temperature (ϑmelt) of the higher melting fraction is stated in the graph.
Colloids 07 00022 g006
Figure 7. Cumulative sum distributions Q0(x) of 1 wt% emulsions directly after preparation (black squares) and after full crystallization and melting (red circles). Dispersed phases consisted of trilaurin + trimyristin (L+M) (a), trimyristin + tripalmitin (M+P) (b), trilaurin + tripalmitin (L+P) (c) and trilaurin + tristearin (L+S) (d). TAGs were mixed in a 1:1 (wt:wt) ratio. The difference in carbon number of fatty acids (∆Cn) and difference in melting temperature (∆T) between the mixed TAGs are stated.
Colloids 07 00022 g007
Figure 8. Exemplary microscopic images of crystalline dispersions during crystallization at 0.5 K/min. Enlarged images of the top row can be seen in the bottom row. Dispersed phases consisted of trilaurin + trimyristin (L+M), trimyristin + tripalmitin (M+P), trilaurin + tripalmitin (L+P) and trilaurin + tristearin (L+S). TAGs were mixed in a 1:1 ratio. Red ellipses accentuate ellipsoidal particles; red arrows point to sharp crystals. The difference in carbon number of fatty acids (∆Cn) and difference in melting temperature (∆T) between the mixed TAGs are stated. Length of the scale bar is 25 µm.
Colloids 07 00022 g008
Figure 9. Exemplary microscopic images of crystalline dispersions during melting at 0.5 K/min. Enlarged images of the top row can be seen in the bottom row. Dispersed phases consisted of trilaurin + trimyristin (L+M), trimyristin + tripalmitin (M+P), trilaurin + tripalmitin (L+P) and trilaurin + tristearin (L+S). TAGs were mixed in a 1:1 ratio. Red circles accentuate particle swelling; blue circles accentuate sharp crystals; red arrows point particles dividing. The difference in carbon number of fatty acids (∆Cn) and difference in melting temperature (∆T) between the mixed TAGs are stated. Length of the scale bar is 25 µm.
Colloids 07 00022 g009
Figure 10. Cumulative volume sum distributions Q3(x) of 1 wt% trilaurin emulsions stabilized with 0.1 wt%, 0.025 wt% and 0.5 wt% Tween® 20 after production (initial) and after crystallization and melting.
Colloids 07 00022 g010
Figure 11. Exemplary microscopic images of 1 wt% emulsified trilaurin stabilized with 0.1, 0.25 and 0.5 wt% Tween® 20. The pictures were taken during melting at 44 °C. Red circles highlight the luminous green particles without swelling during melting. Length of the scale bar is 25 µm.
Colloids 07 00022 g011
Figure 12. Cumulative volume size distributions Q3(x) of 1 wt% trilaurin stabilized with Tween® 20 directly after preparation (initial) and after full crystallization and melting. Different combinations of cooling and heating rates were applied.
Colloids 07 00022 g012
Table 1. Overview of pure TAGs used, their respective melting temperatures (ϑmelt), numbers of C-atoms of the fatty acid and their saturation.
TAGCnSaturationϑmelt in °C
Trilaurin (L)C12C12:047
Trimyristin (M)C14C14:056–57
Tripalmitin (P)C16C16:065–68
Tristearin (S)C18C18:072–75
Triolein (O)C18C18:15
Table 2. Overview of the investigated samples and applied time–temperature profiles.
SampleTemperature Range in °CCooling Rate in KHeating Rate in K
AMF0–500.50.5
CB0–500.50.5
L+M0–680.50.5
L+P0–760.50.5
L+S0–840.50.5
L+O0–680.50.5
M+P0–560.50.5
L0–570.50.5
55
0.55
50.5
Table 3. 10%, 50% and 90% percentile of the cumulative volume sum distribution Q3(x) of the colloidal particles directly after preparation (initial particle size) and after crystallization and melting in relation to the Tween® 20 concentration.
Initial Particle Size
x ¯ 10 , 3 in µm x ¯ 50 , 3 in µm x ¯ 90 , 3 in µm
13.3 ± 1.423.0 ± 1.933.2 ± 3.4
Particle Size after Crystallization and Melting
cTween 20 in wt% x ¯ 10 , 3  in µm x ¯ 50 , 3  in µm x ¯ 90 , 3  in µm
0.12.4 ± 0.910.7 ± 2.567.4 ± 12.0
0.251.5 ± 0.65.3 ±0.736.6 ± 14.5
0.50.6 ± 0.13.0 ± 1.639.5 ± 6.4
Disclaimer/Publisher’s Note: The statements, opinions and data contained in all publications are solely those of the individual author(s) and contributor(s) and not of MDPI and/or the editor(s). MDPI and/or the editor(s) disclaim responsibility for any injury to people or property resulting from any ideas, methods, instructions or products referred to in the content.

