Article

Impact of Operating Parameters on the Production of Nanoemulsions Using a High-Pressure Homogenizer with Flow Pattern and Back Pressure Control

1
Biopolymers and Colloids Laboratory, Department of Food Science, University of Massachusetts, Amherst, MA 01003, USA
2
Department of Food Science & Bioengineering, Zhejiang Gongshang University, 18 Xuezheng Street, Hangzhou 310018, China
*
Author to whom correspondence should be addressed.
Colloids Interfaces 2023, 7(1), 21; https://doi.org/10.3390/colloids7010021
Submission received: 24 January 2023 / Revised: 9 March 2023 / Accepted: 13 March 2023 / Published: 16 March 2023
(This article belongs to the Special Issue Recent Advances in Emulsions and Applications)

Abstract

:
The main objective of this study was to establish the relative importance of the main operating parameters impacting the formation of food-grade oil-in-water nanoemulsions by high-pressure homogenization. The goal of this unit operation was to create uniform and stable emulsified products with small mean particle diameters and narrow polydispersity indices. In this study, we examined the performance of a new commercial high-pressure valve homogenizer, which has several features that provide good control over the particle size distribution of nanoemulsions, including variable homogenization pressures (up to 45,000 psi), nozzle dimensions (0.13/0.22 mm), flow patterns (parallel/reverse), and back pressures. The impact of homogenization pressure, number of passes, flow pattern, nozzle dimensions, back pressure, oil concentration, emulsifier concentration, and emulsifier type on the particle size distribution of corn oil-in-water emulsions was systematically examined. The droplet size decreased with increasing homogenization pressure, number of passes, back pressure, and emulsifier-to-oil ratio. Moreover, it was slightly smaller when a reverse rather than parallel flow profile was used. The emulsifying performance of plant, animal, and synthetic emulsifiers was compared because there is increasing interest in replacing animal and synthetic emulsifiers with plant-based ones in the food industry. Under fixed homogenization conditions, the mean particle diameter decreased in the following order: gum arabic (0.66 µm) > soy protein (0.18 µm) > whey protein (0.14 µm) ≈ Tween 20 (0.14 µm). The information reported in this study is useful for the optimization of the production of food-grade nanoemulsions using high-pressure homogenization.

Graphical Abstract

1. Introduction

Oil-in-water nanoemulsions are colloidal dispersions containing small oil droplets dispersed in water, with the droplets being coated by emulsifying agents, such as surfactants, phospholipids, proteins, and/or polysaccharides [1,2,3]. The mean particle diameter in nanoemulsions typically ranges from around 20 to 200 nm, depending on the formulation and preparation method used [2,4]. Nanoemulsions have several potential advantages for certain commercial applications due to their small droplet dimensions [5]. First, the relatively small droplet size increases their resistance to gravitational separation and aggregation, which increases the shelf life of emulsified products [6]. Second, nanoemulsions with sufficiently small droplets (<50 nm) are optically transparent because they only scatter light very weakly, which is useful for the development of optically clear foods and beverages [7]. Third, the small dimensions of the oil droplets in nanoemulsions means they are rapidly and completely digested within the gastrointestinal tract, which increases the bioavailability of any hydrophobic bioactive agents encapsulated inside them [8,9]. Indeed, nanoemulsions can be used in many different commercial products, including foods, beverages, cosmetics, drugs, biomedicines, and agrochemicals [10,11,12]. For example, they can be used in the medical industry as drug delivery systems or for the development of diagnostic tools, such as contrast agents [12]. They can be used in the agrochemical industry as delivery systems to improve the effectiveness and reduce the environmental impact of pesticides [11]. The ability to create nanoemulsions with well-defined and tunable droplet size distributions is important in many of these commercial applications because the stability and efficacy of these colloidal delivery systems depend on this particle characteristic [13]. In particular, it is usually desirable to produce nanoemulsions with narrow particle size distributions and adjustable mean particle diameters to improve stability and obtain more reliable release characteristics. Consequently, there is great interest in controlling the particle size characteristics of nanoemulsions to improve their functional performance [1,14,15,16].
Food-grade nanoemulsions are typically produced using two distinct approaches: low-energy physicochemical and high-energy mechanical methods [17]. The low-energy methods are based on controlled alterations in composition and/or temperature, which cause the system to move to a different part of the phase diagram, thereby leading to the spontaneous assembly of nanoscale oil droplets [18,19]. Representative examples of this homogenization approach include spontaneous emulsification and phase inversion temperature methods [18]. The main advantage of low-energy methods is that no expensive equipment is required, but the main disadvantage is that they can typically only be carried out using high concentrations of synthetic surfactants and specific kinds of oil. In contrast, high-energy methods use mechanical forces to create nanoemulsions from mixtures of oil, water, and emulsifiers [20]. Specialized mechanical devices have been developed to generate the high level of disruptive forces required to create nanoemulsions, including high-pressure valve homogenizers [21], microfluidizers [22,23], and sonicators [24,25]. The main advantage of this method is that a wide range of oils and emulsifiers can be utilized, but the main disadvantage is that specialized equipment is required.
High-pressure valve homogenizers are one of the most common mechanical devices used to produce nanoemulsions in the food industry, especially for nanoemulsions produced from low- or intermediate-viscosity fluids [21,26,27,28]. In most cases, a coarse emulsion premix is produced first using a high-shear mixer that is then fed into the homogenizer, which increases the overall efficiency of the particle size reduction process [29,30]. The coarse emulsions pass through the inlet of the homogenizer and then are pulled into a chamber that forces them through a narrow nozzle using a piston [31]. As the coarse emulsion passes through the nozzle, the large droplets are broken down into smaller ones by the intense, disruptive forces generated inside the device, which are usually a combination of shear, turbulence, and cavitation forces. The nature of the disruptive forces depends on the homogenization device and operating conditions used and can be manipulated to alter the particle size distribution produced. The nozzle dimensions also have an impact on the efficiency of droplet disruption, with smaller nozzles normally producing smaller droplets [31]. However, larger nozzle dimensions are often more suitable for homogenizing highly viscous fluids so as to ensure a good flow rate and avoid clogs. The number of times to pass through the nozzle also determines the size of final nanoemulsions, with the droplet size decreasing with an increasing number of passes until a plateau is reached [31,32,33]. The physicochemical properties of the materials used to prepare nanoemulsions also influence the size of the droplets that can be produced during homogenization, such as oil type, emulsifier type, oil concentration, emulsifier concentration, and emulsifier-to-oil ratio [34,35,36,37,38]. To produce small droplets, it is critical that there is enough emulsifier present to cover all of the new oil–water interface generated during homogenization. Otherwise, some droplet coalescence occurs inside the device, leading to a larger droplet size.
In this study, we systematically examined the performance of a recently introduced commercial homogenizer at producing oil-in-water nanoemulsions using food-grade ingredients. This device is a type of high-pressure homogenizer, and so the results obtained can be related to other homogenization devices within this category, but it also has some additional features that provide flexibility when producing nanoemulsions with specific particle size distributions. These additional features include the ability to vary the homogenization pressure over a wide range, the number of passes, the nozzle dimensions, the flow pattern, and the back pressure. We examined the impact of these parameters, as well as emulsifier-to-oil concentration ratio, oil concentration, emulsifier concentration, and emulsifier type, on the particle size distributions. Moreover, we compared the emulsifying properties of plant-derived, animal-derived, and synthetic emulsifiers in producing nanoemulsions because there is growing interest in the food industry in creating plant-based foods to replace animal ones for ethical, health, and environmental reasons. The information obtained in this study should therefore be useful to promote the use of nanoemulsions in a wide range of applications within the agrochemical, food, supplement, cosmetics, personal care, biomedical, and pharmaceutical industries.

2. Materials and Methods

2.1. Materials

Corn oil (Mazola, ACH Food Company, Memphis, TN, USA) was purchased from a local supermarket and stored in a refrigerator (4 °C) prior to use. Tween 20 were purchased from Sigma-Aldrich (Sigma Chemical Co., St. Louis, MO, USA). Soy protein isolate was kindly provided by ADM (Decatur, IL, USA). Whey protein isolate was kindly provided by Davisco Foods International Inc. (Le Sueur, MN, USA). Gum Arabic was kindly provided by TIC Gums (Belcamp, MD, USA). Double distilled water was used to prepare all samples.

2.2. Preparation of the Coarse Emulsions

A hand-held shearing device (M133/1281-0, Biospec Products, Inc., Bartlesville, OK, USA) was used to blend oil, water, and emulsifier together in a glass container for 4 min. This led to the formation of coarse oil-in-water emulsions containing relatively large oil droplets (d > 1000 nm). These large droplets were relatively unstable to creaming and phase separation, so it was important to transfer the coarse emulsions to the high-pressure homogenizer used to prepare the nanoemulsions relatively quickly (within a few minutes).

2.3. Impact of Operating Conditions and Formulation on Nanoemulsion Formation

Nanoemulsions were prepared using a high-pressure homogenizer (Nano DeBEE Gen II, BEE International Inc, South Easton, MA, USA). This device can be operated at operating pressures up to 45,000 psi. It is also possible to adjust the instrument to use parallel or reverse flow patterns, different nozzle dimensions, and different back pressures. Experiments were carried out to establish the impact of these machine settings on the droplet size distributions of oil-in-water nanoemulsions. Experiments were therefore carried out using parallel or reverse flow profiles, different nozzle dimensions (Z5/Z8, 0.13/0.22 mm), and with or without back pressure. To provide comparable results, the following parameters were fixed for these experiments: emulsifier type (Tween 20); emulsifier concentration (2 wt%); oil concentration (10 wt%); operating pressure (12,000 psi); the number of passes (three). For the other experiments, the following default machine settings were used: Z5 nozzle, reverse flow pattern, and no back pressure. The impact of homogenization pressure was assessed from 12,000 to 45,000 psi. The impact of emulsifier concentration was assessed from 0.2 to 5 wt%. The number of passes was assessed from 0 to 8. The impact of formulation parameters was also assessed using different oil concentrations, emulsifier concentrations, emulsifier-to-oil concentration ratios, and emulsifier types (whey protein, soy protein, gum Arabic, and Tween 20).

2.4. Characterization of the Particle Size Parameters of Nanoemulsions

Laser diffraction (Mastersizer 2000, Malvern Instruments, Worcestershire, United Kingdom) was used to measure the mean particle diameter (d32 and d43) and particle size distribution of the nanoemulsions. Here, d32 and d43 are the surface-weighted and volume-weighted mean particle diameters, respectively [39]: d32 = (Σnidi3)/(Σnidi2) and d43 = (Σnidi4)/(Σnidi3), where ni and di are the number and diameter of the droplets in the ith size category, and Σ represents the sum over all the categories (i = 1 to N). For laser diffraction, the particle size distribution of a colloidal dispersion is determined by measuring the variation of the intensity of light as a function of the scattering angle when a laser beam is directed through the sample. The particle size distribution that gives the best fit between the measured scattering pattern and the predictions made using Mie theory is then determined. The mean particle diameters are then calculated from the particle size distribution. The “Mean Particle Diameter” in all plots refers to the d32 value if not clearly specified. A measure of the width of the distribution was also calculated from the particle size distribution for some samples: W = (Σϕi(di. − d43)2/N)1/2, where di and ϕi are the particle size and the volume fraction of droplets in the ith size category, respectively, while N is the total number of size categories [39].

2.5. Statistical Analysis

The average values and standard errors of mean particle diameters were calculated from at least three measurements using Microsoft Excel. ANOVA (post hoc Tukey HSD test) software was used to ascertain the significant difference between differences between samples (p < 0.05).

3. Results and Discussion

3.1. Impact of Homogenizer Operating Parameters on Particle Size
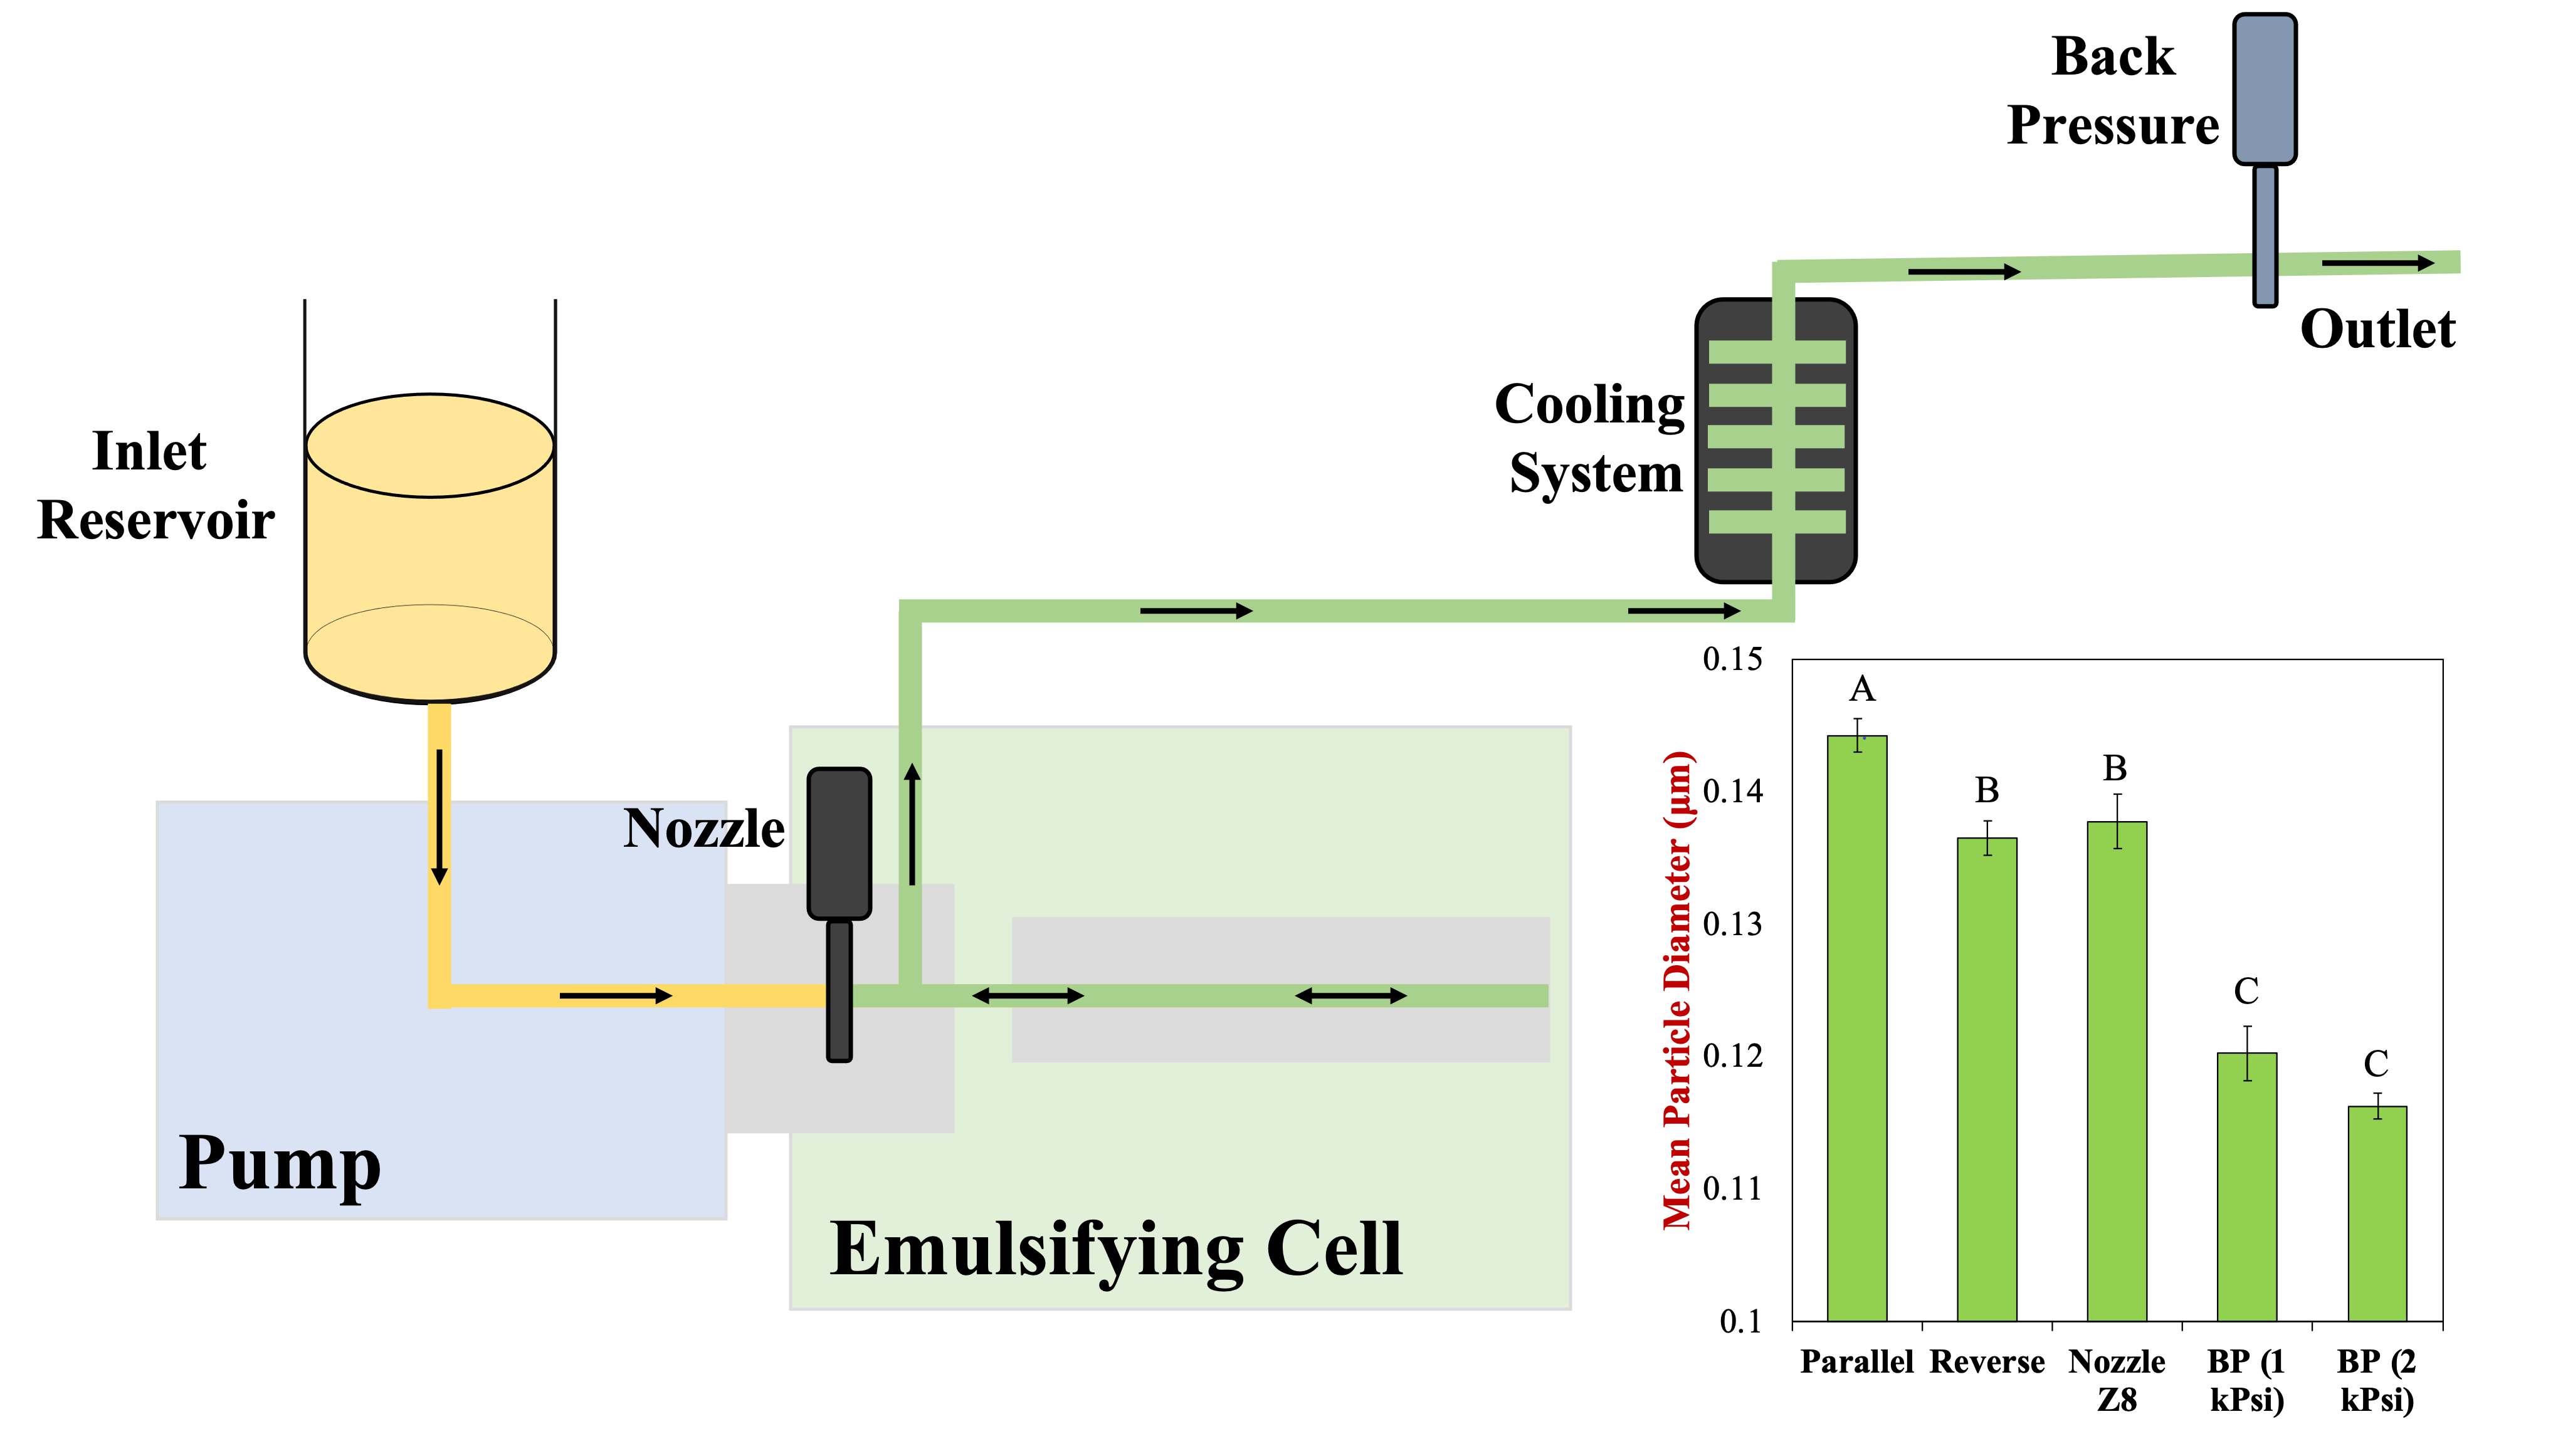
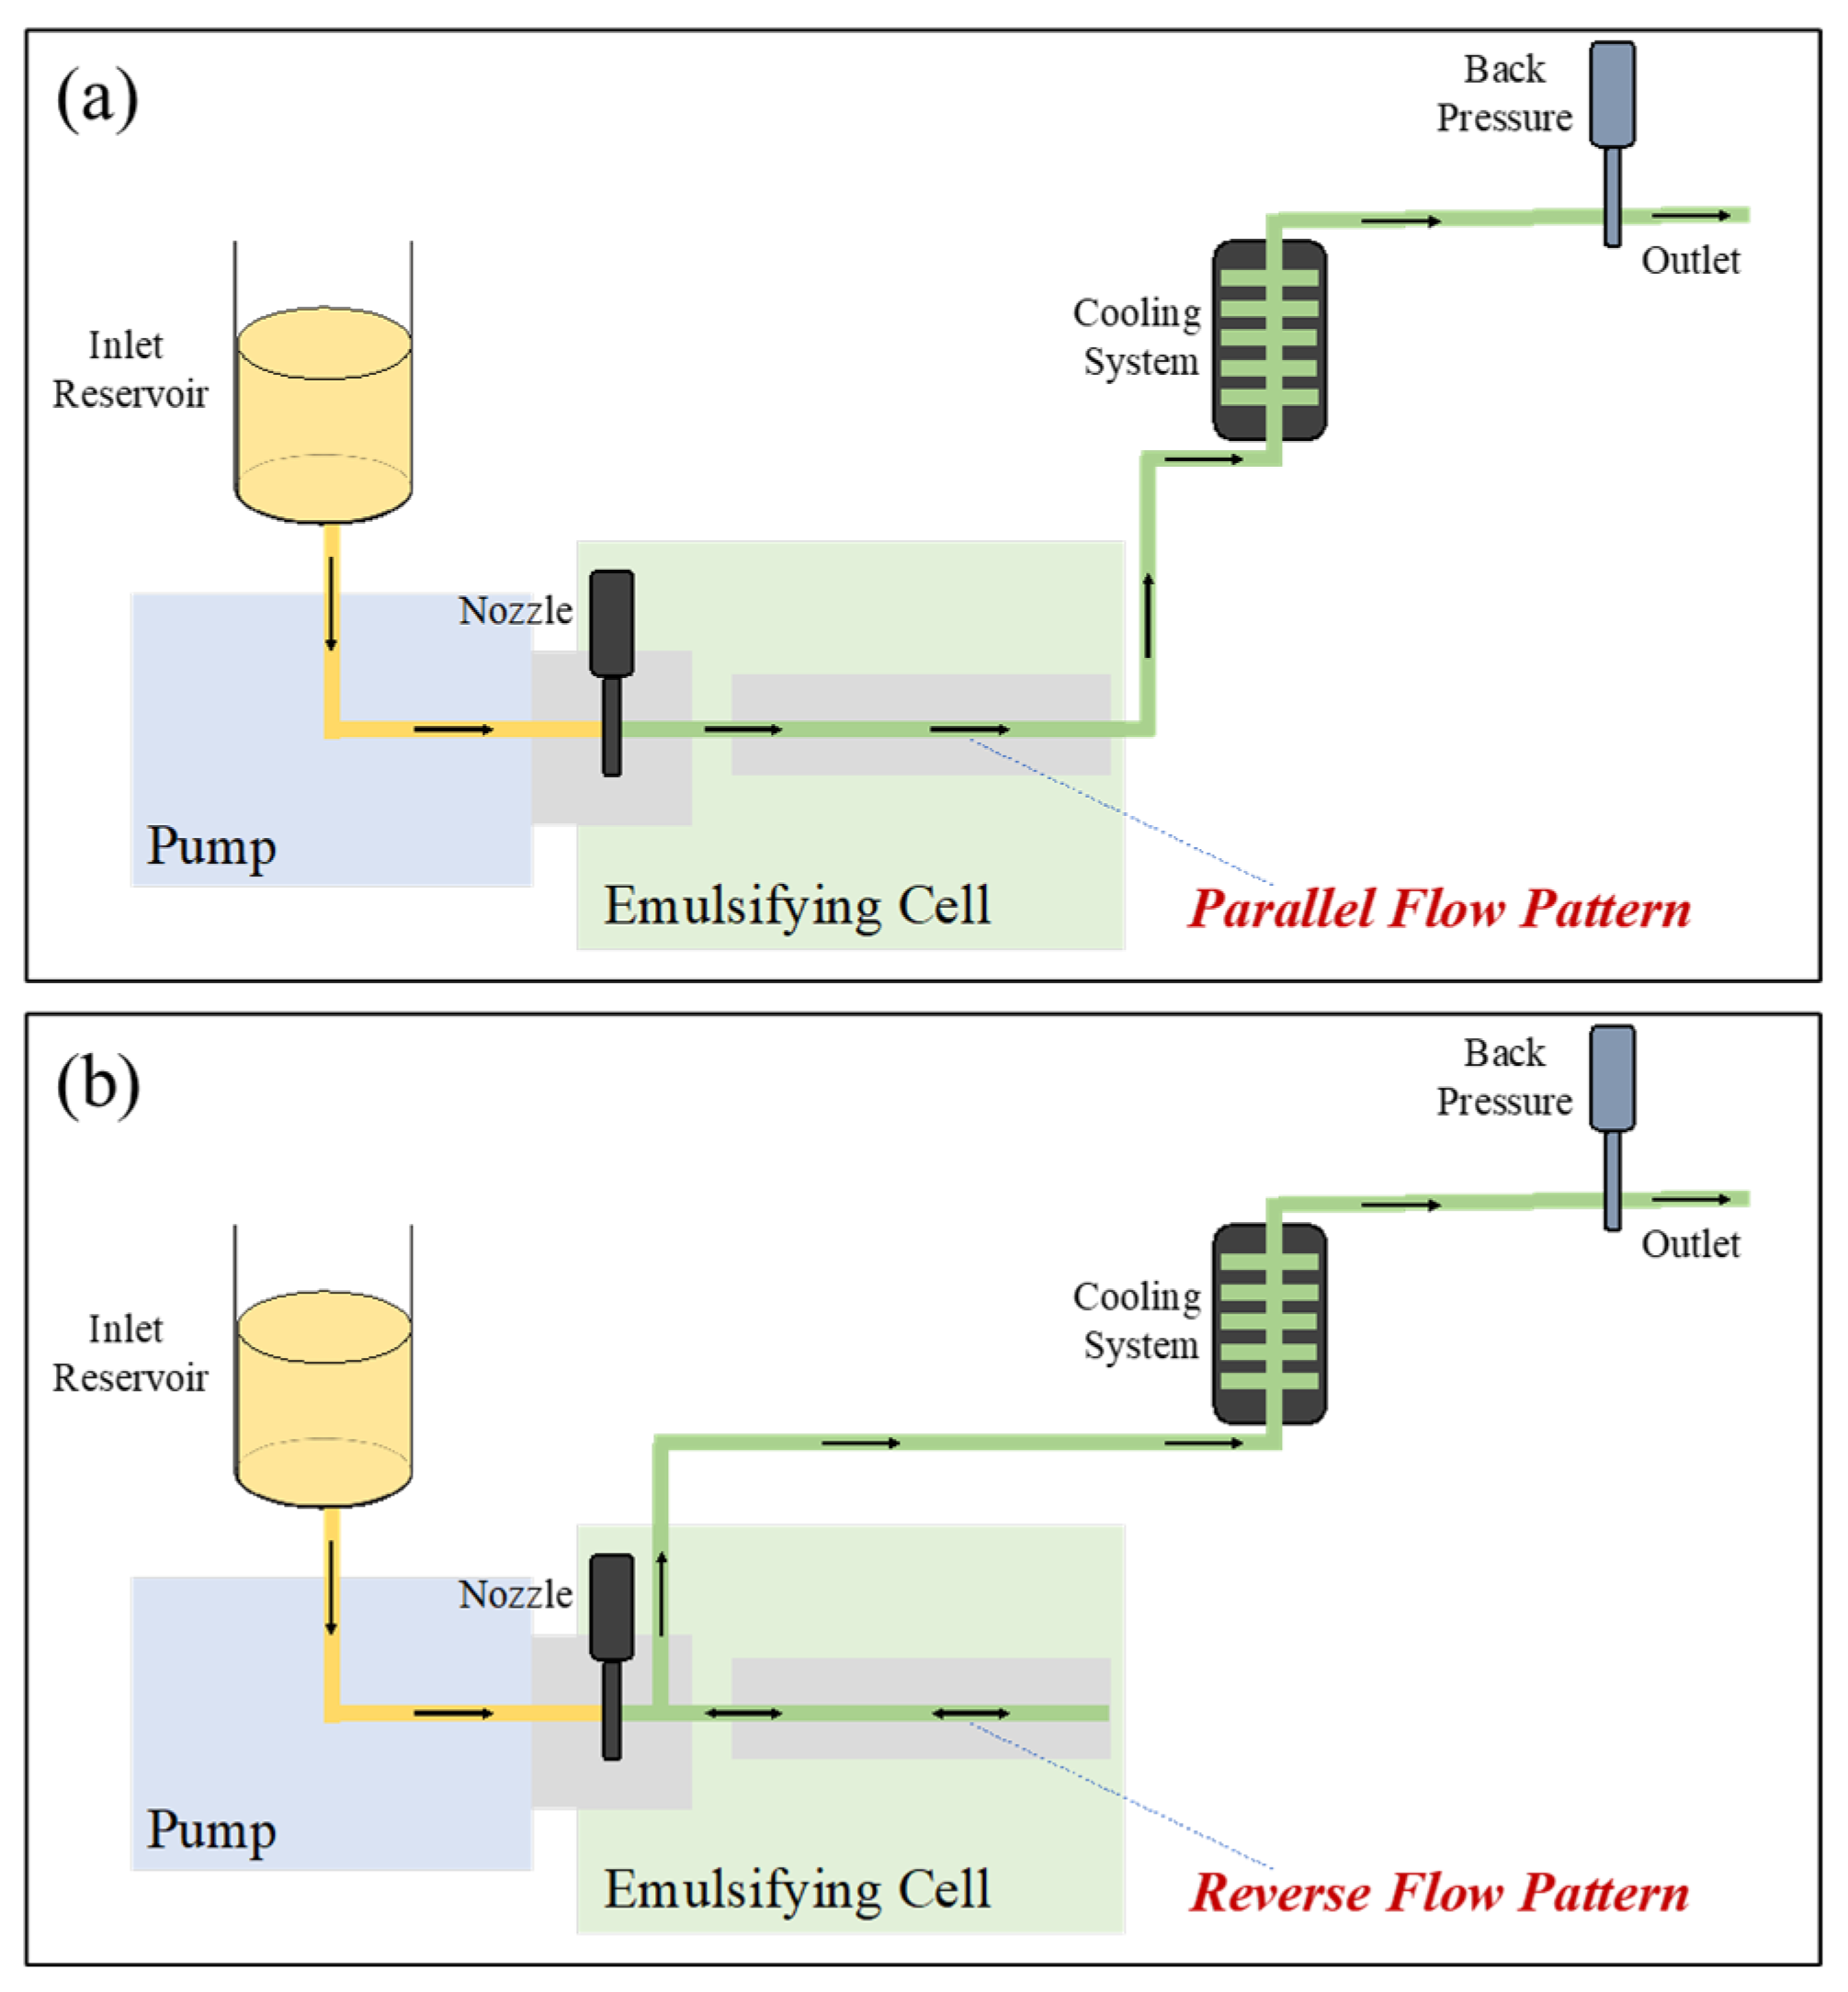
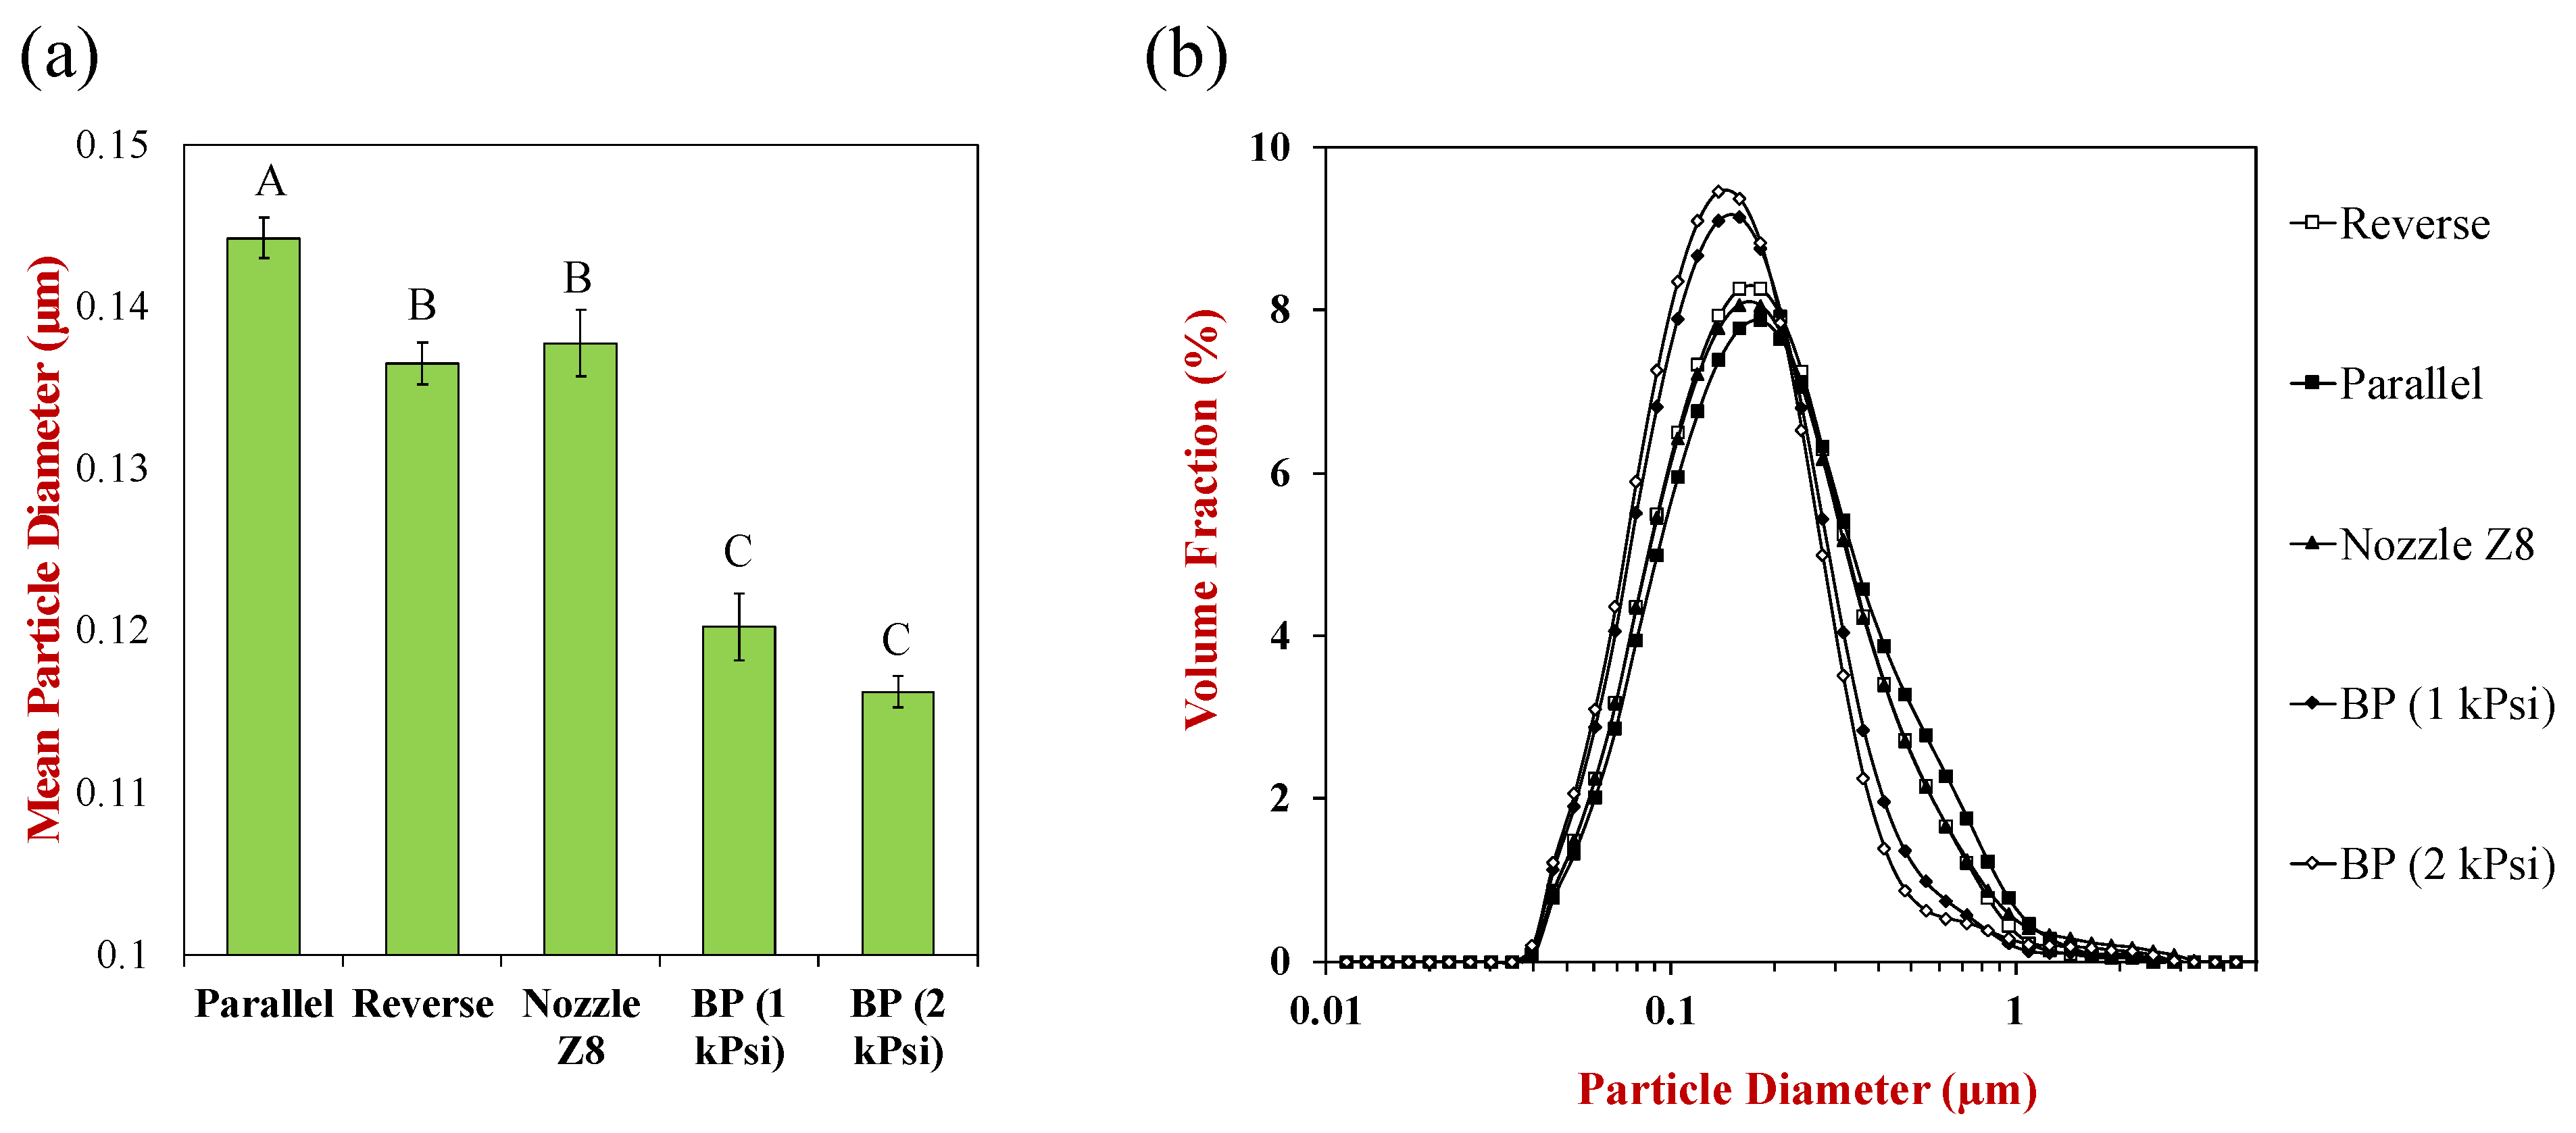
Initially, we examined the impact of operating parameters on the particle size characteristics of 10 wt% corn oil-in-water nanoemulsions stabilized by 2 wt% Tween 20 produced using the high-pressure homogenizer. Several parameters were examined, including the flow pattern, nozzle, and effects of back pressure.

3.1.1. Flow Pattern

The nature of the flow pattern within a homogenizer impacts the efficiency of droplet disruption by altering the relative magnitudes of cavitation, shear, and turbulent forces, as well as the residence time of the droplets in the disruption zone. For this reason, we examined the impact of two different flow patterns (parallel and reverse) that could be created within the homogenizer on the size of the oil droplets produced during homogenization (Figure 1). For the parallel flow pattern, the coarse emulsion is placed in the inlet reservoir, and then pressure from an intensifier pump forces it through a small nozzle. The large droplets in the coarse emulsion are broken down into smaller ones, leading to the formation of nanoemulsions in the emulsifying cell. These nanoemulsions then flow through a cooling system before being collected. For this flow pattern, back pressure is used to reduce the output flow of the nanoemulsions.
For the reverse flow pattern, there are two different channels that the nanoemulsions can pass through; one is similar to the parallel flow channel, while the other is a confined reverse flow channel (Figure 1). The reverse flow channel creates a reverse stream of nanoemulsion that impinges on the input stream, thereby creating additional disruptive forces that reduce the size of the oil droplets. As a result, the reverse flow pattern should be more effective at reducing the proportion of large droplets in the nanoemulsions than the parallel flow pattern.
As expected, the experimental measurements showed that more nanoemulsions with smaller mean droplet diameters and a narrower particle size distribution were produced using the reverse flow pattern compared to the parallel one (Figure 2). Even so, this effect was relatively small. For instance, the mean particle diameter (d32) was 0.137 ± 0.001 µm for reverse flow and 0.144 ± 0.001 µm for parallel flow (less than 5% difference).

3.1.2. Impact of Nozzle Dimensions

The impact of nozzle dimensions was also examined for nanoemulsions that were all produced using the reverse flow profile. Nanoemulsions were produced using a small nozzle (Z5: 0.13 mm) and a large nozzle (Z8: 0.22 mm). The samples produced using the small nozzle are labelled “Reverse”, while those produced using the large nozzle are labeled as “Nozzle Z8” in Figure 2. We hypothesized that the smaller nozzle would produce nanoemulsions containing smaller droplets, but the difference was not significant. For instance, the mean particle diameter (d32) was 0.137 ± 0.001 µm for the small nozzle and 0.138 ± 0.002 µm for the large nozzle (less than 1% difference). Thus, the nozzle dimensions had practically no impact on the formation of nanoemulsions for this particular formulation.

3.1.3. Impact of Back Pressure

The impact of applying back pressure to the nanoemulsions during homogenization was then examined. Previous studies have shown that applying back pressure can alter the cavitation zones around a nozzle, which can alter the efficiency of droplet disruption inside a homogenizer [40,41]. We found that applying back pressure led to a significant reduction in particle size. In this case, the samples were labelled as “Reverse”, “BP 1 KPsi”, and “BP 2 KPsi” for nanoemulsions prepared using 0, 1000 psi and 2000 psi of back pressure, respectively. The mean particle diameters (d32) were 0.137 ± 0.001, 0.122 ± 0.002, and 0.116 ± 0.001 µm for these three nanoemulsions, respectively (Figure 2a). Moreover, the width of the particle size distribution became narrower at the higher back pressures (Figure 2b). These results suggest that the use of back pressure is beneficial for producing nanoemulsions containing smaller droplets. This effect can be attributed to the alteration in the cavitation pattern around the nozzle in the presence of back pressure, as well as the increased retention time of the nanoemulsions in the disruptive zone.

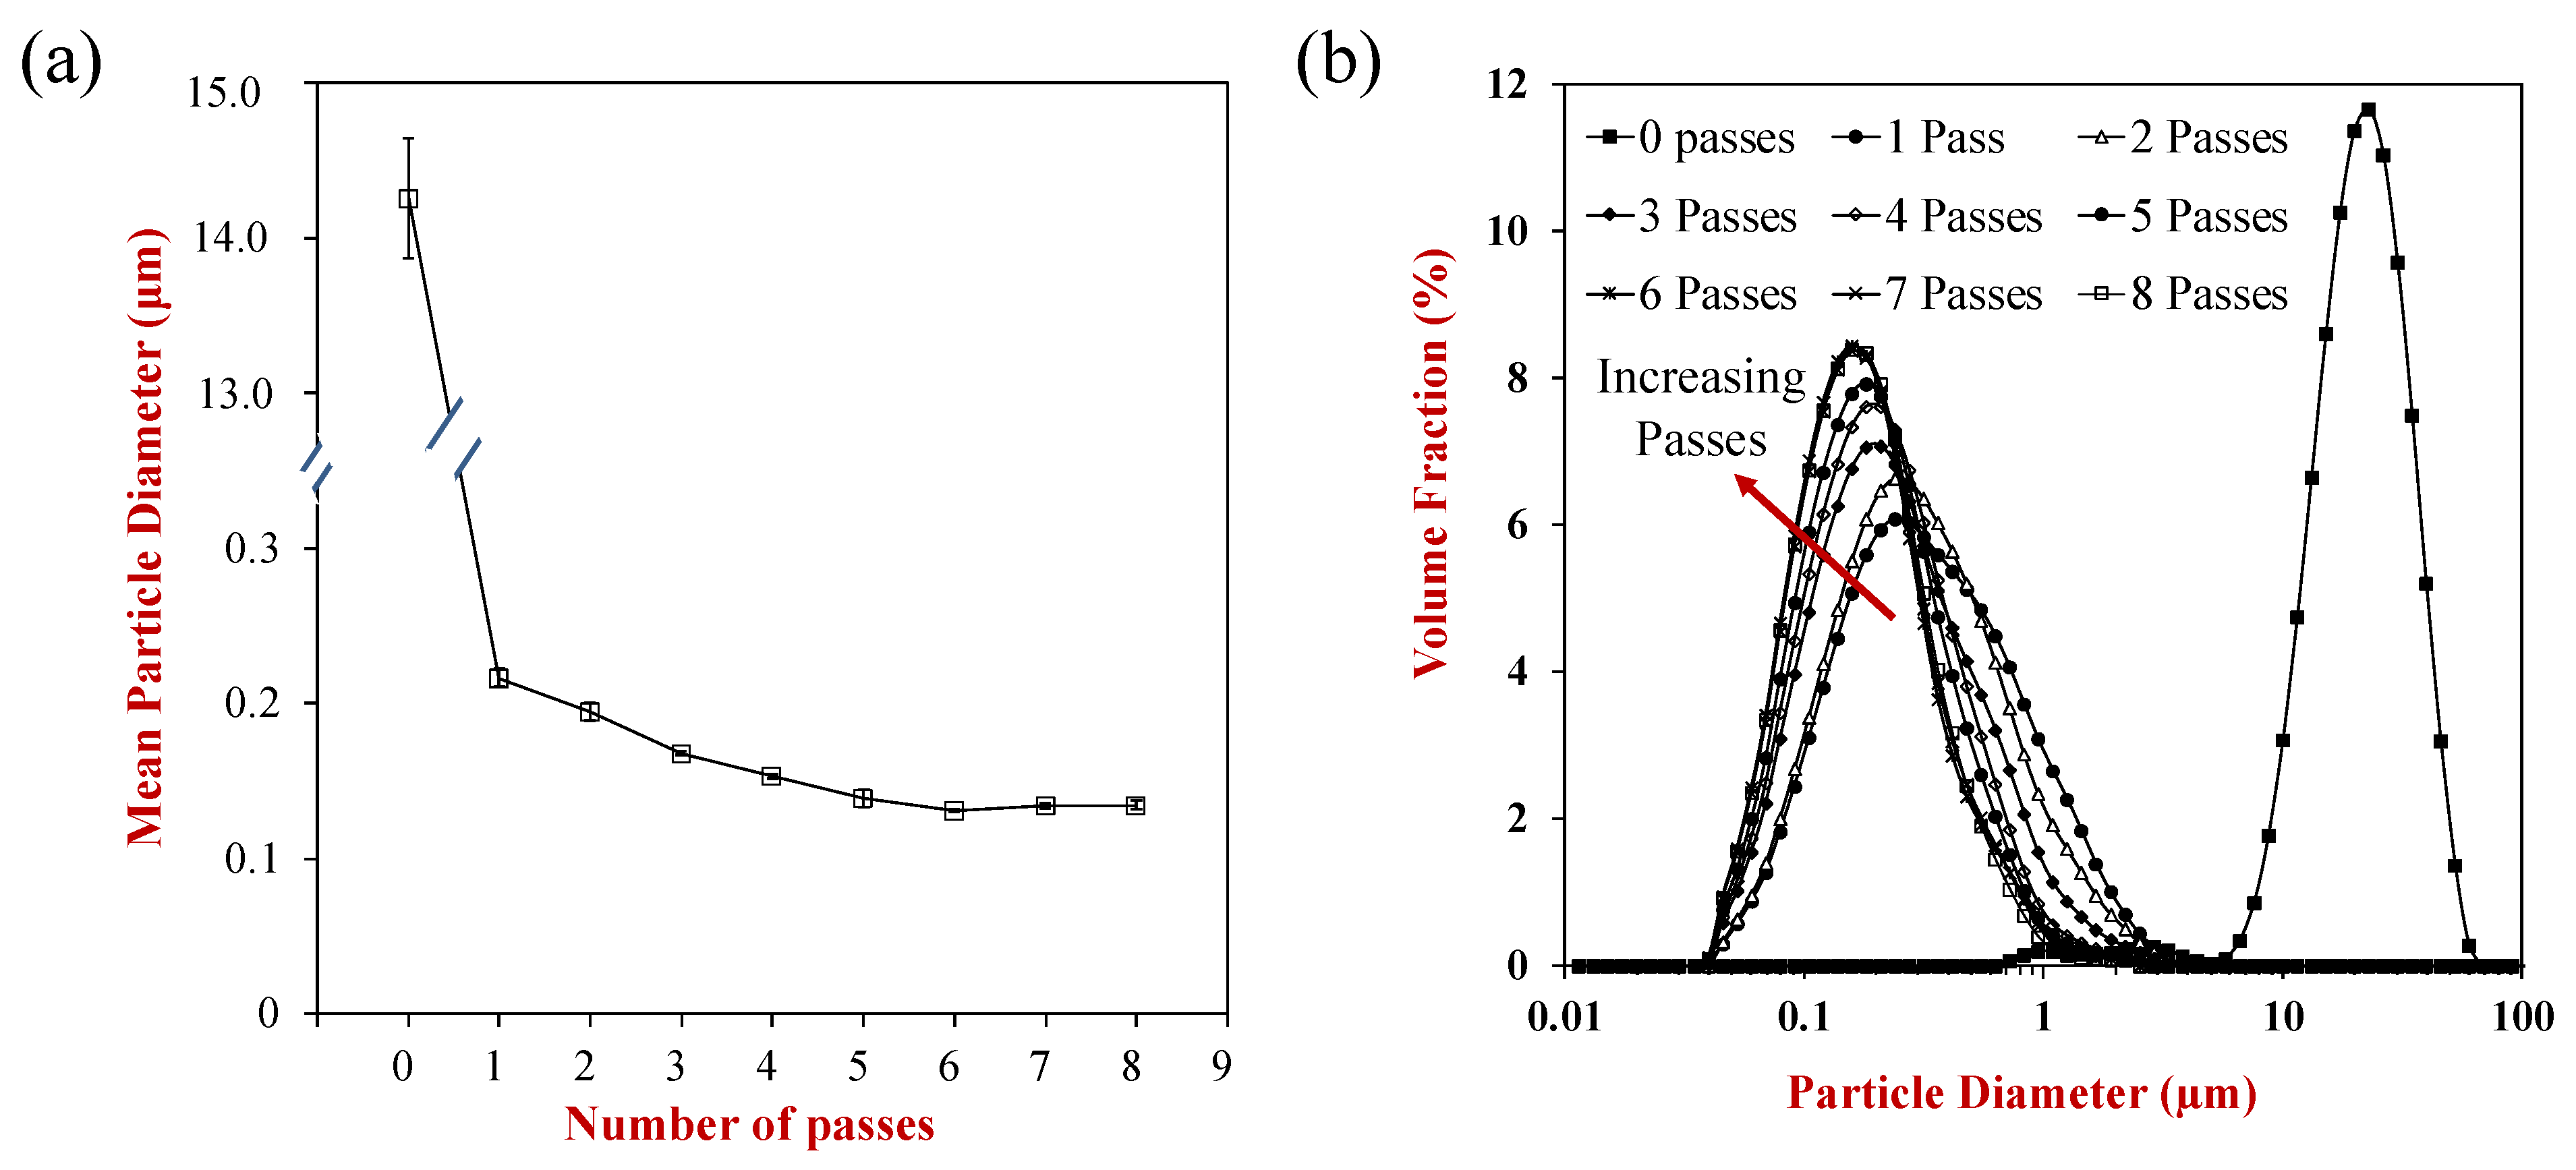
3.1.4. Number of Passes

Another effective mean of controlling the size of the droplets in nanoemulsions is to alter the number of times they are passed through the homogenizer nozzle. The influence of the number of passes through the homogenizer on the mean droplet diameter and particle size distribution was therefore measured (Figure 3). Prior to passing through the homogenizer, the mean particle diameter of the coarse emulsion was around 14.2 μm. These emulsions were relatively unstable to creaming and oiling-off, which can be attributed to the increase in gravitational forces and coalescence rate with increasing droplet size [39]. A single pass through the homogenizer caused a pronounced decrease in the mean particle diameter, which can be attributed to the intense, disruptive forces (cavitation, shear, and turbulence) the emulsions experience as they pass through the homogenizer nozzle. The mean particle diameter then continued to decrease as the number of passes was increased, but there was only a fairly modest reduction in mean particle size with an increasing number of passes. For example, the mean particle diameter decreased from 0.217 ± 0.006 μm after one pass to 0.134 ± 0.003 μm after eight passes. The number of passes had an important impact on the particle size distributions of the nanoemulsions (Figure 3b). The width of the particle size distribution decreased with an increasing number of passes from one to six passes and then remained relatively constant. For instance, the calculated widths of the distributions were 10.4, 0.46, 0.41, 0.33, 0.25, 0.23, 0.21, 0.21, and 0.19 µm from zero to eight passes, respectively. This effect can mainly be attributed to the fact that a larger fraction of the droplets in the nanoemulsions has a chance to pass through the intense, disruptive zone inside the homogenizer as the number of passes increases.
These results show that nanoemulsions with smaller droplets and narrower particle size distributions can be produced by increasing the number of passes through the homogenizer. However, the time and energy requirements increase for each additional pass, which would increase energy costs and reduce the sustainability of the process. Consequently, a limited number of passes would be preferred for most industrial applications. For this reason, we used three passes as a default number of passes in this study. Other researchers have also reported a decrease in droplet size with the number of passes for nanoemulsions produced using high-pressure homogenizers [32,42].

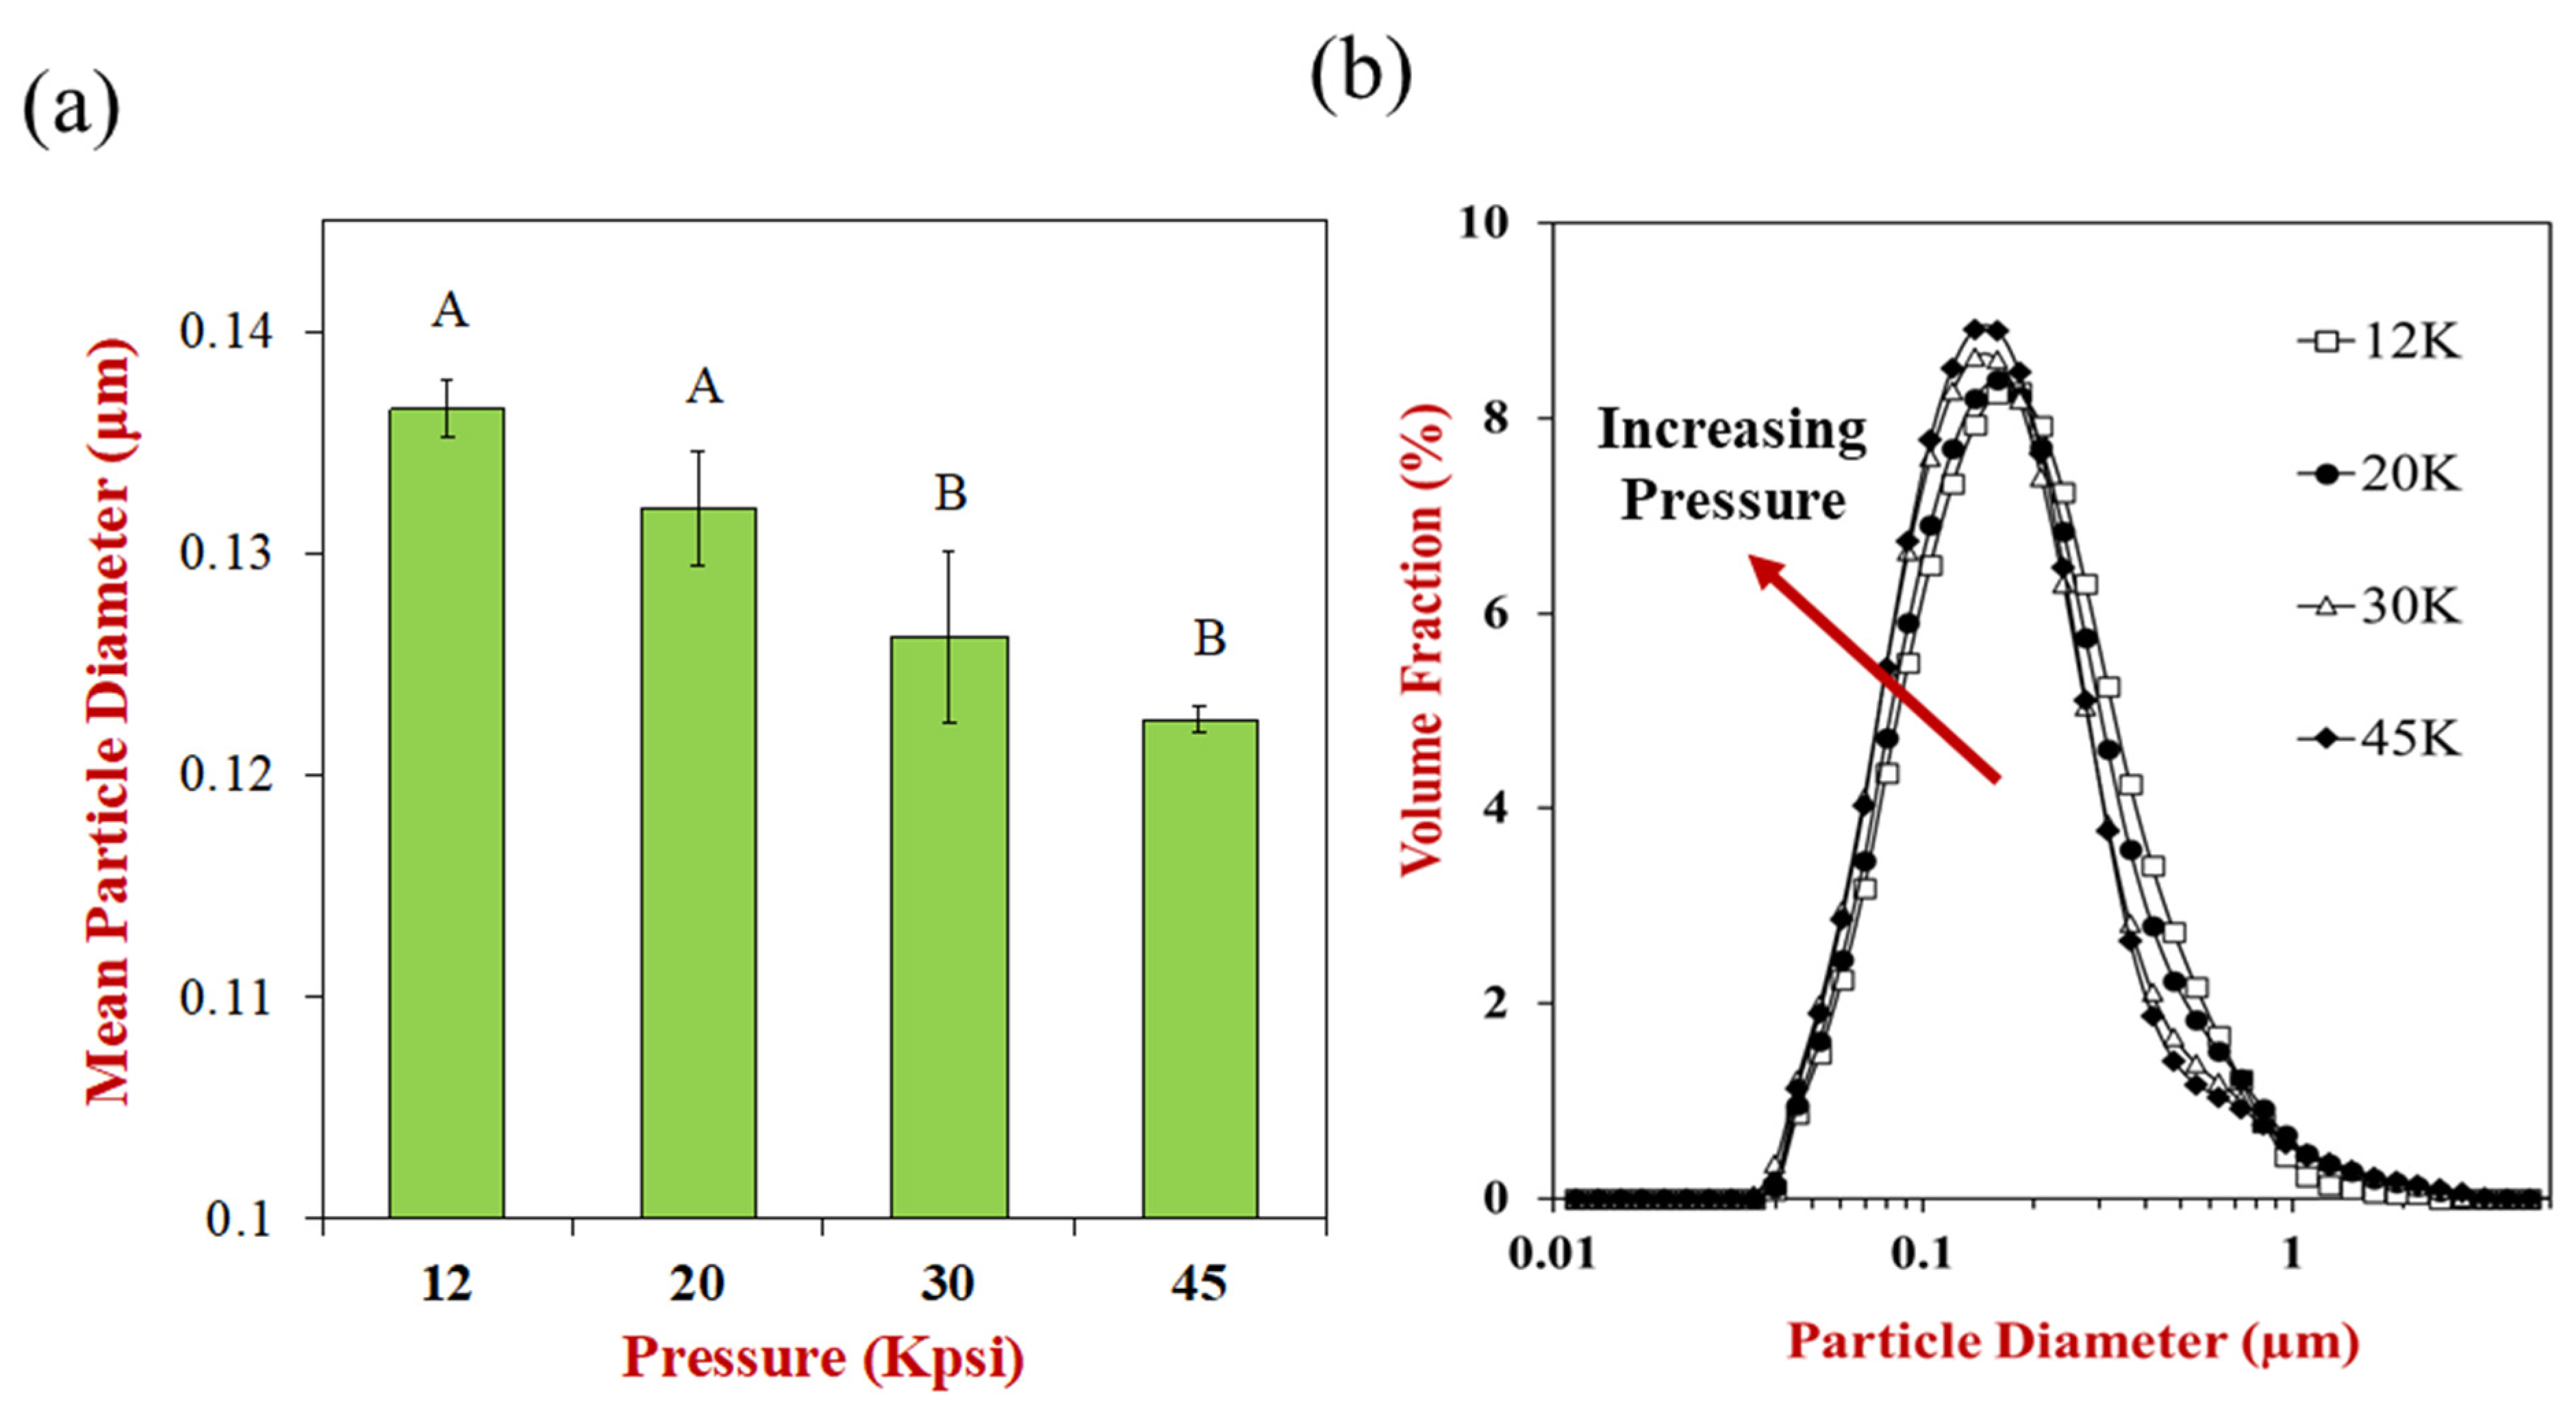
3.1.5. Homogenization Pressure

Controlling the operating pressure of a homogenizer can also be utilized to alter the particle size of nanoemulsions since the magnitude of the disruptive energy generated inside the device increases as the pressure used to force the emulsion through the nozzle is raised [43]. As expected, the mean droplet diameter decreased with increasing operating pressure, which agrees with previous studies [32,44]. Previous studies with high-pressure homogenizers have shown there is often a linear log–log relationship between the mean particle diameter and operating pressure when there is sufficient emulsifier present to cover all the droplets formed [43]. As expected, there was a linear log–log relationship between the mean particle diameter and homogenization pressure with a slope of around −0.084 (see Figure 4 caption). However, the reduction in mean particle diameter with increasing pressure was relatively small. For example, the mean particle diameter decreased from around 0.137 ± 0.001 at 12,000 psi to 0.123 ± 0.001 μm at 45,000 psi, which indicates that an approximately three-fold increase in pressure only caused a 10% reduction in particle size. Moreover, there was only a small change in the droplet size distribution with increasing pressure (Figure 4b).
As the operating pressure is raised, the energy costs of the homogenization process increase, which is undesirable from a cost and sustainability perspective. Consequently, it may be better to use as low an operating pressure as possible to create nanoemulsions with sufficient stability and functional performance. For this reason, we used an operating pressure of 12,000 psi as a default value to produce nanoemulsions with small droplets without incurring excessively high energy costs.

3.2. Impact of Nanoemulsion Properties

In addition to the operating conditions of the homogenizer, the nature of the components used to prepare a nanoemulsion also impacts the mean droplet diameter and particle size distribution [43]. For this reason, we examined the impact of emulsifier concentration (at a fixed oil concentration and at a fixed emulsifier-to-oil ratio) and emulsifier type on the efficiency of homogenization.

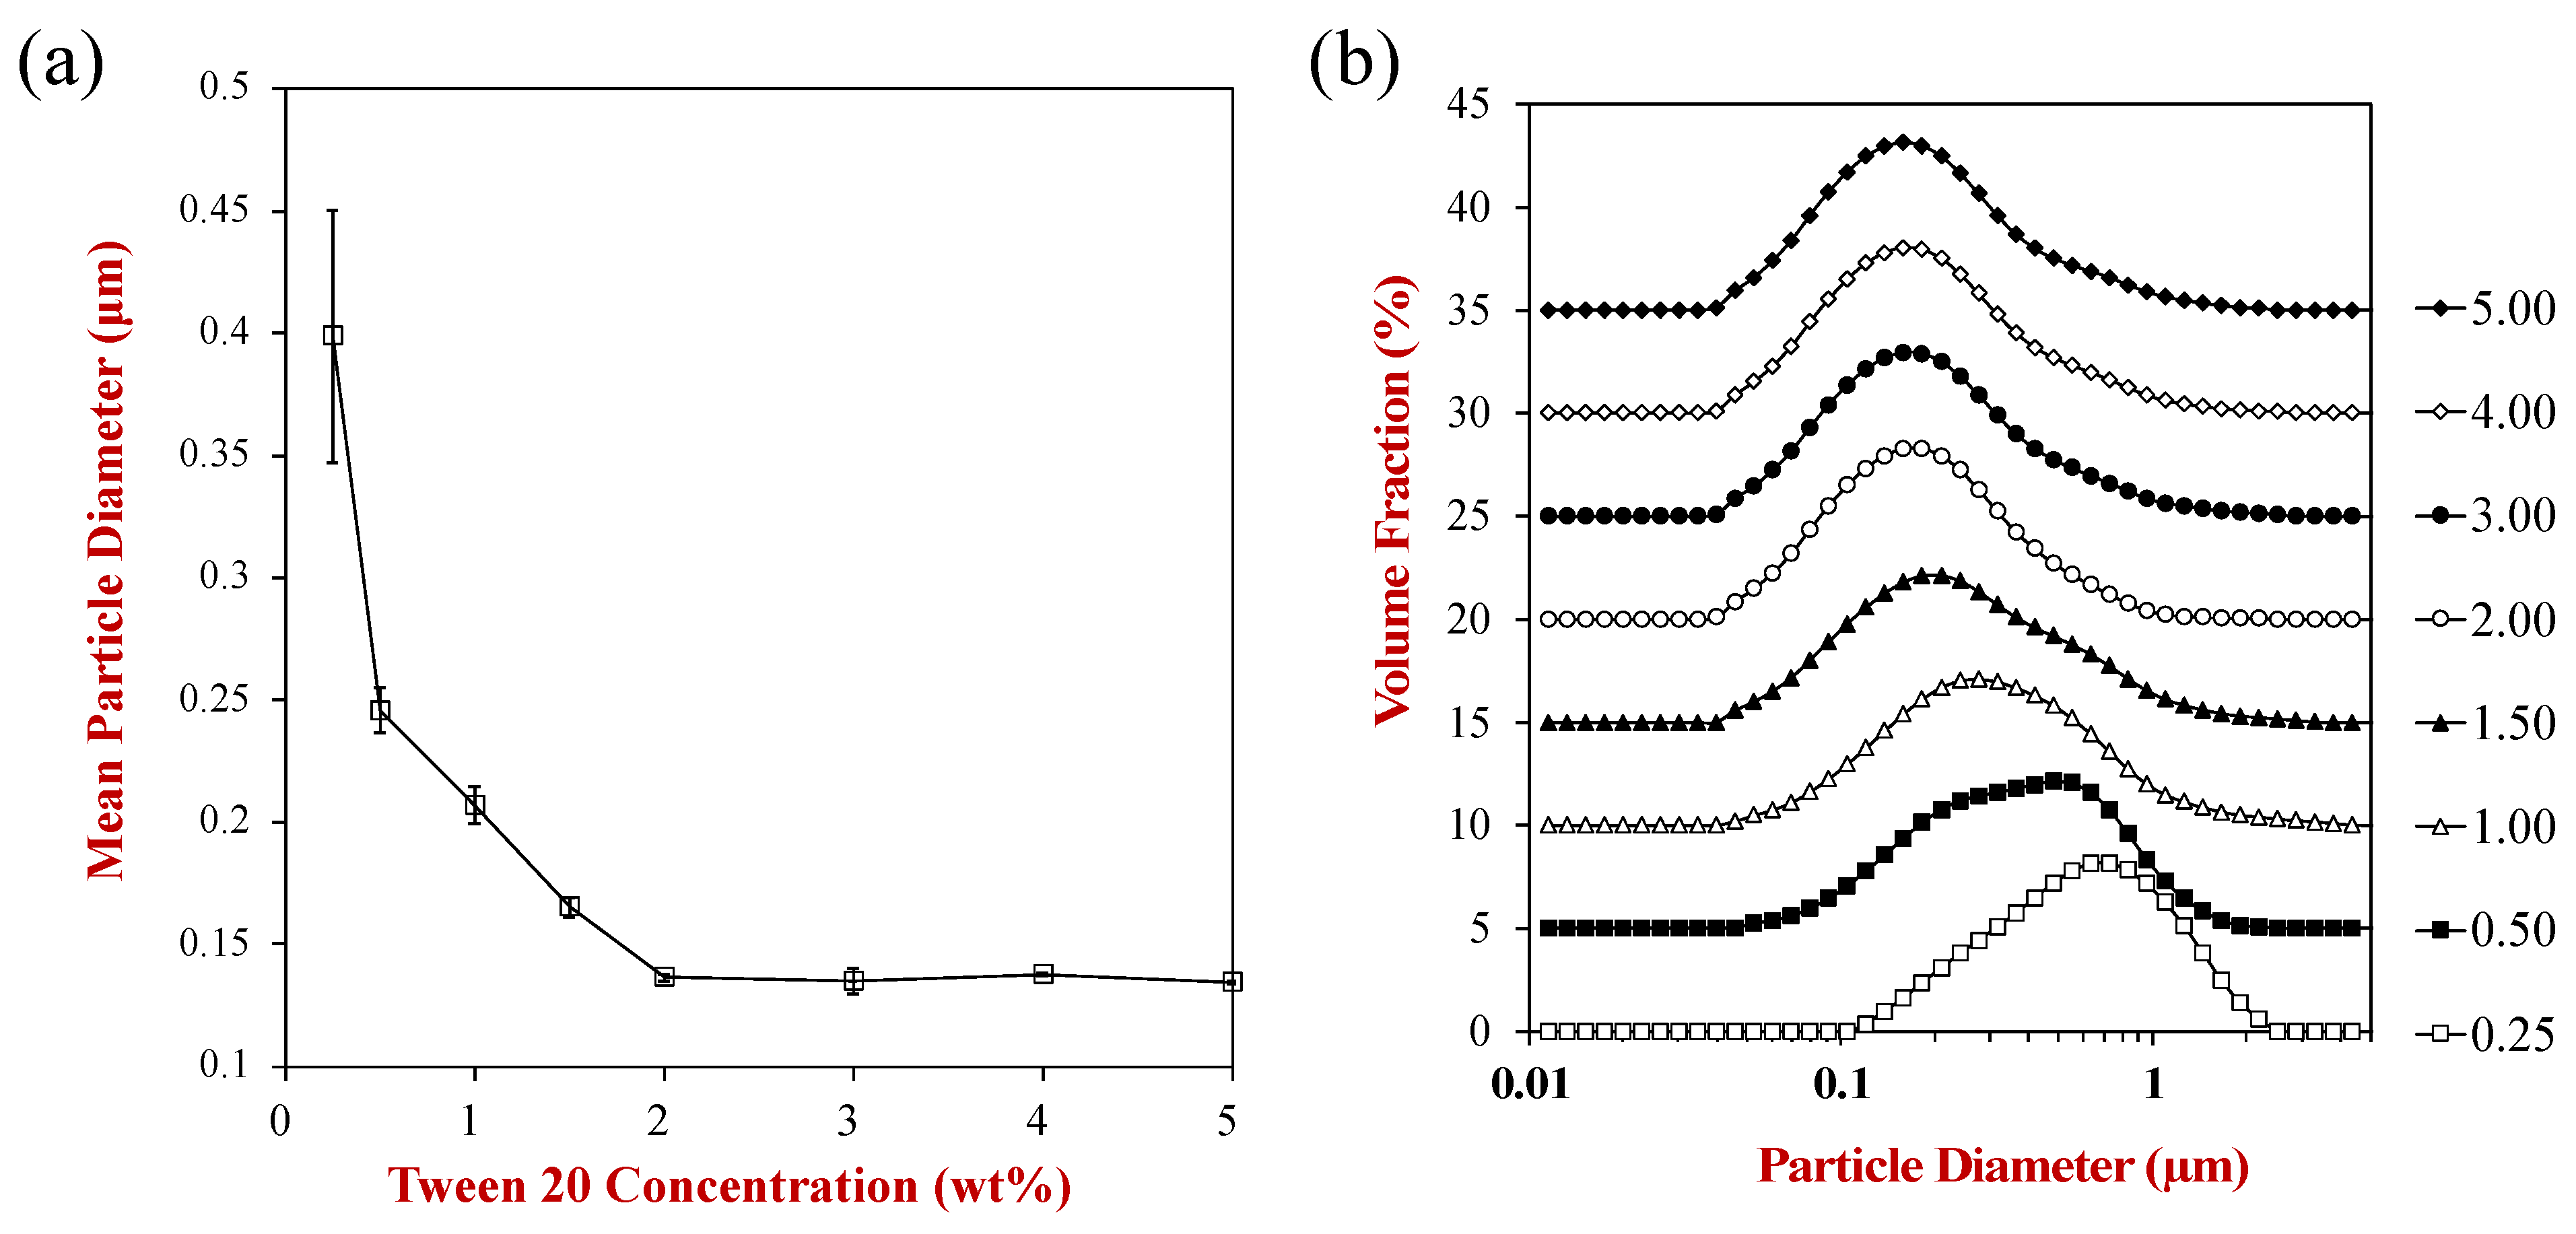
3.2.1. Emulsifier Concentration at a Fixed Oil Concentration

Initially, we examined the impact of emulsifier concentration on the mean particle diameter and particle size distribution of nanoemulsions with a fixed oil concentration, i.e., 10 wt% (Figure 5). As the emulsifier concentration was increased, the mean particle diameter of the nanoemulsions decreased significantly from 0.2 to 2 wt% Tween 20 and then remained relatively constant from 2 to 5 wt% Tween 20. This reduction in particle size with increasing emulsifier concentration can be attributed to two main physicochemical phenomena [39]. First, the time required for the oil droplet surfaces to become saturated with emulsifier molecules is reduced at higher emulsifier concentrations, which inhibits the recoalescence of the oil droplets inside the homogenizer. Second, smaller droplets have a larger specific surface area than larger ones and so require more emulsifiers to stabilize them. The minimum concentration of emulsifier required to completely cover all of the oil droplet surfaces in a nanoemulsion can be calculated using the following equation [45]:
C s = 6 × Γ × Φ d 32
here Cs is the minimum concentration of emulsifier required to reach saturation (kg/m3), Γ is the surface load of the emulsifier at saturation, Φ is the dispersed phase volume fraction, and d32 is the surface-weighted mean droplet diameter [39,46]. To a first approximation, the saturation concentration of Tween 20 was calculated to be about 1 wt% (d32 = 130 nm, Φ = 0.1, Γ = 2.0 × 10⁻⁶ kg/m2) [47], which is fairly close to the value of 2 wt% observed experimentally. The fact that a higher concentration was required than predicted may have been because not all of the surfactant molecules adsorbed to the oil–water interfaces in the nanoemulsions. For instance, some of the surfactant molecules may have been present as monomers or micelles in the aqueous phase.
Practically, it is important to use the minimum amount of emulsifier that can produce stable nanoemulsions containing small droplets; otherwise, ingredient costs will be increased. For this reason, 2 wt% Tween 20 was selected as the default concentration to produce the nanoemulsions.

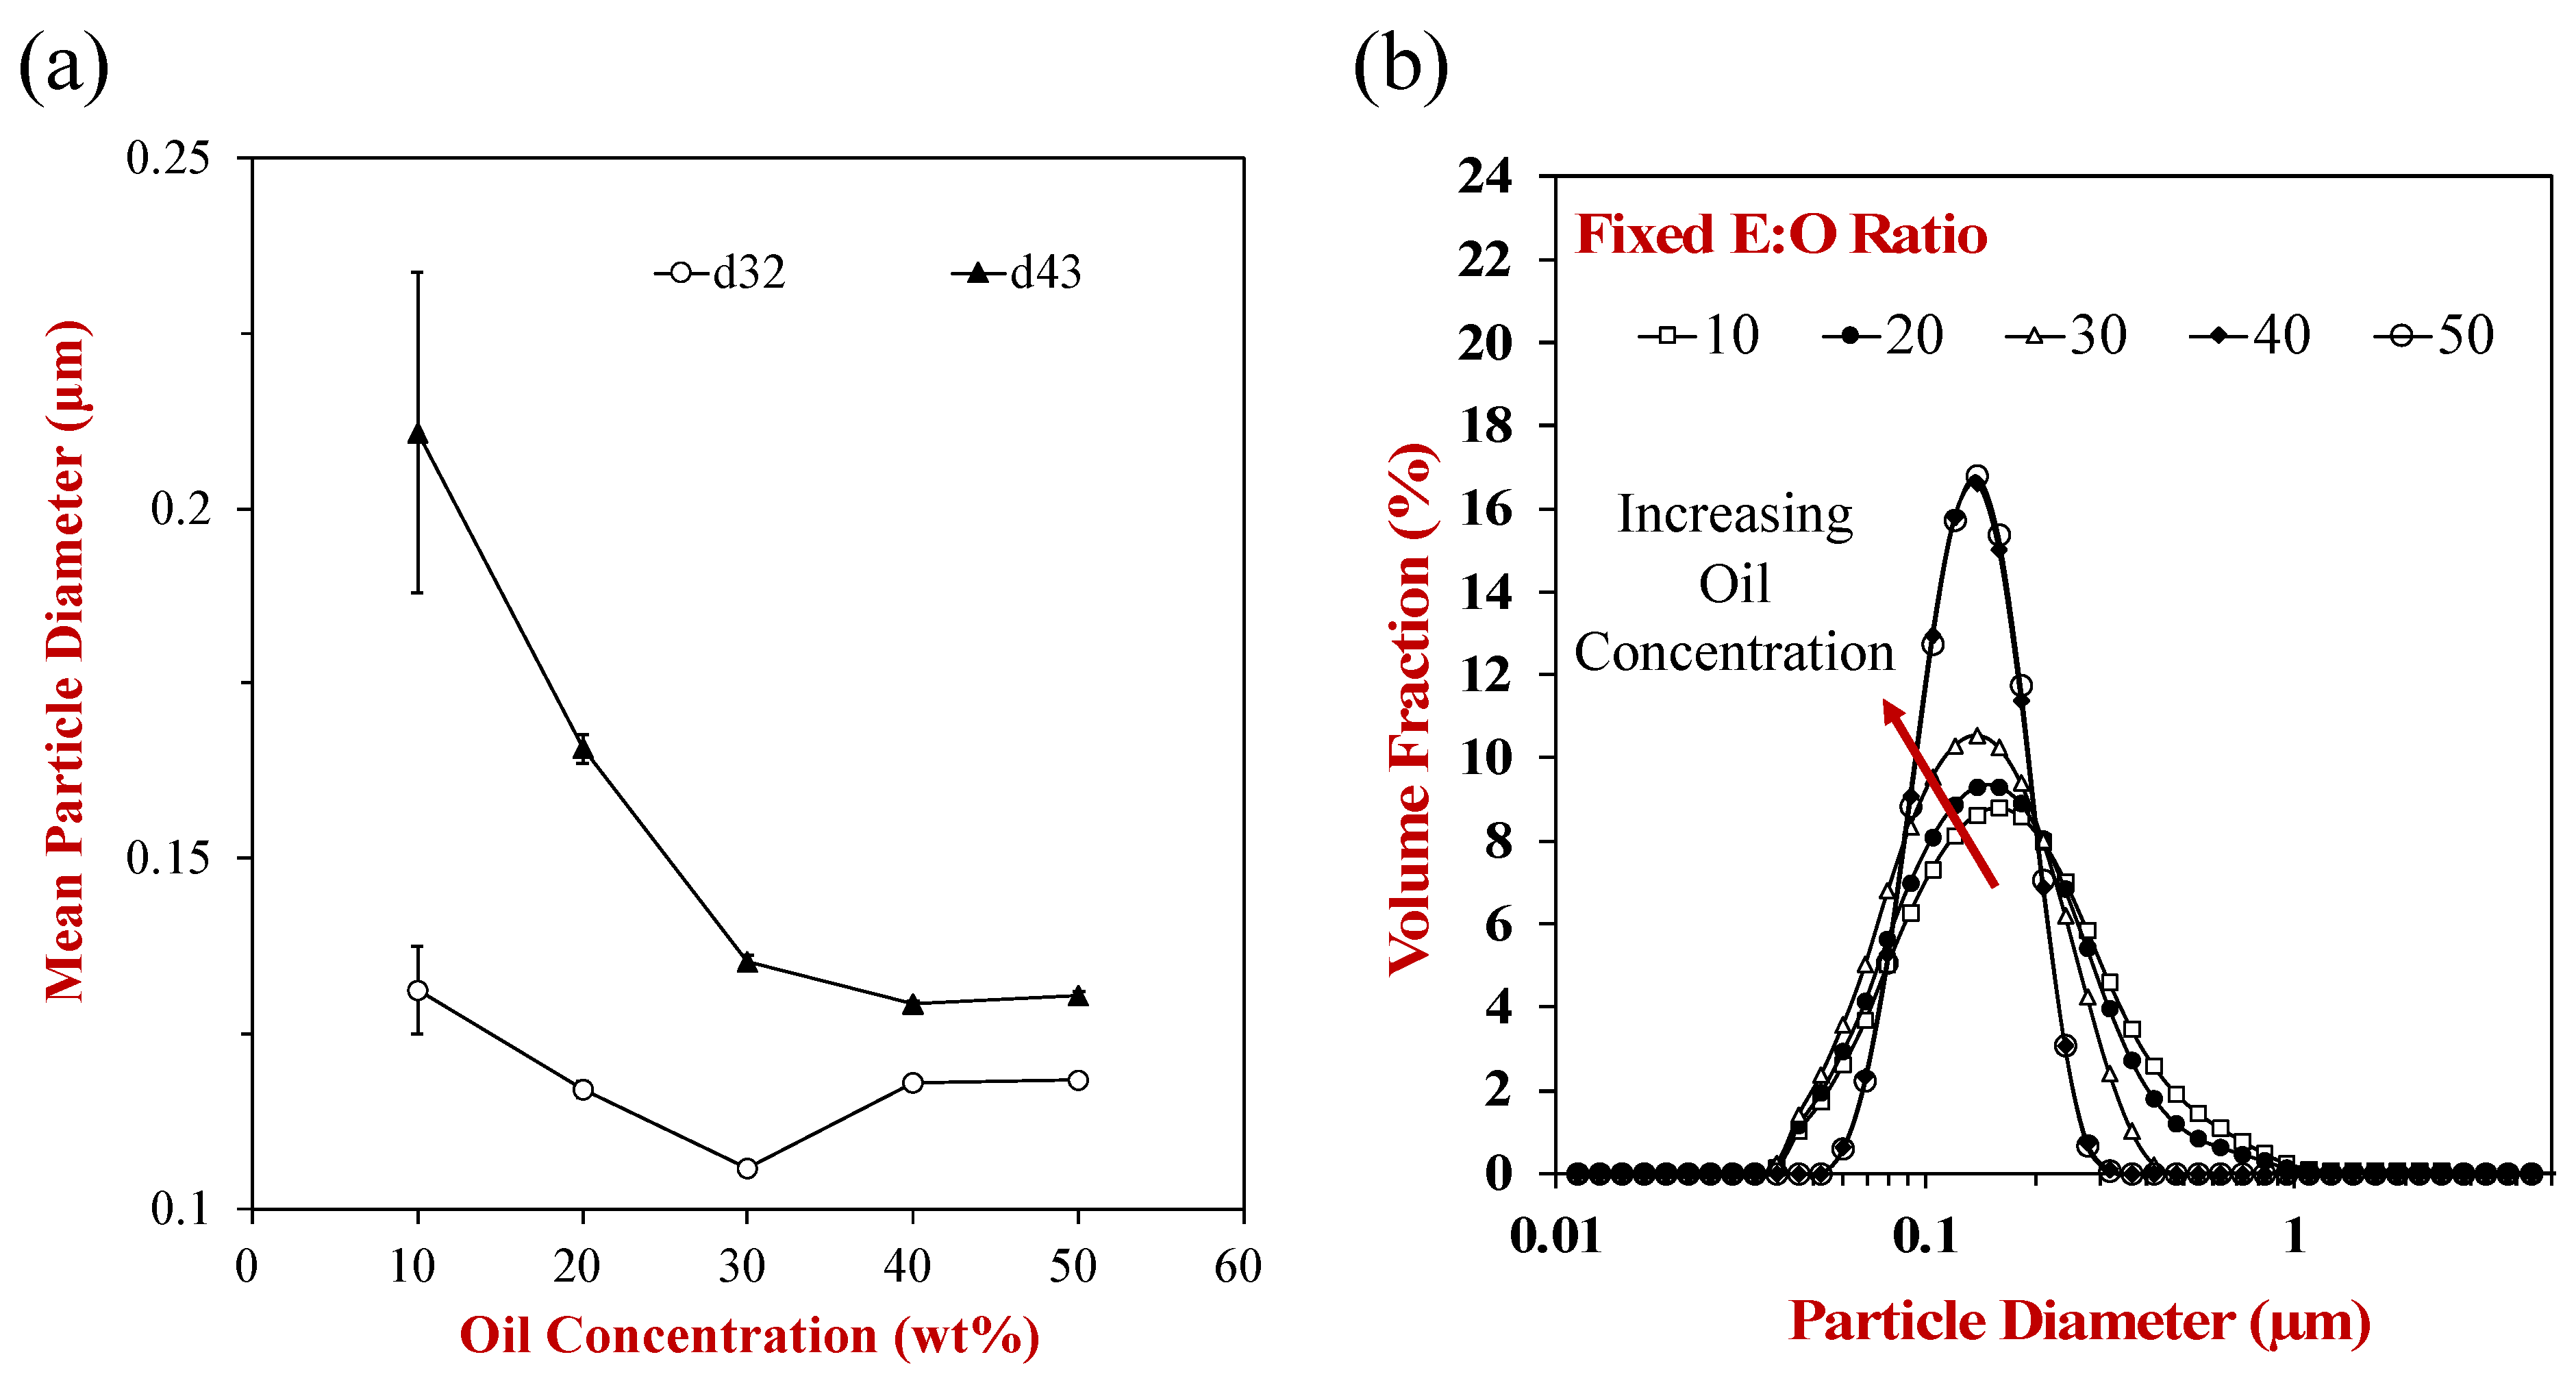
3.2.2. Oil Concentration

For many commercial applications, it is necessary to create nanoemulsions containing a relatively high amount of oil, as this impacts their appearance, rheology, sensory attributes, and delivery properties. For this reason, we examined the impact of oil concentration on the formation of nanoemulsions. In these experiments, the emulsifier-to-oil concentration was fixed at 2:10, as this ratio was found to create small droplets in the previous section. The impact of increasing the oil concentration on the mean particle diameter (d32 and d43) and particle size distributions of the nanoemulsions was then examined (Figure 6). Both d32 and d43 decreased with increasing oil concentration, with the effect being particularly noticeable for the d43 values, which are more sensitive to the larger droplets in an emulsion. The widths of the particle size distribution also decreased with increasing oil concentration (Figure 6b). These results show that using a higher oil concentration is beneficial for producing nanoemulsions with smaller droplets and narrower size distributions. Moreover, this would be beneficial from a cost and time perspective since the total operating time of the homogenizer could be reduced. The origin of the decrease in droplet size with increasing droplet concentration may have been due to the increase in viscosity of the nanoemulsions at higher droplet concentrations. A higher viscosity leads to greater shear stresses being generated during homogenization, thereby leading to smaller droplet sizes. Conversely, a higher droplet concentration may also lead to more frequent droplet–droplet collisions, which could promote coalescence within the homogenizer. It should be noted that we could not form nanoemulsions at 60 wt% oil or higher, which was because they were too viscous to pump through the homogenizer.

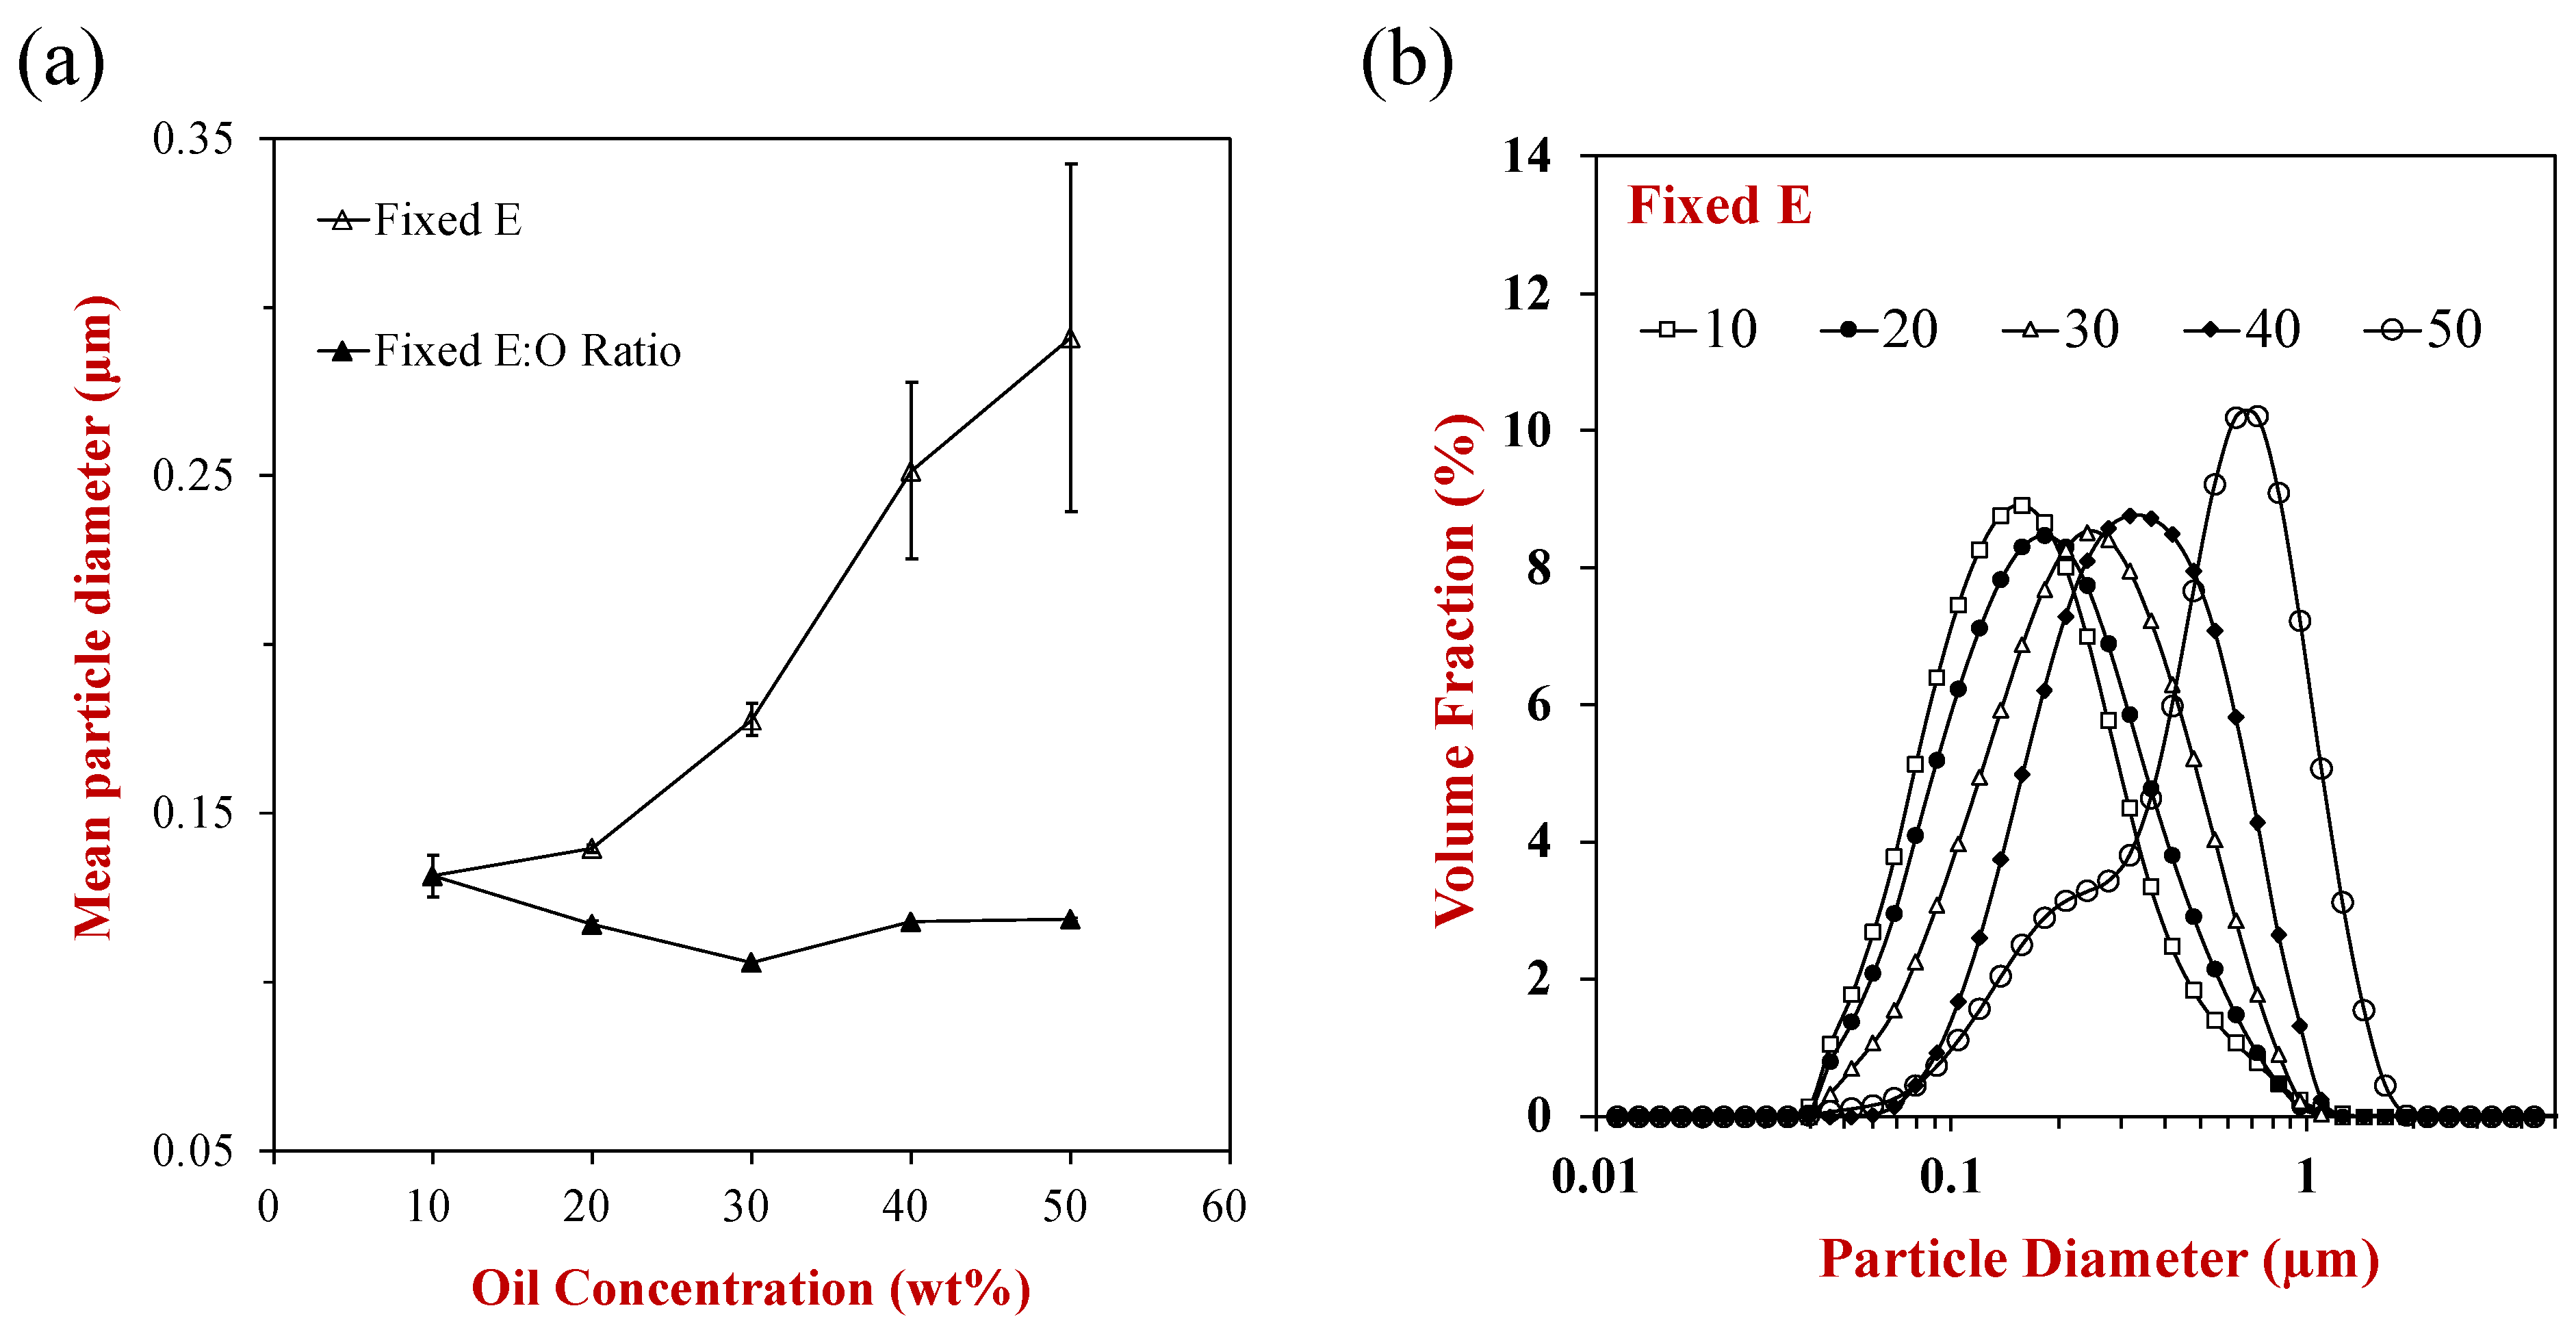
3.2.3. Emulsifier-To-Oil Concentration

When formulating an oil-in-water nanoemulsion, it is possible to increase the oil concentration while keeping the emulsifier concentration constant or while keeping the emulsifier-to-oil concentration constant, which impacts the size of the droplets formed (Figure 7). At a fixed emulsifier concentration, which is 2 wt%, the mean particle diameter increased with increasing oil concentration, which can be attributed to the fact that there was insufficient emulsifier present to cover all of the droplet surfaces in the concentrated nanoemulsions. As a result, droplet coalescence occurred during homogenization, leading to an increase in droplet size [48]. In contrast, at a fixed emulsifier-to-oil ratio (= 0.2), the mean particle diameter decreased with increasing oil concentration, which can be attributed to the reasons discussed in the previous section, i.e., increased disruptive forces for more viscous nanoemulsions. These experiments highlight the importance of keeping the emulsifier-to-oil ratio constant when increasing the oil concentration.

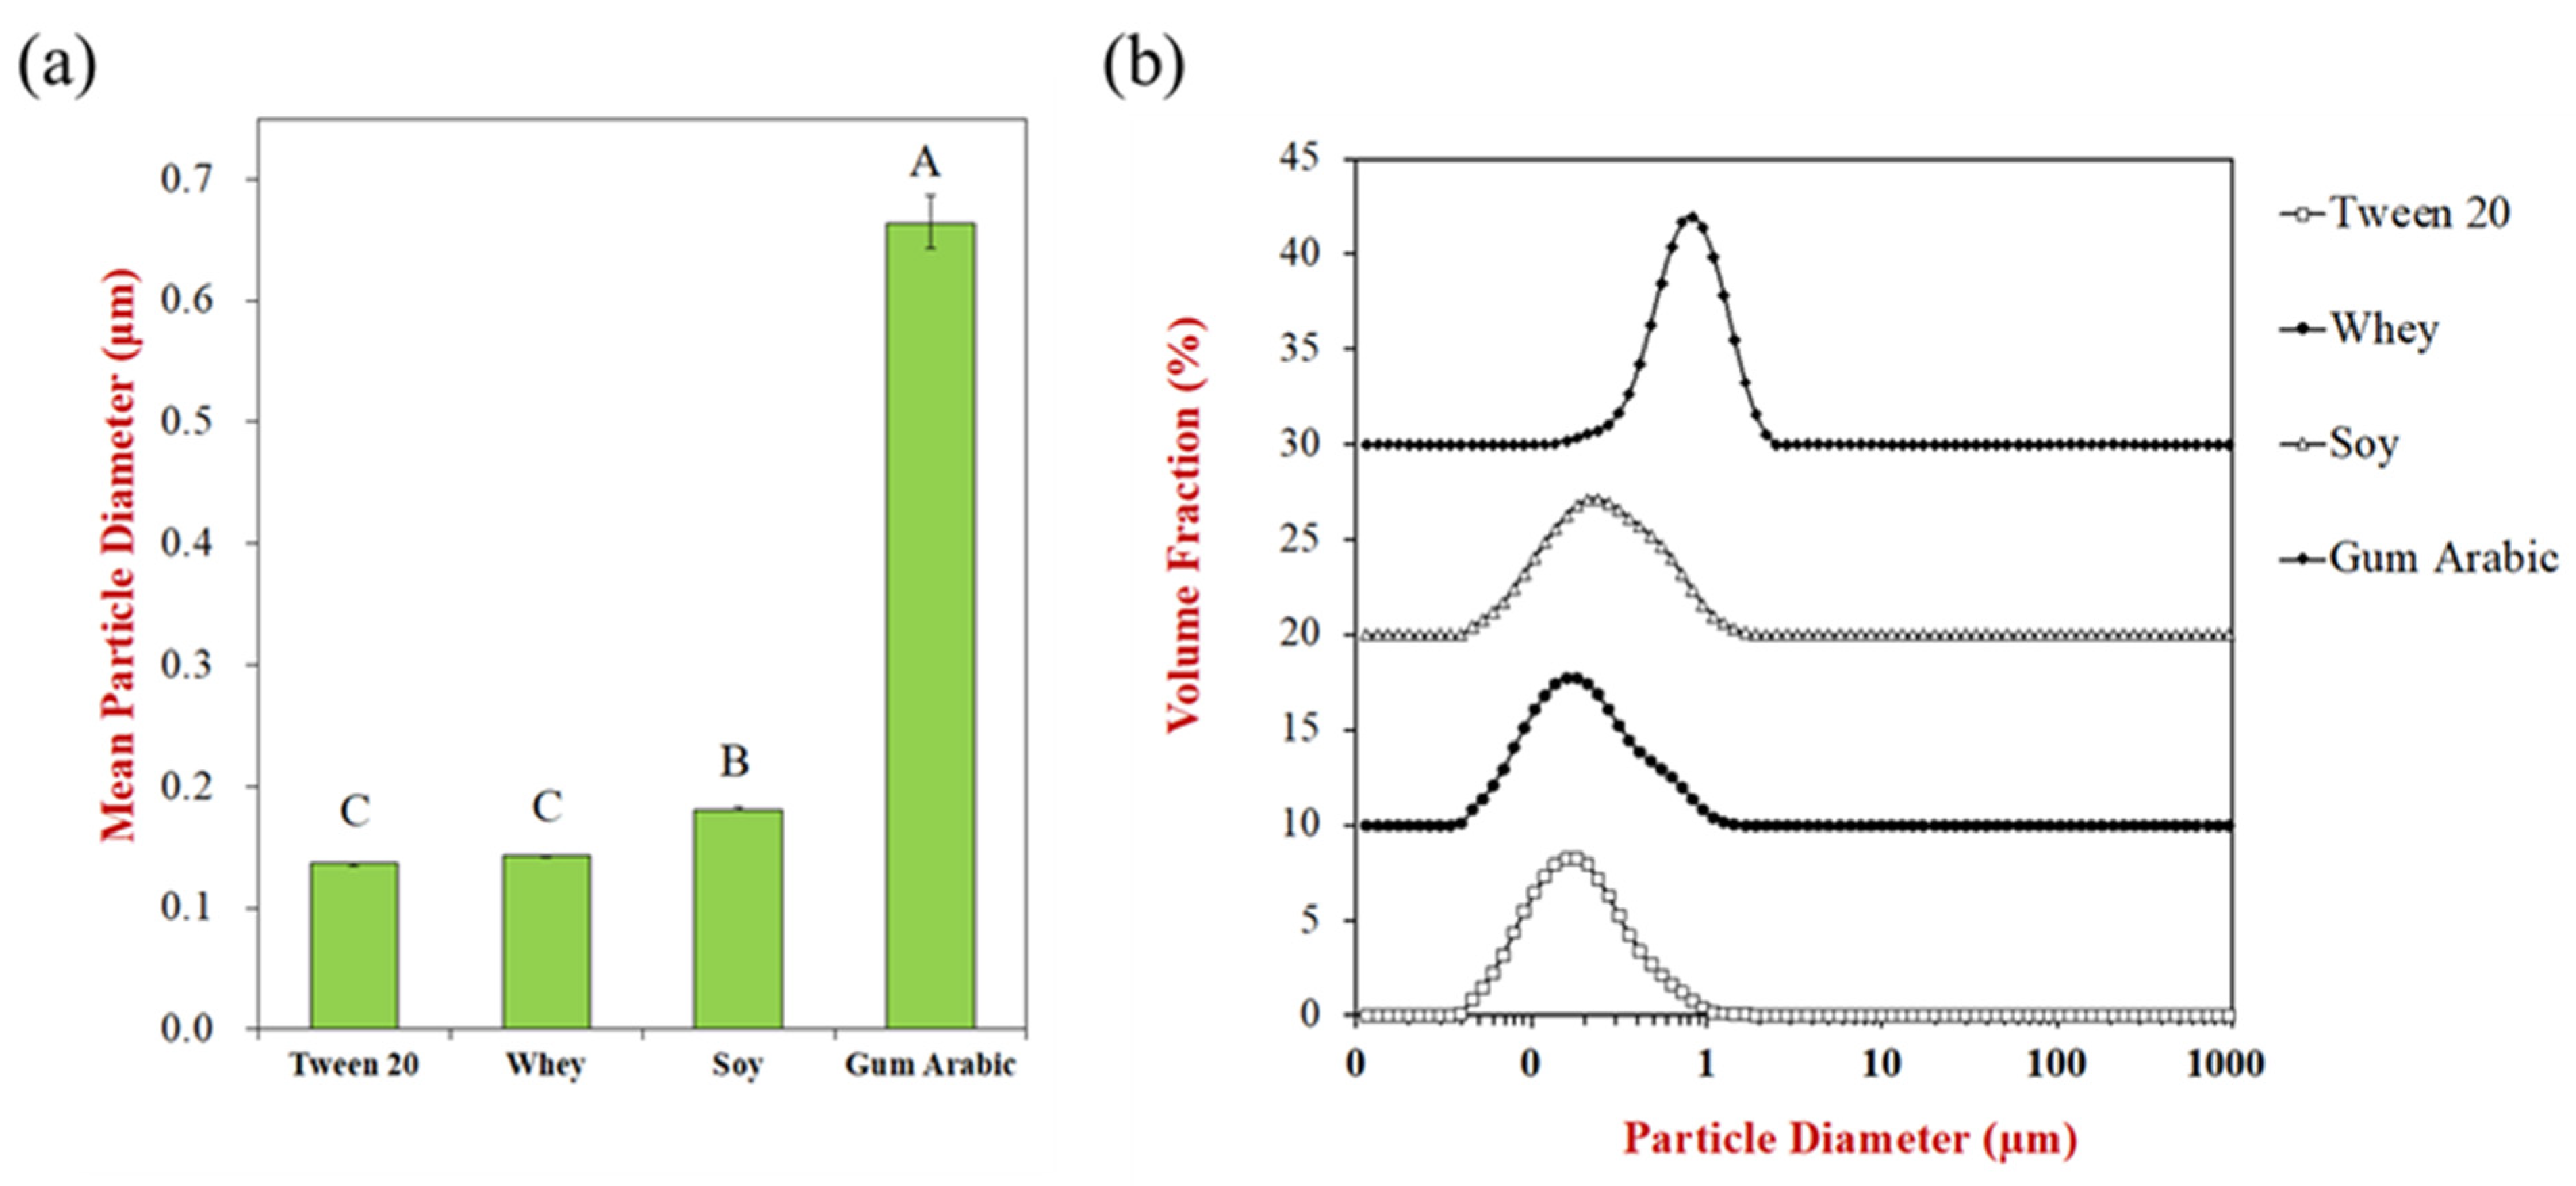
3.2.4. Emulsifier Type

In principle, a wide variety of different types of emulsifiers can be used to formulate edible nanoemulsions. Each of these emulsifiers has a different functional performance because of its different molecular characteristics. In this study, we compared the performance of a synthetic non-ionic surfactant (Tween 20) with that of three natural emulsifiers: whey protein (animal), soy protein (plant), and gum Arabic polysaccharide (plant). These emulsifiers were selected because there is a growing emphasis in the food industry on the creation of plant-based foods because of ethical, environmental, and animal welfare concerns [5,49]. The type of emulsifier used had a significant impact on the formation of the nanoemulsions (Figure 8). The droplets in the nanoemulsions produced using gum Arabic were considerably larger than those in the nanoemulsions produced using surfactants or proteins. This effect can mainly be attributed to the fact that gum Arabic is a mixture of relatively large hydrophilic polysaccharide molecules that adsorb slowly to droplet surfaces and form thick interfaces. Indeed, a previous study reported that the surface load (Γ) of gum Arabic (24.8 mg/m2) was over 10-fold higher than that of whey protein (2.2 mg/m2) in oil-in-water nanoemulsions [45]. The whey and soy proteins were able to form nanoemulsions containing considerably smaller droplets than the gum Arabic. This effect can be attributed to the fact that these are relatively small amphiphilic molecules that rapidly move to the oil–water interfaces during homogenization and form thin interfaces around the oil droplets. The relatively low surface load of these globular proteins means that less emulsifier is required to cover a given droplet surface area, thereby leading to smaller droplet sizes [50]. The particle size distributions of the nanoemulsions produced by the soy and whey proteins had a fairly similar shape, but the mean particle diameter was slightly lower for the whey proteins than the soy proteins, which may be because of the smaller molecular dimensions of the whey proteins [51]. The non-ionic surfactant also gave small droplets during homogenization, which can also be attributed to its small size, rapid adsorption, and low surface load.
Several previous studies have also shown that emulsifier type plays a critical role in the formation of nanoemulsions containing small droplets, which was also related to differences in the molecular and physicochemical attributes of the emulsifiers [52,53]. Overall, our results highlight the importance of selecting an appropriate emulsifier for forming nanoemulsions.

4. Conclusions

In this study, we systematically investigated the major factors influencing the ability of a high-pressure homogenizer to form nanoemulsions. The results of our study are useful for understanding the parameters impacting the formation of nanoemulsions using high-pressure homogenizers in general. However, the specific homogenizer used in our study also had some additional features that provide increased flexibility in controlling the droplet size distributions of nanoemulsions due to its ability to vary the back pressure, flow, profile, and nozzle size. The impact of homogenizer operating conditions (e.g., number of passes, homogenization pressure, flow profile, back pressure, and nozzle size) and formulation parameters (e.g., emulsifier concentration, oil concentration, and emulsifier type) on the mean particle diameter and particle size distribution of the nanoemulsions was examined. The droplet size could be reduced by increasing the homogenization pressure, number of passes, back pressure, and reducing the nozzle size. It could also be reduced by increasing the emulsifier concentration or by increasing the oil concentration (at a fixed emulsifier-to-oil ratio). Nanoemulsions containing relatively small droplets (d32 < 150 nm) could be produced using a non-ionic surfactant (Tween 20), as well as a plant protein (soy protein) or animal protein (whey protein). However, a plant polysaccharide (gum Arabic) was not able to produce nanoemulsions containing small droplets, which was mainly attributed to its relatively large molecular dimensions. The information obtained in this study may facilitate the more efficient formation of nanoemulsions containing small droplet sizes. In particular, it shows that the number of passes, homogenization pressure, and emulsifier concentration should be optimized to produce small droplets without increasing energy use.

Author Contributions

Conceptualization, H.Z. and D.J.M.; methodology, H.Z., G.V. and D.Q.; software, H.Z. and D.J.M.; validation, H.Z. and D.J.M.; formal analysis, H.Z. and D.J.M.; investigation, H.Z., G.V. and D.Q.; resources, D.J.M.; data curation, H.Z. and G.V.; writing—original draft preparation, H.Z.; writing—review and editing, H.Z. and D.J.M.; visualization, H.Z. and D.J.M.; supervision, D.J.M.; project administration, D.J.M.; funding acquisition, D.J.M. All authors have read and agreed to the published version of the manuscript.

Funding

This work was partly based upon work supported by funding from the Good Food Institute.

Institutional Review Board Statement

Not applicable.

Informed Consent Statement

Not applicable.

Data Availability Statement

The data that support the findings of this study are available from the corresponding author upon reasonable request.

Acknowledgments

We thank BEE International Inc. Company for kindly lending us the high-pressure homogenizer used in this study.

Conflicts of Interest

The authors declare no conflict of interest.

References

  1. Aswathanarayan, J.B.; Vittal, R.R. Nanoemulsions and Their Potential Applications in Food Industry. Front. Sustain. Food Syst. 2019, 3, 95. [Google Scholar] [CrossRef] [Green Version]
  2. Gupta, A.; Eral, H.B.; Hatton, T.A.; Doyle, P.S. Nanoemulsions: Formation, properties and applications. Soft Matter 2016, 12, 2826–2841. [Google Scholar] [CrossRef] [Green Version]
  3. Silva, H.D.; Cerqueira, M.A.; Vicente, A.A. Nanoemulsions for Food Applications: Development and Characterization. Food Bioprocess Technol. 2012, 5, 854–867. [Google Scholar] [CrossRef] [Green Version]
  4. McClements, D.J.; Rao, J. Food-Grade Nanoemulsions: Formulation, Fabrication, Properties, Performance, Biological Fate, and Potential Toxicity. Crit. Rev. Food Sci. Nutr. 2011, 51, 285–330. [Google Scholar] [CrossRef]
  5. McClements, D.J. Advances in edible nanoemulsions: Digestion, bioavailability, and potential toxicity. Prog. Lipid Res. 2021, 81, 101081. [Google Scholar] [CrossRef]
  6. Kumar, N.; Verma, A.; Mandal, A. Formation, characteristics and oil industry applications of nanoemulsions: A review. J. Pet. Sci. Eng. 2021, 206, 109042. [Google Scholar] [CrossRef]
  7. Dasgupta, N.; Ranjan, S.; Gandhi, M. Nanoemulsions in food: Market demand. Environ. Chem. Lett. 2019, 17, 1003–1009. [Google Scholar] [CrossRef]
  8. Li, G.; Zhang, Z.; Liu, H.; Hu, L. Nanoemulsion-based delivery approaches for nutraceuticals: Fabrication, application, characterization, biological fate, potential toxicity and future trends. Food Funct. 2021, 12, 1933–1953. [Google Scholar] [CrossRef]
  9. Walia, N.; Dasgupta, N.; Ranjan, S.; Ramalingam, C.; Gandhi, M. Food-grade nanoencapsulation of vitamins. Environ. Chem. Lett. 2019, 17, 991–1002. [Google Scholar] [CrossRef]
  10. Che Marzuki, N.H.; Wahab, R.A.; Abdul Hamid, M. An overview of nanoemulsion: Concepts of development and cosmeceutical applications. Biotechnol. Biotechnol. Equip. 2019, 33, 779–797. [Google Scholar] [CrossRef] [Green Version]
  11. Mustafa, I.F.; Hussein, M.Z. Synthesis and Technology of Nanoemulsion-Based Pesticide Formulation. Nanomaterials 2020, 10, 1608. [Google Scholar] [CrossRef] [PubMed]
  12. Roy, A.; Nishchaya, K.; Rai, V.K. Nanoemulsion-based dosage forms for the transdermal drug delivery applications: A review of recent advances. Expert Opin. Drug Deliv. 2022, 19, 303–319. [Google Scholar] [CrossRef] [PubMed]
  13. Palmieri, D.; Brasili, F.; Capocefalo, A.; Bizien, T.; Angelini, I.; Oddo, L.; Toumia, Y.; Paradossi, G.; Domenici, F. Improved hybrid-shelled perfluorocarbon microdroplets as ultrasound- and laser-activated phase-change platform. Colloids Surf. A Physicochem. Eng. Asp. 2022, 641, 128522. [Google Scholar] [CrossRef]
  14. Ezhilarasi, P.N.; Karthik, P.; Chhanwal, N.; Anandharamakrishnan, C. Nanoencapsulation Techniques for Food Bioactive Components: A Review. Food Bioprocess Technol. 2013, 6, 628–647. [Google Scholar] [CrossRef]
  15. Fathi, M.; Mozafari, M.R.; Mohebbi, M. Nanoencapsulation of food ingredients using lipid based delivery systems. Trends Food Sci. Technol. 2012, 23, 13–27. [Google Scholar] [CrossRef]
  16. Naseema, A.; Kovooru, L.; Behera, A.K.; Kumar, K.P.P.; Srivastava, P. A critical review of synthesis procedures, applications and future potential of nanoemulsions. Adv. Colloid Interface Sci. 2021, 287, 102318. [Google Scholar] [CrossRef]
  17. Rehman, R.; Younas, A.; Ullah, S.; Ano, A.B.; Muzaffar, R.; Altaf, A.A.; Altaf, A.A. Recent Developments in Nano-Emulsions? Preparatory Methods and their Applications: A Concise Review. Pak. J. Anal. Environ. Chem. 2022, 23, 175–193. [Google Scholar] [CrossRef]
  18. Safaya, M.; Rotliwala, Y.C. Nanoemulsions: A review on low energy formulation methods, characterization, applications and optimization technique. Mater. Today Proc. 2020, 27, 454–459. [Google Scholar] [CrossRef]
  19. Komaiko, J.S.; McClements, D.J. Formation of Food-Grade Nanoemulsions Using Low-Energy Preparation Methods: A Review of Available Methods. Compr. Rev. Food Sci. Food Saf. 2016, 15, 331–352. [Google Scholar] [CrossRef]
  20. Sneha, K.; Kumar, A. Nanoemulsions: Techniques for the preparation and the recent advances in their food applications. Innov. Food Sci. Emerg. Technol. 2022, 76, 102914. [Google Scholar] [CrossRef]
  21. Floury, J.; Desrumaux, A.; Legrand, J. Effect of Ultra-high-pressure Homogenization on Structure and on Rheological Properties of Soy Protein-stabilized Emulsions. J. Food Sci. 2002, 67, 3388–3395. [Google Scholar] [CrossRef]
  22. Villalobos-Castillejos, F.; Granillo-Guerrero, V.G.; Leyva-Daniel, D.E.; Alamilla-Beltrán, L.; Gutiérrez-López, G.F.; Monroy-Villagrana, A.; Jafari, S.M. Chapter 8—Fabrication of Nanoemulsions by Microfluidization. In Nanoemulsions; Jafari, S.M., McClements, D.J., Eds.; Academic Press: Cambridge, MA, USA, 2018; pp. 207–232. [Google Scholar]
  23. Li, Y.; Deng, L.; Dai, T.; Li, Y.; Chen, J.; Liu, W.; Liu, C. Microfluidization: A promising food processing technology and its challenges in industrial application. Food Control 2022, 137, 108794. [Google Scholar] [CrossRef]
  24. Jafari, S.M.; He, Y.; Bhandari, B. Nano-Emulsion Production by Sonication and Microfluidization—A Comparison. Int. J. Food Prop. 2006, 9, 475–485. [Google Scholar] [CrossRef]
  25. Taha, A.; Ahmed, E.; Ismaiel, A.; Ashokkumar, M.; Xu, X.; Pan, S.; Hu, H. Ultrasonic emulsification: An overview on the preparation of different emulsifiers-stabilized emulsions. Trends Food Sci. Technol. 2020, 105, 363–377. [Google Scholar] [CrossRef]
  26. Jo, Y.-J.; Kwon, Y.-J. Characterization of β-carotene nanoemulsions prepared by microfluidization technique. Food Sci. Biotechnol. 2014, 23, 107–113. [Google Scholar] [CrossRef]
  27. Håkansson, A.; Trägårdh, C.; Bergenståhl, B. Dynamic simulation of emulsion formation in a high pressure homogenizer. Chem. Eng. Sci. 2009, 64, 2915–2925. [Google Scholar] [CrossRef]
  28. Floury, J.; Desrumaux, A.; Lardières, J. Effect of high-pressure homogenization on droplet size distributions and rheological properties of model oil-in-water emulsions. Innov. Food Sci. Emerg. Technol. 2000, 1, 127–134. [Google Scholar] [CrossRef]
  29. Gallassi, M.; Gonçalves, G.F.N.; Botti, T.C.; Moura, M.J.B.; Carneiro, J.N.E.; Carvalho, M.S. Numerical and experimental evaluation of droplet breakage of O/W emulsions in rotor-stator mixers. Chem. Eng. Sci. 2019, 204, 270–286. [Google Scholar] [CrossRef]
  30. Paximada, P.; Tsouko, E.; Kopsahelis, N.; Koutinas, A.A.; Mandala, I. Bacterial cellulose as stabilizer of o/w emulsions. Food Hydrocoll. 2016, 53, 225–232. [Google Scholar] [CrossRef]
  31. Hidajat, M.J.; Jo, W.; Kim, H.; Noh, J. Effective Droplet Size Reduction and Excellent Stability of Limonene Nanoemulsion Formed by High-Pressure Homogenizer. Colloids Interfaces 2020, 4, 5. [Google Scholar] [CrossRef] [Green Version]
  32. Qian, C.; McClements, D.J. Formation of nanoemulsions stabilized by model food-grade emulsifiers using high-pressure homogenization: Factors affecting particle size. Food Hydrocoll. 2011, 25, 1000–1008. [Google Scholar] [CrossRef]
  33. Lee, L.; Norton, I.T. Comparing droplet breakup for a high-pressure valve homogeniser and a Microfluidizer for the potential production of food-grade nanoemulsions. J. Food Eng. 2013, 114, 158–163. [Google Scholar] [CrossRef]
  34. Tan, Y.; Zhang, Z.; Liu, J.; Xiao, H.; McClements, D.J. Factors impacting lipid digestion and nutraceutical bioaccessibility assessed by standardized gastrointestinal model (INFOGEST): Oil droplet size. Food Funct. 2020, 11, 9936–9946. [Google Scholar] [CrossRef]
  35. Wooster, T.J.; Golding, M.; Sanguansri, P. Impact of Oil Type on Nanoemulsion Formation and Ostwald Ripening Stability. Langmuir 2008, 24, 12758–12765. [Google Scholar] [CrossRef] [PubMed]
  36. Norton, I.T.; Frith, W.J. Microstructure design in mixed biopolymer composites. Food Hydrocoll. 2001, 15, 543–553. [Google Scholar] [CrossRef]
  37. Chung, C.; Smith, G.; Degner, B.; McClements, D.J. Reduced Fat Food Emulsions: Physicochemical, Sensory, and Biological Aspects. Crit. Rev. Food Sci. Nutr. 2016, 56, 650–685. [Google Scholar] [CrossRef] [PubMed]
  38. Karthik, P.; Ezhilarasi, P.N.; Anandharamakrishnan, C. Challenges associated in stability of food grade nanoemulsions. Crit. Rev. Food Sci. Nutr. 2017, 57, 1435–1450. [Google Scholar] [CrossRef]
  39. McClements, D.J. Food Emulsions: Principles, Practices, and Techniques; CRC Press: Boca Raton, FL, USA, 2015. [Google Scholar]
  40. Schlender, M.; Minke, K.; Spiegel, B.; Schuchmann, H.P. High-pressure double stage homogenization processes: Influences of plant setup on oil droplet size. Chem. Eng. Sci. 2015, 131, 162–171. [Google Scholar] [CrossRef]
  41. Schlender, M.; Minke, K.; Schuchmann, H.P. Sono-chemiluminescence (SCL) in a high-pressure double stage homogenization processes. Chem. Eng. Sci. 2016, 142, 1–11. [Google Scholar] [CrossRef]
  42. Kuhn, K.R.; Cunha, R.L. Flaxseed oil—Whey protein isolate emulsions: Effect of high pressure homogenization. J. Food Eng. 2012, 111, 449–457. [Google Scholar] [CrossRef] [Green Version]
  43. Hakansson, A. Emulsion Formation by Homogenization: Current Understanding and Future Perspectives. In Annual Review of Food Science and Technology; Doyle, M.P., McClements, D.J., Eds.; Annual Reviews: San Mateo, CA, USA, 2019; Volume 10, pp. 239–258. [Google Scholar]
  44. Tan, C.P.; Nakajima, M. β-Carotene nanodispersions: Preparation, characterization and stability evaluation. Food Chem. 2005, 92, 661–671. [Google Scholar] [CrossRef]
  45. Bai, L.; Huan, S.; Gu, J.; McClements, D.J. Fabrication of oil-in-water nanoemulsions by dual-channel microfluidization using natural emulsifiers: Saponins, phospholipids, proteins, and polysaccharides. Food Hydrocoll. 2016, 61, 703–711. [Google Scholar] [CrossRef] [Green Version]
  46. Tcholakova, S.; Denkov, N.D.; Sidzhakova, D.; Ivanov, I.B.; Campbell, B. Interrelation between Drop Size and Protein Adsorption at Various Emulsification Conditions. Langmuir 2003, 19, 5640–5649. [Google Scholar] [CrossRef]
  47. Courthaudon, J.-L.; Dickinson, E.; Dalgleish, D.G. Competitive adsorption of β-casein and nonionic surfactants in oil-in-water emulsions. J. Colloid Interface Sci. 1991, 145, 390–395. [Google Scholar] [CrossRef]
  48. Hakansson, A.; Tragardh, C.; Bergenstahl, B. Studying the effects of adsorption, recoalescence and fragmentation in a high pressure homogenizer using a dynamic simulation model. Food Hydrocoll. 2009, 23, 1177–1183. [Google Scholar] [CrossRef]
  49. Kumar, M.; Tomar, M.; Punia, S.; Dhakane-Lad, J.; Dhumal, S.; Changan, S.; Senapathy, M.; Berwal, M.K.; Sampathrajan, V.; Sayed, A.A.S.; et al. Plant-based proteins and their multifaceted industrial applications. Lwt-Food Sci. Technol. 2022, 154, 112620. [Google Scholar] [CrossRef]
  50. Tan, Y.; Lee, P.W.; Martens, T.D.; McClements, D.J. Comparison of Emulsifying Properties of Plant and Animal Proteins in Oil-in-Water Emulsions: Whey, Soy, and RuBisCo Proteins. Food Biophys. 2022, 17, 409–421. [Google Scholar] [CrossRef]
  51. McClements, D.J.; Lu, J.K.; Grossmann, L. Proposed Methods for Testing and Comparing the Emulsifying Properties of Proteins from Animal, Plant, and Alternative Sources. Colloids Interfaces 2022, 6, 19. [Google Scholar] [CrossRef]
  52. Wanyi, W.; Lu, L.; Zehan, H.; Xinan, X. Comparison of emulsifying characteristics of different macromolecule emulsifiers and their effects on the physical properties of lycopene nanoemulsions. J. Dispers. Sci. Technol. 2020, 41, 618–627. [Google Scholar] [CrossRef]
  53. Flores-Andrade, E.; Allende-Baltazar, Z.; Sandoval-González, P.E.; Jiménez-Fernández, M.; Beristain, C.I.; Pascual-Pineda, L.A. Carotenoid nanoemulsions stabilized by natural emulsifiers: Whey protein, gum Arabic, and soy lecithin. J. Food Eng. 2021, 290, 110208. [Google Scholar] [CrossRef]
Figure 1. Schematic illustration of (a) parallel and (b) reverse flow type within the homogenizer used to produce the nanoemulsions.
Colloids 07 00021 g001
Figure 2. The impact of different homogenization parameters on (a) the mean particle diameter and (b) particle size distribution of 10% corn oil-in-water nanoemulsions. The default parameters were: 12,000 psi operating pressure, 3 passes, Z5 nozzle, no back pressure, and reverse flow pattern. The letters (A, B, C) represent the significance of the samples (p < 0.05). In (a), the error bars represent the standard deviations of multiple measurements. For (b), the widths of the distributions calculated from the particle size distribution data were: 0.18, 0.21, 0.26, 0.17, and 0.20 µm from the “Reverse” to “BP (2 KPsi)” sample, respectively.
Colloids 07 00021 g002
Figure 3. Impact of the number of passes on the particle size characteristics of nanoemulsions (10 wt% corn oil, 2 wt% Tween 20 surfactant): (a) the mean particle diameter and (b) particle size distribution. For (a), the standard deviations calculated from repeated measurements were 0.385, 0.006, 0.006, 0.001, 0.001, 0.005, 0.001, 0.001, and 0.003 µm from 0 to 8 passes, respectively. For (b), the widths of the distributions calculated from the particle size distribution data were: 10.4, 0.46, 0.41, 0.33, 0.25, 0.23, 0.21, 0.21, and 0.19 µm from 0 to 8 passes, respectively.
Colloids 07 00021 g003
Figure 4. The impact of homogenizer pressure parameter on (a) mean particle diameter and (b) particle size distributions of 10 wt% corn oil-in-water nanoemulsions stabilized by Tween 20. The letters (A, B) represent significant differences between samples (p < 0.05). For (a), the error bars represent the standard deviations of repeated measurements. A linear relation between the Log (Mean Particle Diameter/µm) and Log (Pressure/KPsi) was found: log(D) = −0.084log(P) − 0.773, R2 = 0.990. For (b), the widths of the distributions calculated from the particle size distribution data were: 0.18, 0.24, 0.24, and 0.24 µm from the 12 k, 20 k, 30 k, and 45 k samples, respectively.
Colloids 07 00021 g004
Figure 5. The influence of Tween 20 concentration on (a) the mean particle diameter (d32) and (b) particle size distribution of nanoemulsions containing 10 wt% corn oil. Default processing conditions were used for all samples, as described in the text. In (a), the error bars represent the standard deviations of repeated measurements. For (b), the widths of the distributions calculated from the particle size distribution data were: 0.41, 0.30, 0.41, 0.32, 0.18, 0.26, 0.24, and 0.23 µm from the “0.25” to “5.00” samples, respectively.
Colloids 07 00021 g005
Figure 6. The influence of oil concentration on the (a) mean particle diameters (d32 and d43) and (b) particle size distributions of corn oil-in-water nanoemulsions stabilized by Tween 20 (emulsifier-to-oil ratio = 0.2). For (a), the error bars represent the standard deviations of repeated measurements. For (b), the widths of the distributions calculated from the particle size distribution data were: 0.18, 0.12, 0.07, 0.04, and 0.04 µm from the “10” to “50” samples, respectively.
Colloids 07 00021 g006
Figure 7. The influence of oil concentration on the mean particle diameter (d32) and (b) particle size distributions of corn oil-in-water nanoemulsions at a fixed emulsifier concentration or fixed emulsifier-to-oil ratio (=0.2). For (a), the error bars represent the standard deviations of repeated measurements. For (b), the calculated widths of the distributions were: 0.14, 0.14, 0.16, 0.20, and 0.32 mm for 10, 20, 30, 40, and 50% oil concentration, respectively. For (b), the widths of the distributions calculated from the particle size distribution data were: 0.14, 0.14, 0.16, 0.20, and 0.32 µm from the “10” to “50” samples, respectively.
Colloids 07 00021 g007
Figure 8. The influence of four emulsifier types on (a) the mean particle diameter and (b) the particle size distributions. The letters (A, B, C) represent the significance of the samples (p < 0.05). For (a), the error bars represent standard deviations. For (b), the widths of the distributions calculated from the particle size distribution data were: 0.18, 0.19, 0.24, and 0.37 µm from the “Tween 20” to “Gum Arabic” samples, respectively.
Colloids 07 00021 g008
Disclaimer/Publisher’s Note: The statements, opinions and data contained in all publications are solely those of the individual author(s) and contributor(s) and not of MDPI and/or the editor(s). MDPI and/or the editor(s) disclaim responsibility for any injury to people or property resulting from any ideas, methods, instructions or products referred to in the content.

