Article

Mitigating Crack Propagation in Hybrid Composites: An Experimental and Computational Study

1
Department of Aerospace Engineering, Embry-Riddle Aeronautical University, Daytona Beach, FL 32114, USA
2
Department of Mechanical Engineering, Kennesaw State University, Marietta, GA 30060, USA
*
Author to whom correspondence should be addressed.
J. Compos. Sci. 2024, 8(4), 122; https://doi.org/10.3390/jcs8040122
Submission received: 15 February 2024 / Revised: 19 March 2024 / Accepted: 25 March 2024 / Published: 27 March 2024
(This article belongs to the Special Issue Characterization and Modelling of Composites, Volume III)

Abstract

:
The exceptional properties of carbon nanotubes (CNTs) make them ideal nanofillers for various composite materials. In carbon fiber-reinforced polymer (CFRP) composites. CNTs can be grown on the carbon fiber surface to act as a third interface between the fiber and the matrix. However, it was established that the uncontrolled random growth of CNTs could exacerbate delamination in composite structures. Thick nanofiller films could hinder the epoxy from seeping into the carbon fiber, resulting in insufficient interlaminar strength. Hence, the density and distribution of nanofillers play a crucial role in determining the hybrid composite fracture mechanisms. In this investigation, CNTs were grown using the low-temperature technique into specific patterns over carbon fibers to discern their derived composites’ fracture properties. The composite fracture energy release was probed using a double cantilever beam (DCB) test setup and digital image correlation (DIC) to monitor interlaminar crack propagation. A standard finite element simulation model based on the cohesive zone method (CZM) was also utilized to delineate fracture behaviors of the various composite configurations. Results conclude that a coarser pattern of CNT growth enhances resistance to crack propagation, thus improving the interlaminar fracture toughness of a composite structure.

1. Introduction

The anisotropy of fiber-reinforced polymer (FRP) composite structures renders their fracture behavior more complex than that of metals. The rampant increase in the application of composites in various industries like marine, aerospace, and transport [1,2] has offered researchers more insights to analyze their probable delamination behavior. The data from these various applications have established that the fiber’s orientation, manufacturing techniques, and machining procedures play a significant role in the delamination of FRPs [3]. Catastrophic failures due to stress concentrations at machined regions like bolt heads or notches are well-documented in composite structure failure [4,5]. Non-destructive testing of these structures became crucial to study the nature of failure by adopting appropriate repair strategies [6].
The delamination cracks in carbon fiber-reinforced polymer (CFRP) structures propagate over time, reducing the load-bearing capacity and, hence, compromising the strength and stiffness of the composite structure. Among the different fracture modes [7], Mode I (crack opening under tensile load) is the most common and is mimicked by the double cantilever beam (DCB) experiment [8]. In a DCB setup, a thin Teflon film is usually inserted into the mid-plane of a laminate beam during the manufacturing process to introduce a starter crack. A tensile load is applied to pull piano hinges attached to the beam’s upper and lower surfaces, and the crack growth due to this load is monitored by visual means such as digital image correlation (DIC) [7] or optical stereoscope techniques [9]. This method was frequently used to study interlaminar fracture in glass/epoxy [10] and carbon fiber/epoxy laminate [9,10]
Due to the intricacy of the DCB experimentation, finite element analysis (FEA) is often utilized to study the fracture behavior in the interlaminar region of CFRPs [11]. Due to the elaborate setup of a DCB technique, researchers rely on simulations to predict the interlaminar fracture of FRPs. There are two leading finite element analysis (FEA) techniques to model the interlaminar crack propagation behavior of the CFRPs; cohesive elements or cohesive zone modeling (CZM) and virtual crack closure technique (VCCT) [12]. The CZM method utilizes interface or contact elements defined by cohesive material behavior between the two delaminating surfaces. This model computes the progressive stiffness reduction in this cohesive zone during delamination to estimate the final fracture parameter [13]. The VCCT method assumes that the strain energy released as a crack propagates by a small amount is equal to the work needed to close the same crack. This method does not consider the plastic effects at the crack tip into consideration, as it implements linear elastic fracture mechanics (LEFM) [14]. A proposed algorithm to implement this method in detail was published by De Xie and Biggers [15]. A comparison between CZM and LEFM techniques was developed by Turon et al. [16] utilizing a virtual DCB test. The authors concluded that for mixed-mode loading ( mode 1 and shear mode), a relation between each mode’s different interlaminar shear strengths is needed to reduce the prediction error of the load-displacement using the cohesive finite element method.
While delamination in CFRPs, using both experimental and simulation techniques, is well-documented, studying delamination in hybrid composites containing nanofiller is relatively recent. Incorporating nano-sized reinforcement into the CFRPs’ structures is a potential remedy for their poor delamination resistance. Carbon nanotubes (CNTs) possess excellent physical and mechanical properties that are transmittable to CFRPs [17]. The most utilized routes to integrate CNTs in CFRPs are premixing CNTs with the polymer matrix used to impregnate the fiber fabric or reinforcing the fiber surface directly with CNTs. Various research groups used the former technique to improve the in-plane and out-of-plane mechanical properties of CFRP composite laminates [18,19]. Borowski et al. [20] investigated the effect of adding CNTs on Mode I interlaminar fracture toughness: GIC. They reported a 25% increase in GIC upon mixing 0.5 wt.% multi-walled carbon nanotubes (MWCNTs) with the polymer matrix. However, the agglomeration of MWCNTs at higher wt.% posed multiple disadvantages. They found that aggregated MWCNTs created stress concentration locations and increased the viscosity of the polymer matrix, which caused poor fiber wettability.
In lieu of directly mixing CNTs with the polymer matrix, some research groups deposited CNTs onto the carbon fiber’s surface directly through the combination of ultrasonics and electrophoretic deposition techniques [21]. Other groups used chemical vapor deposition (CVD), with catalysts like ferrocene, and high-temperature conditions ranging from 700 to 1300 °C to grow CNTs on carbon fibers’ surface [22,23,24]. Due to fiber degradation caused by CVD’s elevated temperatures, the graphitic structures by design (GSD) technique was developed [25,26]. This method utilizes a relatively lower temperature of 550 °C and uses nickel as a catalyst. These techniques produce a uniform and dense film of CNTs on the carbon fiber surface, which could prevent the epoxy from wetting individual fiber strands or even between the laminate plies. Hence, controlling growth density by altering the CNTs topology on the carbon fiber surface plays a significant role in determining the composite mechanical properties [27]. Moreover, patterned nanofillers could act as hurdles for interlaminar cracks propagating between the composite layers. This might result in hybrid CFRPs with a progressive failure model rather than a catastrophic failure, as depicted in Figure 1. Few investigations to study the effect of this phenomenon on the delamination of CFRP composites are available [9].
The overarching goal of this work is to study the effect of the CNTs growth topology on the delamination behavior of hybrid composites using both experimental and modeling techniques. Three composite configurations based on four three CNTs growth patterns were developed. Mode-I failure was captured by DCB setup experimentally and using the CZM modeling technique to study the crack propagation in the four different composite configurations.

2. Materials, Experimental and Modeling Procedures

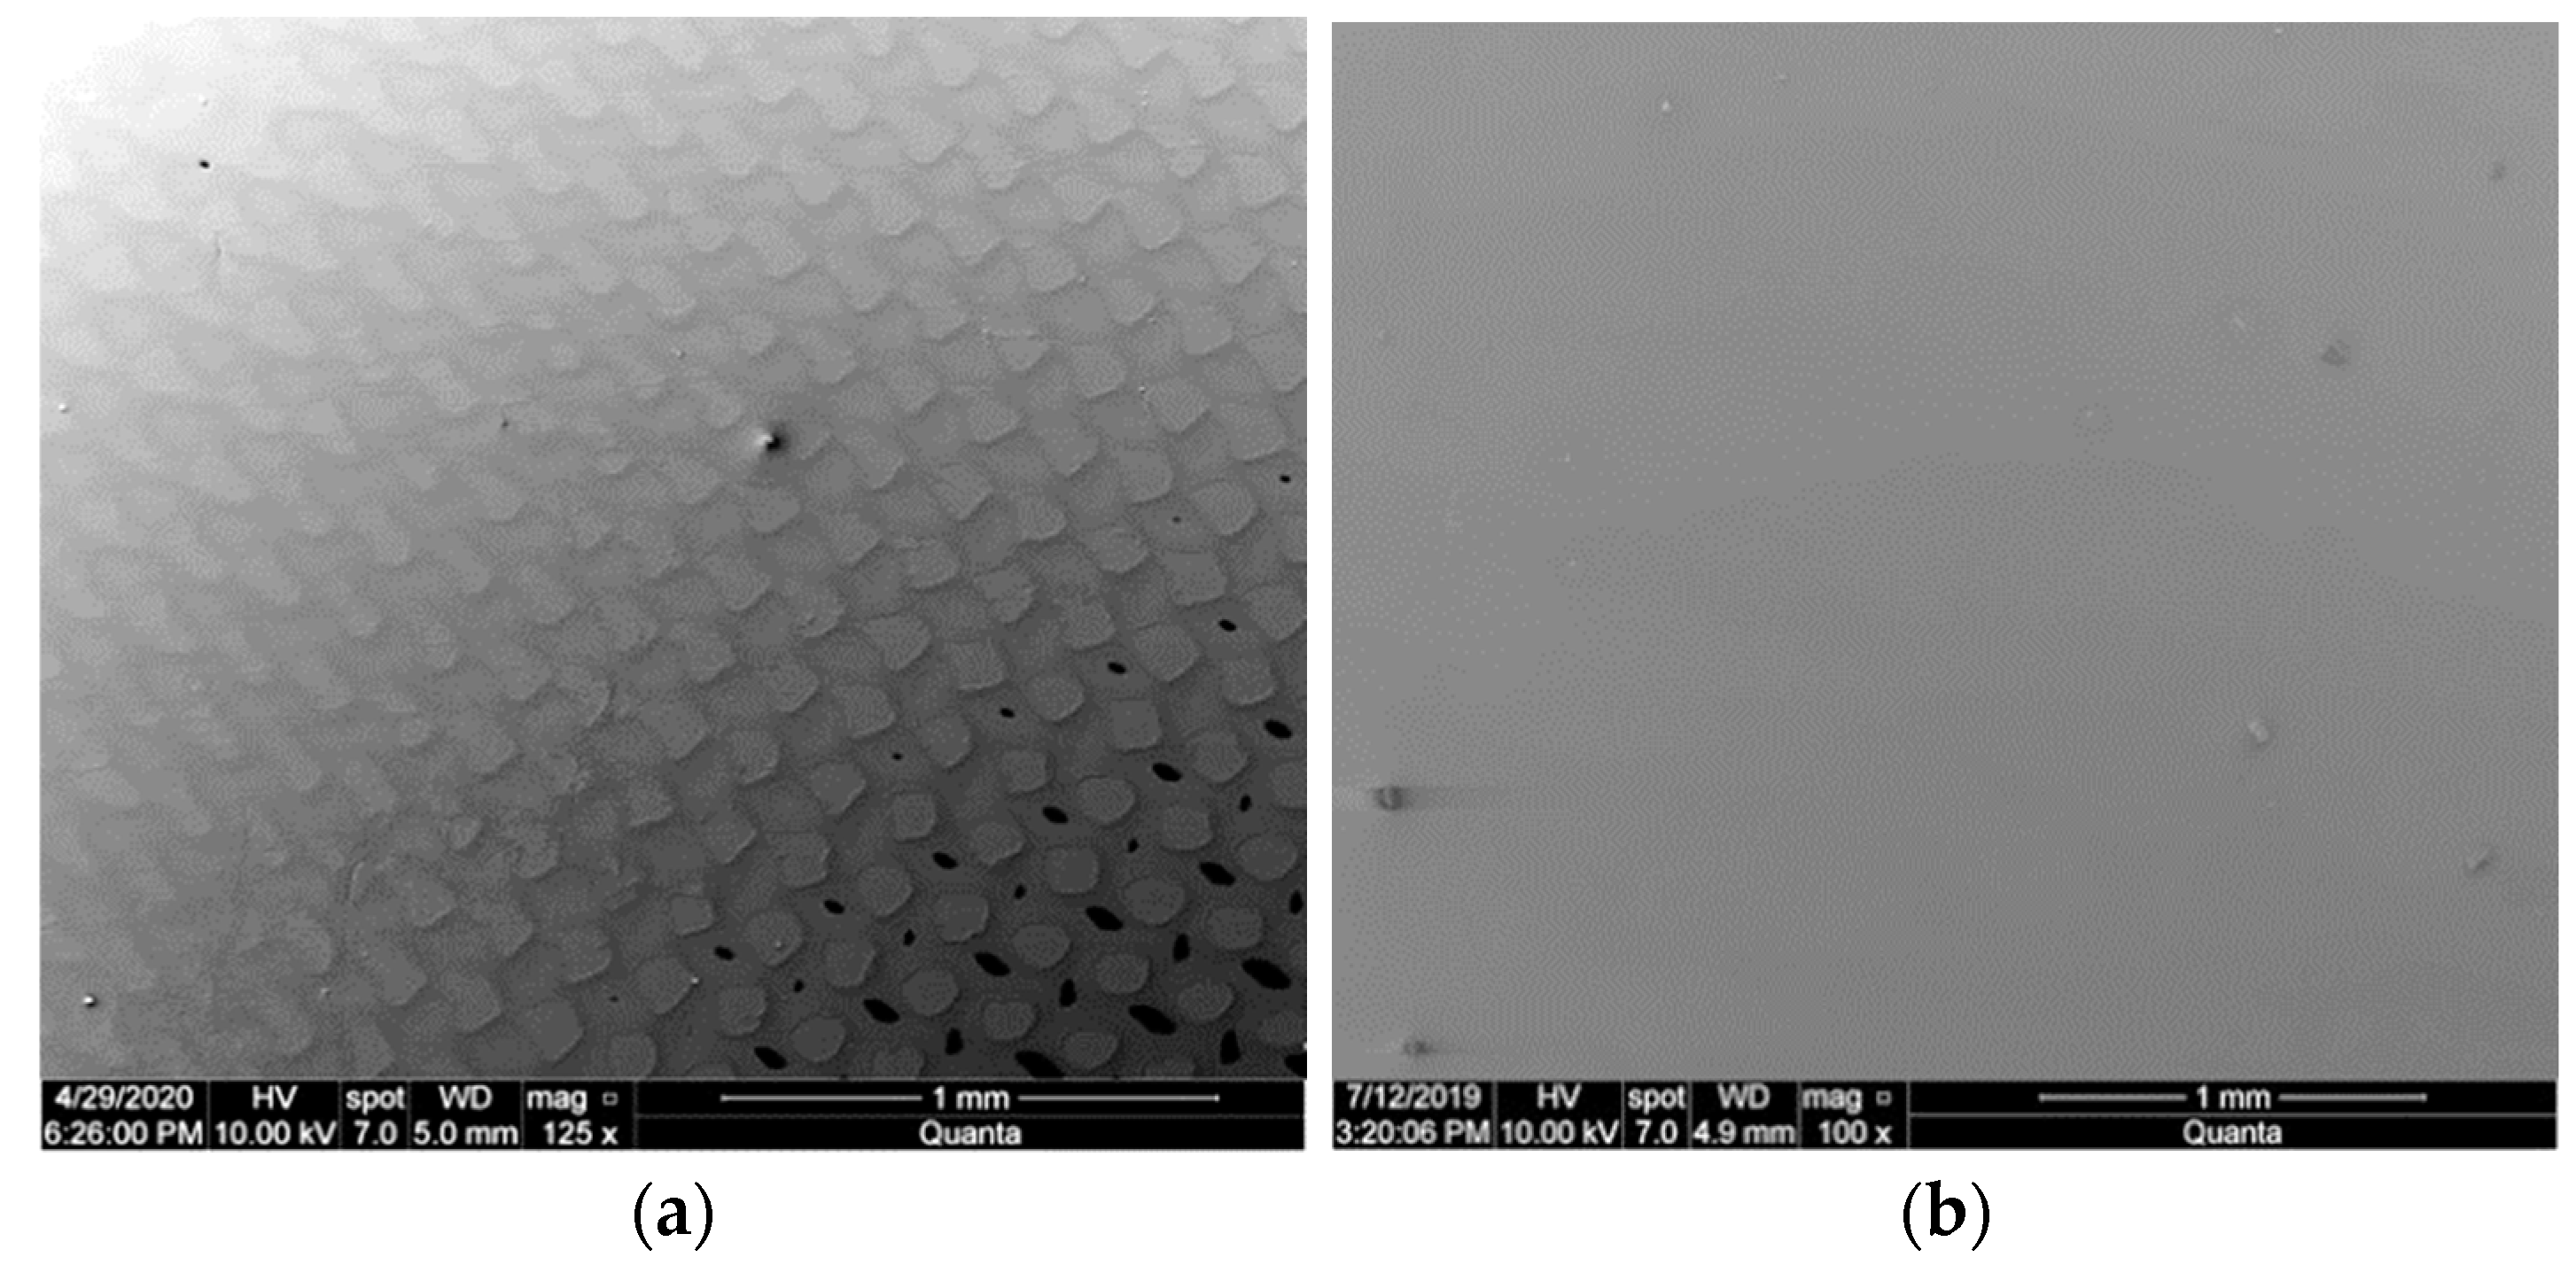
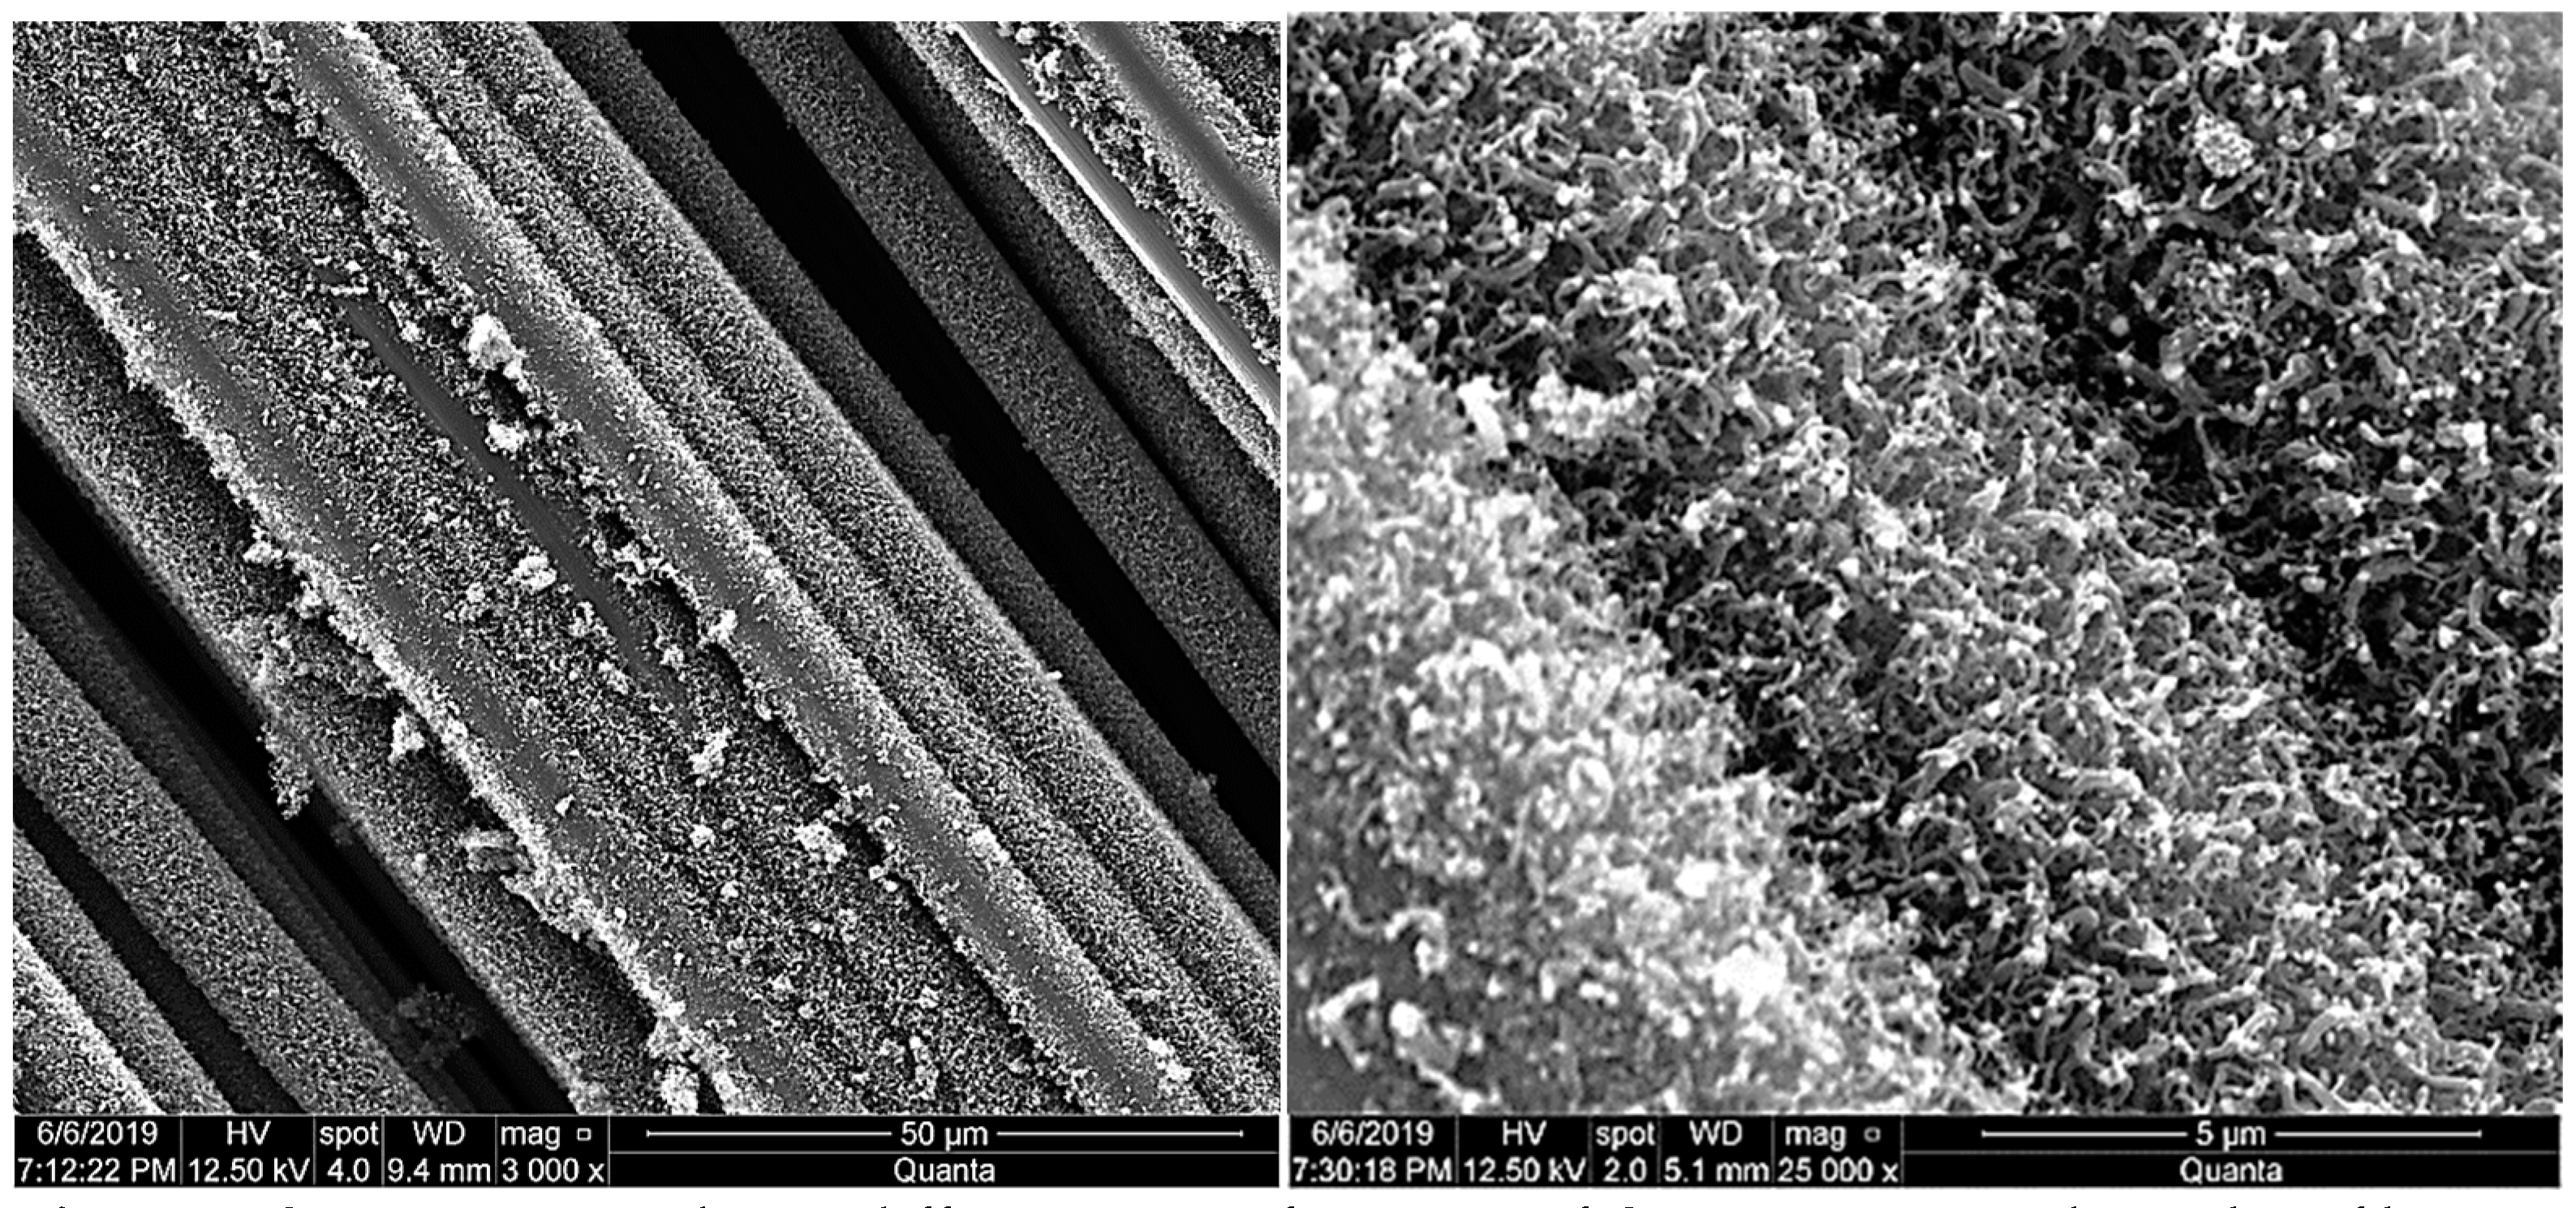
2.1. Synthesis of Hybrid CNTs Reinforcements

A Thornel® T650 PAN-based, plain carbon fibers with 3k bundles (Solvay, Inc. Alorton, IL, USA) were utilized. To rid these fibers of any sizing or chemical residue, they were baked in a tube furnace at 550 °C for 30 min under an inert atmosphere. This de-sizing was followed by catalyst deposition to accommodate the CNTs’ growth using the GSD procedures. Magnetron sputtering technique, using an ATC Orion high vacuum sputtering system (AJA International, Inc, Hingham, MA, USA), was used to sputter a thin film of nickel as the catalyst on both sides of the carbon fibers woven fabric. To grow CNTs into isolated patches (checkerboard patterns), a perforated polyester mesh template (Components Supply, Sparta, TN, USA) with mesh openings of 105 μm and accessible area percentages of 33% was used for pattern-sputtering the catalyst. Based on the configuration of the composite under fabrication, a 2.0 nm thick film of nickel was deposited through the 105 μm perforated mesh and with no perforated mesh (to grow uniform CNTs film) on the carbon fabric under 3 millitorr pressure of Argon gas while 200 W of power was supplied to the sputtering target.
For ease of observation, the two different CNT growth patterns are demonstrated on flat silicon wafers via scanning electron microscopy (SEM) using an FEI Quanta 650 SEM (Thermo-Fisher Scientific, Hillsboro, OR, USA), as shown in Figure 2. The CNTs were grown on the woven fiber fabrics using the GSD technique. To follow through the GSD process, a quartz tube reactor comprising a thermal controller and three mass flow controllers was utilized. The catalyzed carbon fabrics were laid in the quartz tube to perform reduction and growth procedures. Reduction (of oxides) is the initial stage, which was carried out under an H2/N2 mixture atmosphere at 550 °C for 2.0 h. The reduction was followed by flushing the tube furnace chamber and its constituents with N2 gas to remove residue compounds. Then, the CNTs growth stage takes place at 550 °C for 30 min under a C2H4/H2/N2 environment. The GSD growth of CNTs using pre-deposited nickel is shown in Figure 3.

2.2. Composites Fabrication

In this investigation, the constituents of each composite laminate consisted of 10 layers of carbon fiber fabrics and AeropoxyTM (PTM&W Industries, Inc.; Santa Fe Springs, CA, USA) as the matrix. This epoxy is a blend of a Bisphenol-based PR2032 resin and a PH3665 hardener. This blend yields a viscosity of 800–875 cPs, while the individual viscosity for resin and the hardener are 1650 cPs and 190–200 cPs, respectively, at room temperature, as reported by the manufacturer. The medium viscosity PR2032 resin was designed especially for structural applications to aid in the lamination process and facilitate the wetting of carbon, aramid, and glass fibers.
A hand-layup procedure was used for lamination. Among the ten plies of each composite laminate, four plies on each side were based on the reference carbon fibers (CF) with no surface modifications. The two plies at the center were based on fibers with different surface treatments: fibers with patterned CNTs (105 μm pattern), fibers with uniform CNTs, and reference-desized fibers without CNTs. The artificial pre-crack was introduced between the two inner layers using a PTFE insert of 51 μm thickness. Half of the PTFE film was left overhanging, while the other half extended between the two central hybrid layers to create an initial crack opening. The tip to the edge where the PTFE layer ends was around 25.4 mm in length and width, as shown in Figure 4. Following the lay-up of the 10 CF laminae impregnated with epoxy, the constituents were sealed in a vacuum bag for composite fabrication.
Fabrication was performed in a composite autoclave (Econoclave, ASC Process Systems, Santa Clarita, CA, USA). The manufacturer reported a glass transition temperature of 91 °C for the epoxy blend. The autoclave processing cycle was set as follows: Isothermal state for 1.0 h at 30 °C; ramp the temperature up to 93 °C isothermal condition for 2.0 h at 93 °C; and finally, cool down to room temperature. All curing steps were carried out under a pressure of 70 psi and a vacuum of 25 torrs.

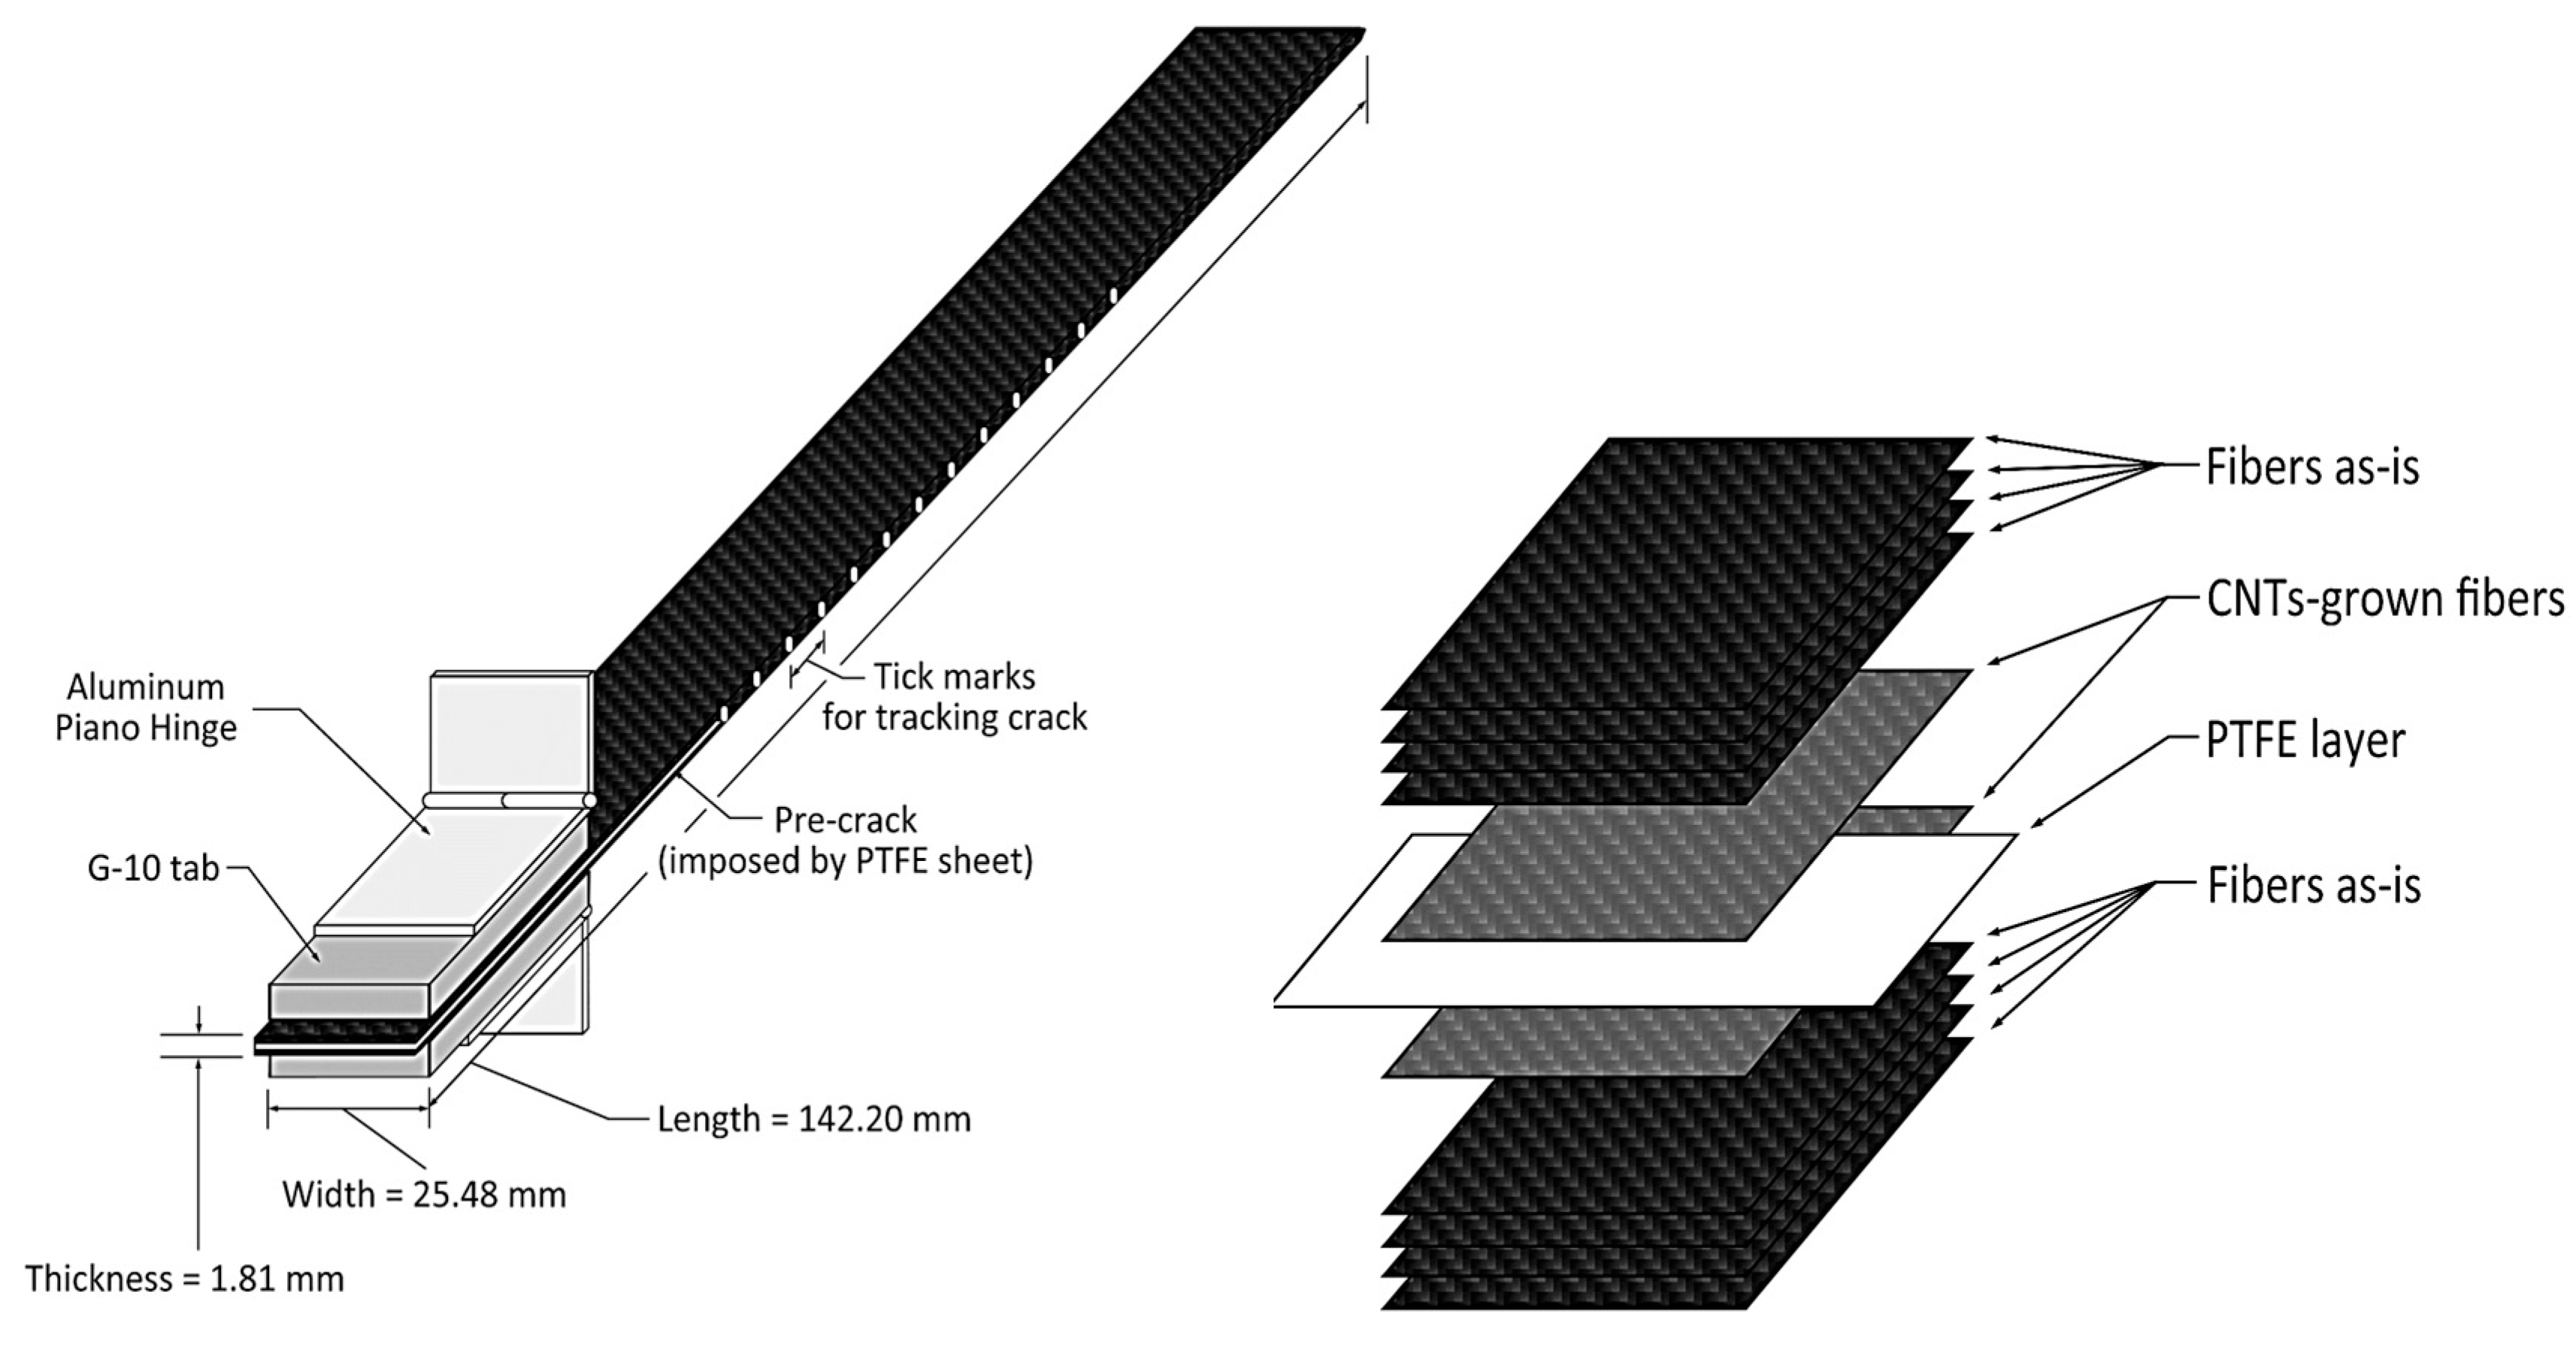
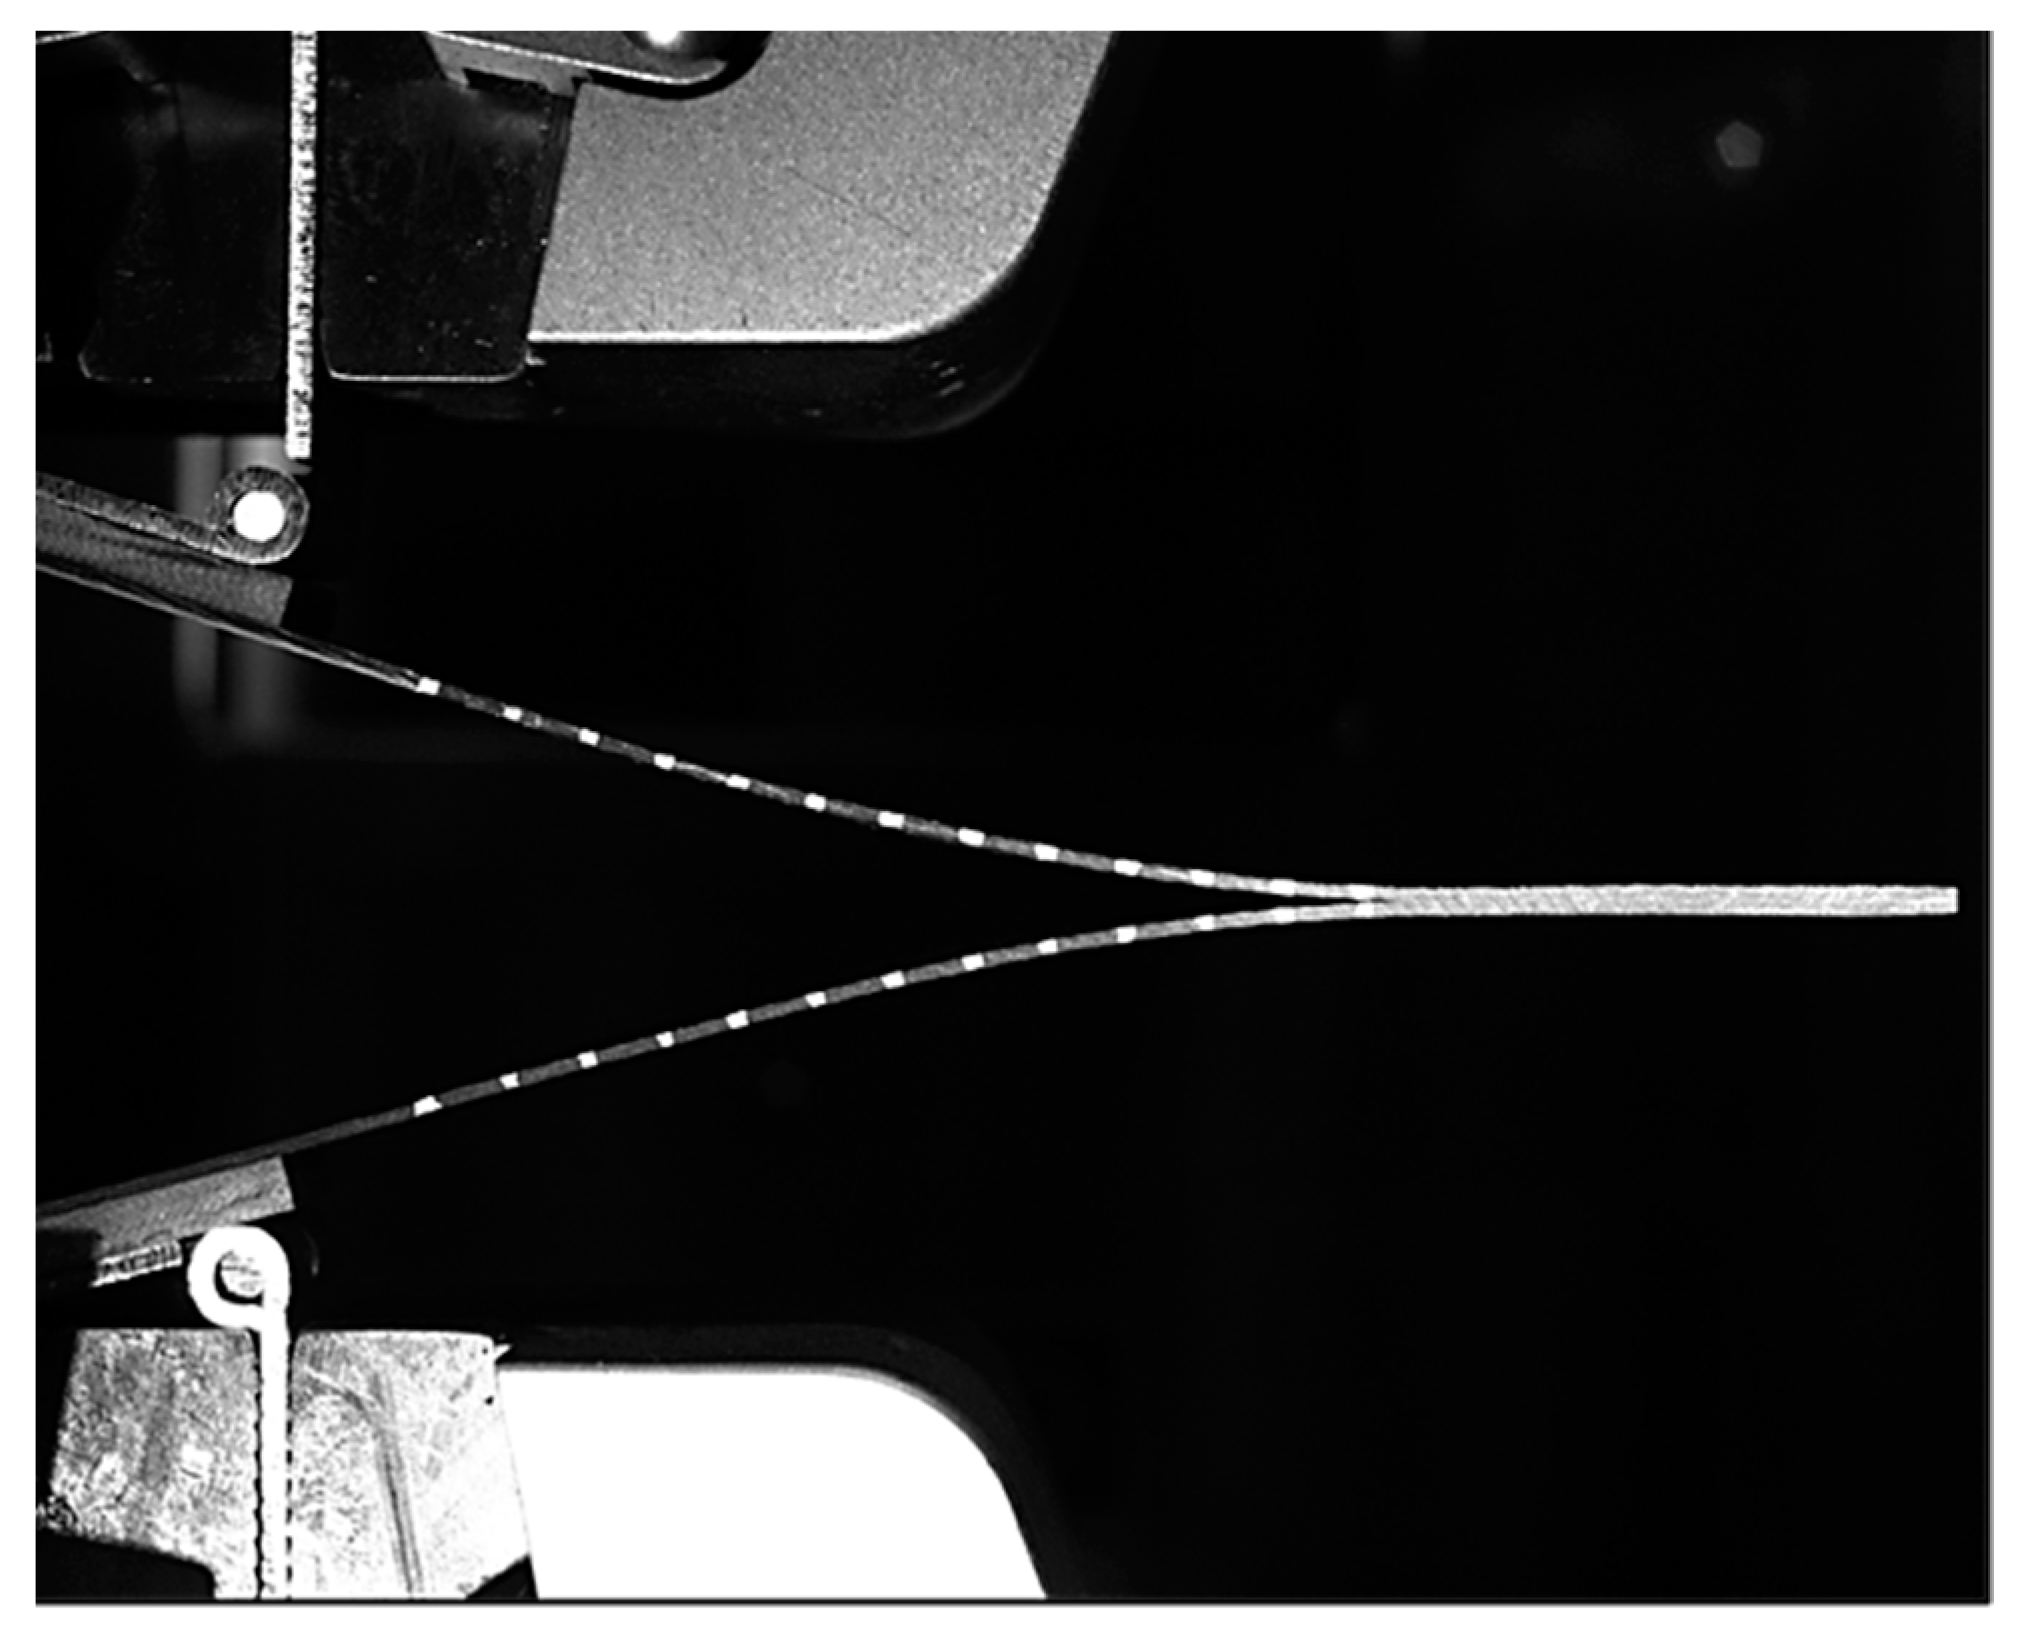
2.3. DCB Experimental Setup and Analysis

After fabrication, G-10 tabs were glued using the Aeropoxy on top of the different composite laminates. Upon curing the tabs, the laminates were cut into coupons of the dimensions detailed in Figure 4. To grip these coupons during the crack opening loading, aluminum piano hinges were glued using Aeropoxy on top of the G-10 tabs. To induce crack-opening loads, a mechanical testing frame (MTS CriterionTM Model 43 MTS, Inc. Eden Prairie, MN, USA) and a digital image correlation (DIC) system (DIC, correlated solutions, Inc., Irmo, SC, USA) were used. The DIC system comprises two cameras to capture the interlaminar crack propagation. Markings spaced at 0.5 mm intervals on the sample edge were utilized to capture the crack movement. The data acquisition platforms of both the MTS and DIC systems were synchronized to collect data at a 10 Hz frequency. The loading rate of MTS was set to 3 mm/min. An illustration of the experimental setup is shown in Figure 5.
Following the experiment, the critical strain energy release rate, GIC, also known as interlaminar fracture toughness, was calculated using the following formula [9]:
G IC =   3 P δ 2 b ( a + | Δ | )
where P is the load applied in Newtons (N), δ is the deflection due to applied load or crosshead movement due to the load in meters (m), b is the width of the DCB sample in meters (m), a is the crack length in meters (m), and Δ is the correction factor to account for the extension resulting from rotation of the DCB arms at the crack front. This was quantified by plotting the cubic root of compliance values, ( δ P ) ( 1 / 3 ) , vs. the crack length, a. The point of intersection of this curve with the x-axis was taken as the value of Δ . To accommodate large displacements, another correction factor was multiplied by the final calculated fracture toughness values. This is denoted by F, given by the following equation [28].
F = 1 3 10 ( δ a ) 2 3 2 δ t a 2
In the above equation, t is the perpendicular distance between the center of the piano hinge and the top surface of the sample mounted, added to the quarter thickness of the sample. For plotting GIC through the crack growth, a visual inspection was carried out to select the crack initiation points while propagating through each tick mark. A series of data points were collected to plot GIC vs. crack length, also called R-curves. This procedure was followed for four different configurations with CNTs used for surface modifications, labeled as: Desized, full growth, and 105 μm. Several samples were tested for each configuration.

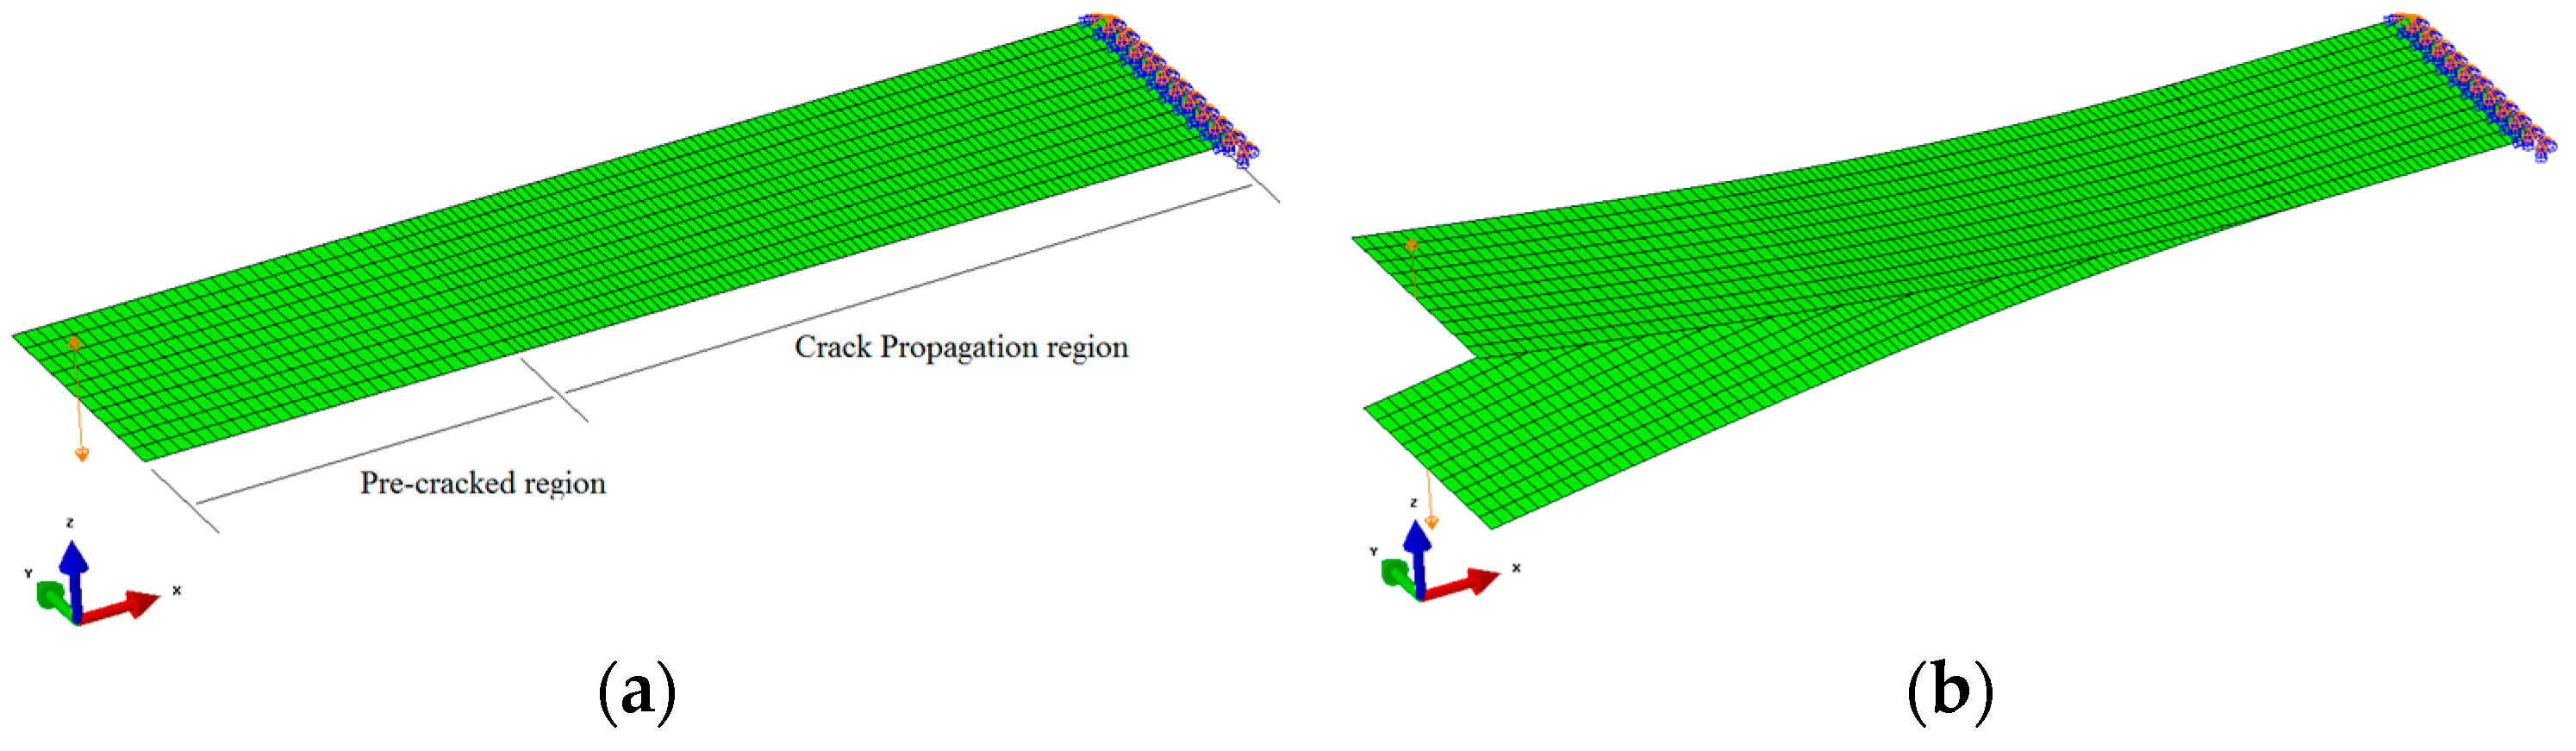
2.4. FEA Delamination Mode

All crack closure methods are generally based on Irwin’s closure integral [29]. These methods assume that the energy released when a crack is extended by a certain amount equals the work needed to close the crack by the same amount. The distinction between different crack closure methods is how to calculate the released energy or the work needed. In this study, we adopted the cohesive element method. Mechanical Parametric Design Language (APDL) 19.1 module in ANSYS® software Ver 19.1 was used to model delamination in composite materials [30]. The cohesive zone modeling (CZM) method, built on the theory that the stress transfer capacity between two surfaces adhered to each other cannot be hindered immediately after damage initiation, was used in this investigation. The CZM is governed by a progressive degradation of the interface stiffness [31,32]. A 3D model of a DCB specimen with identical dimensions to the reference sample tested in the experiments was developed. The model comprised two deformable solid shells with dimensions of 100.0 × 24.9 mm2 representing the two separating parts of a DCB specimen. This can be seen in Figure 6. The material model was assumed to be orthotropic.
The material properties were supplemented to the model based on tensile experimental results of the different configurations of composite: Desized, full growth, and 105 μm. The tensile tests were carried out using MTS CriterionTM Model 43 machine. The results of the tensile tests are summarized in Table 1.
In order to create a pre-cracked DCB sample, each face was meshed coarsely in the pre-cracked and finely in the crack propagation regions, such that 400 elements were seeded in the crack propagation region. The type of elements used in the model were SOLID185 layered solid Element (3D 8-Node Structural Solid). The length of the pre-cracked region was equal to the experimental sample’s (25.4 mm for this case). Mode I interlaminar fracture toughness (GIC) of 0.32 (N/mm) was input to the simulations (from the experimental result of the desized sample). For boundary conditions, the nodes at the end of the specimen were constrained from moving in z-direction and rotating about y-direction. The nodes located along the lines at the tip of the DCB model were tied to the middle nodes of their corresponding line in order to simulate the piano hinges used in the experiments. Similar to the experiments, the loading input was applied on the hinges as a displacement with a constant rate of 3.0 mm/min throughout each simulation.
An appropriate mesh was generated, and various refinements were attempted to select a proper mesh to avoid any discrepancy in results. An element size of 3.0 mm sufficed after this exercise. Figure 6a shows the created 3D model with all the inputs and Figure 6b shows the model with fully propagated interlaminar crack at the end of the simulation.
After meshing, the fracture module was added to the model tree. Pre-meshed crack with an appropriate coordinate system at the crack front was introduced. This was followed by adding the interface delamination subset in the fracture model tree. Three dimensional 8-node linear interface cohesive elements (INTER205) were added to the models in between the middle laminas in the delamination crack propagation region. TER205 simulates an interface between two surfaces and the subsequent delamination process, where the separation is represented by an increasing displacement between nodes, within the interface element itself. The nodes are initially coincident. In ANSYIS, the interface is represented by a single element set. The interface deformation is characterized by a traction separation law with the deformation occurring only within the interface elements (the cohesive zone). Among various methods available in ANSYS to define this cohesive zone, the exponential form was used in this investigation [33]. The cohesive zone model (TB,CZM,EXPO) uses an exponential traction-separation law, defined as [34]:
T n = e σ max δ n e Δ n e Δ t 2
where Δn and Δt denote the normal and tangential displacement jump, respectively, δn is the normal dispalcement jump at maximum normal traction, where the maximum normal traction σmax is the maximum normal traction at Δt = 0. The mode I separation potential is the area under the normal traction–separation curve, which is related to the interfacial normal strength by ϕn = σmaxδn. This form is based on surface potential requiring two relevant input parameters in Mode I loading: Maximum normal traction of the fiber/epoxy system,   σ m a x , which was considered 6.329 MPa (i.e., the strength of the current epoxy system); and δn, the normal separation across the interface, which was approximated by GIC/eσ [35], where GIC is the critical energy release rate for each configuration from experimental crack propagation experiments, and e is exponential constant.
The required results, like crack propagation length, total deformation, force reaction, and energy release rates, were chosen in the solution model tree. This completed the model, after which it was run and analyzed for all the composite configurations, as shown in Figure 7. The results were then plotted for comparison.

3. Results and Discussion

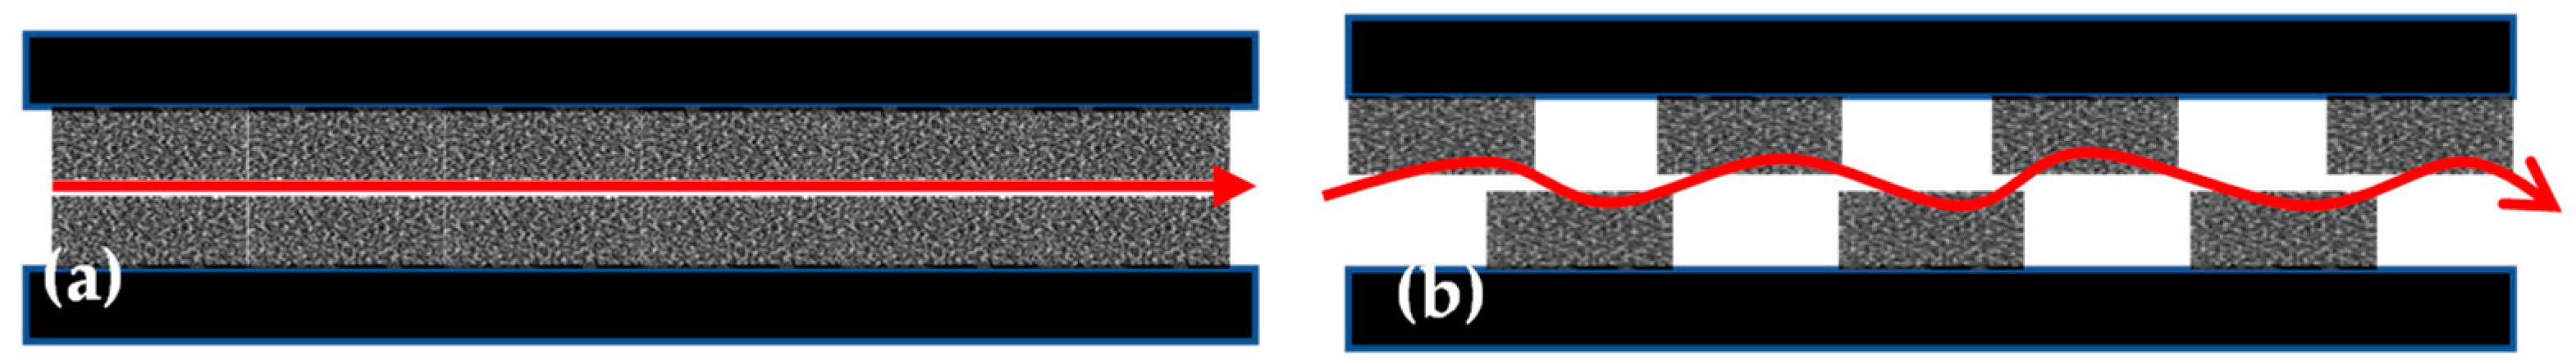
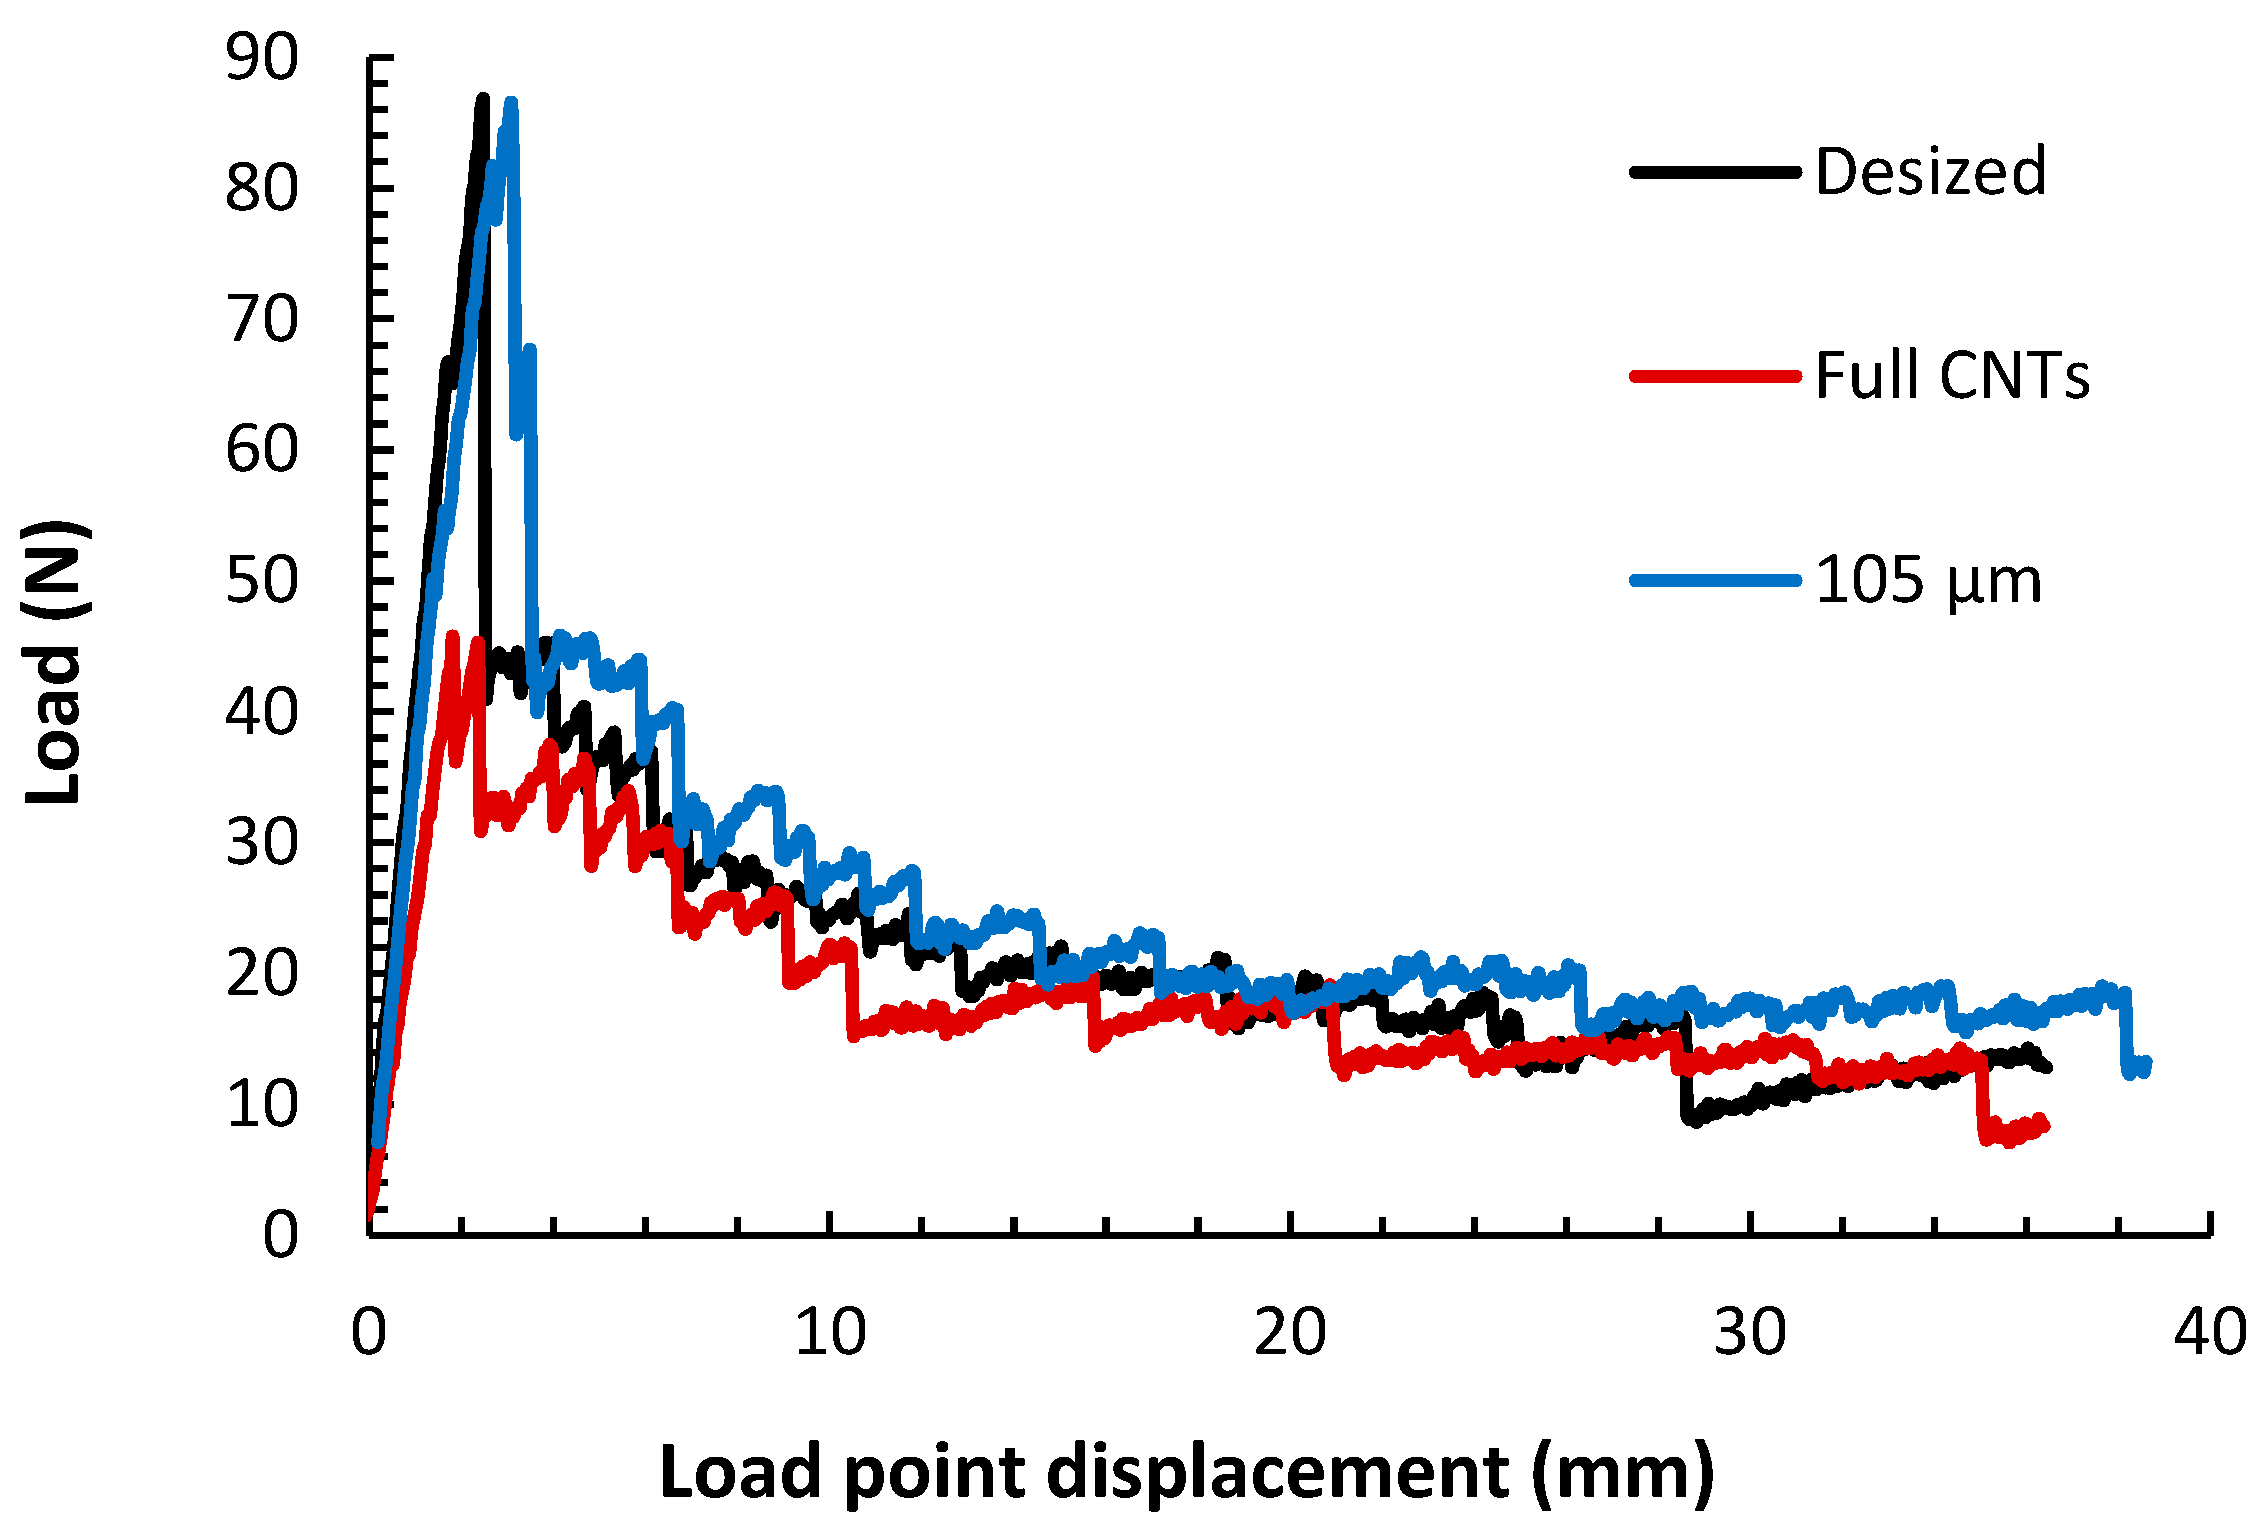
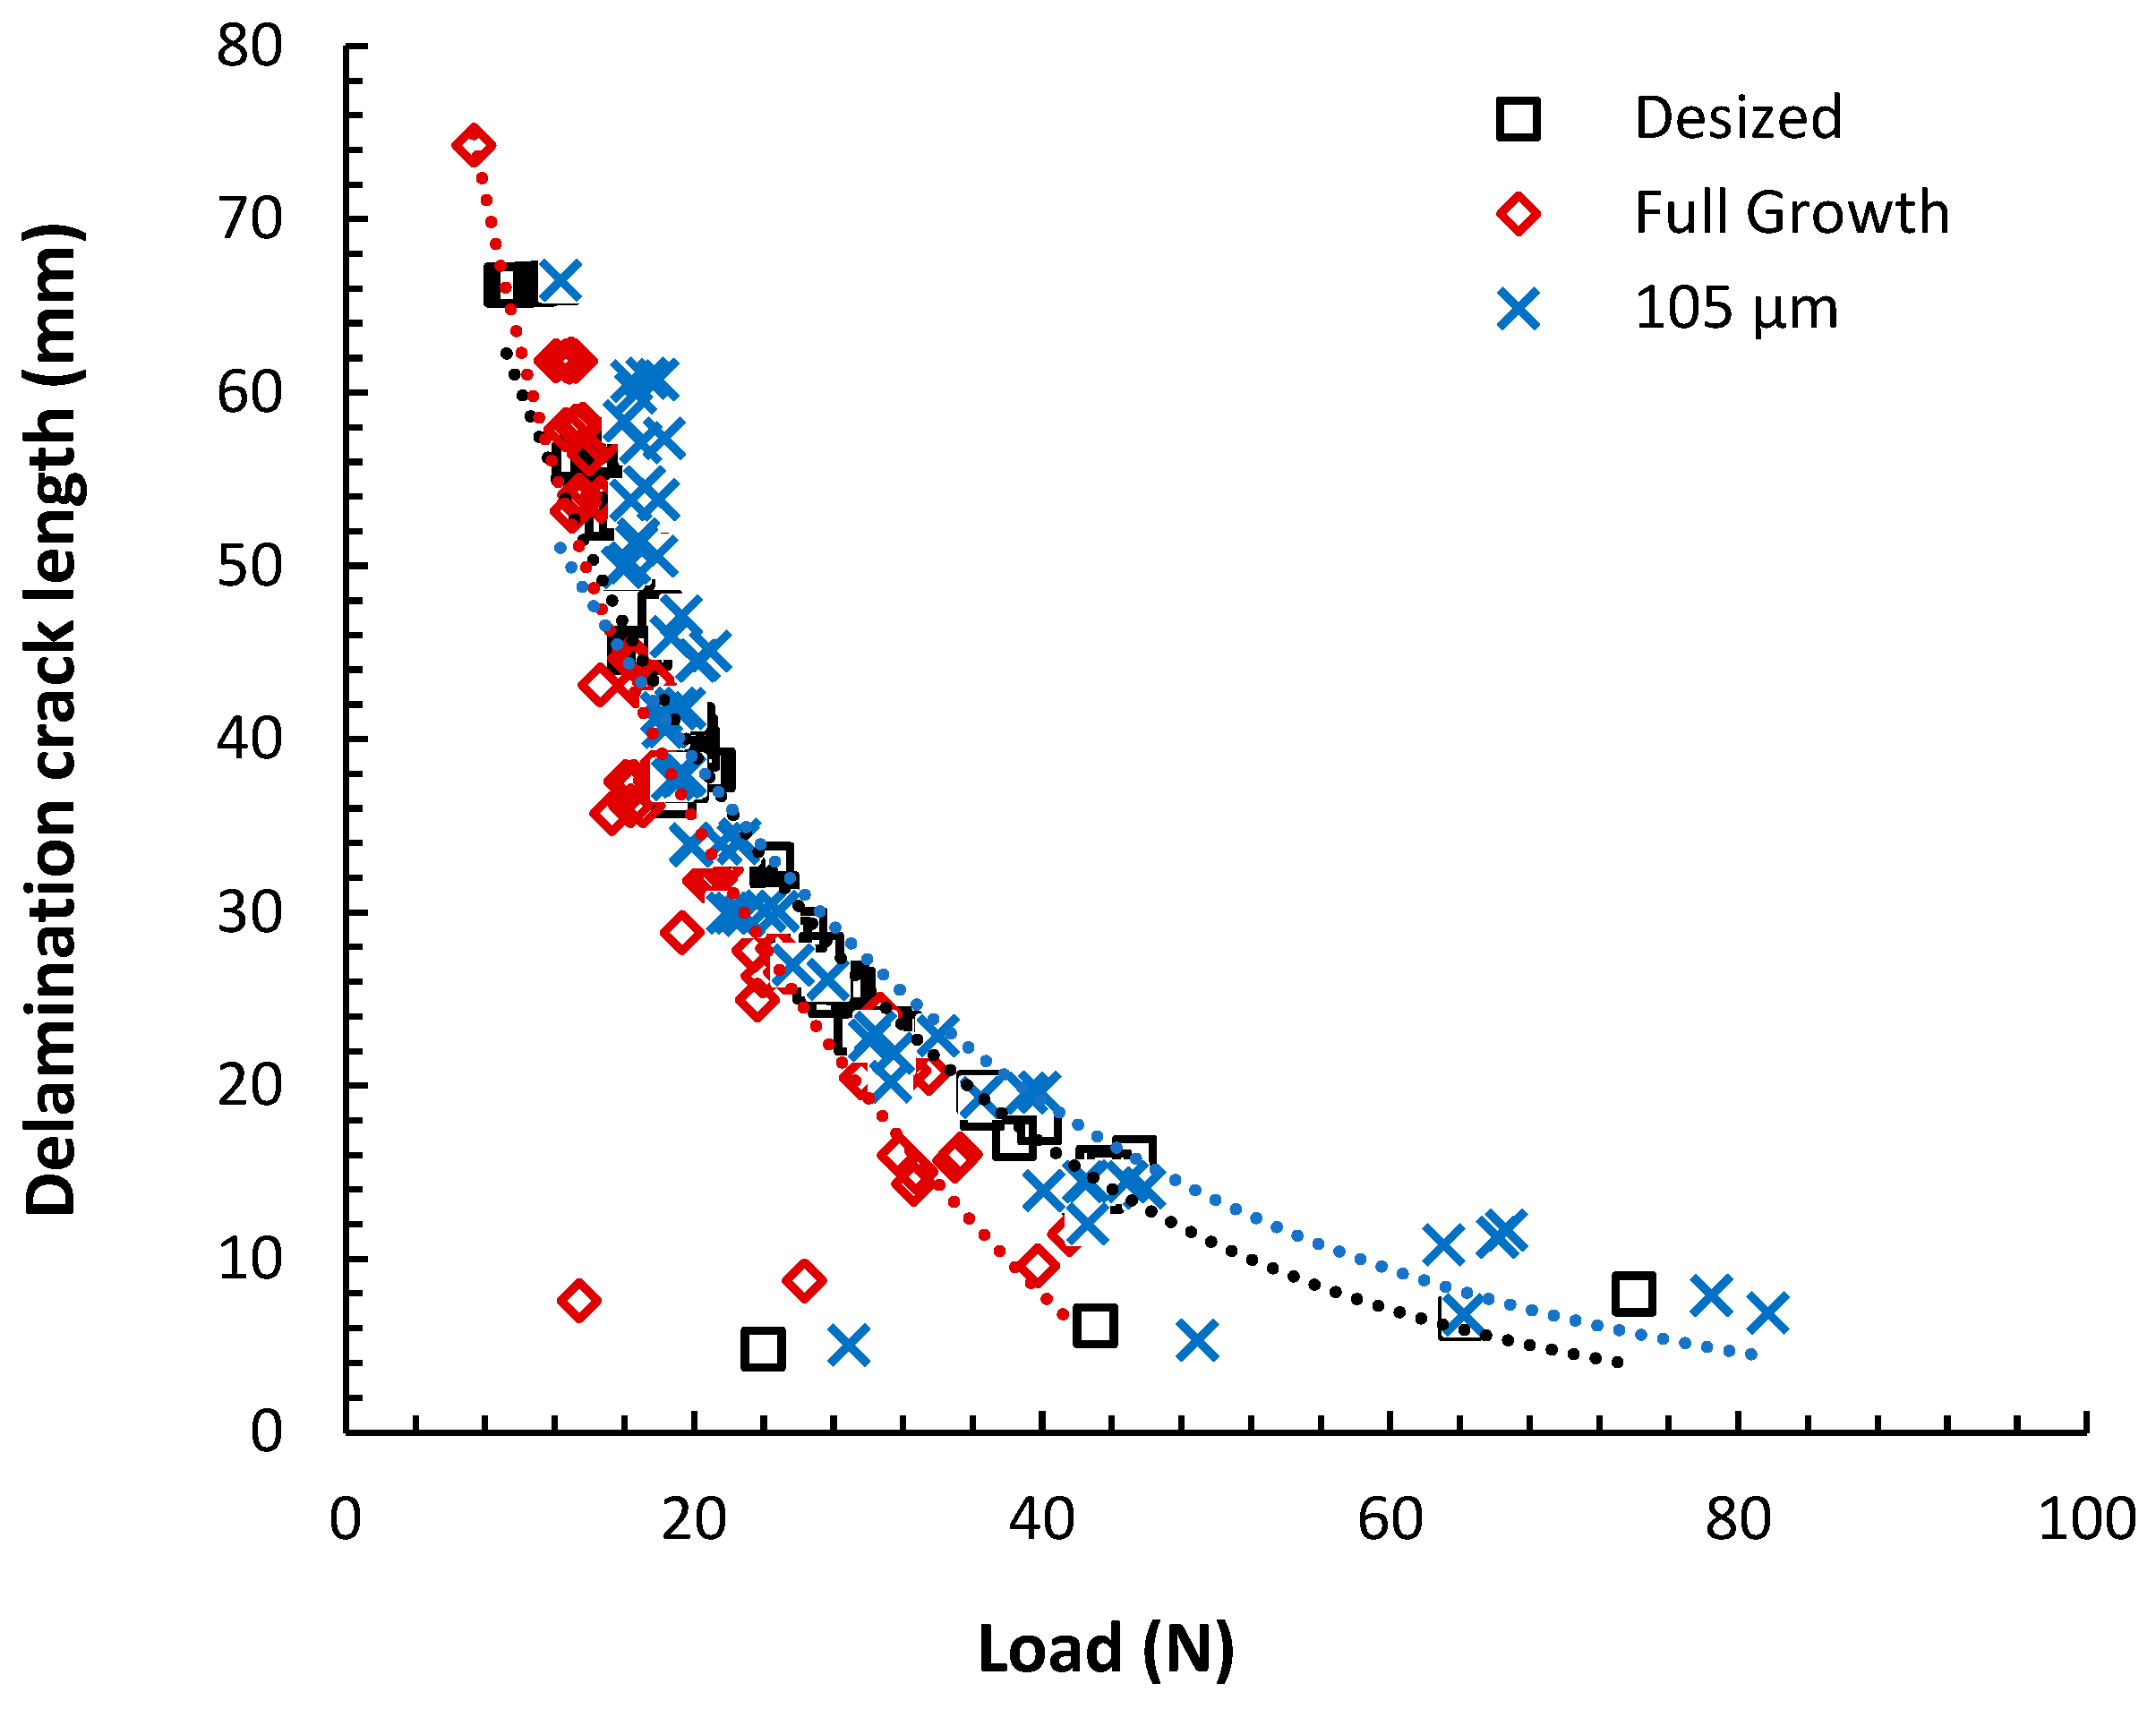
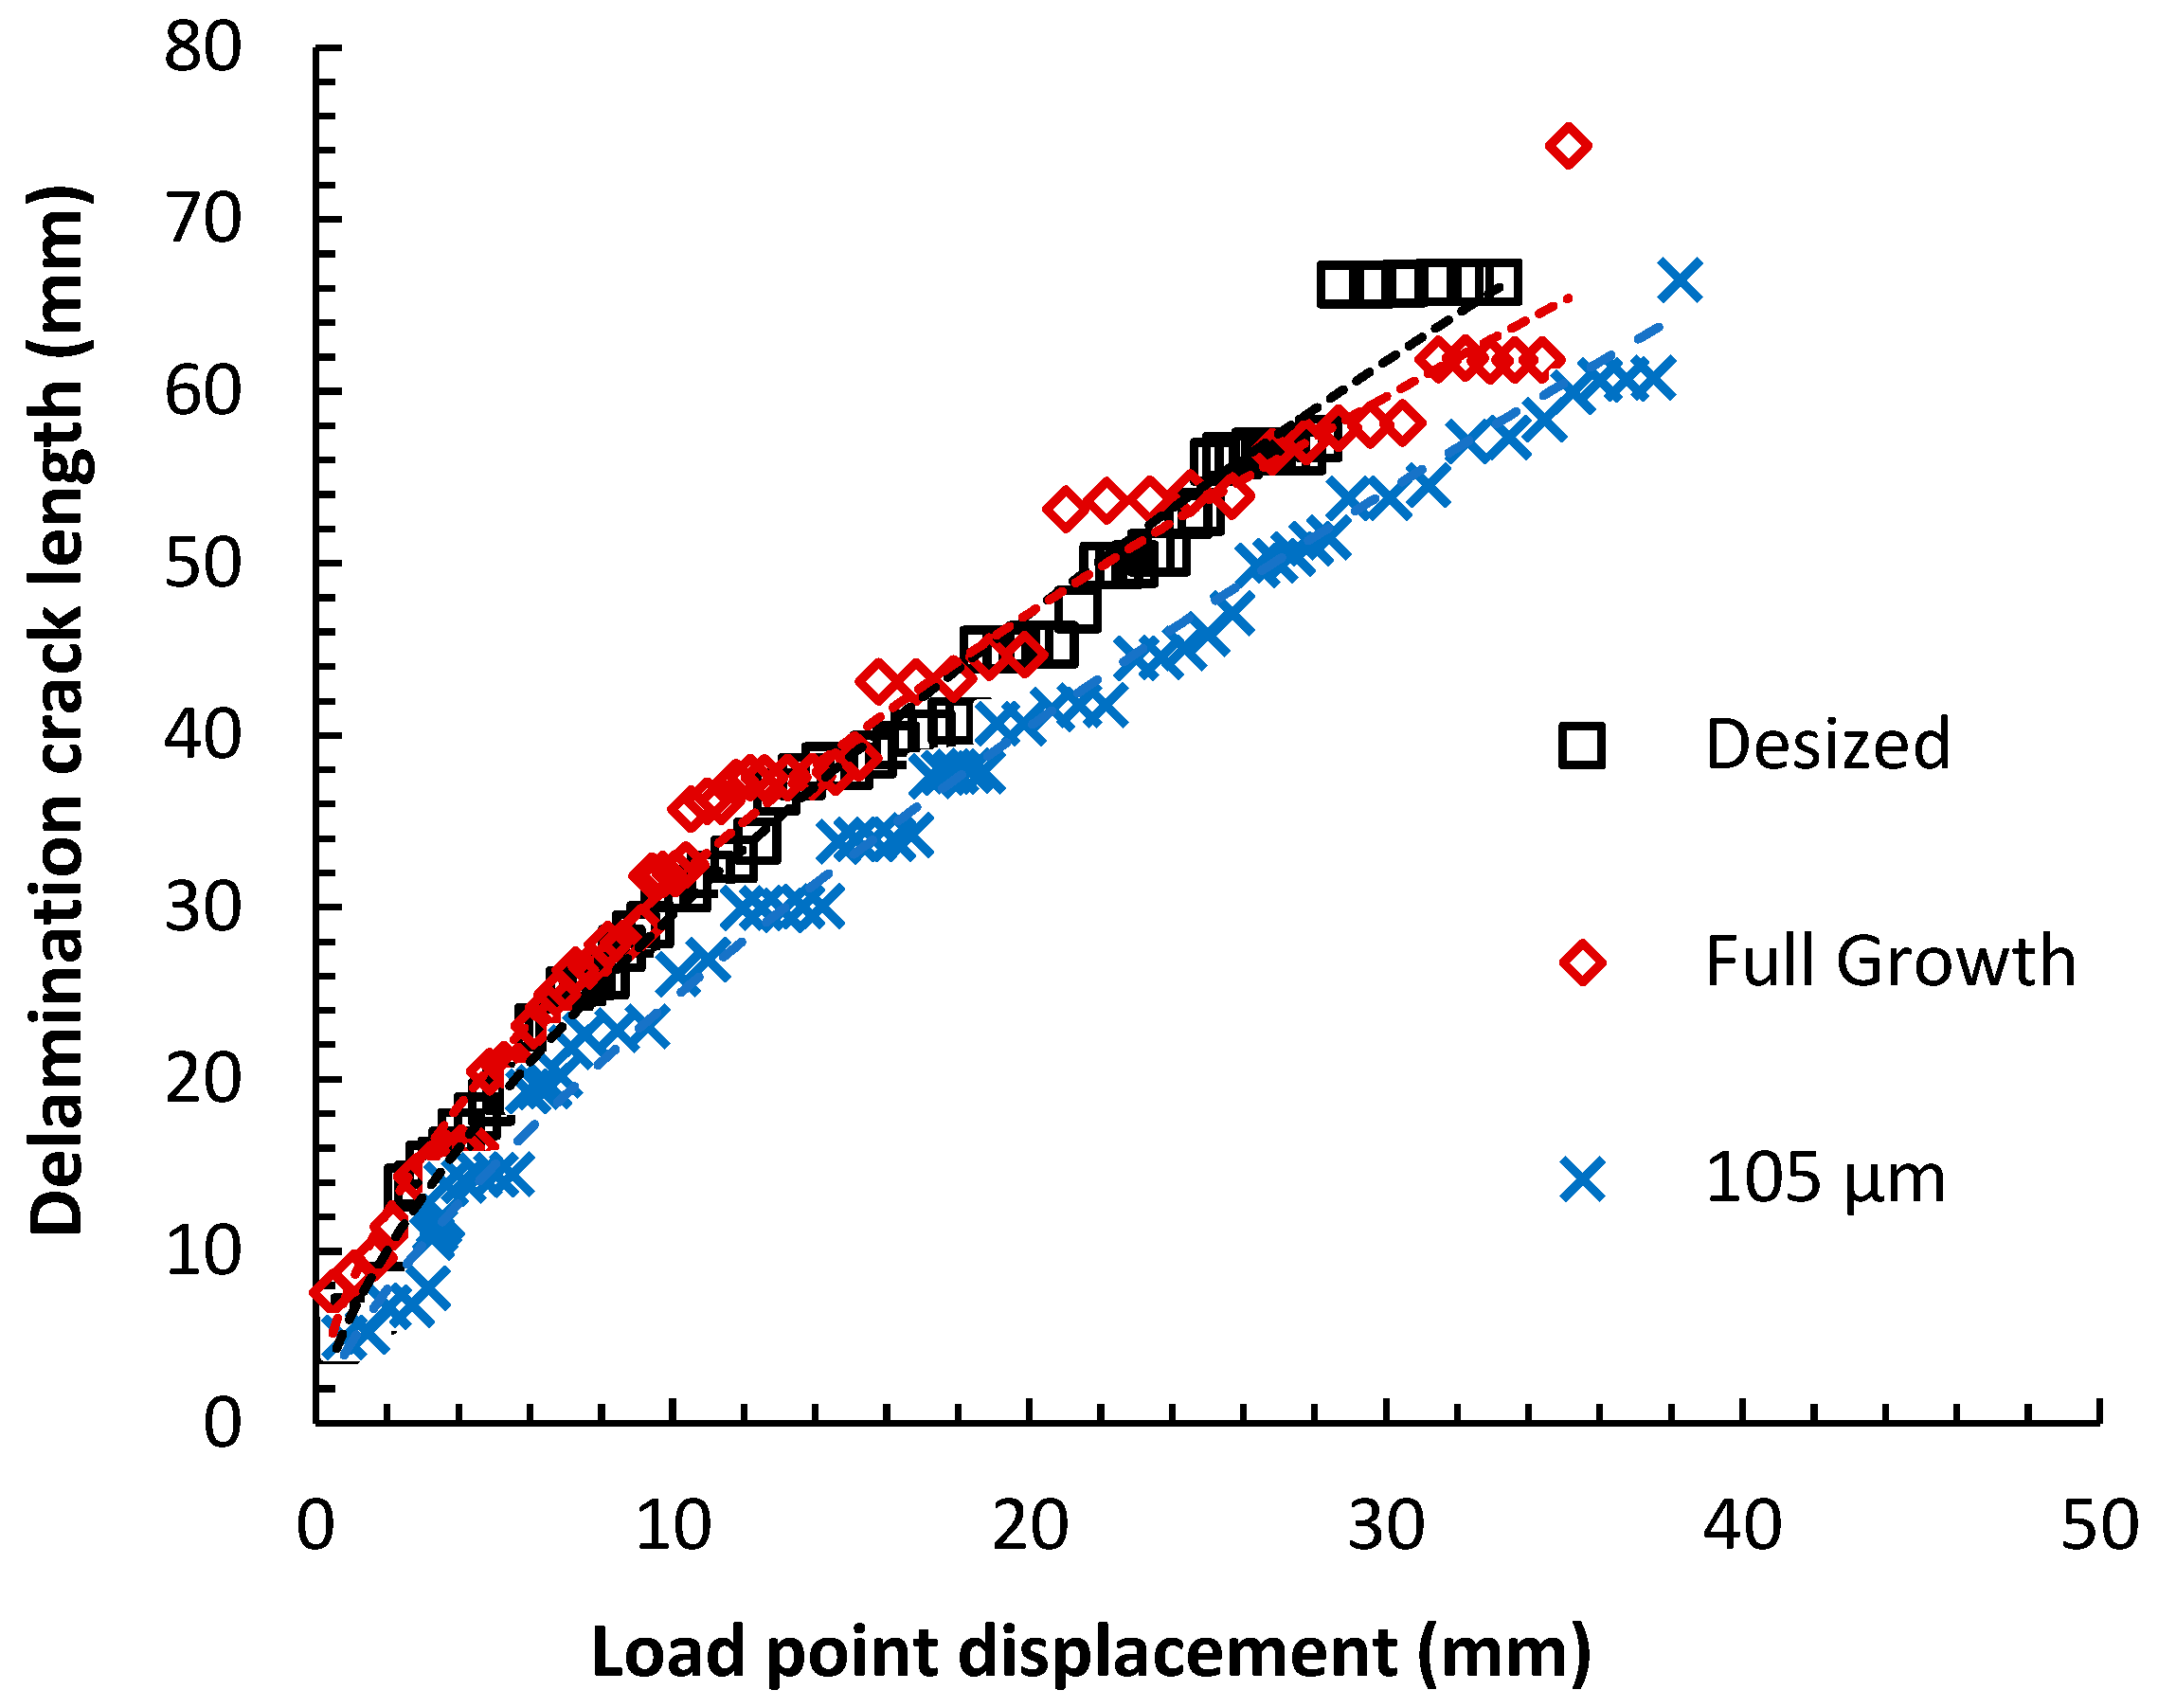
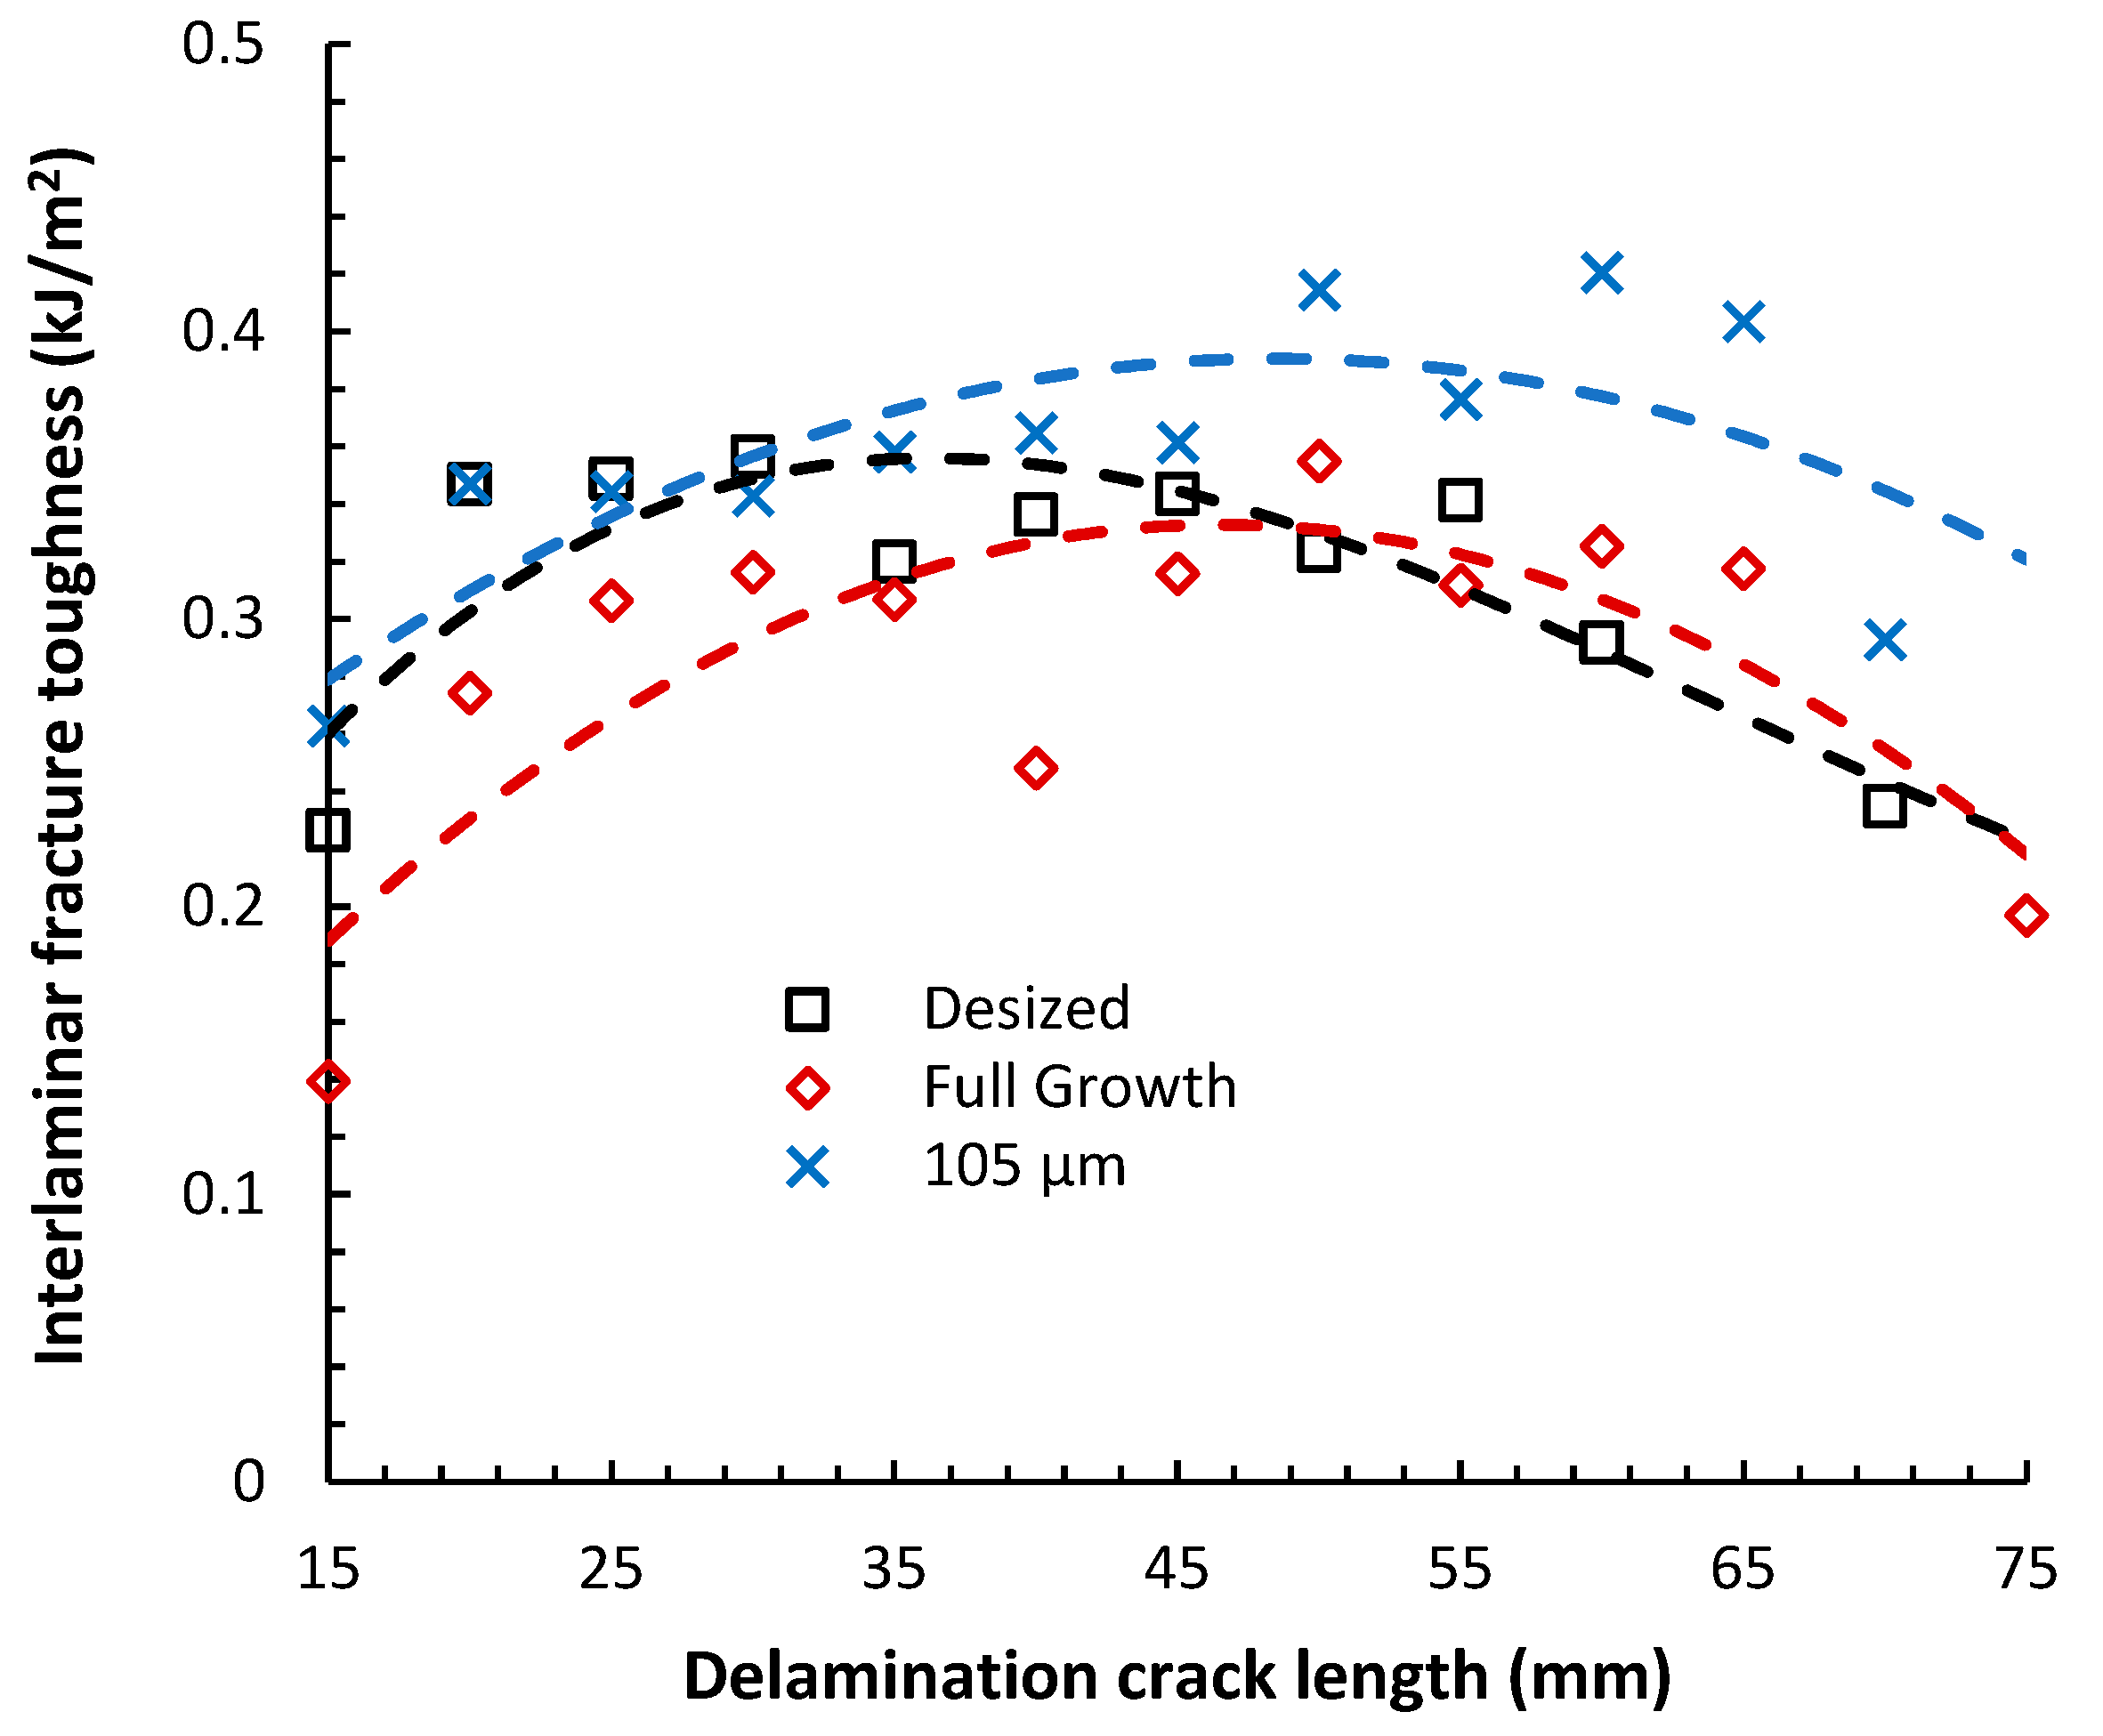
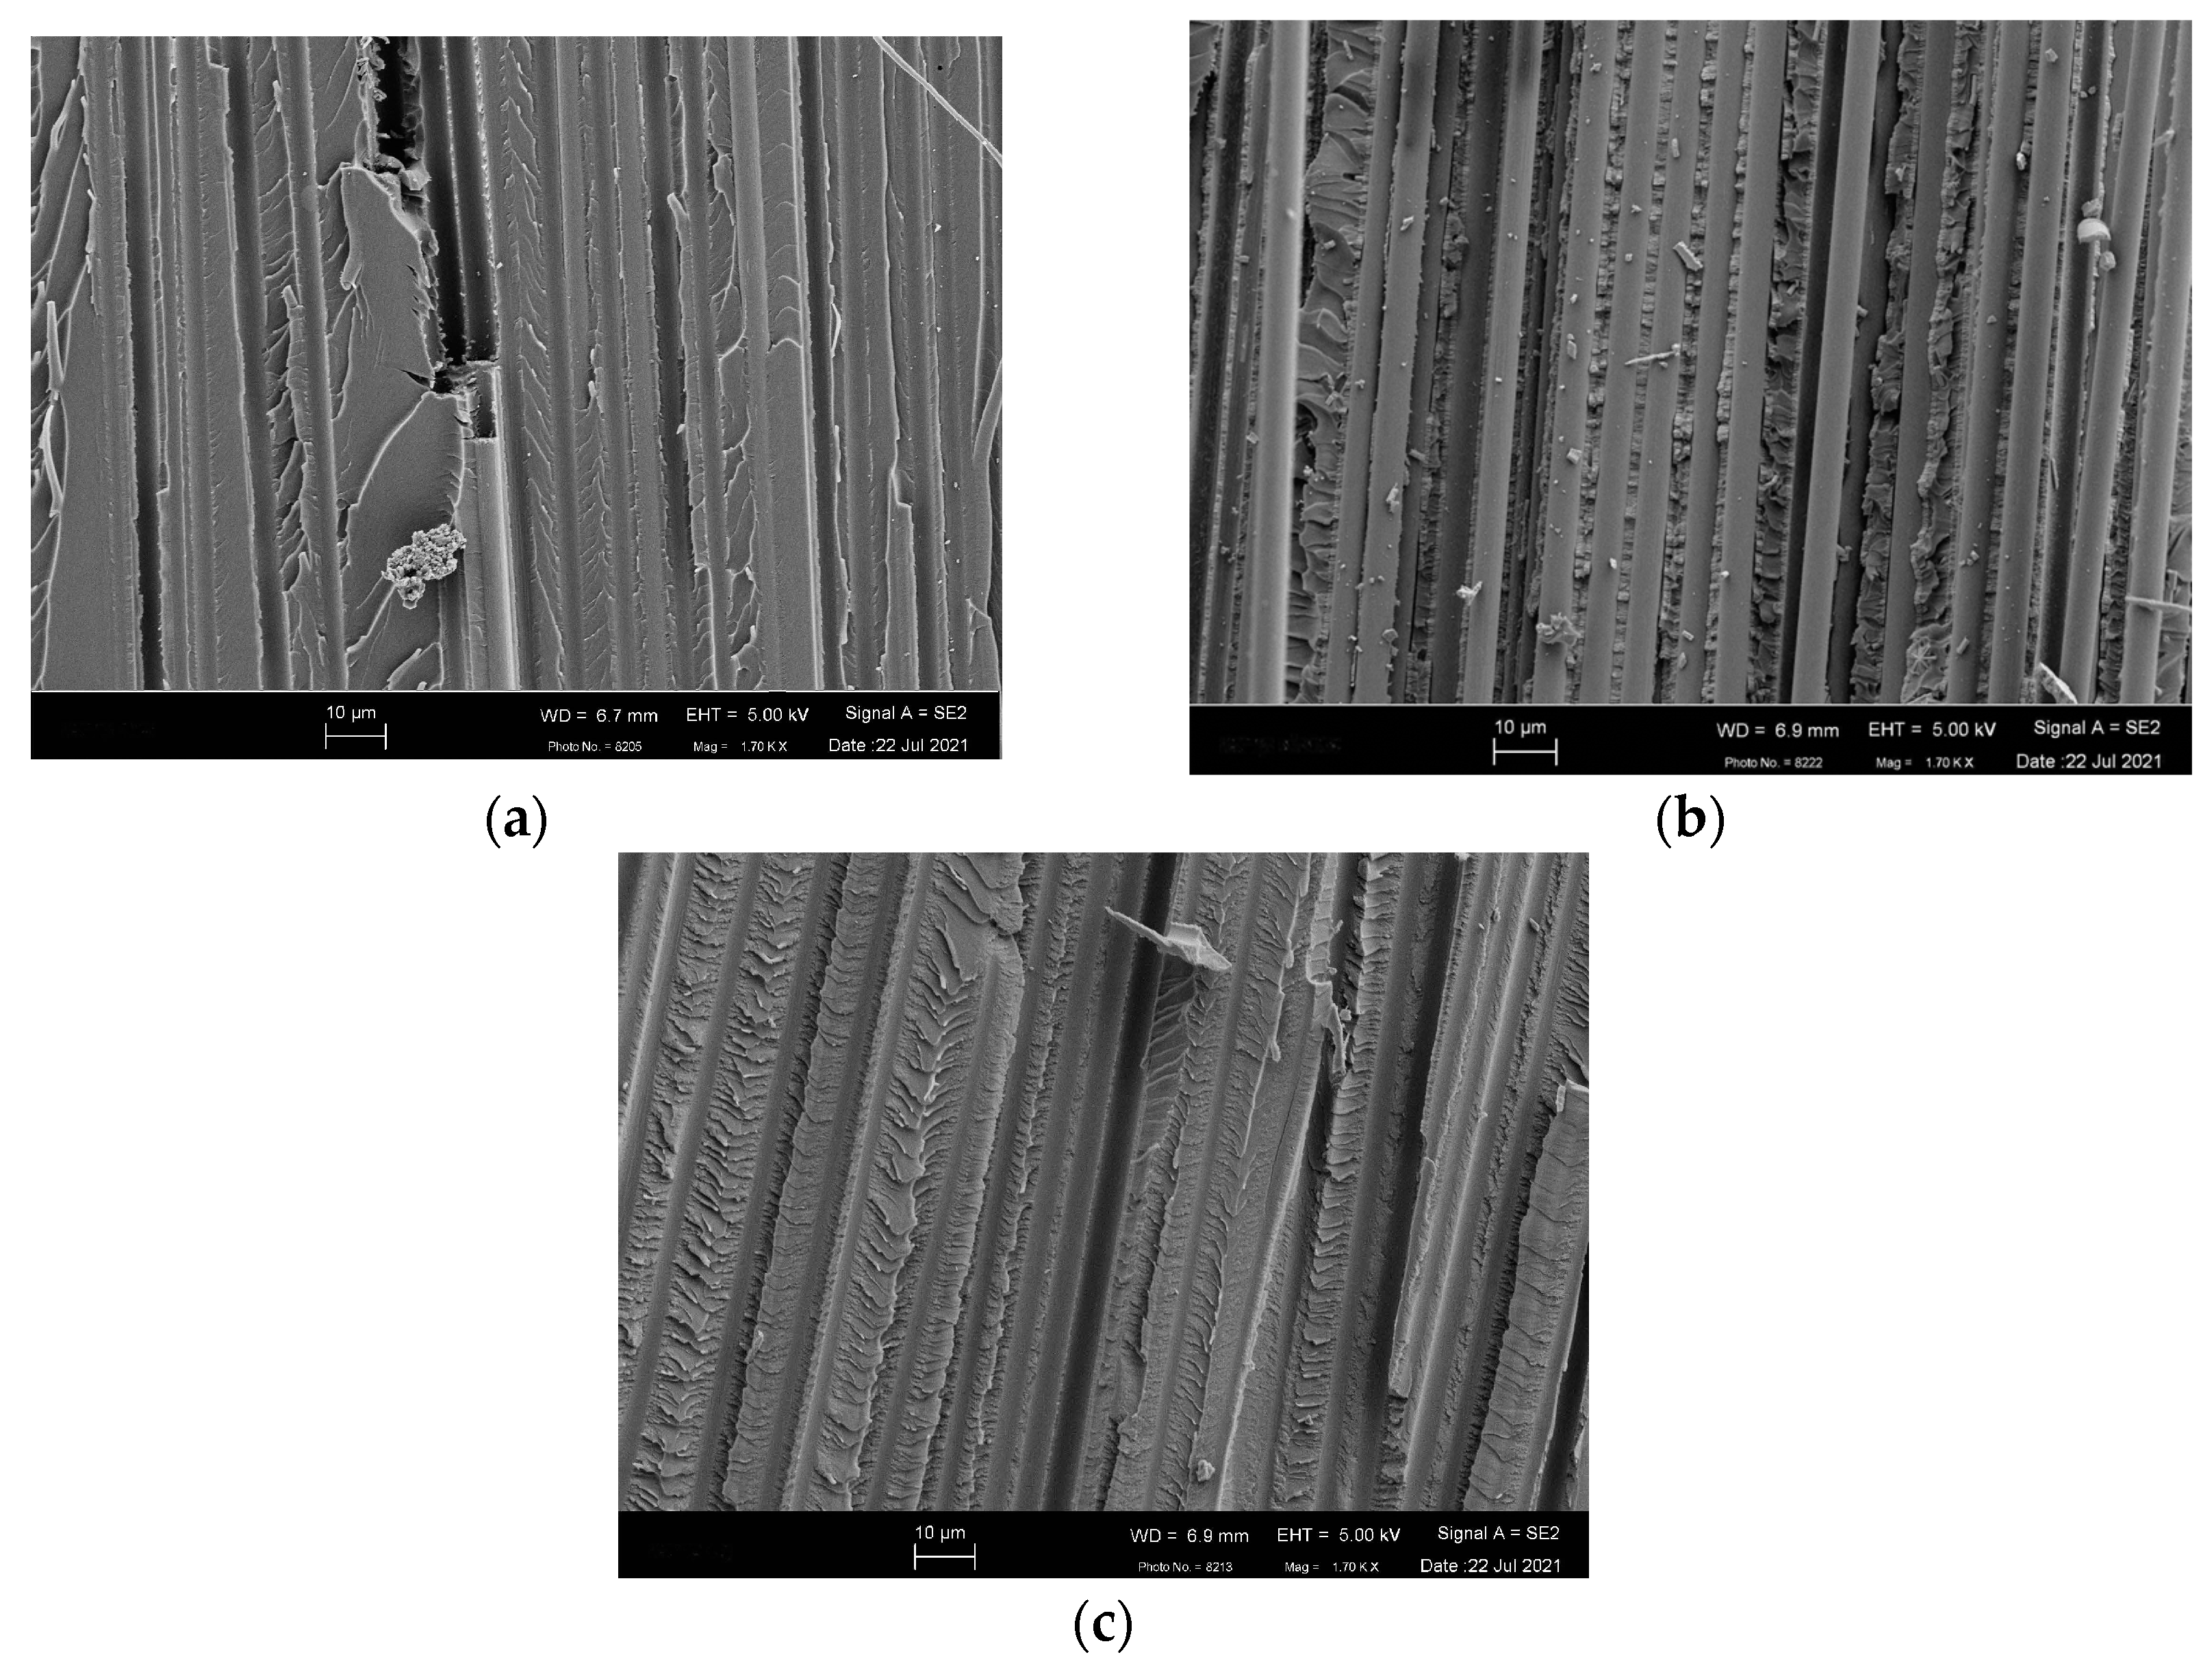
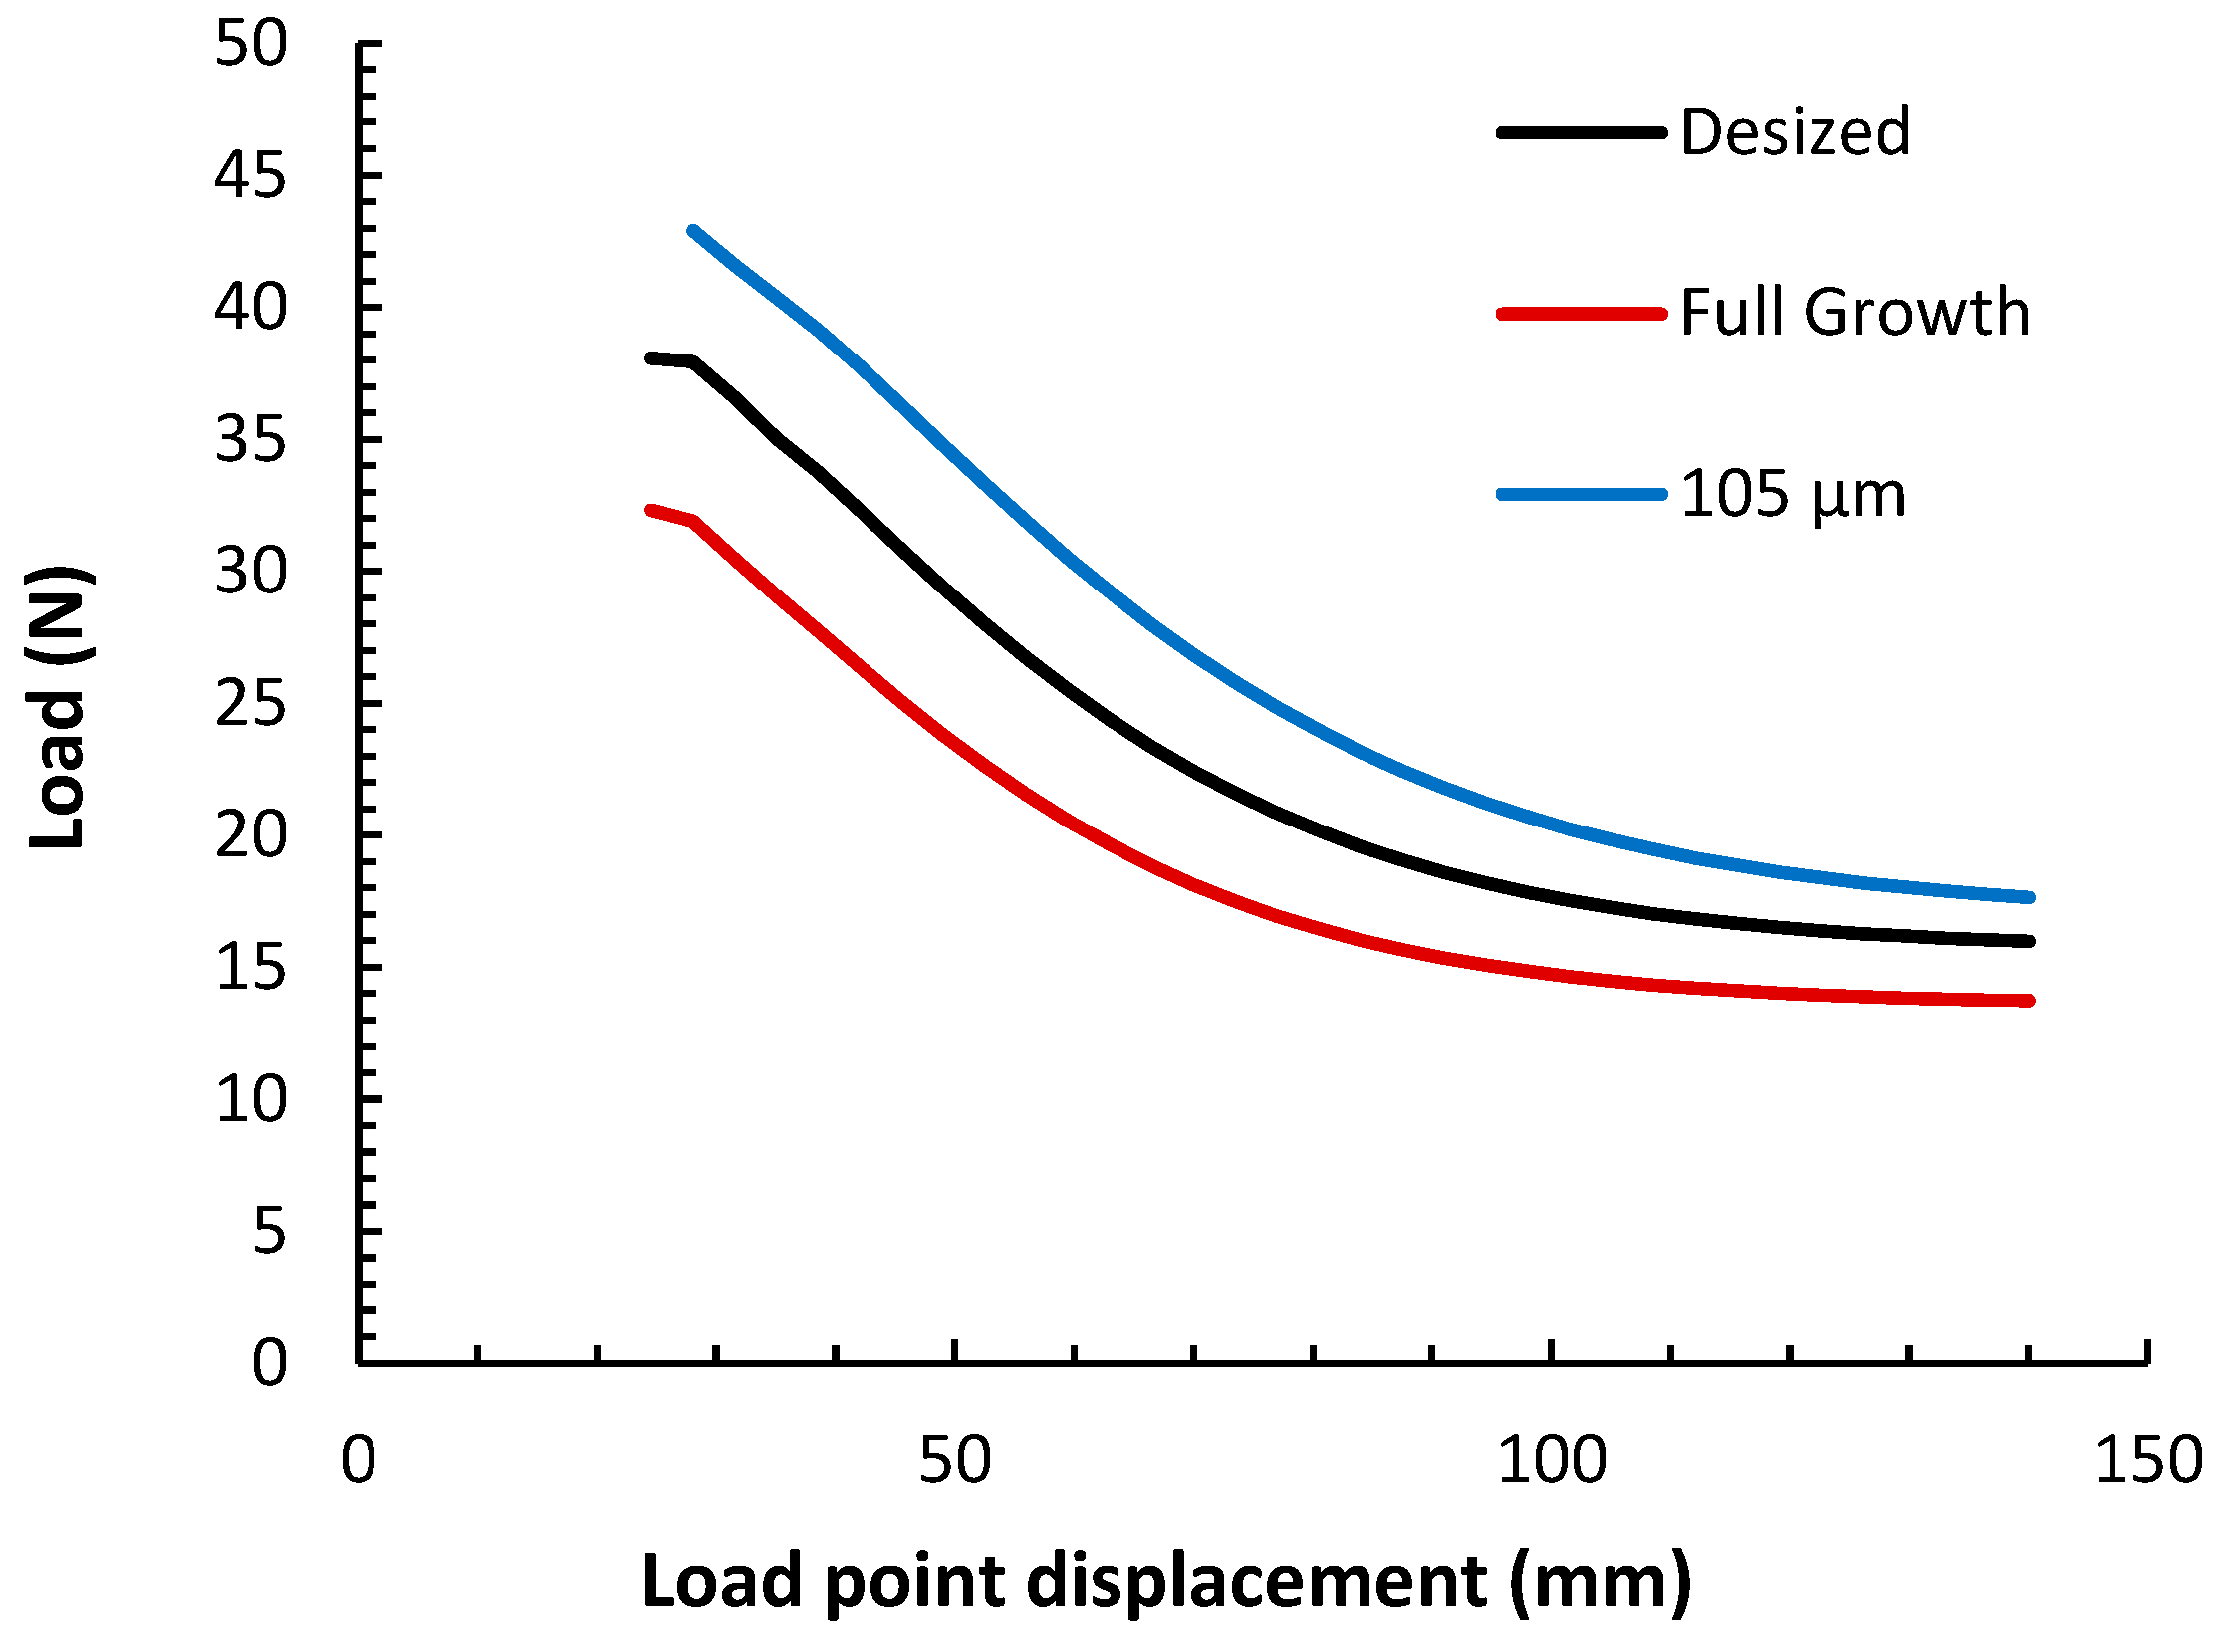
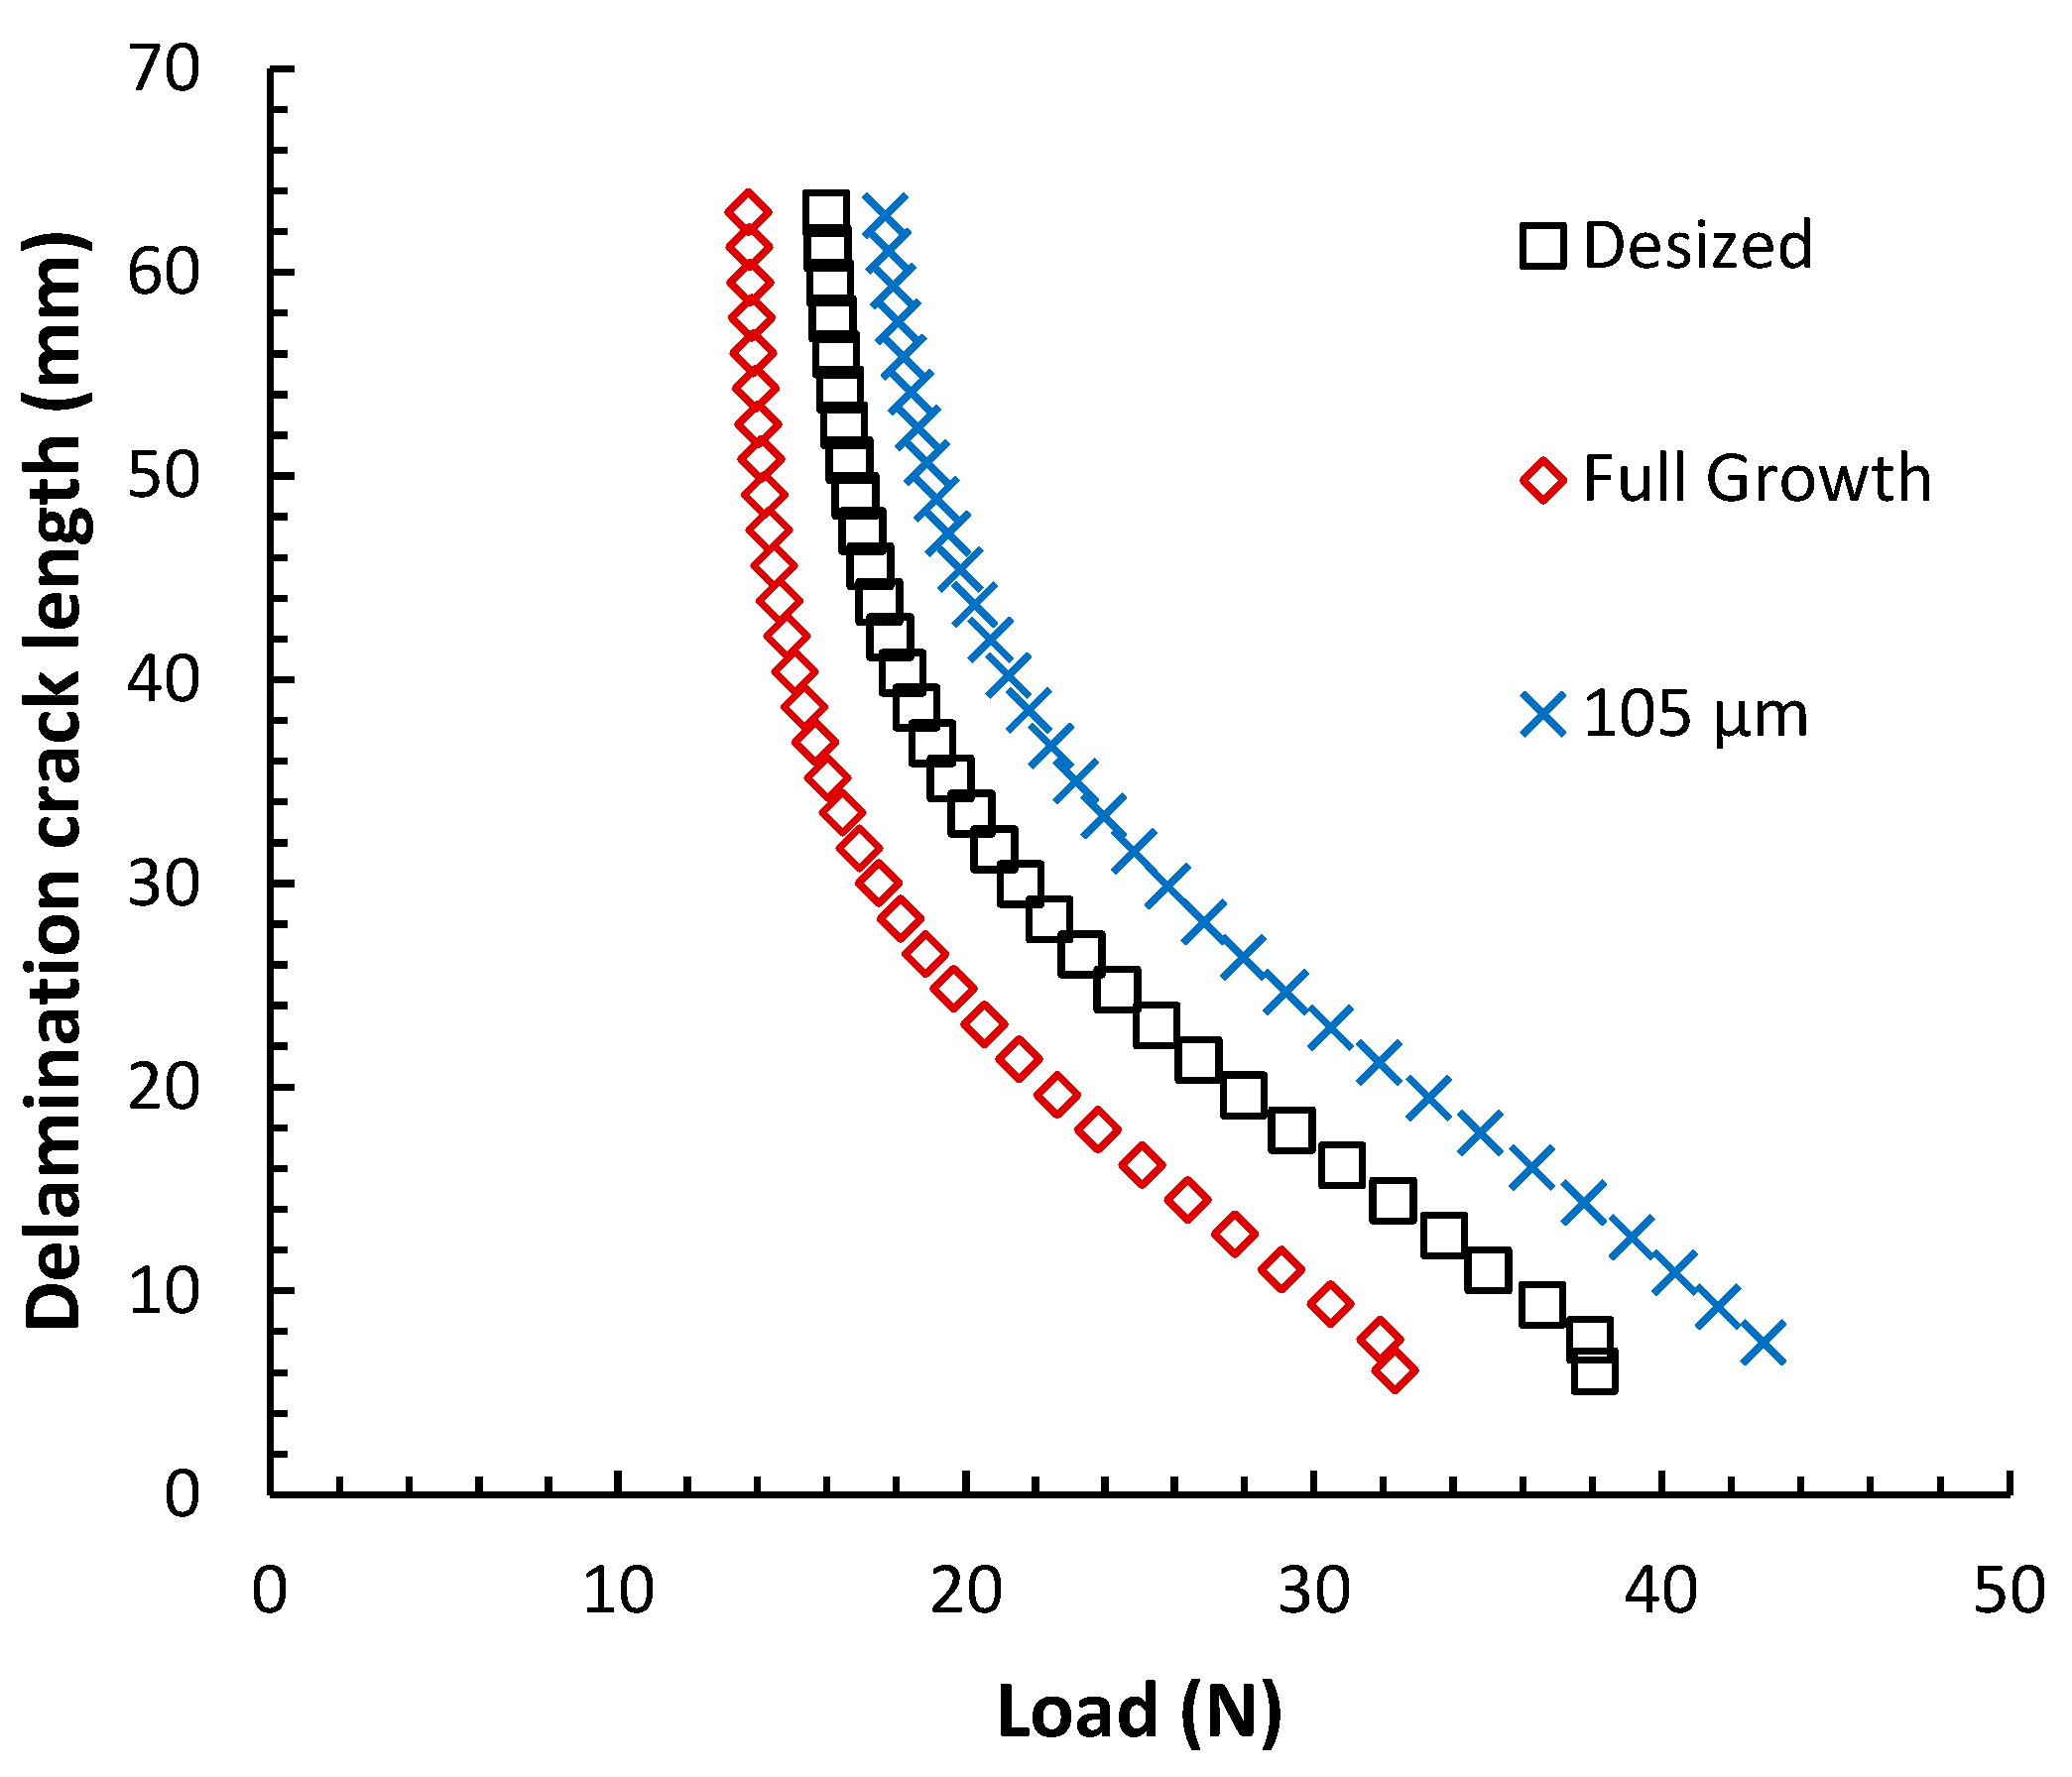
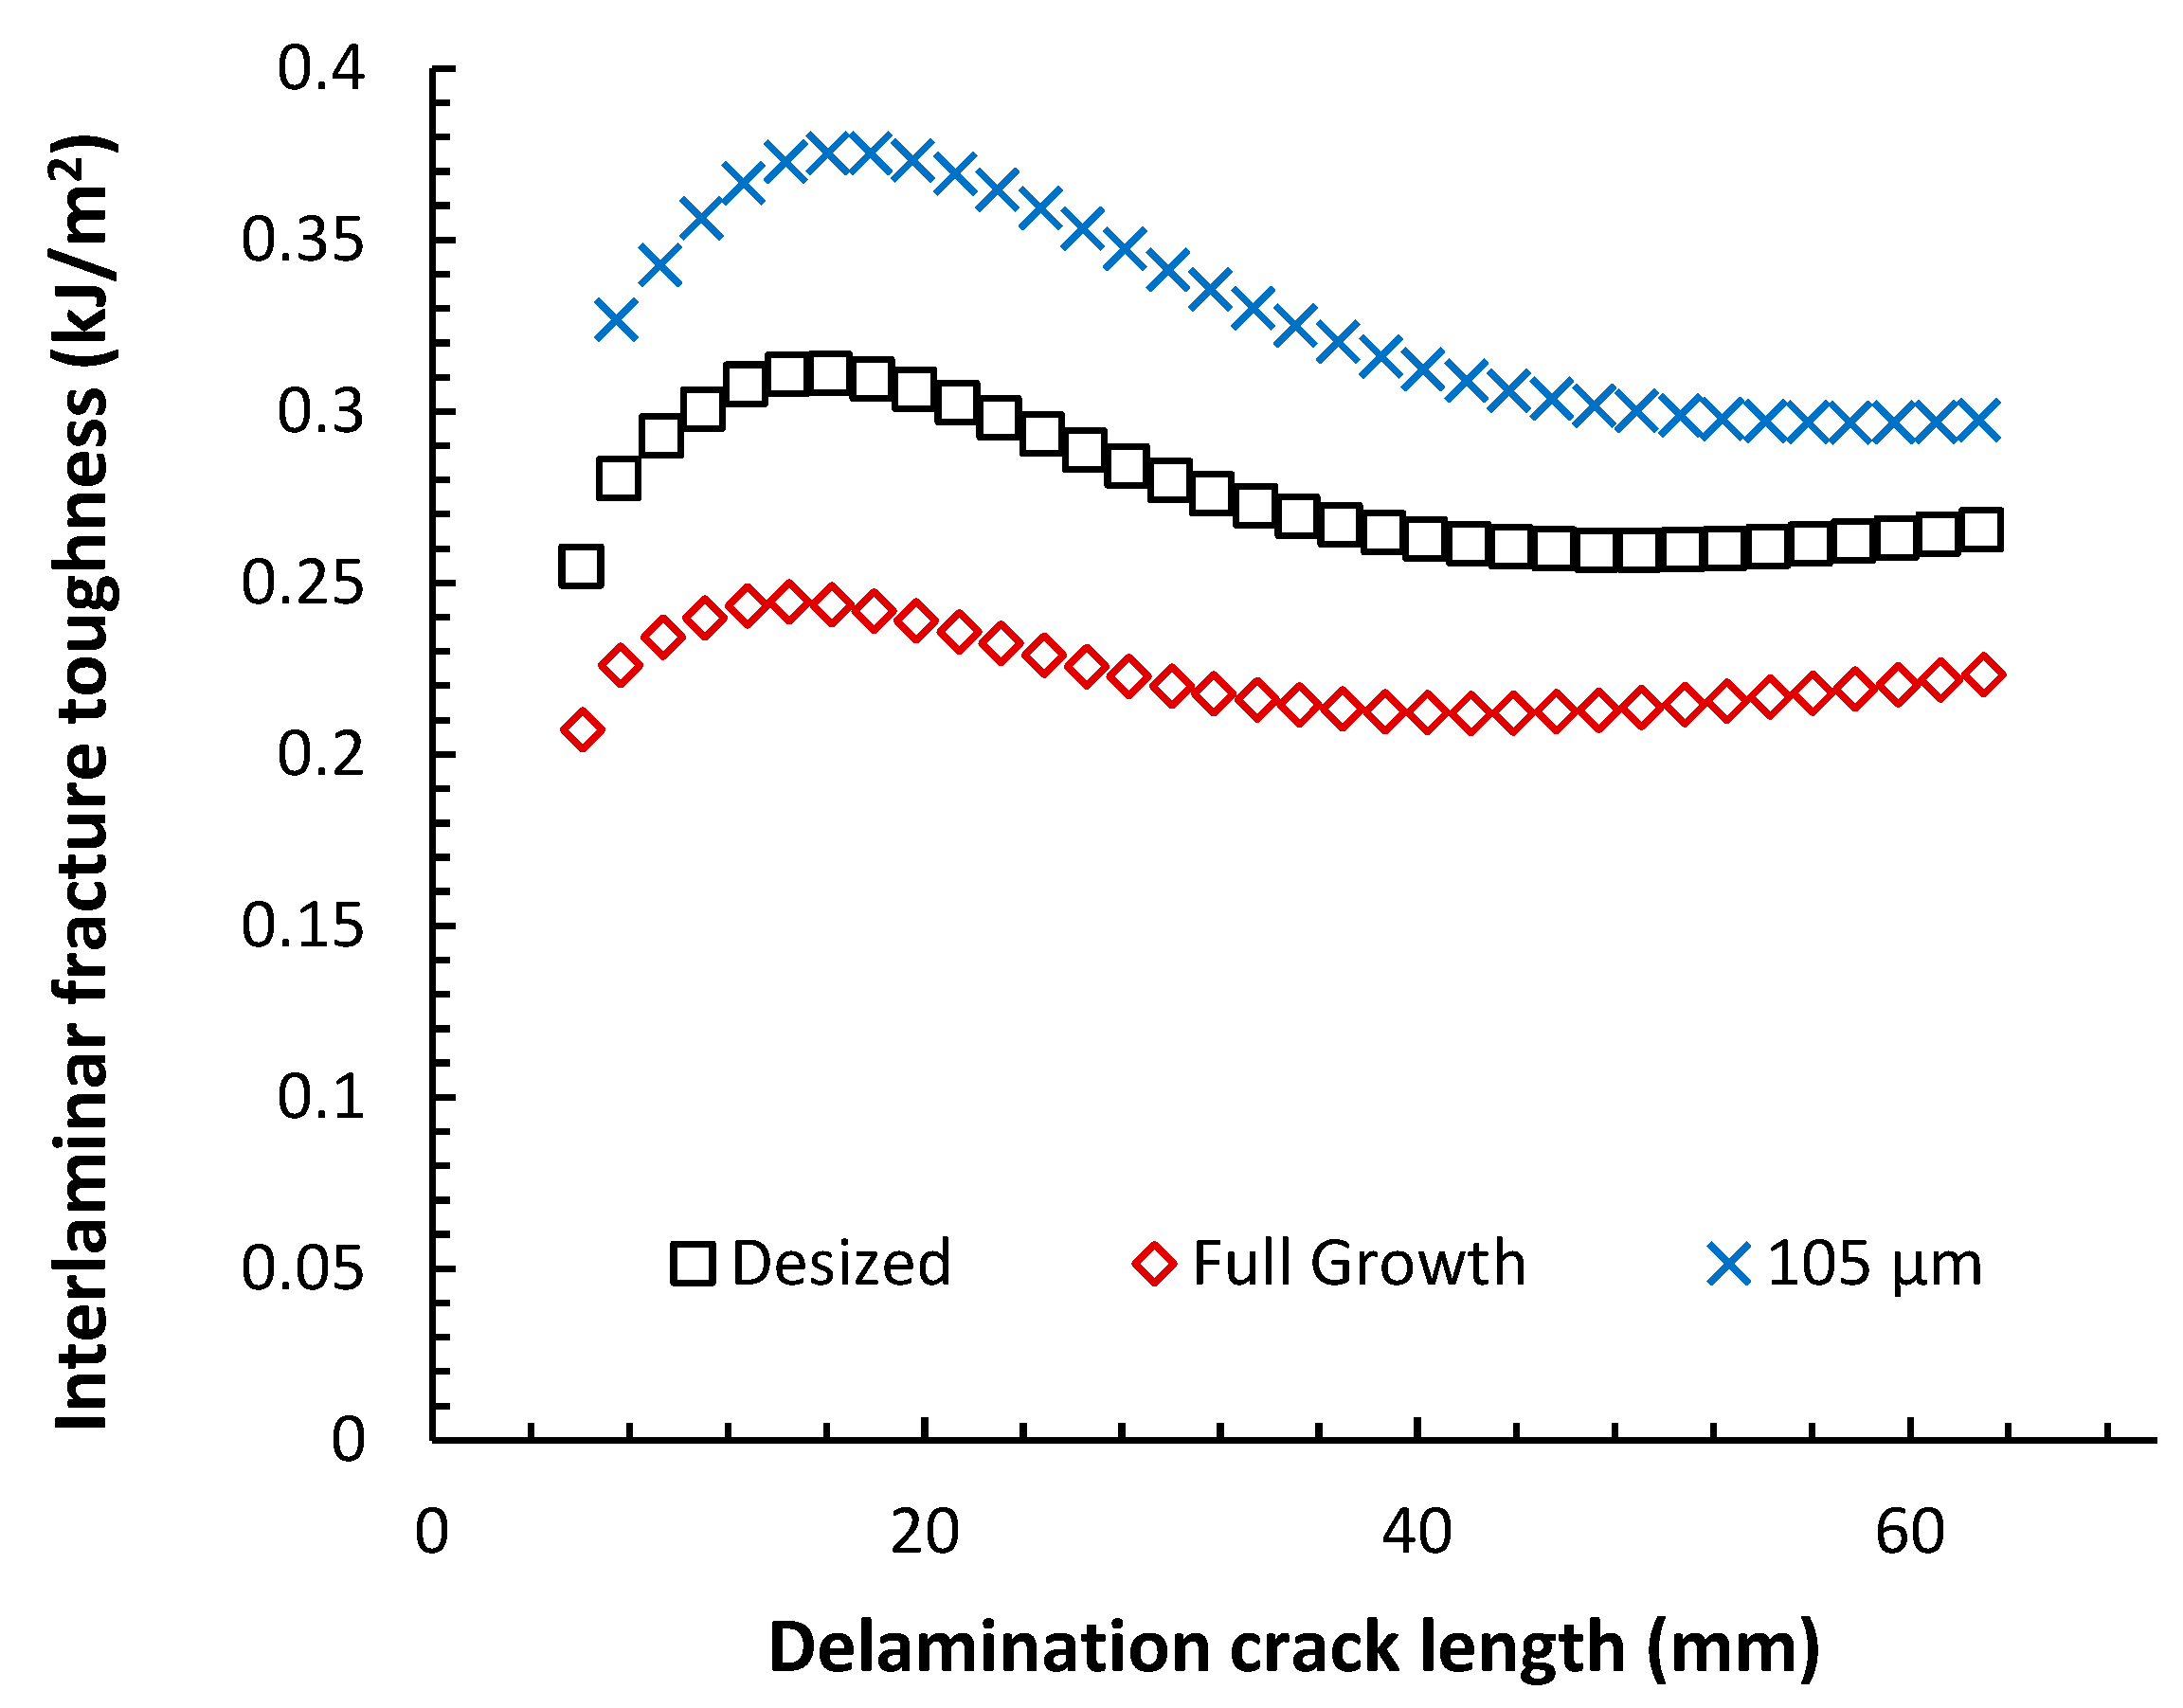
3.1. Experimental DCB Result

As suggested by the model outlined in Section 2.3, the three primary parameters on which the fracture toughness depends are load, delamination crack length, and load point displacement (crosshead displacement). Load and load point displacement were collected using the DAQ system from the MTS machine. The DIC was used to track the delamination crack length. All three parameters for various configurations of composites were plotted against each other, as shown in Figure 8, Figure 9 and Figure 10. The crosshead displacement variation with load applied is shown in Figure 8. This graph is initially seen as linear elastic, imitating a tensile curve. After the load reaches a peak value, there is a significant dip, indicating crack initiation. This was followed by subsequent dips, indicating an unstable crack propagation. This is usually the type of crack growth expected to be seen in composites involving a woven fabric [9,36] in contrast to the stable crack propagation seen in most ceramic-based composites, where the load gradually decreases as the crack propagates [37].
Among the load vs. displacement curves of various configurations seen in Figure 8, compared to the desized sample the 105 μm mesh-based composite sample showed a delayed load drop, indicating delayed crack propagation. These results indicate the presence of stronger mechanical interlocking between the interlaminar regions of mesh-based samples, resulting in higher resistance to crack initiation. In contrast, the load where the crack initiates is almost half at 45 N for the Full CNTs grown composite sample compared to 86 N for the Desized sample. This can be attributed to weak interlaminar strength caused by the dense layer of CNTs prohibiting sufficient wettability of fiber by the matrix.
To examine the crack propagation closely, the delamination crack length was plotted against the load and the load point displacement, as shown in Figure 9 and Figure 10. The load initially increases with the crack length until the crack reaches the end of the PTFE insert. At this stage, the crack starts propagating through the material, dissipating energy. Hence, the load drops with increasing crack length, as a general trend seen in Figure 9. Although the graph might portray a misleading impression of converging data, the data points for the 105 μm configuration are shifted rightward at higher crack length values. This constitutes evidence of the fiber-bridging phenomenon during energy dissipation.
The scattered points are common in these curves per ASTM standard D5528 [28]. The leading causes of such scattering are assuming linear elastic behavior while some nonlinearity can exist, especially when the size of the initial delamination is relatively larger than the smallest dimension in the DCB sample, which is the thickness. The possibility of having mixed mode crack propagation (rather than juts mode-1 as assumed) also generates some scattering. The other source stems from relying on optical means to track the crack propagation.
From Figure 10, it can be inferred that the crack length in the 105 μm configuration at identical load point displacements is lower than the rest of the other composite configurations. This is evident by its lower slope values. This implies that the rate of crack growth in the 105 μm hybrid configuration is lower than in the other composites. The other configurations show relatively higher and lower slopes based on the crack region. This shows that 105 μm patterning is more efficient for resisting crack growth and slowing the crack growth rate. This result emphasizes the importance of the optimal topology/density of CNTs reinforcements on the carbon fiber surface.
After the experimental data was collected and plotted, Equations (1) and (2) were used to calculate interlaminar fracture toughness for each configuration. The averaged data of this parameter is shown in Figure 11. These plots are also known as representative crack resistance curves (R-curves). The values of these R-curves are initially low, representing GIc for crack initiation. They gradually rise to form a plateau, representing GIc for crack growth [9]. Crack initiation usually occurs due to brittle matrix fracture, requiring lesser energy. As the crack propagates, debonding of the fiber/matrix interface occurs. In the presence of a strong interface, fiber-bridging, and pull-outs, or nano-reinforcement bridging, are some phenomena that hinder crack propagation, increasing the interlaminar fracture toughness of the composite. In the presence of a weak interface, delamination is smooth as the crack propagates through the fiber mat/matrix interface with no resistance, virtually rendering the interlaminar toughness of the composite to minimum values [38,39].
During crack propagation, the crack encounters several types of regions like matrix-rich regions, CNTs patches, and fiber/matrix bonds, among others. Each region exhibits a different energy dissipation mechanism during the crack growth. These different mechanisms result in a distinct R-curve representing a particular composite configuration. From Figure 11, the GIc at crack initiation, in increasing order, can be seen as Full Growth, Desized, and 105 μm. Inspecting crack propagation in each configuration, the Desized composite interlaminar toughness values initially increased and then dropped as the crack length expanded, indicating significant crack resistance due to fiber bridging or fiber pull-out mechanisms deemed possible by a relatively strong fiber/matrix interface. In the case of Full Growth configuration, the low crack initiation GIc and relatively constant GIc values during crack propagation indicate a weak fiber/matrix interface due to poor CNTs adhesion at the fiber/matrix interface and smooth, non-resistant crack growth. Finally, for the case of 105 μm composite configuration, the toughness value is high during crack initiation and significantly increases till the end of crack growth. This implies a strong fiber/matrix/CNTs interface and enhanced crack resistance via fiber/CNTs bridging and fiber pull out, among other energy dissipation mechanisms during crack growth.
The results revealed that the 105 μm patterning is more efficient for both resisting crack growth and slowing the crack growth rate. This result emphasizes the importance of the optimal topology/density of CNTs reinforcements on the carbon fiber surface. As shown in the SEM images in Figure 12, the interfaces between the fiber and the matrix play a key role in how the cracks propagate at the interface. Figure 12a reveals that for the Desized composite, the acceptable adhesion of the fiber to the matrix is evident by minimal detached fibers from the matrix. For the uniform growth composite configuration, several cracks propagated along the axis of the fibers, indicating poor adhesion to the matrix. The poor adhesion can be attributed to the dense growth of the CNTs hindering the epoxy from wetting the carbon fiber; this is supported by several clean surface fibers observed in Figure 12b. On the contrary, the patterned growth of CNTs promoted the wetting of the fiber by the epoxy, yielding good adhesion between the constituents, as shown in Figure 12c. The patches of CNTs act as bridge reinforcements, facilitating a zigzag path instead of a straight path during crack propagation [9,40]. This provides more resistance and requires higher loads for the crack to propagate.

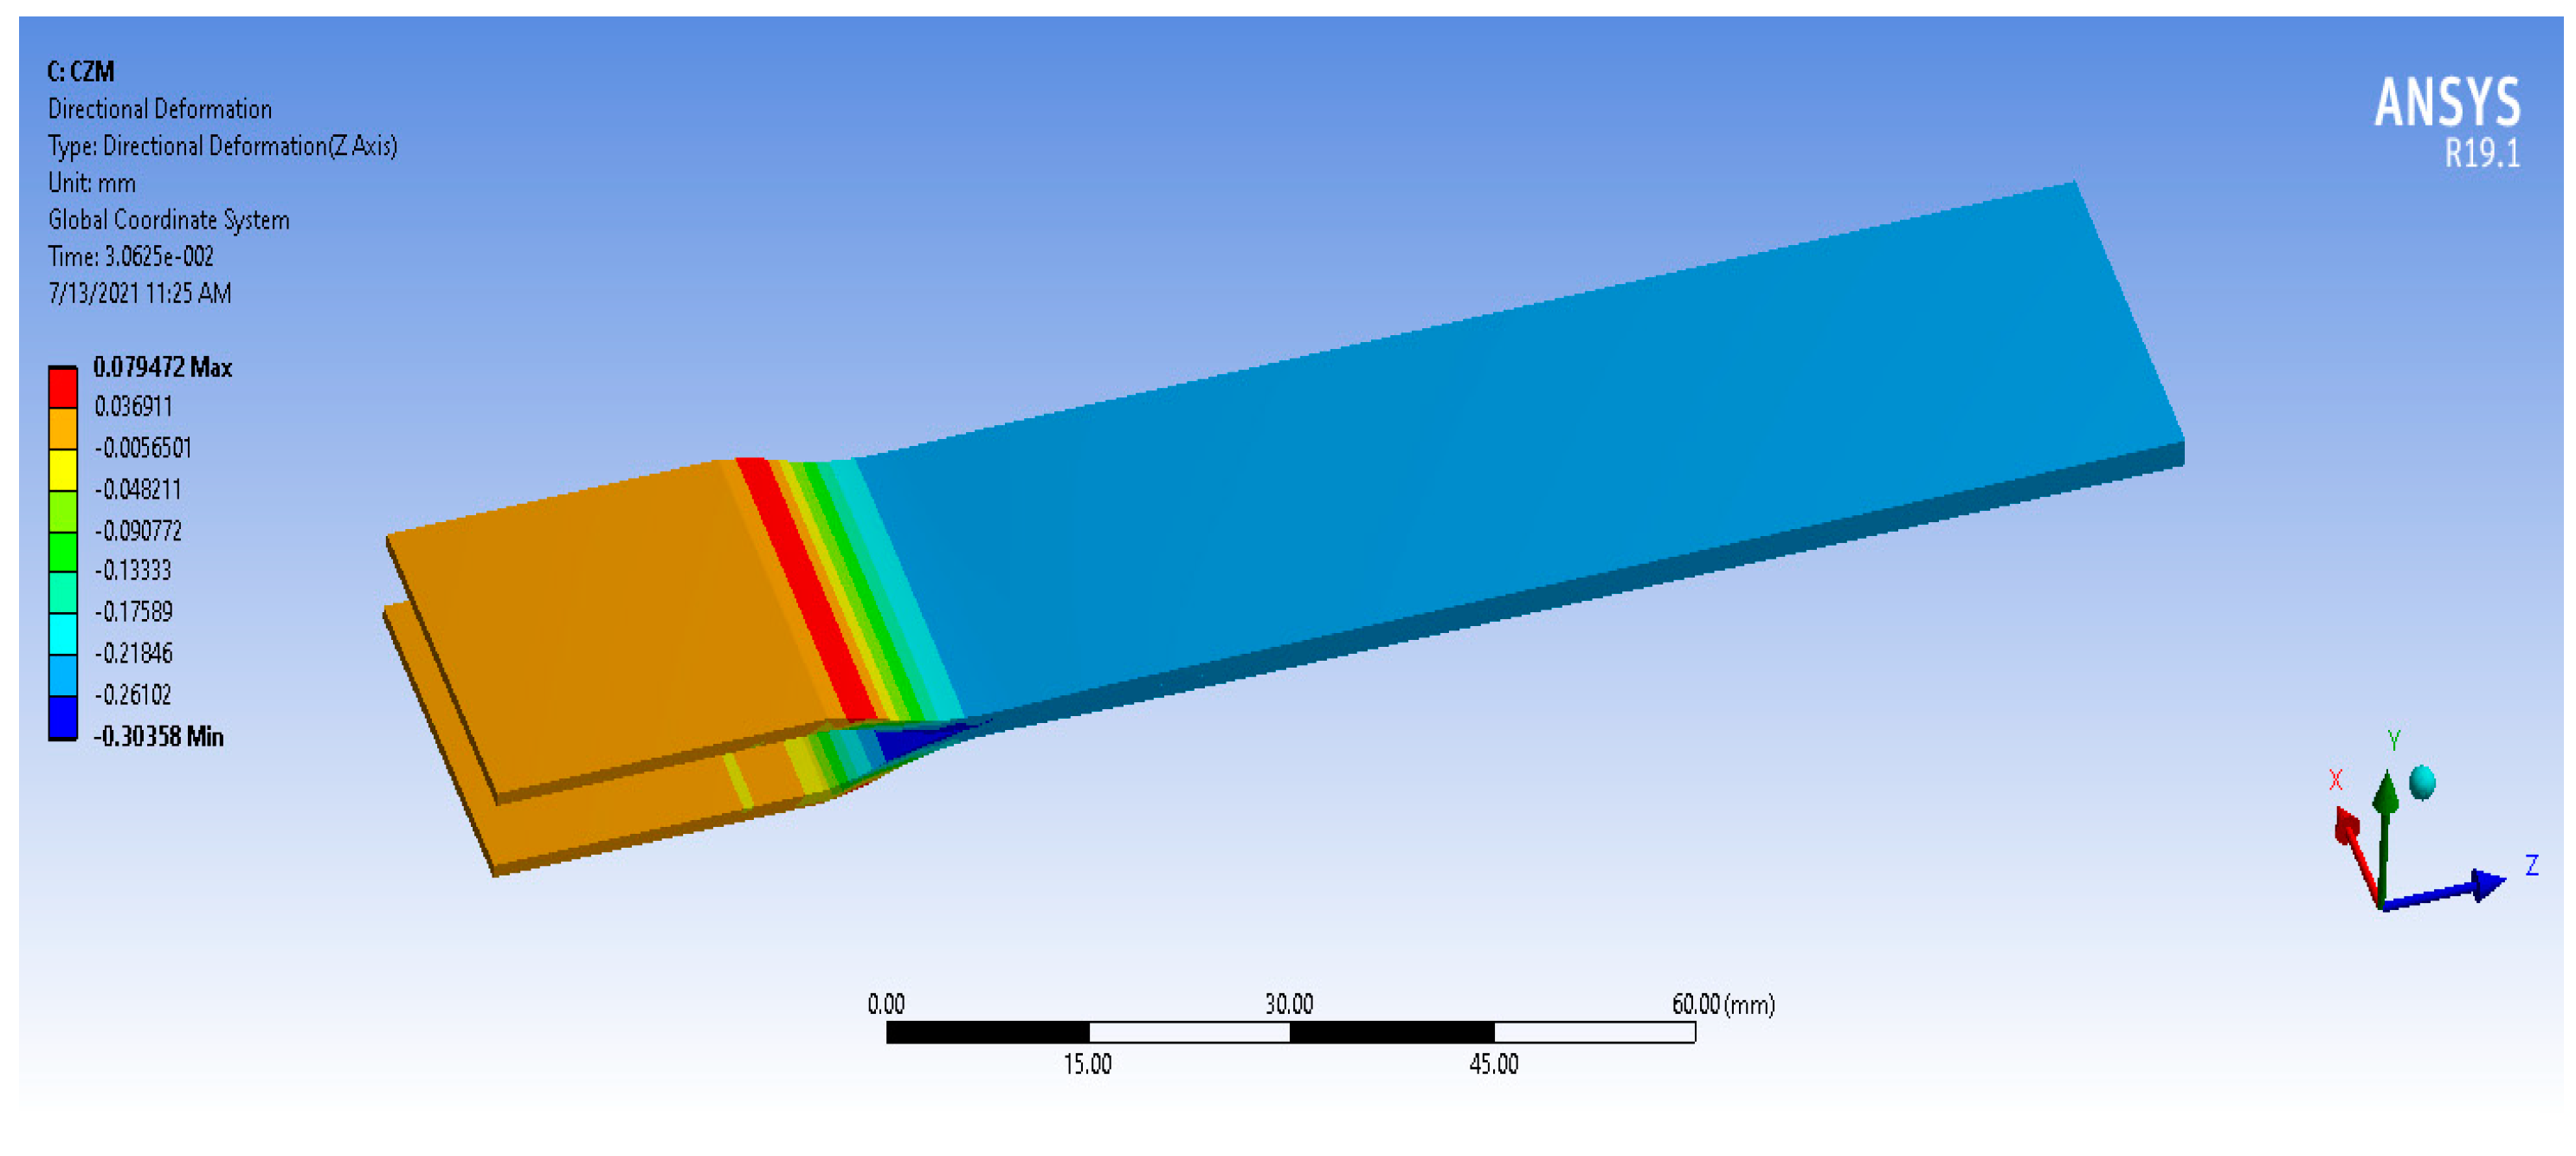
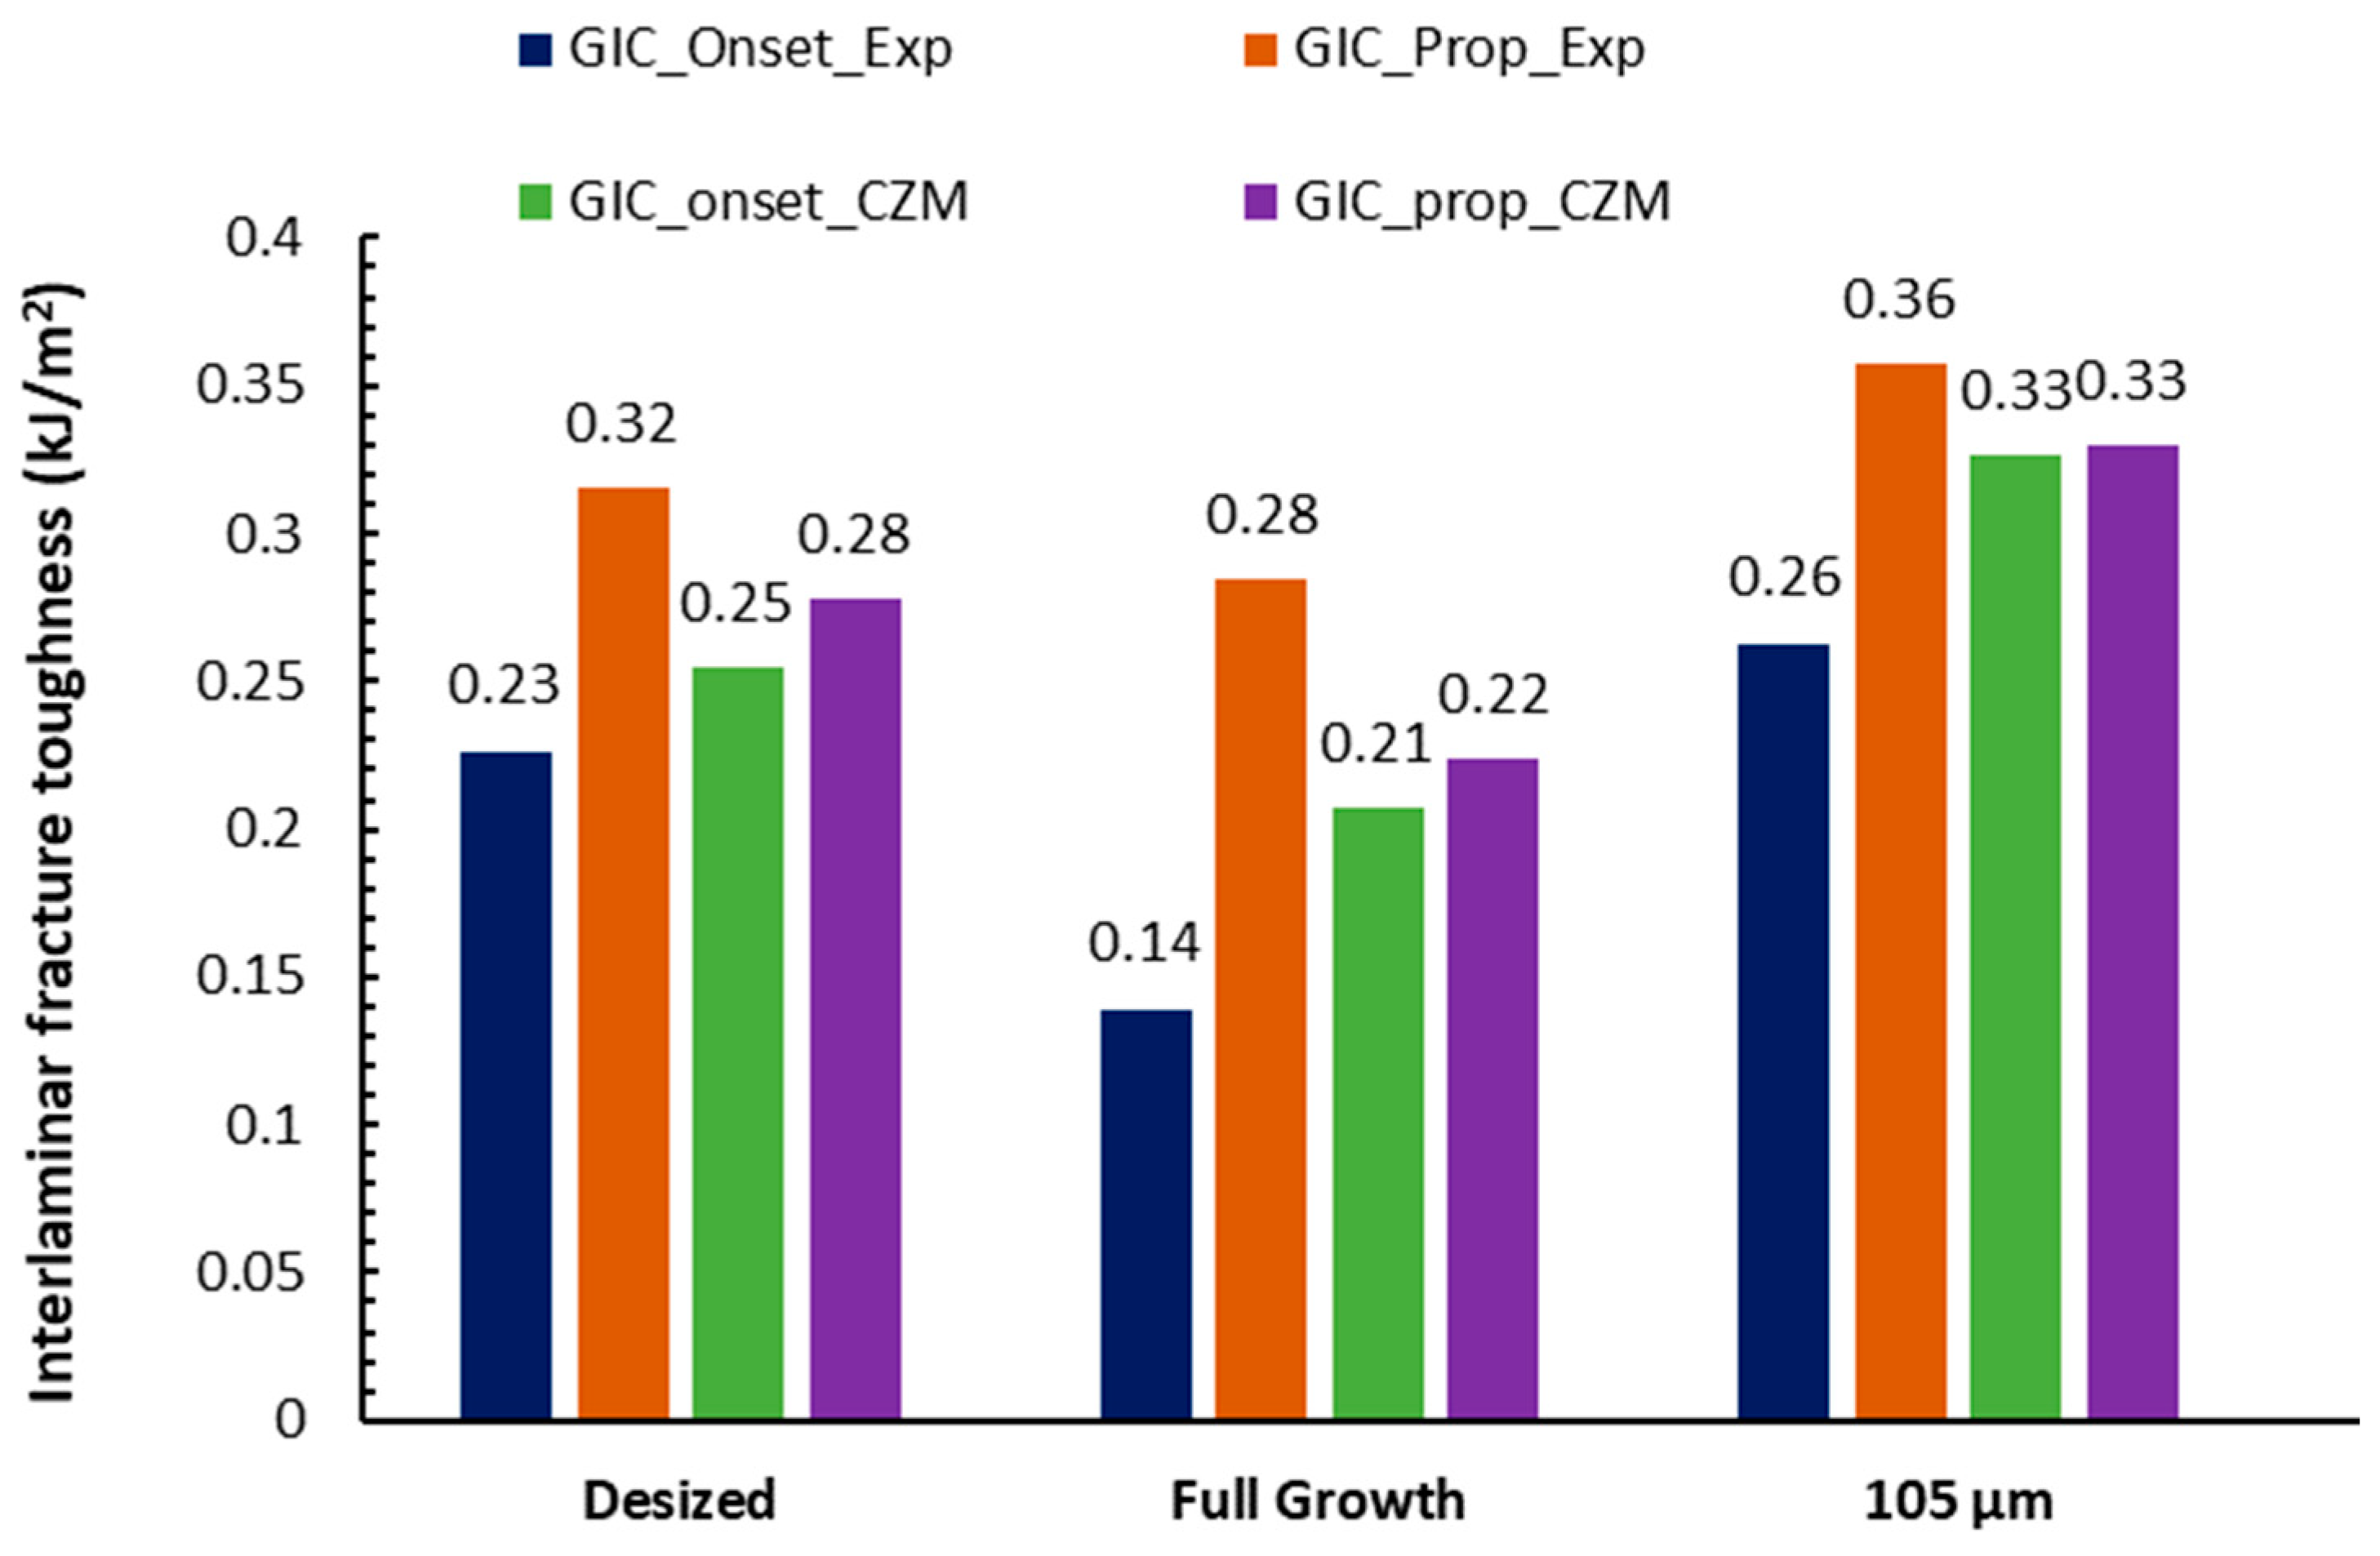
3.2. CZM Simulation Results

Following the simulation procedure outlined in Section 2.4, load vs. crack length and load vs. load point displacement from the simulation are plotted as shown in Figure 13 and Figure 14. From Figure 13; it is seen that the load decays smoothly with displacement, indicating that the model did not capture the unstable crack propagation observed in the experimental results; Figure 8. This is attributed to the traction of the cohesive zone. Since a single traction value was assigned to the entire adhesive zone, there was a gradual decay in stiffness in this zone as the crack propagated. This, in return, fails to capture the individual effects of the composite constituents, such as fiber/CNTs bridging, fiber pullouts, etc. These phenomena result in the unstable crack behavior seen in Figure 8. To capture this behavior, multiple contact elements with varying traction values could be more representative. However, due to limited computational resources, the model is simplified to one single traction value for each configuration in this current investigation [41,42].
Figure 13 also shows lower peak loads compared to the experimental values seen in Figure 8. This is attributed to the low traction value of 6.33 MPa, which is the reported manufacturer strength of the epoxy blend used in the current experiments. Per different literature, this value was also considered to be shear or tensile composite or adhesive strength based on mesh criteria or the particular experimental case [33,41,43]. For example, Gliszczynski et al. [33] swept the traction values from 1 to 100 MPa to study its impact on the peak load. It was concluded that the peak loads were significantly underestimated when traction strength was lower and vice versa.
Hence, the results of the model should be considered on a qualitative basis. Comparing various configurations seen in Figure 13, the 105 μm composite configuration is seen to perform the best, reiterating the experimental results. Identical to experimental observation, once the crack front approaches the cohesive zone, the stiffness drops, meaning the load drops with increasing crack length, Figure 14. Since the relationship between delamination crack length and load point displacement is assumed to be linear in the model, this plot follows the same trend seen in Figure 13.
Figure 15 depicts representative crack resistance curves (R-curves) for all the composite configurations modeled by the CZM simulations. Since the ANSYS software Ver 19.1 did not output this parameter explicitly, Equations (1) and (2), used for the experimental analysis, were adopted to calculate GIC values for the model. Like experiments, these R-curves initially show lower values, representing GIc for crack initiation. They gradually rise to form a plateau, representing GIc for crack growth [9]. The plots seen in Figure 15 are much smoother than their experimental counterparts since the model did not capture the energy dissipation mechanisms. The stiffness drop of the cohesive zone is the only contributing factor, resulting in this smooth (stable) crack growth behavior. As seen in previous CZM-based results, Figure 15 infers better crack initiation and propagation in the 105 μm composite configuration and degraded performance in the Full Growth, in comparison to the reference Desized sample.
The interlaminar fracture toughness of the different composites from experimental results and the CZM-based analysis are shown in Figure 16. The crack onset GIC is the toughness value seen during crack initiation, while the crack propagating GIC value is the average of all the toughness values during crack propagation. The experimental data exhibited a significant difference in fracture toughness during the transition from crack onset to crack propagation. This difference highlights the need for a multiscale model involving fiber/matrix/CNTs as individual components while defining the molecular interactions between each of them for more representative results.

4. Conclusions

Incorporating nanofillers at the interface between carbon fibers and polymer matrix enhances their static mechanical properties and has the potential to influence delamination behavior. The introduction of this additional interface may decrease the likelihood of delamination in hybrid carbon fiber reinforced polymers (CFRPs) due to improved impregnation of epoxy into fibers. To comprehensively analyze this phenomenon, experimental and modeling techniques were employed, involving three different configurations of carbon fiber composites with different the fiber/matrix interfaces, which were fabricated and tested for crack propagation.
The summarized results are as follows:
  • Patterns of 105 μm CNTs contributed to delayed crack initiation and propagation, while full growth of CNTs exhibited inferior crack initiation and propagation properties compared to reference samples without CNT growth.
  • A moderate 13% increase in fracture toughness values was observed for the 105 μm configuration at the onset of crack propagation compared to composites based on desized fibers, highlighting the influence of CNT growth topology on enhancing interlaminar fracture toughness.
  • Cohesive zone modeling (CZM) simulation results qualitatively supported the conclusion that the coarser CNT pattern surpassed other composite configurations in resisting interlaminar crack propagation.
The results of this study emphasize that the uniform growth of CNTs on carbon fibers prior to the composite fabrication might not yield the best performance possible. Instead, to harvest the full potential of hybrid composites based on multiscale reinforcements, the growth of nanofillers should conform to an optimal topology so that they can mitigate delamination and avoid catastrophic composite structural failures.
Limitations and future work: This study assumed the hybrid composite as a homogenized orthotropic material. More accurate analysis can treat the CNTs layer as a third phase, but this will require a multiscale analysis. Because different loading modes of interlaminar fracture exhibit different fracture mechanisms, the interlaminar fracture toughness experiments, modes II, III, and mixed-mode II/III, can also be examined for the designed hybrid CFRPs. The role of nano-reinforcements in resisting these fracture modes can be investigated. The CZM model can be better tuned using other than the exponential material model for examining the CFRPs’ behavior in the interlaminar fracture resistance. After then, the FEM can be used to develop accurate models of the hybrid CFRPs. Also, the use of alternative techniques, such as the virtual crack closing technique (VCCT), will be tried.

Author Contributions

Conceptualization, M.A.-H. methodology, M.A.-H. and S.A., software, S.A.; validation, M.A.-H. and S.A.; formal analysis, S.A. and M.A.-H.; data curation, S.A.; writing—original draft preparation, S.A.; writing—review and editing, M.A.-H.; supervision, M.A.-H.; project administration, M.A.-H.; funding acquisition, M.A.-H. All authors have read and agreed to the published version of the manuscript.

Funding

This research was funded by the National Science Foundation (NSF, USA) grants numbers CMMI-20001038 and CMMI-2018375.

Data Availability Statement

The raw data supporting the conclusions of this article will be made available by the authors on request.

Conflicts of Interest

The authors declare no conflicts of interest.

References

  1. Balasubramanian, K.; Sultan, M.T.H.; Rajeswari, N. 4—Manufacturing techniques of composites for aerospace applications. In Sustainable Composites for Aerospace Application; Jawaid, M., Thariq, M., Eds.; Woodhead Publishing: Cambridge, UK, 2018; pp. 55–67. [Google Scholar] [CrossRef]
  2. Ishikawa, T.; Amaoka, K.; Masubuchi, Y.; Yamamoto, T.; Yamanaka, A.; Arai, M.; Takahashi, J. Overview of automotive structural composites technology developments in Japan. Compos. Sci. Technol. 2018, 155, 221–246. [Google Scholar] [CrossRef]
  3. Babu, J.; Sunny, T.; Paul, N.A.; Mohan, K.P.; Philip, J.; Davim, J.P. Assessment of delamination in composite materials: A review. Proc. Inst. Mech. Eng. Part B J. Eng. Manuf. 2016, 230, 1990–2003. [Google Scholar] [CrossRef]
  4. Hintze, W.; Hartmann, D.; Schütte, C. Occurrence and propagation of delamination during the machining of carbon fibre reinforced plastics (CFRPs)—An experimental study. Compos. Sci. Technol. 2011, 71, 1719–1726. [Google Scholar] [CrossRef]
  5. Geng, D.; Liu, Y.; Shao, Z.; Lu, Z.; Cai, J.; Li, X.; Jiang, X.; Zhang, D. Delamination formation, evaluation and suppression during drilling of composite laminates: A review. Compos. Struct. 2019, 216, 168–186. [Google Scholar] [CrossRef]
  6. Casavola, C.; Palano, F.; De Cillis, F.; Tati, A.; Terzi, R.; Luprano, V. Analysis of CFRP Joints by Means of T-Pull Mechanical Test and Ultrasonic Defects Detection. Materials 2018, 11, 620. [Google Scholar] [CrossRef] [PubMed]
  7. Saadati, Y.; Chatelain, J.-F.; Lebrun, G.; Beauchamp, Y.; Bocher, P.; Vanderesse, N. A Study of the Interlaminar Fracture Toughness of Unidirectional Flax/Epoxy Composites. J. Compos. Sci. 2020, 4, 66. [Google Scholar] [CrossRef]
  8. Nasuha, N.; Azmi, A.I.; Tan, C.L. A review on mode-I interlaminar fracture toughness of fibre reinforced composites. J. Phys. Conf. Ser. 2017, 908, 012024. [Google Scholar] [CrossRef]
  9. Boroujeni, A.Y.; Al-Haik, M.S. Interlaminar fracture toughness of hybrid carbon fiber-carbon nanotubes-reinforced polymer composites. Polym. Compos. 2019, 40, E1470–E1478. [Google Scholar] [CrossRef]
  10. Samborski, S.; Gliszczynski, A.; Rzeczkowski, J.; Wiacek, N. Mode I interlaminar fracture of glass/epoxy unidirectional laminates. Part I: Experimental studies. Materials 2019, 12, 1607. [Google Scholar] [CrossRef]
  11. Pappas, G.; Botsis, J. Intralaminar fracture of unidirectional carbon/epoxy composite: Experimental results and numerical analysis. Int. J. Solids Struct. 2016, 85–86, 114–124. [Google Scholar] [CrossRef]
  12. Liu, R.; Yu, Z.; Nasonov, F. Evaluations on VCCT and CZM methods of delamination propagation simulation for composite specimens. Aerosp. Syst. 2023, 6, 621–632. [Google Scholar] [CrossRef]
  13. Cao, D.; Duan, Q.; Hu, H.; Zhong, Y.; Li, S. Computational investigation of both intra-laminar matrix cracking and inter-laminar delamination of curved composite components with cohesive elements. Compos. Struct. 2018, 192, 300–309. [Google Scholar] [CrossRef]
  14. Krueger, R. 1—The virtual crack closure technique for modeling interlaminar failure and delamination in advanced composite materials. In Numerical Modelling of Failure in Advanced Composite Materials; Camanho, P.P., Hallett, S.R., Eds.; Woodhead Publishing: Cambridge, UK, 2015; pp. 3–53. [Google Scholar] [CrossRef]
  15. Xie, D.; Biggers Jr, S.B. Strain energy release rate calculation for a moving delamination front of arbitrary shape based on the virtual crack closure technique. Part I: Formulation and validation. Eng. Fract. Mech. 2006, 73, 771–785. [Google Scholar] [CrossRef]
  16. Turon, A.; Camanho, P.; Costa, J.; Renart, J. Accurate simulation of delamination growth under mixed-mode loading using cohesive elements: Definition of interlaminar strengths and elastic stiffness. Compos. Struct. 2010, 92, 1857–1864. [Google Scholar] [CrossRef]
  17. Sinnott, S.B.; Andrews, R. Carbon Nanotubes: Synthesis, Properties, and Applications. Crit. Rev. Solid State Mater. Sci. 2001, 26, 145–249. [Google Scholar] [CrossRef]
  18. Boroujeni, A.Y.; Al-Haik, M. Carbon nanotube—Carbon fiber reinforced polymer composites with extended fatigue life. Compos. Part B Eng. 2019, 164, 537–545. [Google Scholar] [CrossRef]
  19. Boroujeni, A.Y.; Tehrani, M.; Nelson, A.J.; Al-Haik, M. Hybrid carbon nanotube–carbon fiber composites with improved in-plane mechanical properties. Compos. Part B Eng. 2014, 66, 475–483. [Google Scholar] [CrossRef]
  20. Borowski, E.; Soliman, E.; Kandil, U.F.; Taha, M.R. Interlaminar Fracture Toughness of CFRP Laminates Incorporating Multi-Walled Carbon Nanotubes. Polymers 2015, 7, 1020–1045. [Google Scholar] [CrossRef]
  21. Jiang, J.; Xu, C.; Su, Y.; Guo, Q.; Liu, F.; Deng, C.; Yao, X.; Zhou, L. Influence of Carbon Nanotube Coatings on Carbon Fiber by Ultrasonically Assisted Electrophoretic Deposition on Its Composite Interfacial Property. Polymers 2016, 8, 302. [Google Scholar] [CrossRef]
  22. Kumar, M.; Ando, Y. Chemical Vapor Deposition of Carbon Nanotubes: A Review on Growth Mechanism and Mass Production. J. Nanosci. Nanotechnol. 2010, 10, 3739–3758. [Google Scholar] [CrossRef]
  23. Al-Haik, M.; Luhrs, C.C.; Reda Taha, M.M.; Roy, A.K.; Dai, L.; Phillips, J.; Doorn, S. Hybrid Carbon Fibers/Carbon Nanotubes Structures for Next Generation Polymeric Composites. J. Nanotechnol. 2010, 2010, 860178. [Google Scholar] [CrossRef]
  24. De Greef, N.; Zhang, L.; Magrez, A.; Forró, L.; Locquet, J.-P.; Verpoest, I.; Seo, J.W. Direct growth of carbon nanotubes on carbon fibers: Effect of the CVD parameters on the degradation of mechanical properties of carbon fibers. Diam. Relat. Mater. 2015, 51, 39–48. [Google Scholar] [CrossRef]
  25. Boroujeni, A.Y.; Tehrani, M.; Nelson, A.J.; Al-Haik, M. Effect of carbon nanotubes growth topology on the mechanical behavior of hybrid carbon nanotube/carbon fiber polymer composites. Polym. Compos. 2016, 37, 2639–2648. [Google Scholar] [CrossRef]
  26. Luhrs, C.C.; Garcia, D.; Tehrani, M.; Al-Haik, M.; Taha, M.R.; Phillips, J. Generation of carbon nanofilaments on carbon fibers at 550 °C. Carbon 2009, 47, 3071–3078. [Google Scholar] [CrossRef]
  27. Ayyagari, S.; Al-Haik, M.; Ren, Y.; Nepal, D. Effect of Nano-Reinforcement Topologies on the Viscoelastic Performance of Carbon Nanotube/Carbon Fiber Hybrid Composites. Nanomaterials 2020, 10, 1213. [Google Scholar] [CrossRef]
  28. ASTM D5528-13; Standard Test Method for Mode I Interlaminar Fracture Toughness of Unidirectional Fiber-Reinforced Polymer Matrix Composites. ASTM International: West Conshohocken, PA, USA, 2013.
  29. Broek, D. Elementary Engineering Fracture Mechanics; Springer Science & Business Media: New York, NY, USA, 2012. [Google Scholar]
  30. Co, A. Solver Theory Guide. Release 2021 R2; ANSYS Inc.: Canonsburg, PA, USA, 2021. [Google Scholar]
  31. HS, M.W.; Kumar, K. Finite Element Modeling for Delamination Analysis of Double Cantilever Beam Specimen. SSRG Int. J. Mech. Eng. 2014, 1, 1–11. [Google Scholar]
  32. Heidari-Rarani, M.; Sayedain, M. Finite element modeling strategies for 2D and 3D delamination propagation in composite DCB specimens using VCCT, CZM and XFEM approaches. Theor. Appl. Fract. Mech. 2019, 103, 102246. [Google Scholar] [CrossRef]
  33. Gliszczynski, A.; Samborski, S.; Wiacek, N.; Rzeczkowski, J. Mode I interlaminar fracture of glass/epoxy unidirectional laminates. Part II: Numerical analysis. Materials 2019, 12, 1604. [Google Scholar] [CrossRef]
  34. Zhu, G.; Qu, P.; Nie, J.; Guo, Y.; Jia, Y. Numerical Simulation of the Mode I Fracture of Angle-ply Composites Using the Exponential Cohesive Zone Model. Polym. Polym. Compos. 2014, 22, 25–30. [Google Scholar] [CrossRef]
  35. Bahei-El-Din, Y.A. Finite element analysis of viscoplastic composite materials and structures. Mech. Compos. Mater. Struct. 1996, 3, 1–28. [Google Scholar] [CrossRef]
  36. De Baere, I.; Jacques, S.; Van Paepegem, W.; Degrieck, J. Study of the Mode I and Mode II interlaminar behaviour of a carbon fabric reinforced thermoplastic. Polym. Test. 2012, 31, 322–332. [Google Scholar] [CrossRef]
  37. Mobasher, B.; Li, C.Y. Effect of interfacial properties on the crack propagation in cementitious composites. Adv. Cem. Based Mater. 1996, 4, 93–105. [Google Scholar] [CrossRef]
  38. Sakai, M.; Miyajima, T.; Inagaki, M. Fracture toughness and fiber bridging of carbon fiber reinforced carbon composites. Compos. Sci. Technol. 1991, 40, 231–250. [Google Scholar] [CrossRef]
  39. Spearing, S.; Evans, A.G. The role of fiber bridging in the delamination resistance of fiber-reinforced composites. Acta Metall. Mater. 1992, 40, 2191–2199. [Google Scholar] [CrossRef]
  40. Ou, Y.; González, C.; Vilatela, J.J. Interlaminar toughening in structural carbon fiber/epoxy composites interleaved with carbon nanotube veils. Compos. Part A Appl. Sci. Manuf. 2019, 124, 105477. [Google Scholar] [CrossRef]
  41. Krieger, W.E. Cohesive Zone Modeling for Predicting Interfacial Delamination in Microelectronic Packaging. Master’s Thesis, Woodruff School of Mechanical Engineering, Atlanta, GA, USA, 2014. [Google Scholar]
  42. Li, S.; Thouless, M.; Waas, A.; Schroeder, J.; Zavattieri, P. Use of mode-I cohesive-zone models to describe the fracture of an adhesively-bonded polymer-matrix composite. Compos. Sci. Technol. 2005, 65, 281–293. [Google Scholar] [CrossRef]
  43. Barbero Ever, J. Finite Element Analysis of Composite Materials Using ANSYS®; CRC Press: Boca Raton, FL, USA, 2013. [Google Scholar]
Figure 1. Schematic illustration of crack (red curve) propagation in a laminate of (a) carbon fiber with uniformly grown CNTs and (b) carbon fiber with pattern-grown CNTs.
Jcs 08 00122 g001
Figure 2. SEM micrographs of CNTs grown on silicon wafers (a) CNTs grown utilizing a 105 μm perforated mesh pattern (inset figure scale bar 400 μm), and (b) Uniform CNTs growth pattern.
Jcs 08 00122 g002
Figure 3. SEM micrographs (at different magnifications) of CNTs grown on the carbon fiber surface using the GSD process.
Jcs 08 00122 g003
Figure 4. Composite lamination and testing coupon illustration.
Jcs 08 00122 g004
Figure 5. The DCB test setup shows a crack opening of a composite test coupon acquired by the DIC system.
Jcs 08 00122 g005
Figure 6. (a) 3D model of a DCB test specimen with boundary conditions and input loading, coarsely meshed in the pre-cracked region and finely meshed in the crack propagation region. (b) The model after crack propagation.
Jcs 08 00122 g006
Figure 7. The model was built in ANSYS for delamination after the CZM analysis.
Jcs 08 00122 g007
Figure 8. Representative load vs. load point displacement curves for the different composite configurations.
Jcs 08 00122 g008
Figure 9. Delamination crack length vs. load for the different composite configurations. Dotted lines represent data regression.
Jcs 08 00122 g009
Figure 10. Delamination crack length vs. load point displacement for the different composite configurations.
Jcs 08 00122 g010
Figure 11. Interlaminar fracture toughness comparison for all composite configurations. Dotted lines represent data regression.
Jcs 08 00122 g011
Figure 12. SEM micrographs of the DCB sample damaged surfaces for composites based on (a) desized carbon fibers, (b) carbon fibers with uniform growth of CNTs, and (c) carbon fibers with 105 μm pattern grown CNTs.
Jcs 08 00122 g012
Figure 13. FEM model prediction of the load vs. load point displacement using CZM for the different composite configurations.
Jcs 08 00122 g013
Figure 14. Prediction of the delamination crack length vs. load using the CZM model for the different composite configurations.
Jcs 08 00122 g014
Figure 15. Interlaminar fracture toughness comparison for the different composite configurations using the CZM model.
Jcs 08 00122 g015
Figure 16. Interlaminar fracture toughness of the different composite configurations using DCB experiments and the CZM model.
Jcs 08 00122 g016
Table 1. Average tensile test results for the different composite configurations.
Sample TypeStrength (MPa)Modulus (GPa)
E1 = E2
* Out of Plane
Modulus
E3 (GPa)
* Poisson’s
Ratio
ν12
* In-Plane Shear Modulus
G12 (GPa)
Desized526.6729.746.00 0.185.00
Full Growth485.6938.596.000.185.00
105 μm503.5045.806.000.185.00
* Assumed.
Disclaimer/Publisher’s Note: The statements, opinions and data contained in all publications are solely those of the individual author(s) and contributor(s) and not of MDPI and/or the editor(s). MDPI and/or the editor(s) disclaim responsibility for any injury to people or property resulting from any ideas, methods, instructions or products referred to in the content.

