Article

Optimization of a Tapered Specimen Geometry for Short-Term Dynamic Tensile Testing of Continuous Fiber Reinforced Thermoplastics

Leibniz-Institut für Verbundwerkstoffe GmbH, 67663 Kaiserslautern, Germany
*
Author to whom correspondence should be addressed.
J. Compos. Sci. 2024, 8(3), 93; https://doi.org/10.3390/jcs8030093
Submission received: 26 January 2024 / Revised: 9 February 2024 / Accepted: 1 March 2024 / Published: 3 March 2024
(This article belongs to the Special Issue Characterization and Modelling of Composites, Volume III)

Abstract

:
Continuous fiber reinforced thermoplastics (cFRTP) are one of the most promising lightweight materials. For their use in structural components, reproducible and comparable material values have to be evaluated, especially at high strain rates. Due to their high stiffness and outstanding strength properties, the evaluation of the material behavior at high strain rates is complex. In the presented work, a new tensile specimen geometry for strain rate testing is virtually optimized using a metamodel approach with an artificial neural network. The final specimen design is experimentally validated and compared with rectangular specimen results for a carbon fiber reinforced polycarbonate (CF-PC). The optimized specimen geometry leads to 100% valid test results in experimental validation of cross-ply laminates and reaches 9% higher tensile strength values than the rectangle geometry with applied end tabs at a strain rate of 40 s−1. Through the optimization, comparable material parameters can be efficiently generated for a successful cFRTP strain rate characterization.

1. Introduction

Lightweight construction is a key technology in the development of efficient and environmentally sustainable products. Continuous fiber reinforced thermoplastics (cFRTP) play a key role here, due to their excellent density-specific stiffness and strength properties, as well as their high specific energy absorption capacity. Further interesting advantages such as short cycle times, recyclability, and welding capability make them suitable for the large-scale production of safety-relevant structural components [1,2,3,4]. The virtual prediction of their mechanical behavior in the finite element analysis (FEA) is an efficient way of developing structural parts. Therefore, comparable and reproducible material properties, especially for tensile load cases at high strain rates, are necessary. However, the increased material complexity of these materials compared to isotropic materials and the lack of uniform testing standards, particularly for material characterization at high strain rates, are barriers to industrial application. Without standards, no uniform tensile specimen geometry definition exists either, which defines the motivation of the following work.
The process of material characterization at quasi-static test speeds is well understood in industrial applications. On the contrary, testing at higher rates of material deformation is more challenging because of the material’s strain rate effects and a sudden load introduction into the test specimen, often leading to invalid testing failures [5,6].
Based on the unitless displacement (strain), the strain rate defines the deformation speed of a test specimen. This value is chosen as a comparative parameter for short-term dynamic testing due to different tensile specimen lengths and deviating test velocities between test machine and specimen. The strain rate ε ˙ is defined as a time derivative of the specimen’s tensile strain ε according to Equation (1). To estimate the strain rate of rectangular specimens even before testing, the nominal strain rate ε ˙ n o m is defined as quotient of the target test speed v 0 and the free clamping length of the test specimen l 0 , according to Equation (2) [7,8].
ε ˙ = ε t
ε ˙ n o m = v 0 l 0
Quasi-static as well as high strain rate testing (up to 6000 s−1 in Split Hopkinson Bar testing) are deeply investigated research areas (e.g., [9,10,11,12]). A gap appears in short-term dynamic tensile tests on cFRTP materials in a medium strain rate spectrum (1 to 100 s−1) for which only isolated preliminary work exists [6,8,13]. This strain rate area is addressed in this work, forming the basis of a cFRTP test method necessary for material applications, e.g., in the automotive sector [14].
Testing methods are developed based on scientific findings (e.g., Junginger [15]) and are often transferred to procedural instructions and international standards. These guidelines, in combination with test specimen definitions for short-term dynamic tensile testing, already exist for metals [7,16,17,18] and unreinforced as well as short and long fiber reinforced plastics [19,20,21]. The specimen definition for strain rate testing of cFRTP is the subject of this research. The actual focus in the literature is on composites with thermoset matrices. Table 1 summarizes different specimens with a dogbone (Fitoussi et al. [22], Todo et al. [23]), tapered (Spronk et al. [8], Chen et al. [24], De Baere et al. [25], Gilat et al. [26]), and rectangular shape (Hufner/Hill [27]). In comparison, not only the specimens’ shapes but also the dimensions vary widely. The only commonality is the use of circle segments with radii r for implemented geometry discontinuities (e.g., tapered sections or dogbone shape).
For quasi-static tensile testing of cFRTP, the work of Schmeer et al. [28] shows the advantage of a tapered specimen mid-section using a spline geometry instead of circle segments, leading to low shear stresses in the tapered edge section and a valid specimen failure without the use of end tabs. Based on this work, the specimen (TTS) is already standardized in ISO 527-4 [5], but due to a free clamping length l 0 of 200 mm, it is not suitable for strain-rate testing with conventional high speed test machines. With a maximum test speed of 20 m s−1 (e.g., for servo-hydraulic test machines), a true strain rate of 100 s−1 cannot be reached using the TTS geometry (according to findings of nominal and true strain rate deviation by Spronk et al. [29]).
Specimen geometries are developed by experiments and/or analytical, numerical methods. An efficient tool for virtual shape optimization is the finite element method (FEM) in combination with a metamodel approach. A metamodel describes the complex relationship between input variables x k and output variables y ^ of a mathematical model by function approximation without knowing the function a priori. An artificial neural network can do this function approximation by the combination of neurons z i to a hidden layer, as shown in Figure 1. To learn and describe the relationship between input and output, a transfer function f of the neurons z i has to be defined. In different studies on industrial optimization tasks, radial basis functions have proven themselves advantageous in terms of accuracy and computation time. Such an artificial neural network is called radial basis function neural network (RBFN) [30,31,32,33,34].
The application of RBFN for geometry optimization of a tensile specimen is beneficial, because the optimization of different dependent design parameters for reaching the goal of a valid specimen’s tensile failure is complex. With design parameters as input values and the specimen stresses as output values, the RBFN is an efficient way of solving this design problem.
To evaluate specimen shapes with a geometry discontinuity in the form of a tapered section, form factors are used. The best-known is the global form factor K t g , defined as the quotient of the maximum stress in the notch base σ m a x and the nominal stress in the notch-free cross-section σ N , according to Equation (3) [35]. Because the failure location often does not correspond to the place of maximal stress for anisotropic materials like cFRTP, Kremer/Schürmann [35] defined a local, layer-based form factor K t l for composite materials according to Equation (4). It is defined as the ratio of the maximum stress exposure f E in the notched laminate layer i , in dependence of the notch’s orbital coordinate ϑ, and the maximum stress exposure in the same layer of the laminate without any notch f E , f r e e .
σ m a x σ N = K t g
max ϑ , i ( f E , i ( ϑ ) ) max i ( f E , f r e e , i ) = K t l
max ϑ , i ( f E , I F F i ( ϑ ) ) max i ( f E , F F , i ) = β
K t l does not indicate the resulting fracture type of cFRTPs (fiber failure or inter fiber failure). Therefore, Schmeer et al. [28] define a local fracture type number β, based on the ratio of the maximum inter-fiber failure (IFF) stress exposure f E , I F F and fiber failure (FF) stress exposure f E , F F in the notched laminate layer according to Equation (5). β < 1 indicates the specimen’s fiber failure and marks, along with a low K t l value, the key figures in a successful tensile specimen optimization for cFRTP.

2. Materials and Methods

The optimization approach according to Schmeer et al. [28] uses a detailed cFRTP material model for a precise specimen optimization. This research concentrates on a continuous unidirectional carbon fiber reinforced polycarbonate (CF-PC-UD) tape material with a fiber volume content of 44%. A CF reinforced thermoplastic is chosen as reference material for the cFRTP material class in this work, being more brittle compared to, e.g., glass fiber reinforced thermoplastics and therefore more sensible against notch effects. In addition, it represents the material class due to its high tensile strength and stiffness (σ11 = 1400 MPa, E11 = 105 Gpa), being most challenging in tensile testing. The CF-PC tape has a thickness of 0.17 mm and is stacked to unidirectional (UD [0]6) and cross-ply (KV [0/90]3s) layups manufactured to laminates in a hot-press process. The tensile specimens are extracted out of the laminates by abrasive water jet cutting due to findings of Mischo et al. [36].
To reach a tensile strain rate of 100 s−1 by avoiding large test speeds, the free clamping length of the ISO 527 [5] specimen needs to be reduced, making a new geometry and especially spline function optimization necessary. By a conservative maximal test speed estimation of 10 m s−1, adjustable for, e.g., servo-hydraulic test machines, the maximum free clamping length l 0 is 100 mm (according to Equation (2)). Figure 2 and Table 2 show the basic parameters of the geometry in a quarter-model representation. In the global coordinate system of the specimen, with its origin at the crossing of the specimen’s symmetry axes, the model length l is defined with 85 mm. This length contains two parallel alignment sections l c = 5 mm at each end of the model. It is l < l 0 to integrate a parallel specimen mid-section for Young’s modulus measurement (evaluation area) after the optimization. The width in the clamping area w c is set to 18 mm.
For the optimization of the tapered section, the mathematical description of a spline by a classical polynomial approach can be very complex due to the influence identification of polynomial coefficients on the geometry. Therefore, the Bézier representation is chosen, based on the work of Casteljau [37] and Bezier [38], for a parameterized description of freeform curves [39,40,41]. With this approach, a cubic Bézier curve (n ∈ [0;3]) is fully represented by the definition of four supporting points b n with coordinates b n , x / y (Figure 2). Table 2 indicates the coordinates of the four points in the model’s local coordinate system with its origin in supporting point b 0 (Figure 2). According to Figure 2, the coordinates of the control points b 0 and b 3 are fixed in the local coordinate system and only depend on the basic parameters. Moreover, a geometrically continuous spline connection to the mid-section of the specimen is defined as optimization’s boundary condition to impede any stress concentrations in the test material. This leads to a horizontal vector b 0 b 1 ¯ (Figure 2) and a fixed coordinate b 1 , y = 0, reducing the optimization parameters to four ( b 1 , x , b 2 , x , b 2 , y , w m ).
For the virtual optimization using FEM, the quarter-model representation of the specimen is transferred to an implicit FE-model. The load is applied by a displacement in global x-direction of the clamping area. It is set to reach fiber failure ( f E , F F > 1) in the model. The stress exposures are calculated using a subroutine based on PUCK’s failure model [42], according to VDI 2014 [43]. In the FE-model, f E , I F F and f E , F F as well as the shear stress τ 12 along the tapered specimen edge are evaluated. The goal of the optimization is to minimize τ 12 in the tapered region preventing an inter-fiber failure and initiating fiber failure in the mid-section for the measurement of valid tensile material properties.
The developed optimization procedure is shown in the flow chart in Figure 3. The blue fields identify the optimization procedure followed by a verification step of the final geometry (green fields in Figure 3). After defining the optimization parameters, the iteration starts with a parameter sampling of ten simulation points using a space-filling algorithm [44]. These simulations points, which represent geometry variations, are generated and calculated using FEM (marked in grey in Figure 3). With the parameters and calculation results, a metamodel is built using a RBFN. Here, the optimization parameters define the input values of the RBFN and the maximum shear stresses Max( τ 12 ) the output values.
The radial basis function f r , according to Equation (6), is used as a transfer function defined by the radial distance r between the values and the function’s center as well as a shape parameter c :
f r = r 2 + c 2
After fitting the transfer function, the optimization step identifies the global minimum of the output values (objective function). If the iteration fulfills the termination criteria (see Figure 3), a verification calculation is performed, otherwise the optimization continues with another iteration, beginning with the next parameter sampling.
To evaluate the accuracy of the final metamodel, the coefficient of determination (R2) as well as the root mean square (RMS) error is calculated. The RMS error is defined by Equation (7), calculating the square sum of the difference between the predicted metamodel response y ^ i and the true FE-model response y i via the data points P:
RMS   error = 1 P i = 1 P ( y i y ^ i ) 2
For the experimental validation of the virtual optimization results at high strain-rates, a servo-hydraulic high-speed tension machine (HTM) from ZwickRoell GmbH & Co. KG (Ulm, Germany) is used. It is designed for a maximum test force of 160 kN and a maximum test speed of 20 m s−1. The specimens are clamped using mechanical wedge grips and the force is measured by a piezo-electric load cell (KMD 9071C, Kistler Instrumente AG, Winterthur, Switzerland), calibrated to a force measurement range of ±50 kN.

3. Results

In this chapter, the results of the geometry optimization are presented, followed by the experimental validation results of the final tapered geometry.

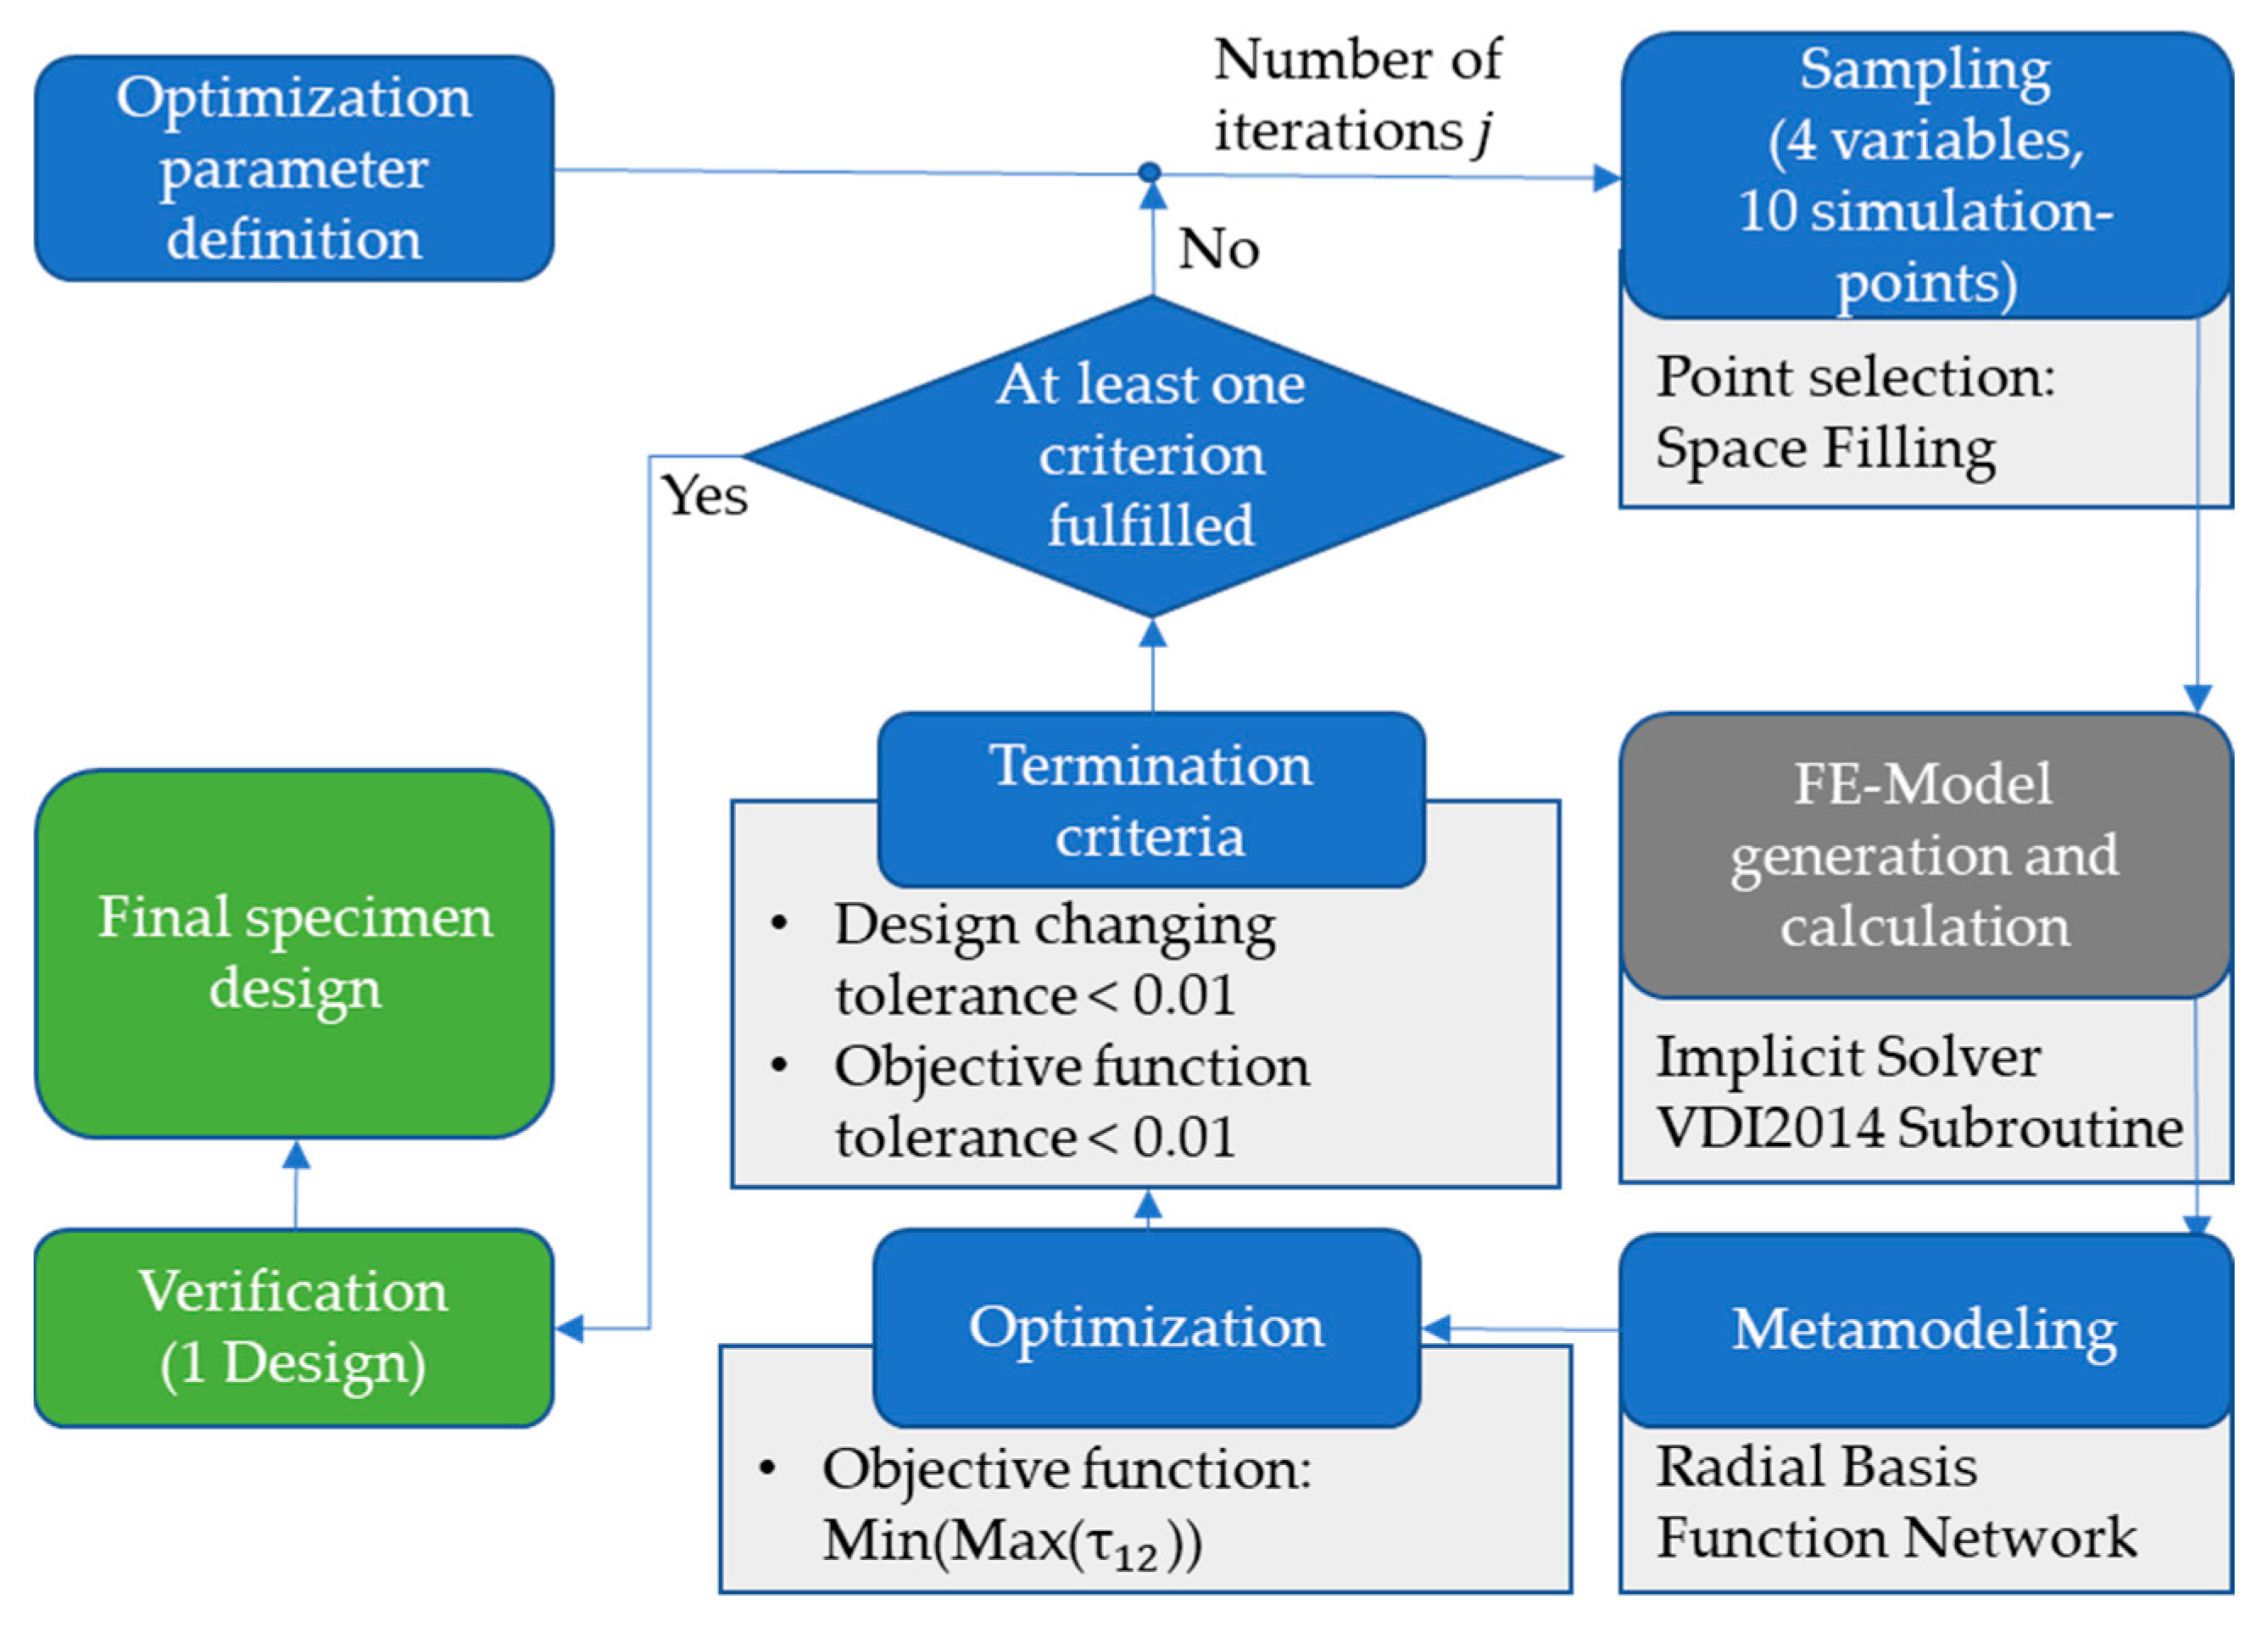
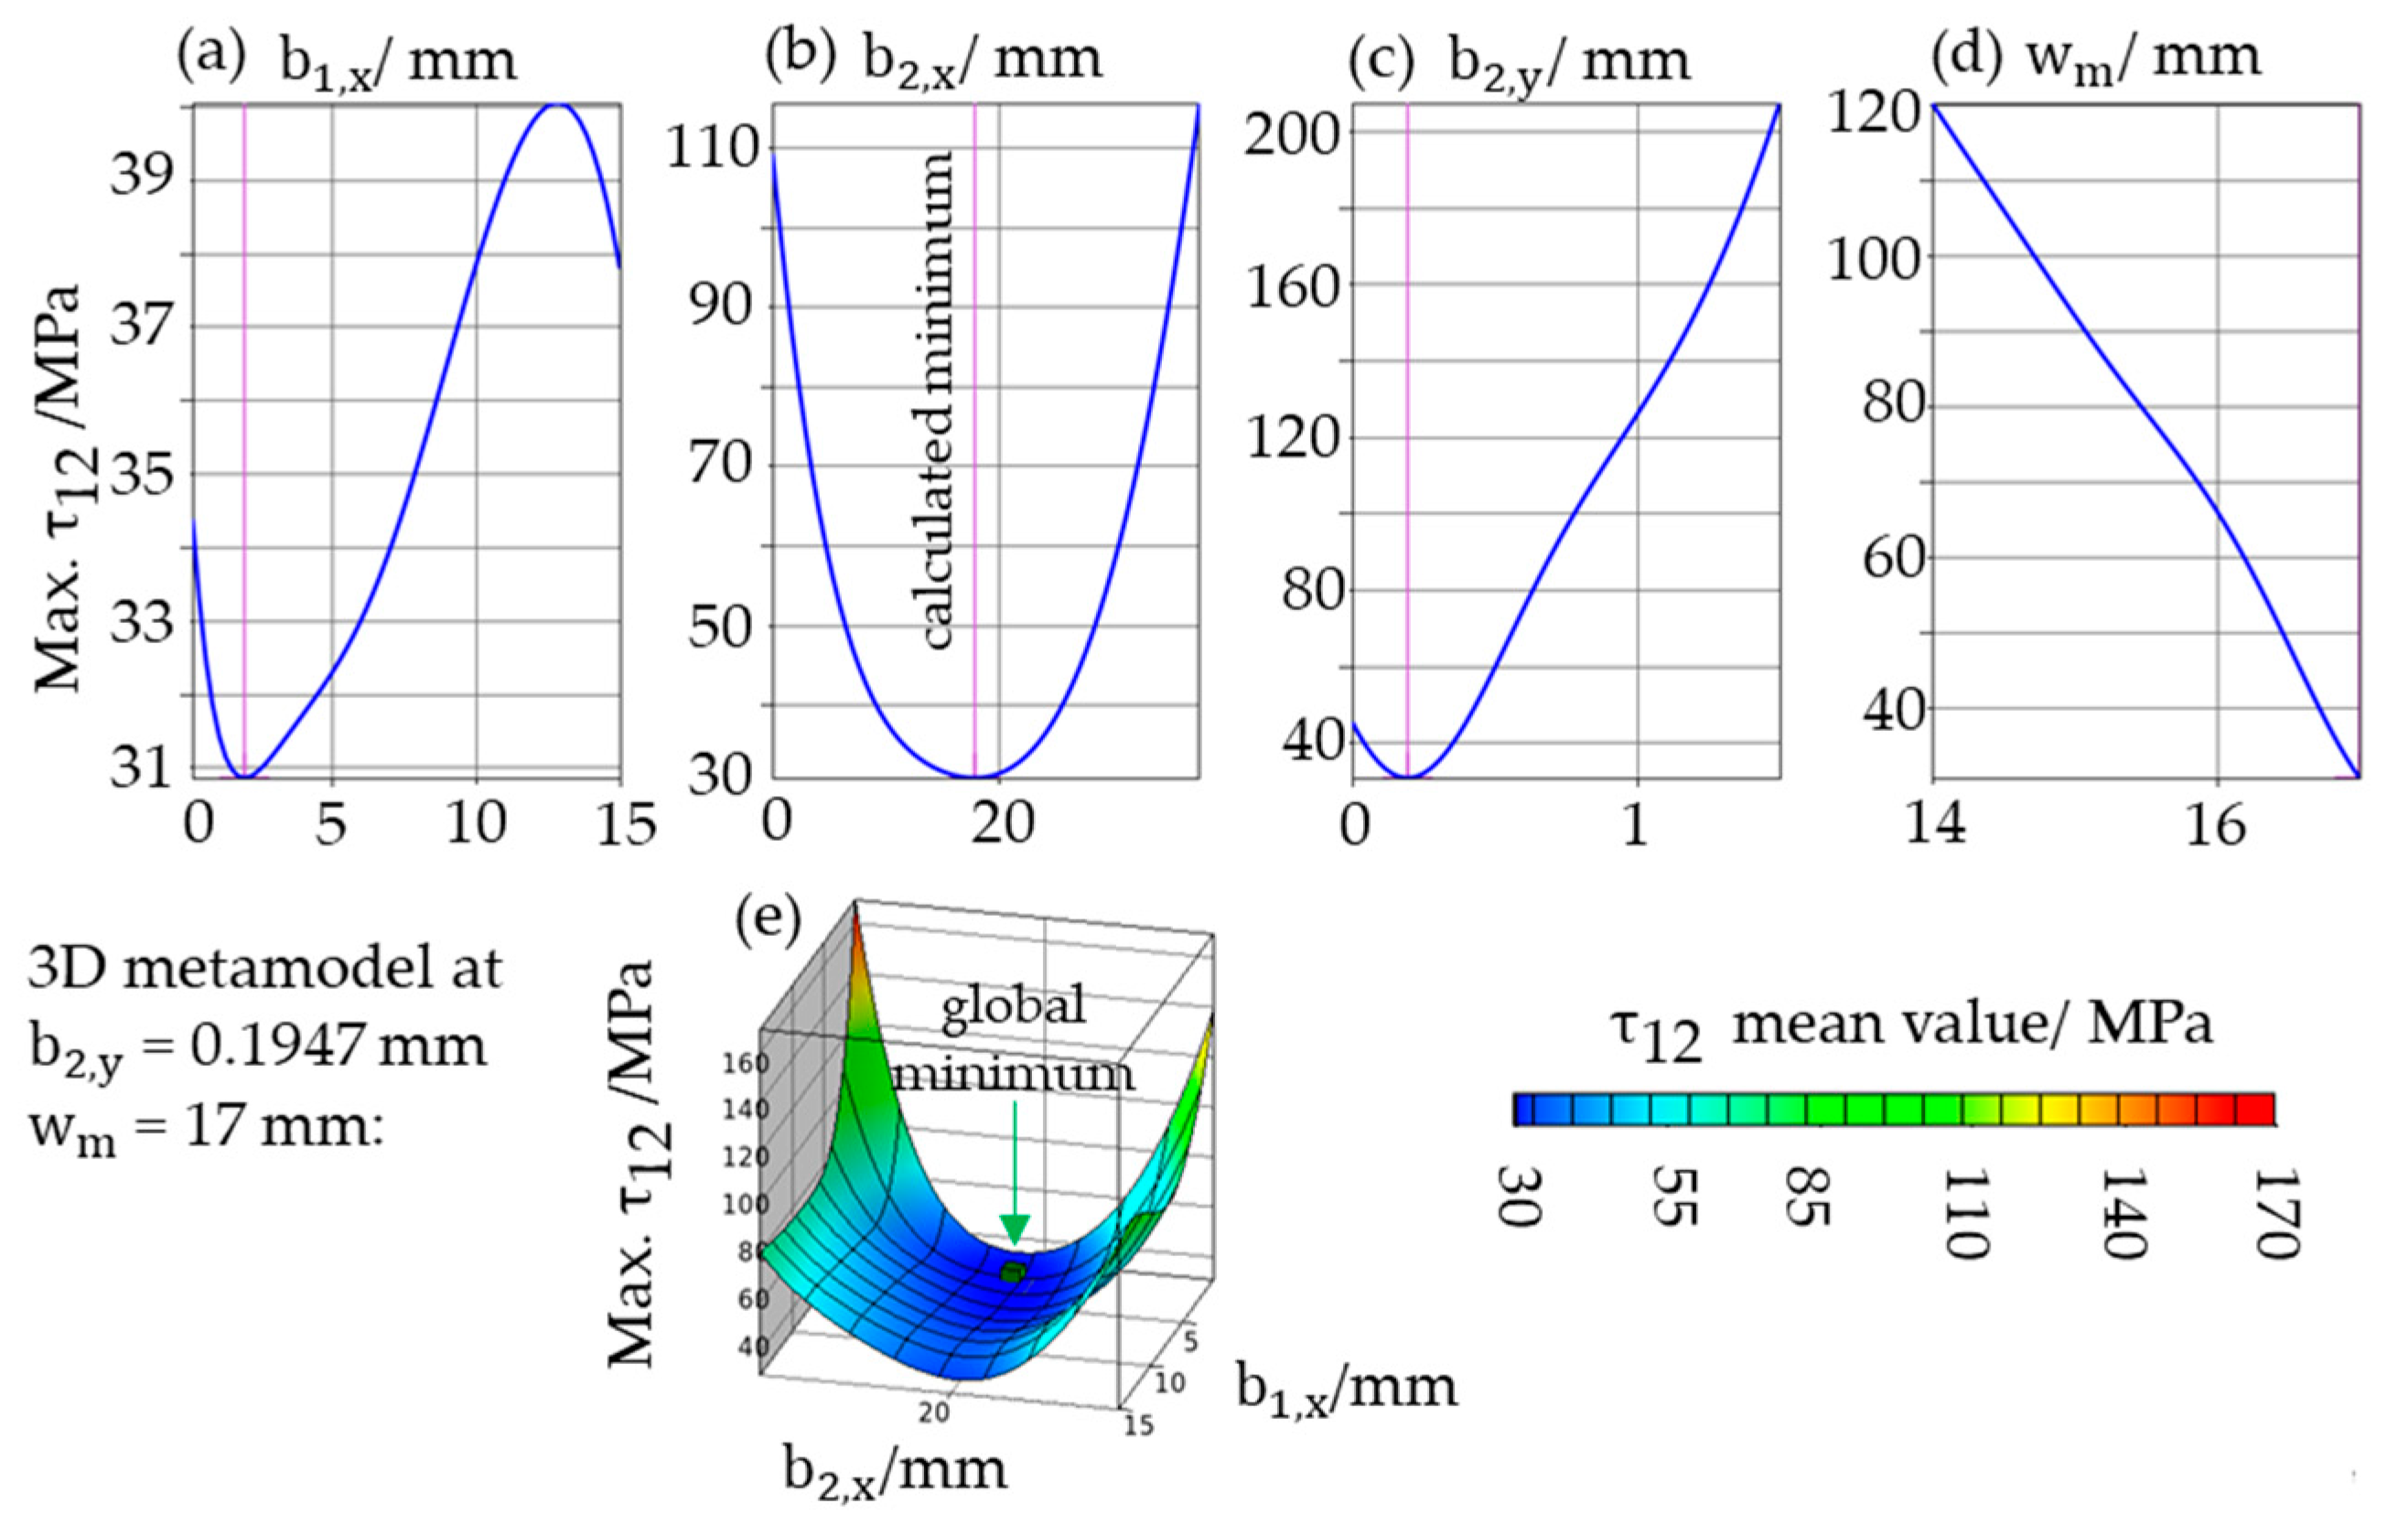
3.1. Optimization Results

With the optimization procedure described above, several different specimen geometries were generated. In the following, only the final, most promising design is presented. The optimization of this geometry validly terminated after 50 iteration steps. The optimization history (parameter results of previous iteration steps) is added as Supplementary Materials. The results of the metamodeling are shown in two-dimensional (2D) and three-dimensional (3D) plots of the output value (Max( τ 12 )) over the input values ( b 1 , x , b 2 , x , b 2 , y , w m ) in Figure 4.
Each plot in Figure 4a–d depicts the values on the 2D cutting plane through the global minimum of Max( τ 12 ) of the five-dimensional metamodel. Max( τ 12 ) shows a non-linear dependency on all Bézier point coordinates with a calculated minimum at b 1 , x = 1.910, b 2 , x = 17.813 and b 2 , y = 0.195. Only for w m , an almost linear τ 12 -dependency over the considered parameter area (Table 2) is present. With increasing width of the specimen’s mid-section, the maximum shear stress in the tapered section decreases. This is plausible due to a smaller difference between clamping and mid-section following a reduced load diversion in the specimen. Therefore, the minimum value in the parameter area w m = 17 mm is chosen, resulting in a 1 mm width decrease over the specimen length. Figure 4e shows the 3D response surface of the metamodel with its global minimum at τ 12 = 31.78 MPa, fulfilling the objective function with the parameters mentioned above. The accuracy of the metamodel together with the summarized metamodel results are given in Table 3.
R2 = 1.00 indicates an almost perfect model fit in Table 3. Together with low RMS errors (absolute and as a percentage of the center of gravity of the regression line), a significant metamodel and a precise parameter optimization can be confirmed.
Figure 5 shows f E , F F and f E , I F F over the contour coordinate x of the tapered specimen’s edge. From the clamping area ( w c = 18 mm at x = 35 mm) to the specimen’s mid-section ( w m = 17 mm at x = 0 mm) f E , F F increases, reaching the failure threshold value ( f E , F F = 1) at the mid-section. In contrast, the IFF stress exposures do not exceed the threshold value of one. f E , I F F forms an almost homogeneous plateau along the contour due to a successful spline optimization. The analyzation identifies a clear fiber failure in the specimen’s mid-section. Based on these stress exposures, the form factors K t l and fracture-type numbers β of the CF-PC-UD and -KV laminate layups are shown in Table 4.
The local fracture-type number β confirms the predicted fiber failure for both investigated CF-PC laminates. It is visible that the FF-tendency for the cross-ply layup is lower than for the UD-layup (βKV < βUD), based on the supporting effect of the 90° layers in terms of load transfer in the cross-ply laminate. The same applies for the local form factor ( K t l , K V = 1.10 < K t l , U D = 1.46). With K t l , K V = 1.10, the tapered section has a lower and tolerable theoretical notch factor for composite cross-ply layups than other investigated specimen geometries in literature [45,46]. For Young’s modulus measurement, a quadratic evaluation area (17 × 17 mm2) is added in the specimen’s mid-section (Figure 6). This leads to a free clamping length l 0 of 100 mm, fulfilling the initial requirements to reach a minimum strain rate of 100 s−1 at conservative test speeds of servo-hydraulic test machines.

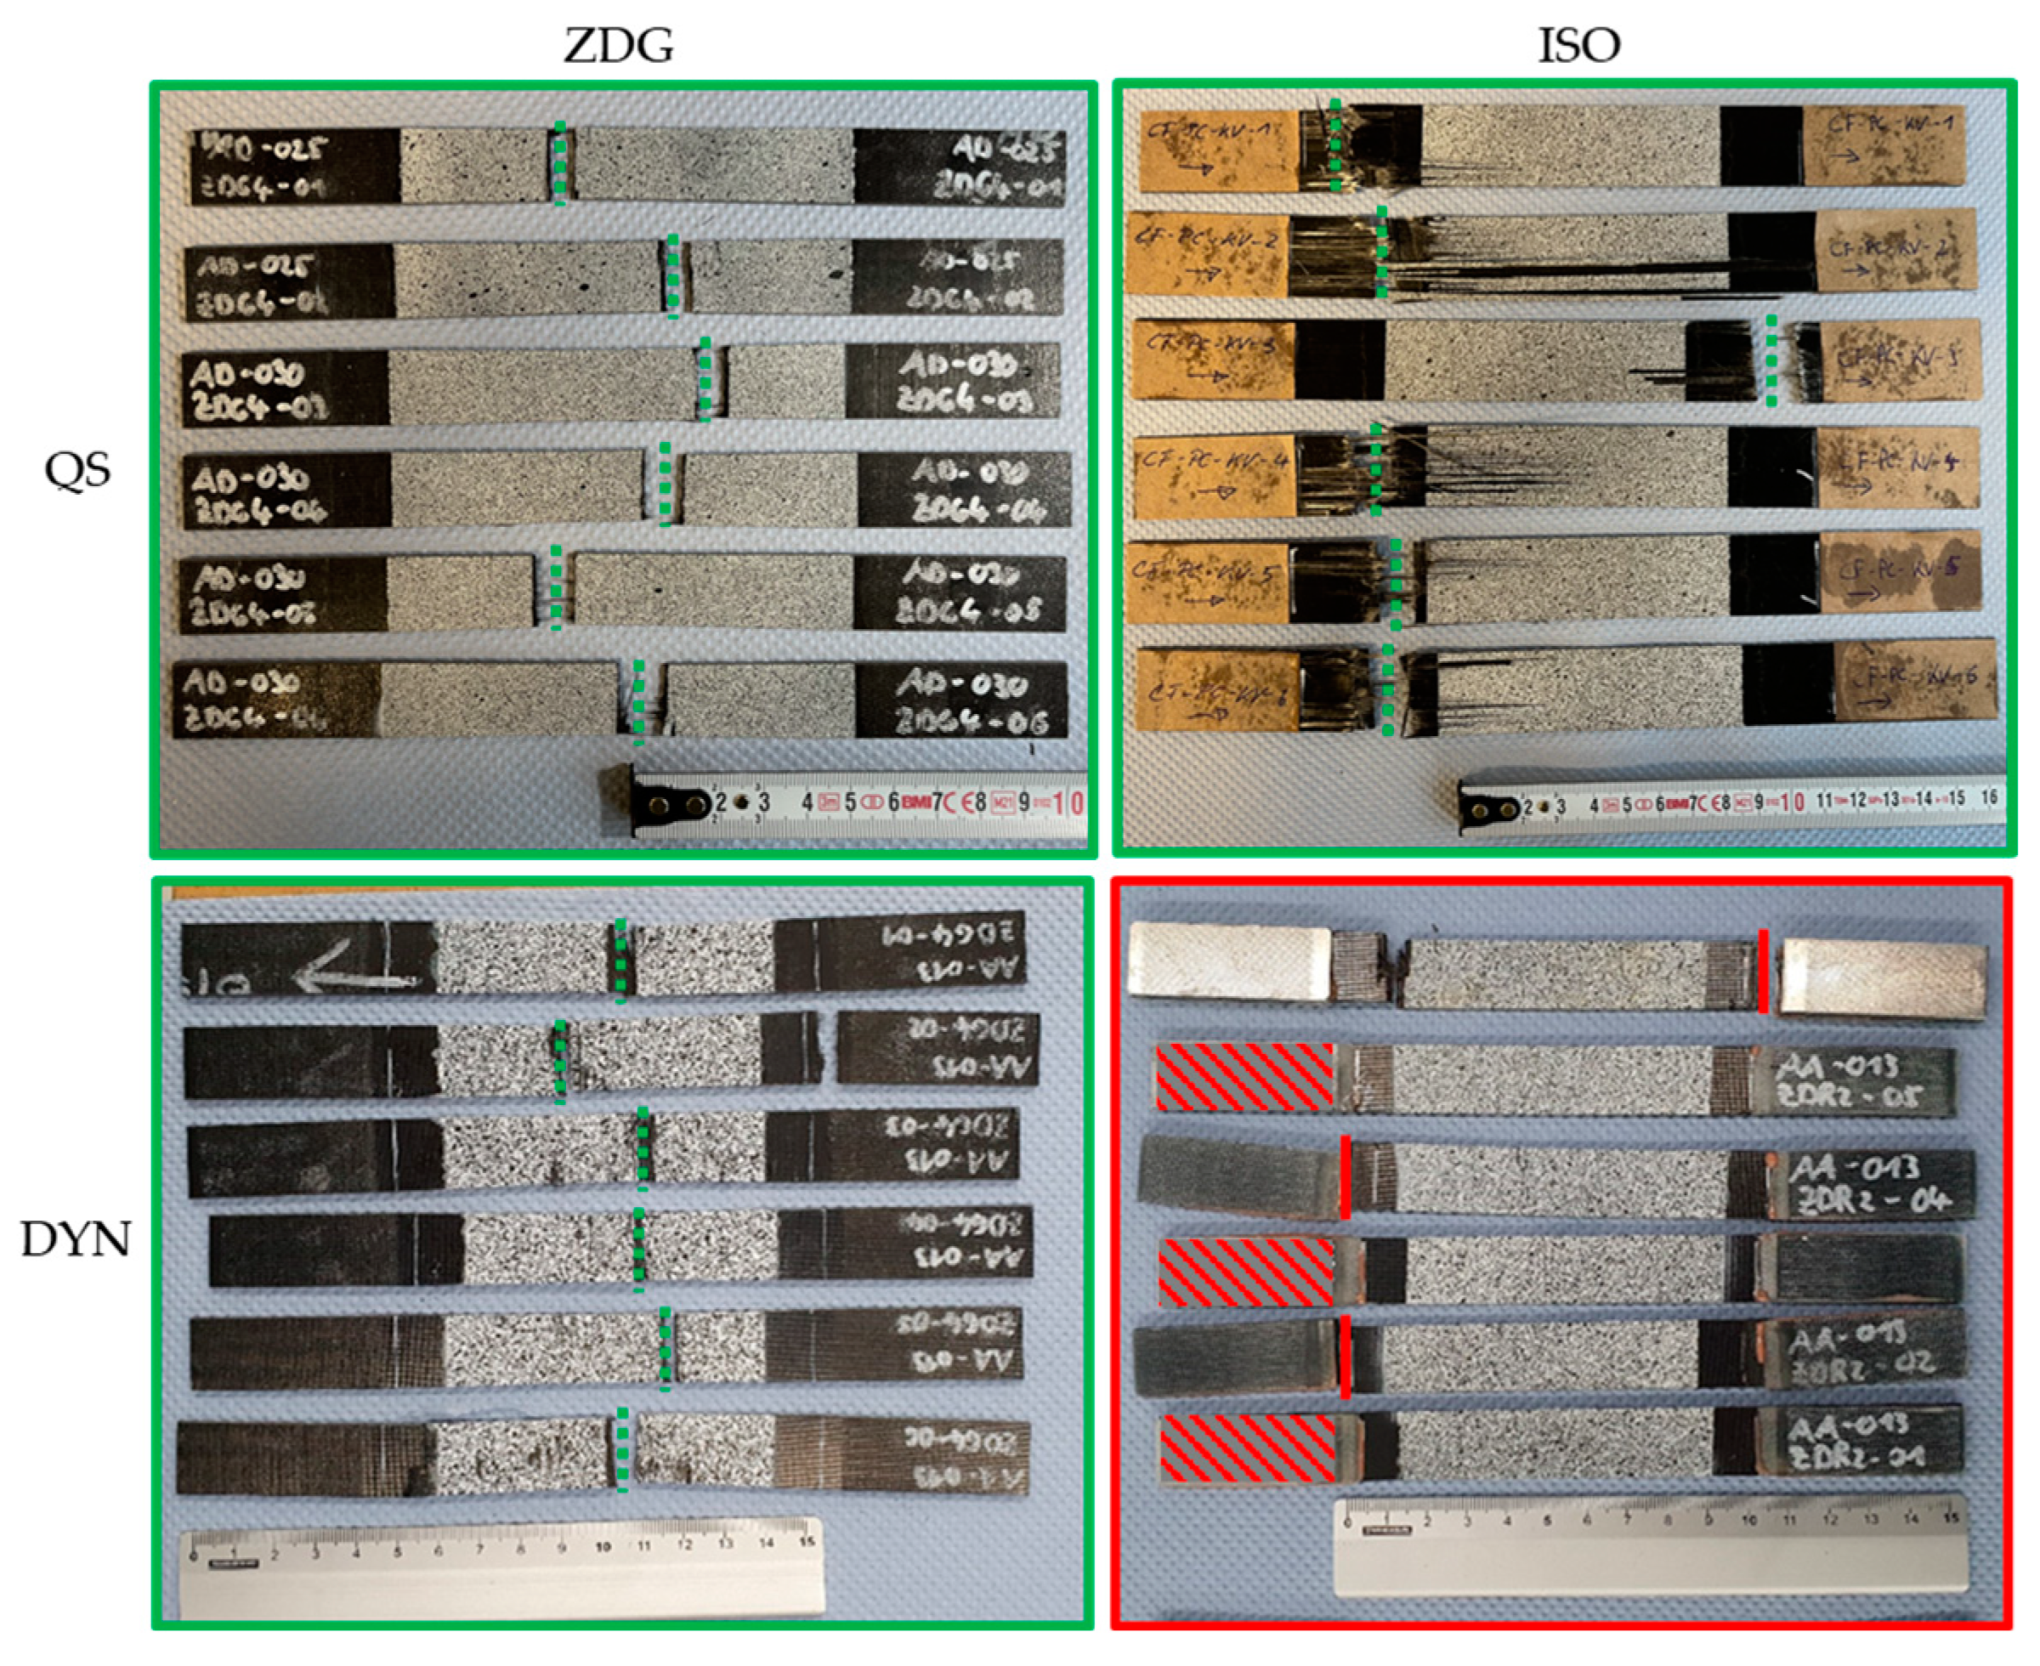
3.2. Experimental Validation Results

To prove the numerical optimization results, an experimental validation of the specimen geometry is conducted, performing quasi-static tensile tests at a test speed of 2 mm min−1 (QS) as well as high-speed tensile tests at 4000 mm s−1 (DYN). To compare the test results of the tapered specimen (ZDG) to results of a rectangle reference geometry (ISO), specimens based on the standard ISO 527-5 [47] are tested in addition. In Figure 7 and Figure 8, the experimental mean curves (engineering stress-strain curves and their standard deviation based on at least five valid test results) for CF-PC-UD and CF-PC-KV of both specimen geometries are shown.
The derived tensile material properties (Young’s modulus and tensile strength) of both laminates and specimen geometries are shown in Table 5. Due to the low standard deviations (<10%, in relation to the corresponding mean values), the properties show statistical significance.

4. Discussion of Experimental Results

The curves of the UD laminate in Figure 7 show no significant strain rate and geometry influence in tensile strength. Due to the fiber dominated mechanical behavior of the UD laminate loaded in the fiber direction, the results follow the strain rate independence of carbon fibers seen in the literature [48]. For the additional 90° layers in the cross-ply laminate, the strain rate dependence of the thermoplastic matrix comes into play. Therefore, an increase in tensile strength at elevated test speeds is present in Figure 8 and Table 5. The strain rate effect on the tensile properties of CF-PC-KV leads to a modulus increase of 59% and a tensile strength increase of 41% for the optimized ZDG geometry.
By comparing the test results of different specimen geometries at a quasi-static test speed (QS), the rectangle specimen geometry (ISO) leads to a 12% higher mean tensile strength than ZDG for CF-PC-KV. Due to a valid tensile failure mode of both test batches (Figure 9), this indicates a stress concentration in the tapered ZDG-section. According to Equation (3), an experimental K t g , K V value of 1.12 is calculated for the optimized ZDG geometry. This number validates the theoretical K t l , K V value of 1.10 in a good approximation. Failure location and location of maximum stress (in the transition region of the parallel mid-section) match in the simulation and experiment (Figure 9 batch ZDG-QS). The green dotted lines in Figure 9 indicate the tensile failure locations of the tested specimens.
In short-term dynamic testing (DYN), the previous geometry influence observation on the tensile strength is reversed for CF-PC-KV. The optimized ZDG geometry leads to a 9% higher mean tensile strength than the rectangular specimen (KV-DYN, ZDG vs. ISO, Table 5). The reason is the invalid failure mode of all tested rectangular specimens (Figure 9, batch ISO-DYN), in comparison to the valid specimen failure of the ZDG geometry in the evaluation area (mid-section of ZDG-DYN in Figure 9). The red lines in Figure 9 show the tensile failure locations of half of the tested ISO-DYN specimens directly at the end tabs. These failures are invalid, according to ISO 527 [5]. All other tested ISO-DYN specimens indicate a slipping out of the clamping (at shaded areas in Figure 9) due to a reduction in clamping force, trying to prevent the failure in the clamping section.
This indicates that the clamping of rectangle specimens influences the material’s failure stress in a greater manner than the tapering of ZDG specimens’ mid-section at elevated test speeds. Due to these advantages of the new tapered geometry in terms of testability, a low notch factor of 1.12 is tolerated. The measured value is closer to the true material’s tensile strength of cross-ply laminates in short-term dynamic testing. For KV laminates, the newly developed tapered specimen geometry ZDG leads to robust and reproducible cFRTP tensile properties without using end tabs.
For the UD-DYN specimens, the previous observations are confirmed (see results in Table 5). The mean tensile strength of the rectangular specimens in the QS test state is 15% higher than the measured mean tensile strength of ZDG specimens leading to an experimental notch factor K t g ,   U D = 1.15. With K t l , U D = 1.46, the numerical material model overestimates this value, but it is still higher than the experimental KV layup value ( K t g ,   K V = 1.12), concluding a plausible result. At an elevated test speed (DYN), the mean UD tensile strengths of the ZDG specimen are higher than the rectangular specimen value, validating the dominant clamping influence for rectangle specimens in strain rate testing. However, due to a high energy release of the UD laminates leading to complete specimen failures (mixed FF and IFF) at the end of experimental tensile testing, the failure location and mode for both UD specimen geometries cannot be precisely evaluated in this work. Therefore, the validity of UD laminate’s tensile strength properties will be investigated in a following study.

5. Conclusions

Within this work, a new tensile specimen geometry (ZDG) for short time dynamic tensile testing of cFRTP was optimized. It is developed for a successful and robust cFRTP material characterization at medium strain rates (1–100 s−1). By choosing a parametric spline approach, the geometry was virtually optimized using a metamodel technique to reduce shear stresses in the tapered specimen sections and offering a broader load introduction area. The final geometry results in a 1 mm width decrease in the tapered section and has a free clamping length of 100 mm (including a parallel section for Young’s modulus evaluation in the specimen’s mid-section).
The experimental validation of the geometry indicates a robust and reproducible failure behavior in the parallel mid-section when testing cFRTP cross-ply layups. All tested tapered cross-ply specimens show valid tensile failure without applied end tabs at quasi-static and high strain rates. In contrast, all rectangle cross-ply specimens fail in the clamping area at elevated test speeds even with applied end tabs and a clamping force adjustment. Their measured strength is lower compared to the tapered specimens, meaning the clamping influences the failure stress more significantly than the tapering of the mid-section. Due to these advantages of the new tapered geometry (ZDG) in terms of testability, a low notch factor of 1.12 for CF-PC-KV is tolerable.
For CF-PC-UD, the ZDG specimen shows a slightly higher tensile strength than the rectangular geometry at elevated test speed. That confirms the higher clamping influence for rectangular specimens, compared to the notch effect of the ZDG geometry at elevated test speeds also for UD laminates (experimental CF-PC-UD notch factor of 1.15). Unfortunately, the validity of the failure mode is not as clear as it is for the cross-ply laminates.
Overall, the measured tensile strength values of the new specimen geometry (ZDG) are closer to the true material’s tensile strength. For the KV laminate, the ZDG specimen fulfills the goal of a successful cFRTP material characterization for strain-rate dependent tensile properties.

Supplementary Materials

The following supporting information can be downloaded at: https://www.mdpi.com/article/10.3390/jcs8030093/s1, Supplementary Materials S1: Optimization data.

Author Contributions

Conceptualization, F.M. and S.S.; methodology, F.M. and S.S.; validation, F.M.; writing—original draft preparation, F.M.; writing—review and editing, S.S.; funding acquisition, S.S. and F.M. All authors have read and agreed to the published version of the manuscript.

Funding

This research was funded by the European Regional Development Fund (ERDF) and the Ministry of Economics, Transport, Agriculture and Viticulture (MWVLW) in Rhineland Palatinate, funding reference 84005413, “Chara-TPC–Establishing a Material Characterization Center for Thermoplastic Composites (TPC) in Rhineland-Palatinate”.

Data Availability Statement

Data of the optimization is available as Supplementary Materials; Experimental data is contained within the article.

Conflicts of Interest

Author Florian Mischo and Sebastian Schmeer were employed by the company Leibniz-Institut für Verbundwerkstoffe GmbH. The remaining authors declare that the research was conducted in the absence of any commercial or financial relationships that could be construed as a potential conflict of interest.

References

  1. Schürmann, H. Konstruieren Mit Faser-Kunststoff-Verbunden, 2nd ed.; Springer: Berlin/Heidelberg, Germany, 2007; ISBN 9783540721895. [Google Scholar]
  2. Premium AEROTEC. Premium AEROTEC Zeigt Zukunftspotenzial von CFK mit Thermoplastischer Matrix: Weltweit Erster Demonstrator für A320-Druckkalotte Steht im Mittelpunkt des ILA-Auftritts; Premium AEROTEC: Augsburg, Germany, 2018. [Google Scholar]
  3. ElringKlinger, A.G. ElringKlinger Erhält Großserienauftrag für ein Globales Leichtbau-Projekt. 2016. Available online: https://www.elringklinger.de/sites/default/files/releases/pressemitteilungen/2016/160607_elringklinger_pressemitteilung.pdf (accessed on 28 February 2022).
  4. Friedrich, H.E. (Ed.) Leichtbau in der Fahrzeugtechnik, 2nd ed.; Springer Vieweg: Wiesbaden, Germany; Heidelberg, Germany, 2017; ISBN 978-3-658-12294-2. [Google Scholar]
  5. DIN. DIN EN ISO 527-4: 2022-03; Kunststoffe-Bestimmung der Zugeigenschaften- Teil 4: Prüfbedingungen Für isotrop und Anisotrop Faserverstärkte Kunststoffverbundwerkstoffe. Beuth Verlag GmbH: Berlin, Germany, 2022.
  6. Eriksen, R.N.W. High Strain Rate Characterisation of Composite Materials; Technical University of Denmark: Kongens Lyngby, Denmark, 2014. [Google Scholar]
  7. Forschungsvereinigung Automobiltechnik. FAT-Richtlinie Dynamische Werkstoffkennwerte für die Crashsimulation; VDA, FAT: Frankfurt, Germany, 2007. [Google Scholar]
  8. Spronk, S.W.F.; Verboven, E.; Gilabert, F.A.; Sevenois, R.D.B.; Garoz, D.; Kersemans, M.; van Paepegem, W. Stress-strain synchronization for high strain rate tests on brittle composites. Polym. Test. 2018, 67, 477–486. [Google Scholar] [CrossRef]
  9. Harding, J.; Welsh, L.M. A tensile testing technique for fibre-reinforced composites at impact rates of strain. J. Mater. Sci. 1983, 18, 1810–1826. [Google Scholar] [CrossRef]
  10. Taniguchi, N.; Nishiwaki, T.; Kawada, H. Tensile strength of unidirectional CFRP laminate under high strain rate. Adv. Compos. Mater. 2007, 16, 167–180. [Google Scholar] [CrossRef]
  11. Kawata, K.; Hashimoto, S.; Takeda, N. Mechanical Behaviours in High Velocity Tension of Composites. Presented at the 4th International Conference on Composite Materials, Tokyo, Japan, 25–28 October 1982. [Google Scholar]
  12. Naik, N.K.; Yernamma, P.; Thoram, N.M.; Gadipatri, R.; Kavala, V.R. High strain rate tensile behavior of woven fabric E-glass/epoxy composite. Polym. Test. 2010, 29, 14–22. [Google Scholar] [CrossRef]
  13. Ploeckl, M. Effect of Strain Rate on the Tensile, Compressive, and Shear Response of Carbon-Fiber-Reinforced Thermoplastic Composites. Ph.D. Thesis, TU München, München, Germany, 2019. [Google Scholar]
  14. Schmack, T. Entwicklung einer Ganzheitlichen Methode zur Bestimmung des Dehnratenabhängigen Verhaltens Faserverstärkter Kunststoffe; Springer Fachmedien Wiesbaden: Wiesbaden, Germany, 2019; ISBN 978-3-658-26930-2. [Google Scholar]
  15. Junginger, M. Charakterisierung und Modellierung Unverstärkter Thermoplastischer Kunststoffe zur Numerischen Simulation von Crashvorgängen; Fraunhofer IRB Verlag: Freiburg Breisgau, Germany, 2004. [Google Scholar]
  16. DIN. DIN EN ISO 26203-2: 2012-01; Metallische Werkstoffe—Zugversuch bei Hohen Dehngeschwindigkeiten—Teil 2: Servohydraulische und Andere Systeme. Beuth Verlag GmbH: Berlin, Germany, 2012.
  17. European Structural Integrity Society. ESIS P7-00: Procedure for Dynamic Tensile Tests; European Structural Integrity Society: Rimini, Italy, 2000. [Google Scholar]
  18. Stahl Eisen Prüfblatt. Ermittlung Mechanischer Eigenschaften an SEO 1230: Blechwerkstoffen Bei Hohen Dehnraten im Hochgeschwindigkeitsdehnversuch; Beuth Verlag GmbH: Berlin, Germany, 2007. [Google Scholar]
  19. ISO. ISO 18872; Plastics—Determination of Tensile Properties at High Strain Rates. International Organization for Standardization: Geneva, Switzerland, 2007; 83.080.10. Available online: https://www.iso.org/standard/38914.html (accessed on 18 October 2022).
  20. SAE. SAE J 2749: High Strain Rate Tensile Testing Of Polymers; Beuth Verlag GmbH: Berlin, Germany, 2017; Available online: https://www.beuth.de/de/norm/sae-j-2749/277331661 (accessed on 18 October 2022).
  21. VDA. VDA 287; Dehnratenabhängige Zugprüfung für nicht Faserverstärkte Thermoplaste bei Raumtemperatur. Verband der Automobilindustrie e. V.: Berlin, Germany, 2022. (287). Available online: https://webshop.vda.de/VDA/de/vda-287-032022 (accessed on 3 February 2023).
  22. Fitoussi, J.; Meraghni, F.; Jendli, Z.; Hug, G.; Baptiste, D. Experimental methodology for high strain-rates tensile behaviour analysis of polymer matrix composites. Compos. Sci. Technol. 2005, 65, 2174–2188. [Google Scholar] [CrossRef]
  23. Todo, M.; Takahashi, K.; Béguelin, P.; Kausch, H.H. Strain-rate dependence of the tensile fracture behaviour of woven-cloth reinforced polyamide composites. Compos. Sci. Technol. 2000, 60, 763–771. [Google Scholar] [CrossRef]
  24. Chen, W.; Meng, Q.; Hao, H.; Cui, J.; Shi, Y. Quasi-static and dynamic tensile properties of fiberglass/epoxy laminate sheet. Constr. Build. Mater. 2017, 143, 247–258. [Google Scholar] [CrossRef]
  25. De Baere, I.; van Paepegem, W.; Hochard, C.; Degrieck, J. On the tension–tension fatigue behaviour of a carbon reinforced thermoplastic part II: Evaluation of a dumbbell-shaped specimen. Polym. Test. 2011, 30, 663–672. [Google Scholar] [CrossRef]
  26. Gilat, A.; Goldberg, R.K.; Roberts, G.D. Strain Rate Sensitivity of Epoxy Resin in Tensile and Shear Loading. J. Aerosp. Eng. 2007, 20, 75–89. [Google Scholar] [CrossRef]
  27. Hufner, D.R.; Hill, S.I. High strain rate testing and modeling of a woven E-glass–vinylester composite in dry and saturated conditions. J. Compos. Mater. 2017, 51, 3017–3039. [Google Scholar] [CrossRef]
  28. Schmeer, S.; Mischo, F.; Scheliga, D. Tapered geometry for testing continuous fiber reinforced thermoplastics under tension. In Proceedings of the 20th European Conference on Composite Materials—Composites Meet Sustainability (Vol 1–6), Lausanne, Switzerland, 26–30 June 2022; EPFL Lausanne, Composite Construction Laboratory: Lausanne, Switzerland, 2022; pp. 181–188, ISBN 978-2-9701614-0-0. [Google Scholar]
  29. Spronk, S.; Verboven, E.; Gilabert, F.; Sevenois, R.; Garoz, D.; Kersemans, M.; van Paepegem, W. Dynamic tensile testing of brittle composites using a hydraulic pulse machine: Stress-strain synchronization and strain rate limits. In Proceedings of the Eighteenth International Conference of Experimental Mechanics, Brussels, Belgium, 1–5 July 2018; MDPI: Basel, Switzerland, 2018; p. 5274. [Google Scholar]
  30. Ryberg, A.-B.; Domeij Bäckryd, R.; Nilsson, L. Metamodel-Based Multidisciplinary Design Optimization for Automotive Applications; Technical Report; Linköping University: Linköping, Sweden, 2012. [Google Scholar]
  31. Seiler, M.S. Geometrische Restriktionen Bei der Geometriebasierten Strukturoptimierung von Maschinenbauteilen mit Freiformgeometrien. Ph.D. Thesis, RWTH, Aachen, Germany, 2012. [Google Scholar]
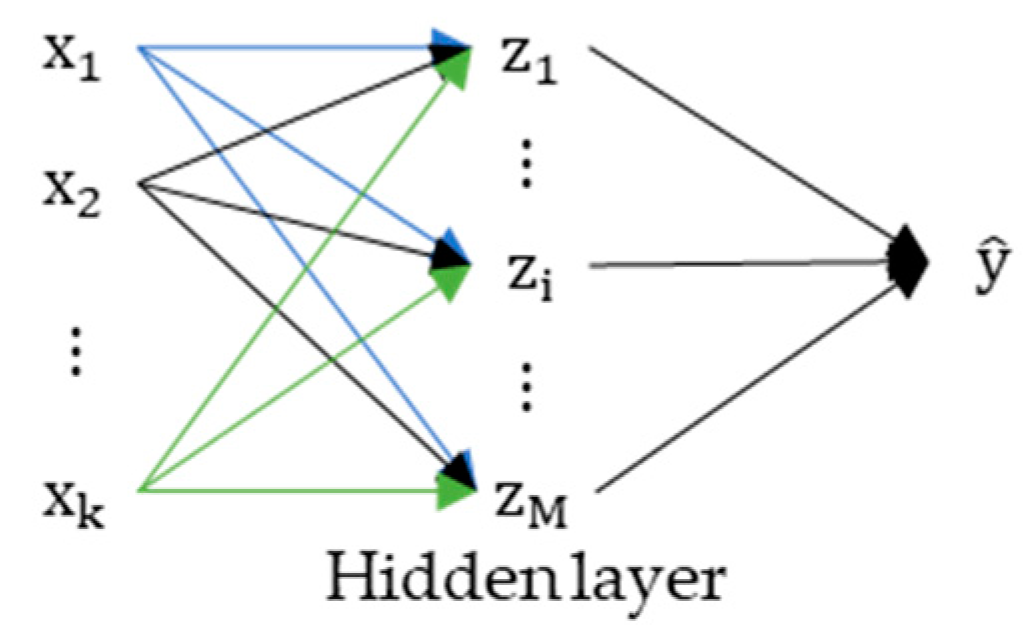
  32. Hussain, M.F.; Barton, R.R.; Joshi, S.B. Metamodeling: Radial Basis Functions, versus Polynomials. Eur. J. Oper. Res. 2002, 138, 142–154. [Google Scholar] [CrossRef]
  33. Bishop, C.M. Neural networks and their applications. Rev. Sci. Instrum. 1994, 65, 1803–1832. [Google Scholar] [CrossRef]
  34. Sheldon, A.; Helwig, E.; Cho, Y.-B. Investigation and Application of Multi-Disciplinary Optimization for Automotive Body-in-White Development. In Proceedings of the 8th European LS-DYNA Users Conference, Strasbourg, France, 23–24 May 2011. [Google Scholar]
  35. Kremer, T.; Schürmann, H. Über die Verwendung und Bedeutung von Kerbformzahlen bei der Auslegung von Faser-Kunststoff-Verbunden. Mat. Wiss. u. Werkstofftech. 2008, 39, 385–390. [Google Scholar] [CrossRef]
  36. Mischo, F.; Kenf, A.; Kammler, M.; Schmeer, S. Influence of Manufacturing Procedure on Mechanical Properties of Continous Fiber Reinforced Thermoplastics. In Proceedings of the 20th European Conference on Composite Materials—Composites Meet Sustainability (Vol 1–6), Lausanne, Switzerland, 26–30 June 2022; EPFL Lausanne, Composite Construction Laboratory: Lausanne, Switzerland, 2022; pp. 1125–1132, ISBN 978-2-9701614-0-0. [Google Scholar]
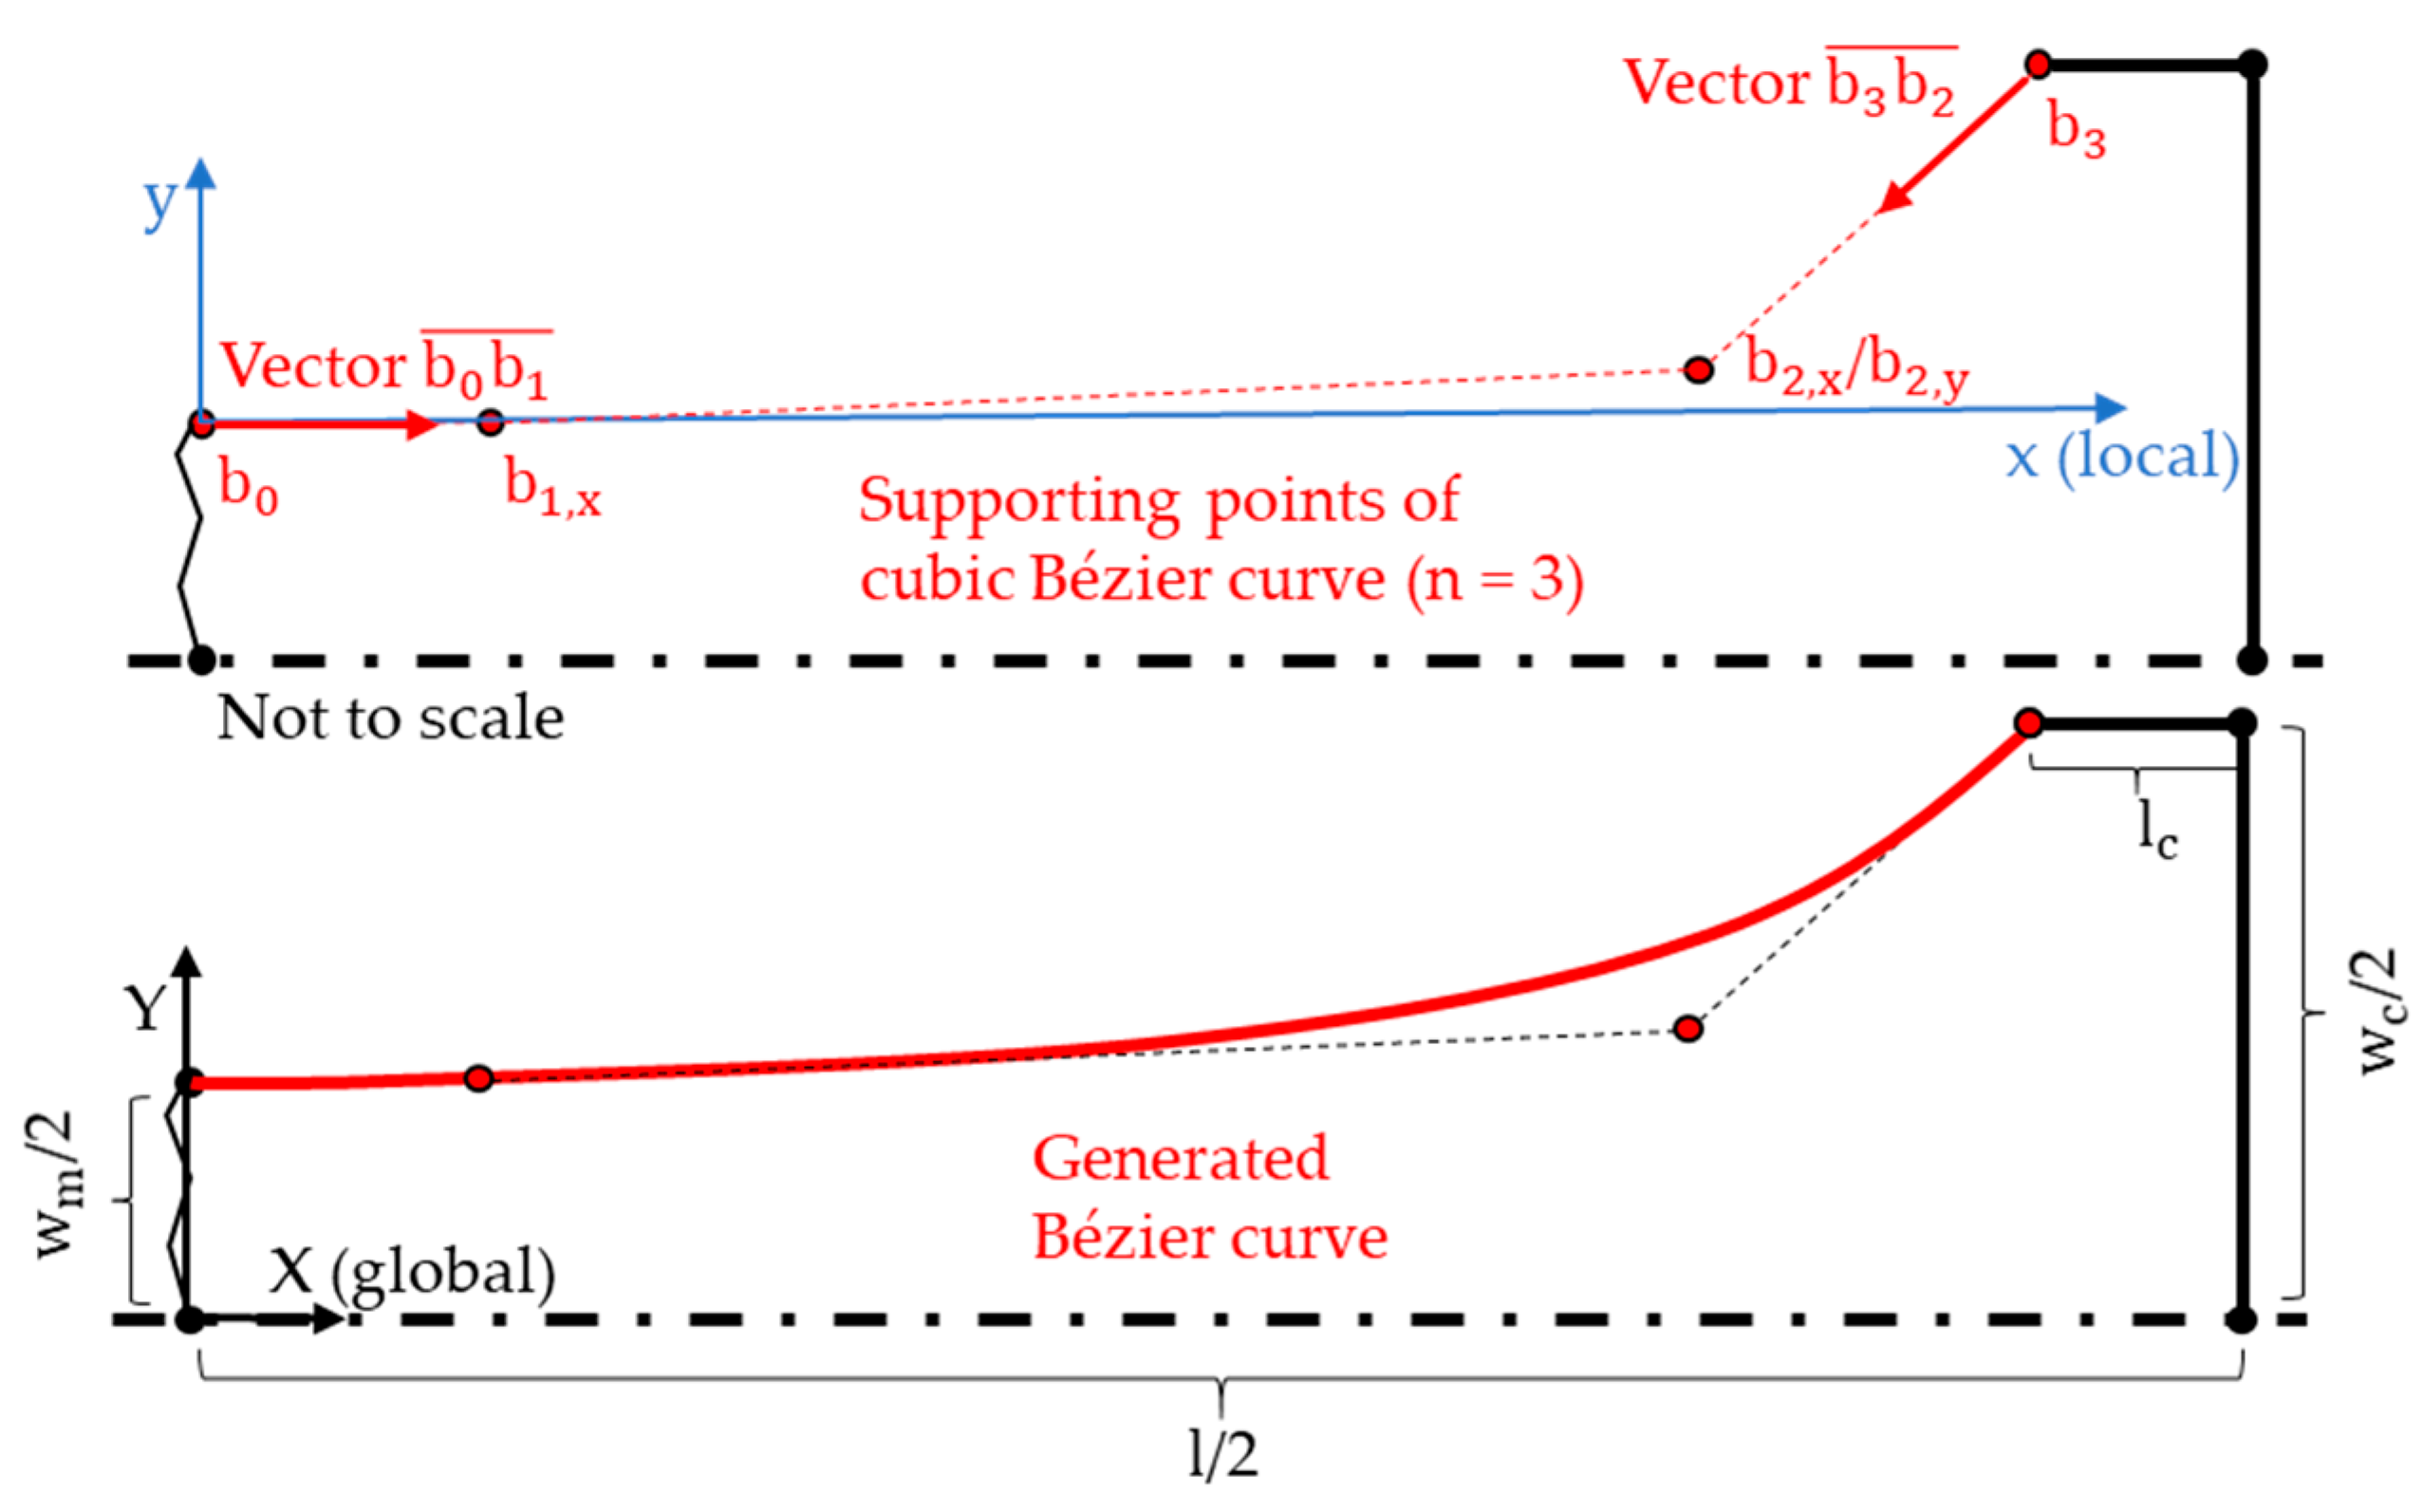
  37. De Casteljau, P. Courbes et Surfaces à Pôles No. 66; André Citroën Automobiles SA: Paris, France, 1963. [Google Scholar]
  38. Bezier, P. How a Simple System Was Born: Curves and Surfaces for Computer Aided Geometric Design. A Practical Guide; Elsevier Science: Amsterdam, Netherlands, 1993. [Google Scholar]
  39. Prautzsch, H.; Boehm, W.; Paluszny, M. Bézier and B-Spline Techniques; Springer: Berlin/Heidelberg, Germany, 2002; ISBN 978-3-662-04919-8. [Google Scholar]
  40. Krautter, J.; Parizot, S. Systeme d’aide a la définition et a l’usinage des surfâces de carosserie. J. de la SIA 1971, 44, 581–586. [Google Scholar]
  41. Boehm, W.; Müller, A. On de Casteljau’s algorithm. Comput. Aided Geom. Des. 1999, 16, 587–605. [Google Scholar] [CrossRef]
  42. Puck, A. Festigkeitsanalyse von Faser-Matrix-Laminaten: Modelle für die Praxis; Hanser: München, Germany, 1996; ISBN 3446181946. [Google Scholar]
  43. VDI. Entwicklung von Bauteilen aus Faser-Kunststoff-Verbund—Berechnungen. 2006. (VDI 2014 Blatt3). Available online: https://www.vdi.de/en/home/vdi-standards/details/vdi-2014-blatt-3-entwicklung-von-bauteilen-aus-faser-kunststoff-verbund-berechnungen-1 (accessed on 4 December 2022).
  44. Stander, N.; Basudhar, A.; Roux, W.; Liebold, K.; Eggleston, T.; Goel, T.; Craig, K. LS-OPT ® User’s Manual: A Design Optimization and Probabilistic Analysis Tool for the Engineering Analyst; Version 7.0; Livermore Software Technology Corporation: Livermore, CA, USA, 2020. [Google Scholar]
  45. Liu, C.J.; Sterk, J.C.; Nijhof, A.; Marissen, R. Matrix-Dominated Damage in Notched Cross-Ply Composite Laminates: Experimental Observations. Appl. Compos. Mater. 2002, 9, 155–168. [Google Scholar] [CrossRef]
  46. Hufenbach, W.; Kroll, L. Kerbspannungsanalyse anisotrop faserverstärkter Scheiben. Arch. Appl. Mech. 1992, 62, 277–290. [Google Scholar] [CrossRef]
  47. DIN. DIN EN ISO 527-5:2022-05; Kunststoffe_- Bestimmung der Zugeigenschaften_- Teil_5: Prüfbedingungen für Unidirektional Faserverstärkte Kunststoffverbundwerkstoffe. Beuth Verlag GmbH: Berlin, Germany, 2022.
  48. Zhou, Y.; Jiang, D.; Xia, Y. Tensile mechanical behavior of T300 and M40J fiber bundles at different strain rate. J. Mater. Sci. 2001, 36, 919–922. [Google Scholar] [CrossRef]
Figure 1. Network of neurons z i of a single layer neural network.
Jcs 08 00093 g001
Figure 2. Quarter-model representation of the tapered tensile specimen to optimize.
Jcs 08 00093 g002
Figure 3. Optimization flow chart of the tapered tensile specimen geometry.
Jcs 08 00093 g003
Figure 4. Three-dimensional visualization of the metamodel (e); Two-dimensional cutting planes (ad) through the global minimum of Max( τ 12 ) of the five-dimensional metamodel.
Jcs 08 00093 g004
Figure 5. Stress exposure progression at the specimen’s edge of the optimized specimen geometry in CF-PC-UD laminate.
Jcs 08 00093 g005
Figure 6. Final specimen design for short-term dynamic tensile testing of cFRTP.
Jcs 08 00093 g006
Figure 7. Tensile results (mean value curves) of optimized geometries (ZDG) and rectangular reference specimens (ISO) for CF-PC-UD at a quasi-static (QS) test speed and at 4 m s−1 (DYN).
Jcs 08 00093 g007
Figure 8. Tensile results (mean value curves) of optimized geometries (ZDG) and rectangular reference specimens (ISO) for CF-PC-KV at a quasi-static (QS) test speed and at 4 m s−1 (DYN).
Jcs 08 00093 g008
Figure 9. Failure pattern of tested CF-PC-KV specimen batches: ZDG (left) and ISO (right) at test speeds QS (first row) and DYN (second row); dotted lines indicate first tensile failure; shaded areas indicate specimen slipping in clamping area.
Jcs 08 00093 g009
Table 1. Overview of specimen geometries for continuous fiber reinforced composites in the literature.
AuthorMaterialGeometryRadius
r/mm
Length
l0/mm
Width
b/mm
Width Change over Length
Δb/mm
Fitoussi et al. [22]CF-Epoxy WeaveDogbone729614
Spronk et al. [8]CF-Epoxy WeaveTapered136.575015.384.62
Chen et al. [24]GF-Epoxy WeaveTapered76.580137
De Baere et al. [25]CF-PPS WeaveTapered144621023.16.9
Hufner; Hill [27]GF-VE WeaveRectangular-12.712.7-
Gilat et al. [26]CF-Epoxy
UD/Cross-ply
Tapered12.734.9253.29
Table 2. Parameter of the tapered tensile specimen and its Bézier curve control points.
Basic
Parameter
Parameter Value
(global)/mm
Bézier Point-
Parameter
Parameter Value
(local)/mm
l 85 b 0 ( x 0 | y 0 ) (0 | 0)
l c 5 b 1 ( x 1 | y 1 ) ( b 1 , x | b 1 , y = 0)
w c 18 b 2 ( x 2 | y 2 ) ( b 2 , x | b 2 , y )
w m 14–17 b 3 ( x 3 | y 3 ) (( l / 2 ) − l c | ( w c w m ) / 2 )
Table 3. Final optimization results after 50 iterations.
RMS ErrorR2Objective Function ResultParameter Value (Local)/mm
1.29
(0.92%)
1.00 τ 12 = 31.78 MPa b 1 (1.910 | 0.000)
b 2 (17.813 | 0.195)
w m = 17
Table 4. Form factor K t l and fracture type numbers β for different laminate layups of CF-PC for the optimized specimen geometry.
Laminate LayupKtl/1β/1
CF-PC-UD [0]61.460.52
CF-PC-KV [0/90]3s1.100.28
Table 5. Experimental tensile material properties of CF-PC (KV and UD) using the optimized geometry (ZDG) and a rectangular reference specimen (ISO) at a quasi-static (QS) test speed and at 4 m s−1 (DYN).
Test SpeedGeometryYoung’s Modulus/GPaTensile Strength/MPa
MeanStandard DeviationMeanStandard Deviation
KVQS
(3.33 × 10⁻⁵ m s−1)
ZDG41.262.99632.9154.72
ISO44.501.18711.6137.19
DYN
(4.00 m s−1)
ZDG65.674.11890.5156.54
ISO60.973.99809.5664.67
UDQS
(3.33 × 10⁻⁵m s−1)
ZDG94.283.081159.9873.47
ISO98.876.541338.1595.12
DYN
(4.00 m s−1)
ZDG92.738.541347.40119.22
ISO97.118.111329.94138.22
Disclaimer/Publisher’s Note: The statements, opinions and data contained in all publications are solely those of the individual author(s) and contributor(s) and not of MDPI and/or the editor(s). MDPI and/or the editor(s) disclaim responsibility for any injury to people or property resulting from any ideas, methods, instructions or products referred to in the content.

