Article

Influence of SiC Doping on the Mechanical, Electrical, and Optical Properties of 3D-Printed PLA

Institute of Nanoscience and Nanotechnology (INN), National Centre for Scientific Research “Demokritos”, Patr. Gregoriou E & 27 Neapoleos Str., Aghia Paraskevi, 15310 Athens, Greece
*
Author to whom correspondence should be addressed.
J. Compos. Sci. 2024, 8(3), 79; https://doi.org/10.3390/jcs8030079
Submission received: 5 January 2024 / Revised: 9 February 2024 / Accepted: 19 February 2024 / Published: 22 February 2024
(This article belongs to the Special Issue 3D Printing Composites)

Abstract

:
Additive manufacturing, also known as 3D printing or digital fabrication technology, is emerging as a fast-expanding technology for the fabrication of prototypes and products in a variety of applications. This is mainly due to the advantages of 3D printing including the ease of manufacturing, the use of reduced material quantities minimizing material waste, low-cost mass production as well as energy efficiency. Polylactic acid (PLA) is a natural thermoplastic polyester that is produced from renewable resources and is routinely used to produce 3D-printed structures. One important feature that makes PLA appealing is that its properties can be modulated by the inclusion of nano or microfillers. This is of special importance for 3D-printed triboelectric nanogenerators since it can enhance the performance of the devices. In this work we investigate the influence of SiC micron-sized particles on the mechanical, electrical, and optical properties of a PLA-SiC composite for potential application in triboelectric energy harvesting. Our result show that the ultimate tensile strength of the pure PLA and 1%-doped PLA decreases with the number of fatigue cycles but increases by about 10% when SiC doping increases to 2% and 3%, while the strain at max load was about 3% independent of doping and the effective hardness was increased reaching a plateau at about 2 wt% SiC, about 40% above the value for pure PLA. Our results show that the mechanical properties of PLA can be enhanced by the inclusion of SiC, depending on the concentration of SiC. In addition, the same behavior is observed for the dielectric constant of the composite material increases as the SiC concentration increases, while the optical properties of the resulting composite are strongly dependent on the concentration of SiC.

1. Introduction

Additive manufacturing (AM), also known as 3D printing (3DP), has been established over the last few years as an industrial process in various applications including automotive, electronics, energy, healthcare, and aerospace [1,2,3]. The main advantages of AM, compared to other manufacturing processes, is the ability to produce a variety of structures ranging from simple to complicated designs with low material waste and reduced manufacturing time and cost. It is not surprising that AM technologies are very significant for the fourth industrial revolution which is characterized by digitalization, automation, and interconnected systems [4].
Material extrusion techniques such as Fused deposition modelling (FDM) and Fused Filament Fabrication (FFF) are the most common 3D printing techniques. In both cases a thermoplastic filament is heated to its melting point and then delivered layer-by-layer upon a heated platform to form a 3D structure [5]. These processes have been widely used to build fully functional products with low cost [6]. Thermoplastic materials used for FDM/FFF printing include polylactic acid (PLA), acrylonitrile butadiene styrene (ABS), polypropylene (PP) or polyethylene (PE) as well as thermoplastics filaments with higher melting temperatures such as PEEK and PMMA.
The polylactic acid (PLA) filament is a recyclable, natural thermoplastic polyester that is produced from renewable resources. PLA is routinely used in 3D printing due to its low cost compared to other thermoplastics, while also being very forgiving during the printing process. Moreover, PLA is biodegradable under certain conditions, biocompatible, non-toxic and does not contribute to environmental pollution. PLA-printed structures can be recycled, although the mechanical properties of the recycled parts may differ from the original material [7,8]. Regarding its mechanical properties, PLA has high strength although its rigidity is moderately low [9].
PLA properties can be altered by the inclusion of nanofillers. Anwer et al. [10] investigated the mechanical behavior of composite PLA reinforced with different carbon nanofiber concentrations and they concluded that the tensile modulus of the composite PLA shows a rise of almost 50% at 15 wt% carbon fiber content, compared to the undoped PLA. Yao et al. [11] studied the mechanical properties of printed carbon-fiber-reinforced PLA structures. They demonstrated that the tensile strength increases, and the flexural strength of the reinforced PLA increased by 70% and 18.7%, respectively, compared to non-reinforced specimens. Ferreira et al. [12] studied the mechanical properties of PLA and PLA reinforced with short carbon fibers in a weight fraction of 15% produced by 3D printing based on fused filament fabrication. They concluded that the elastic modulus of the reinforced PLA was higher compared to the original material and that the enhancement depended on the printing direction. Fabijanski [13] studied the influence of PLA filled with macaroni chalcedonite in the amount of 5%, 10%, 15%, 20% and 30% by weight. Their results indicated that the concentration of macaroni chalcedonite in the composite had a significant effect on changing the properties of the obtained material. Mansour et al. [14] investigated the influence of nanodiamonds and carbon fibers on the mechanical behavior of reinforced PLA. The mechanical behavior of 3D-printed structures using the reinforced PLA was evaluated under a series of tests. Their results showed that the incorporation of nanodiamonds into the PLA matrix enhanced the elastic modulus, strength, and hardness of the 3D-printed specimens.
Dichtl et al. [15] investigated whether the properties of “as-printed” PLA are suitable as functional materials for electronic devices or as an experimental setup for electrical measurement. These researchers conducted a set of experiments including temperature and frequency-dependent analysis of its dielectric properties and compared their results to partially crystalline and completely amorphous PLA. They concluded that the dielectric properties of “as-printed” PLA are like the latter. In addition, they demonstrated that the electrical conductivity of PLA can be enhanced by mixing it with an ionic liquid such as trihexyl tetradecyl phosphonium decanoate. Kuzmanić et al. [16] investigated the influence of printing parameters, such as infill pattern and density, on the relative dielectric constant in the additive manufacturing of the printed ship’s spare parts. Their results showed that the dielectric constant of PLA ranged from 1.7778 and 2.8141.
In this work we investigate the influence of SiC microparticles on the mechanical, electrical, and optical properties of SiC-doped PLA for the potential application in 3D-printed tribogenerators [17,18]. To our knowledge the inclusion of SiC particles in PLA and its evaluation for triboelectric mechanical harvesting has not been reported in the literature. The performance characteristics of the SiC-PLA tribogenerator are reported in another paper [19].

2. Materials and Methods

2.1. Materials

PLA pellets (REVODE 101, Luminy LX175), used as the matrix for the composite material, were obtained from TotalEnergies Corbion (Gorinchem, The Netherlands). SiC powder (#1200 mesh, about 8.3 μm grain size) was obtained from Struers (Copenhagen, Denmark). The PLA pellets were dried for 24 h at 100 °C. The SiC powder was thoroughly mixed with the PLA in a heated bowl at 75 °C with the simultaneous addition of a few drops of acetone to enable adhesion of the SiC powder to the pellets. The mixture was dried again at 100 °C for 24 h and stored in a desiccator till extrusion. A schematic of the full fabrication process is shown in Figure 1.
Five types of composites were prepared with 1, 1.5, 2, 2.5 and 3 wt% SiC corresponding to calculated values of about 0.4, 0.6, 0.8, 1.05 and 1.3 vol%, respectively (taking the density of PLA and SiC as 1.3 g/cm3 and 3.15 g/cm3, respectively).

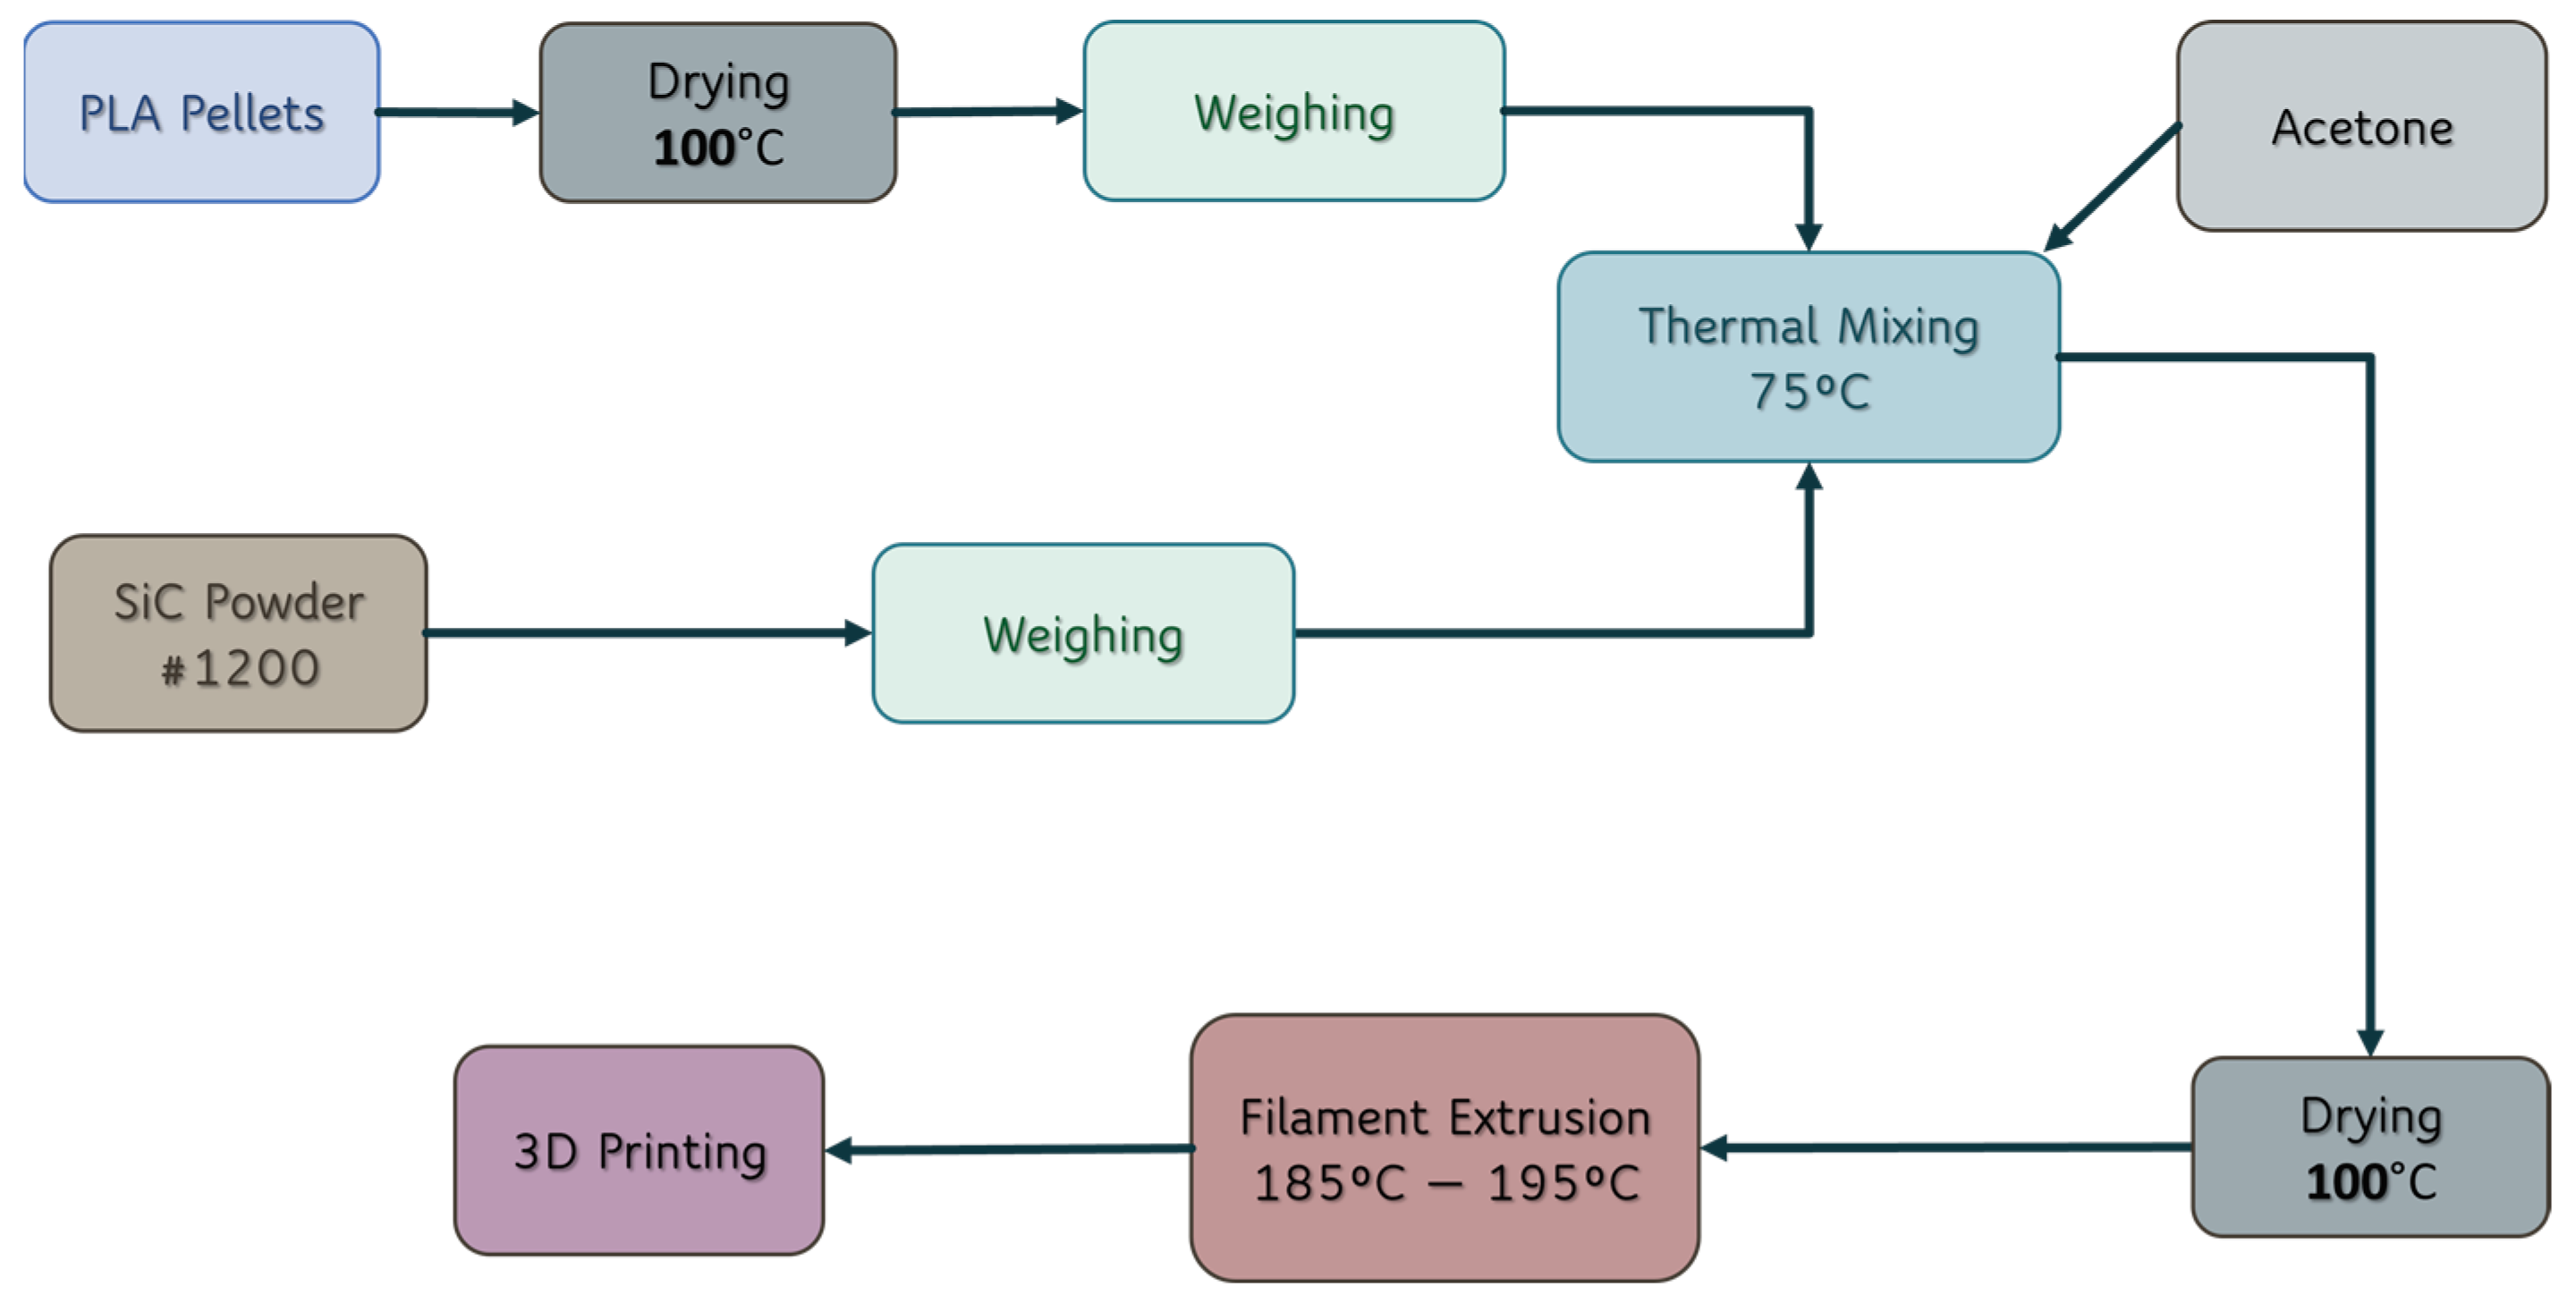
2.2. Preparation of the SiC-Doped PLA Filaments and Test Samples

The dried mixture was transferred to a single-screw extruder (Felfil Evo, Felfil, Turin, Italy) to produce a continuous composite filament that was 1.75 mm in diameter. The extrusion temperature was 185–195 °C, and the extrusion rate was 50 cm per minute. Pure PLA filament was also produced after identical drying conditions and extrusion method were used.
The various specimens that were used in this study were fabricated with the produced filament using a CREALITY CR20 Pro 3D printer (Creality 3D Technology Co., Ltd., Shenzhen, China). The specimens were 3D printed using the following parameters: filament diameter = 1.75 mm, nozzle temperature = 200–210 °C, bed temperature = 55 °C, nozzle size = 1 mm and printing speed = 50 mm/s.
For the fabrication of the capacitors used in the electrical characterization, circular samples of 32 mm in diameter were 3D printed and polished for each different material. The measured thickness for all samples is given in Table 1. Thickness measurements were performed using a micrometer, with a minimum graduation of 10 μm. For the electrical characterization, 200 nm thick Al contacts were deposited through a mechanical shadow mask on both sides of the samples, creating circular parallel plate capacitors of 25 mm in diameter.

2.3. Mechanical Characterization

The six different materials examined (PLA with 0, 1, 1.5, 2, 2.5 and 3% SiC) were characterized by measurements of their tensile strength before and after fatigue as well as abrasion resistance, Shore D hardness and resistance to Hertzian ball loading. All mechanical tests were carried out on specimens conditioned at 23 ± 2 °C and 50 ± 10% relative humidity.

2.3.1. Tensile Testing to Failure after Fatigue

Tensile loading tests to failure were carried out according to the guidelines in the ISO 527-1 standard [20]. The specimens used were flat and “dog-bone” shaped with a nominal gauge length of 40 mm, gauge width of 6 mm and gauge thickness of 2 mm. The tests were carried out on an INSTRON 1026 (Instron, Norwood, MA, USA) tensile loading frameat a displacement rate of 545 μm/min using pneumatic grips. Load data were recorded on a computer via a conditioner module with a precision of 0.1 N while displacement accuracy was estimated at 0.1 mm.
Specimens were tested under tensile loading before and after fatigue cycling to determine remaining strength. Fatigue of the tensile specimens was carried out under a mixed tension-bending mode on a specially built system shown in Figure 2a. The specimens were cycled between about 50% of maximum expected tensile deformation and about 50% of maximum expected bending deformation for up to 400 cycles at a rate of about 0.5 Hz (2 s per cycle).
The load–extension curves obtained were analyzed to obtain the ultimate tensile strength (UTS, stress at maximum load) and the strain at maximum load.

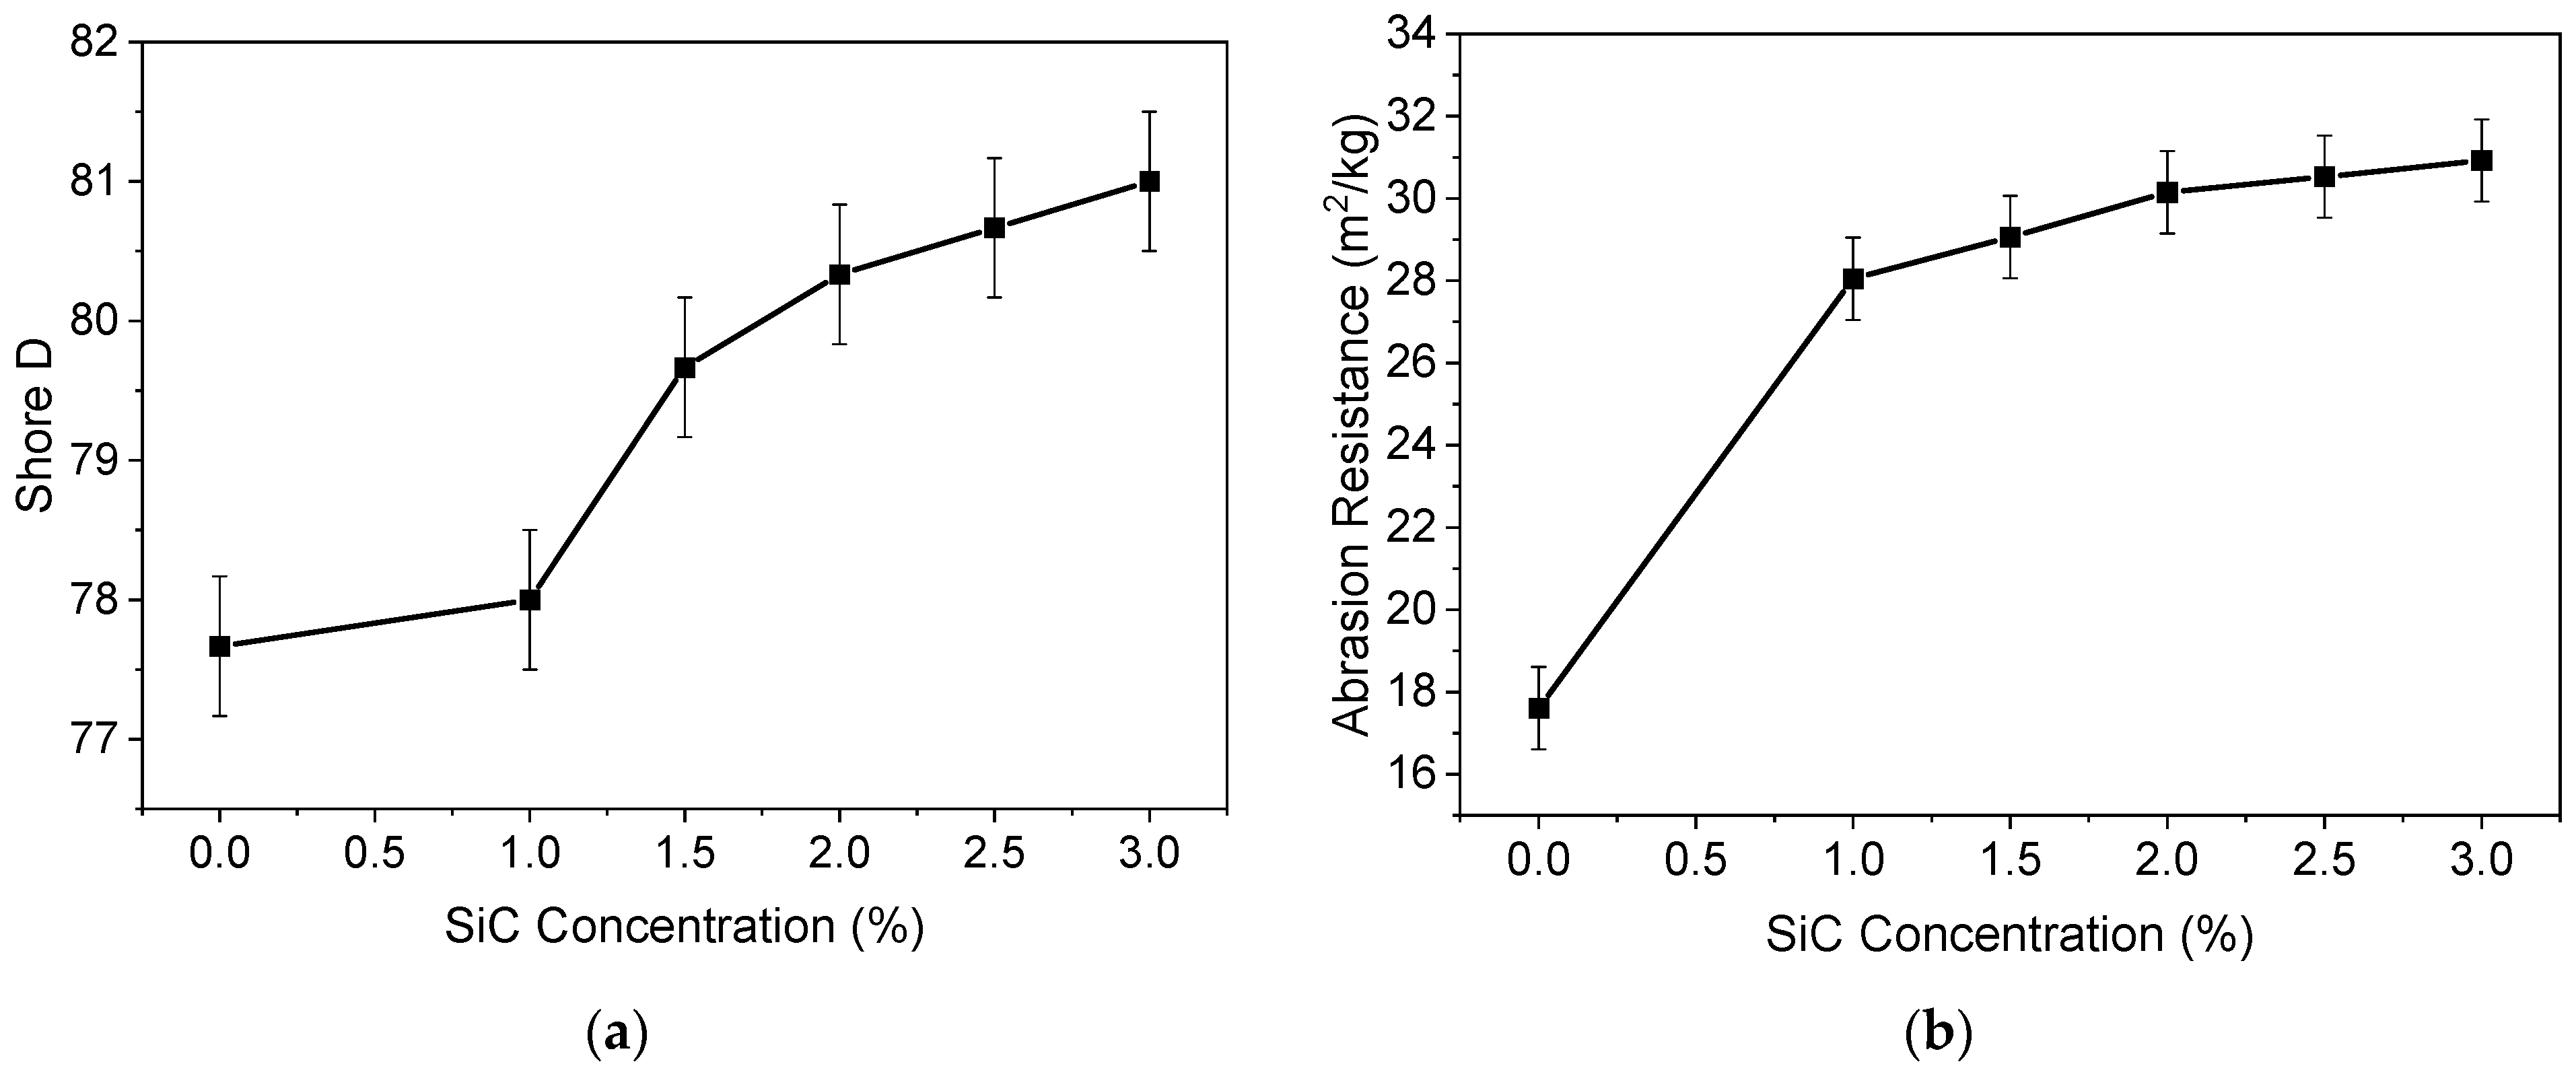
2.3.2. Shore D Hardness

Shore D hardness was measured on various points on the surface of 3DP specimens with diameter of 32 mm and thickness of 7 mm using a hand-held durometer calibrated on the Shore D scale. The hardness is given by a unitless number between 1 and 100.

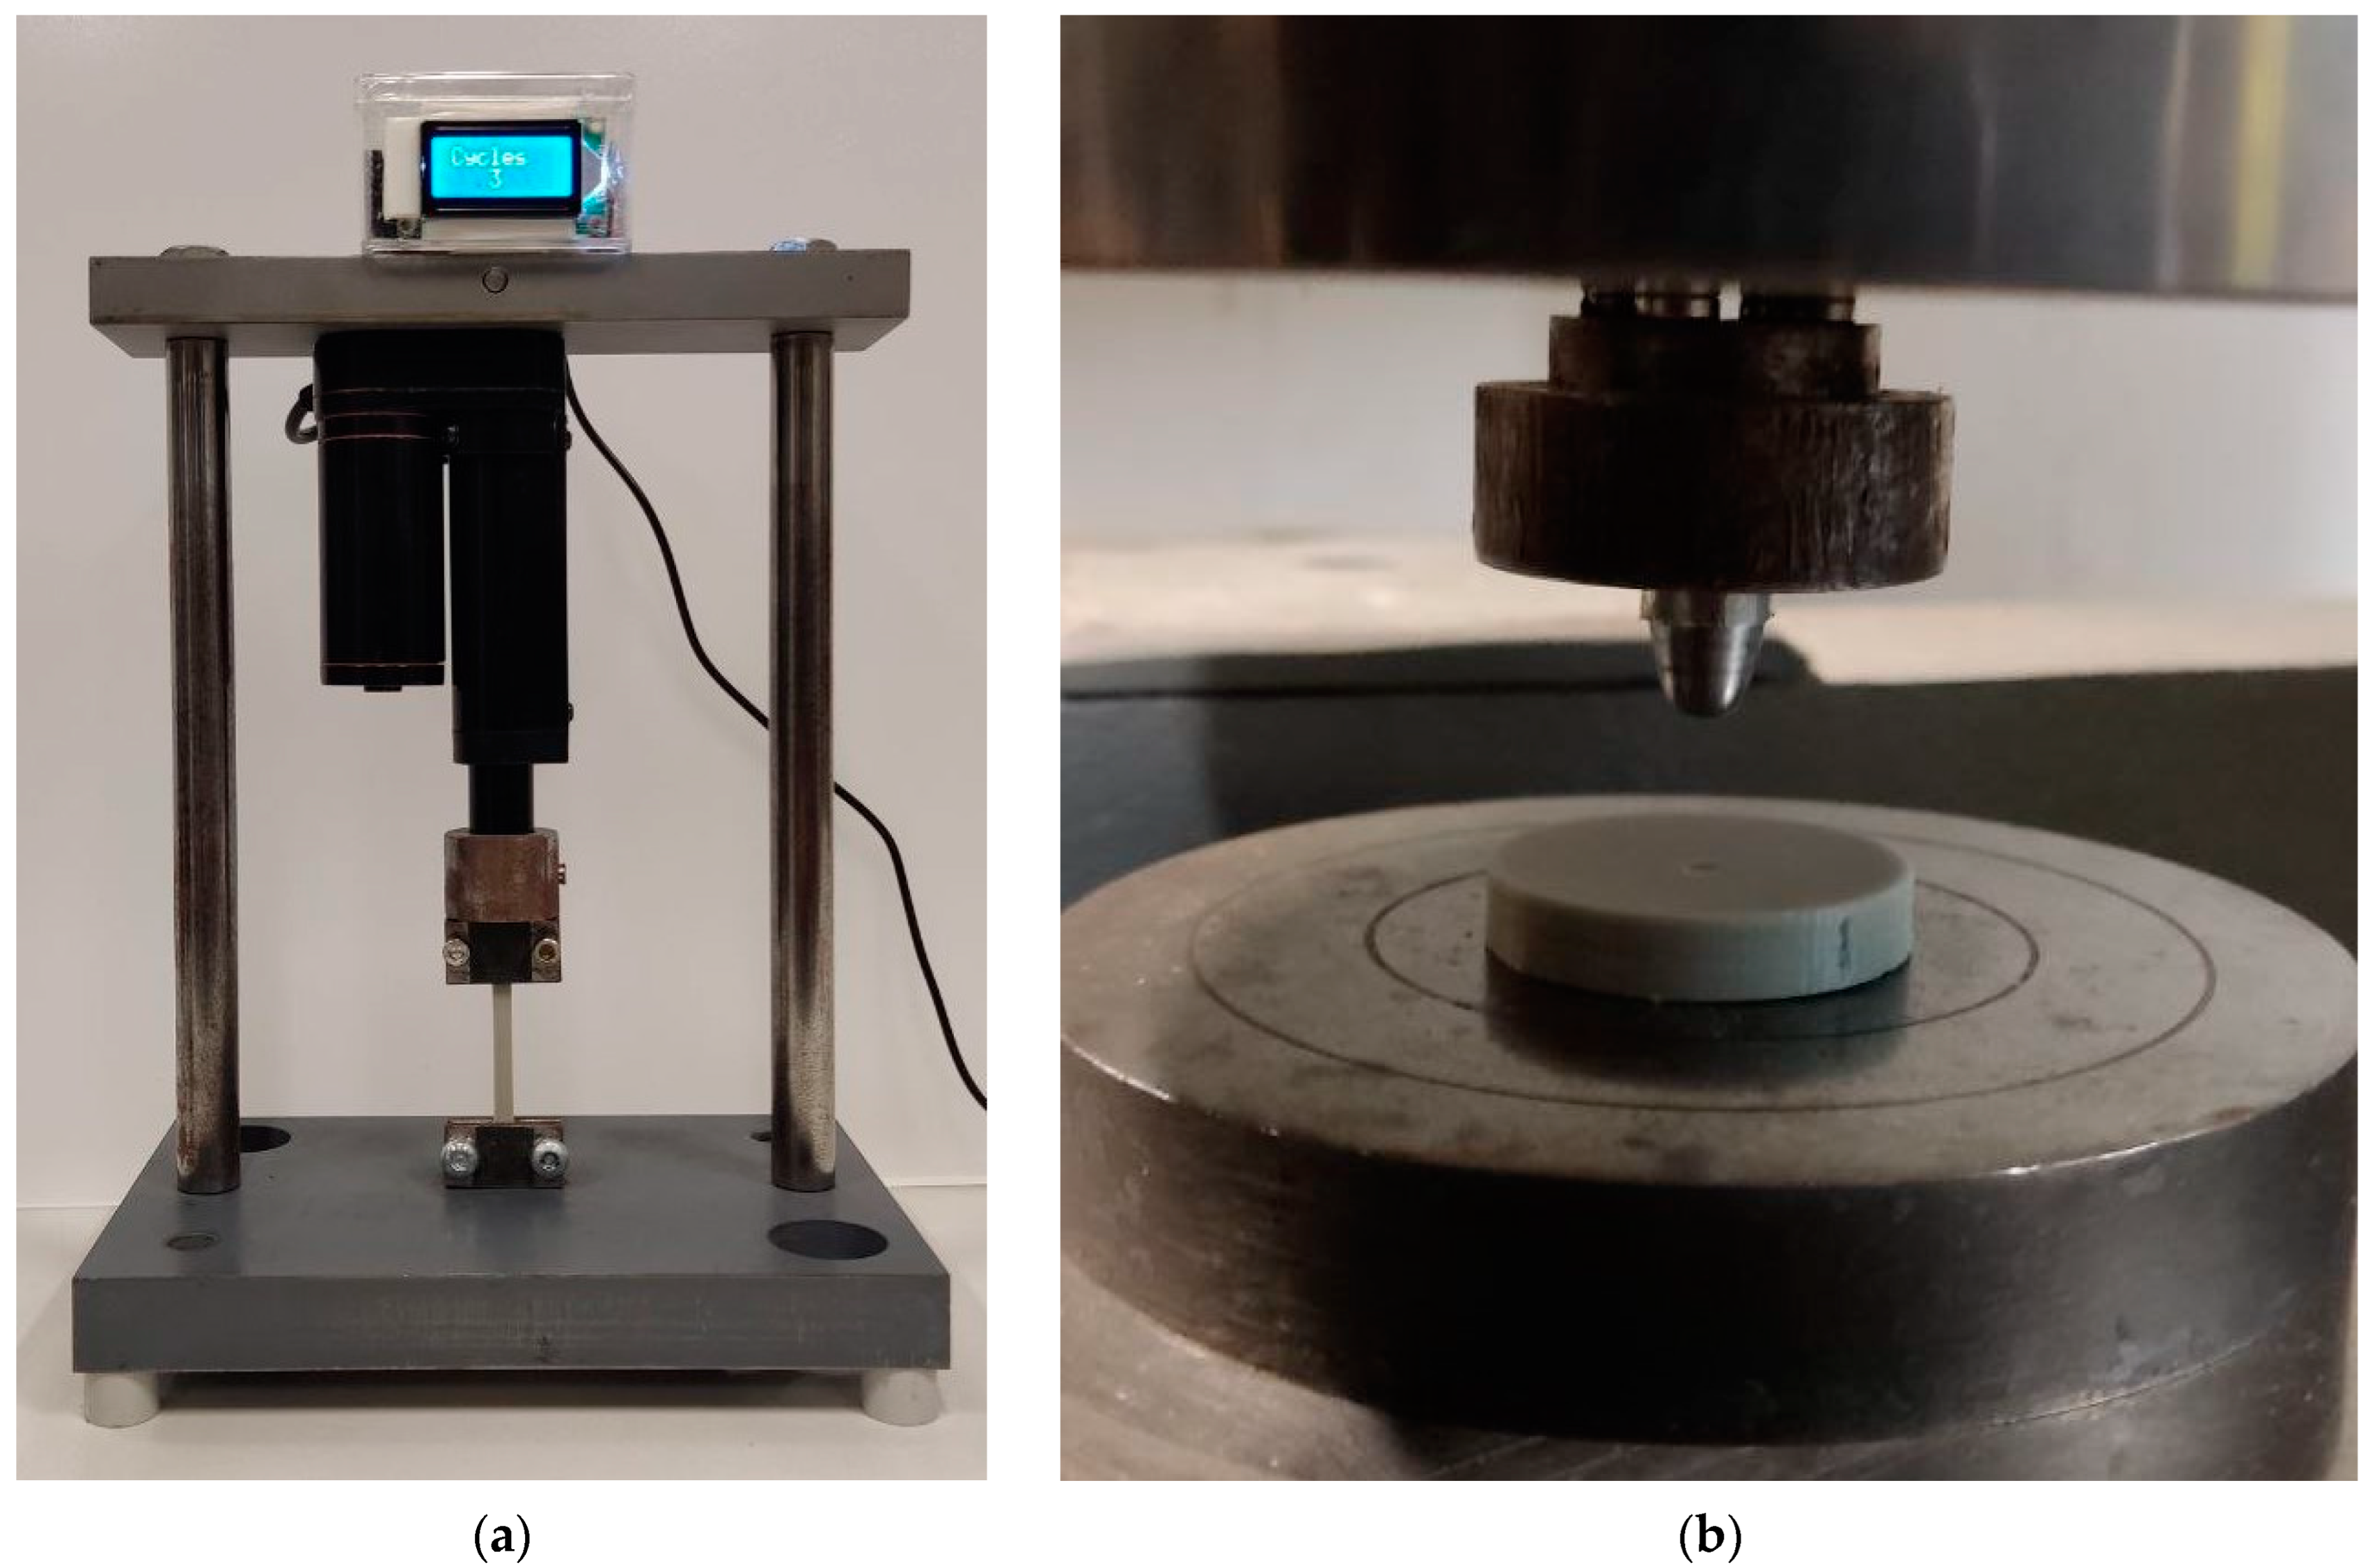
2.3.3. Abrasion Resistance

The resistance of the materials to 2-body abrasion was investigated on specimens with diameter of 32 mm and thickness of 7 mm on an adapted rotating polishing facility, based on a Struers DAP-7 grinder/polisher (Struers, Copenhagen, Denmark) with a PEDEMIN-2 specimen holder at 125 rpm. Three specimens were tested together, and each specimen was loaded with 10 N load (average stress on each specimen 12 kPa) and tested against a fresh #1000 SiC paper for 1 min with continuous water supply to remove any loose particles and avoid 3-body abrasion. The specimens were dried and weighed before and after testing to a precision of 1 mg and the abrasion resistance is given by the reciprocal of the weight loss per unit specimen area with units m2/kg.

2.3.4. Hertzian Point Compression

The resistance of the materials to point loading was measured under “Hertzian point contact” loading conditions using a hardened steel pin with a radius of curvature of 2.5 mm at a displacement rate of 500 μm/min on an INSTRON 5982 (Instron, Norwood, MA, USA) loading frame (Figure 2b). The specimens tested had a diameter of 32 mm and nominal thickness of 7 mm and loading was recorded until the pin had penetrated to a depth of 0.5 mm. The resistance to Hertzian point loading is given by the slope of the tangent to the load–depth curve at a penetration depth of 0.5 mm in units of N/mm.

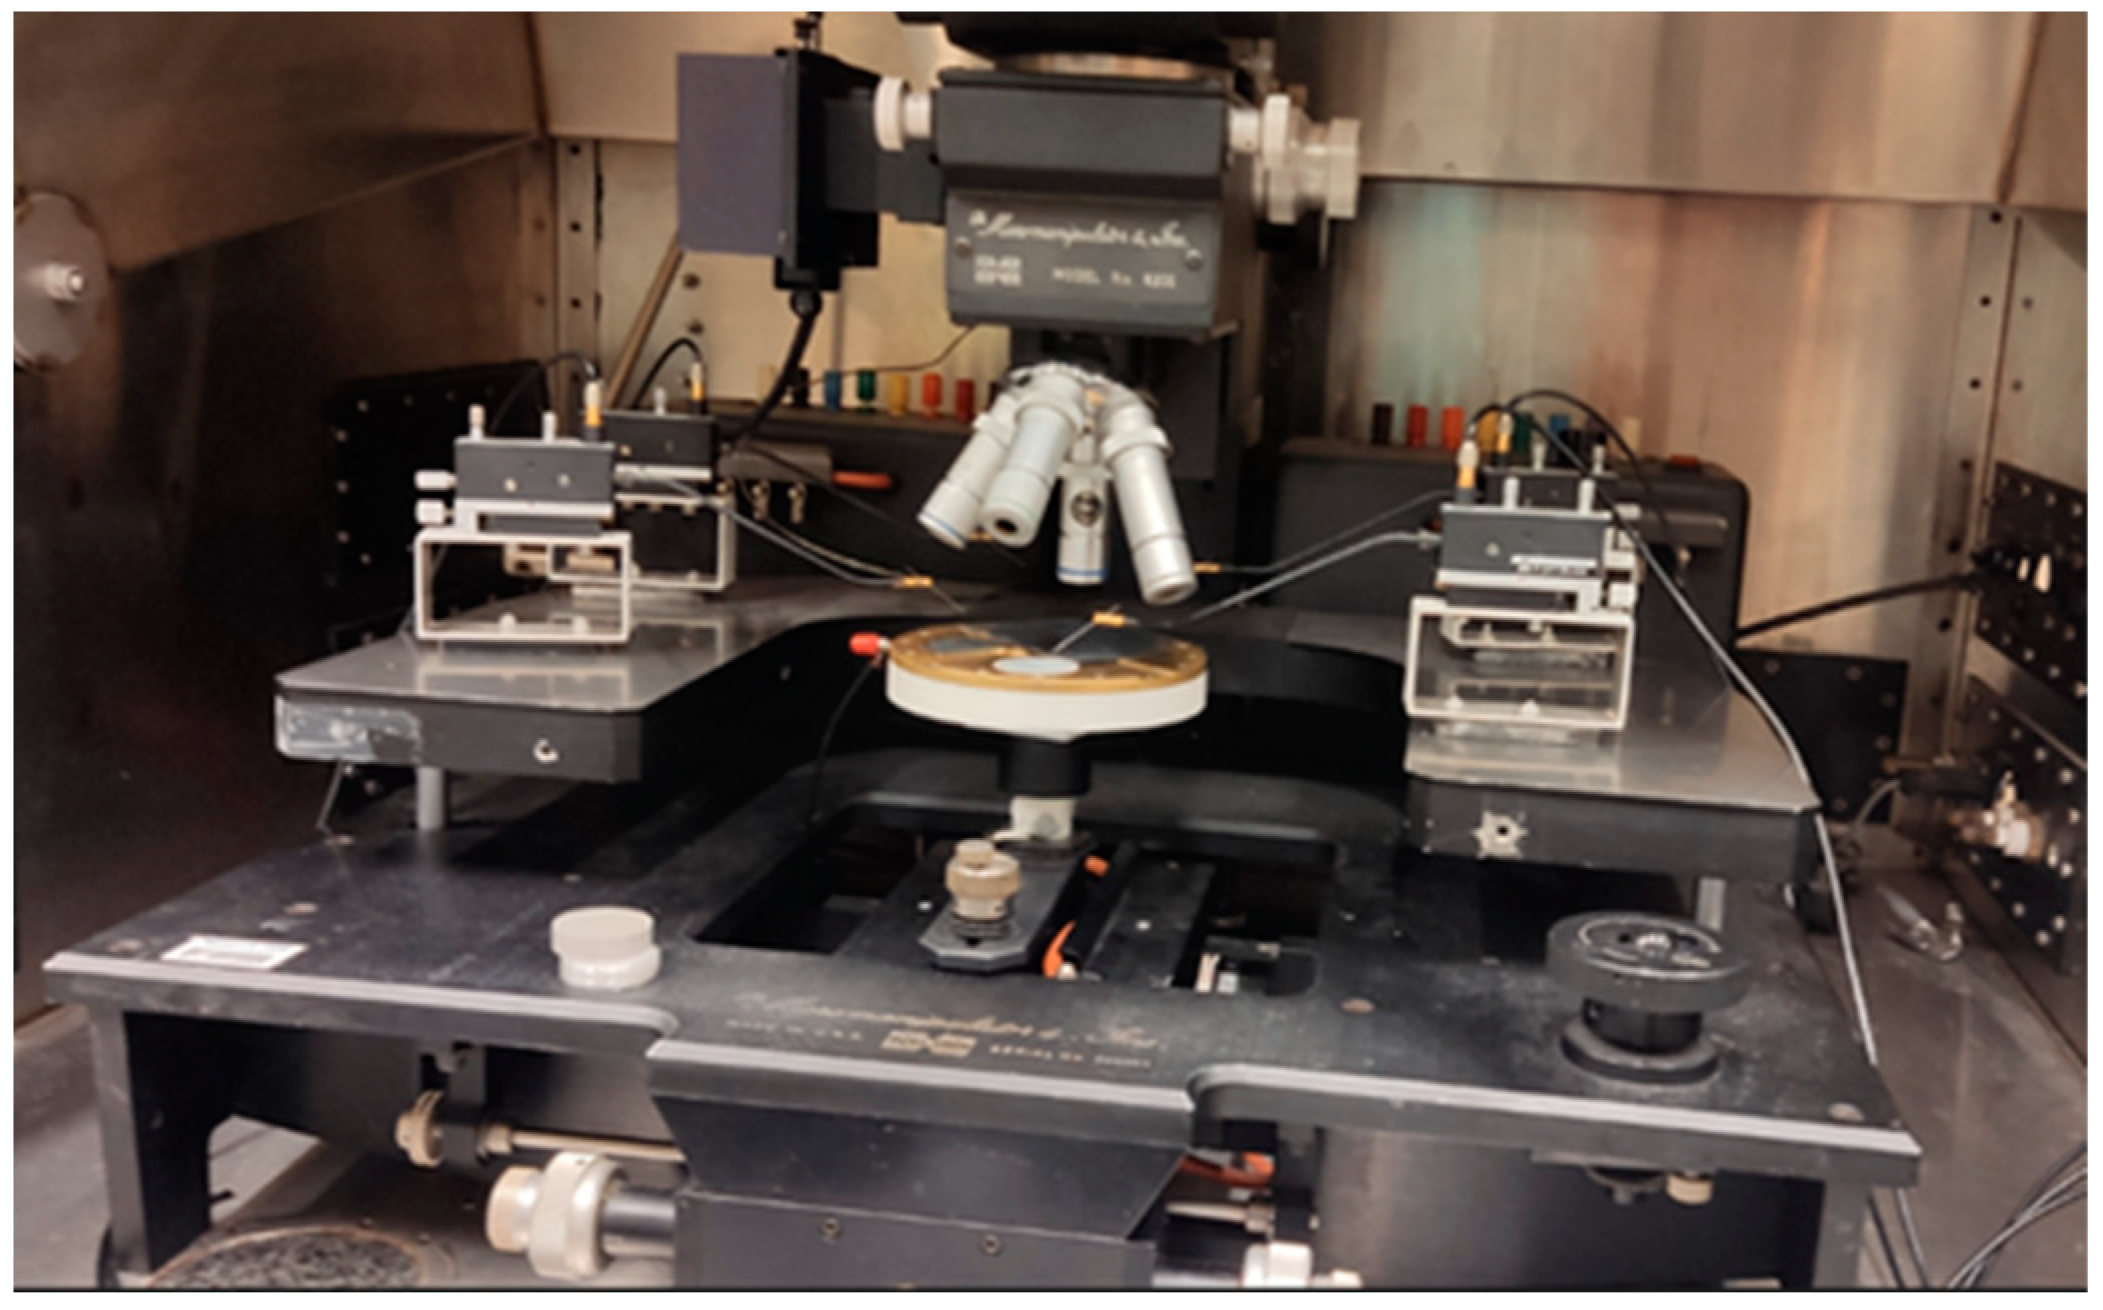
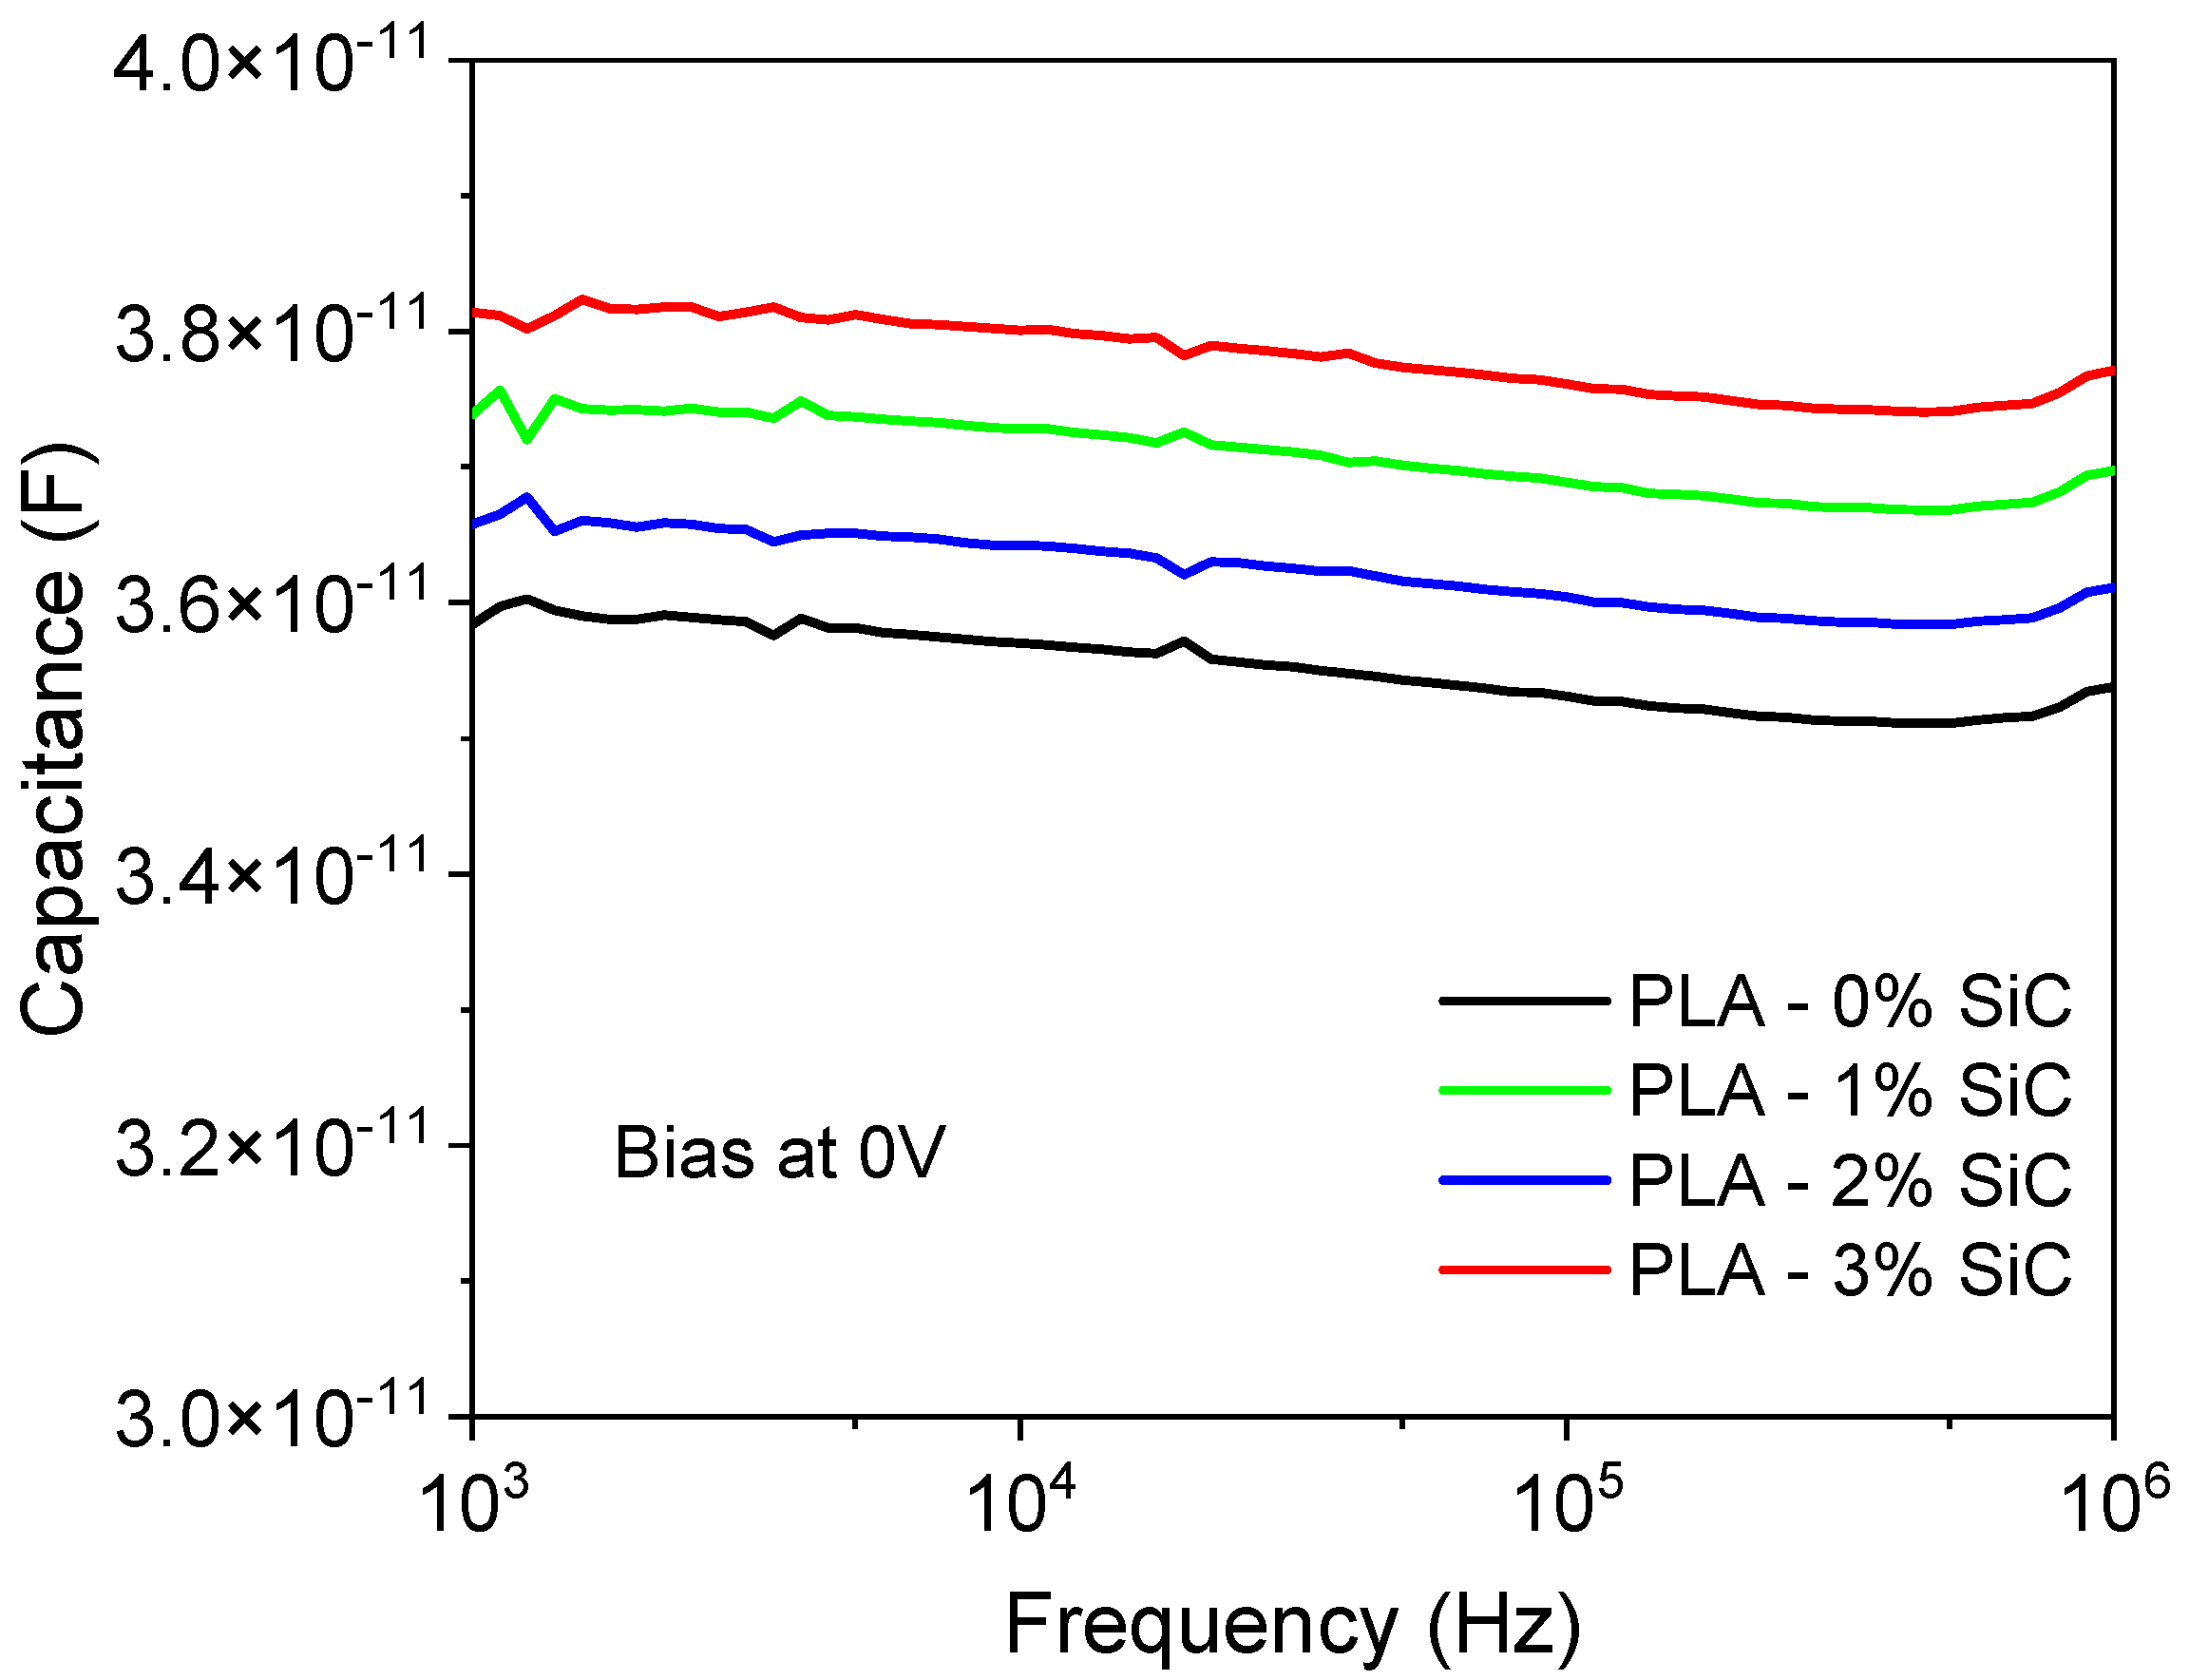
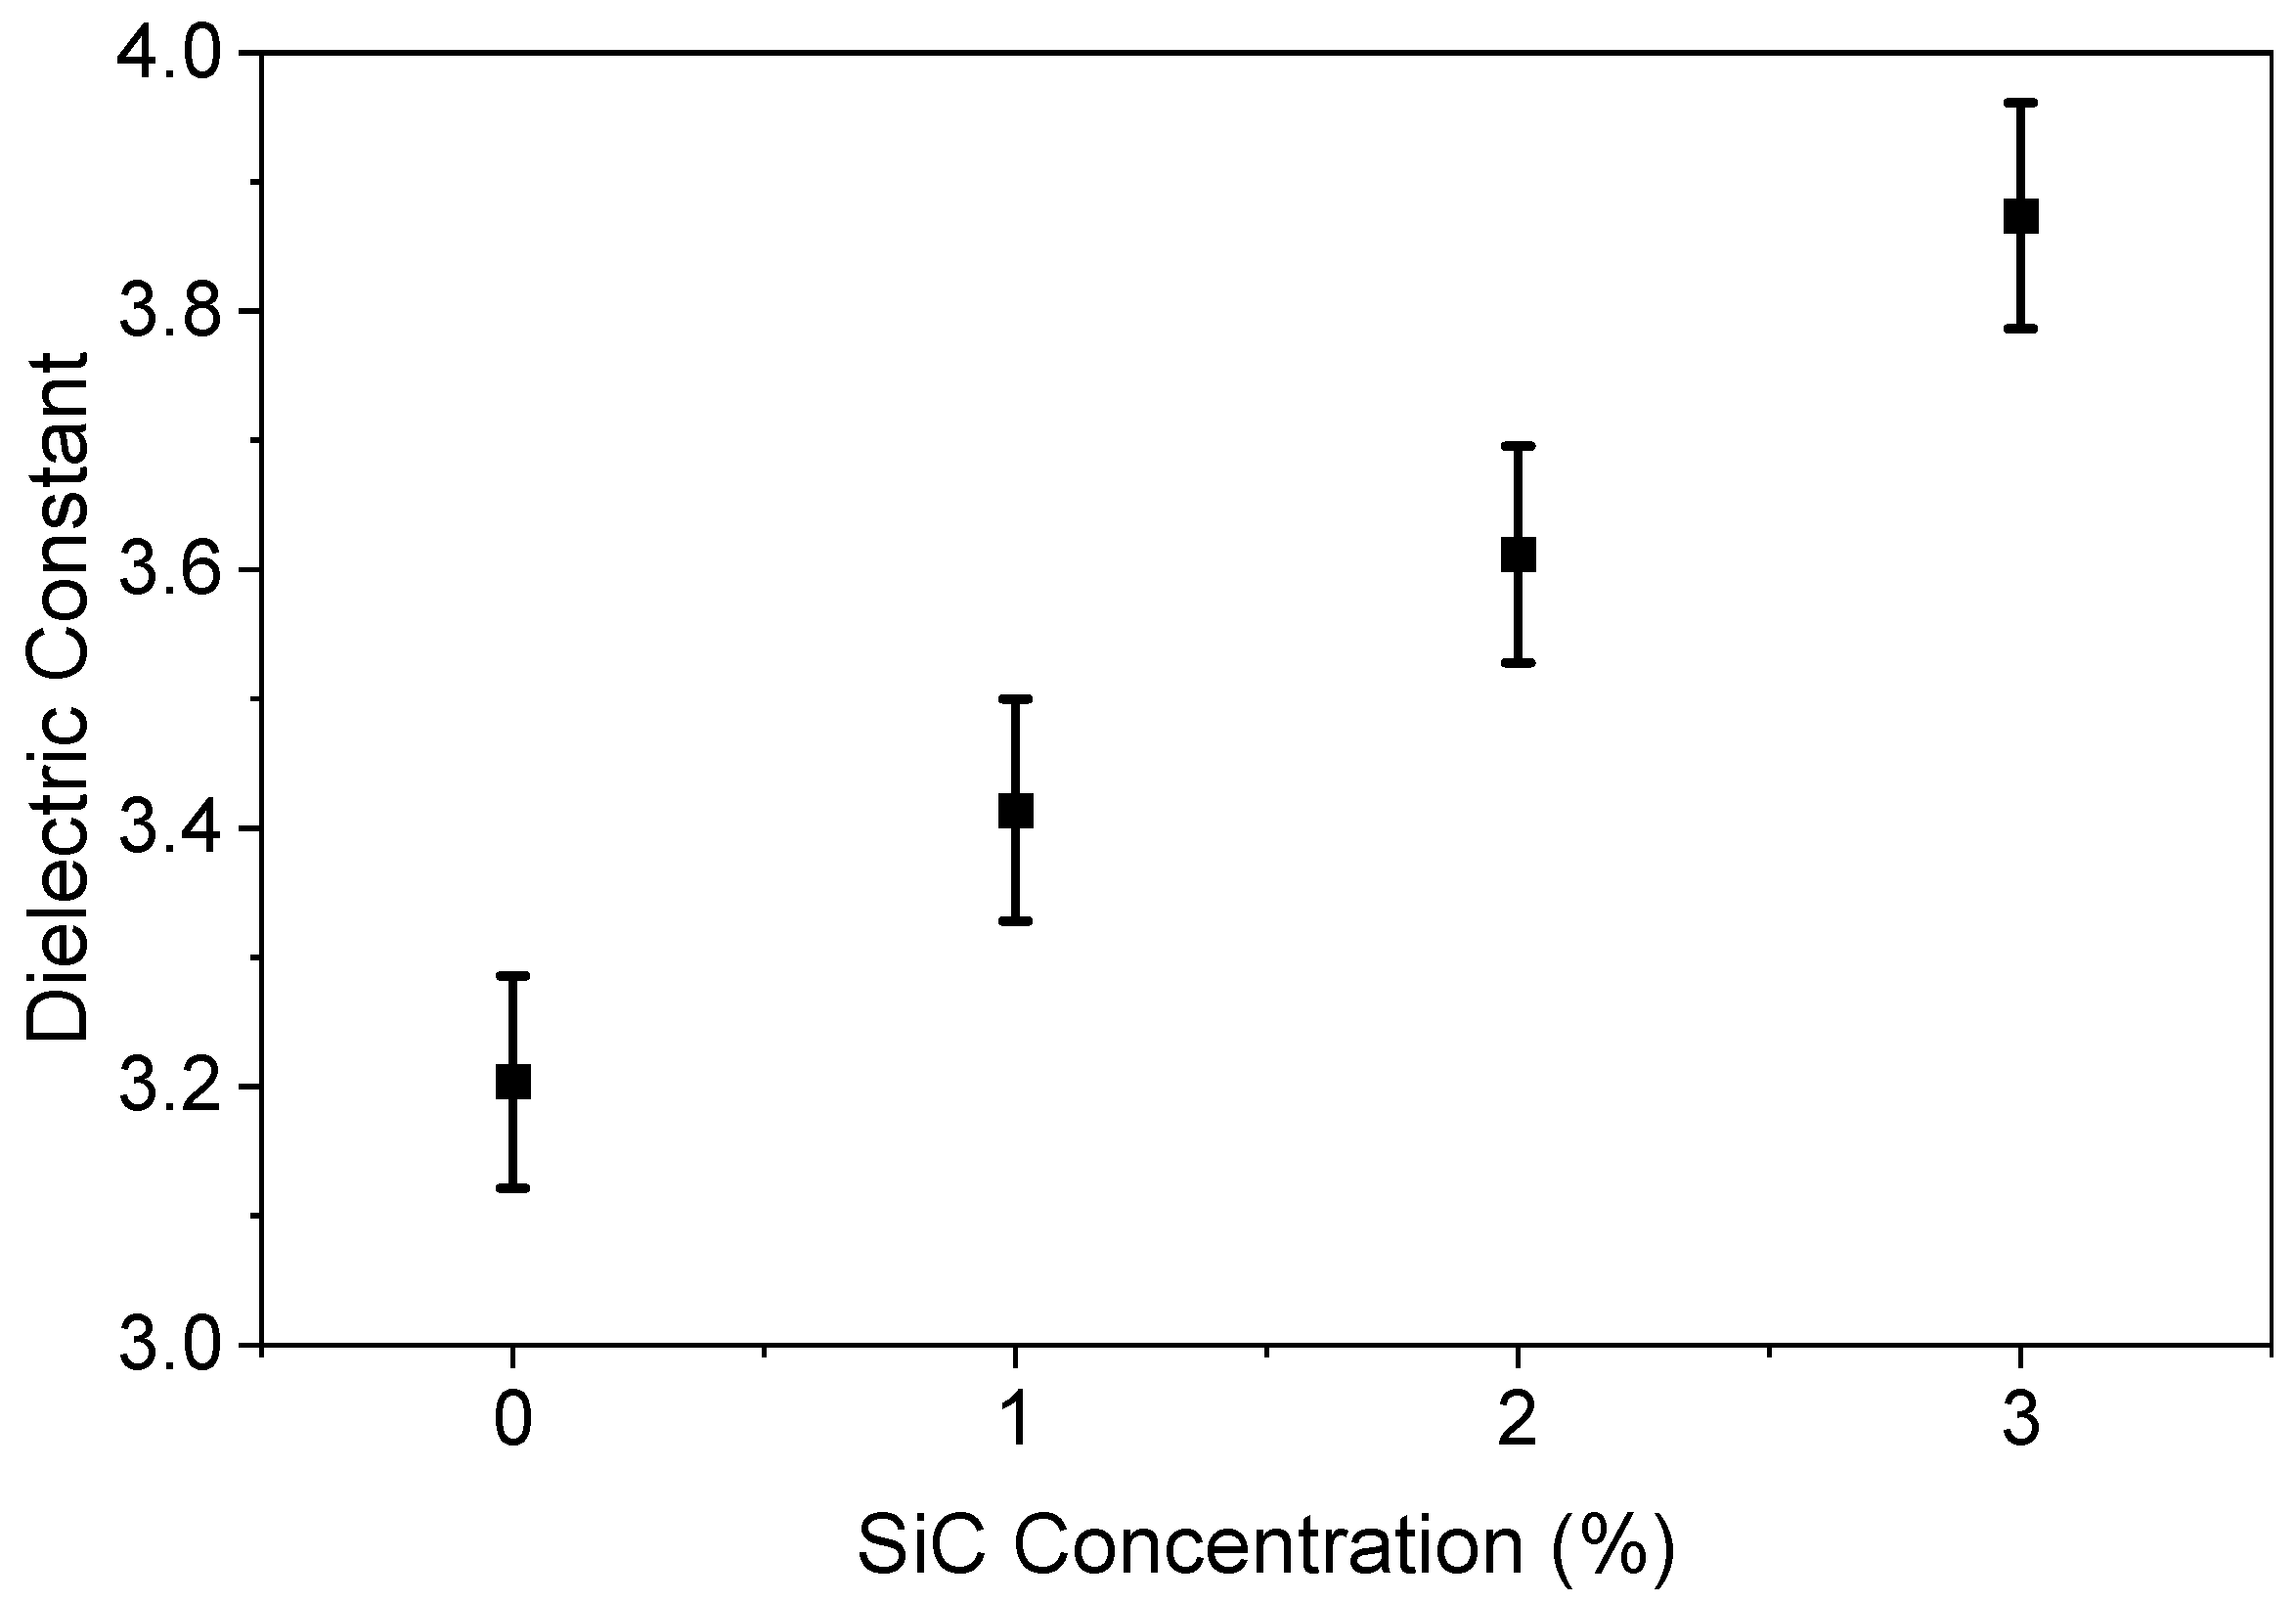
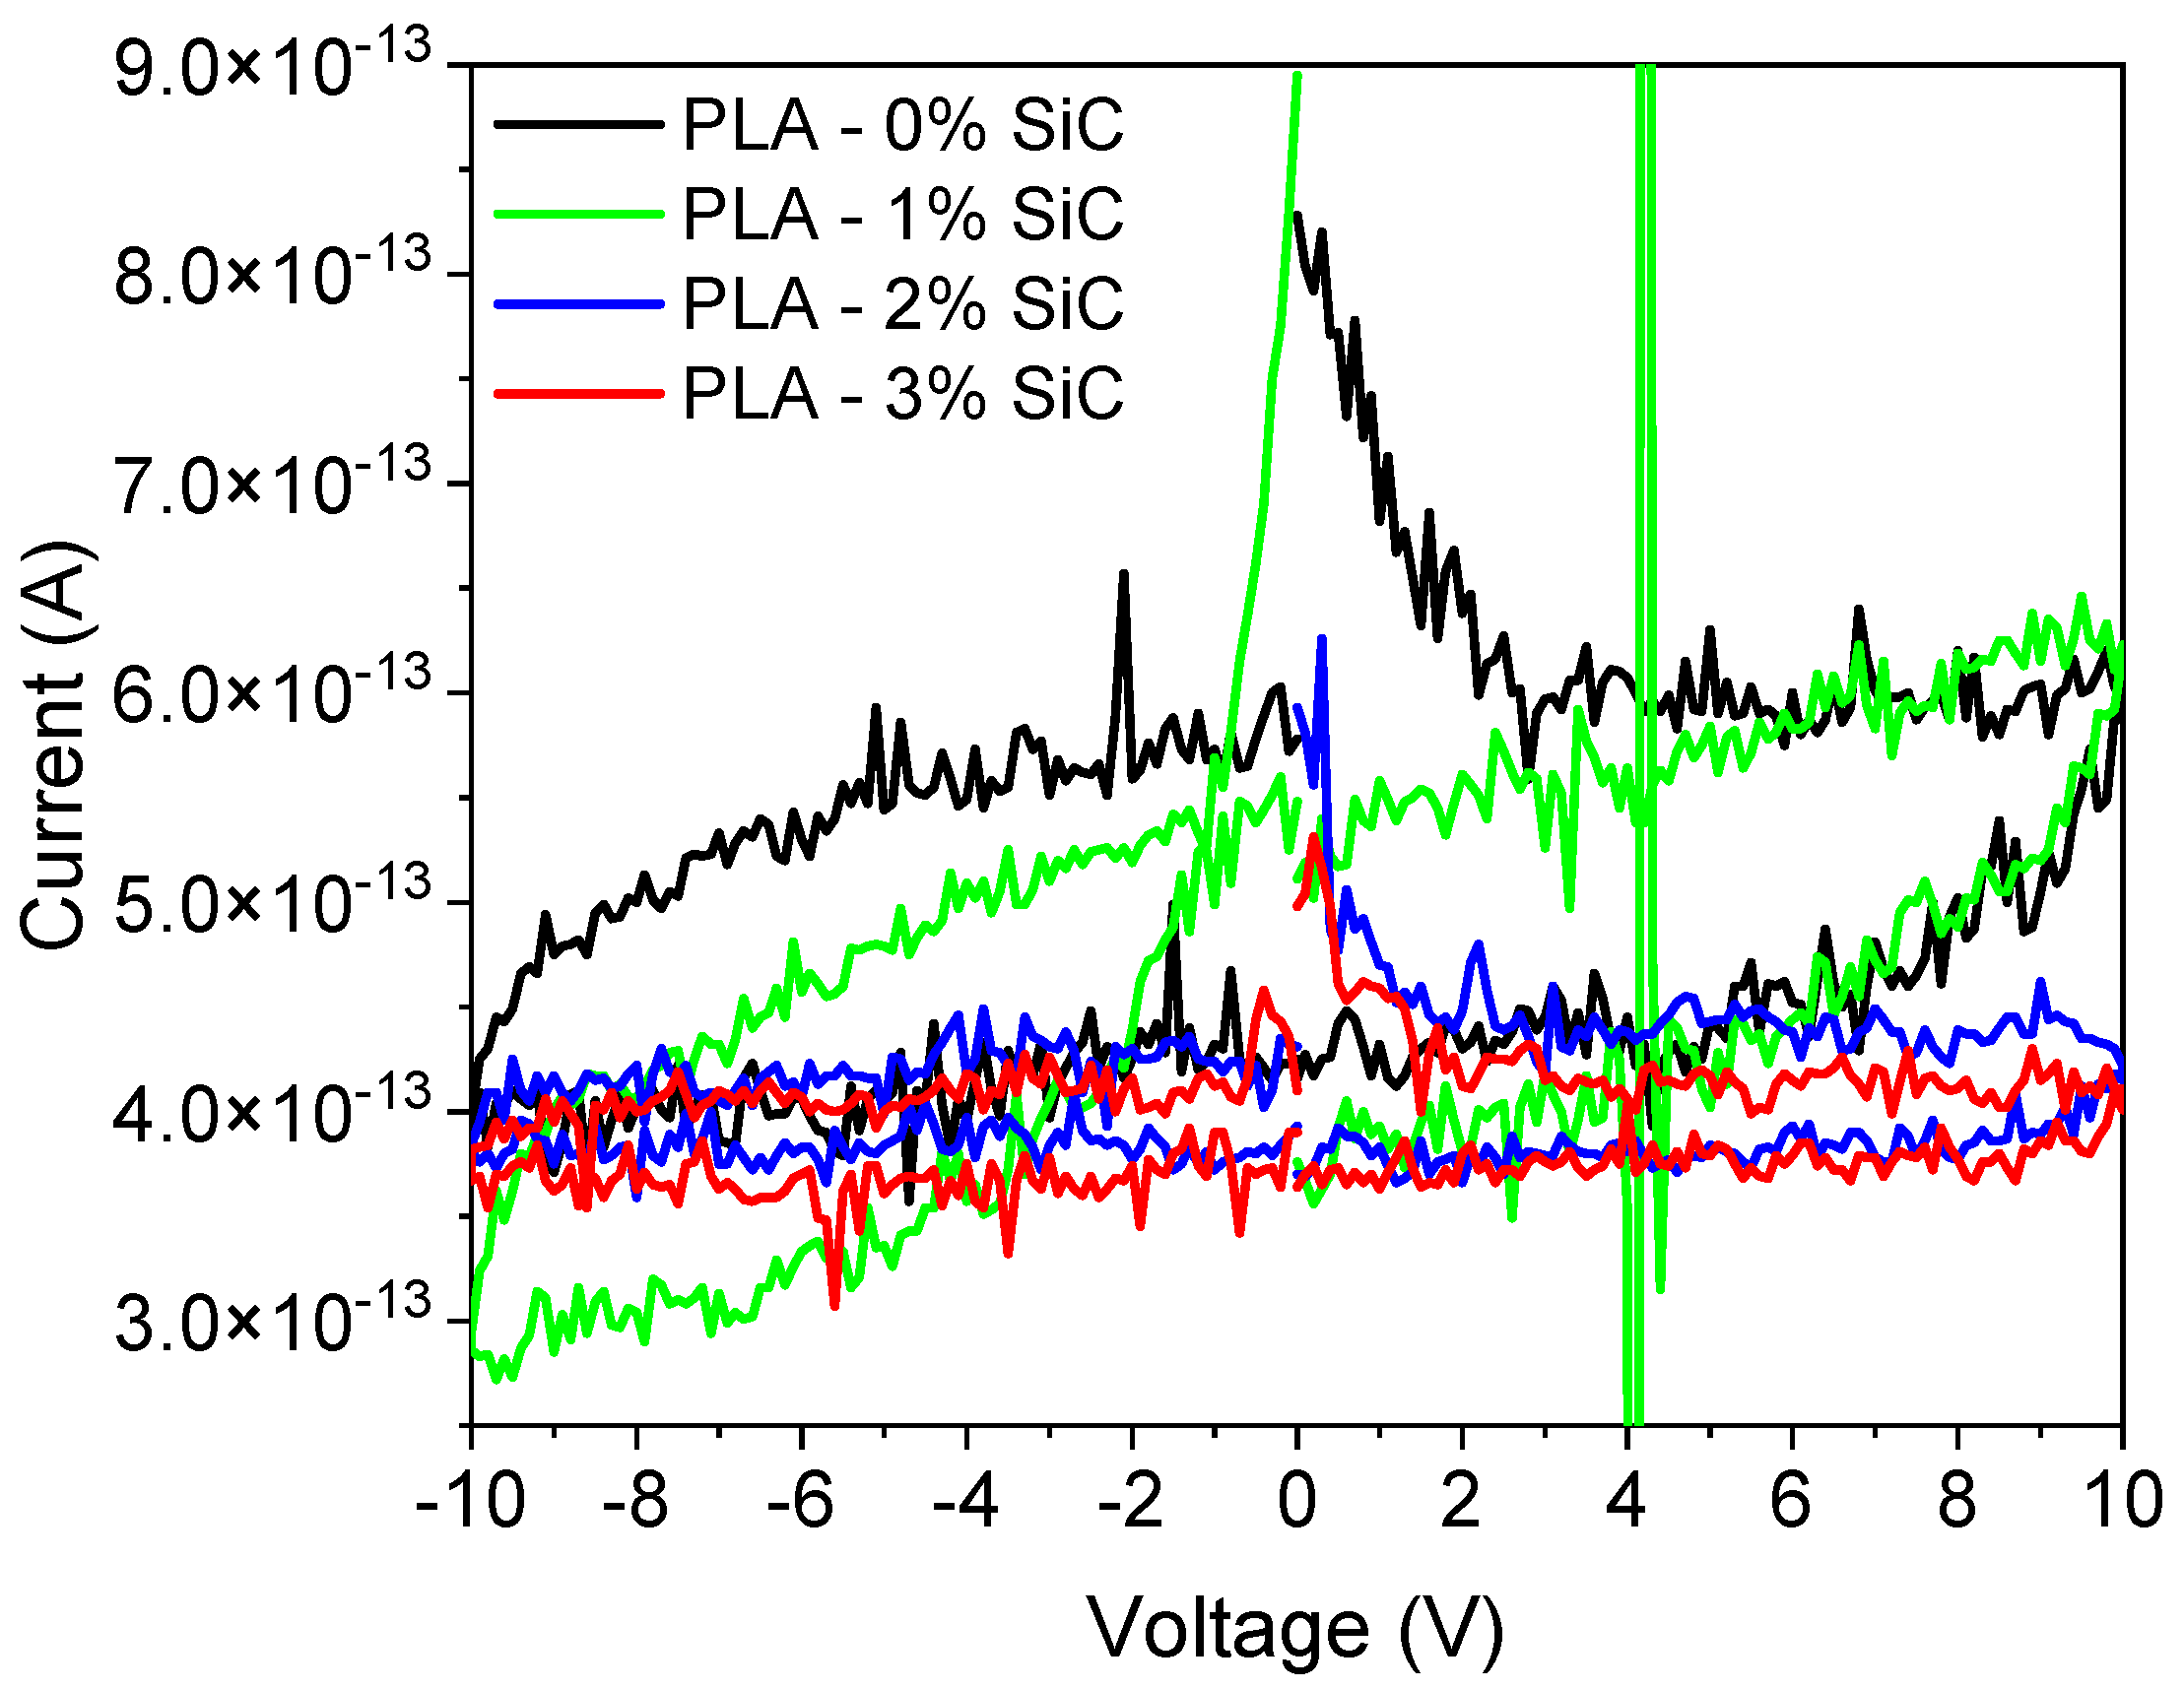
2.4. Electrical Characterization

Samples were characterized electrically using a probe station (Figure 3) for the electrical contacts. Capacitance measurements were performed using an HP 4284A LCR meter (Hewlett-Packard, Palo Alto, CA, USA). Measurements were performed for frequencies ranging from 1 kHz to 1 MHz and for biases ranging from 0 V to ±2 V. Leakage current measurements were performed using an HP4140B pA meter (Hewlett-Packard, Palo Alto, CA, USA).
Capacitance measurements were used to calculate each specimen’s dielectric constant using the following equation:
C x = ε ο · ε x · A d
where Cx is the measured capacitance, εo = 8.854 × 10⁻¹² CV−1 m−1 is the dielectric permittivity of vacuum, εx is the composite material dielectric constant, A is the capacitor area and d is the material thickness.

2.5. Optical Characterization

For the optical characterization of the PLA-SiC composite samples, a SPECORD PLUS UV/Vis spectrometer from AnalytikJena (Jena, Germany) was used, along with its integrating sphere component which allows for the characterization of solid samples. The samples measured were PLA-SiC disks with 0%, 1%, 1.5%, 2%, 2.5% and 3% wt. SiC with 15 mm diameter and 5 mm thickness. Reflectance spectra were collected for all samples in the range between 200 nm and 450 nm.

3. Results and Discussion

3.1. Microstructural Characterization
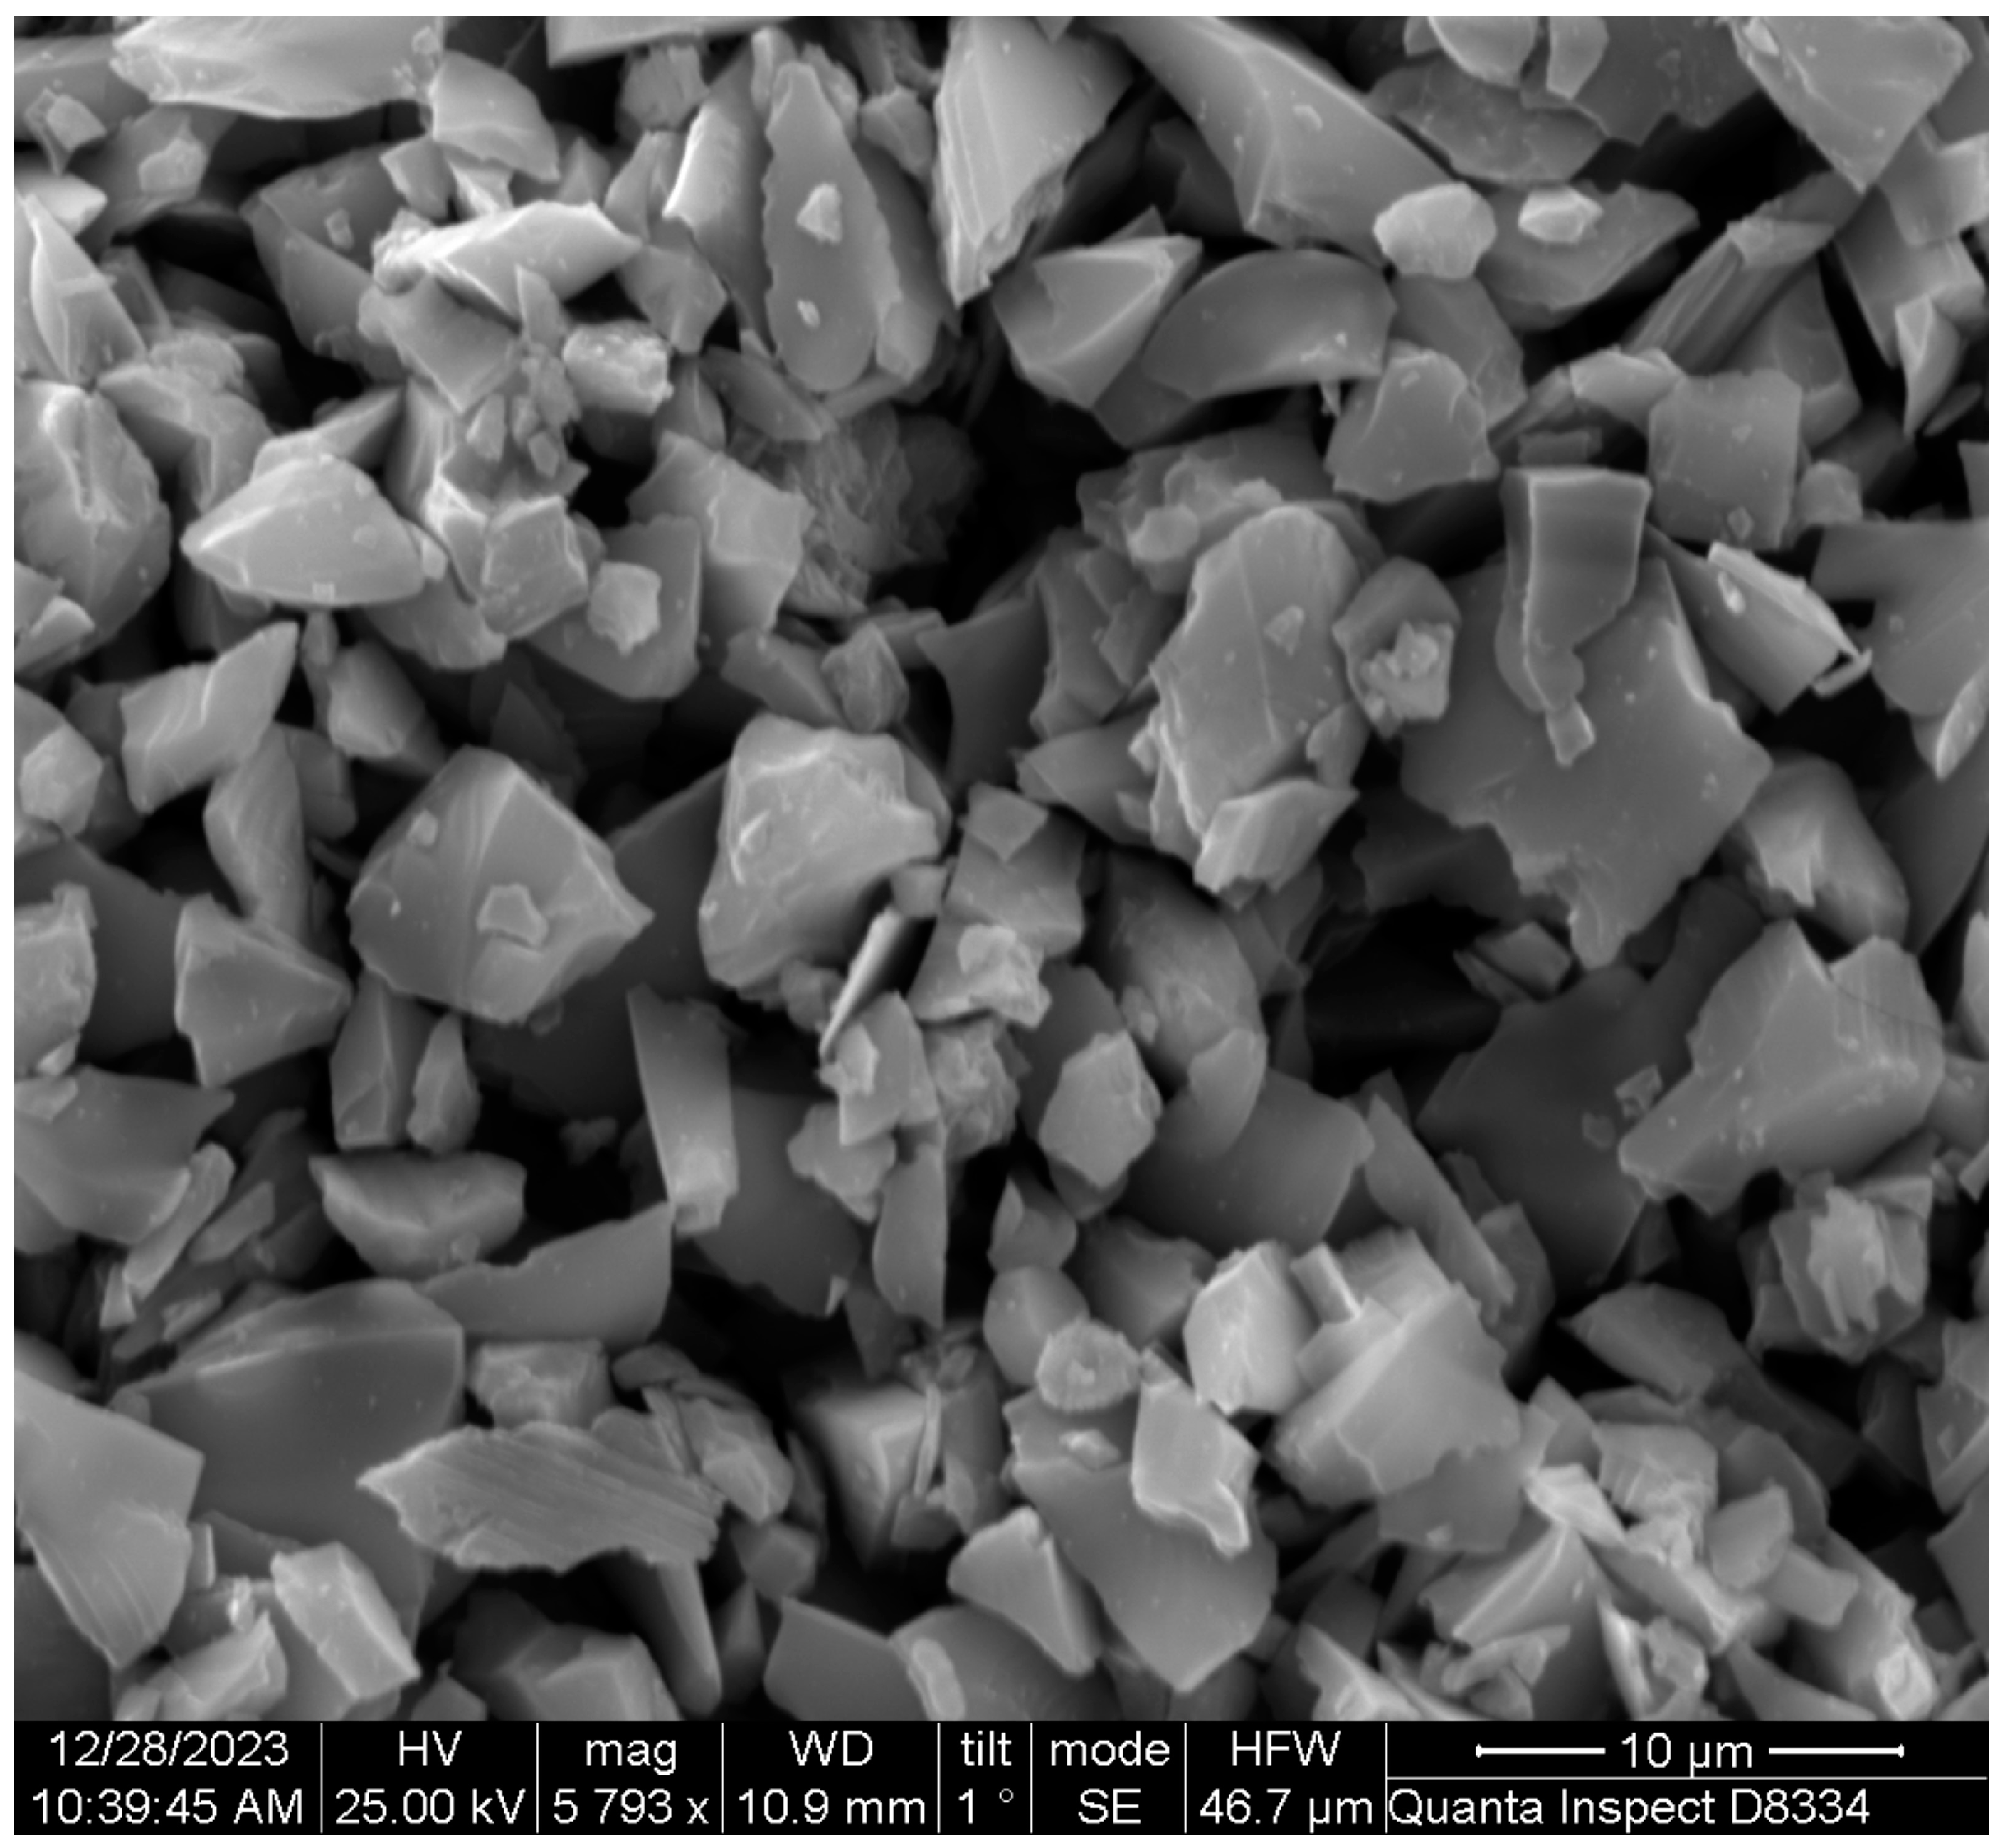
3.1.1. SiC Powder

The microstructure of the SiC powder is shown in the SEM micrograph in Figure 4. The powder is irregular and angular with a maximum grain size (largest dimension) of about 8.3 μm corresponding to a mesh size of #1200.
A quantitative assessment of the grain size distribution based on the SEM micrographs showed that the powder had an average grain size of about 7 μm and a range of 4–8.3 μm.

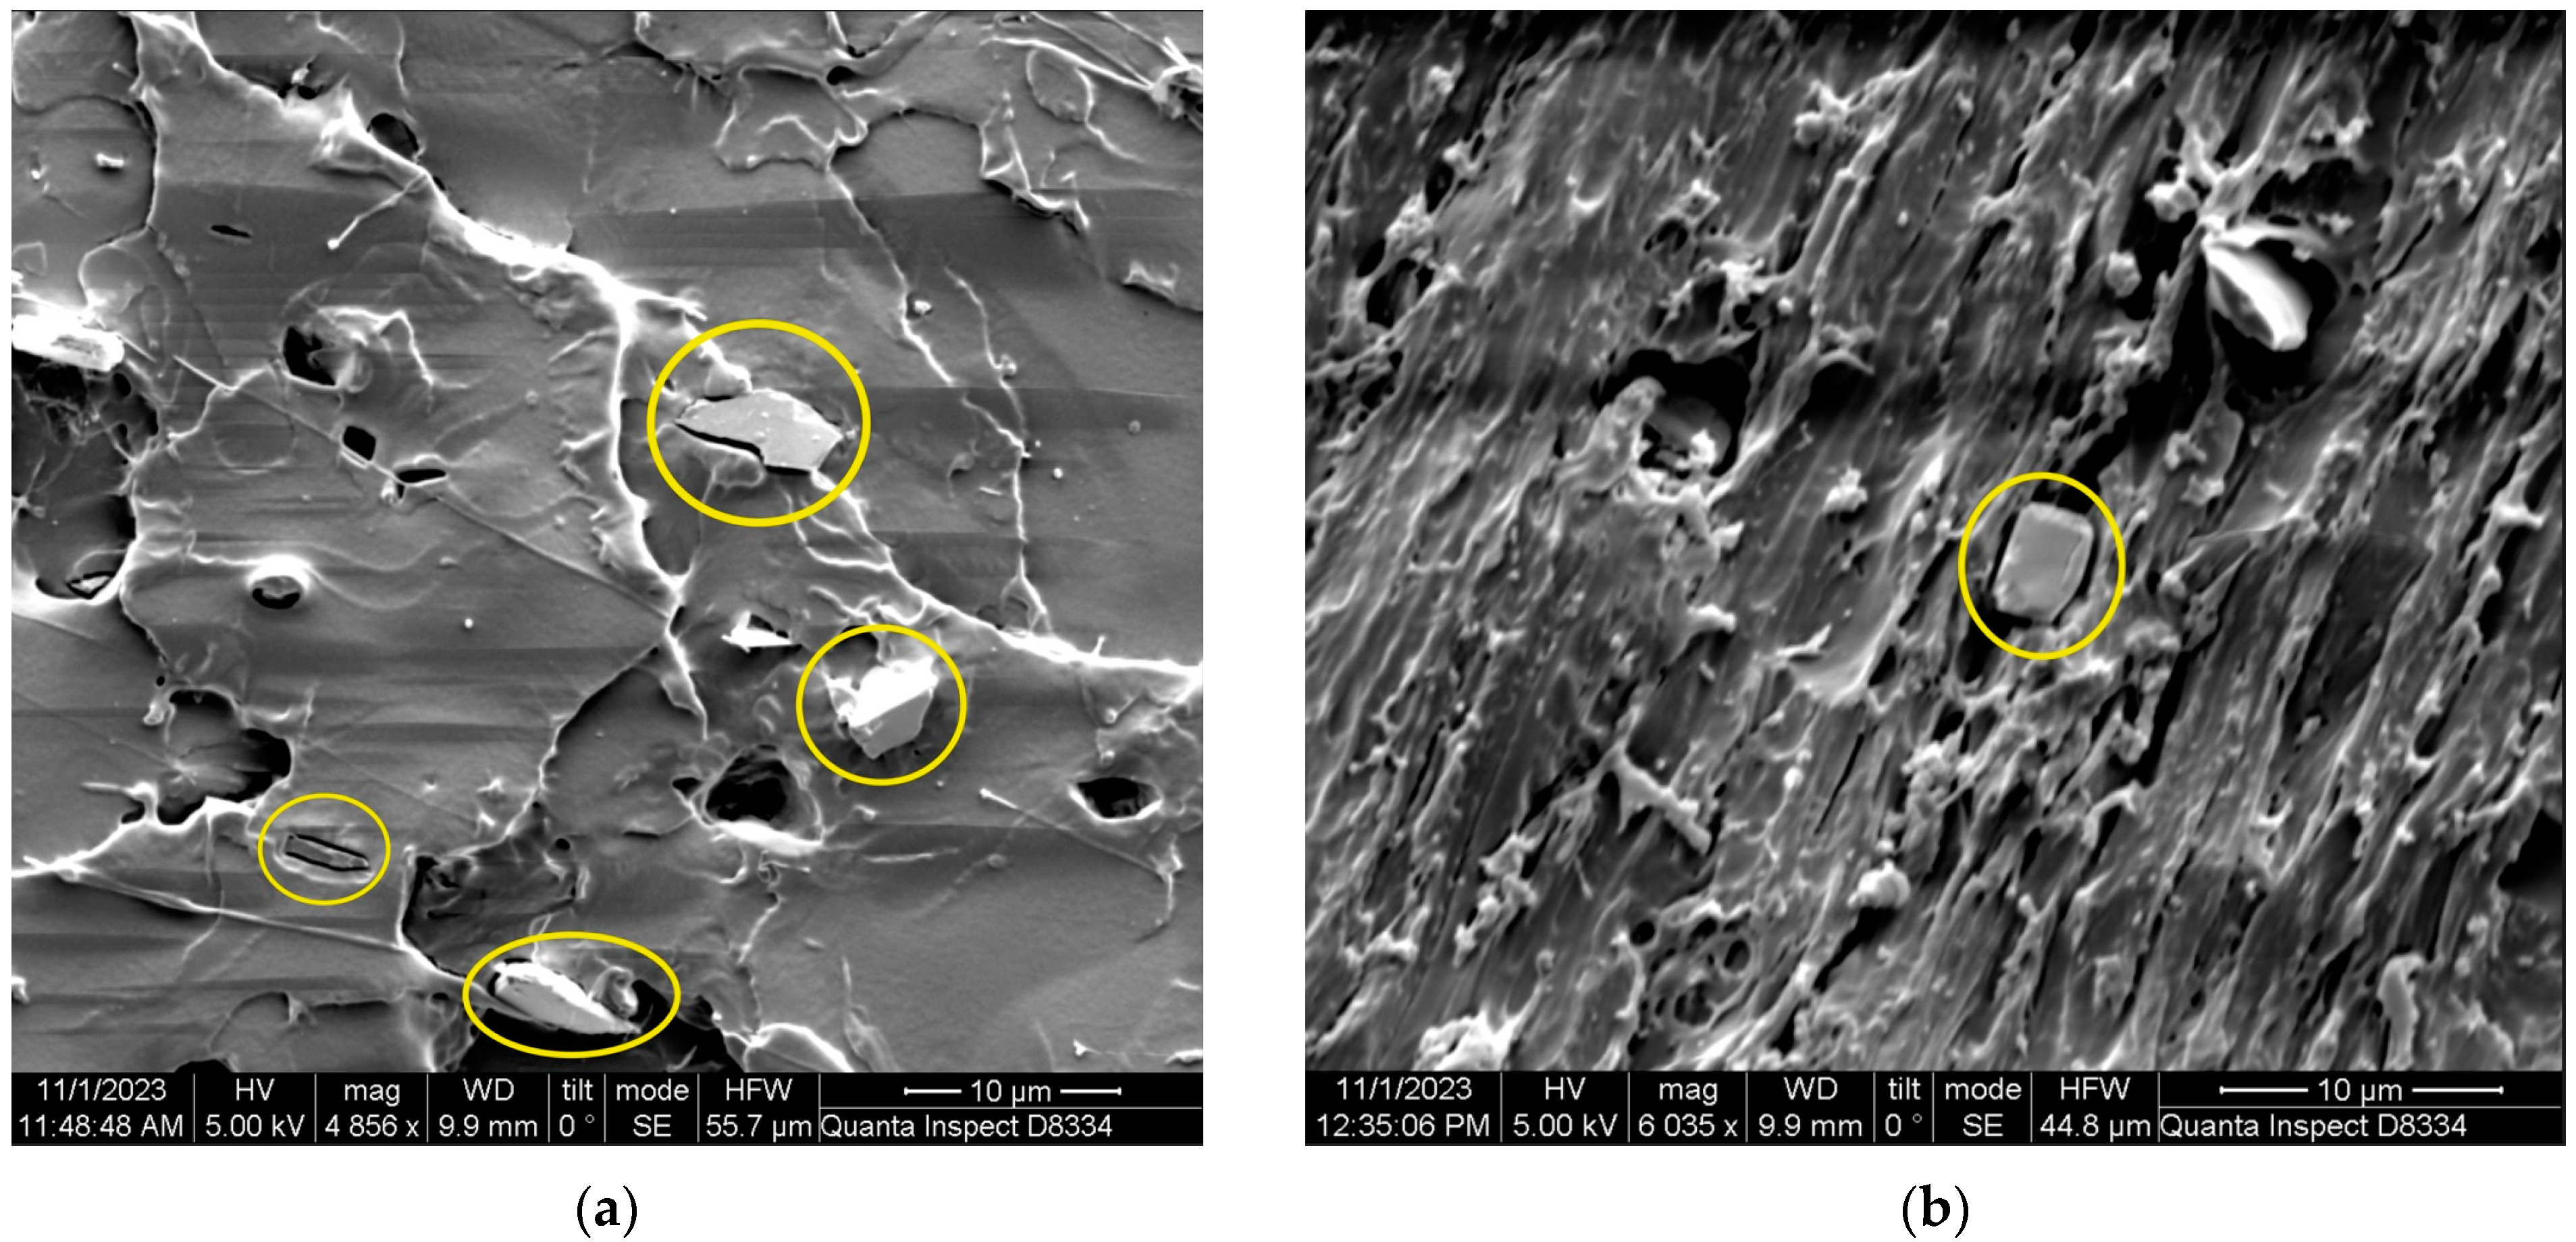
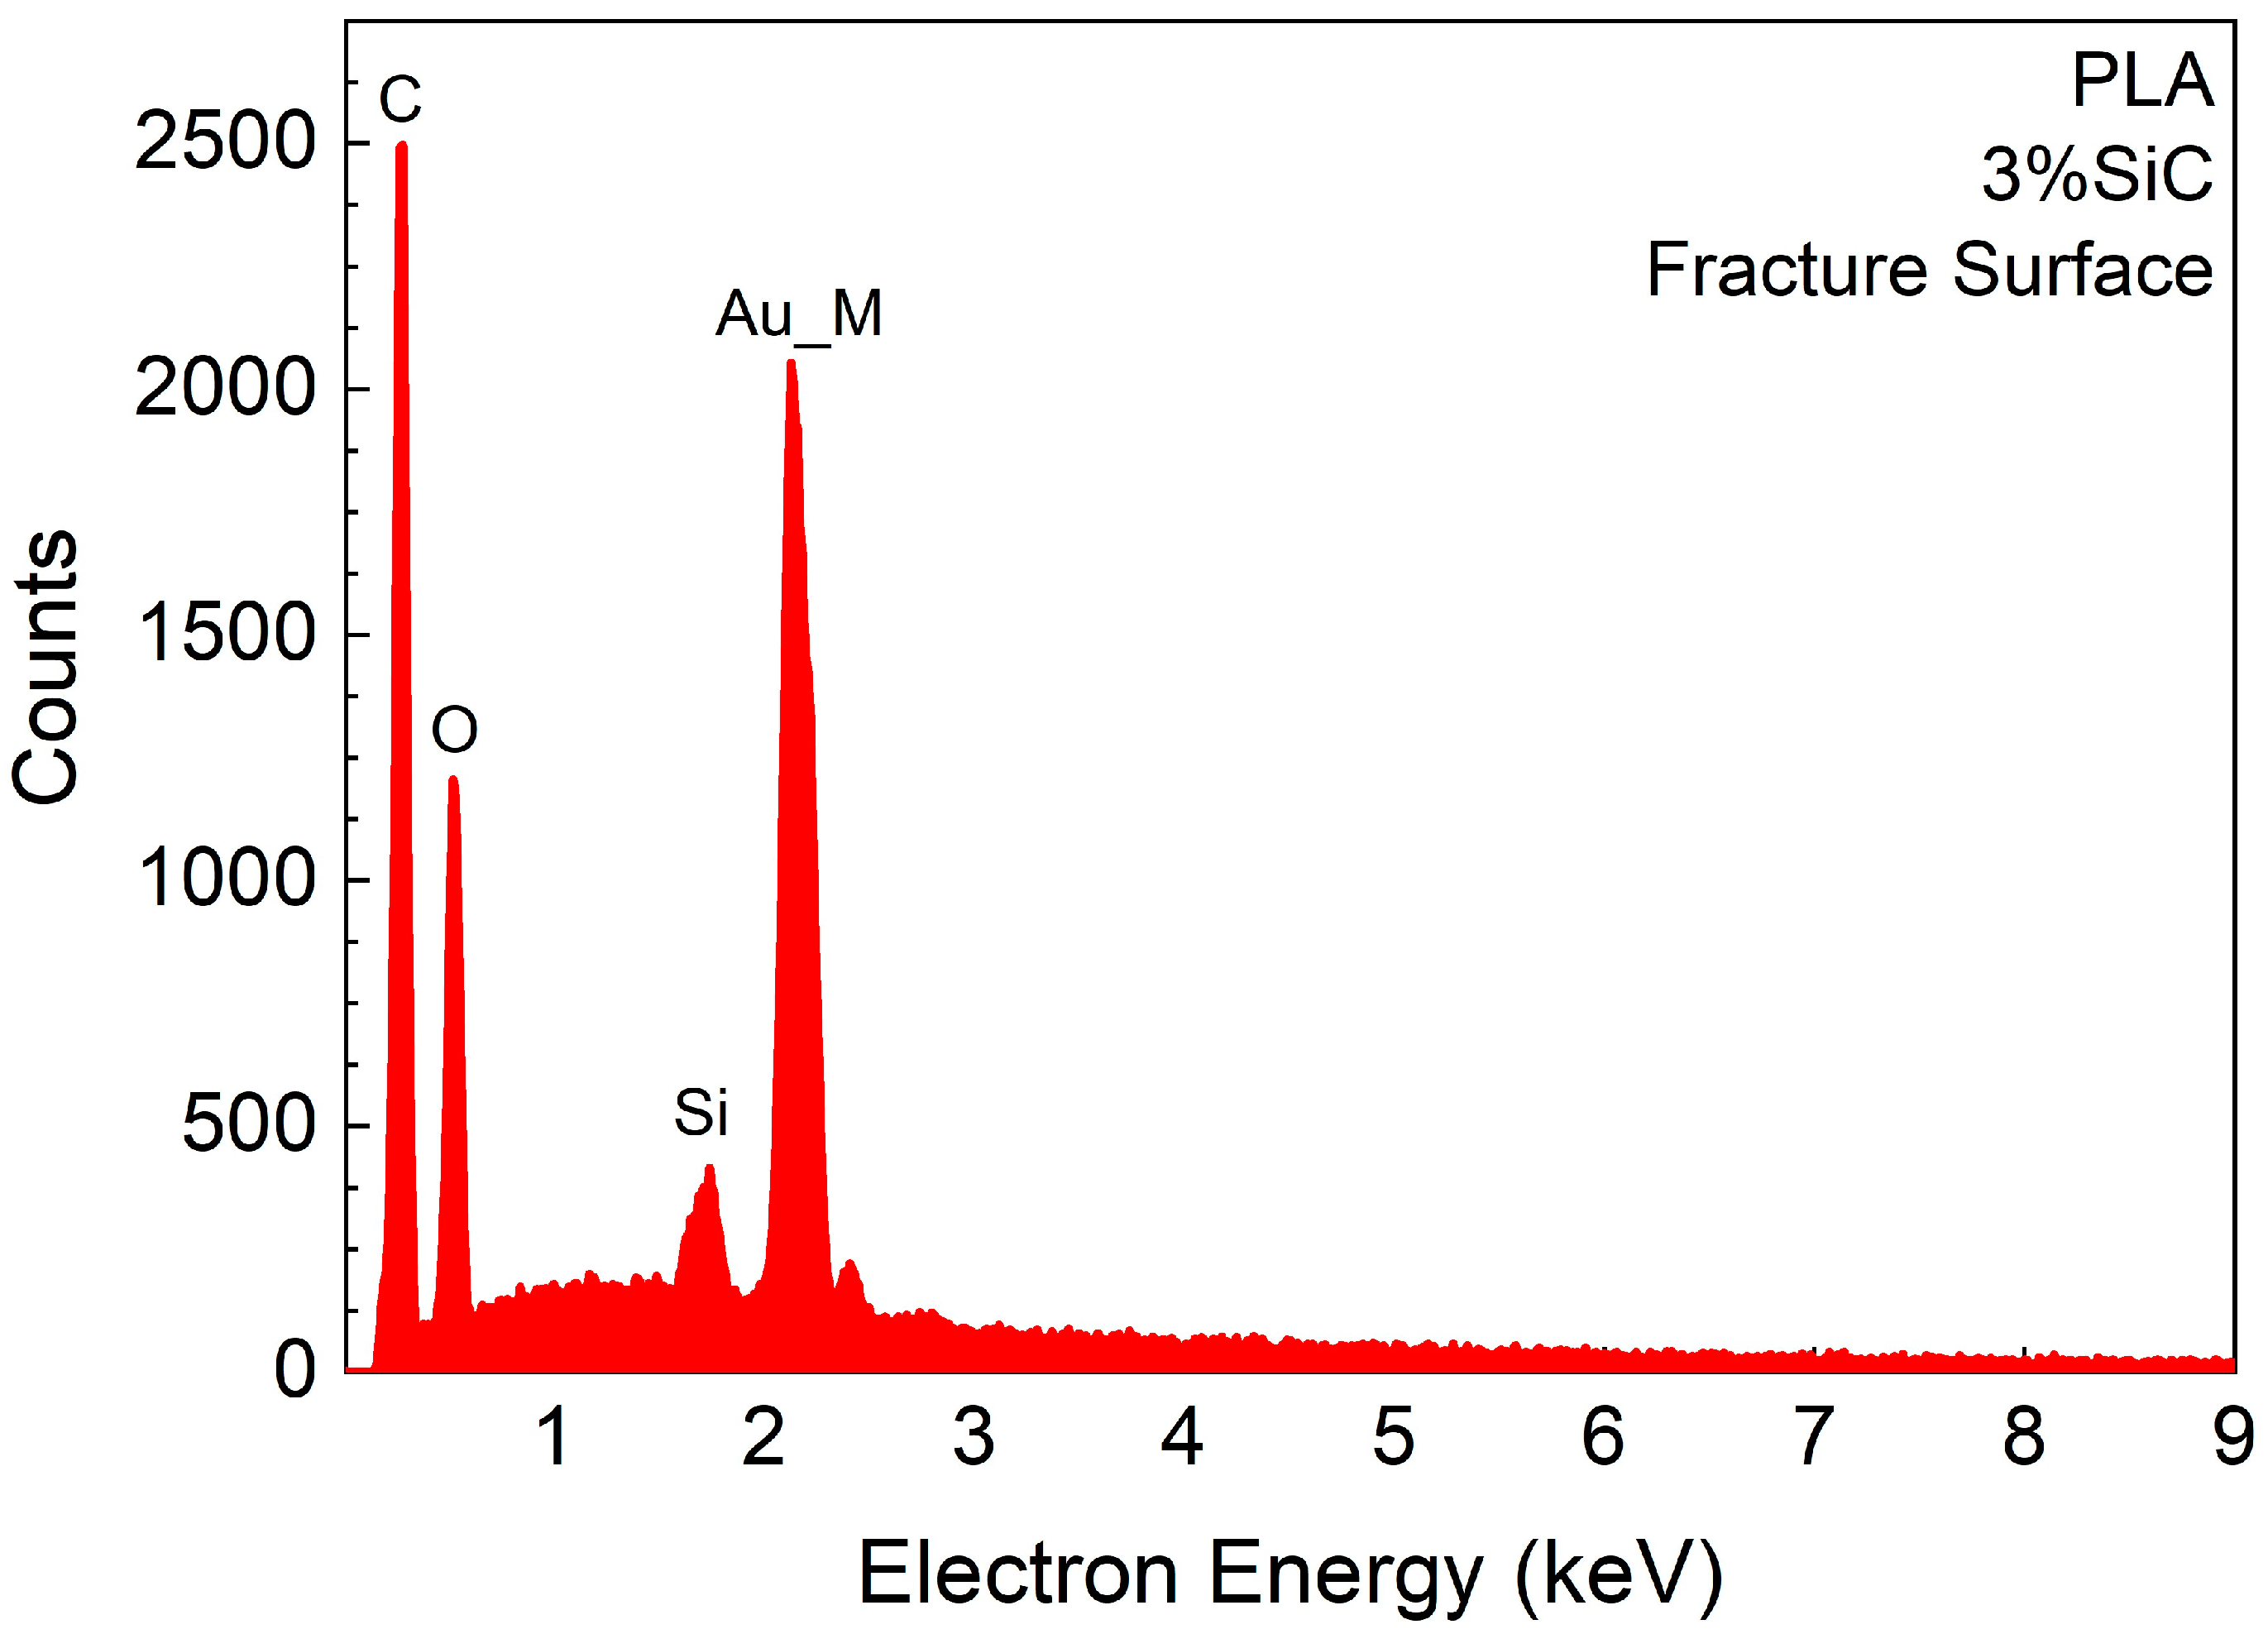
3.1.2. Fracture Surfaces

Typical fracture surfaces of a PLA-3%SiC specimen after fatigue and fracture in tension are shown in Figure 5. A predominantly quasi-ductile fracture is visible with some evidence of brittle fracture as evidenced by some fine striations (visible in Figure 5a). The SiC particles are well coated by the PLA but occasionally they are exposed as in Figure 5b.
A semi-quantitative estimation of the areal density of SiC on the surface of the 3 wt% specimens indicated values of between 1 and 1.5 areal% which is in a general agreement with the 1.3 vol% of SiC calculated for such materials.
An EDX spectrum of a PLA-3%SiC specimen at low (×100) magnification is shown in Figure 6 where the Si peak is partly covered and slightly obscured by a gold peak.

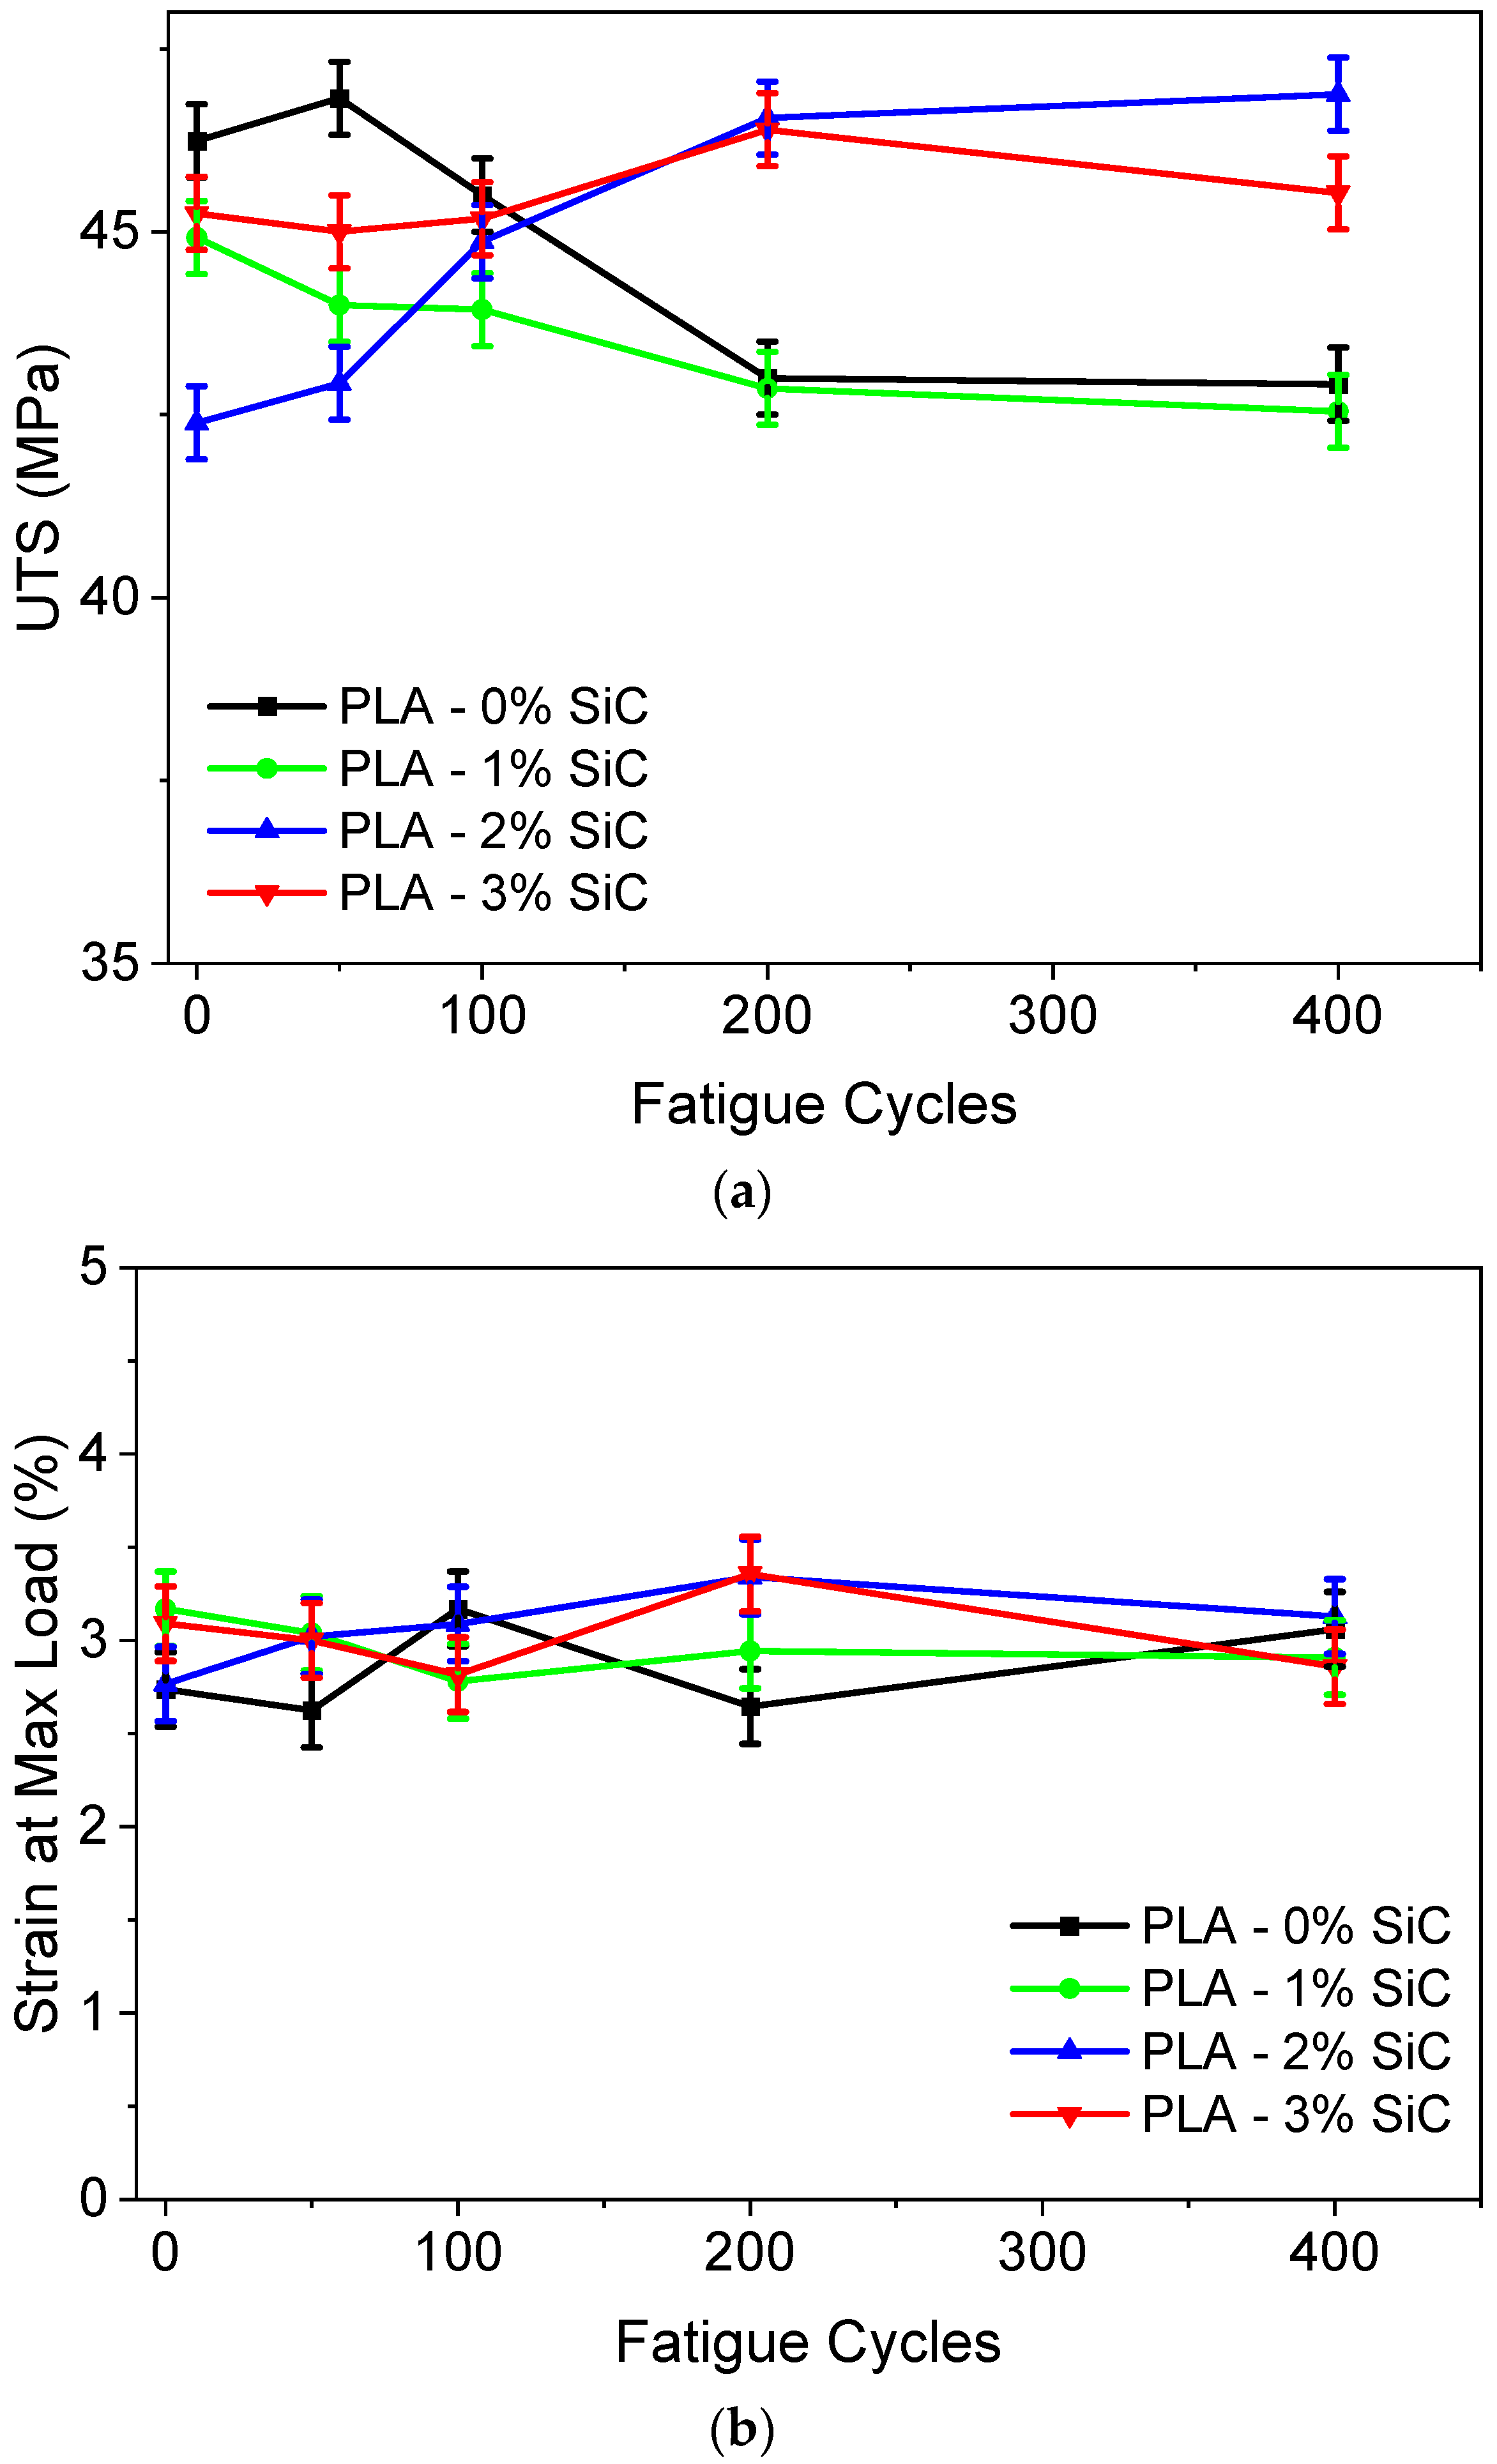
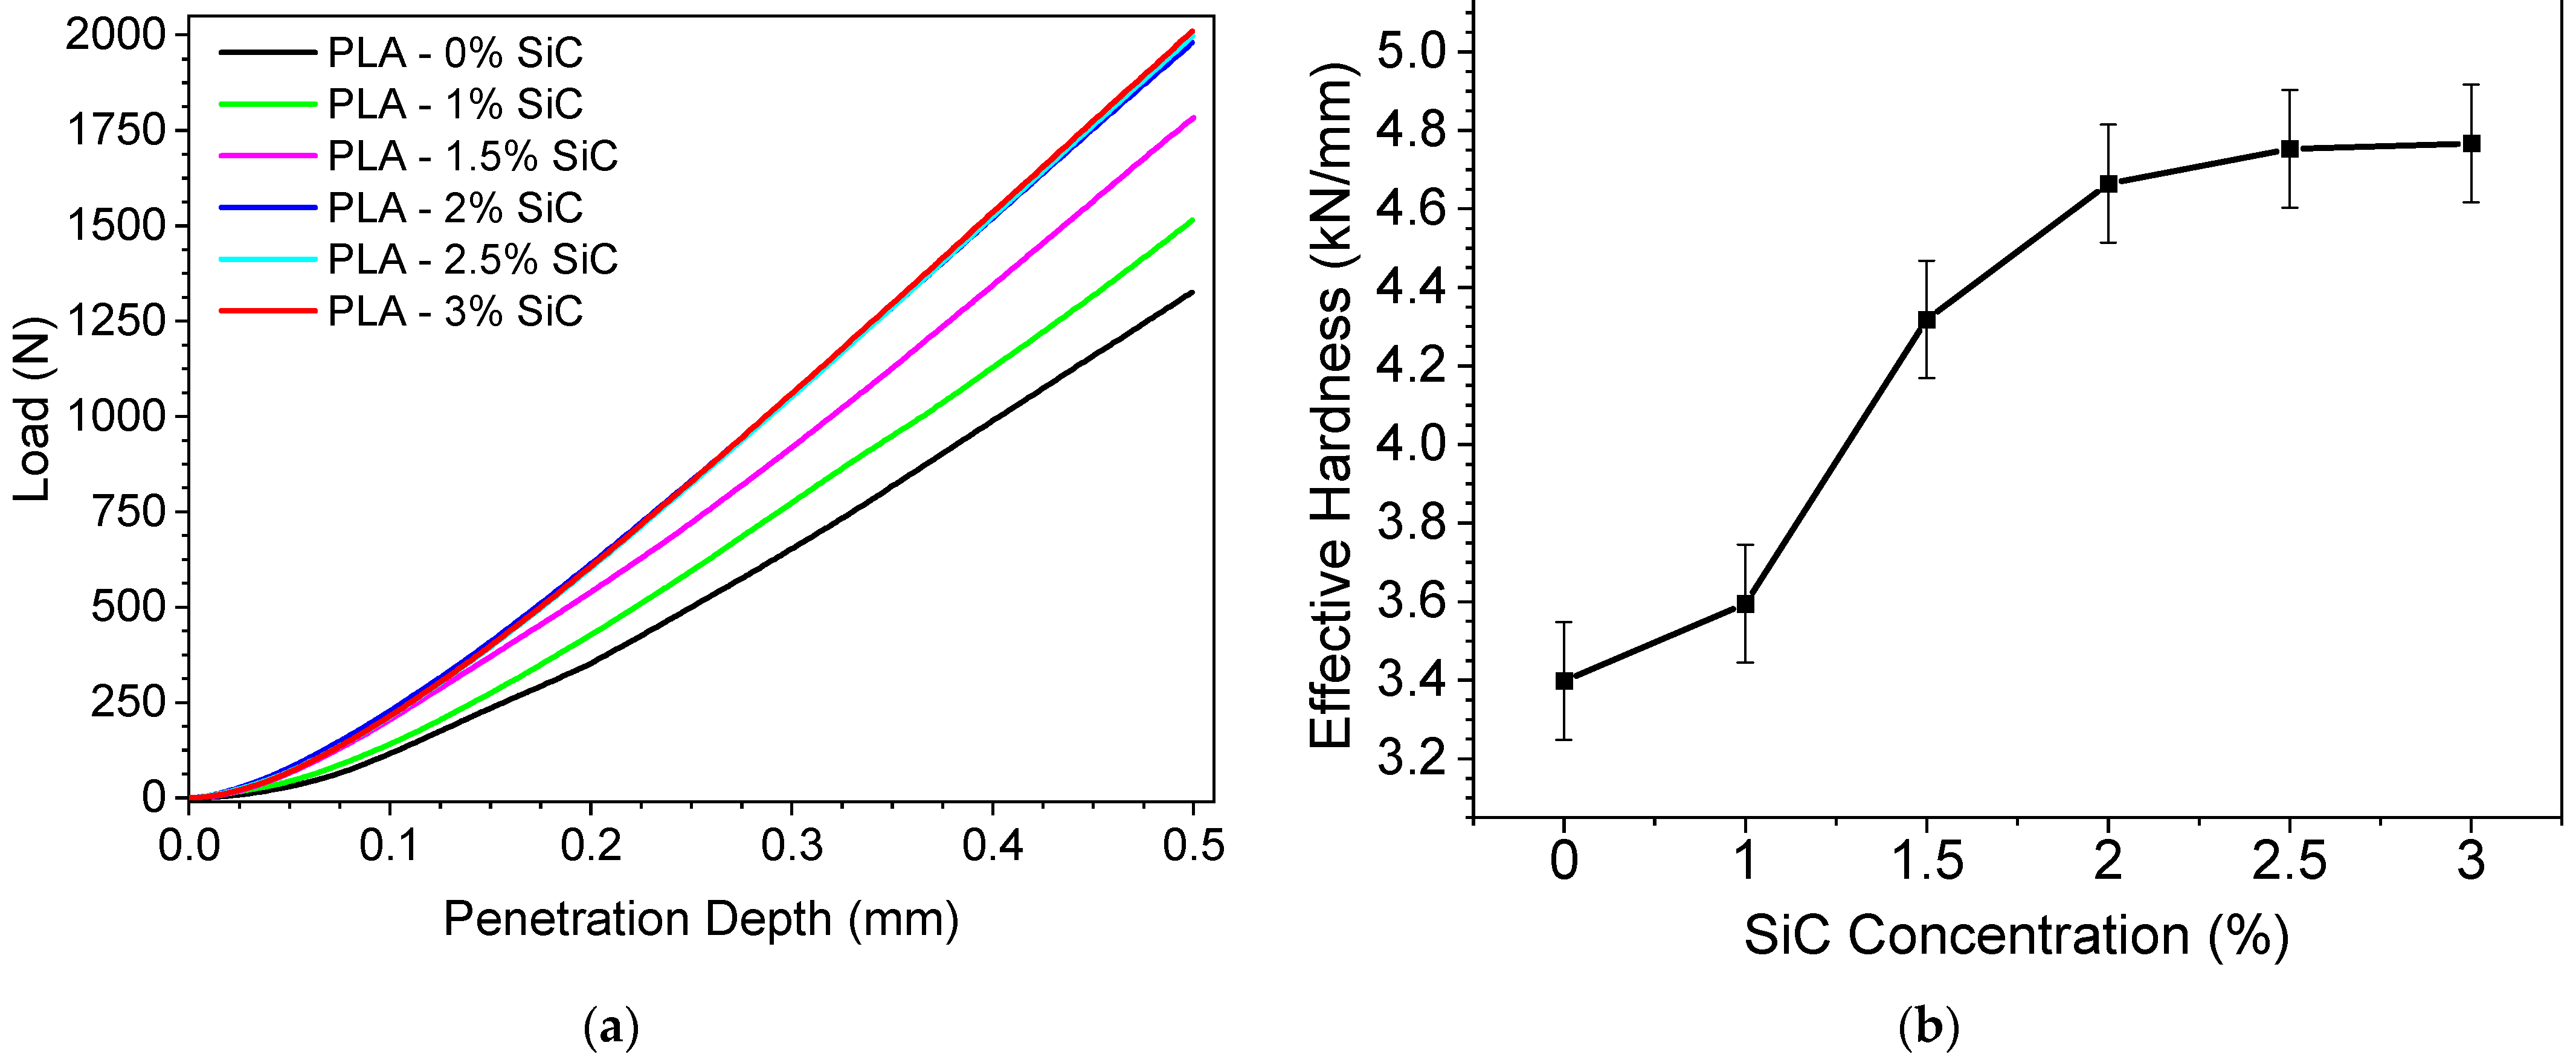
3.2. Mechanical Characterization

At least five specimens with up to 3 wt% SiC were tested under tensile loading before and after mixed-mode fatigue and the results are shown in Figure 7a (Ultimate tensile strength, UTS) and Figure 7b (Strain at maximum load). The UTS appears to decrease with the number of fatigue cycles by about 10% after about 100 cycles for pure PLA and 1%SiC, probably by the accumulation of fine microcracks which results in localized stress concentrations. On the other hand, UTS appears to increase by about 10% after about 100 cycles when SiC doping increases to 2% or 3%, possibly because of the entanglement of microcrack networks with the SiC particles which can reduce the localized stress concentrations by localized blunting of the main crack. In addition, at SiC contents greater or equal to about 2%, the tangles of SiC particles can act as “anchors” for any microcracks growing during fatigue, delaying their development.
The strain at maximum load of the PLA composite is shown in Figure 7b. In all cases, the strain at the maximum load was about 3% and no significant difference in strain was found in up to 400 cycles of mixed-mode fatigue. This indicates that no or few significant microcracks are generated by mixed-mode fatigue in these materials, at least up to 400 cycles.
The results obtained for Hertzian ball compression are shown in Figure 8a (average load–depth curves) and Figure 8b (average gradients). The gradient (calculated between 0.3 and 0.45 mm penetration depth for all curves) of the load–depth curves can be considered as a measure of “effective hardness”, i.e., plastic deformation and the results indicate that the effective hardness increases after about 1–1.5%, with SiC reaching a plateau at about 2 wt% SiC, about 40% above the value for pure PLA.
The increase in effective hardness after about 1–1.5% SiC is probably due to the obstacles presented by the networks of SiC particles to the plastic deformation of the PLA matrix. At only 1% the SiC particles are possibly too far from each other to form continuous networks, but by 1.5% the particles are close enough to each other to present relative barriers to further plastic deformation, increasing hardness.
The increase in effective hardness observed for SiC doping greater than about 1% are confirmed by measurements of Shore D hardness shown in Figure 9a as well as abrasion resistance in Figure 9b. Shore D hardness is relatively unaffected up to about 1% SiC but increases sharply thereafter and reaches a plateau at about 2% SiC. On the other hand, abrasion resistance increases sharply even with as little as 1% SiC since SiC is much harder than PLA and it shields the PLA matrix from the abrading grains.

3.3. Electrical Characterization

A characteristic example of a capacitance versus frequency measurement at 0 bias voltage for all samples appears in Figure 10. It can be seen that the capacitance is almost constant, as expected for the frequency range of the measurements. Small variations of the capacitance of each sample are most probably due to the presence of interface charge traps between the PLA and Al. More importantly though, a distinct difference in measured capacitance exists between the samples.
Using the measured capacitance at 10 kHz, the dielectric constant for each sample was calculated using Equation (1). The results are presented in Figure 11. The error bars have been calculated using the error associated with the material thickness measurement.
A clear increase in dielectric constant with SiC concentration can be seen from Figure 11. The dielectric constant of PLA with 0% SiC is measured to be 3.2, which is a little higher than previously reported values ranging from 2.5 to 3.11 [21,22]. This value increases monotonically with SiC concentration to 3.9 for the PLA with the 3% SiC sample. Considering that the SiC has a dielectric constant of almost 15 [23], in its powder form, the observed increase in dielectric constant with SiC concentration is not surprising. In fact, this type of effect has been shown in the literature for a variety of material shapes [24].
The leakage current (I) as a function of applied voltage (V) for all samples is presented in Figure 12. The current was measured for voltage ramps starting at 0 V and increasing to +10 V and back to 0 V and then to −10 V and back to 0 V. The results presented in Figure 12 reveal that the magnitude of the leakage current is at the noise floor of our measurement system which is almost 5 × 10⁻¹³ A. We can then use our samples’ dimensions to calculate the resistivity of the PLA composites examined. By doing so, we conclude that the resistivity is larger than 6 × 10¹⁴ Ω·cm for all composites. This value is consistent with reports on the volume resistivity of pure PLA ranging from 5 × 10¹⁴ Ω·cm [24] up to 4 × 10¹⁷ Ω·cm [25].
Another interesting observation concerning the leakage current is that there is a hysteresis of the current voltage curves with respect to applied bias. This hysteresis must be due to charge trapping within the PLA material. Interestingly, the addition of SiC seems to reduce the perceived trapping without increasing the leakage current and, thus, the volume resistivity of the composite material. In fact, the resistivity seems to decrease with increasing SiC content, even though the measurements are very close to the noise floor of our instrumentation and the SiC content is smaller than usually reported additive contents [25,26]. We need to stress at this point that SiC is not a conducting material, which is a significant difference between these cases and other reported additives in PLA in the literature.

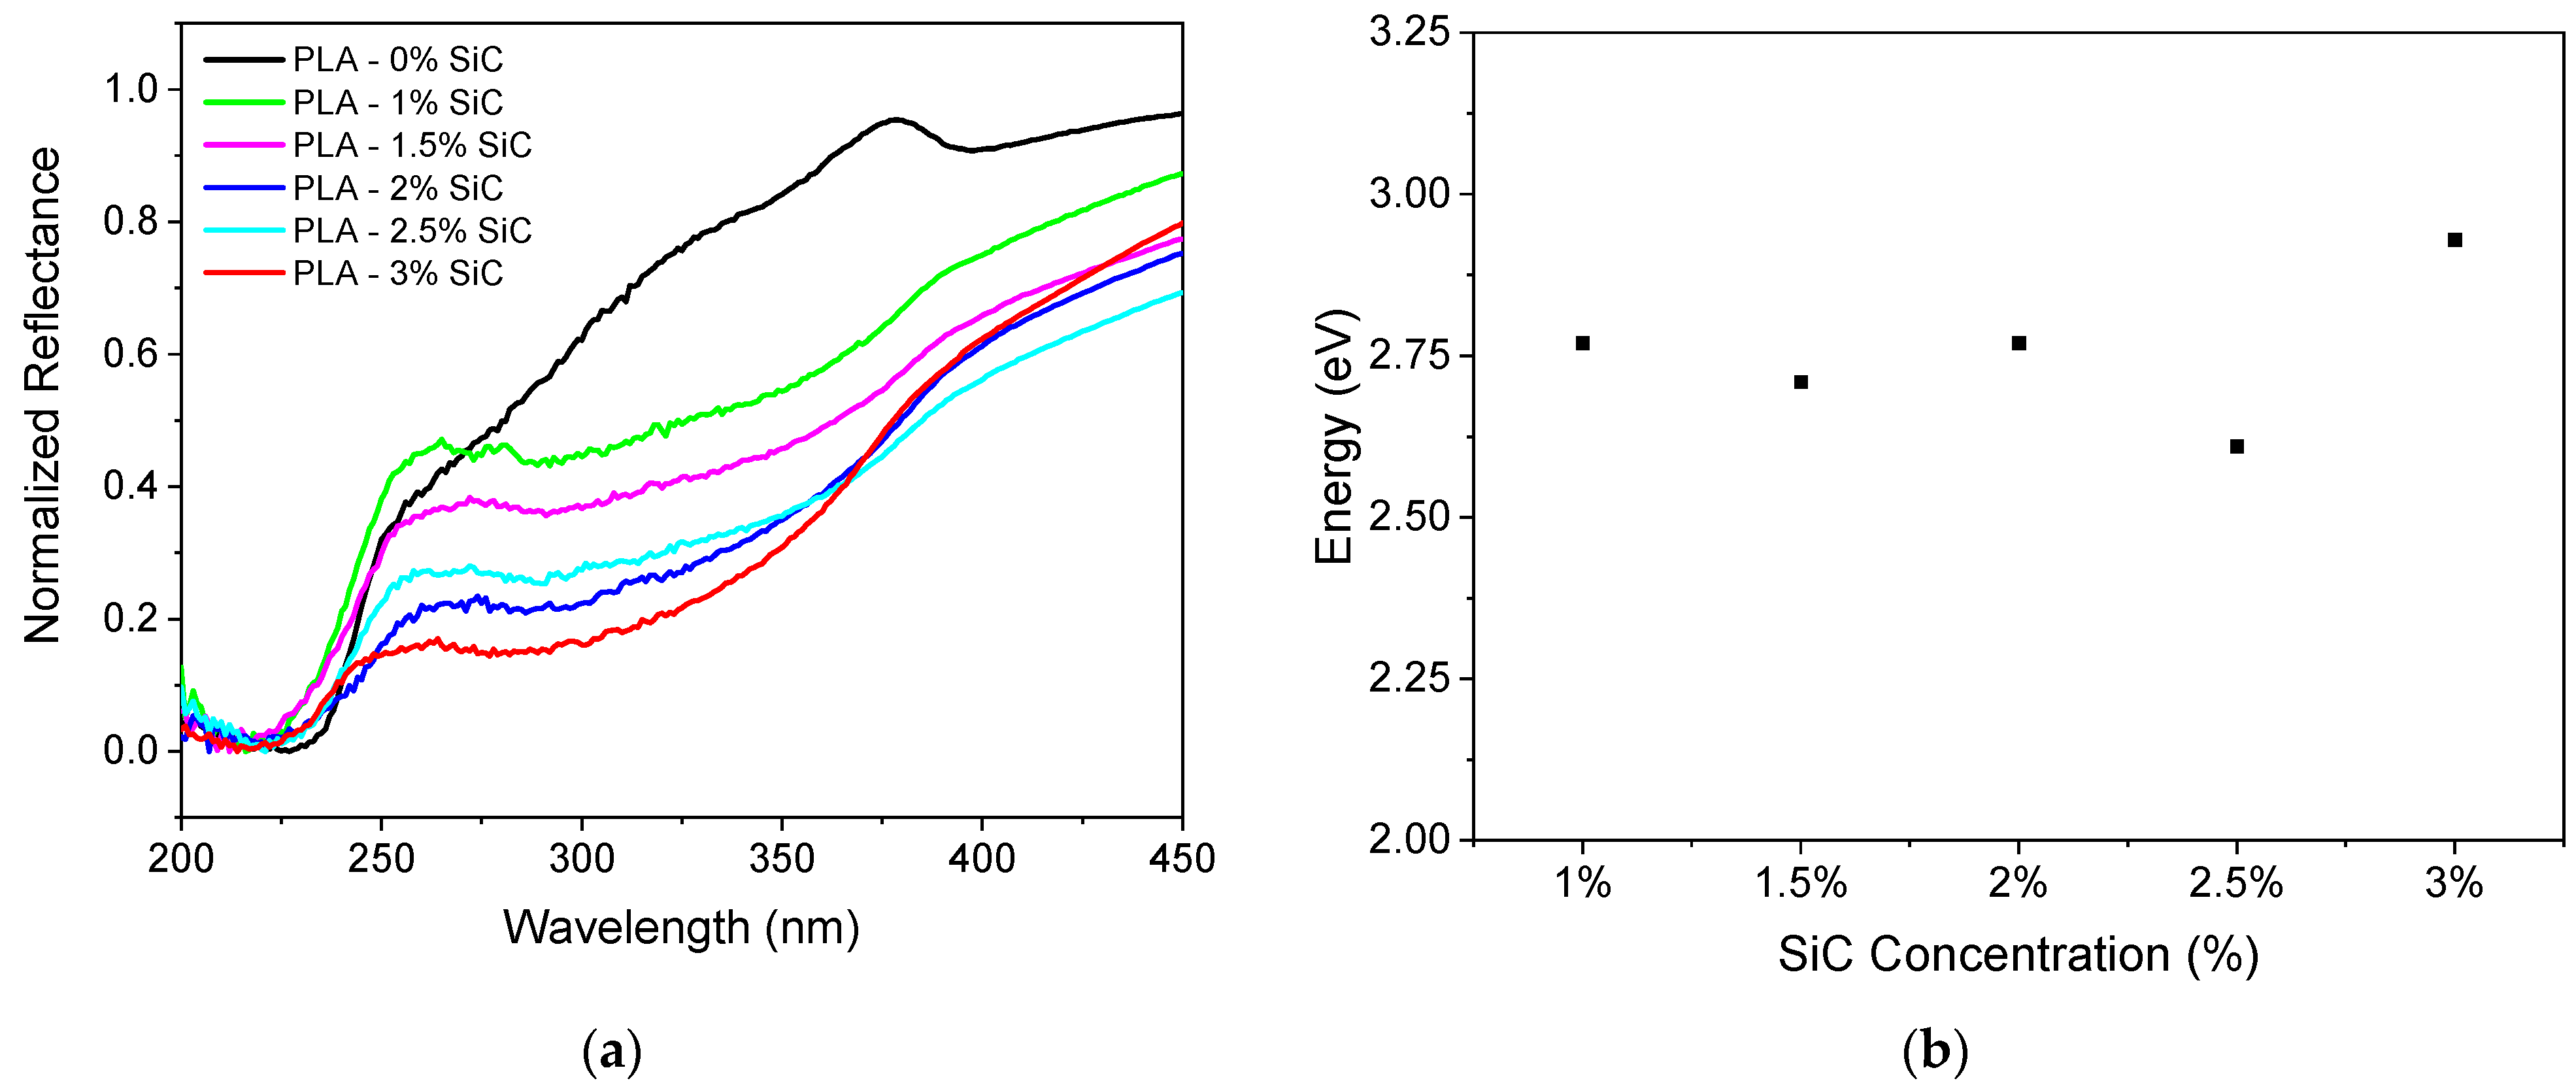
3.4. Optical Characterization

From the reflectance curves of the different samples (Figure 13a), it is evident that an increase in the SiC percentage results in a significant reduction in reflectance in the 260 nm–350 nm range, as the incident radiation is absorbed by the dispersed SiC microparticles. Using the Kubelka–Munk function for indirect bandgap semiconducting materials (SiC) [27]
( F R × E ) 1 2 = ( E     E g )
where F(R) is the ratio of the absorption coefficient over the scattering coefficient of the sample, E is the incident photon energy and Eg is the energy of the bandgap, we can extract information about the optical energy gap of nanocomposite materials, as illustrated in Figure 13b.
From the obtained spectra the optical bandgap is calculated to range between 2.75 and 3 eV, without showing a direct correlation to the SiC content of the samples. In the literature, the electronic energy gap of compact β-SiC has been calculated to be 2.3 eV, while in the case of SiC nanorods, the energy gap has been found to be approximately 3.1 eV [28]. From the above, it appears that the addition of SiC microparticles to PLA in percentages ranging from 1% to 3% leads to nanocomposite materials in which a significant influence of SiC properties on the optical characteristics of the samples is observed.

4. Conclusions

In this work we investigated the influence of SiC microparticles on the mechanical, electrical, and optical properties of SiC-doped PLA. PLA composites were characterized using measurements of their tensile strength before and after fatigue, abrasion resistance, Shore D hardness and resistance to Hertzian ball loading. Our result shows that the ultimate tensile strength of the pure PLA and 1%-doped PLA decreases with the number of fatigue cycles but increases by about 10% when SiC doping increases to 2% and 3%. These results could indicate that SiC microparticles act as an “anchor” for any microcracks growing during fatigue, delaying their development. At the same time the strain at the max load was about 3% independent of doping for all samples up to 400 cycles of the mixed-mode fatigue. This indicates that no or few significant microcracks are generated by mixed-mode fatigue in these materials, at least up to 400 cycles. Hertzian ball compression experiments showed that the effective hardness increases after about 1% SiC reaching a plateau at about 2 wt% SiC, which is about 40% above the value for pure PLA. This increase in effective hardness is probably due to the obstacles presented by the networks of SiC particles to the plastic deformation of the PLA matrix. These results are confirmed by measurements of Shore D hardness as well as abrasion resistance experiments.
Regarding the influence of SiC microparticles on the electrical properties of the PLA composite, a clear increase in the dielectric constant was observed. The dielectric constant of PLA increased monotonically with SiC from 3.2, for pure PLA, to 3.9, for PLA doped with 3% SiC. Moreover, the resistivity of all composites is larger than 6 × 10¹⁴ Ω·cm, indicating that the addition of SiC does not deteriorate the insulating properties of PLA. A hysteresis of the current voltage curves with respect to applied bias was observed. This is maybe due to charge trapping within the PLA material. The addition of SiC appears to decrease this charge trapping without increasing the observed leakage current and thus the dielectric properties of the PLA material.
Finally, from the UV-Vis experiments the optical energy gap does not appear to depend on the SiC content in the samples. This indicates that the addition of SiC microparticles to PLA in percentages ranging from 1% to 3% leads to nanocomposite materials in which a significant influence of SiC properties on the optical characteristics of the samples is observed.
Overall, our results show that the mechanical properties of SiC-doped PLA are enhanced compared to undoped PLA. This is of importance for the development of 3D-printed triboelectric nanogenerators, that operate in contact-separation (where the two triboelectric surfaces undergo continuous vertical impact) as well as in sliding mode (where friction appears between the two triboelectric surfaces due to their relative sliding motion). Moreover, the inclusion of SiC particles increases the dielectric constant of the PLA resulting in increased production of surface charge on the triboelectric surfaces and thus enhancing the output performance of the tribogenerators.

Author Contributions

Conceptualization, C.T. and G.V.; methodology, C.T., E.H. and G.V.; validation, S.S., N.C., A.S. and A.B.; investigation, S.S., N.C., A.S. and A.B.; data curation, S.S., N.C., A.S., G.V., A.B. and C.T.; writing—original draft preparation, S.S.; writing—review and editing, all authors; supervision, C.T. and G.V.; funding acquisition, C.T. All authors have read and agreed to the published version of the manuscript.

Funding

This research has been co-financed by the European Regional Development Fund of the European Union and Greek national funds through the Operational Program Competitiveness, Entrepreneurship and Innovation, under the call RESEARCH–CREATE–INNOVATE (EFOS, project code: Τ2EDK-00350).

Data Availability Statement

The data presented in this study are available on request from the corresponding author.

Conflicts of Interest

The authors declare no conflicts of interest.

References

  1. Khosravani, M.R.; Berto, F.; Ayatollahi, M.R.; Reinicke, T. Characterization of 3D-printed PLA parts with different raster orientations and printing speeds. Sci. Rep. 2022, 12, 1016. [Google Scholar] [CrossRef]
  2. Ngo, T.D.; Kashani, A.; Imbalzano, G.; Nguyen, K.T.Q.; Hui, D. Additive Manufacturing (3D Printing): A Review of Materials, Methods, Applications and Challenges. Compos. Part B Eng. 2018, 143, 172–196. [Google Scholar] [CrossRef]
  3. Yu, W.; Sun, L.; Li, M.; Li, M.; Lei, W.; Wei, C. FDM 3D Printing and Properties of PBS/PLA Blends. Polymers 2023, 15, 4305. [Google Scholar] [CrossRef]
  4. Kanishka, K.; Acherjee, B. Revolutionizing manufacturing: A comprehensive overview of additive manufacturing processes, materials, developments, and challenges. J. Manuf. Process. 2023, 107, 574–619. [Google Scholar] [CrossRef]
  5. Jandyal, A.; Chaturvedi, I.; Wazir, I.; Raina, A.; Ul Haq, M.I. 3D printing—A review of processes, materials and applications in industry 4.0. Sustain. Oper. Comput. 2022, 3, 33–42. [Google Scholar] [CrossRef]
  6. Shahrubudin, N.; Lee, T.C.; Ramlan, R. An overview on 3D printing technology: Technological, materials, and applications. Procedia Manuf. 2019, 35, 1286–1296. [Google Scholar] [CrossRef]
  7. Bergaliyeva, S.; Sales, D.L.; Delgado, F.J.; Bolegenova, S.; Molina, S.I. Manufacture and Characterization of Polylactic Acid Filaments Recycled from Real Waste for 3D Printing. Polymers 2023, 15, 2165. [Google Scholar] [CrossRef]
  8. Tezel, T.; Kovan, V.; Topal, E.S. Effects of the Printing Parameters on Short-Term Creep Behaviors of Three-Dimensional Printed Polymers. J. Appl. Polym. Sci. 2019, 136, 47564. [Google Scholar] [CrossRef]
  9. Joseph, T.M.; Kallingal, A.; Suresh, A.M.; Mahapatra, D.K.; Hasanin, M.S.; Haponiuk, J.; Thomas, S. 3D printing of polylactic acid: Recent advances and opportunities. Int. J. Adv. Manuf. Technol. 2023, 125, 1015–1035. [Google Scholar] [CrossRef]
  10. Anwer, M.A.S.; Naguib, H.E. Study on the morphological, dynamic mechanical and thermal properties of PLA carbon nanofiber composites. Compos. Part B Eng. 2016, 91, 631–639. [Google Scholar] [CrossRef]
  11. Yao, X.; Luan, C.; Zhang, D.; Lan, L.; Fu, J. Evaluation of carbon fiber-embedded 3D printed structures for strengthening and structural-health monitoring. Mater. Des. 2017, 114, 424–432. [Google Scholar] [CrossRef]
  12. Ferreira, R.T.L.; Amatte, I.C.; Dutra, T.A.; Bürger, D. Experimental characterization and micrography of 3D printed PLA and PLA reinforced with short carbon fibers. Compos. Part B Eng. 2017, 124, 88–100. [Google Scholar] [CrossRef]
  13. Fabijanski, M. Mechanical Properties of Polylactide Filled with Micronized Chalcedonite. J. Compos. Sci. 2022, 6, 387. [Google Scholar] [CrossRef]
  14. Mansour, M.T.; Tsongas, K.; Tzetzis, D. Carbon-Fiber- and Nanodiamond-Reinforced PLA Hierarchical 3D-Printed Core Sandwich Structures. J. Compos. Sci. 2023, 7, 285. [Google Scholar] [CrossRef]
  15. Dichtl, C.; Sippel, P.; Krohns, S. Dielectric Properties of 3D Printed Polylactic Acid. Adv. Mater. Sci. Eng. 2017, 2017, 6913835. [Google Scholar] [CrossRef]
  16. Kuzmanić, I.; Vujović, I.; Petković, M.; Šoda, J. Influence of 3D printing properties on relative dielectric constant in PLA and ABS materials. Prog. Addit. Manuf. 2023, 8, 703–710. [Google Scholar] [CrossRef]
  17. Choi, D.; Lee, Y.; Lin, Z.H.; Cho, S.; Kim, M.; Ao, C.K.; Soh, S.; Sohn, C.; Jeong, C.K.; Lee, J.; et al. Recent Advances in Triboelectric Nanogenerators: From Technological Progress to Commercial Applications. ACS Nano 2023, 17, 11087–11219. [Google Scholar] [CrossRef] [PubMed]
  18. Suo, X.; Li, B.; Ji, H.; Mei, S.; Miao, S.; Gu, M.; Yang, Y.; Jiang, D.; Cui, S.; Chen, L.; et al. Dielectric Layer Doping for Enhanced Triboelectric Nanogenerators. Nano Energy 2023, 114, 108651. [Google Scholar] [CrossRef]
  19. Skorda, S.; Bardakas, A.; Tsamis, C. Influence of SiC and ZnO doping on the electrical performance of PLA-based triboelectric nanogenerators. Sensors, 2024; submitted. [Google Scholar]
  20. ISO 527-1:2019; Plastics-Determination of Tensile Properties. International Organization for Standardization: Geneva, Switzerland, 2019. Available online: https://www.iso.org/standard/80370.html (accessed on 1 February 2024).
  21. Colella, R.; Chietera, F.P.; Catarinucci, L. Analysis of fdm and dlp 3d-printing technologies to prototype electromagnetic devices for rfid applications . Sensors 2021, 21, 897. [Google Scholar] [CrossRef]
  22. Behzadnezhad, B.; Collick, B.D.; Behdad, N.; McMillan, A.B. Dielectric properties of 3D-printed materials for anatomy specific 3D-printed MRI coils. J. Magn. Reson. 2018, 289, 113–121. [Google Scholar] [CrossRef]
  23. Yang, H.J.; Yuan, J.; Li, Y.; Hou, Z.L.; Jin, H.B.; Fang, X.Y.; Cao, M.S. Silicon carbide powders: Temperature-dependent dielectric properties and enhanced microwave absorption at gigahertz range. Solid State Commun. 2013, 163, 1–6. [Google Scholar] [CrossRef]
  24. Sareni, B.; Krähenbühl, L.; Beroual, A.; Brosseau, C. Effective dielectric constant of periodic composite materials. J. Appl. Phys. 1996, 80, 1688–1696. [Google Scholar] [CrossRef]
  25. Guo, R.; Ren, Z.; Bi, H.; Xu, M.; Cai, L. Electrical and thermal conductivity of polylactic Acid (PLA)-based biocomposites by incorporation of nano-graphite fabricated with fused deposition modeling. Polymers 2019, 11, 549. [Google Scholar] [CrossRef]
  26. Froš, D.; Králová, I. Conductive FDM Filament: Electrical Resistivity Assessment and Sensor Applications. In Proceedings of the 2023 46th International Spring Seminar on Electronics Technology (ISSE), Timisoara, Romania, 10–14 May 2023. [Google Scholar] [CrossRef]
  27. Landi, S.; Segundo, I.R.; Freitas, E.; Vasilevskiy, M.; Carneiro, J.; Tavares, C.J. Use and misuse of the Kubelka-Munk function to obtain the band gap energy from diffuse reflectance measurements. Solid State Commun. 2022, 341, 114573. [Google Scholar] [CrossRef]
  28. Peng, G.; Zhou, Y.; He, Y.; Yu, X.; Zhang, X.A.; Li, G.Y.; Haick, H. UV-Induced SiC Nanowire Sensors. J. Phys. D Appl. Phys. 2015, 48, 055102. [Google Scholar] [CrossRef]
Figure 1. Schematic of the fabrication process.
Jcs 08 00079 g001
Figure 2. (a) The specially designed fatigue apparatus applying a cyclic tension-bending load on the tensile specimens prior to tensile testing; (b) the Hertzian point loading arrangement on the INSTRON 5982.
Jcs 08 00079 g002
Figure 3. The probe station used for the electrical characterization of the samples.
Jcs 08 00079 g003
Figure 4. SEM micrograph of the irregular SiC powder of mesh size #1200 used in this work.
Jcs 08 00079 g004
Figure 5. Typical SEM micrographs of a PLA-3%SiC specimen after failure in tension (a) and after abrasion testing (b). Some SiC particles are visible (circled).
Jcs 08 00079 g005
Figure 6. EDX spectrum of a 3%SiC specimen.
Jcs 08 00079 g006
Figure 7. (a) Ultimate tensile strength of PLA composite after mixed-mode fatigue. (b) Strain at max load of SiC-doped PLA after mixed-mode fatigue.
Jcs 08 00079 g007
Figure 8. Results for specimens with 1–3wt% SiC for (a) Hertz contact force with the compression test data and (b) effective hardness.
Jcs 08 00079 g008
Figure 9. Results for (a) Shore D hardness and (b) abrasion resistance.
Jcs 08 00079 g009
Figure 10. Capacitance vs. frequency at zero bias voltage for all samples.
Jcs 08 00079 g010
Figure 11. Dielectric constant of the PLA-SiC composite material as a function of SiC concentration.
Jcs 08 00079 g011
Figure 12. Leakage current as a function of applied voltage for all samples. The measurements were performed using voltage ramps from +10 V to 0 V to −10 V to 0 V.
Jcs 08 00079 g012
Figure 13. (a) Normalized reflectance spectra of PLA and PLA-SiC samples with 0%, 1%, 1.5%, 2%, 2.5% and 3% wt. SiC. (b) Calculated optical bandgap of SiC-doped PLA samples using the Kubelka–Munk equation.
Jcs 08 00079 g013
Table 1. Thickness measurements of the circular samples used for the electrical characterization.
SampleThickness (μm)δThickness (μm)
0% SiC40010.0
1% SiC39010.0
2% SiC42010.0
3% SiC42010.0
Disclaimer/Publisher’s Note: The statements, opinions and data contained in all publications are solely those of the individual author(s) and contributor(s) and not of MDPI and/or the editor(s). MDPI and/or the editor(s) disclaim responsibility for any injury to people or property resulting from any ideas, methods, instructions or products referred to in the content.

