Article

Quasi-Static Fracture Toughness and Damage Monitoring in Liquid Metal Reinforced Hybrid Composites

by
Zachary Safford
1,
Mohammed Shonar
2 and
Vijaya Chalivendra
2,*
1
Department of Aerospace Engineering, Worcester Polytechnique Institute, Worcester, MA 01609, USA
2
Department of Mechanical Engineering, University of Massachusetts Dartmouth, North Dartmouth, MA 02747, USA
*
Author to whom correspondence should be addressed.
J. Compos. Sci. 2024, 8(1), 25; https://doi.org/10.3390/jcs8010025
Submission received: 11 November 2023 / Revised: 13 December 2023 / Accepted: 8 January 2024 / Published: 11 January 2024
(This article belongs to the Special Issue Characterization and Modelling of Composites, Volume III)

Abstract

:
An experimental study is performed to investigate the quasi-static fracture toughness and damage monitoring capabilities of liquid metal (75.5% Gallium/24.5% Indium) reinforced intraply glass/carbon hybrid composites. Two different layups (G-0, where glass fibers are along the crack propagation direction; C-0, where carbon fibers are along the crack propagation direction) and two different weight percentages of liquid metal (1% and 2%) are considered in the fabrication of the composites. A novel four-probe technique is employed to determine the piezo-resistive damage response under mode-I fracture loading conditions. The effect of layups and liquid metal concentrations on fracture toughness and changes in piezo-resistance response is discussed. The C-composite without liquid metal demonstrated higher fracture toughness compared to that of the G-composite due to carbon fiber breakage. The addition of liquid metal decreases the fracture initiation toughness of both G- and C-composites. Scanning electron microscopy images show that liquid metal takes the form of large liquid metal pockets and small spherical droplets on the fracture surfaces. In both C- and G-composites, the peak resistance change of composites with 2% liquid metal is substantially lower than that of both no-liquid metal and 1% liquid metal composites.

1. Introduction

Carbon fiber and glass fiber composites have garnered significant attention as advanced materials due to their lightweight nature, high modulus of elasticity, substantial strength, and low density. These attributes render these materials highly suitable for diverse applications across the aerospace and automotive sectors [1,2,3,4,5]. Researchers have sought to leverage the exceptional performance characteristics of both carbon and glass fibers by combining them in various configurations and, subsequently, examining their mechanical and fracture properties. Recent investigations have particularly delved into the fracture characterization of hybridized carbon and glass fiber composites. For instance, Jung and Kim [6] explored the mode-I fracture toughness of epoxy interply composites comprising carbon and glass fibers. Their findings indicated that as the number of glass fabric layers increased, the fracture toughness of the interply composites decreased. Furthermore, the arrangement of the fibers exhibited an influence on the fracture toughness of the composites. Notably, the presence of multiple layers of glass fabric, as opposed to a single layer, proved most effective in enhancing fracture toughness. Similarly, Kirk et al. [7] delved into the impact of varying ratios of carbon and glass fibers on the fracture energy of composites consisting of carbon fibers, glass fibers, and epoxy resin. Their results emphasized the significance of post-debond friction energy in determining both the fracture energy of the glass fibers and the non-linear behavior of fracture work within the composite material. In a different vein, Thorat and Lakkad [8] concentrated on the fracture toughness of unidirectional composites comprised of both glass and carbon fibers. Their investigation unveiled a positive hybrid effect resulting from the combination of these fibers. This hybridization notably elevated the fracture toughness of the composites, attributed to a distinct failure process, as compared to composites reinforced solely with glass or carbon fibers.
In the area of monitoring the structural health of composite structures, the identification of damage within laminated composites is of utmost importance, especially considering their susceptibility to interlaminar delamination and the fracturing of brittle matrices [9,10,11]. Researchers have employed various methodologies, including ultrasonic [12], thermographic [13], X-ray [14], laser stereographic [15], and acoustic emission techniques [16], to oversee the condition of these structures under mechanical loads. However, these approaches often necessitate costly equipment. As an alternative, the utilization of carbon-based materials for damage detection through piezo-resistive measurements under mechanical and fracture loads has gained traction. Carbon nanotubes (CNTs), in particular, have garnered significant attention in recent studies for establishing an electrically conductive network within composites, enabling damage monitoring. For instance, Thostenson and Chou [17] integrated CNT networks into an epoxy polymer matrix as sensors to track the evolution of damage in composites. By employing direct current measurements, internal damage could be detected, with shifts in the sensing curve serving as indicators of irreversible damage within the composite. In a recent study, Meninno and Chalivendra [18] explored the piezo-resistive behavior of epoxy composites containing intraply glass and carbon fibers. They specifically examined how these composites responded electrically under quasi-static mode-I and mode-II fracture loading conditions. Notably, distinct electrical reactions were observed for all four-ply orientations in relation to the aforementioned loading conditions. Shonar and Chalivendra conducted an investigation into quasi-static mode-I fracture behavior, utilizing intraply composites that incorporated carbon nanotubes (CNTs) within a liquid thermoplastic polymer matrix [19]. The outcomes of their experimentation unveiled a noteworthy relationship between the load reductions during crack propagation and the concurrent rise in resistance within the specimens. As the loading process unfolded, marked load drops were consistently observed, leading to a substantial and exponential surge in resistance alterations. O’Donnell et al. employed an electro-flocking method to reinforce fiberglass epoxy composites using milled carbon fibers of varying lengths, specifically 150 and 350 microns [20]. Through the process of carbon fiber flocking, improvements were achieved in the quasi-static mode-I fracture loading of the composites when compared to those that were not treated with flocking. Across many of the composites, a distinct association was identified between instances of load drops and corresponding increases in resistance, particularly when there was unsteady propagation of cracks. However, it is worth noting that instances of steady crack propagation were also observed, particularly in the context of composites containing 350-micron fibers.
There has been growing interest in using liquid metal (LM) and low-melting-point alloys to create hybrid material architectures that demonstrate novel combinations of mechanical, thermal, and electrical properties in composites comparable to metals. In recent studies, liquid metals are embedded in elastomers to make them multi-functional materials that are soft and highly deformable or flexible [21,22,23]. Wang et al. [24] fabricated and characterized ethylene–vinyl acetate (EVA)-based printable super elastic conductors by electrically anchoring conductive fillers with eutectic gallium indium particles (EGaInPs). The developed composites demonstrated high stretchability, with 1000% strain at an initial conductivity of 8331 S cm−1 and excellent cycling durability. Pozarycki et al. [25] generated the tough, permanent adhesion of LM composites to diverse substrates by chemically anchoring LM composites to various materials through a surface treatment process that uses oxygen plasma and (3-aminopropyl)triethoxysilane (APTES). The fracture energy increased up to 100× relative to untreated surfaces, with values reaching up to 7800 J m−2. Recently, Schlingman et al. [26] developed a simple process to fabricate intrinsically conductive LMEEs (iLMEEs) with conductive surfaces through the sedimentation of microparticles of eutectic gallium-indium alloy (EGaIn) in the elastomer poly(dimethylsiloxane). The resulting composites exhibited a low sheet resistance of 0.63 ± 0.04 Ω sq–1. Moreover, they were soft, stretchable, and demonstrated a stable conductivity up to 100% strain. Ambulo et al. [27] developed a 4D-printable composite composed of a liquid crystal elastomer (LCE) matrix with dispersed droplets of eutectic gallium indium alloy (EGaIn). At higher LM concentrations (88 wt.%), the embedded LM droplets can form percolating networks that conduct electricity and enable electrical Joule heating of the LCE. Actuation strain ranging from 5 to 12% is controlled by the amount of electrical power that is delivered to the composite. Fang et al. [28] fabricated an innovative elastomeric composite that incorporates a 3D network of liquid metal (LM), offering exceptional stretchability, durability, and conductivity. The authors developed a mechanics-based analytical model, which indicated that through interconnected 3D LM architecture, these composites can withstand tensile strains up to 500% without rupture. Moreover, the 3D architecture facilitates crack blunting and stress delocalization, elevating fracture toughness while, simultaneously, establishing continuous conductive pathways that result in high conductivity. It is very clear from these studies that LM composites have great potential to be multi-functional composites where they can be used for damage-sensing applications through piezo-resistance measurements due to their superior electrical conductivity.
Hence, in this work, for the first time, the effect of the addition of liquid metal (75.5% Gallium/24.5% Indium) on fracture toughness and damage sensitivity in intraply carbon/glass composites is investigated. Two distinct layup configurations are examined in the fabrication of composites: G-0, where glass fibers are aligned along the crack propagation direction, and C-0, where carbon fibers follow the same direction. Additionally, two varying weight percentages of liquid metal (1% and 2%) are incorporated. A unique four-probe methodology is utilized to assess the piezo-resistive response to damage under conditions of mode-I fracture loading. The impact of different layups and concentrations of liquid metal on fracture toughness and alterations in resistance response is deliberated upon. Scanning electron microscopy imaging is used to correlate the fracture mechanisms to the fracture toughness and piezo-resistance response in the composites.

2. Experimental Details
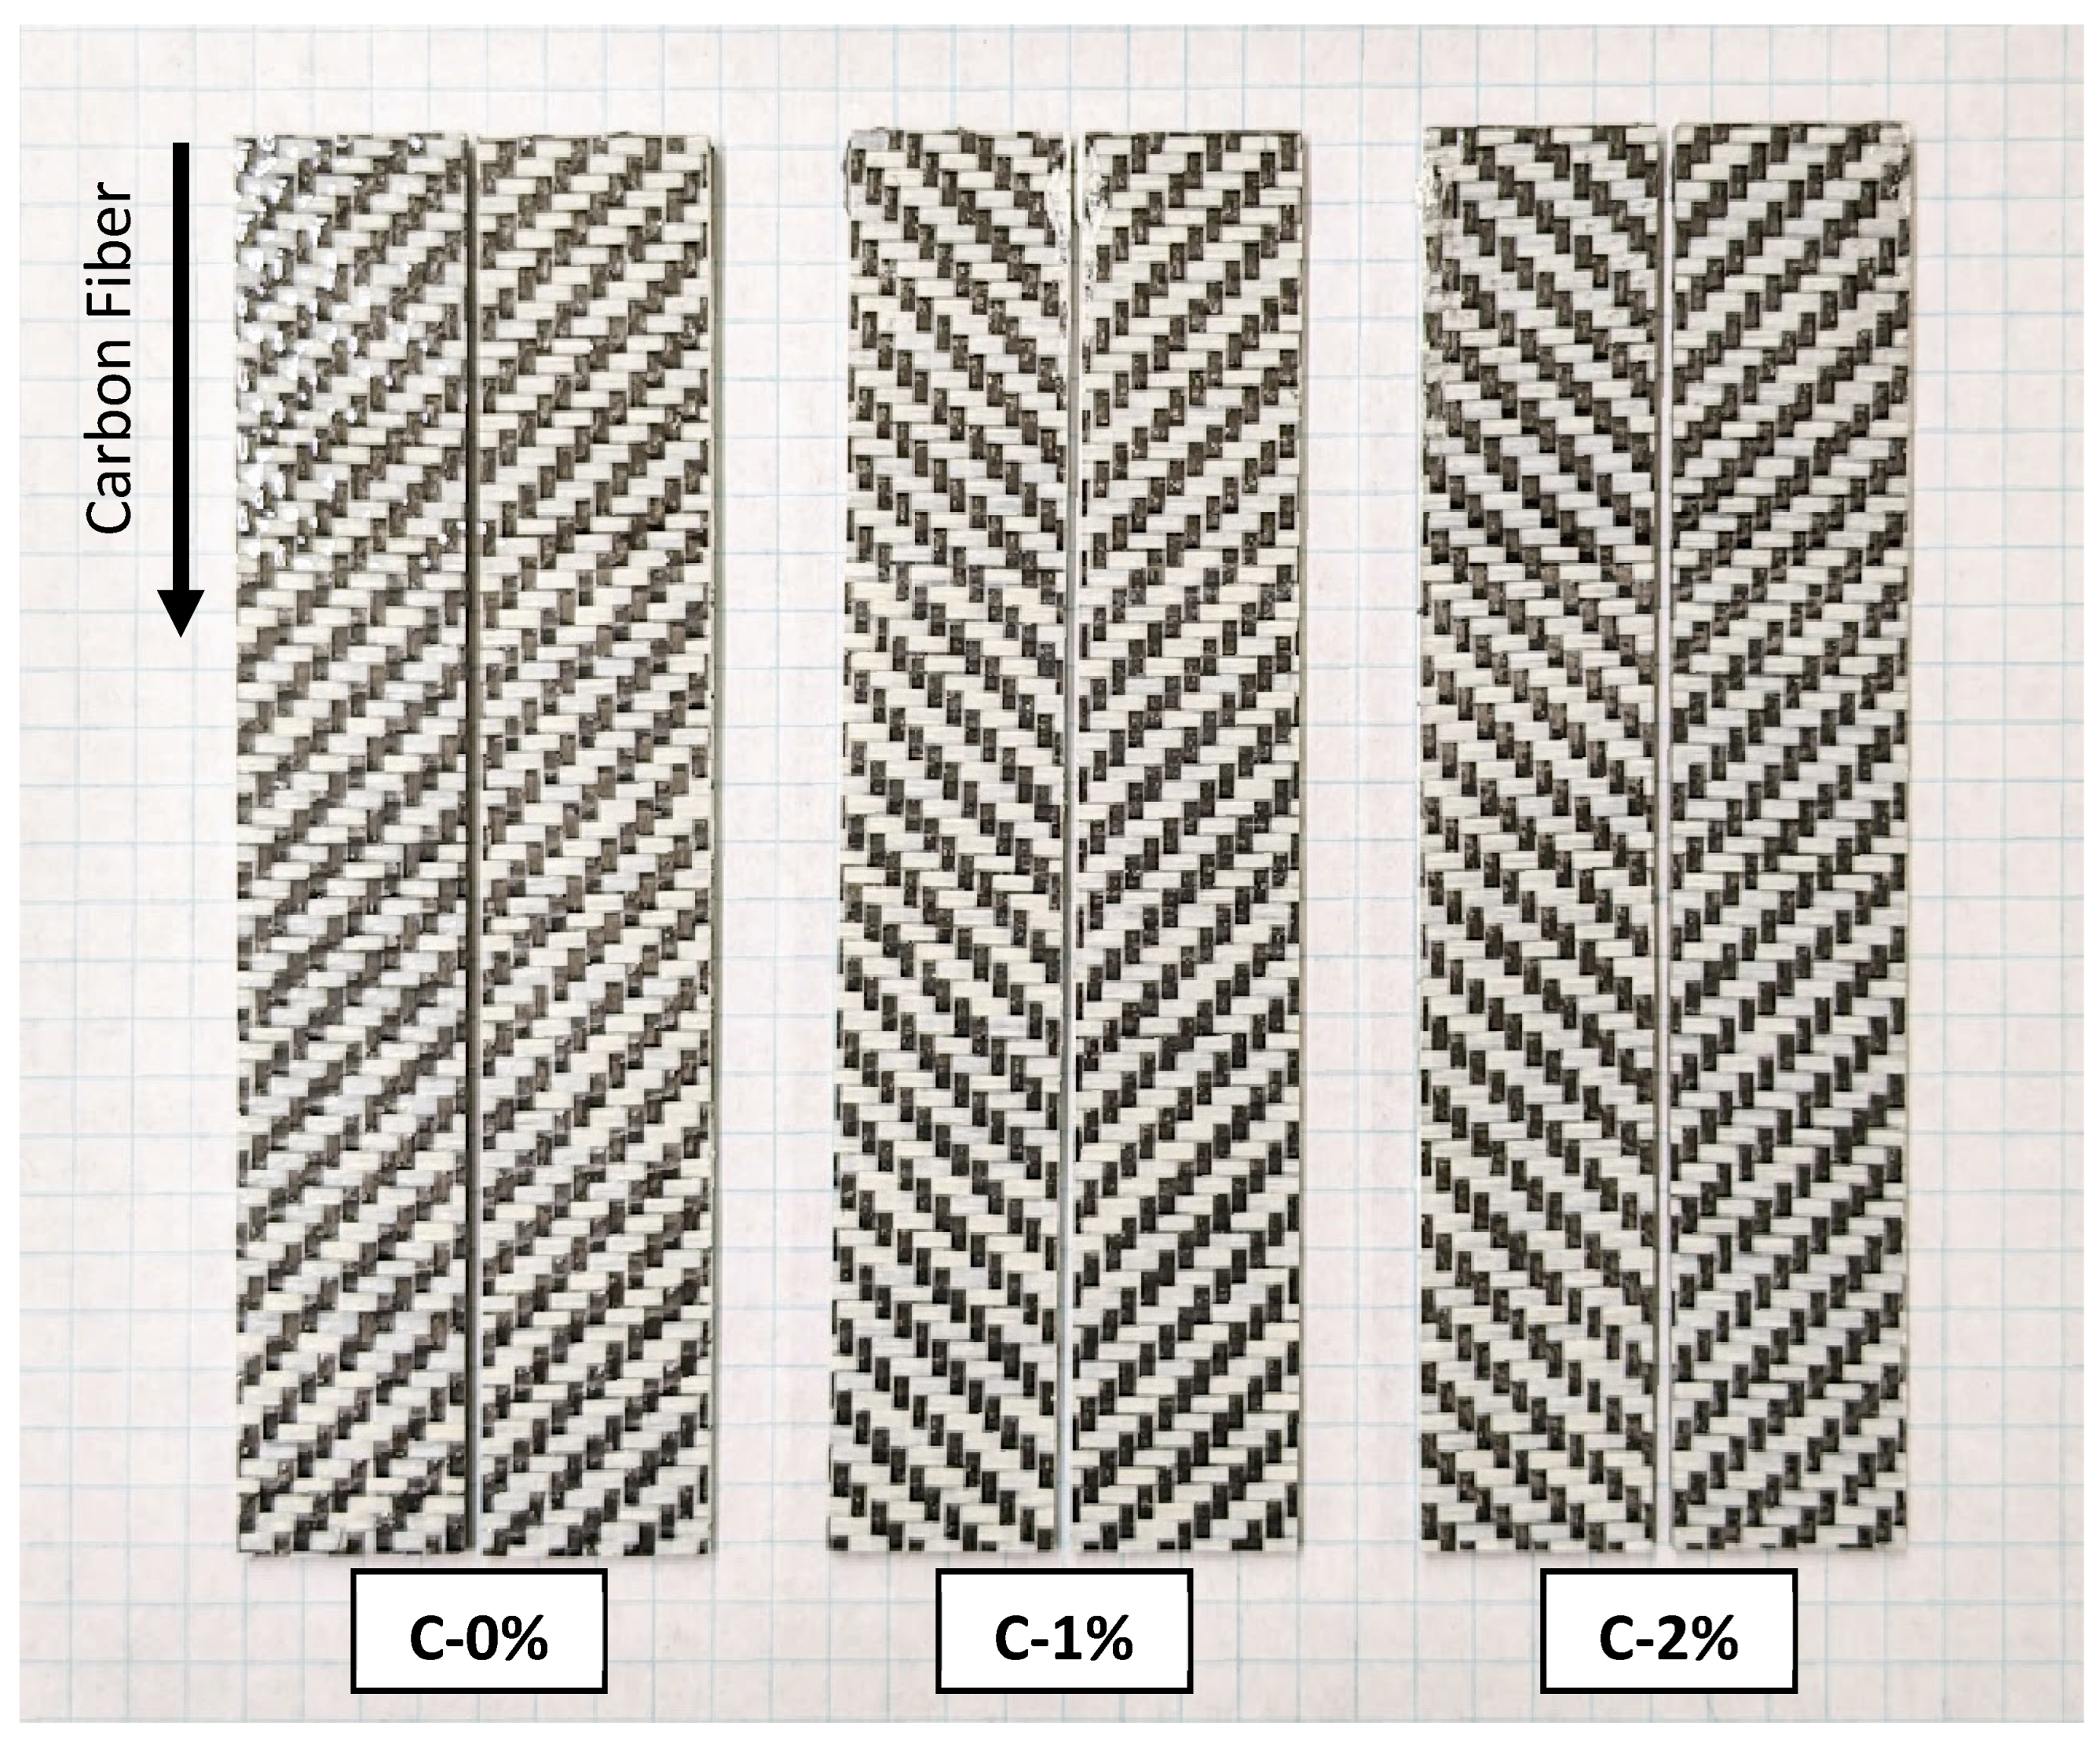
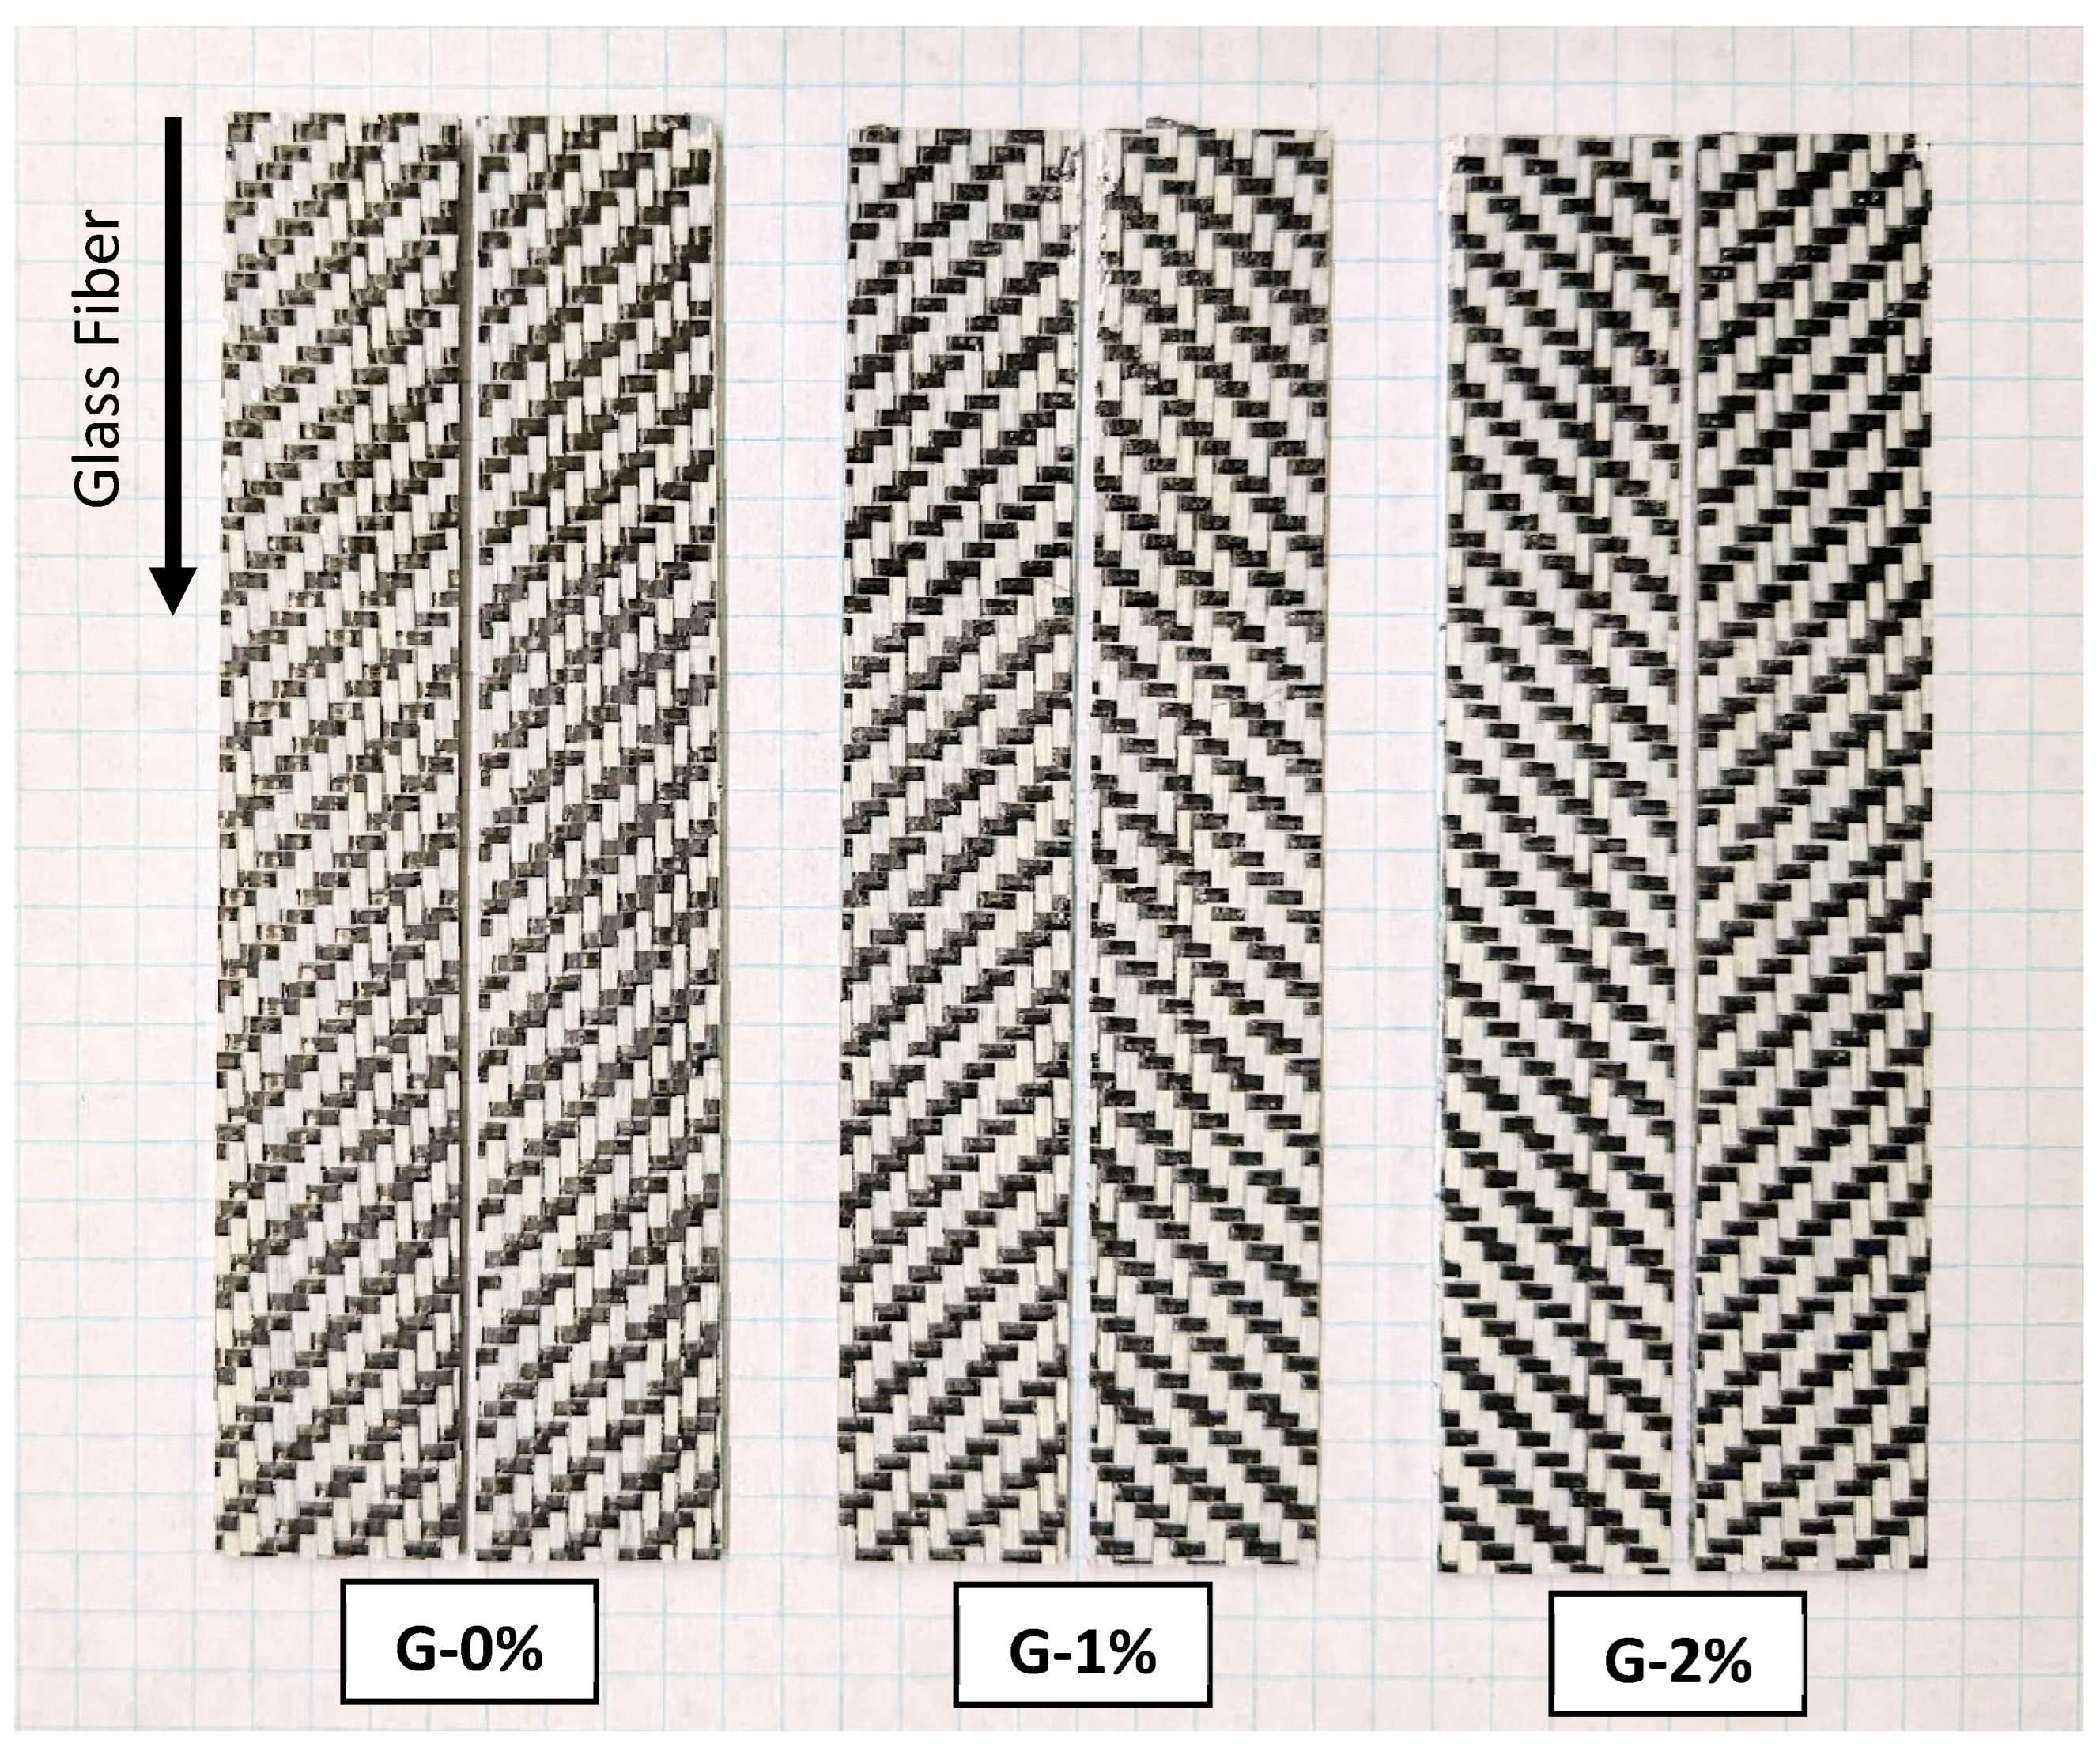
2.1. Materials

Carbon fiber/fiberglass fabric of 2 × 2 twill weave laminate with 3K carbon content is purchased from Composite Envisions (Wausau, WI, USA) for making intraply hybrid composites. System 2000 thermoset epoxy (with a hardener-to-resin ratio of 100:27) supplied by Fibre Glast (Brookeville, OH, USA) is used as the matrix for the composites. The liquid metal is a eutectic Gallium-Indium alloy, consisting of 75.5% Gallium and 24.5% Indium (Indalloy® 60) and is supplied by Indium Corporation, Clinton, NY, USA. These electrical probes are applied using silver paint (SPI-Paint 05001-AB) procured from SPI Supplies, West Chester, PA, USA. A pre-crack in the fracture specimens made using a clear moisture-resistant Polyester film of 12.7 µm thickness is procured from McMaster-Carr (Aurora, OH, USA). Piano hinges purchased from Home Depot, USA are used on fracture specimens for the open-mode fracture loading.

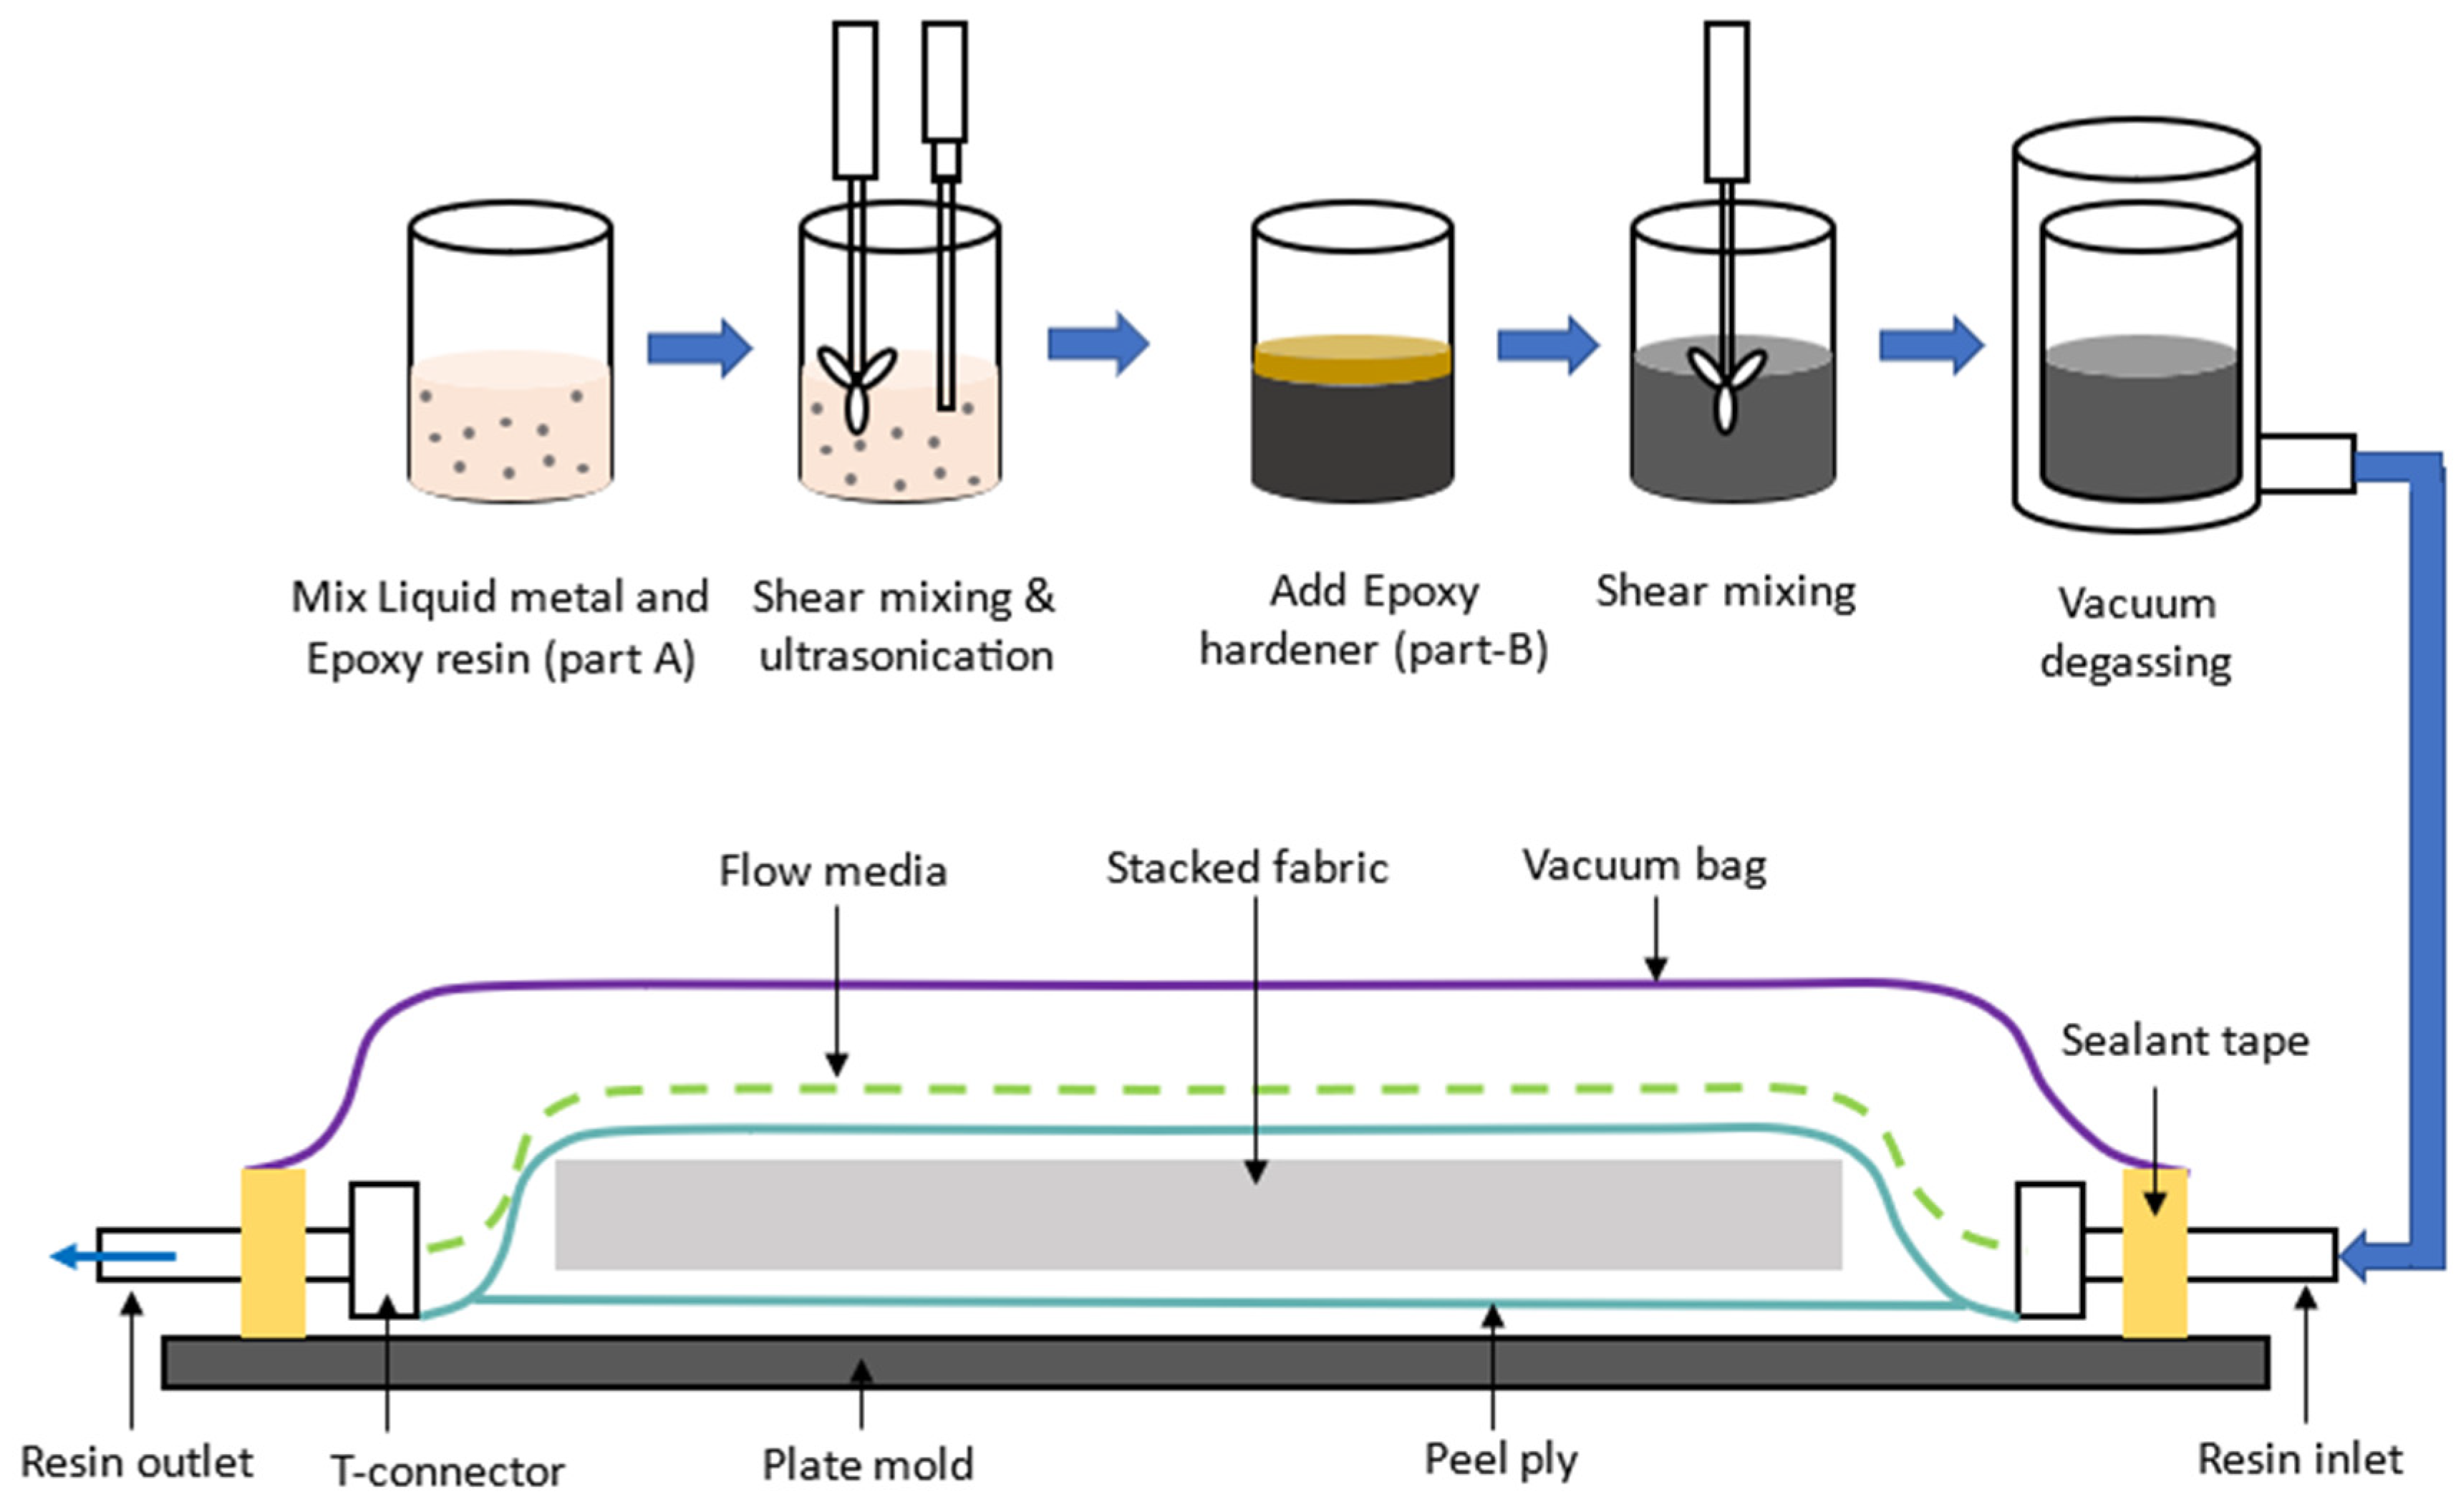
2.2. Fabrication of Composites

Figure 1 provides a detailed approach to the fabrication process of hybrid composites. It involves two stages: (a) liquid metal dispersion and (b) vacuum infusion process. First, the required weight percentage of liquid metal (1% and 2%) is added to the resin part of the epoxy matrix. It is subjected to shear mixing and ultrasonication simultaneously for 90 min. Upon this step, the measured amount of epoxy hardener is added and shear mixed for 5 min. Later, this mix is vacuumed for 30 min before it is infused into the stack of intraply fabrics. A standard vacuum infusion process, as depicted in Figure 1, is employed to make the composites [29]. To generate a pre-crack of 50 mm, a clear moisture-resistant Polyester film of 12.7 µm thickness is inserted between the middle layers of the fabric stack before infusion. The composite in the mold is kept for 48 h at room temperature for complete polymerization of epoxy matrix. Two kinds of fabric orientations denoted by C and G, as shown in Figure 2, are fabricated in this study. In the C-composite type, the carbon fibers are oriented along the crack growth direction and the glass fibers are oriented along the transverse direction. In the G-composite type, the glass fibers are oriented along the crack growth direction and the carbon fibers are oriented along the transverse direction. Six different composite types are considered in this study: C-0%, C-1%, C-2%, G-0%, G-1%, and G-2%, where the numbers denote the amount of the weight percentage of liquid metal mixed in the matrix of the composite.

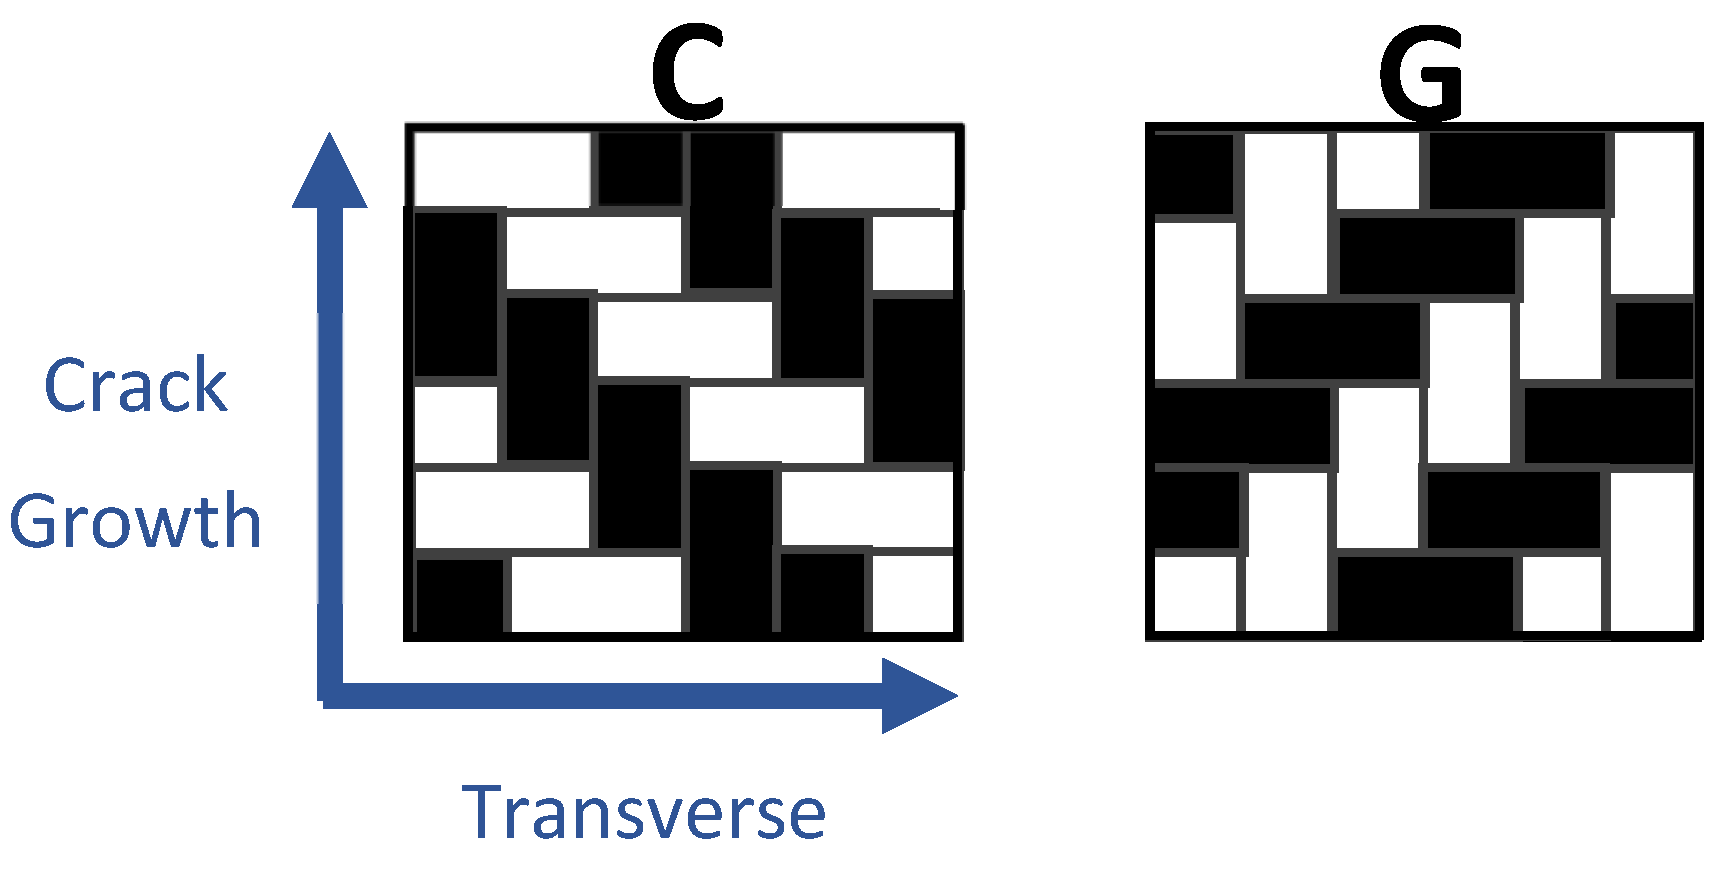
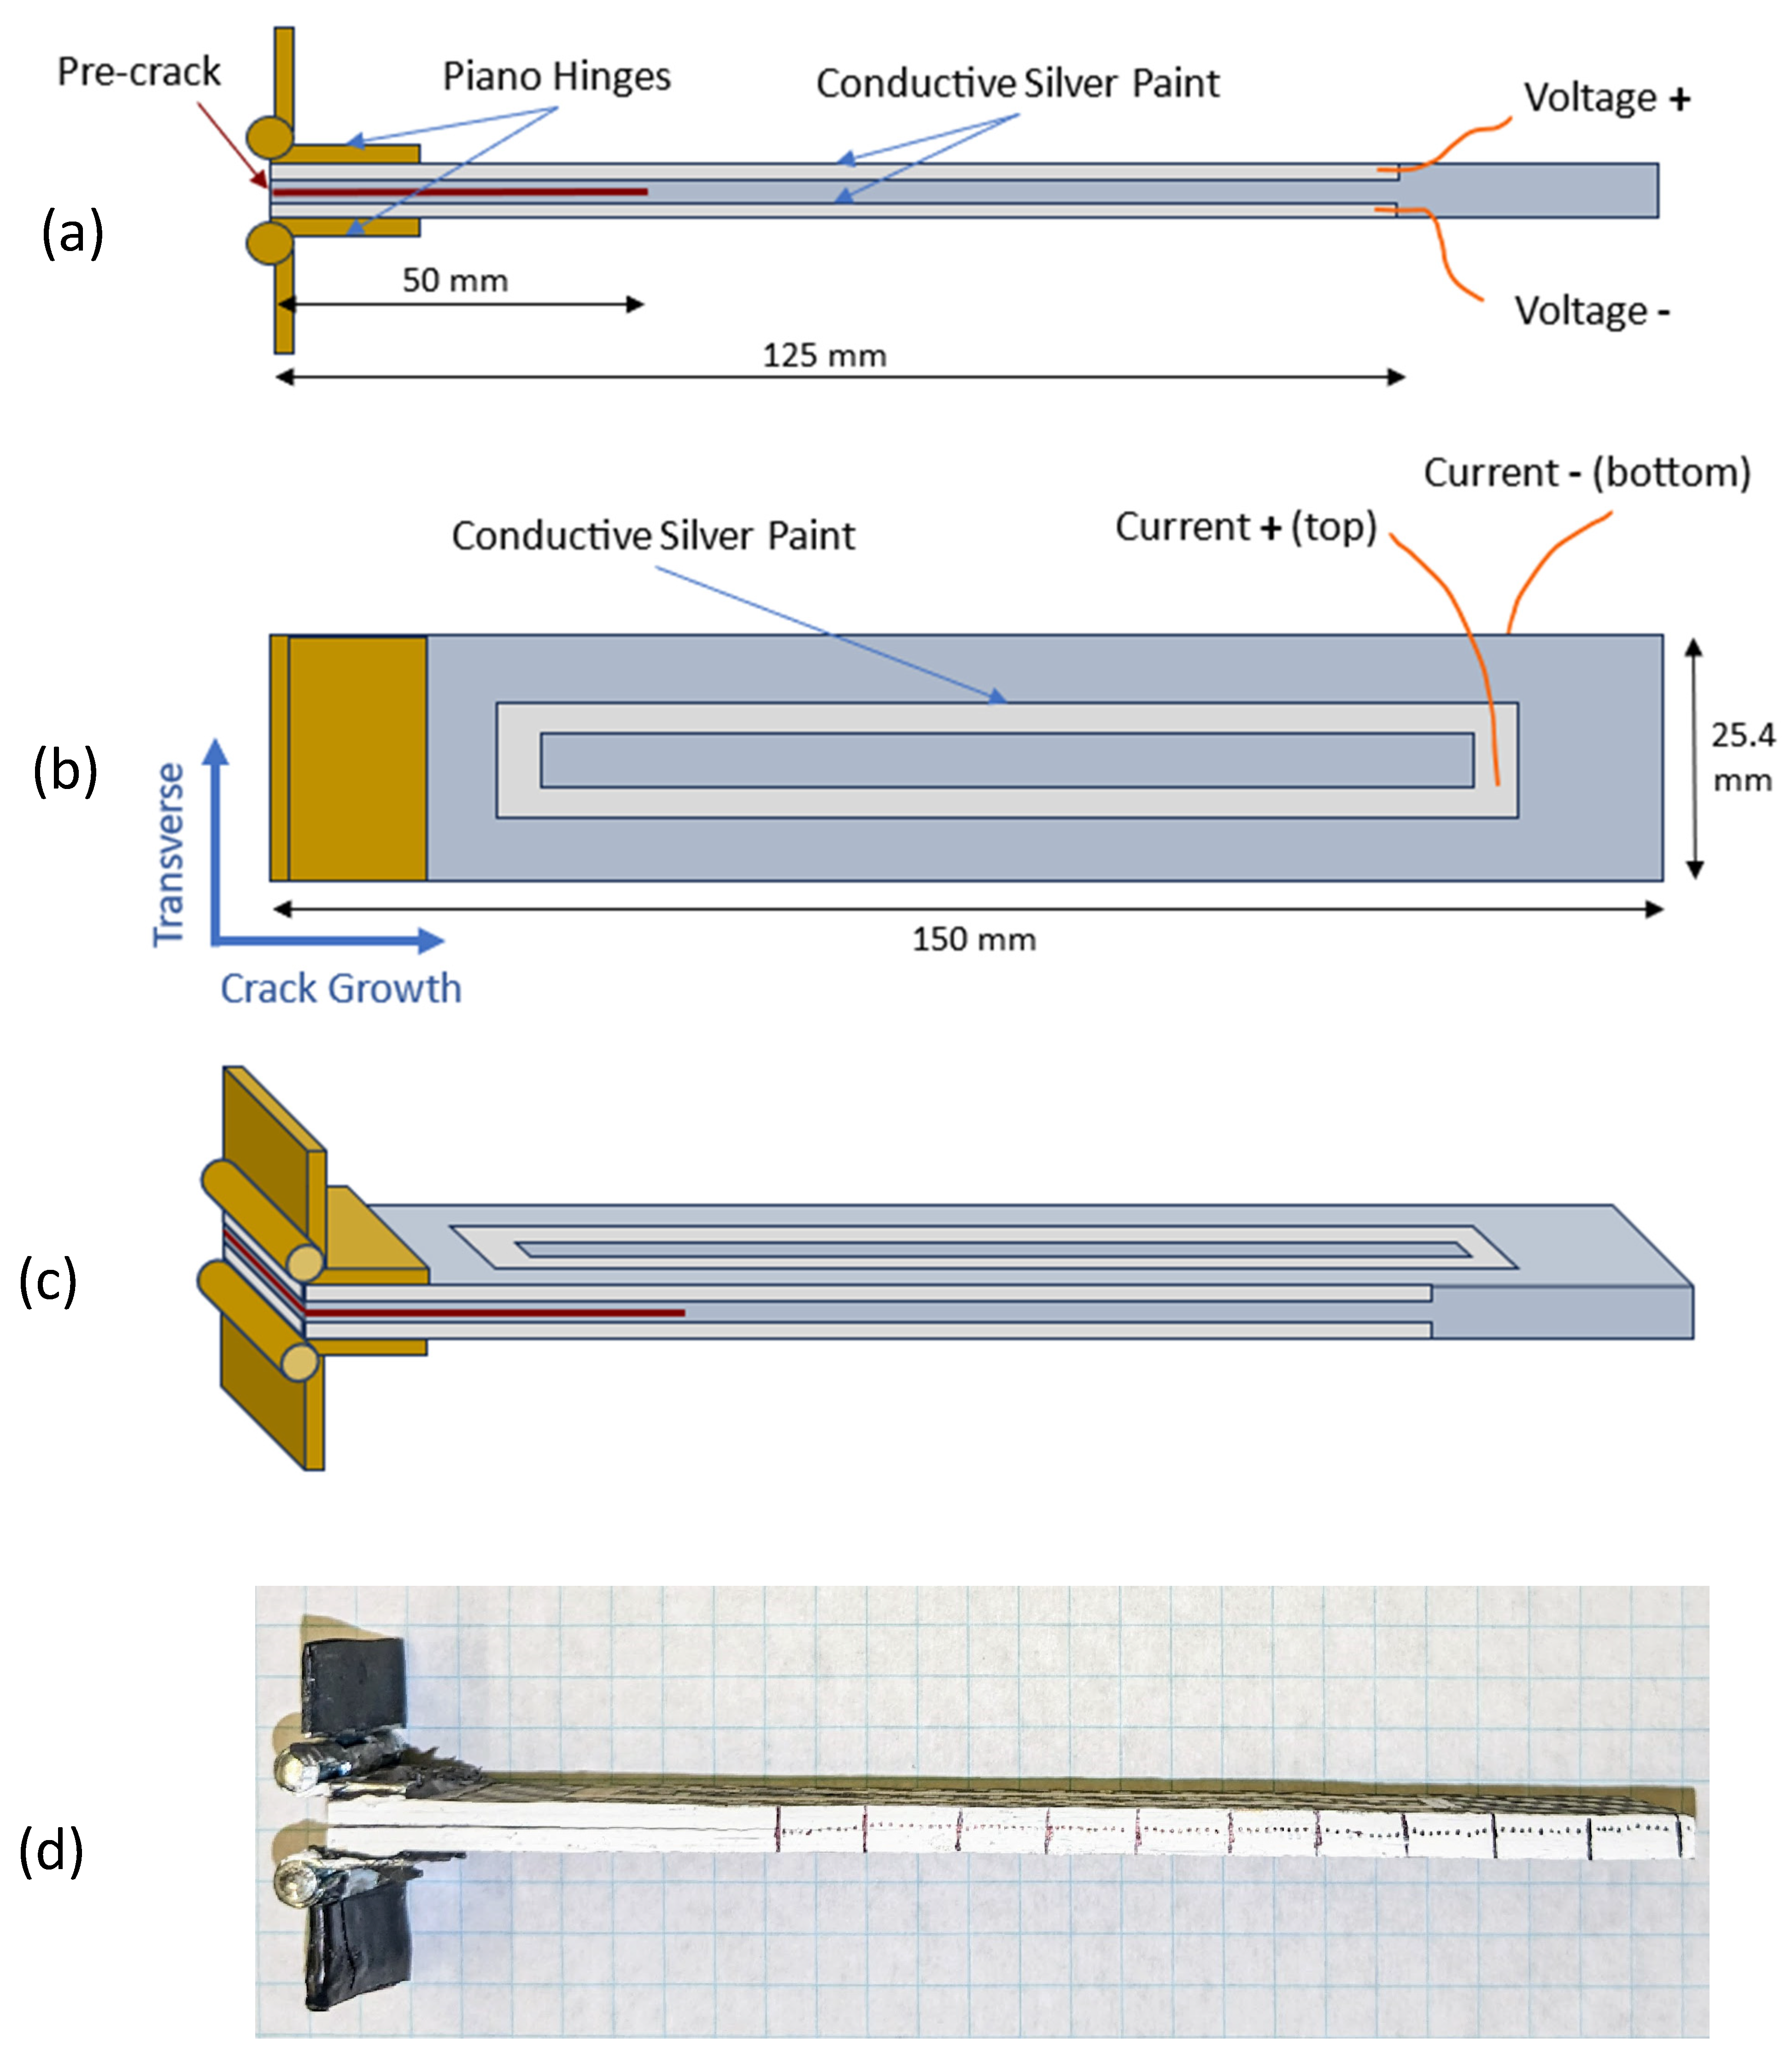
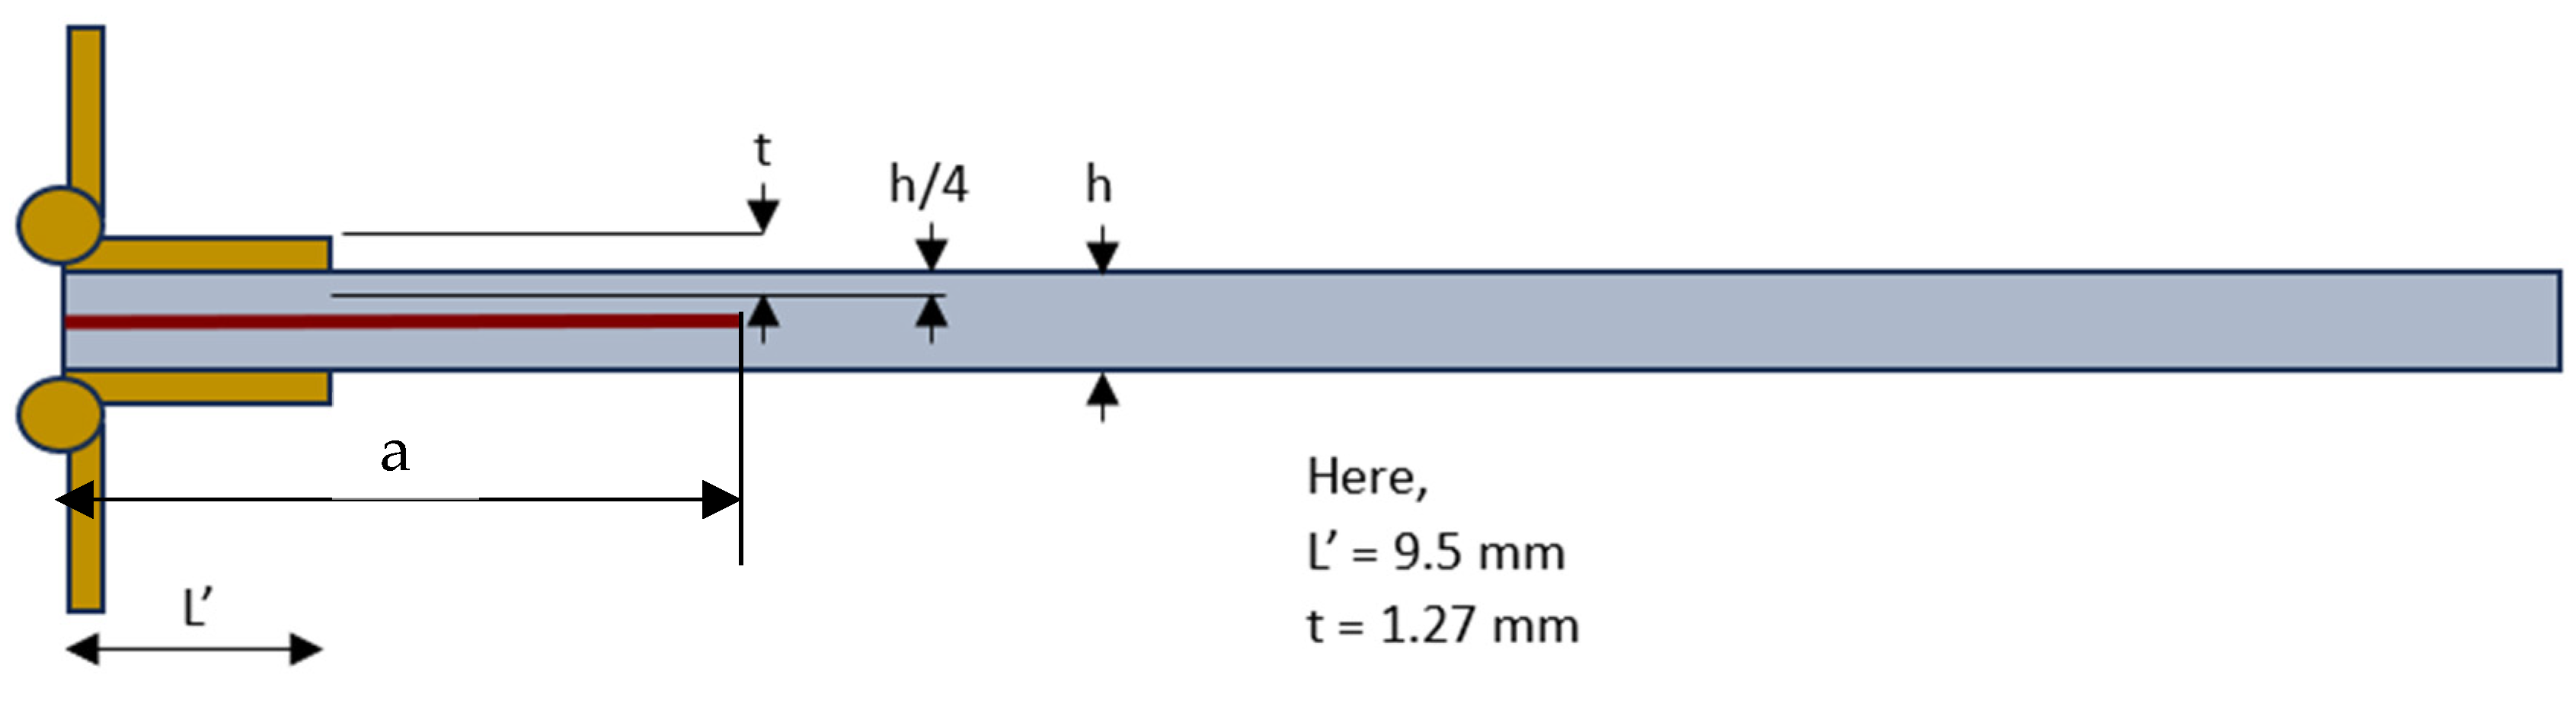
2.3. Specimen Configuration

A double cantilever beam (DCB) specimen configuration suggested by the ASTM D5528 [30] is shown in Figure 3. The dimensions of the specimens include a length of 150 mm and a width of 25 mm, with a pre-crack with a length of 50 mm in accordance with ASTM D5528. All DCB specimens are pre-cracked following a wedge pre-cracking procedure outlined in Annex A3 of ASTM D5528. To conduct the pre-cracking, the specimen is vertically clamped and a wedge consisting of a clean utility blade and a thin aluminum flat bar is used to open the 47 mm pre-crack insert and carefully extend the pre-crack to about 50 mm. Ring probes are painted with a sliver of paint on the top and bottom surfaces of the specimens to supply a constant current of 5 mA. Two U-shaped lines of silver paint, as shown in Figure 3c, are painted partially around the specimen to measure the voltage change during the crack initiation and propagation. Piano hinges are attached to the top and bottom of each specimen at the left end of the DCB specimen (at the beginning of the pre-crack) using J-B Weld™ Original Steel Reinforced Epoxy (purchased from Home Depot, USA). These hinges are used to apply open-mode or mode-I tensile load. Figure 3d provides the side view of the actual test specimen, where crack detection marks are drawn to determine the incremental crack length during crack propagation.
Figure 4 provides a schematic of the experimental setup for fracture experiments, which includes an electrical measurement system. The Instron® universal testing machine with a 50 kN load cell at a rate of 5 mm/min is used to apply the quasi-static opening load. A MicroCapture® Pro digital microscope is used to monitor crack initiation and propagation during the opening mode loading. A Keithley 6620 DC Current Source is used to supply a contact current of 5 mA along the through-thickness direction. A set of two Keithley 6514 Electrometers having a resolution of 10 µV with high impendence (to prevent current leakage) are used to measure the voltages above and below the crack line of the DCB specimens during the crack initiation and propagation. A Keithley 2000 Multimeter with a resolution of 100 µΩ is used to measure the voltage difference between the electrometers and the resulting voltage values are recorded through a LabView program. These three measurements (load and displacement from Instron, voltage measurements from LabView, and incremental crack length measurements from video recording) are synchronized at the same time. Later the correlated data are processed to make plots with three axes and new crack length information, as presented in the experimental results and discussion section (Section 3.3). Examples of the post-mortem specimens for C-composite and G-composite samples are presented in Figure 5 and Figure 6, respectively. Macroscopically, no significant differences can be noticed on the fracture surfaces among the C-composite types, as well as among G-composite types, in these figures. However, microscopically, the specimens experience different damage mechanisms, as captured using scanning electron microscopy (SEM). The images of SEM are discussed in the experimental results and discussion section (Section 3.2).
To determine mode-I interlaminar fracture toughness (GIC), a simple beam theory was used to determine the fracture toughness from the critical strain energy release rate, resulting in Equation (1) [30]. The piano hinges on the pre-crack portion (shown in Figure 3) cause an insignificant stiffening effect on the two halves of the beam specimen, which is determined as per ASTM D5528 standard:
G I C = 3 P δ 2 b a ( F N )
where P and δ are the load and crack opening displacement at the crack initiation, b is the width of the specimen and a is the crack length:
F = 1 3 10 ( δ a ) 2 3 2 ( δ t a 2 )
N = 1 ( L a ) 3 9 8 [ 1 ( L a ) 2 ] ( δ t a 2 ) 9 35 ( δ a ) 2
Here, parameters L and t are measured from the DCB specimen, as shown in Figure 7.

3. Experimental Results and Discussion

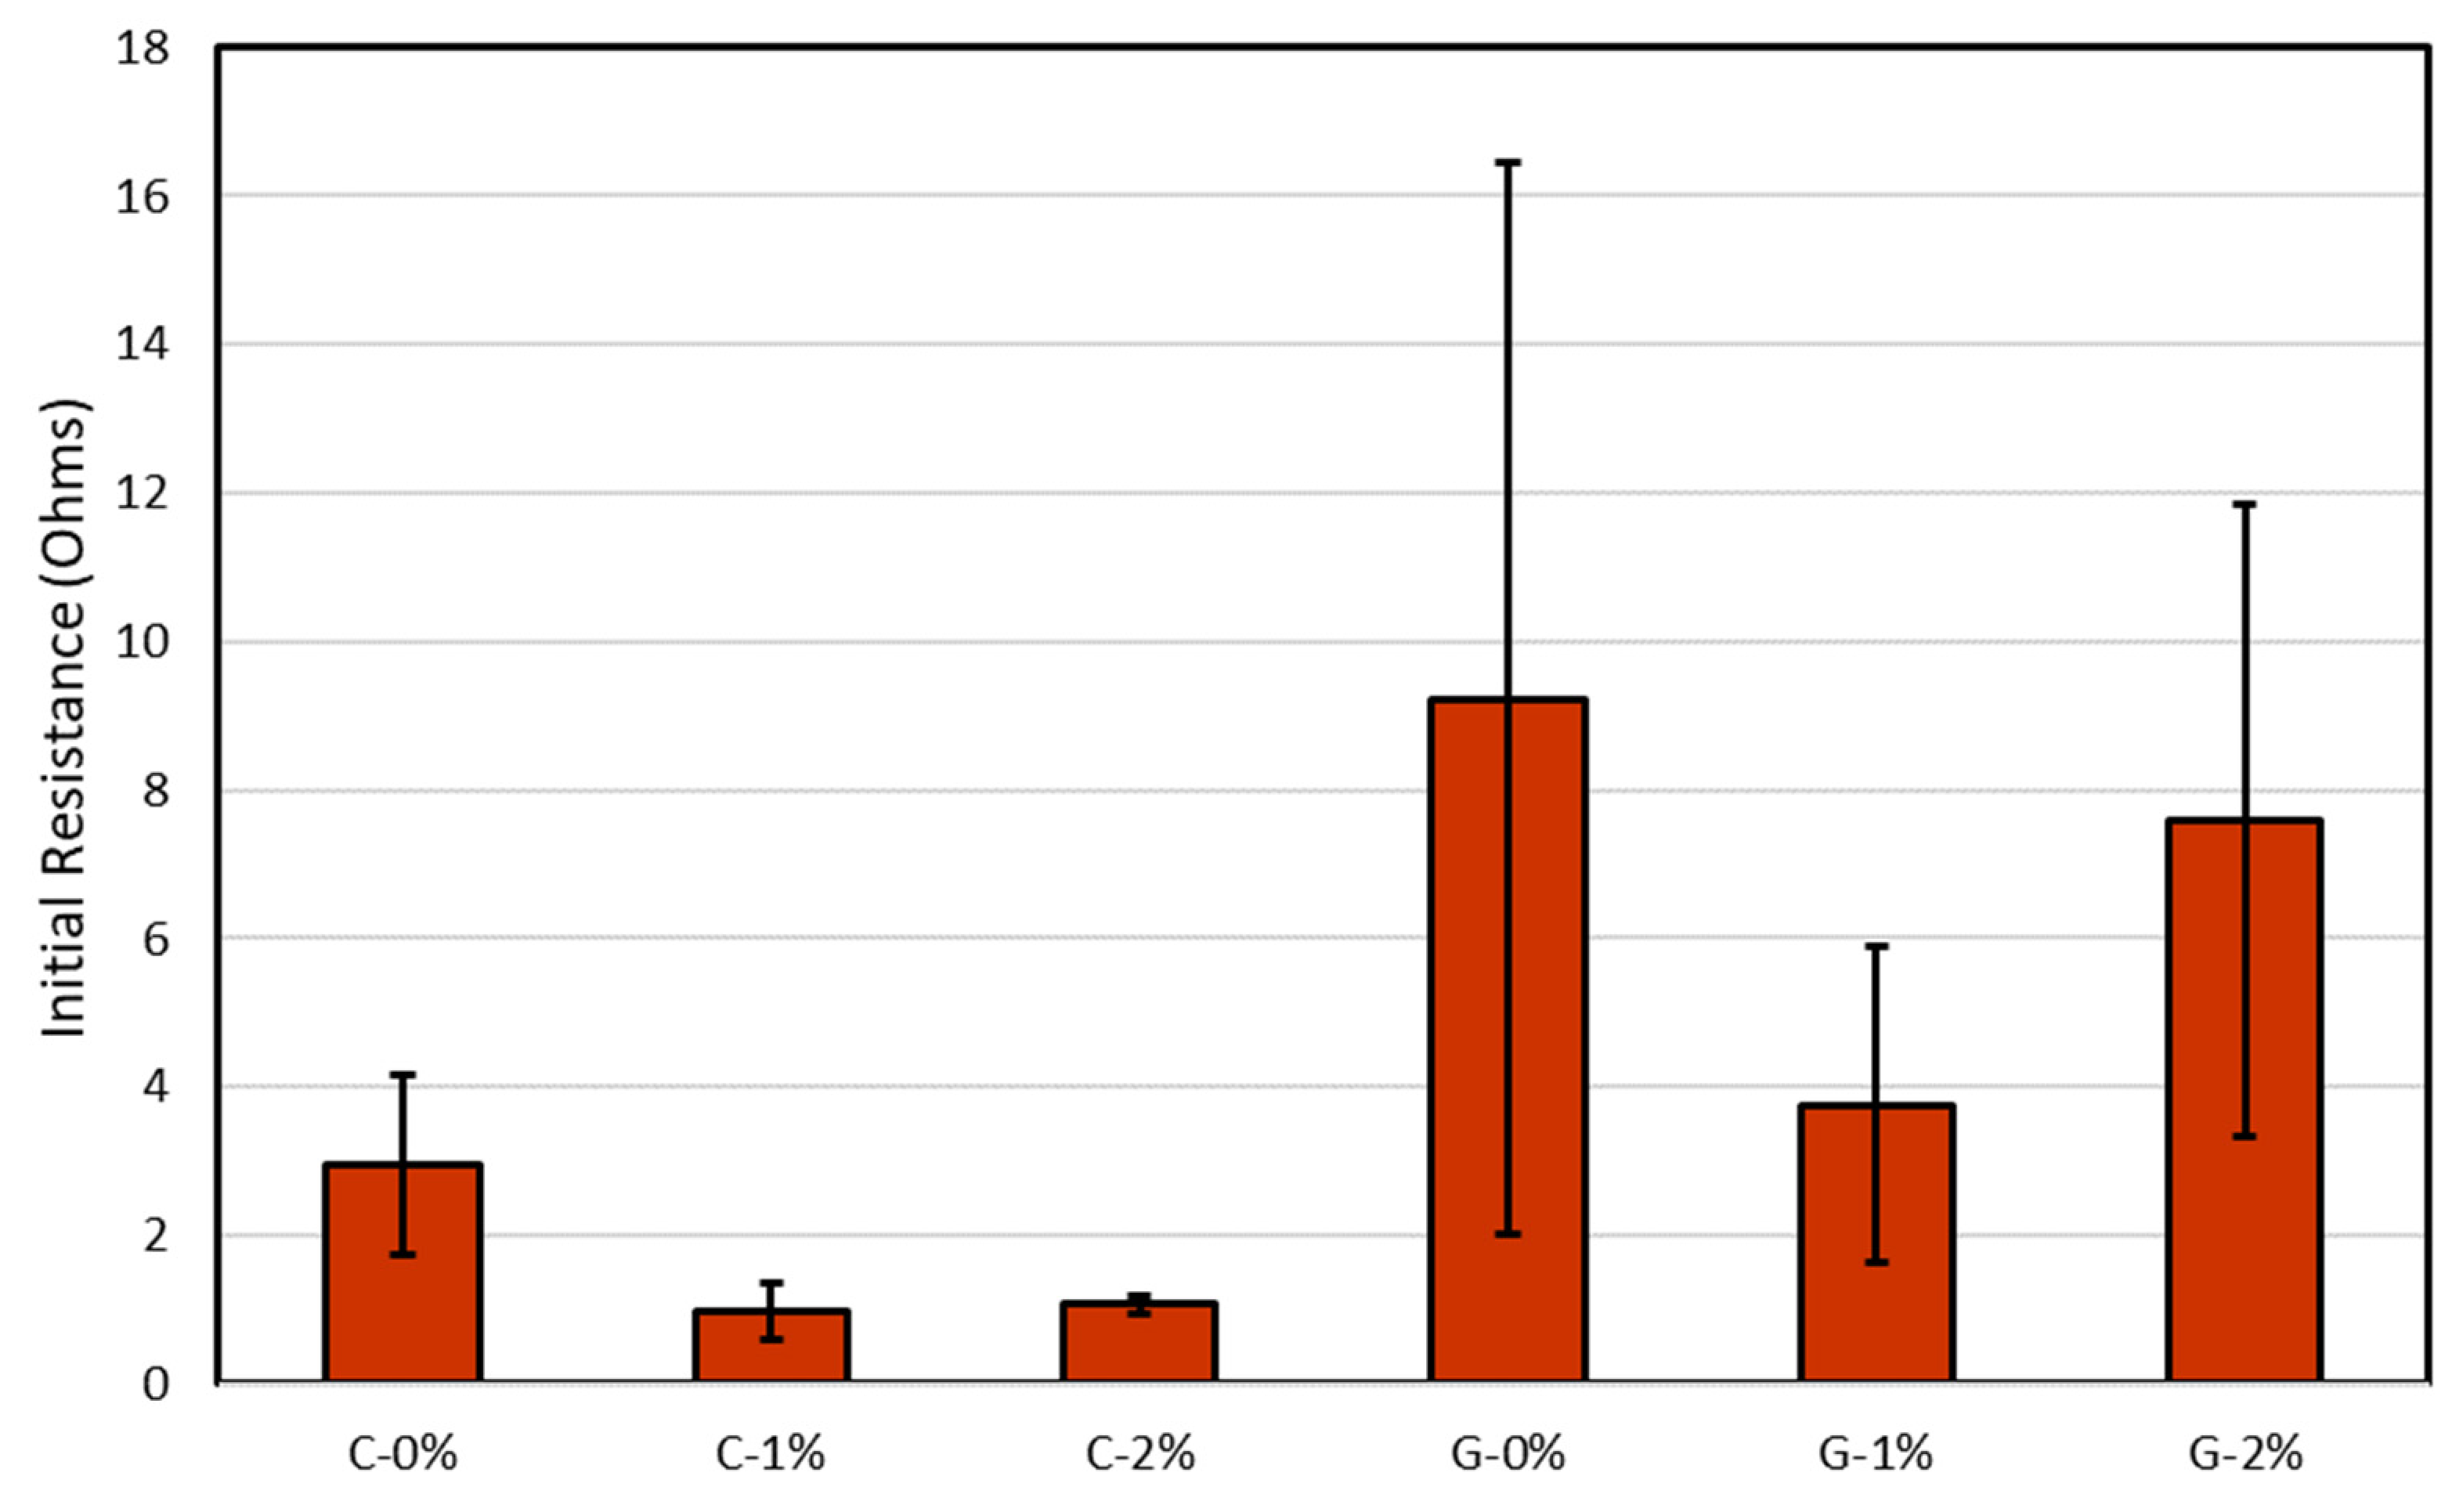
3.1. Initial Resistance before Application of Fracture Load

The initial resistance of all composite types before the application of fracture load is determined and shown in Figure 8. The addition of liquid metal brings down the initial resistance by about 66% with the presence of 2% liquid metal in C-2%. The liquid metal improves the conductive network of the composite by creating conductive paths through the carbon-fiber–liquid-metal contacts in the liquid metal pockets. Whereas, for G-composites, the mean value of the initial resistance of G-1% decreases significantly compared to that of no-liquid metal by 60%. However, the mean value of the initial resistance of G-2% decreases by 18% with the addition of liquid metal from 0% to 2%. We note the large variation in initial resistance for all G-composites specifically, which makes this trend less conclusive.

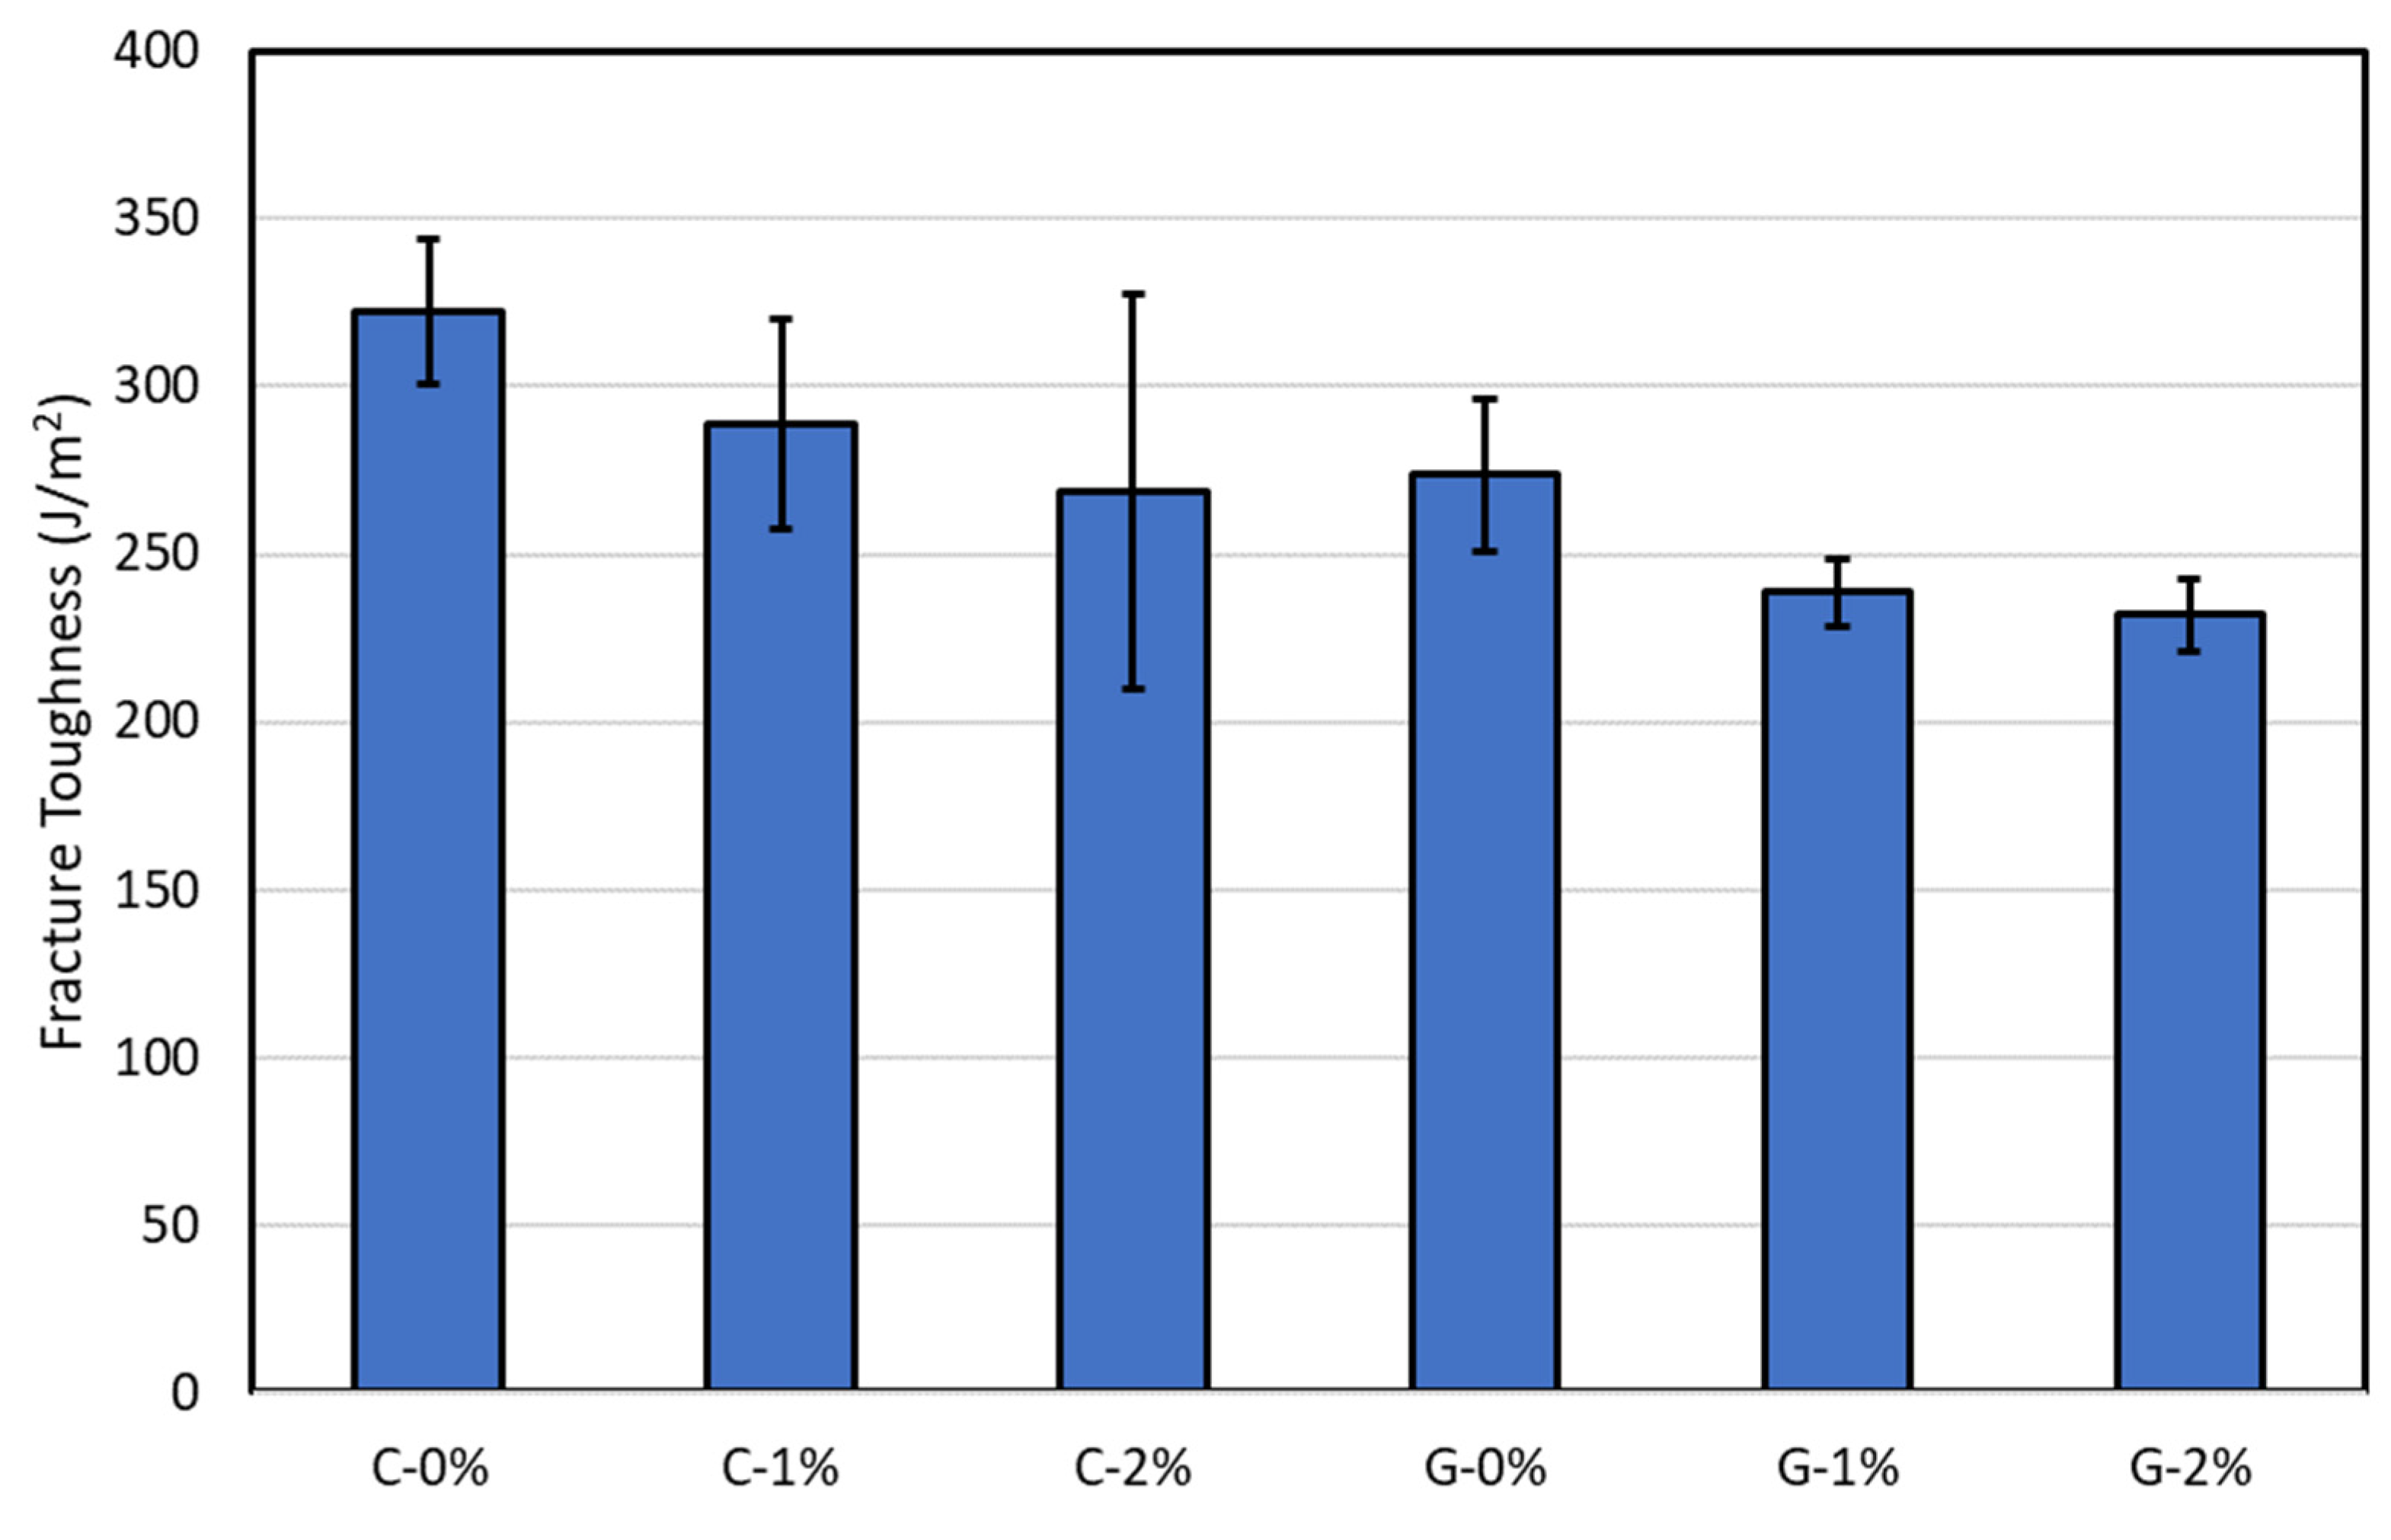
3.2. Fracture Initiation Toughness

The load-displacement and electrical response of the C-0%, C-1%, and C-2% composite types are shown in Figure 9; whereas, the load-displacement and electrical response of the G-0%, G-1%, and G-2% composite types are shown in Figure 10. A minimum of four experiments for each composite type are conducted for statistical confidence and significance. Load-displacement diagrams for all composite types are highly consistent to emphasize the reproducibility of the experiments. In case, the electrical resistance change response of the composites is also significantly similar qualitatively with a similar trend, except that in some cases the nature of the local characteristics during the crack propagation dictates the electrical resistance change. Hence, it is impossible to expect a reproducible electrical resistance response in all experiments of the same composite type. The C-composite types showed much higher fracture load compared to G-composite types as the carbon fibers aligned along the crack growth direction offer a considerable amount of stiffness compared to G-composite, where the carbon fibers are aligned normally to the crack growth direction.
Figure 11 provides the fracture initiation toughness values of six different composite types. In general, the addition of liquid metal decreases the fracture toughness values significantly and more so at the higher wt.% compared to control composites of both C-0% and G-0%. It can also be noticed that C-0% composites demonstrate much higher fracture toughness compared to G-0% by 18%. Since carbon fibers are brittle and need higher strength to break, the fracture initiation toughness is much higher for C-0% composites. Figure 12 shows the fracture surfaces near the initiation point of all three C-composite types, where for C-0% composites, the major failure mechanisms are carbon fiber breakage and matrix cracking. Although the failure mechanisms do not change significantly with the addition of liquid metal, as shown in Figure 12b,c for C-1% and C-2%, respectively, the fracture toughness decreases with the addition of liquid metal by 10% and 17%, respectively. This can be due to the reason that liquid metal does not adhere with the laminate and, hence, acts as a defect in the composite, which allows the composite to have crack initiation at a lesser force value, as shown in Figure 9b,c, compared to that of C-0% shown in Figure 9a. The droplets of liquid metal on the fracture surfaces can be zoomed in, as shown in the image of the C-2% composite in Figure 12d. The liquid metal droplets take a range of shapes and scales due to the vacuum infusion process. The infusion process leads to the formation of large, irregularly shaped liquid metal pockets, which may form as small spherical droplets combine to create larger ones. Figure 12d also depicts these spherical liquid metal droplets on the fracture surfaces, which can range from 20 µm diameters to as small as 0.5 µm diameters.
In contrast to C-0% composites, the G-0% composites demonstrate the fracture surface predominantly with matrix failure and fiber/matrix delamination, as shown in Figure 13a. The addition of liquid metal does not change the failure mechanisms for both the G-1% and G-2% composites shown in Figure 13b,c, respectively. This again indicates that the presence of liquid metal acts like a defect inside, between the laminates in G-1% and G-2% composites, thus causing composites to initiate the crack at a lesser force value, as shown in Figure 10b,c. This load drop impacts the decrease in the fracture toughness values of G-1% and G-2% composites by about 12% and 15%, respectively, compared to the G-0% composites. Once again, the presence of liquid metal droplets in G-1% and G-2% can be seen in Figure 13b–d. Similar to C-composites, liquid metal takes the form of large liquid metal pockets and small spherical droplets.

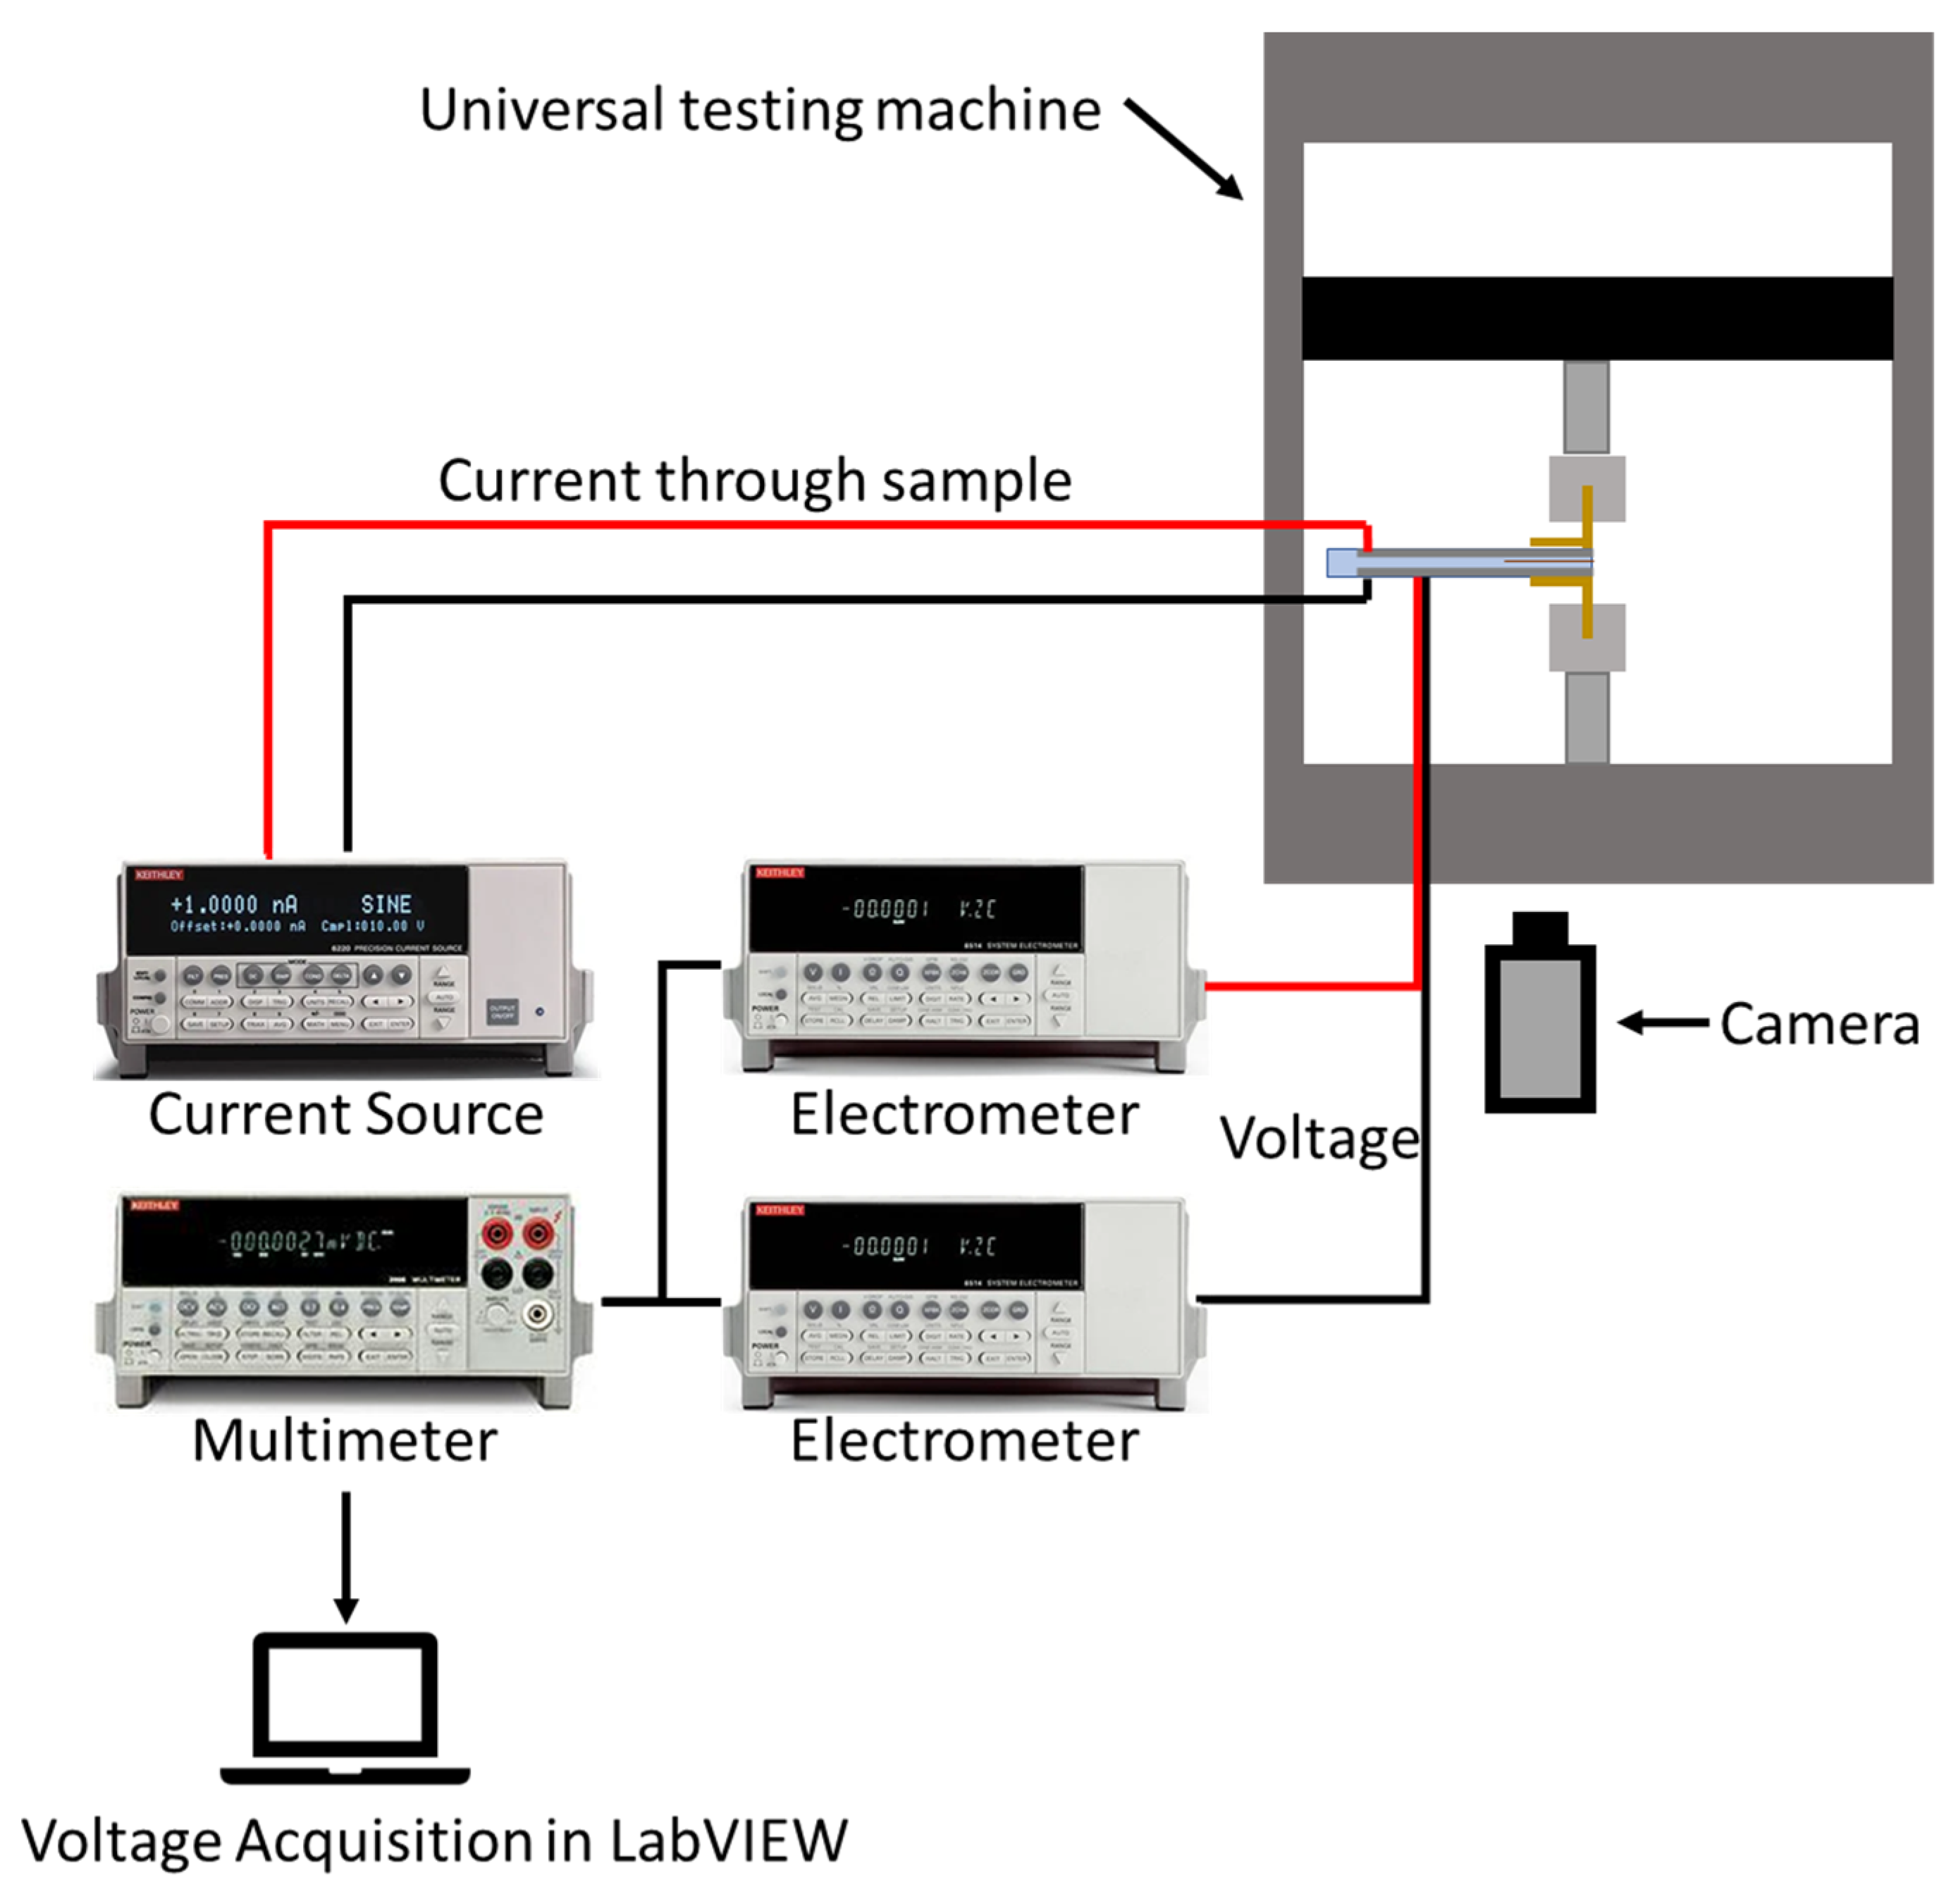
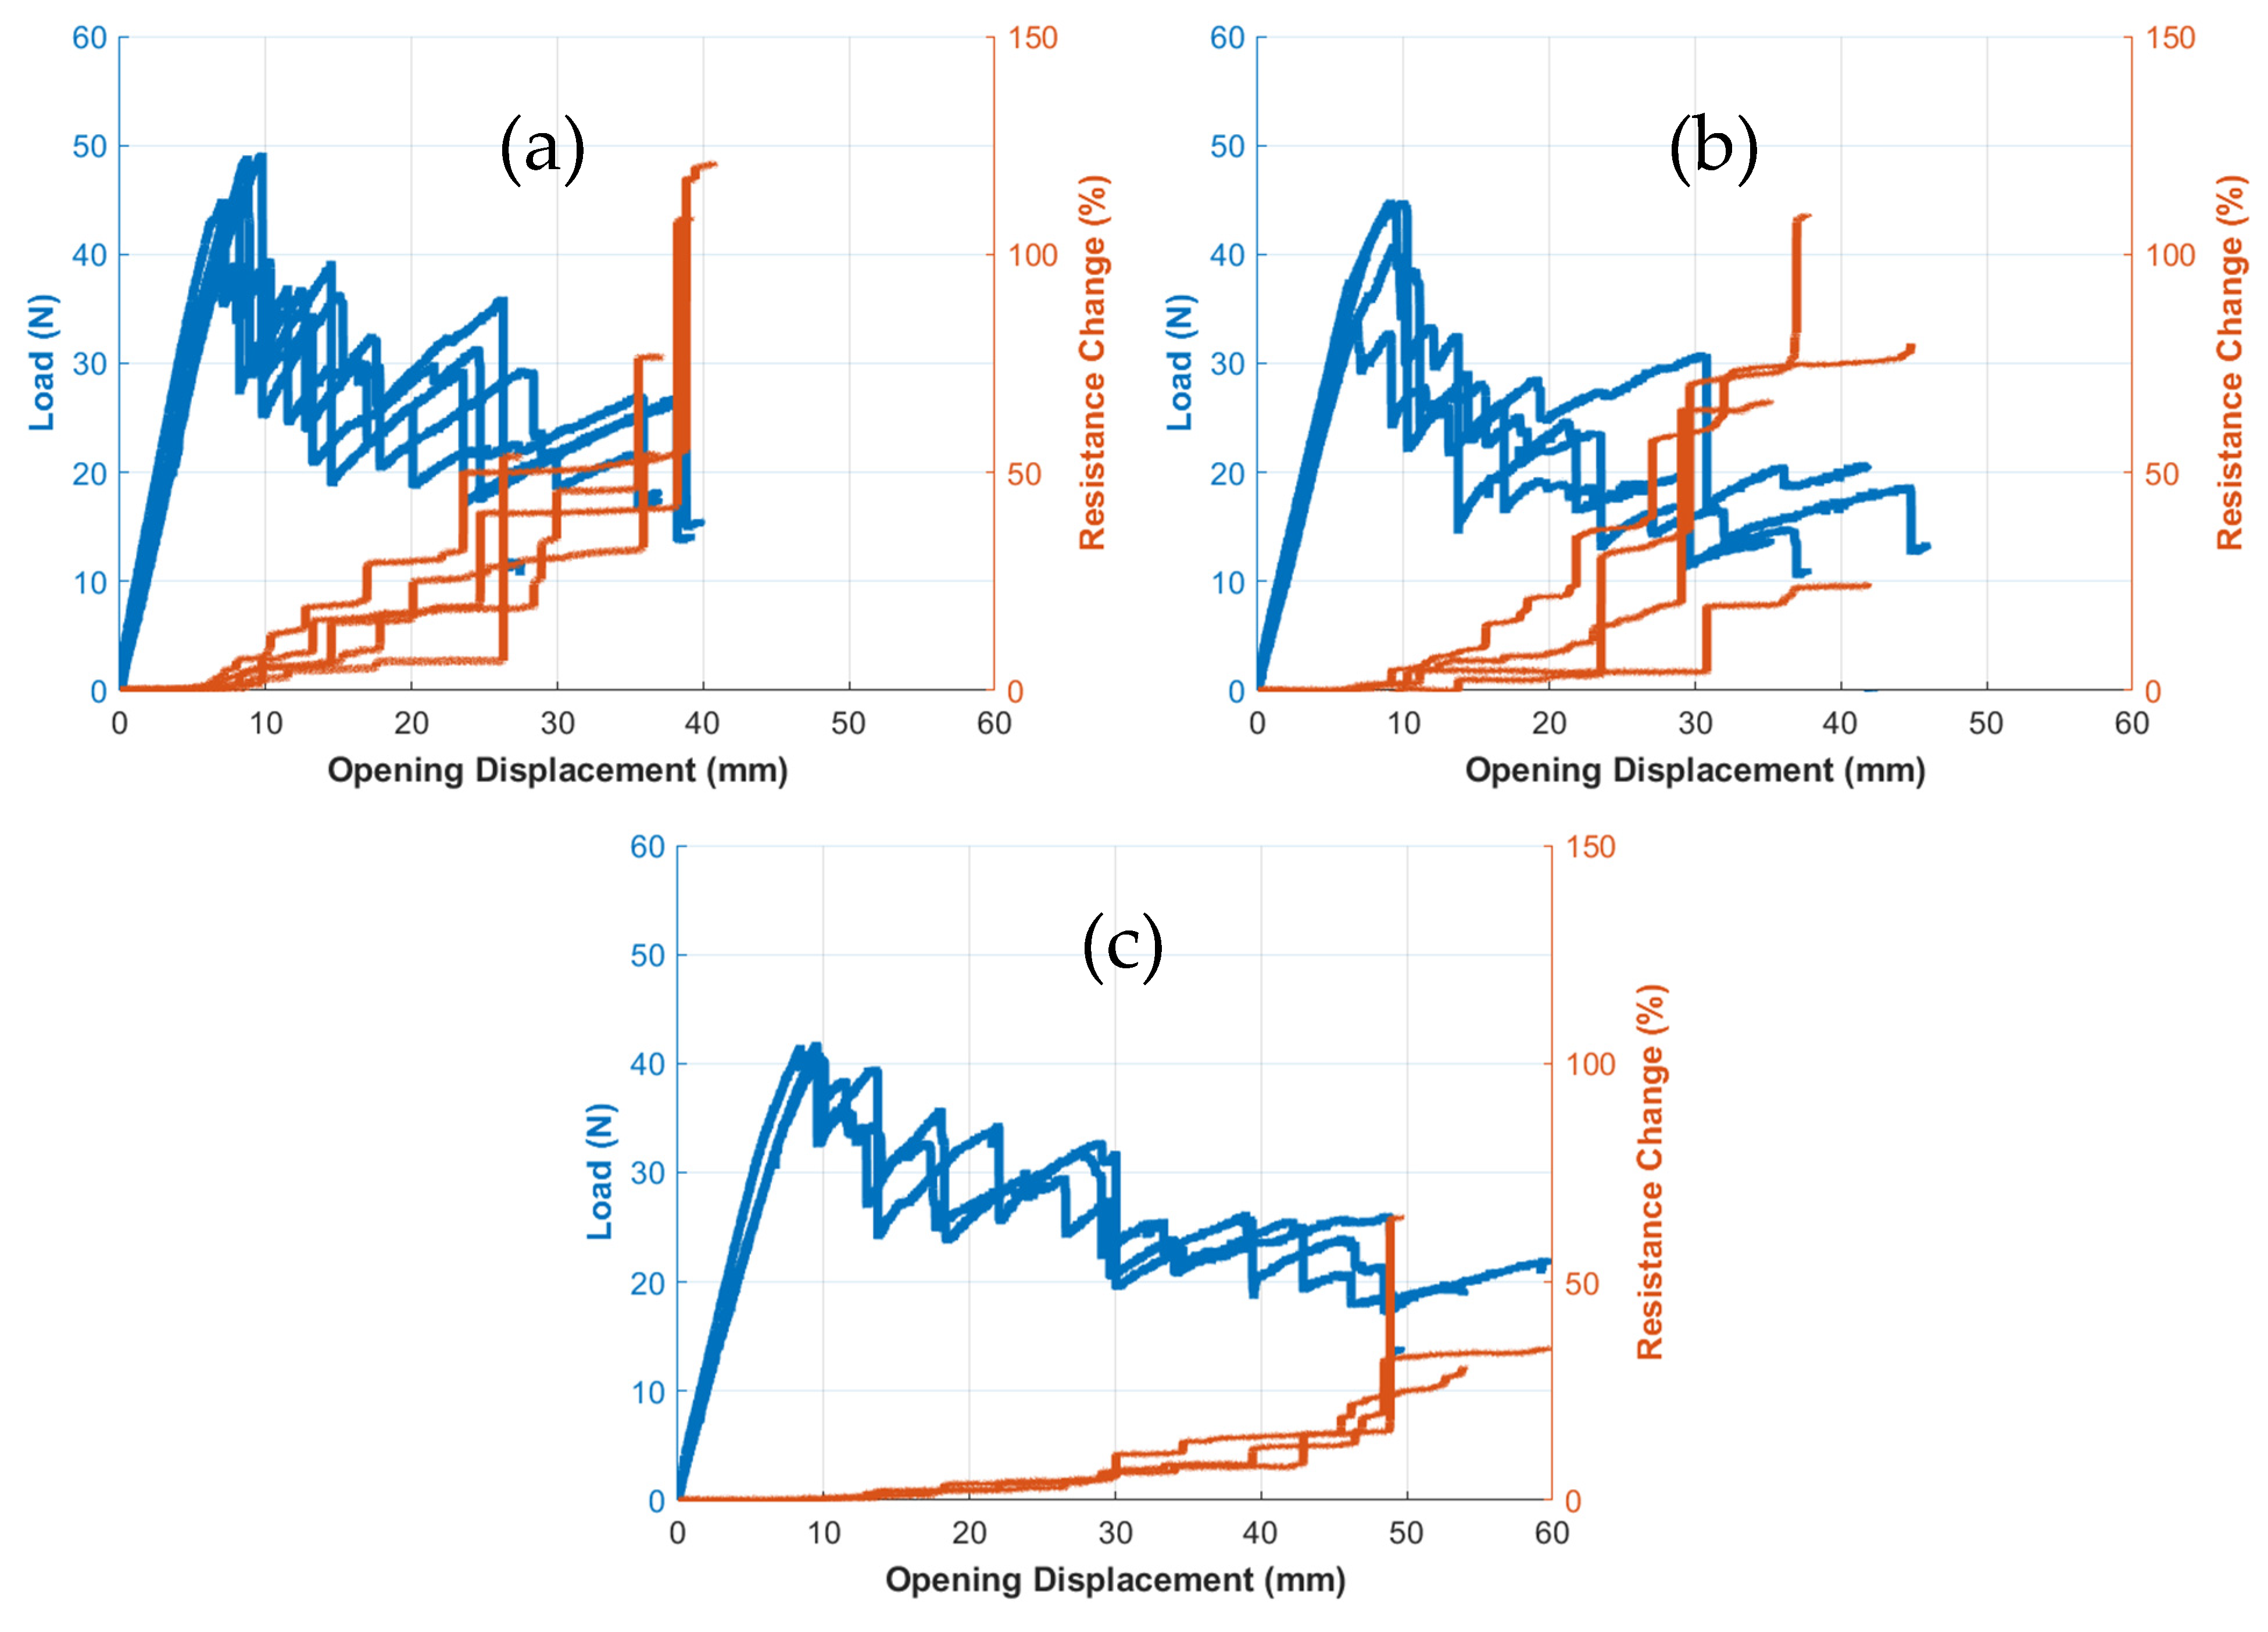
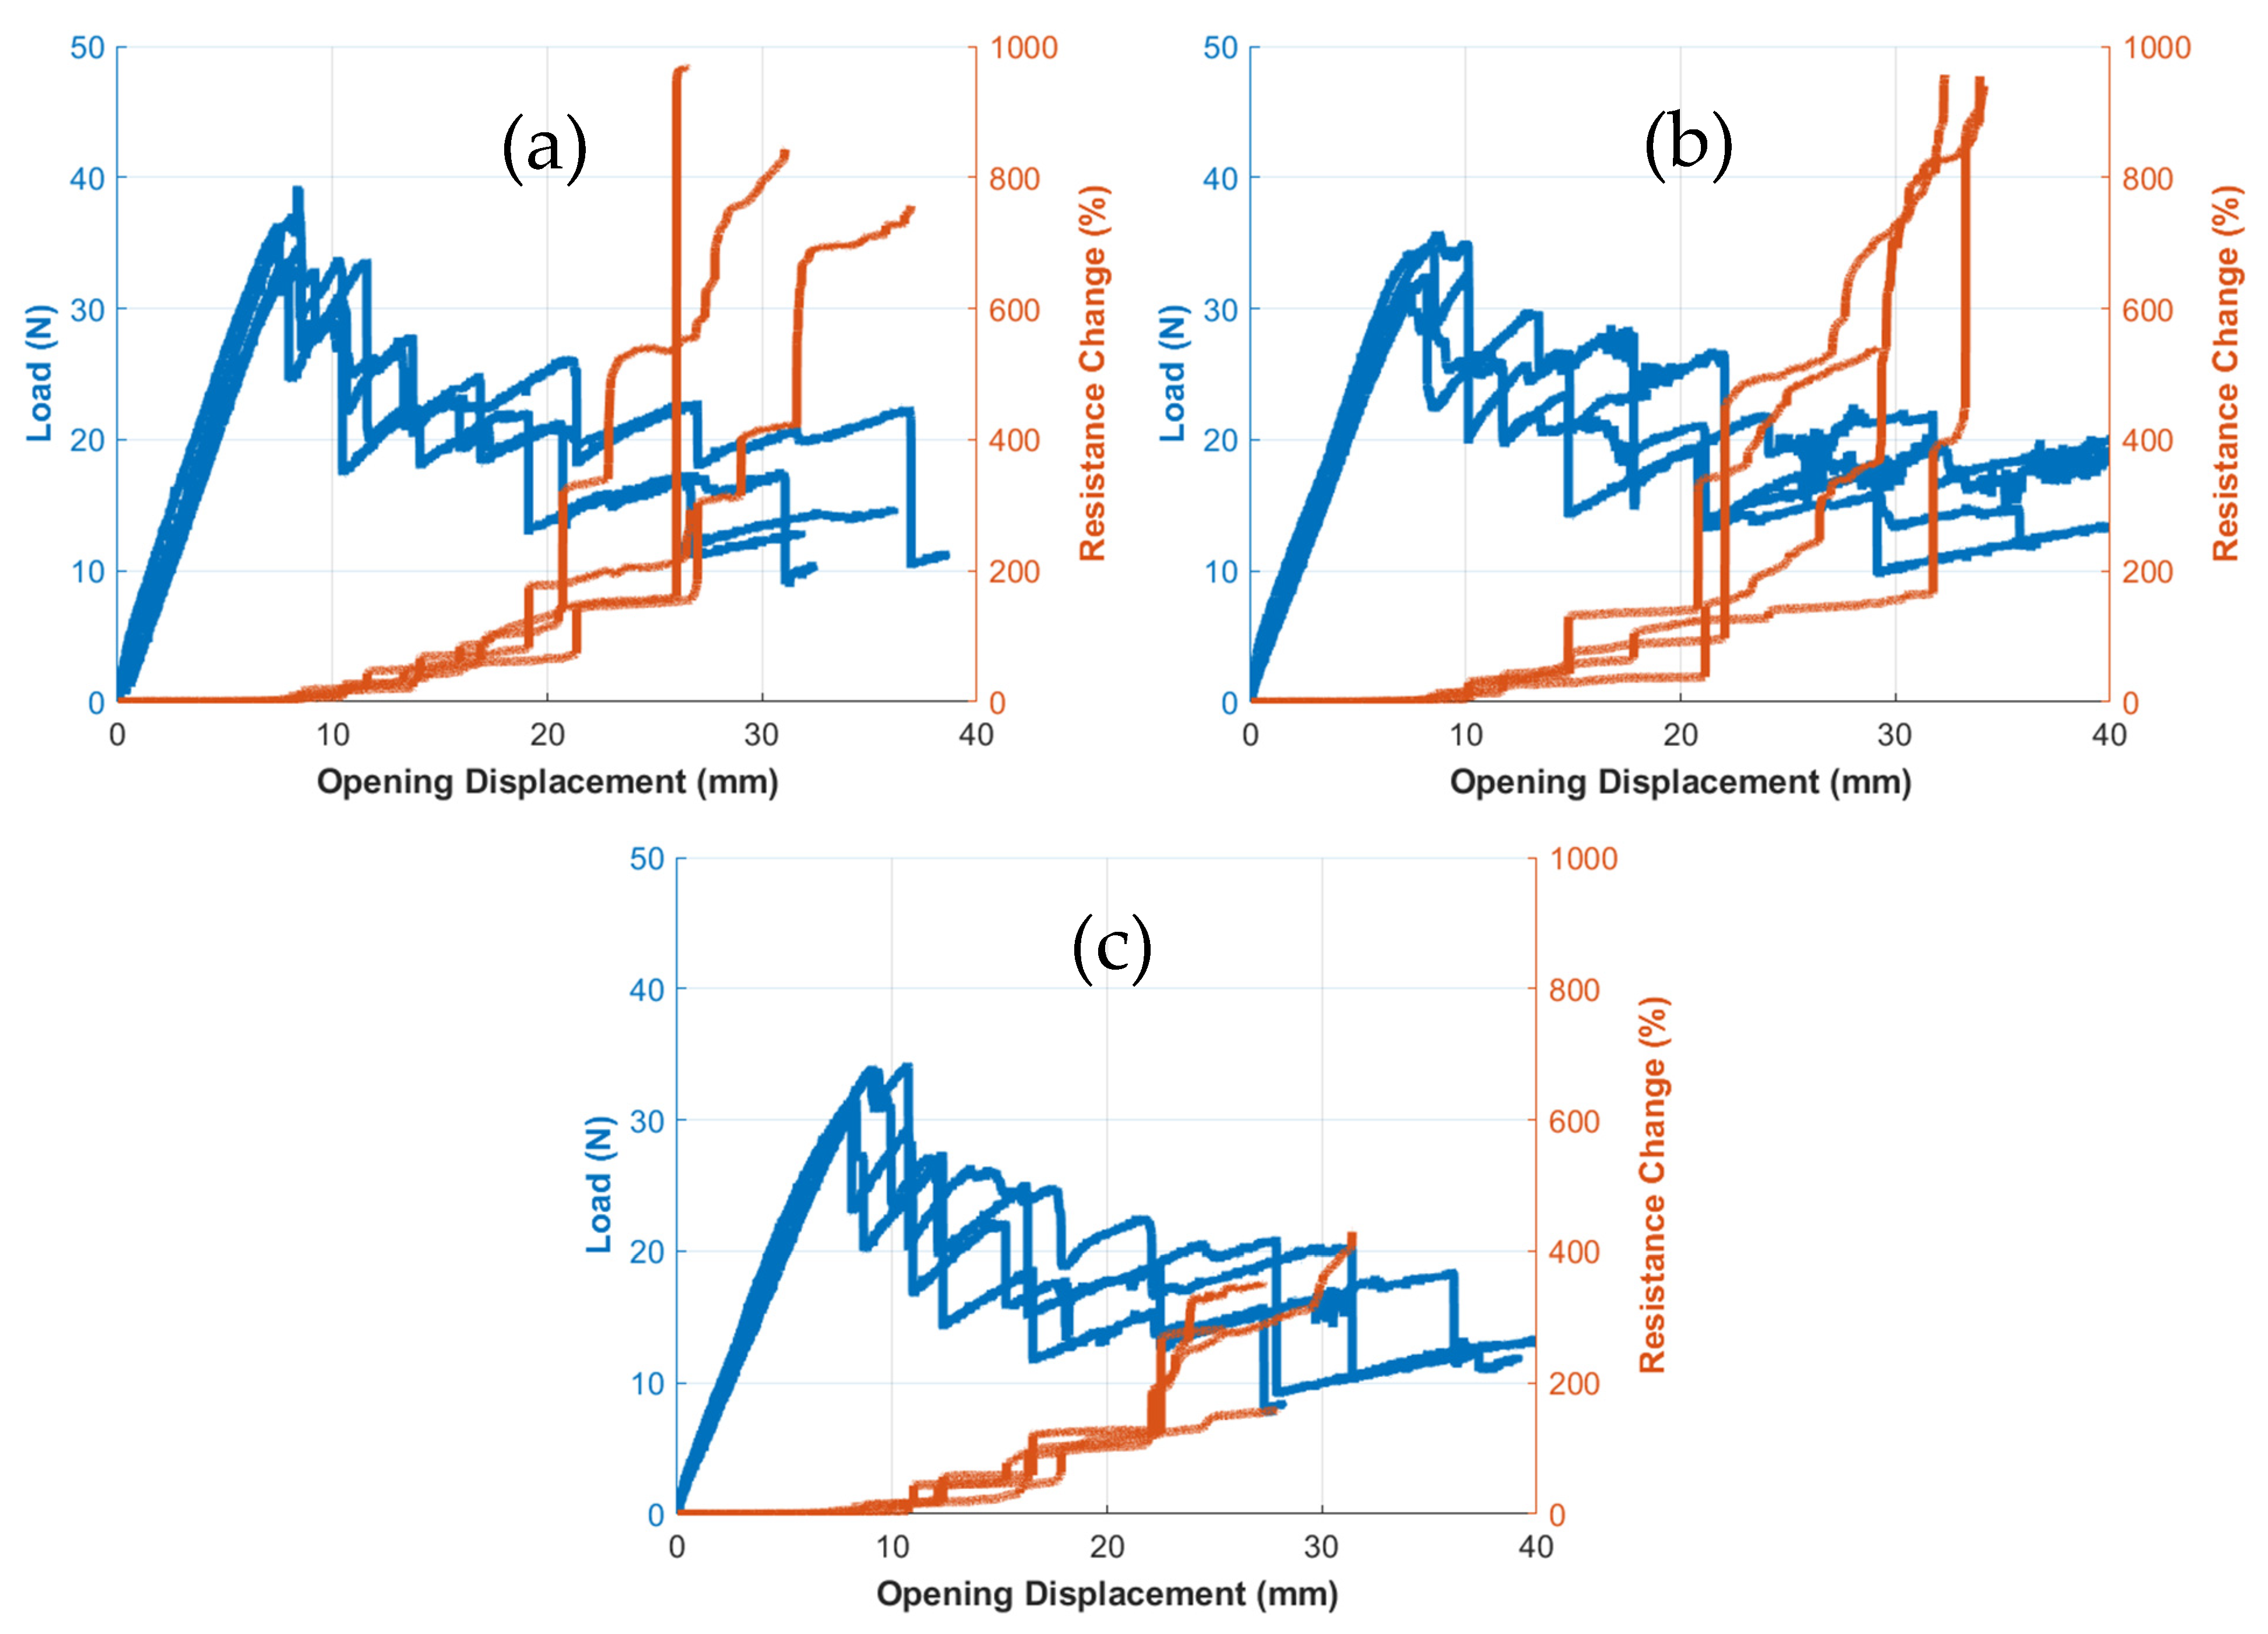
3.3. Piezo-Resistance Change Response

Figure 14 shows the representative curves of load and electrical resistance change (R%) against opening displacement for all three C-0%, C-1%, and C-2% composite types. The major feature of the electrical responses of all composite types is the step-wise increase in resistance for each drop in load. The crack propagates with a stick-slip mechanism where the specimen stores the required amount of strain energy to advance the crack further in steps. Until a sufficient amount of energy is available, crack arrest happens in all these composite types. Hence, there is no crack growth between the two load drops. The crack takes much higher displacement between crack advances for C-2% compared to the other two composite types. It can be due to the presence of liquid metal of 2% that the specimen needs much higher crack mouth opening displacement, making the composite a bit flexible.
It is evident in C-0% that the percentage resistance change is much higher for incremental crack growth as the composite has much higher initial resistance, as shown in Figure 8. Any breaking of the conductive network due to crack growth will lead to a higher change in resistance. With the addition of liquid metal, as in the case of C-1%, the percentage increase in resistance change with incremental crack growth is less than that of C-0%. However, there is no significant difference in percentage change in resistance for incremental growth between C-1% and C-2%. This is expected as there is not much difference in initial resistance between these composite types due to the given error bars shown in Figure 8. Overall, the C-0% composite demonstrates a much higher maximum percentage change resistance (of about 125%) before the DCB specimen completely separates compared to the other two composite types (a maximum value of about 65% for C-1% and a maximum value of about 35% for C-2%). It is again due to the insufficient conductive paths that were generated between the carbon yarn in intraply composites; whereas, the liquid metal creates additional conductive paths between the plies.
Figure 15 shows the percentage of resistance change and force variation with respect to the opening-mode displacement of the G-0%, G-1%, and G-2% composites. The G-composites demonstrate much higher jumps of resistance change compared to those of C-composites. These higher jumps are anticipated because the initial resistance of the G-composite types is significantly higher than that of the C-composite types, as shown in Figure 8. A similar trend of peak resistance change is also observed in G-composites where the addition of liquid metal considerably lowers the peak resistance change, especially for G-2% composite. This might be due to the presence of a better local conductive network with 2% liquid metal compared to other G-composite types. The peak resistance change for G-0% composites is about 725% and the same for G-2% is 175%. In addition to peak resistance change, for the G-2% composite, the resistance change for the crack growth beyond a = 100 mm is less than 100%. However, for the other two G- composite types, the resistance change beyond a = 100 mm is a significantly high value of 580% for C-0% and 725% for C-1%. It is clearly evident that the presence of 2% liquid metal in G-composites plays a significant role in the conductive network; although, the initial resistance shown in Figure 8 is not significantly different from the given error bars.

4. Conclusions

An experimental study is performed to investigate the influence of liquid metal on fracture toughness and the piezo-resistance response of intraply laminated hybrid composites under quasi-static mode-I fracture loading conditions. The major outcomes of this study are as follows:
(a)
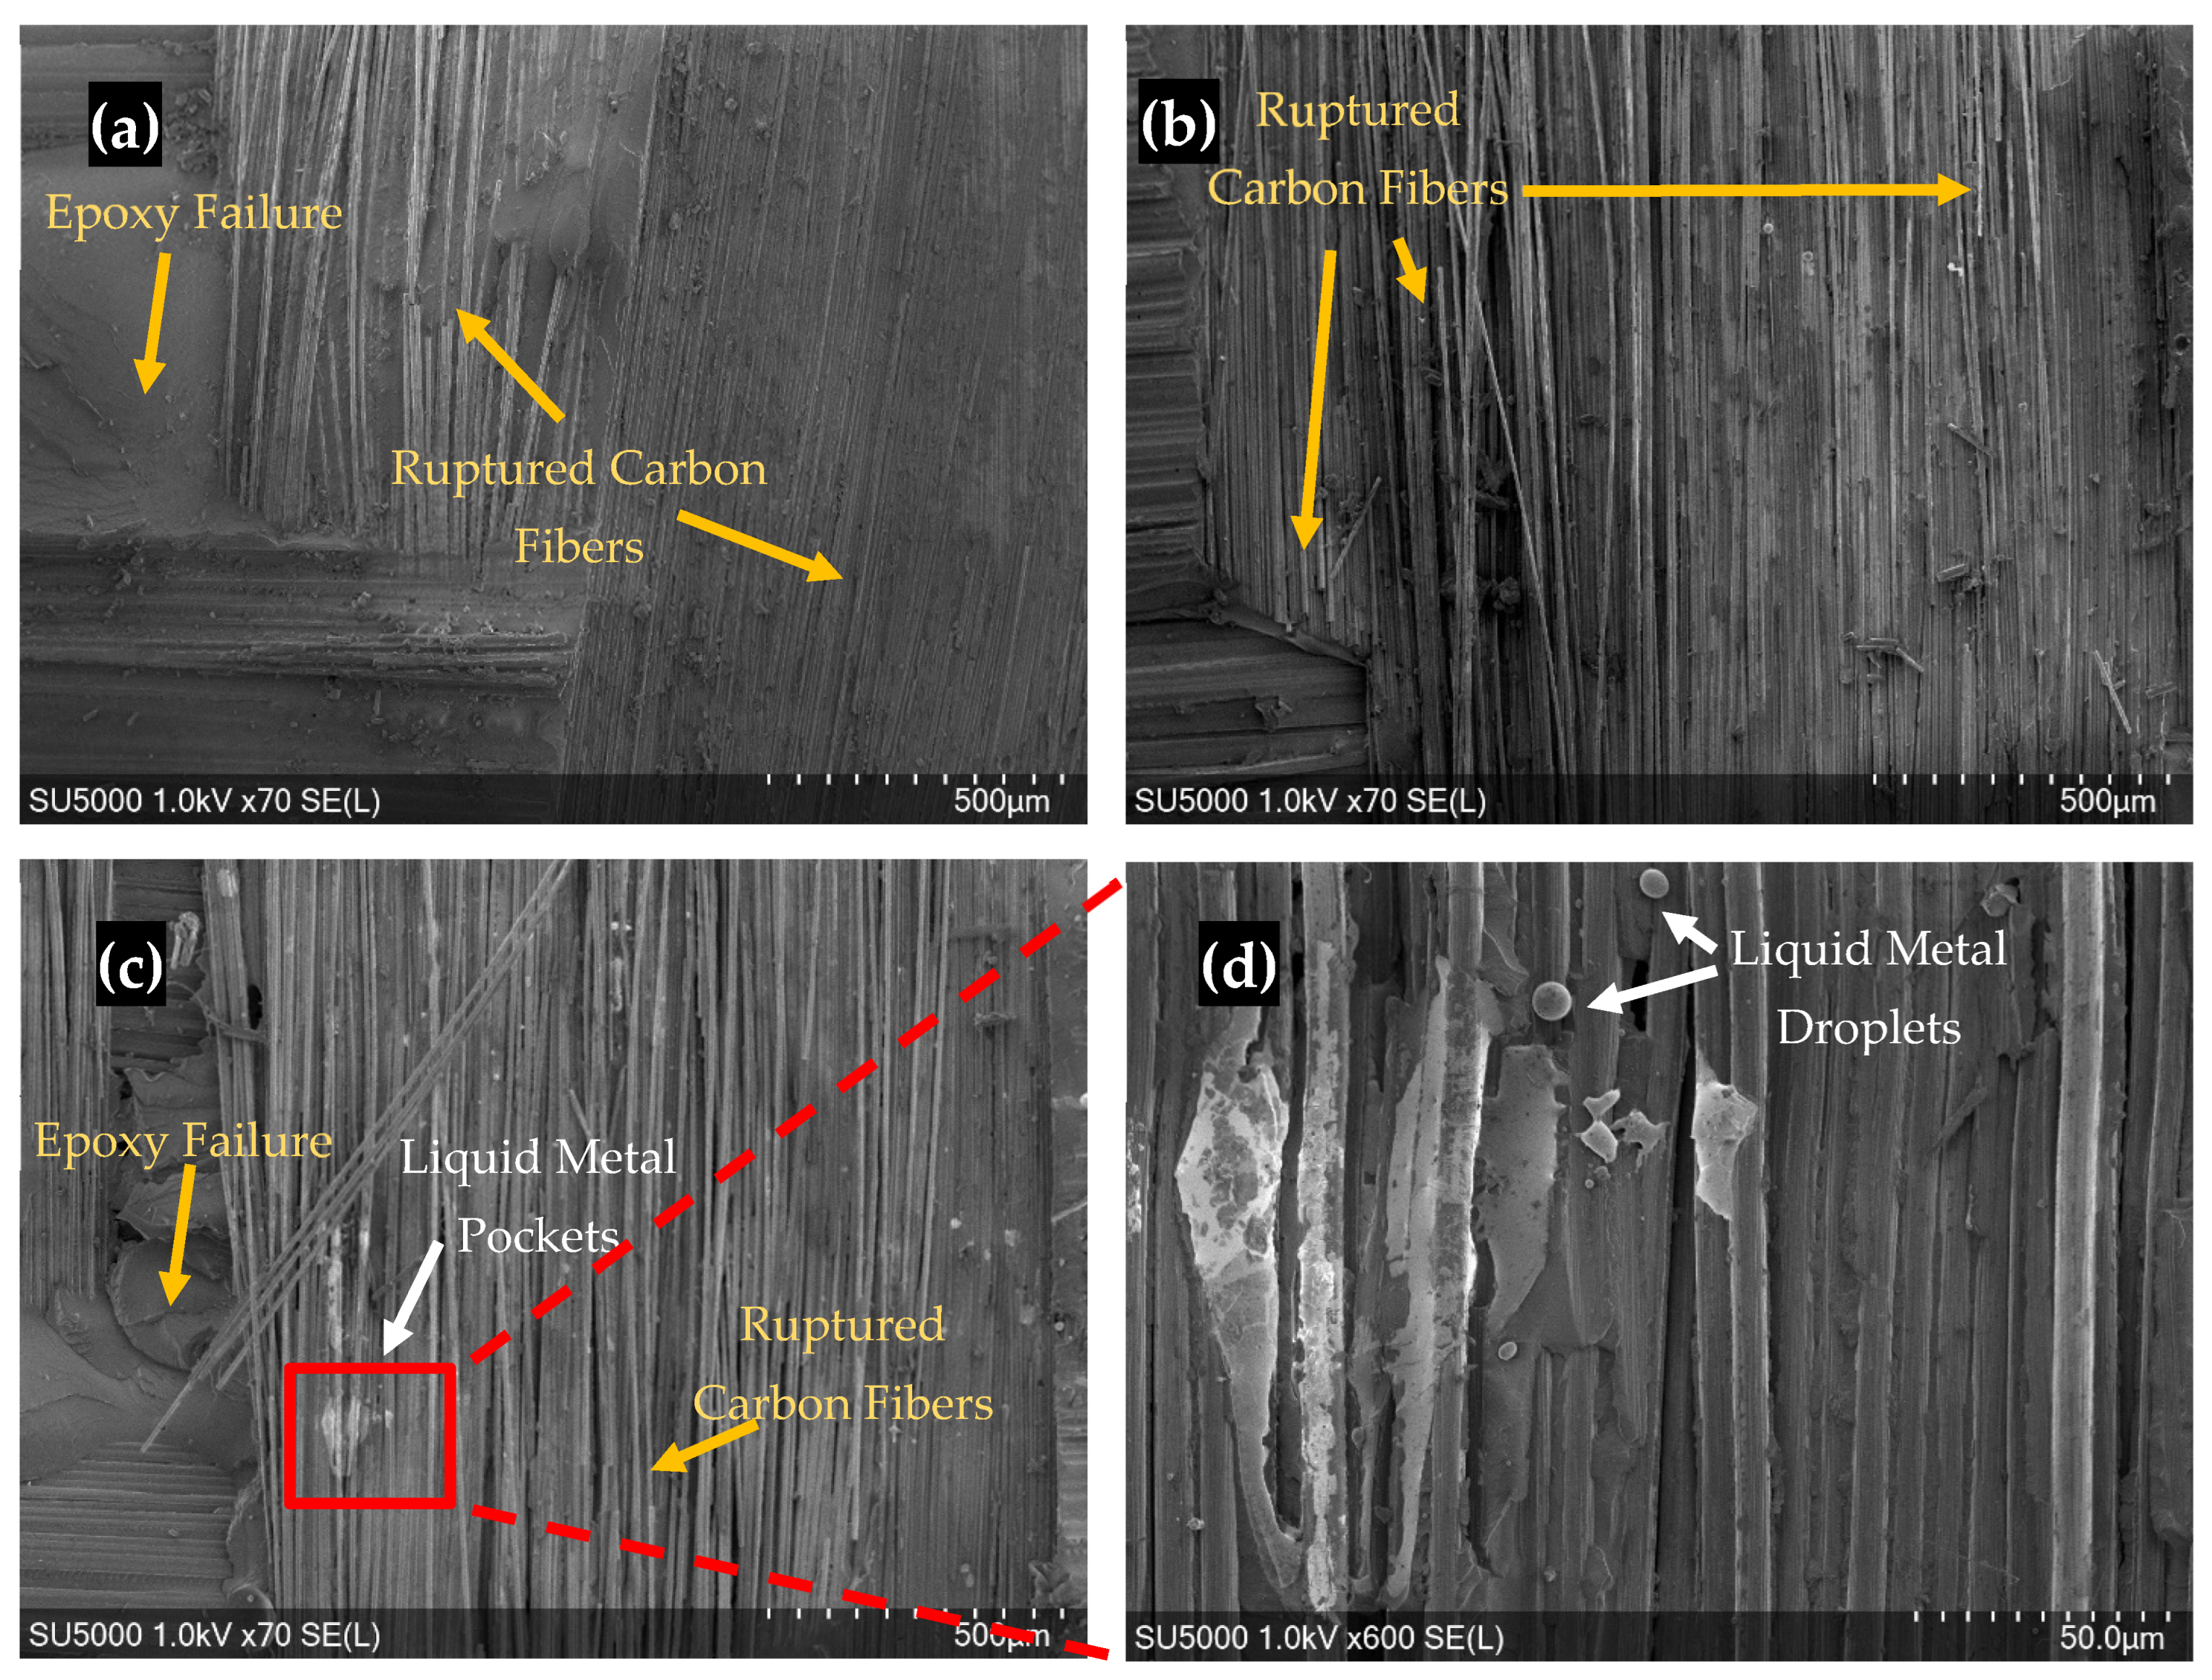
The C-composite without liquid metal demonstrates higher fracture toughness compared to that of the G-composite due to carbon fiber breakage;
(b)
The addition of liquid metal decreases the fracture toughness considerably in both composite types (C and G);
(c)
The addition of 2% liquid metal makes the C-composite type slightly flexible with higher crack opening displacement and the same is not observed in G-composite types;
(d)
The liquid metal increases the conductivity of C-composite types significantly, causing them to have less peak resistance change before the complete failure of the fracture specimen compared to corresponding G-composites;
(e)
In both C- and G-composites, the peak resistance change of composites with 2% liquid metal is substantially lower than that of both no-liquid metal and 1% liquid metal composites.
The results of this study are useful for damage-sensing applications of both commercial and defense composite structures where early detection of damage in them will prevent catastrophic failure. In the present study, the addition of LM decreases fracture toughness values; however, it can be improved by anchoring LM to the polymer matrix with proper coating/chemical bonding.

Author Contributions

All authors performed the investigation and participated in the writing and the final review. All authors have read and agreed to the published version of the manuscript.

Funding

The authors acknowledge the financial support from the National Science Foundation grant (NSF-DMR:2149893). The author also acknowledges the National Science Foundation grant (NSF-MRI-1726239) used for acquiring scanning electron microscopy.

Data Availability Statement

Data are contained within the article.

Conflicts of Interest

The authors declare no conflicts of interest.

References

  1. Chung, D.D.L. Carbon Fiber Composites; Butterworth-Heinemann: Newton, MA, USA, 1994. [Google Scholar]
  2. Mohan, N.S.; Kulkarni, S.M.; Ramachandra, A. Delamination analysis in drilling process of glass fiber reinforced plastic (GFRP) composite materials. J. Mater. Process. Tech. 2007, 186, 265–271. [Google Scholar] [CrossRef]
  3. Pendhari, S.S.; Kant, T.; Desai, Y.M. Application of polymer composites in civil construction: A general review. Comp. Struct. 2008, 84, 114–124. [Google Scholar] [CrossRef]
  4. Hsissou, R.; Seghiri, R.; Benzekri, Z.; Hilali, M.; Rafik, M.; Elharfi, A. Polymer composite materials: A comprehensive review. Comp. Struct. 2021, 262, 113640. [Google Scholar] [CrossRef]
  5. Rajak, D.K.; Pagar, D.D.; Menezes, P.L.; Linul, E. Fiber-Reinforced Polymer Composites: Manufacturing, Properties, and Applications. Polymers 2019, 11, 1667. [Google Scholar] [CrossRef] [PubMed]
  6. Jung, H.; Kim, Y. Mode I fracture toughness of carbon-glass/epoxy interply hybrid composites. J. Mater. Process. Tech. 2015, 29, 1955–1962. [Google Scholar] [CrossRef]
  7. Kirk, J.N.; Munro, M.; Beaumont, P.W.R. The fracture energy of hybrid carbon and glass fibre composites. J. Mater. Sci. 1978, 13, 2197–2204. [Google Scholar] [CrossRef]
  8. Thorat, H.T.; Lakkad, S.C. Fracture Toughness of Unidirectional Glass/Carbon Hybrid Composites. J. Compos. Mater. 1983, 17, 2–14. [Google Scholar] [CrossRef]
  9. Wang, S.; Chung, D.D. Self-sensing of flexural strain and damage in carbon fiber polymer-matrix composite by electrical resistance measurement. Carbon 2006, 44, 2739–2751. [Google Scholar] [CrossRef]
  10. Ku-Herrera, J.J.; Saponara, V.L.; Aviles, F. Selective damage sensing in multiscale hierarchical composites by tailoring the location of carbon nanotubes. J. Intel. Mat. Syst. Str. 2018, 29, 553–562. [Google Scholar] [CrossRef]
  11. Aly, K.; Bradford, P.D. Real-time impact damage sensing and localization in composites through embedded aligned carbon nanotube sheets. Compos. Part B Eng. 2019, 162, 522–531. [Google Scholar] [CrossRef]
  12. Lee, H.; Koo, B.; Chattopadhyay, A.; Neerukatti, R.K.; Liu, K.C. Damage detection technique using ultrasonic guided waves and outlier detection: Application to interface delamination diagnosis of integrated circuit package. Mech. Syst. Signal. Process. 2021, 160, 107884. [Google Scholar] [CrossRef]
  13. Chrysafi, A.P.; Athanasopoulos, N.; Siakavellas, N.J. Damage detection on composite materials with active thermography and digital image processing. Int. J. Therm. Sci. 2017, 116, 242–253. [Google Scholar] [CrossRef]
  14. Schilling, P.J.; Karedla, B.R.; Tatiparthi, A.K.; Verges, M.A.; Herrington, P.D. X-ray computed microtomography of internal damage in fiber reinforced polymer matrix composites. Compos. Sci. Tech. 2005, 65, 2071–2078. [Google Scholar] [CrossRef]
  15. Goidescu, C.; Welemane, H.; Garnier, C.; Fazzini, M.; Brault, R.; Peronnet, E.; Mistou, S. Damage investigation in CFRP composites using full-field measurement techniques: Combination of digital image stereo-correlation, infrared thermography and X-ray tomography. Compos. Part B Eng. 2013, 48, 95–105. [Google Scholar] [CrossRef]
  16. Andraju, L.B.; Raju, G. Damage characterization of CFRP laminates using acoustic emission and digital image correlation: Clustering, damage identification and classification. Eng. Frac. Mech. 2023, 277, 108993. [Google Scholar] [CrossRef]
  17. Thostenson, E.T.; Chou, T.-W. Carbon Nanotube Networks: Sensing of Distributed Strain and Damage for Life Prediction and Self Healing. Adv. Mater. 2006, 18, 2837–2841. [Google Scholar] [CrossRef]
  18. Meninno, C.; Chalivendra, V. Damage detection in intra-ply glass/carbon laminated composites under Mode-I and Mode-II fracture loadings. Compos. Part B Eng. 2021, 218, 108924. [Google Scholar] [CrossRef]
  19. Shonar, M.; Chalivendra, V. Piezoresistive damage sensing and mechanical characteristics of carbon/glass hybrid thermoplastic composites. J. Compos. Mater. 2023, 57, 1909–1926. [Google Scholar] [CrossRef]
  20. O’Donnell, J.; Chalivendra, V.; Hall, A.; Kim, Y. Damage sensing in multi-functional glass fiber composites under mode-I fracture loading. J. Compos. Mater. 2020, 54, 4821–4829. [Google Scholar] [CrossRef]
  21. Kazem, N.; Hellebrekers, T.; Majidi, C. Soft Multifunctional Composites and Emulsions with Liquid Metals. Adv. Mater. 2017, 28, 1605985. [Google Scholar] [CrossRef] [PubMed]
  22. Chen, S.; Wang, H.-Z.; Zhao, R.-Q.; Rao, W.; Liu, J. Liquid Metal Composites. Matter 2020, 2, 1446–1480. [Google Scholar] [CrossRef]
  23. Majidi, C.; Alizadeh, K.; Ohm, Y.; Silva, A.; Tavakoli, M. Liquid metal polymer composites: From printed stretchable circuits to soft actuators. Flex. Print. Electron. 2022, 7, 013002. [Google Scholar] [CrossRef]
  24. Wang, J.; Cai, G.; Li, S.; Gao, D.; Xiong, J.; Lee, P.S. Printable Superelastic Conductors with Extreme Stretchability and Robust Cycling Endurance Enabled by Liquid-Metal Particles. Adv. Mater. 2018, 30, 1706157. [Google Scholar] [CrossRef] [PubMed]
  25. Pozarycki, T.A.; Hwang, D.; Barron, E.J., III; Wilcox, B.T.; Tutika, R.; Bartlett, M.D. Tough Bonding of Liquid Metal-Elastomer Composites for Multifunctional Adhesives. Small 2022, 18, 2203700. [Google Scholar] [CrossRef] [PubMed]
  26. Schlingman, K.; D’Amaral, G.M.; Carmichael, R.S.; Carmichael, T.B. Intrinsically Conductive Liquid Metal-Elastomer Composites for Stretchable and Flexible Electronics. Adv. Mater. 2023, 8, 2200374. [Google Scholar] [CrossRef]
  27. Ambulo, C.P.; Ford, M.J.; Searles, K.; Majidi, C.; Ware, T.H. 4D-Printable Liquid Metal–Liquid Crystal Elastomer Composites. ACS Appl. Mater. Interfaces 2021, 13, 12805–12813. [Google Scholar] [CrossRef] [PubMed]
  28. Fang, R.F.; Chen, T.; Xu, X.; Xue, D.; Hong, W.; Wang, H.; Wang, Q.; Zhang, S. 3D Highly Stretchable Liquid Metal/Elastomer Composites with Strain-Enhanced Conductivity. Adv. Fun. Mater. 2023, 2310225. [Google Scholar] [CrossRef]
  29. Pinto, M.A.; Chalivendra, V.B.; Kim, Y.K.; Lewis, A.F. Evaluation of surface treatment and fabrication methods for jute fiber/epoxy laminar composites. Polym. Compos. 2013, 35, 310–317. [Google Scholar] [CrossRef]
  30. ASTM Standard D5528-94a; Test Method for Mode I Interlaminar Fracture Toughness of Unidirectional Fiber-Reinforced Polymer Matrix Composites. American Society for Testing and Materials: West Conshohocken, PA, USA, 2001. [CrossRef]
Figure 1. Fabrication process for liquid metal dispersion and the vacuum infusion process.
Jcs 08 00025 g001
Figure 2. Schematics of the two composite orientations are C (carbon fibers are in the crack propagation direction) and G (glass fibers are in the crack propagation direction).
Jcs 08 00025 g002
Figure 3. Diagram of DCB specimen configuration, with (a) showing the side view with voltage probes, (b) showing the top view with current probes, (c) showing a 3D view of the specimen where the voltage probes go around the crack faces, and (d) showing a side view of the actual test specimen.
Jcs 08 00025 g003
Figure 4. Schematic of the experimental setup used for fracture experimentation that includes the electrical measurement system.
Jcs 08 00025 g004
Figure 5. Delaminated sections of the actual test sample after failure for C-0%, C-1%, and C-2%.
Jcs 08 00025 g005
Figure 6. Delaminated sections of actual test samples after failure for G-0%, G-1%, and G-2%.
Jcs 08 00025 g006
Figure 7. Schematic of DCB specimen with dimensions associated with piano hinges used in Equations (2) and (3).
Jcs 08 00025 g007
Figure 8. Initial resistance for each composite configuration.
Jcs 08 00025 g008
Figure 9. Force-displacement and electrical resistance change plots of experiments for samples (a) C–0%, (b) C-1%, and (c) C-2%.
Jcs 08 00025 g009
Figure 10. Force-displacement and electrical resistance change plots of experiments for samples (a) G-0%, (b) G-1%, and (c) G-2%.
Jcs 08 00025 g010
Figure 11. Fracture toughness initiation values for each composite configuration.
Jcs 08 00025 g011
Figure 12. SEM images of the fracture surfaces of (a) C-0%, (b) C-1%, (c) C-2%, and (d) the magnified regions of C-2%.
Jcs 08 00025 g012
Figure 13. SEM images of the fracture surfaces of (a) G-0%, (b) G-2%, and (c,d) the magnified regions of G-2%.
Jcs 08 00025 g013
Figure 14. Characteristic plots of force vs. displacement plots, including zoomed regions for (a) C-0%, (b) C-1%, and (c) C-2%.
Jcs 08 00025 g014
Figure 15. Characteristic plots of force vs. displacement plots, including zoomed regions for (a) G-0%, (b) G-1%, and (c) G-2%.
Jcs 08 00025 g015
Disclaimer/Publisher’s Note: The statements, opinions and data contained in all publications are solely those of the individual author(s) and contributor(s) and not of MDPI and/or the editor(s). MDPI and/or the editor(s) disclaim responsibility for any injury to people or property resulting from any ideas, methods, instructions or products referred to in the content.

