Article

Capillary Rise: A Simple Tool for Simultaneous Determination of Porosity and Thickness of Thin Silica Coatings

by
Emmanuel E. Ubuo
1,2,*,
Inimfon A. Udoetok
3,*,
Andrew T. Tyouwa
2,4,
Clement O. Obadimu
1 and
Hamza S. Al-Shehri
2,5
1
Department of Chemistry, Akwa Ibom State University, Mkpat Enin 532111, Akwa Ibom State, Nigeria
2
Department of Chemistry and Biochemistry, University of Hull, Hull HU6 7RX, UK
3
Department of Chemistry and Biochemistry, University of Regina, Regina, SK S4S 0A2, Canada
4
Applied Colloid Science and Cosmeceutical Group, Department of Chemistry, Benue State University, Makurdi 970211, Benue State, Nigeria
5
Chemistry Division, King Khaled Military Academy, SANG, Riyadh 11564, Saudi Arabia
*
Authors to whom correspondence should be addressed.
J. Compos. Sci. 2023, 7(6), 259; https://doi.org/10.3390/jcs7060259
Submission received: 22 April 2023 / Revised: 8 June 2023 / Accepted: 13 June 2023 / Published: 19 June 2023

Abstract

:
Coating porosity is an important property that supports solid-gas and solid-liquid exchange that can either enhance various science and technological applications or promote damage if not properly controlled. However, non-destructive instrumental techniques for the measurement of porosity on coated walls or surfaces can be quite challenging. Here, a seamless capillary rise technique has been used to determine both the thickness and porosity of a thin silica coating. Uniform coatings were prepared from 5 wt% hydrophobic fumed silica in absolute ethanol and spin-coated at 500–8000 rpm on glass slides. Capillary imbibition of squalane was then controlled into known areas of the resulted hydrophobic nano-porous coatings. The mass of the solid (silica) and the infiltrated oil (squalane) were gravimetrically measured. The porosity of the material was calculated as the percentage fraction of the pore volume while the film thickness was determined as the ratio of the total volume to the area of coverage. Mean values of the porosity and coating thickness calculated from capillary impregnation technique were 86 ± 2% and 3.7 ± 0.2 μm, respectively. The coating thickness obtained was comparable with those revealed by SEM and Dektak profiler measurements. This study highlights the effectiveness of capillary rise as a simple and cost-effective non-destructive technique for assessment of coating thickness and porosity.

1. Introduction

The world has abundant deposits of naturally occurring sustainable porous materials (e.g., soils, rocks, sponge, woods, human skin, animal bones). However, the quest for porous materials has led to synthetic modification of existing porous and non-porous materials with the aim of enhancing the porosity and applications of such materials. These synthetically developed porous materials include fabrics, paper materials, filters, foams, ceramics, composites and powder coatings. Generally, porous materials play crucial roles in many fields and technology due to their unique properties, especially their low density [1], large surface area [2] and a range of novel physical, mechanical, thermal, electrical and acoustic properties [3]. These unique properties have afforded their application in catalysis [4,5], sorption of pollutants from aqueous solutions, water treatment [6], sound absorption [7], fire resistance/thermal insulators [8], controlled wetting [9], oil spill clean-up [10], drug delivery [11] and orthopedic applications, etc. [12].
Inorganic porous powders, such as silica, zeolite, calcium carbonates, aluminium silicates, titanium(iv) oxide, kaolin, mica and other powdery metals, are regularly used as coatings, either for decorative [13,14] or protective [15,16,17] purposes. Interestingly, most of these inorganic porous materials are usually derived from nature with little or no environmental pollution, where they are also known to show good resistance to aging, combustion and chemical attack [18,19,20]. Due to their characteristic brilliant and attractive colors, these inorganic porous materials are also used as pigments in coatings, where they provide aesthetics to the coated materials [20,21,22]. In addition to advancing the outward appearance of the coated films, the ability of these porous materials to enhance various structural features (thickness and porosity) of the coated materials makes them essential tools for the prediction of quality and durability [23,24,25]. Remarkably, film thickness is a crucial feature of surface coatings that can impact cost, quality or performance [26,27]. Another unique feature of these powder-based materials is their grains being packed together to afford tiny spaces between them, where their porosities are essentially created by the inter-particle cavities. These inter-particle cavities build up to provide porous or capillary networks of various dimensions that may depend on their nature (fused or mono-dispersed) [28,29] or particle size [30]. If such internal pores are well connected to the surface, the coating will definitely permit fluid transports, a property that supports applications, such as gas separation and filtration of liquids [31].
Although porosity is important in many applications, it may also lead to undesired results. The presence of pores on some surfaces can initiate cracks, induce friability, reduce wear resistance, affect toughness as well as harbor other harmful materials, thus becoming susceptible to biofouling and corrosion attacks [32,33]. It is therefore vital to note that, since variable morphologies and porosities are required for diverse applications [34], porous materials may only be useful if their porosities are well understood and tailored to suit the anticipated applications. Materials with porosity tailored towards the anticipated application can be developed if the material formation mechanism is considered during the design. This may be done via tuning of their pore properties through the proper selection of precursors [34,35,36]. To ascertain the effectiveness of the design strategy, the porosity of such materials are usually determined by imaging techniques, such as optical microscopy (OM), scanning electron microscopy (SEM), atomic force microscopy, field emission scanning electron microscopy (FESEM), focused ion beam (FIB), nuclear magnetic resonance (NMR), X-ray and tomography. Apart from the aforementioned imaging and spectroscopic techniques, other methods include nitrogen adsorption and BET analysis, mercury intrusion porosimetry, dynamic vapor sorption, pycnometry and envelope density analysis. The later (non-imaging) techniques require the flow of a fluid through the materials to evaluate their porosity [24,31,35,36,37,38,39,40]. However, in some cases, such flows are usually done under the influence of applied pressure that may affect the fine grains of some coatings, leading to inconsistent or false results [41].
The destructive effects of applied pressure on particle-based coatings may be eliminated through a method that involves a natural flow of wetting liquids through narrow spaces without the influence of external forces [42]. Such processes are evidenced during the flow of underground water in the soil, sap transport from the roots to the leaves of a plant and the absorption of water by spongy materials. This process also occurs on coated walls, concretes and other particle-based composites. For instance, at low temperature and high humidity or during rainfall, the aforementioned materials (coated walls or concrete) can freely absorb and trap gases or moisture from the ground or atmosphere. When temperature increases, the trapped air or moisture expands and is released as vapor in a process commonly termed outgassing or off-gassing [43,44]. This spontaneous flow of wetting liquids in narrow spaces without the influence of external forces is known as capillary rise. Capillary rise has been well studied, even before the proposition of theoretical models to describe its mechanism by Lucas (1918) and Washburn (1921) [45]. In general, it has been established that capillary pressure is the main driving force for this spontaneous flow of liquids through interconnected pores against gravity and is known to be inversely proportional to the pore radius; the smaller the pore radius, the greater the capillary force [46]. However, it is also noted that the phenomenon requires the wetting liquid to have good affinity for the solid surface. If the adhesive forces between the liquid and the capillary wall are stronger than the cohesive forces between the liquid molecules, the liquid wets the wall, and capillary rise occurs.
Capillary rise and wettability of finely divided solids, such as powders, grains, colloids, etc., are useful in a wide range of areas, notably in the permeability test of soil samples, mining/geological investigations, flotation separation, granulation phenomena, pharmaceutical manufacturing, and materials processing. In most of these investigations, porous samples are usually packed into capillary tubes that may not truly represent the complex geometric arrangement or morphology of the original structures. Notwithstanding, very few studies have really employed the process for structural characterization of surface coatings. In this work, capillary rise technique is used to infiltrate squalane (non-volatile oil) into nanoporous networks of hydrophobic silica coatings. The solid-void ratio was quantified gravimetrically using the densities of oil and silica. The technique is a simple and reliable approach for the determination of coating thickness and porosity without modifying the morphology of the sample. This study evaluates the effectiveness and reliability of this natural phenomena (capillary rise) as a simple tool for the determination of porosity and thickness of coating. It is anticipated that this study will highlight the effectiveness and capacity of capillary rise to provide a means of an experimental determination of the porosity and thickness of coatings devoid of sophisticated spectrophotometric and microscopic techniques.

2. Materials and Methods

2.1. Materials

Hydrophobic fumed silica powder, Aerosil R202 (99.8% SiO2 content, Evonik Industry), with average primary particle size of about 10 nm was supplied by Lawrence Industry, UK. Isopropanol and absolute ethanol (analytical grades) were obtained from Fisher Scientific, Loughborough, UK. Squalane (99%) was purchased from Sigma-Aldrich, Gillingham, UK. Premium pathology grade microscope slides were purchased from Heathrow Scientific, Nottingham, United Kingdom.

2.2. Methods

2.2.1. Hydrophobization of Glass Slides

Glass slides were hydrophobized in a vessel saturated with silane vapor. The hydrophobization was done by fixing six slides on a Teflon holder and placing in an airtight vessel fitted with gas inlet and outlet. The vessel was flushed with nitrogen for 3 min then 300 µL of dichlorodimethylsilane was immediately introduced into the vessel. The set-up was left for at least 1 h in a fume cupboard. At the end, the samples were removed and ventilated for 1 h before use.

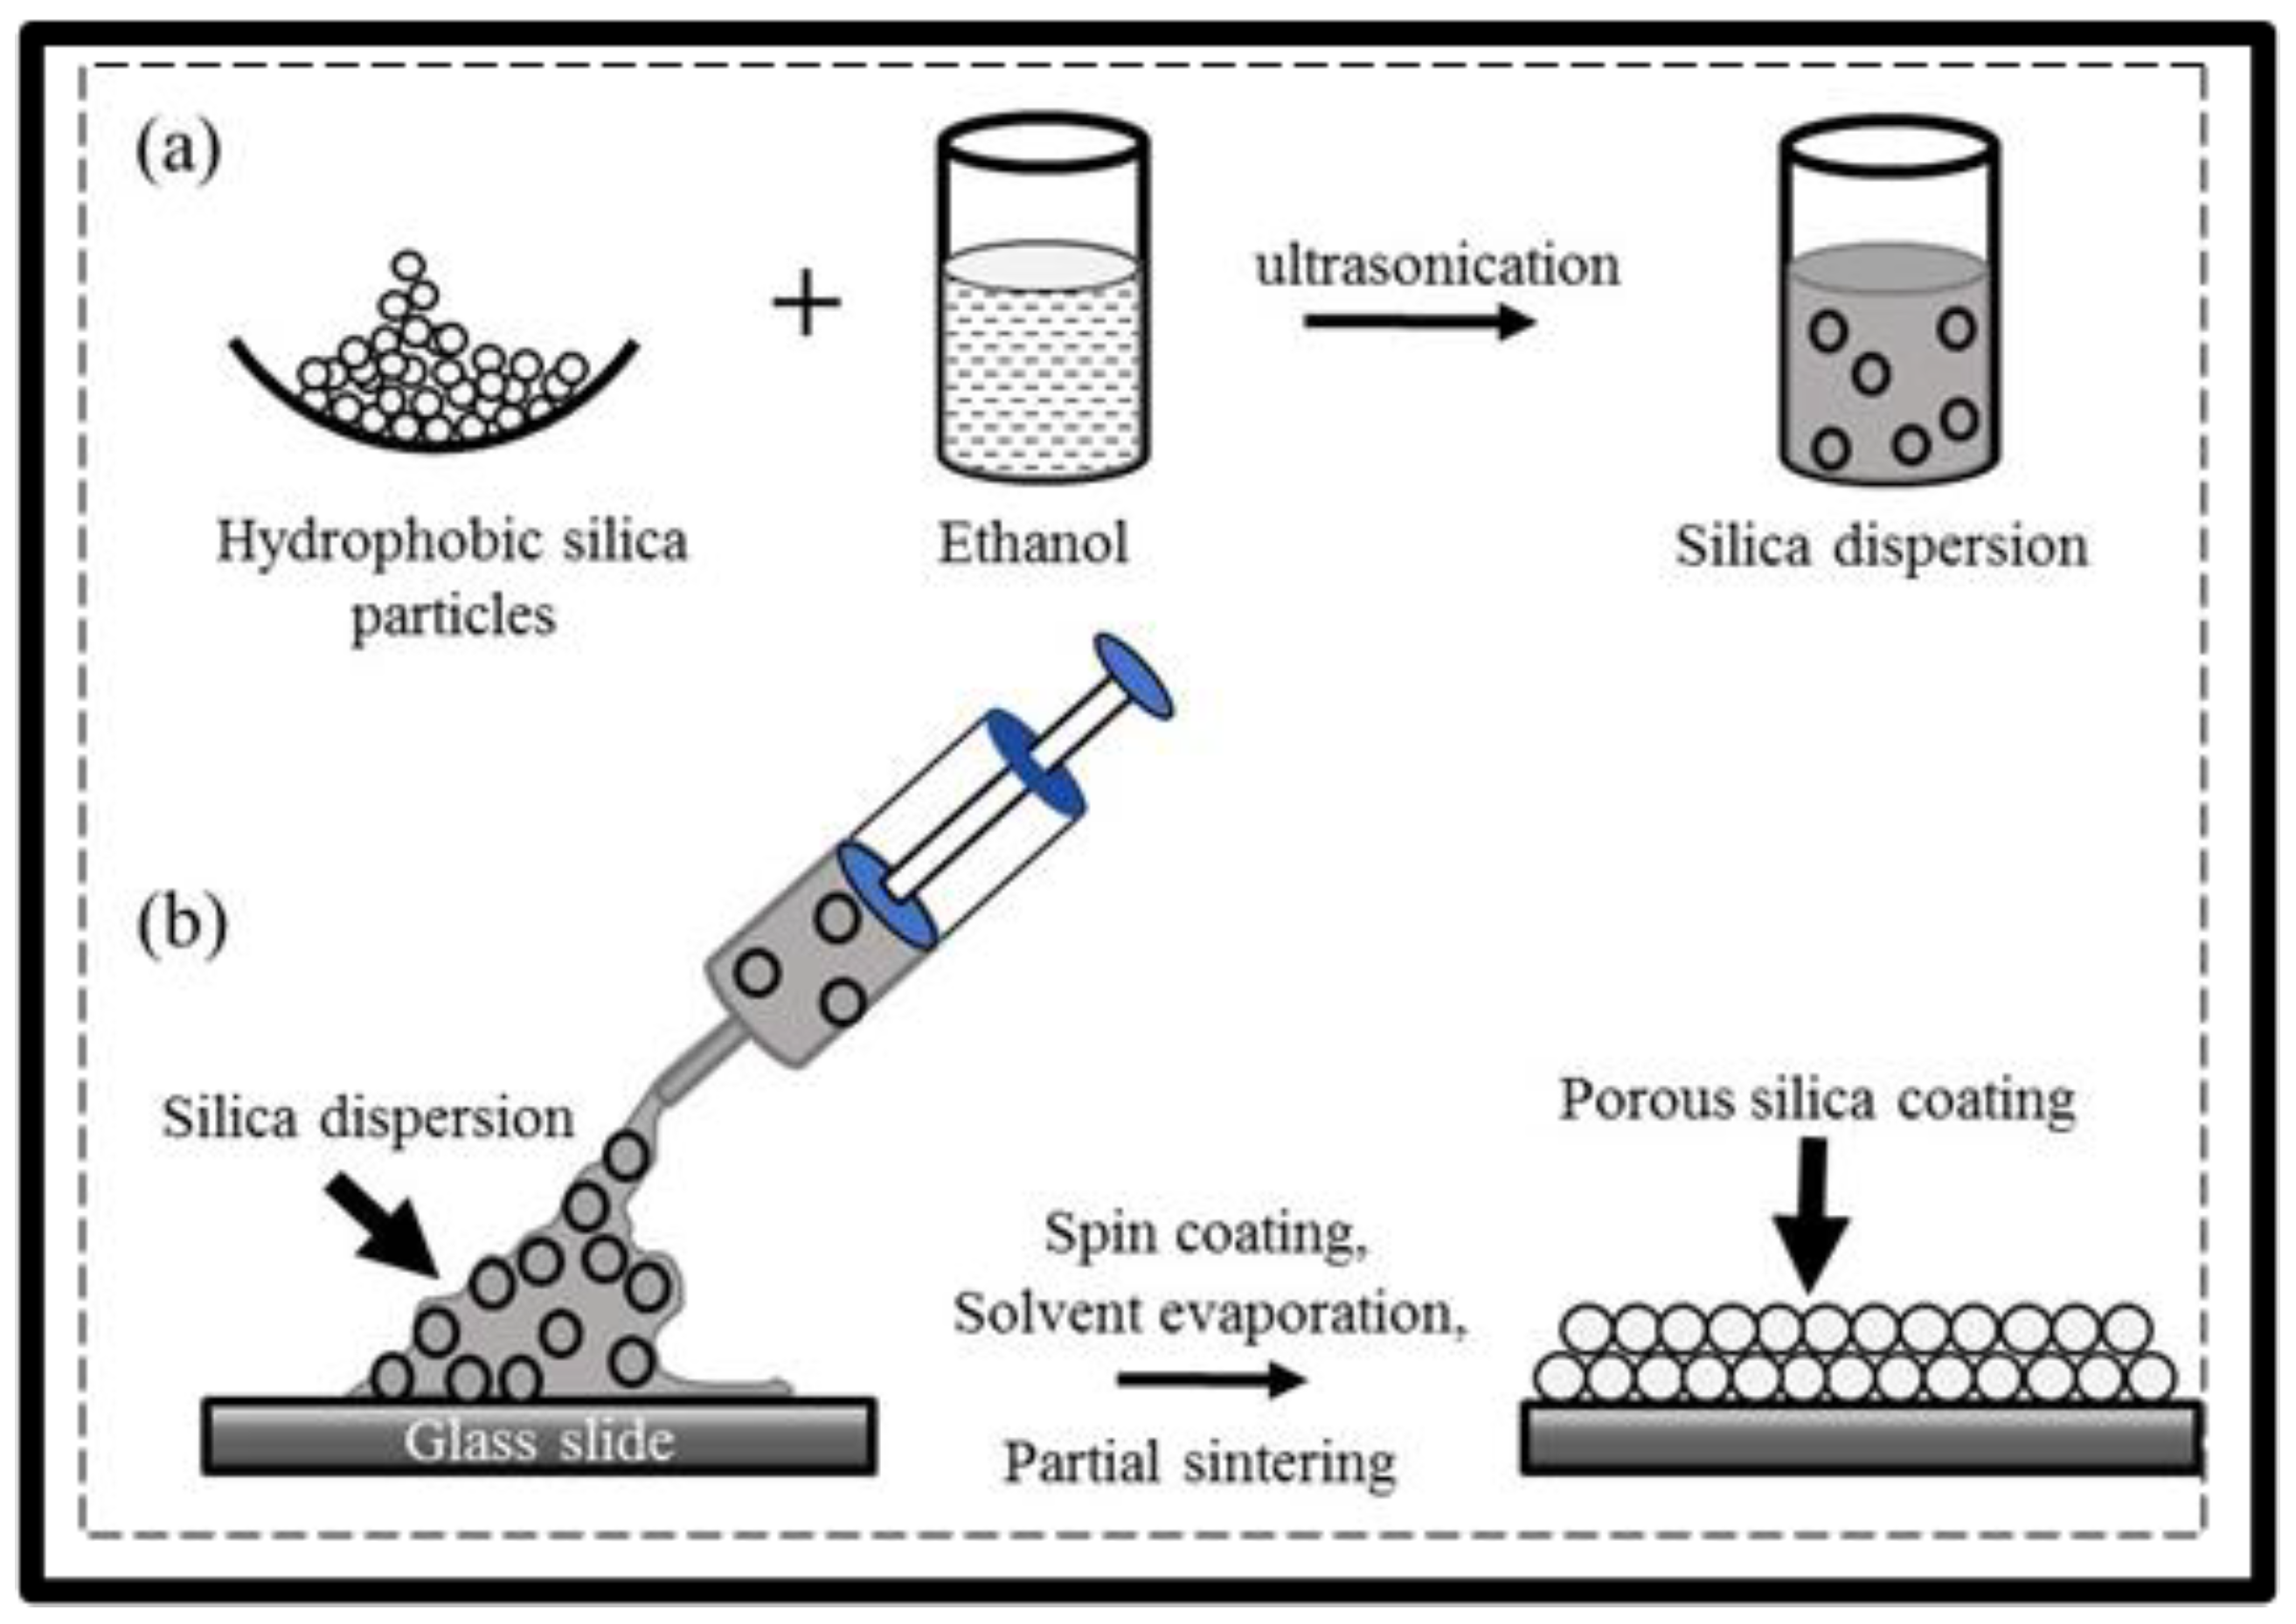
2.2.2. Fabricating of Porous Coatings

The coating suspension was prepared by mixing hydrophobic fumed silica with ethanol to form 5 wt% dispersion as earlier reported (cf. Scheme 1a) [26,33,47]. The mixture was placed in an ice-water bath and ultrasonically dispersed for 10 min using a sonicator (model 450) set at 50% of the maximum power. The microscope slides were cut to the required sizes (about 25 mm2) and washed successively with ethanol, isopropanol and water in an ultrasonic bath for 10 min each and then dried at ambient conditions. About 500 µL of the silica suspension was spread on the hydrophobized glass slide and spin-coated at different spin rates (500, 1000, 2000, 4000, 6000, 8000 rpm, denoted as C-500, C-1000, C-2000, C-4000, C-6000 and C-8000, respectively) for 40 s (cf. Scheme 1b). The resulting coated slides were dried in an oven at 100°C for 1 h and stored in vacuum desiccators.

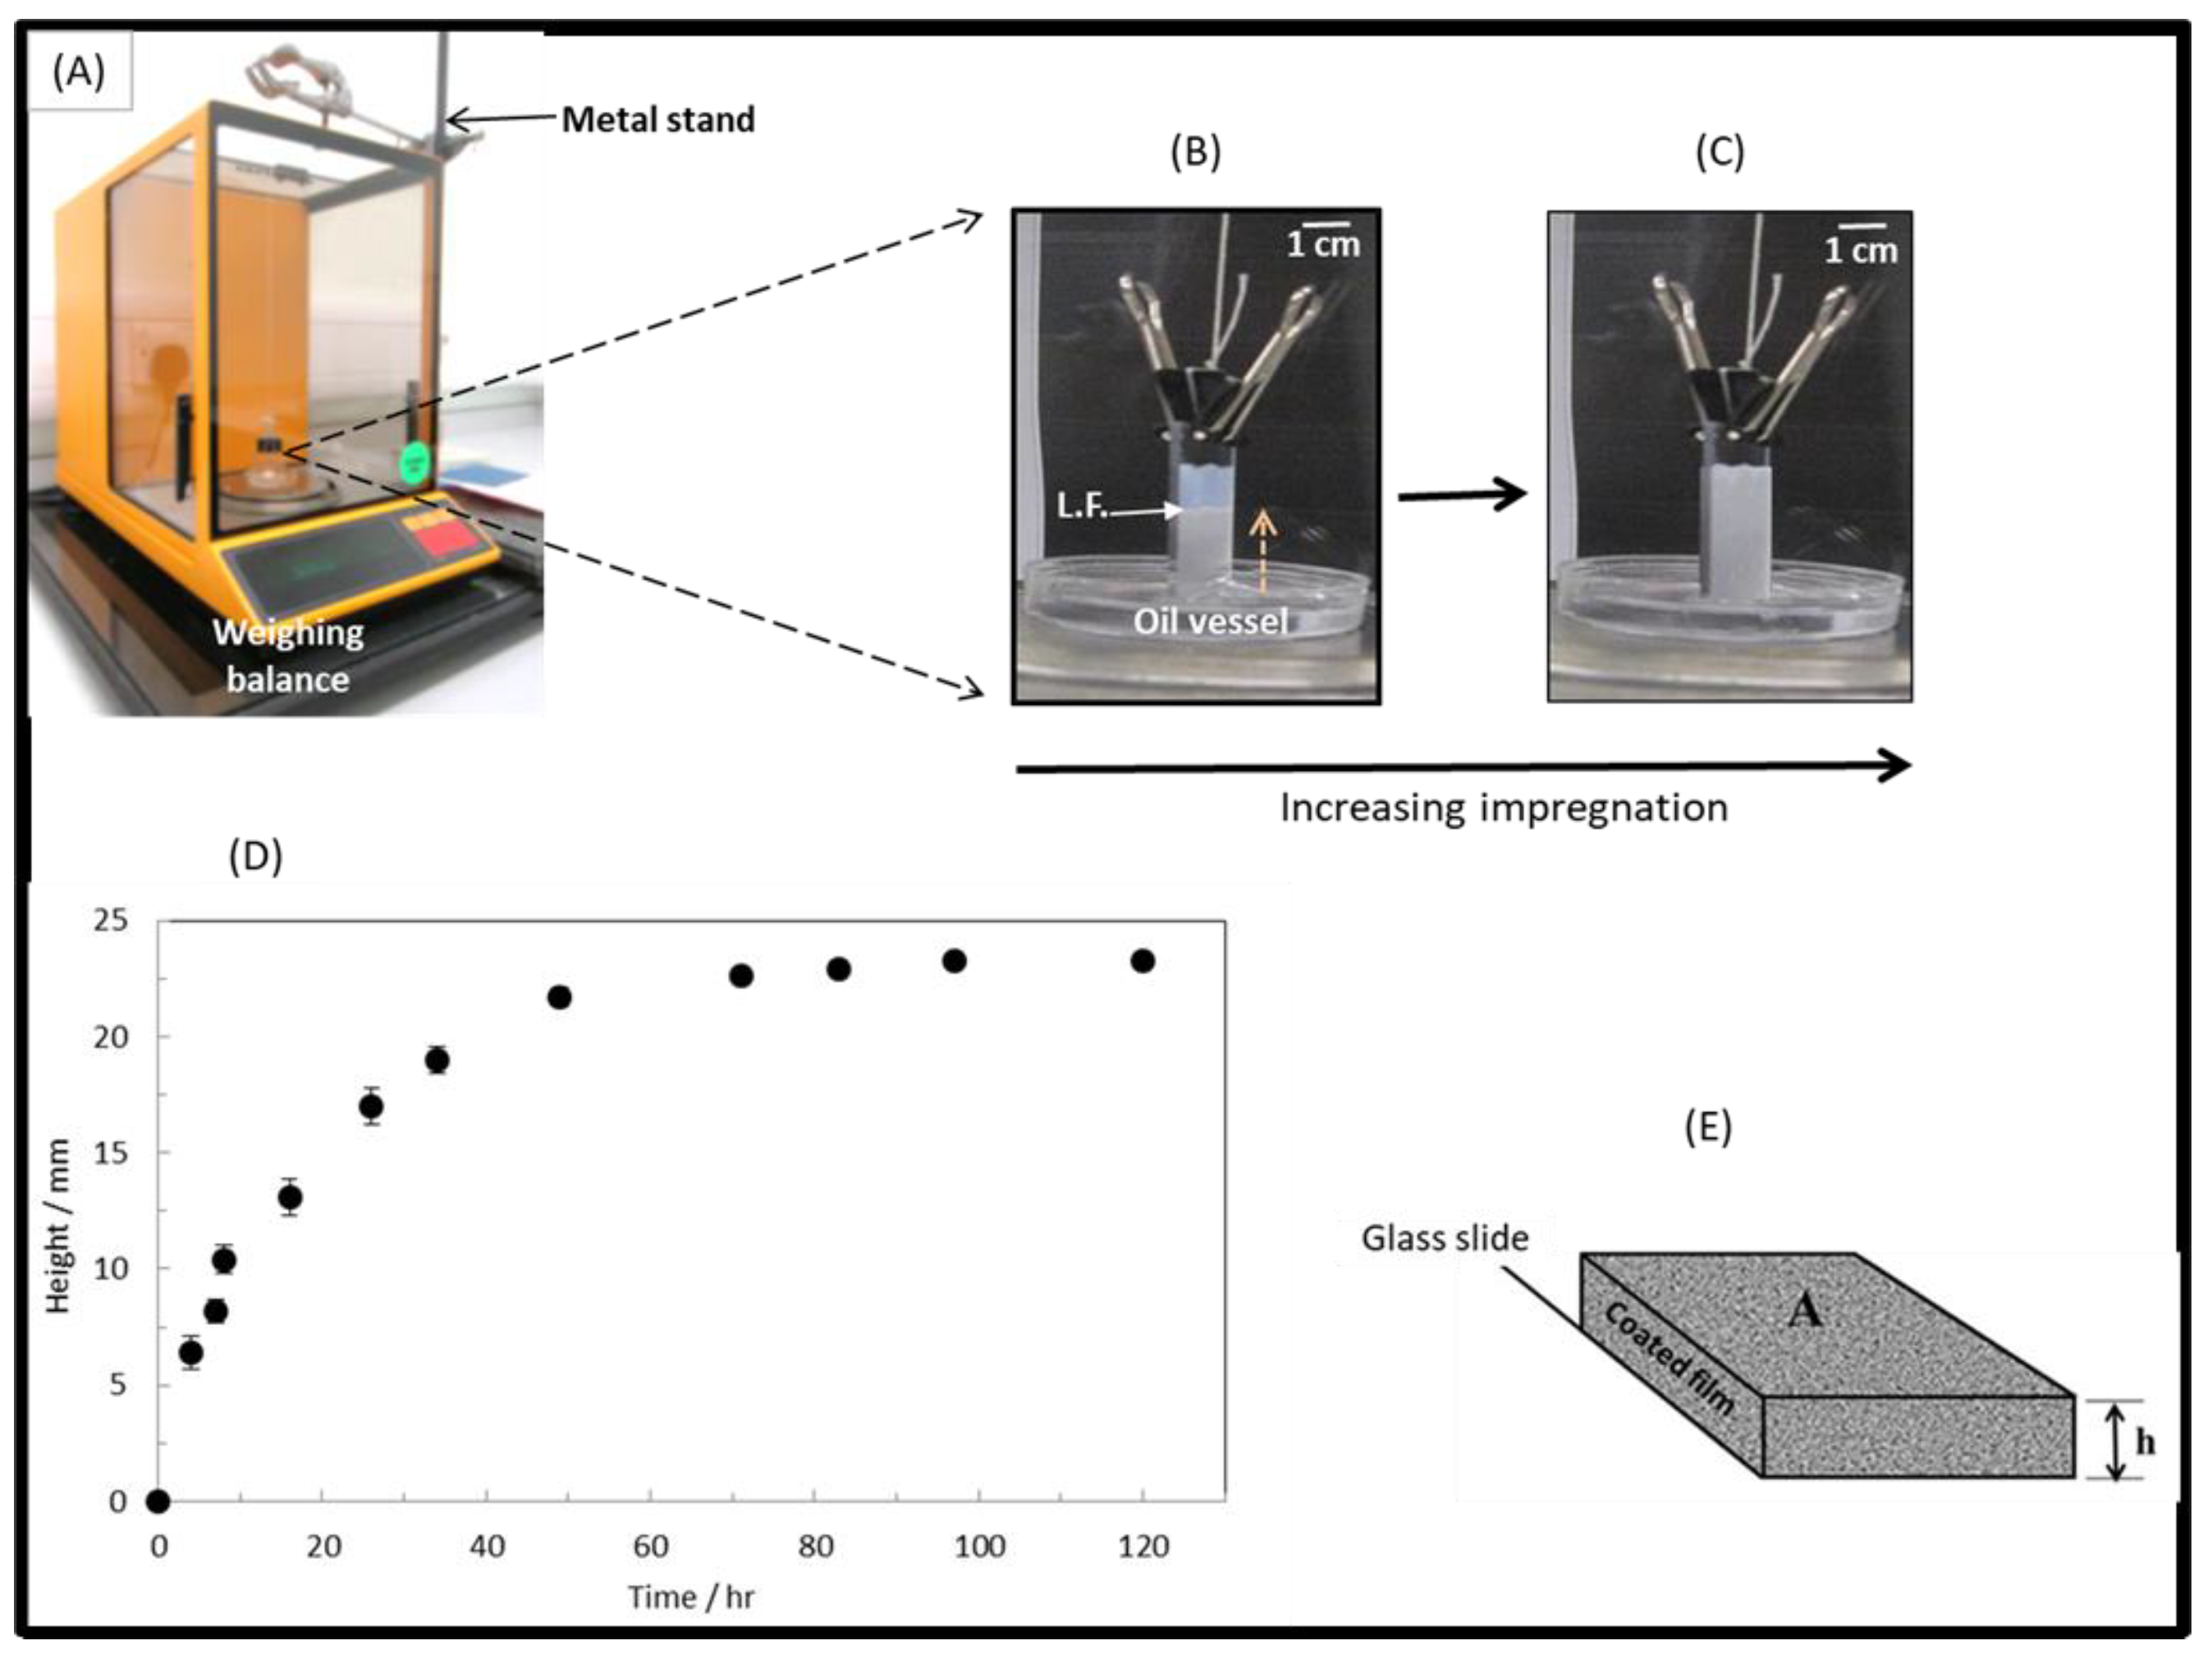
2.2.3. Capillary-Driven Impregnation

The dry coated slide (from vacuum desiccators) was vertically suspended over squalene, the impregnating liquid, and carefully lowered to be slightly immersed in the oil. The spontaneous rise of oil through the porous silica film was monitored through the movement of the liquid front until the coating was fully soaked. The fully soaked substrate was allowed to remain stable for another 24 h to allow for proper equilibration and filling of wider or poorly connected pores. The soaked sample was removed and placed on a filter paper to eliminate the excess oil from the slide. The mass of the coating before and after impregnation were measured gravimetrically [26,47].

2.2.4. Optical and Scanning Electron Microscopy (SEM)

The dry coated samples were viewed using an optical microscope (Olympus (BX-51), fitted with a DP70 digital camera). The slides were viewed using transmitted visible light, and high-resolution images of samples were taken. For structural details of the micro/nano surfaces, a Carl Zeiss Evo 60 scanning electron microscopy was used to examine the thickness of the coatings. To enhance the surface electro-conductivity and avoid the charging effect, the samples were pre-coated with carbon monolayers prior to the SEM imaging.

2.2.5. Dektak XT Stylus Profilometry

Dektak XT stylus profiler was also used for the determination of coating thickness. To measure the thickness of fumed silica coatings on glass slides, a reference slide was scratched to reveal the glass slide. The surface of the coated film and the predetermined reference uncoated (scratched) portions of the film were scanned and the thickness of the film, h, was determined as the vertical difference between top surface and the bottom of the scratched mark.

3. Results and Discussion

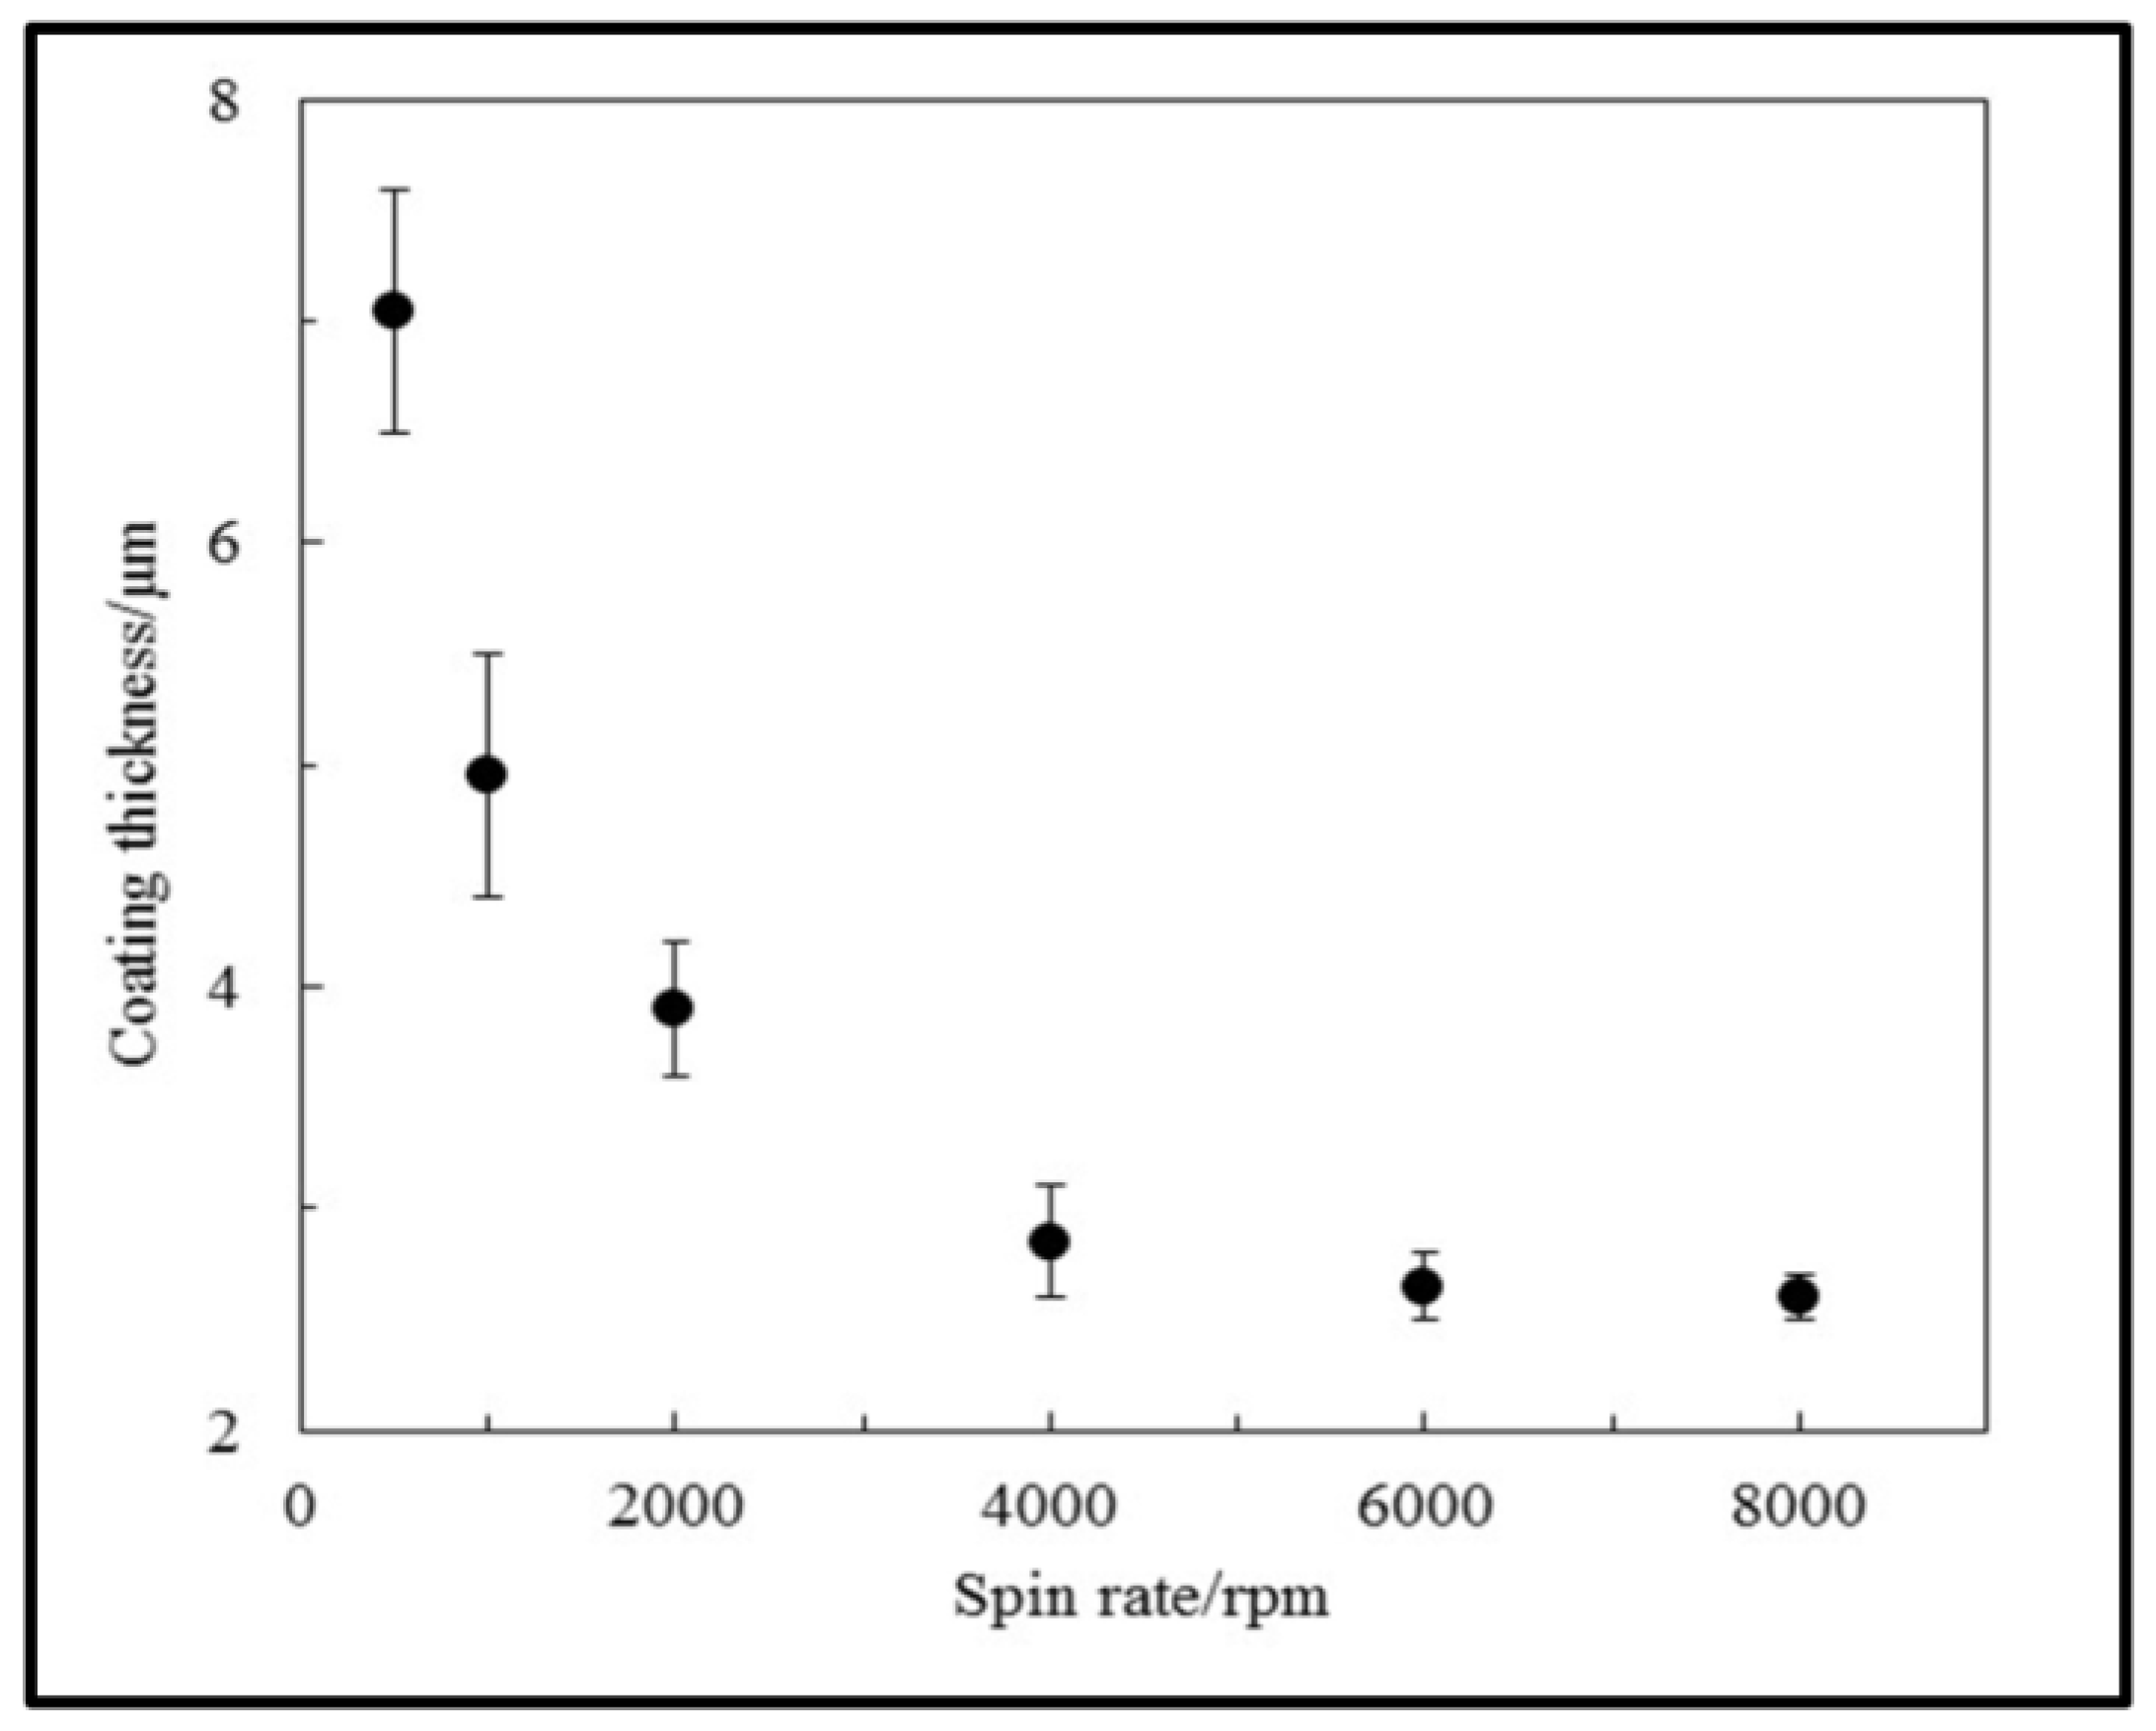
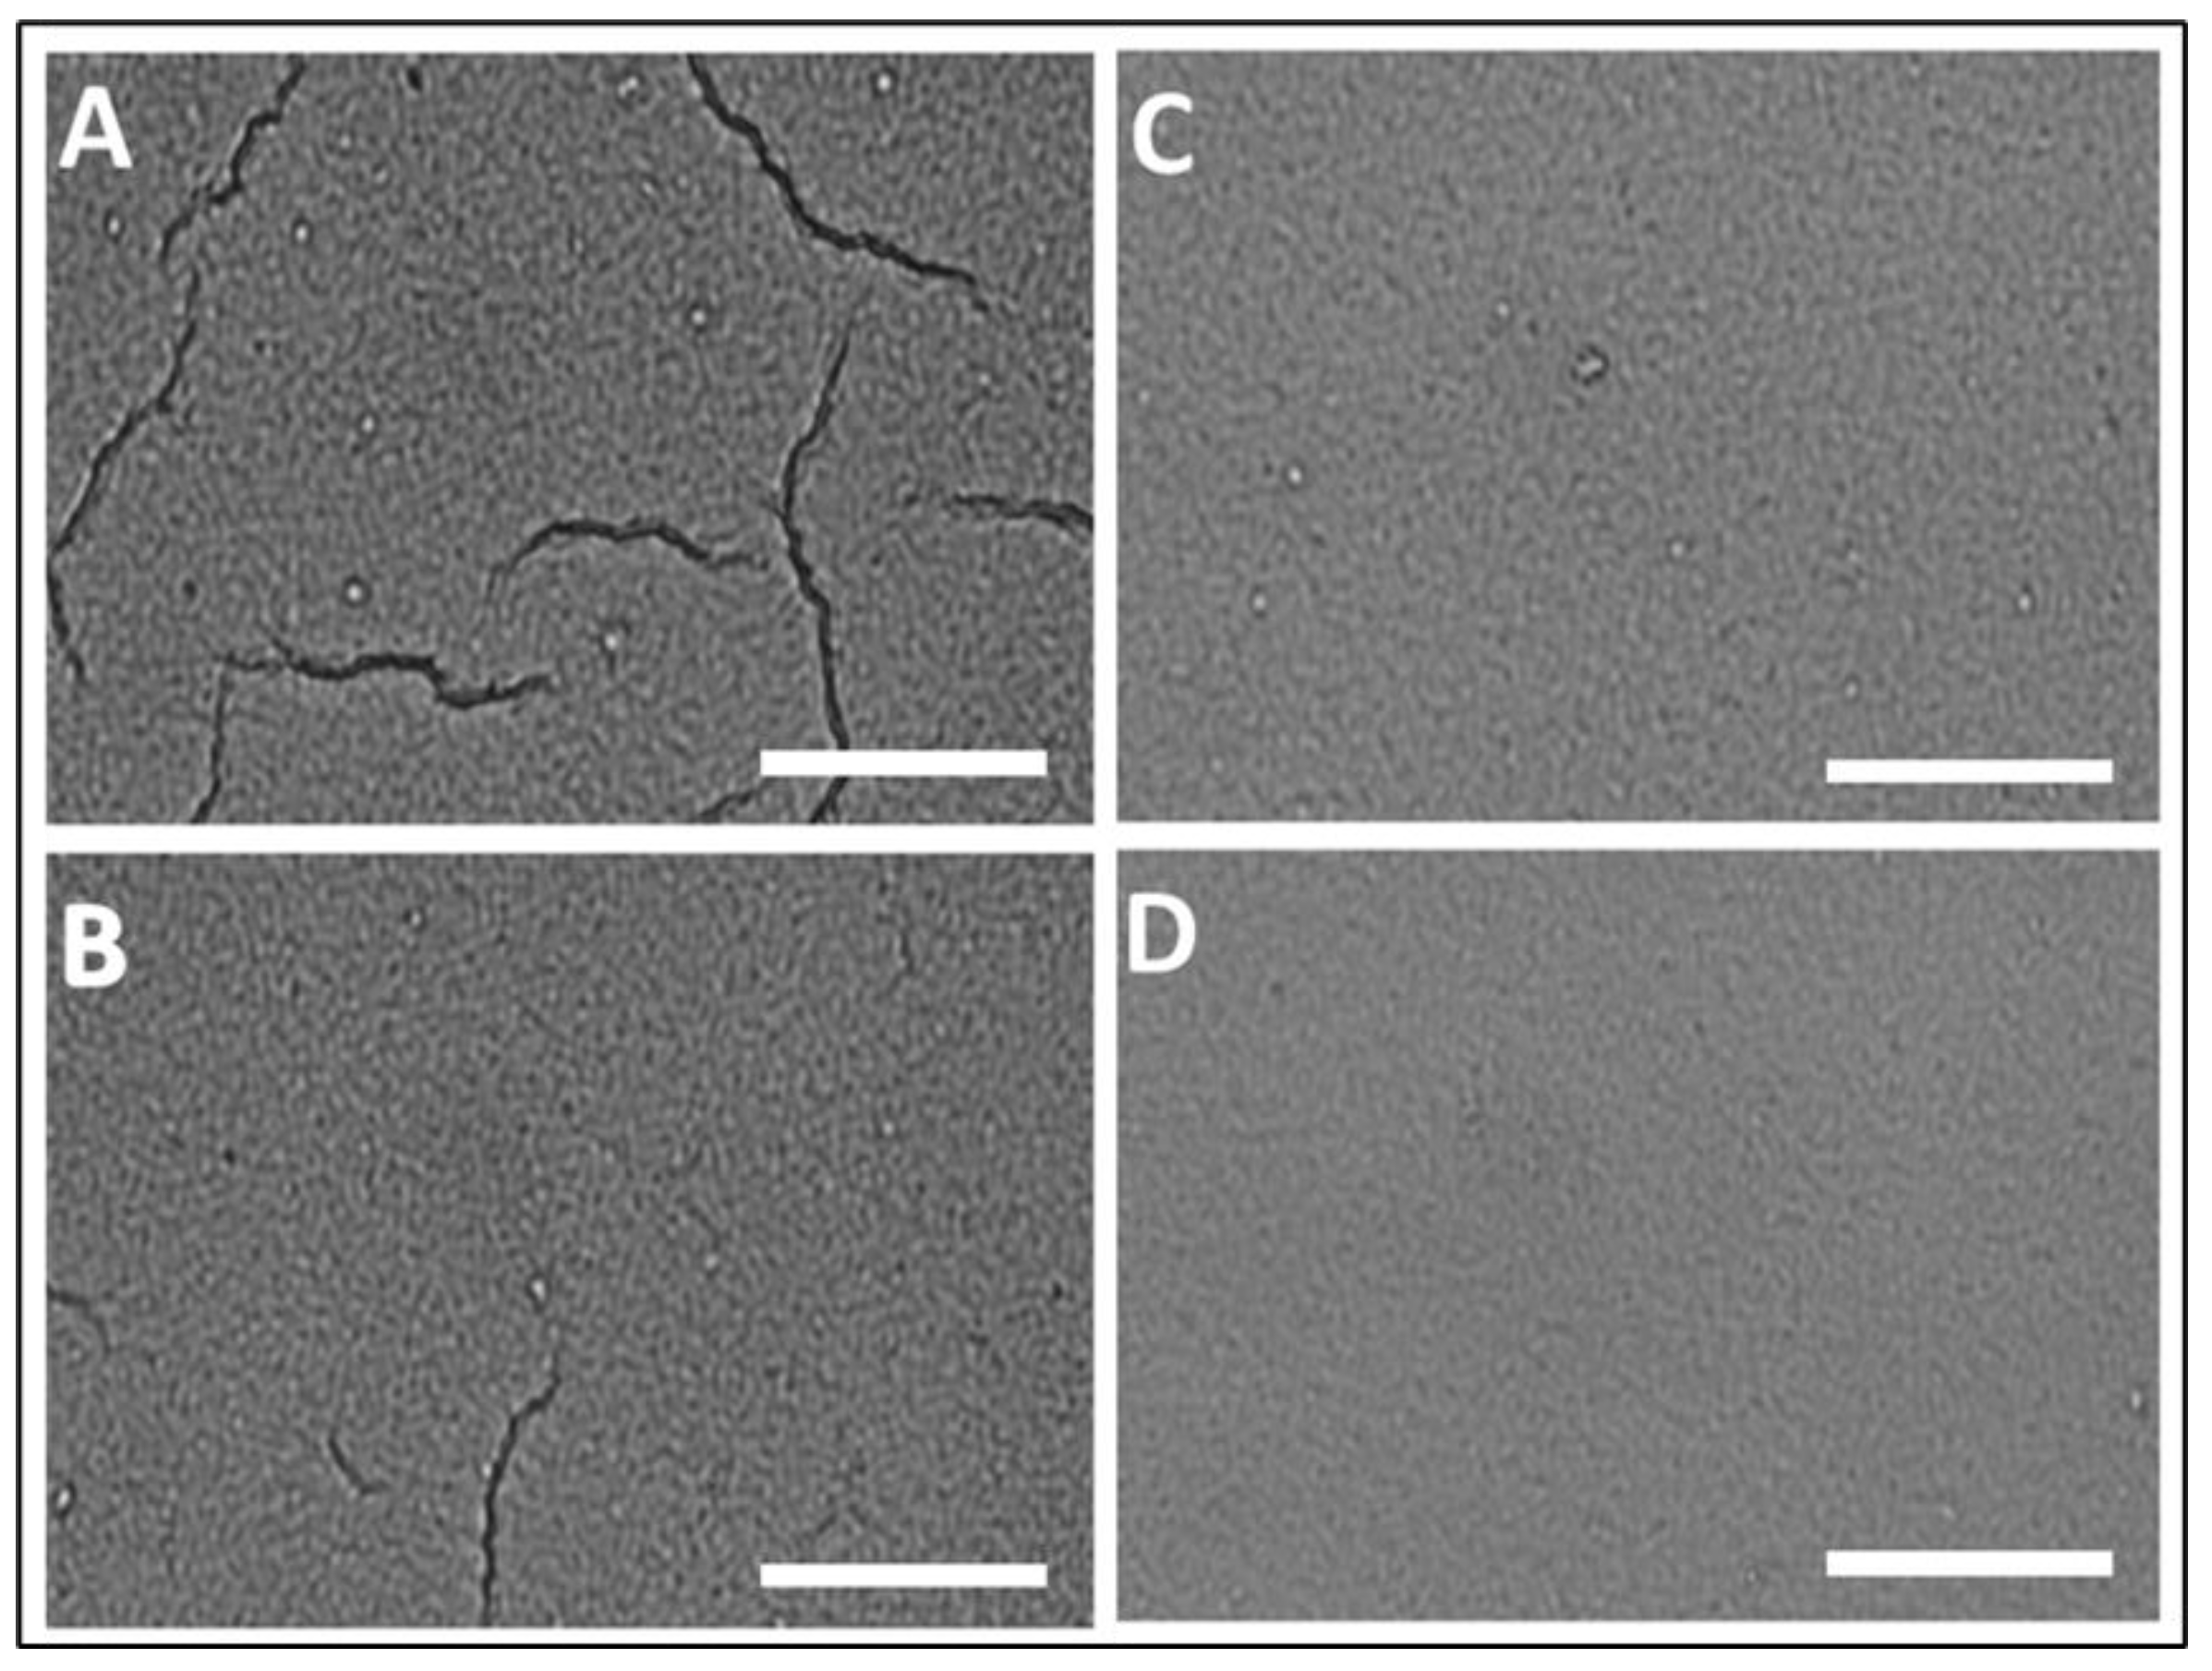
3.1. Selection of the Preferred Coatings

The loss of moisture from fresh coatings is mainly driven by capillary forces as earlier discussed. In an enhanced drying process (e.g., under high temperature or pressure, etc.), the solvent that occupies a certain volume of the dispersion or wet coatings rapidly evaporates mostly from the surface and creates voids. This volumetric reduction at the surface allows surface particles to rearrange in order to fill the created voids, resulting in shrinkage. If the particles are soft, they deform to close the pores (i.e., the distance between particles becomes smaller), thereby changing the capillary pressure; if the particles are mechanically and chemically stable, however, cracks are produced to release the stress [48,49,50,51]. In addition, when the film is under such influence, compression at the surface of the film is certainly not in uniformity with the rest of the coating matrix. For instance, if the evaporation rate is faster than the capillary rise of the liquid through the capillary networks, the liquid becomes stretched to cover the dry portion of film; this produces a tension which varies in the transverse direction of the layers. Efforts for capillary pressure to overcome these compressive forces can result in crack formations on the film as well [49]. Thus, cracks that develop during drying could be attributed to stress caused by pressure gradients in the liquid phase as well as biaxial tension exerted by the substrate [50,51]. Cracks much wider than the porous networks of the film have the tendency to remarkably modify or disconnect the tortuosity and capillary network of the coatings and hence affect capillary absorption [52,53]. Interestingly, many reports have revealed that cracks can be avoided on coatings during fabrication if the thickness of coatings is varied to a critical cracking thickness (CCT), below which it dries without cracking [51,54,55]. In this work, different coatings were produced and studied by varying the coating speed of the spin coater from 500 to 8000 rpm to particularly examine surface morphologies and identify crack-free coatings [56]. The effect of the spin rate on coating thickness (measured using SEM images) is shown in Figure 1. Accordingly, an increase in the spin rate from 500 to 4000 rpm led to a sharp decrease in the thickness of the coating produced, whereas no significant change was observed for the higher spin rates of 4000 to 8000 rpm.
The effects of the coating speed on surface morphology of the coatings is presented in Figure 2. The images presented show greater cracks on the thickest coating ( 7.2 μm) obtained at 500 rpm (C-500). As shown in Figure 2B, the cracks tend to reduce with increase in the spin rate from 500 to 1000 rpm (or decrease in the coating thickness from about 7.2 to 5.2 μm). The coatings (C-2000 to C-8000) were relatively smooth, without significant cracks (cf. Figure 2C,D). Based on the results in Figure 2, C-2000 with relatively better smoothness and thickness, was chosen for further studies.

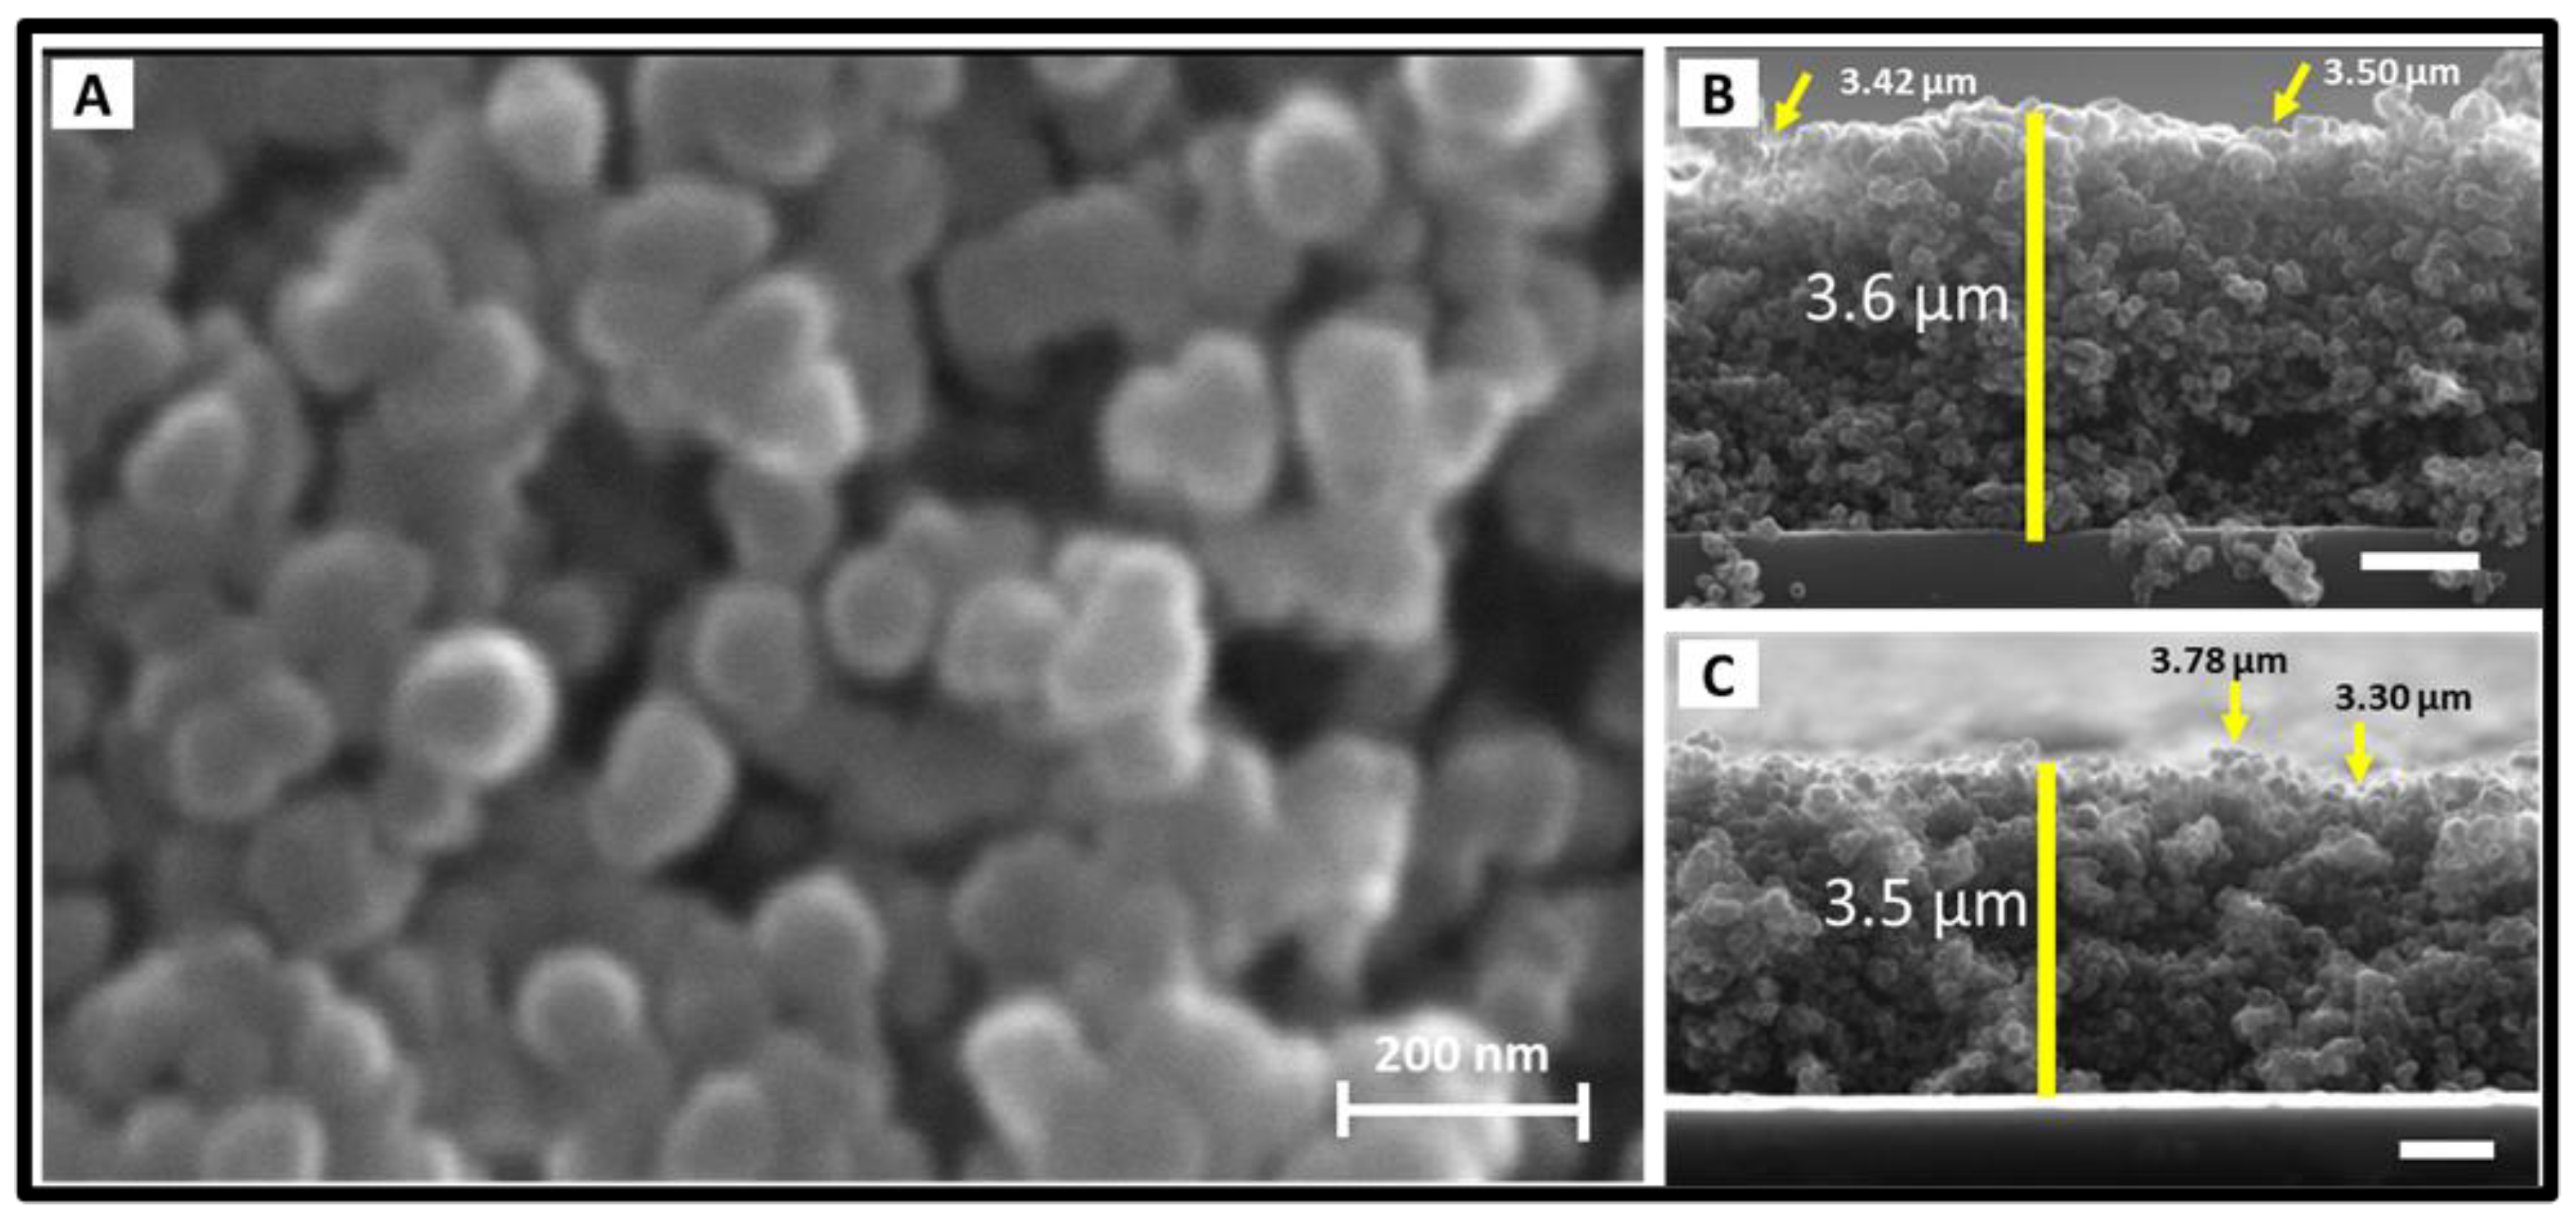
3.2. SEM Analyses of the Morphology and Thickness of the Preferred Coating

SEM images showing the detailed morphology and thickness of the selected coated surface (C-2000) are presented in Figure 3. The SEM images reveal coatings with high porosity and hierarchical random roughness at nanometer and micrometer scales. However, the primary fumed silica particles ( ~ 10   n m ) do not exist in isolation but are fused together to form open branched particles of about 75–100 nm. The tendency of the primary fumed silica particles to form these aggregates (larger particles) may be attributed to the strong hydrophobic interactions between them [33,47,57]. Although the SEM image supports the claim of a porous structure for the coating, complementary results from further investigations that highlight the actual volume of the voids are described in subsequent sections.
Apart from the top view, transverse sections of the coatings were also investigated through SEM studies to determine coating thickness (cf. Figure 3B,C). The analyzed SEM images of three replicated films show that the coatings have rough top surfaces with thickness ranging from 3.3 to 3.8 μm.

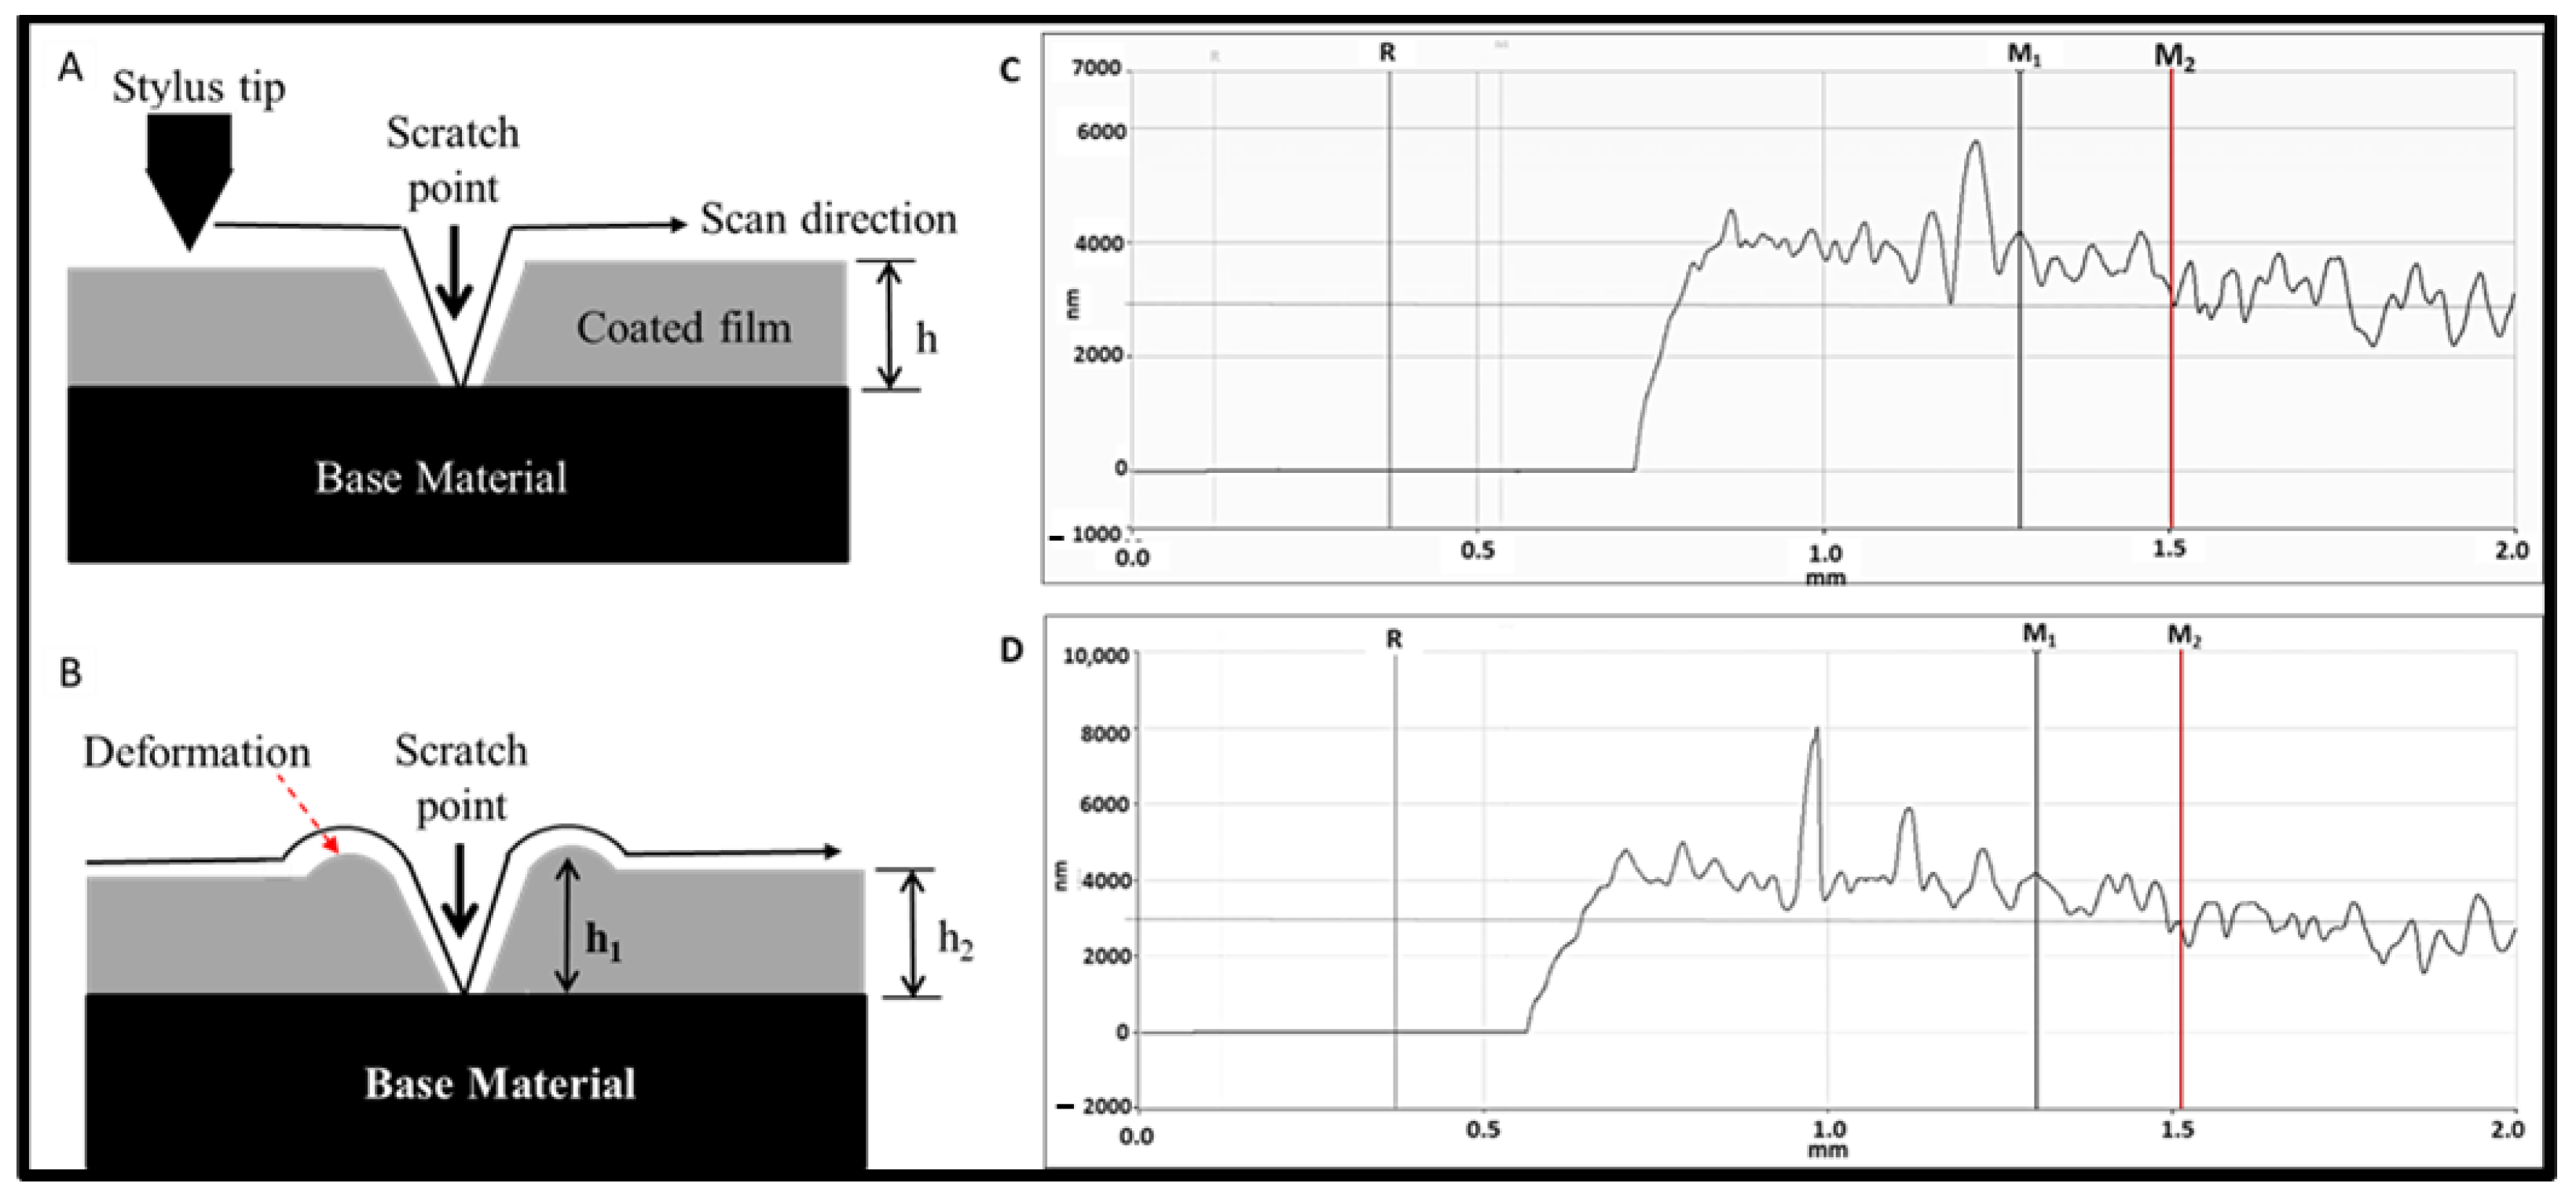
3.3. Determination of Coating Thickness

The thickness of the coating was determined using a Dektak profiler. The Dektak profiler measuring system is an advanced thin and thick film step height measurement tool that takes measurements electromechanically by moving the tip of the diamond stylus over the sample surface in line with programmed scan length, speed and stylus force. As earlier described in the experimental section, a portion of the film was scratched to reveal the glass slide (base material). The stylus is linked to a Linear Variable Differential Transformer (LDVT), such that it produces and processes electrical signals that correspond to surface variations between the base material (scratch point) and the uppermost surface of the film (cf. Figure 4A). However, the uniform thickness shown in Figure 4A is for ideal situations. The introduction of scratches (applied force) on dried or hard coated film can cause irreversible movement of the film particles (plastic deformation) leading to distortion and inconsistency in coating thickness [58] as shown in Figure 4B, where different thicknesses are created. The actual profilometer results showing the thickness of C- 2000 are presented in Figure 4C,D. The coating thickness was carefully analyzed from the scratch or reference point R to avoid erroneous values arising from the aforementioned surface deformation. Accordingly, surface distortion can be observed near the scratch (0.8–1.3 mm) where the compressive effects emanating from the scratch tend to produce high spikes and increase in coating thickness. Beyond this region (green column, 1.3–1.5 mm), the spikes were eliminated but the coating thicknesses are still higher (about 4.1 µm) than portions of the coating at the extreme (red column, 1.5–2.0 mm), where most peaks remain fairly stable at about 3.4–3.8 µm. The coating thicknesses obtained at this region were reliable as distortions and spikes associated with scratches were completely eliminated, and the results agree with SEM results.

3.4. Impregnation of the Coated Film

The experimental set-up for capillary driven impregnation is shown in Figure 5A. The coated slide was suspended from a metal stand to slightly touch the impregnating oil in a Petri dish, placed on a weighing balance. Figure 5B,C are magnified images of the coated slide at different stages of impregnation. During the experiment, the oil gradually rose upward against gravity through the porous network of the coating. The movement of oil into the coating was monitored by the liquid front (L.F.) from inception of the impregnation through the partially impregnated stage (Figure 5B) to full impregnation (Figure 5C). The height of the liquid front, indicating degree of impregnation, was plotted against time in Figure 5D, where Figure 5E illustrates the geometry and dimensions of the coated film. The plot in Figure 5D depicts the gradual impregnation of the coated surface via capillary rise, where full impregnation was afforded after 40 h with no significant change in the liquid front.

3.5. Gravimetric Analysis and Calculation of Coating Thickness and Porosity

Although the fabricated coating did not have flat surfaces, after full impregnation (pores totally filled), the coating could be likened to a cuboid with thickness, h and area, A as shown in Figure 5E. Using the illustration, the thickness, h and porosity, ϕ of the coated film can be calculated if the densities of the impregnated liquid (squalane) and the solid (silica) are known. In this case, porosity is the fraction of the total film volume, V, that is not occupied by the solid matter (silica) but with the impregnated oil.
From Figure 5E, the thickness and area of the film are h and A, respectively; hence, the total volume of the film is given by:
V = A × h
the pore volume, V P , gives the total volume of the film, V T
V T = V S + V P = A × h
h = ( V S + V P ) / A
In terms of the material mass density,
V S = M S / ρ S
V P = M o i l / ρ o i l
where MS is the mass of silica, ρ S is the density of silica, Moil is the mass of the oil (squalane) and ρ o i l is the density of squalane.
Hence, the porosity of the coating ϕ (%) can be given by the equation below.
ϕ = V P / ( V S + V P ) 100
In this study, the dimensions of the areas covered by the coated films, A, were directly measured; the mass of the coated silica, M S , and the mass of the infiltrated oil, M o i l , were determined gravimetrically. The densities of silica, ρ S (2.20 g/cm3) [59], and squalane, ρ o i l (0.81 g/cm3) [60], were obtained from the manufacturers and literature, respectively. The mass of coated silica was calculated as the difference between the mass of uncoated microscope slides (MO) and the mass of the coated slide, MC
M S = M C M O
The mass of oil in the pores was determined by subtracting the mass of the coated slide from the mass of the impregnated slide, MI
M O i l = M I M C
The data are shown in Table 1 and Table 2, respectively.
As shown in Table 2, the results for the coating thickness and porosity are 3.7 ± 0.2 μm and 86 ± 2%, respectively. The calculated results (coating thickness) are in good agreement with the SEM and Dektak profilometer values as earlier discussed in Section 3.2 and Section 3.3.

4. Conclusions

In this study, porous coatings were successfully prepared by spin-coating hydrophobic fumed silica dispersion onto microscope glass slide to form porous substrates. The thickness and uniformity of the coatings were tuned by varying the spin rate. The hydrophobic coating was impregnated with squalane (hydrophobic liquid) using capillary rise technique. The pore volume of the coating was determined using density and mass of the infiltrated oil measured gravimetrically while the coating thickness was calculated as the total volume (sum of pore and solid volumes) per coated area. The average porosity of the film was found to be 86 ± 2% and the coating thickness was 3.7 ± 0.2 μm (i.e., 3.5–3.9 μm). The capillary rise result shows strong agreement with those obtained from Dektak profilometer 3.4–3.8 and SEM (3.4–4.0 μm). This work therefore demonstrates the effectiveness of capillary rise method as a simple and seamless technique for the assessment of permeability, porosity and thickness of simple coatings. It further affirms the capacity of this natural phenomena (capillary rise) to afford experimental determination of porosity and thickness of coatings devoid of sophisticated spectrophotometric and microscopic techniques.

Author Contributions

Conceptualization, E.E.U.; Methodology, E.E.U. and H.S.A.-S.; Formal analysis, E.E.U. and I.A.U.; Data curation, E.E.U. and I.A.U.; Writing—original draft preparation, E.E.U.; Writing—review and editing, E.E.U., I.A.U., H.S.A.-S., A.T.T. and C.O.O. All authors have read and agreed to the published version of the manuscript.

Funding

This research was sponsored by Tertiary Education Trust Fund (TetFund) of Nigeria. Grant/Award Number: TETFUND/ES/AST & D/AISU/VOL.1.

Data Availability Statement

The data presented in this study are contained within the article.

Conflicts of Interest

The authors declare no conflict of interest.

References

  1. Rubio-Aguinaga, A.; Reglero-Ruiz, J.A.; Muñoz, A.; García, F.C.; García, J.M.; Trigo-López, M. Preparation of low-density high-performance porous aramid films using porosity promoter polymers. J. Appl. Polym. Sci. 2022, 139, e53192. [Google Scholar] [CrossRef]
  2. Leng, L.; Xiong, Q.; Yang, L.; Li, H.; Zhou, Y.; Zhang, W.; Jiang, S.; Li, H.; Huang, H. An overview on engineering the surface area and porosity of biochar. Sci. Total Environ. 2021, 763, 144204. [Google Scholar] [CrossRef]
  3. Jiang, S.; Agarwal, S.; Greiner, A. Low-density open cellular sponges as functional materials. Angew. Chem. Int. Ed. 2017, 56, 15520–15538. [Google Scholar] [CrossRef] [PubMed]
  4. Li, J.; Chang, H.; Ma, L.; Hao, J.; Yang, R.T. Low-temperature selective catalytic reduction of NOx with NH3 over metal oxide and zeolite catalysts—A review. Catal. Today 2011, 175, 147–156. [Google Scholar] [CrossRef]
  5. Rani, M.A.A.B.A.; Karim, N.A.; Kamarudin, S.K. Microporous and mesoporous structure catalysts for the production of 5-hydroxymethylfurfural (5-HMF). Int. J. Energy Res. 2022, 46, 577–633. [Google Scholar] [CrossRef]
  6. Diagboya, P.N.; Dikio, E.D. Silica-based mesoporous materials; emerging designer adsorbents for aqueous pollutants removal and water treatment. Microporous Mesoporous Mater. 2018, 266, 252–267. [Google Scholar] [CrossRef]
  7. Kalauni, K.; Pawar, S. A review on the taxonomy, factors associated with sound absorption and theoretical modeling of porous sound absorbing materials. J. Porous Mater. 2019, 26, 1795–1819. [Google Scholar] [CrossRef]
  8. Yu, Z.L.; Yang, N.; Apostolopoulou-Kalkavoura, V.; Qin, B.; Ma, Z.Y.; Xing, W.Y.; Qiao, C.; Bergström, L.; Antonietti, M.; Yu, S.H. Fire-retardant and thermally insulating phenolic-silica aerogels. Angew. Chem. Int. Ed. 2018, 57, 4538–4542. [Google Scholar] [CrossRef]
  9. AlRatrout, A.; Blunt, M.J.; Bijeljic, B. Wettability in complex porous materials, the mixed-wet state, and its relationship to surface roughness. Proc. Natl. Acad. Sci. USA 2018, 115, 8901–8906. [Google Scholar] [CrossRef] [Green Version]
  10. Bhushan, B. Bioinspired oil–water separation approaches for oil spill clean-up and water purification. Philos. Trans. R. Soc. A 2019, 377, 20190120. [Google Scholar] [CrossRef] [Green Version]
  11. Li, W.; Liu, Z.; Fontana, F.; Ding, Y.; Liu, D.; Hirvonen, J.T.; Santos, H.A. Tailoring porous silicon for biomedical applications: From drug delivery to cancer immunotherapy. Adv. Mater. 2018, 30, 1703740. [Google Scholar] [CrossRef]
  12. Kumar, S.; Nehra, M.; Kedia, D.; Dilbaghi, N.; Tankeshwar, K.; Kim, K.-H. Nanotechnology-based biomaterials for orthopaedic applications: Recent advances and future prospects. Mater. Sci. Eng. C 2020, 106, 110154. [Google Scholar] [CrossRef]
  13. Li, W.; Shi, L.; Zhang, J.; Cheng, J.; Wang, X. Double-layered surface decoration of flaky aluminum pigments with zinc aluminum phosphate and phytic acid–aluminum complexes for high-performance waterborne coatings. Powder Technol. 2020, 362, 462–473. [Google Scholar] [CrossRef]
  14. Loganina, V.I.; Kislitsyna, S.N.; Mazhitov, Y.B. Development of sol-silicate composition for decoration of building walls. Case Stud. Constr. Mater. 2018, 9, e00173. [Google Scholar] [CrossRef]
  15. Guerguer, M.; Naamane, S.; Edfouf, Z.; Raccurt, O.; Bouaouine, H. Chemical Degradation and Color Changes of Paint Protective Coatings Used in Solar Glass Mirrors. Coatings 2021, 11, 476. [Google Scholar] [CrossRef]
  16. Feng, Y.; Wang, H.; Zhang, S.; Zhao, Y.; Gao, J.; Zheng, Y.; Zhao, P.; Zhang, Z.; Zaworotko, M.J.; Cheng, P. Antibodies@ MOFs: An in vitro protective coating for preparation and storage of biopharmaceuticals. Adv. Mater. 2019, 31, 1805148. [Google Scholar] [CrossRef] [PubMed]
  17. Creus, J.; Mazille, H.; Idrissi, H. Porosity evaluation of protective coatings onto steel, through electrochemical techniques. Surf. Coat. Technol. 2000, 130, 224–232. [Google Scholar] [CrossRef]
  18. Mu, S.; Liu, J.; Lin, W.; Wang, Y.; Liu, J.; Shi, L.; Jiang, Q. Property and microstructure of aluminosilicate inorganic coating for concrete: Role of water to solid ratio. Constr. Build. Mater. 2017, 148, 846–856. [Google Scholar] [CrossRef]
  19. Abd El-Wahab, H.; Hassan, A.; Naser, A.; Fouad, O.; El-Din, A.; Wahba, O. Preparation and evaluation of nanosized mixed calcium iron oxide (CaFe2O4) as high heat resistant pigment in paints. Pigment Resin Technol. 2015, 44, 172–178. [Google Scholar] [CrossRef]
  20. Bao, W.; Ma, F.; Zhang, Y.; Hao, X.; Deng, Z.; Zou, X.; Gao, W. Synthesis and characterization of Fe3+ doped Co0.5Mg0.5Al2O4 inorganic pigments with high near-infrared reflectance. Powder Technol. 2016, 292, 7–13. [Google Scholar] [CrossRef]
  21. Jose, S.; Joshy, D.; Narendranath, S.B.; Periyat, P. Recent advances in infrared reflective inorganic pigments. Sol. Energy Mater. Sol. Cells 2019, 194, 7–27. [Google Scholar] [CrossRef]
  22. Gürses, A.; Açıkyıldız, M.; Güneş, K.; Gürses, M.S. Dyes and pigments: Their structure and properties. In Dyes and Pigments; Springer: Cham, Switzerland, 2016; pp. 13–29. [Google Scholar]
  23. Buitkenov, D.; Rakhadilov, B.; Tuyakbaev, B.; Sagdoldina, Z.B.; Kenesbekov, A. Structure and properties of detonation coatings based on titanium carbosilicide. Key Eng. Mater. 2019, 821, 301–306. [Google Scholar] [CrossRef]
  24. Lawrence, M.; Jiang, Y. Porosity, Pore Size Distribution, Micro-structure. In Bio-Aggregates Based Building Materials: State-of-the-Art Report of the RILEM Technical Committee 236-BBM; Amziane, S., Collet, F., Eds.; RILEM State-of-the-Art Reports; Springer: Cham, Switzerland, 2017; pp. 39–71. [Google Scholar]
  25. He, L.; Chen, L.; Xu, Y. Interfacial structure, mechanical properties and thermal stability of CrAlSiN/CrAlN multilayer coatings. Mater. Charact. 2017, 125, 1–6. [Google Scholar] [CrossRef]
  26. Ubuo, E.E.; Paunov, V.N.; Horozov, T.S. Slippery or sticky nano-porous silica coatings impregnated with squalane: The role of oil over-layer. Lubr. Sci. 2022, 35, 29–39. [Google Scholar] [CrossRef]
  27. Wang, D.; Yang, J.; Liu, J.; Li, X.; Li, R.; Cai, M.; Sham, T.-K.; Sun, X. Atomic layer deposited coatings to significantly stabilize anodes for Li ion batteries: Effects of coating thickness and the size of anode particles. J. Mater. Chem. A 2014, 2, 2306–2312. [Google Scholar] [CrossRef]
  28. Prasad, C.D.; Joladarashi, S.; Ramesh, M.; Srinath, M.; Channabasappa, B. Effect of microwave heating on microstructure and elevated temperature adhesive wear behavior of HVOF deposited CoMoCrSi-Cr3C2 coating. Surf. Coat. Technol. 2019, 374, 291–304. [Google Scholar] [CrossRef]
  29. Kim, D.-Y.; Jin, S.H.; Jeong, S.-G.; Lee, B.; Kang, K.-K.; Lee, C.-S. Microfluidic preparation of monodisperse polymeric microspheres coated with silica nanoparticles. Sci. Rep. 2018, 8, 8525. [Google Scholar] [CrossRef]
  30. Jia, H.; Zheng, J.; Song, J.; Luo, L.; Yi, R.; Estevez, L.; Zhao, W.; Patel, R.; Li, X.; Zhang, J.-G. A novel approach to synthesize micrometer-sized porous silicon as a high performance anode for lithium-ion batteries. Nano Energy 2018, 50, 589–597. [Google Scholar] [CrossRef]
  31. Lago, M.; Araujo, M. Capillary rise in porous media. J. Colloid Interface Sci. 2001, 234, 35–43. [Google Scholar] [CrossRef]
  32. Ruys, A. Processing, structure, and properties of alumina ceramics. In Alumina Ceramics: Biomedical and Clinical Applications; Woodhead Publishing: Sawston, UK, 2019; pp. 71–121. [Google Scholar]
  33. Ubuo, E.; Udo, G.; Koffi, U.; Alswafy, O. The role of particle size on bio-fouling properties of oil-impregnated nano-porous silica coatings. J. Appl. Sci. Environ. Manag. 2019, 23, 1153–1157. [Google Scholar] [CrossRef]
  34. Nandiyanto, A.B.D.; Okuyama, K. Progress in developing spray-drying methods for the production of controlled morphology particles: From the nanometer to submicrometer size ranges. Adv. Powder Technol. 2011, 22, 1–19. [Google Scholar] [CrossRef]
  35. Baig, N.; Kammakakam, I.; Falath, W. Nanomaterials: A review of synthesis methods, properties, recent progress, and challenges. Mater. Adv. 2021, 2, 1821–1871. [Google Scholar] [CrossRef]
  36. Xu, Y.; Zhang, B. Recent advances in porous Pt-based nanostructures: Synthesis and electrochemical applications. Chem. Soc. Rev. 2014, 43, 2439–2450. [Google Scholar] [CrossRef] [PubMed]
  37. Missimer, T.; Lopez, O. Laboratory measurement of total porosity in unconsolidated quartz sand by two integrated methods. J. Geol. Geophys. 2018, 7, 2. [Google Scholar]
  38. Espinal, L. Porosity and its measurement. In Characterization of Materials; John Wiley & Sons, Inc.: Hoboken, NJ, USA, 2002; pp. 1–10. [Google Scholar]
  39. Odhiambo, J.G.; Li, W.; Zhao, Y.; Li, C. Porosity and its significance in plasma-sprayed coatings. Coatings 2019, 9, 460. [Google Scholar] [CrossRef] [Green Version]
  40. Kazanin, I.; Zinovyev, V.; Lebiga, V.; Pak, A.Y.; Fomin, V.; Vereshchagin, A.; Tsibulsky, N. Determination of transport characteristics of granulated sorbents in adsorber. AIP Conf. Proc. 2018, 1939, 020029. [Google Scholar]
  41. Saidian, M.; Kuila, U.; Godinez, L.J.; Rivera, S.; Prasad, M. A comparative study of porosity measurement in mudrocks. In SEG Technical Program Expanded Abstracts 2014; Society of Exploration Geophysicists: Houston, TX, USA, 2014; pp. 2433–2438. [Google Scholar]
  42. Ponomarenko, A.; Quéré, D.; Clanet, C. A universal law for capillary rise in corners. J. Fluid Mech. 2011, 666, 146–154. [Google Scholar] [CrossRef] [Green Version]
  43. Grinham, R.; Chew, D.A. A review of outgassing and methods for its reduction. Appl. Sci. Converg. Technol. 2017, 26, 95–109. [Google Scholar] [CrossRef]
  44. Pecha, M.B.; Thornburg, N.E.; Peterson, C.A.; Crowley, M.F.; Gao, X.; Lu, L.; Wiggins, G.; Brown, R.C.; Ciesielski, P.N. Impacts of anisotropic porosity on heat transfer and off-gassing during biomass pyrolysis. Energy Fuels 2021, 35, 20131–20141. [Google Scholar] [CrossRef]
  45. Kolliopoulos, P.; Jochem, K.S.; Johnson, D.; Suszynski, W.J.; Francis, L.F.; Kumar, S. Capillary-flow dynamics in open rectangular microchannels. J. Fluid Mech. 2021, 911, A32. [Google Scholar]
  46. Aguilera, J.M.; Michel, M.; Mayor, G. Fat migration in chocolate: Diffusion or capillary flow in a particulate solid?—A hypothesis paper. J. Food Sci. 2004, 69, 167–174. [Google Scholar] [CrossRef]
  47. Ubuo, E.E. Wetting Properties of Protective Coatings Based on Structured Surfaces. Ph.D. Thesis, University of Hull, Kingston, UK, 2016. [Google Scholar]
  48. Schneider, M.; Maurath, J.; Fischer, S.B.; Weiß, M.; Willenbacher, N.; Koos, E. Suppressing crack formation in particulate systems by utilizing capillary forces. ACS Appl. Mater. Interfaces 2017, 9, 11095–11105. [Google Scholar] [CrossRef] [Green Version]
  49. Ghazanfari, A.; Li, W.; Leu, M.C.; Hilmas, G.E. A novel freeform extrusion fabrication process for producing solid ceramic components with uniform layered radiation drying. Addit. Manuf. 2017, 15, 102–112. [Google Scholar] [CrossRef] [Green Version]
  50. Larosche, C. Types and causes of cracking in concrete structures. In Failure, Distress and Repair of Concrete Structures; Elsevier: Amsterdam, The Netherlands, 2009; pp. 57–83. [Google Scholar]
  51. Singh, K.B.; Tirumkudulu, M.S. Cracking in drying colloidal films. Phys. Rev. Lett. 2007, 98, 218302. [Google Scholar] [CrossRef] [Green Version]
  52. Van Belleghem, B.; Montoya, R.; Dewanckele, J.; Van den Steen, N.; De Graeve, I.; Deconinck, J.; Cnudde, V.; Van Tittelboom, K.; De Belie, N. Capillary water absorption in cracked and uncracked mortar–A comparison between experimental study and finite element analysis. Constr. Build. Mater. 2016, 110, 154–162. [Google Scholar] [CrossRef]
  53. Yang, L.; Chen, C.; Liu, Y.; Zheng, Y. A comparative study of ion diffusion during water imbibition in shale, sandstone and volcanic rock. Capillarity 2020, 3, 16–27. [Google Scholar] [CrossRef]
  54. Khatun, T.; Dutta, T.; Tarafdar, S. Topology of desiccation crack patterns in clay and invariance of crack interface area with thickness. Eur. Phys. J. E 2015, 38, 83. [Google Scholar] [CrossRef] [Green Version]
  55. Du, Z.; Rollag, K.; Li, J.; An, S.J.; Wood, M.; Sheng, Y.; Mukherjee, P.; Daniel, C.; Wood Iii, D. Enabling aqueous processing for crack-free thick electrodes. J. Power Sources 2017, 354, 200–206. [Google Scholar] [CrossRef] [Green Version]
  56. Hafedh, A. STA. In Proceedings of the 2016 17th International Conference on Sciences and Techniques of Automatic Control and Computer Engineering (STA), Sousse, Tunisia, 19–21 December 2016; pp. 558–562. [Google Scholar]
  57. Whitby, C.P.; Krebsz, M.; Booty, S.J. Understanding the role of hydrogen bonding in the aggregation of fumed silica particles in triglyceride solvents. J. Colloid Interface Sci. 2018, 527, 1–9. [Google Scholar] [CrossRef] [PubMed]
  58. Giurlani, W.; Berretti, E.; Innocenti, M.; Lavacchi, A. Measuring the thickness of metal coatings: A review of the methods. Coatings 2020, 10, 1211. [Google Scholar] [CrossRef]
  59. Bode, R.; Ferch, H.; Fratzscher, H. Basic characteristics of AEROSIL fumed silica. Tech Bull-Fine Part 2006, 11, 55–56. [Google Scholar]
  60. Tripathi, N. Densities, viscosities, and refractive indices of mixtures of hexane with cyclohexane, decane, hexadecane, and squalane at 298.15 K. Int. J. Thermophys. 2005, 26, 693–703. [Google Scholar] [CrossRef]
Scheme 1. Schematic presentation of (a) the preparation of silica suspension and (b) the spin coating process.
Jcs 07 00259 sch001
Figure 1. Plot showing the effect of coating speed on the coating thickness (measured from SEM images).
Jcs 07 00259 g001
Figure 2. Optical microscopy images of the spin-coated glass (A) C-500, (B) C-1000, (C) C-2000, (D) C-8000. All scale bars represent 100 µm.
Jcs 07 00259 g002
Figure 3. SEM images of C-2000 showing (A) porosity, (B,C) thickness. Scale bars represent 200 nm on (A) and 1 µm on (B,C).
Jcs 07 00259 g003
Figure 4. (A) Schematic of stylus tip (from Dektak XT) scanning through the top surface and base material (scratch point) of the coating. The thickness of the coating is the vertical distance between the topmost layer and the base material, denoted as h on a distortion free coating, (B) schematic of deformation during the scratch test creating inconsistent thickness, h1 and h1, (C,D) Dektak profilometer results showing distorted thickness (R-M1 and M1-M2) and the actual thickness of the coatings (beyond M2).
Jcs 07 00259 g004
Figure 5. (A) Photograph of the experimental set-up for capillary driven impregnation, magnified images showing (B) partial impregnation and (C) full impregnation, (D) plot of the height of the liquid front, indicating degree of impregnation vs. time, (E) approximated geometry and dimensions of the impregnated coating used in thickness and porosity calculations.
Jcs 07 00259 g005
Table 1. Experimental results showing values of parameters expressed in Equations (7) and (8) and the measured areas of the coated films.
SampleMO (g)Mc (g)Ml (g)A (cm2) ρ S (gcm−3) ρ o i l (gcm−3)
11.752891.753651.755316.602.200.81
21.844411.845171.846806.802.200.81
31.752991.753831.755316.002.200.81
41.681841.682591.684607.102.200.81
51.761901.762741.764707.302.200.81
Table 2. Analyses of the experimental results (provided in Table 1) for the calculations of the mass of coated silica, mass of impregnated oil, volume occupied by silica, voids volume, coating thickness and porosity.
SampleMs (g)
(McMo)
Moil (g)
(MlMc)
Vs (cm3)
( M s / ρ S )
Vp (cm3)
( M oil / ρ o i l )
H (µm)
(Vs = Vp)/A
Φ (%)
[Vp/(Vs+ Vp)100]
10.000760.001660.000350.002053.686
20.000760.001630.000350.002013.585
30.000840.001480.000380.001833.783
40.000750.002010.000340.002484.088
50.000840.001960.000380.002423.986
Mean value 3.7 ± 0.286 ± 2
Disclaimer/Publisher’s Note: The statements, opinions and data contained in all publications are solely those of the individual author(s) and contributor(s) and not of MDPI and/or the editor(s). MDPI and/or the editor(s) disclaim responsibility for any injury to people or property resulting from any ideas, methods, instructions or products referred to in the content.

