Article

Ternary Ni-Ce-Mg-O Composites: In-Depth Optical Spectroscopy Study and Catalytic Performance in CO Oxidation

by
Grigory B. Veselov
,
Vladimir O. Stoyanovskii
and
Aleksey A. Vedyagin
*
Boreskov Institute of Catalysis, 5 Lavrentyev Avenue, 630090 Novosibirsk, Russia
*
Author to whom correspondence should be addressed.
J. Compos. Sci. 2023, 7(6), 251; https://doi.org/10.3390/jcs7060251
Submission received: 7 May 2023 / Revised: 6 June 2023 / Accepted: 12 June 2023 / Published: 15 June 2023

Abstract

:
In the present work, ternary Ni-Ce-Mg-O composites containing various amounts of NiO and CeO2 were synthesized via a sol-gel approach. Aqueous solutions of cerium and nickel nitrates were introduced at the stage of hydrolysis of magnesium methoxide, which allowed for avoiding the use of expensive organic precursors. It was revealed that the properties of the composites were defined by the complex interactions between NiO, CeO2, and MgO components. In order to perform an in-depth characterization of the prepared samples, diffuse reflectance UV–vis and Raman spectroscopies were applied. According to the results of these methods, Mg2+ ions did not substitute Ce4+ ions in the CeO2 lattice. However, in the case of the Ni-containing samples, approximately 2–3% of the Ce4+ ions were substituted by Ni2+, thus resulting in the formation of vacancies in the CeO2. The strong interaction of NiO with MgO predictably resulted in the formation of NixMg1−xO solid solutions. When the NiO content in the sample was 20 wt%, the composition of the formed solid solution was estimated to be Ni0.60Mg0.40O. In addition, the presence of CeO2 affected the texture of the ternary composites, thus leading to a slight decrease in the specific surface area. The catalytic performance of the Ni-Ce-Mg-O composites was examined in the CO oxidation reaction under prompt thermal aging conditions. The choice of reaction conditions was due to a high sensitivity of the CO oxidation response toward the available metal surface area and possible metal-support interactions.

1. Introduction

One of the most industrially important applications of oxide materials is their use as catalyst support. Among such oxides, Al2O3 and SiO2 attract much attention, and therefore they are used in real industrial processes more frequently. Contrarily, MgO is often considered as a model support with pronounced basic properties. The main reason for this is that Al2O3 and SiO2 generally possess higher specific surface and porosity values than MgO prepared using conventional methods. However, during the last decades, MgO has been intensively studied within the composition of the catalysts for various catalytic processes. For instance, the AuAg-MgO system was effective in n-octanol oxidation [1], Ru-MgO was applicable for ammonia decomposition [2], Co/MgO showed an appropriate activity in glycerol steam reforming [3], Cu/MgO was applied in the water–gas shift reaction [4], CO oxidative coupling to dimethyl oxalate was performed over Pd/MgO [5], aerogel-prepared VOx/MgO system exhibited promising activity in oxidative dehydrogenation of propane [6], and Ni/MgO was used for CO2 methanation [7,8]. In addition, the basic properties of magnesium oxide make it possible to create efficient systems for carbon dioxide capture, which can be regenerated many times without a loss in adsorption capacity [9,10,11].
The most attractive directions of application of MgO-based systems deal with such processes as steam reforming and carbon dioxide reforming of methane. Ni/MgO catalysts are mostly used for these purposes [12,13,14,15,16,17]. As has been reported, such systems have excellent stability and are less inclined to coke formation. In this case, MgO plays a significant role in stabilizing the clusters of metallic nickel on the surface, thus contributing to the preservation of catalytic activity [15]. The doping of Ni/MgO catalysts with such elements as ruthenium [18], molybdenum [19], and palladium [20] have been reported to further improve the catalytic performance. The addition of cerium and zirconium oxides also positively affects the Ni/MgO catalysts, increasing their activity in both steam and dry reforming processes. Thus, Kim et al. demonstrated that such supports possessed a larger surface area and better dispersion of Ni species [21]. Khajenoori et al. [22] reported that the doping of Ni/MgO with cerium oxide allowed decreasing the number of carbon deposits formed on the Ni particles during the reaction and weakened the chemical interaction between NiO and the support, which simplified the reduction of NiO species. The optimal composition of the catalyst was found to be 10% Ni–7% CeO2/MgO [23]. According to Qiujie et al. [24], the MgO-to-CeO2 ratio of 1:1 allowed for achieving the highest activity, stability, and selectivity in the steam reforming of ethanol. As is known, CeO2 possesses a high oxygen storage capacity that plays an important role during the catalytic process. An intensified oxygen transfer facilitates the removal of carbon deposits from the metal surface [25]. It is important to mention that once the lattice oxygen in CeO2 is depleted, it can be regenerated by the atmospheric oxygen. This allows for CeO2 to be used as a component of a catalytic washcoat in diesel particulate filters. The redox properties of CeO2 can be enhanced by the addition of transition metals such as Cu and Ag, thus increasing the oxygen storage capacity as well as the reactivity of the surface oxygen species [26,27].
In some cases, the combination of the oxidative properties of CeO2 with the basic properties of MgO provides a synergetic effect, improving the process efficiency. Thus, the introduction of CeO2 into the MgO matrix allows the acceleration of the initial rate of SO2 adsorption due to its oxidation by the lattice oxygen of cerium oxide to SO3 [28]. Ru/CeO2-MgO materials were also used for the CO2 capture/methanation process. In this case, the morphology of the particles was proven to have a significant effect on the activity of CeO2 [29]. Binary oxides of such composition as Ce0.05Mg0.95O1.05 demonstrated excellent performance in the dry reforming of methane in the presence of H2S. CO2 captured on the CeO2-MgO interface behaved as an oxidant in the reaction with CH4 [30]. Ivanova et al. [31] showed that the introduction of CeO2 into magnesium oxide can lead to the formation of (Mg, Ce)O2 solid solutions along with an increase in the concentration of both strong and weak Lewis acid sites.
The properties of the ternary NiO-CeO2-MgO composite systems are defined by a complex interaction between all three components. MgO can interact with NiO with the formation of NixMg1−xO solid solutions [32,33,34,35]. This contributes to the stabilization of NiO species at elevated temperatures. On the other hand, the migration of Ni2+ ions into the bulk of the MgO lattice is not a desirable process because this makes these nickel species inaccessible for the reagents and complicates their reduction. As with Ni2+ ions, Mg2+ ions are capable of replacing cerium ions in the CeO2 lattice with the formation of oxygen vacancies [31,36]. It is obvious that the appearance of such vacancies reflects in the catalytic performance of the materials. Thus, Zhang et al. [37] emphasized the role of such vacancies in the activation of oxygen on the CeO2. An increase in the number of vacancies reduced both the band gap and the activation energy, thus leading to greater specific activity. For the CO oxidation reaction over NiO/CeO2 catalysts, the interactions near the NiO-CeO2 interface were shown to be of great importance [36,38]. Oxygen activated on the CeO2 surface reacted with CO adsorbed on NiO, which intensified the overall process. It is important to note that the surface migration of adsorbed intermediates is complicated, which emphasizes the role of the interface interactions. NiO-MgO-CeO2 systems have been recently tested as oxygen carriers for the chemical looping process of CO2 splitting [39]. Due to the formation of CeO2-NiO and NiO-MgO double solid solutions, the agglomeration of NiO species was avoided, and the redox stability of the oxygen carrier was improved.
It can be concluded from the abovementioned studies that the development of preparation methods to synthesize such ternary composites as NiO-CeO2-MgO is in high demand. Therefore, the development of an effective synthetic method for the preparation of such catalysts is an important task. Various preparation approaches have been proposed to obtain multicomponent systems based on MgO, such as co-precipitation [21,31], sequential impregnation [22,23], and the solid-phase burning method [24]. Co-precipitation and impregnation methods often do not allow obtaining a uniform distribution of the active component. In addition, the surface area of commercially available MgO supports does not exceed 50–60 m2/g [7,13,32]. Pure MgO and MgO-based systems with the highest surface area and pore volume can be obtained with supercritical drying and the calcination of magnesium hydroxides prepared via magnesium alkoxide hydrolysis [6]. This method also provides the possibility to introduce the second component in a form of a precursor soluble in organics.
In our previous publications, a simplified approach based on sol-gel technology to prepare MgO-containing systems was proposed [40,41,42,43]. The main idea of this approach was to introduce the second and further components in the form of an aqueous solution of suitable precursors at the stage of magnesium methoxide hydrolysis. This technique was successfully used for the preparation of a ternary Ni-Mo-Mg-O oxide system [44]. In this case, ammonium heptamolybdate was used as a water-soluble precursor of molybdenum oxide. The goal of the present work was to prepare a ternary Ni-Ce-Mg-O composite via the proposed sol-gel approach. Low-temperature nitrogen adsorption was used to determine the textural properties of the prepared samples. In order to study the possible interactions between the NiO, CeO2, and MgO components of the composites in more detail, optical spectroscopic methods (Raman spectroscopy and UV–vis spectroscopy) were utilized. The catalytic performance of the Ni-Ce-Mg-O systems was examined in a model reaction of CO oxidation performed in prompt thermal aging (PTA) mode. Such conditions allowed us to follow both the low-temperature and high-temperature changes taking place during the reaction. As was mentioned above, the CO oxidation reaction was sensitive to the dispersion and structure of the active component as well as to its interaction with the support.

2. Materials and Methods

2.1. Preparation of the Composites

The sol-gel technique was used to prepare ternary composites containing NiO, CeO2, and MgO. The NiO:CeO2 weight ratio was varied from 1:3 to 3:1. The total loading of NiO and CeO2 was 20 wt%. Two reference samples of binary composites containing 20 wt% of NiO or CeO2 were prepared as well. The composition and corresponding designation of the prepared samples is presented in Table 1.
The preparation procedure was as follows. First, magnesium ribbon (Sigma-Aldrich, St. Louis, MO, USA) was dissolved in methanol (Avantor Performance Materials, Gliwice, Poland) with rigorous stirring at 50 °C with the formation of Mg(OCH3)2. In order to dissolve each 1 g of magnesium, 43 mL of methanol was used. Then, toluene was added in a 1:1 volumetric ratio to the methanol. An aqueous solution of Ni(NO3)2 and/or Ce(NO3)3 (Sigma-Aldrich, St. Louis, MO, USA) was added dropwise to the solution of magnesium methoxide. The concentrations of the salts were varied to achieve the target concentrations of NiO and CeO2 in the final composites. This resulted in the immediate hydrolysis of Mg(OCH3)2 and the formation of a Mg(OH)2 gel containing Ni2+ and Ce3+ ions. The color of the gels changed from light green (for the samples containing Ni2+ ions only) to orange (for the samples containing Ce3+ ions only). The gels were stirred for 2 h and then kept overnight with mild stirring in a glass bowl to let the solvent evaporate. The samples were then dried at 150 °C for 2 h and calcined at 500 °C at a heating rate of 1 °C/min.

2.2. Characterization of the Materials

The textural characteristics of the samples were determined using low-temperature nitrogen adsorption/desorption. The isotherms were recorded at 77 K using an ASAP-2400 (Micromeritics, Norcross, GA, USA) instrument. The total pore volume (Vpore) was defined by the point of maximum adsorption. The specific surface area (ABET) was calculated using the Brunauer–Emmett–Teller method.
A powder X-ray diffraction (XRD) analysis of the samples was carried out using a Bruker D8 diffractometer (Billerica, MA, USA) working on CuKα irradiation. The Scherrer equation [45] was used to calculate the crystallite size of the samples (Equation (1)):
D = Kλ/βcosθ
where D is an average crystallite size, K is a constant equal to 0.9, λ is the wavelength of X-ray, β is the line broadening at FWHM, and θ is Bragg’s angle.
Diffuse reflectance UV–vis spectra were recorded between 190 and 800 nm using a Varian Cary 300 UV/VIS Bio UV–vis spectrometer (Agilent Technologies, Inc., Santa Clara, CA, USA) with a Labsphere DRA-CA-3300 integrating sphere (Labsphere, North Sutton, NH, USA) and using the Spectralon® standard as reference. The samples were characterized in a naturally hydrated state under atmospheric conditions.
The UV–vis spectra were transformed into the Kubelka–Munk function (Equation (2)) [46]:
F(R) = (1 − R)2/2R = α/s
where R is the reflectance of infinite sample, α is the absorption, and s is the scattering. The optical band gap of the samples, which characterized the Eg value, was estimated from the diffuse reflectance spectra using the expression proposed by Tauc, Davis, and Mott (Equation (3)) [47]:
[F(R)·hν]n = A( − Eg)
where h is Planck’s constant, ν is the frequency of vibration, represents the energy per photon, function F(R) ∼ α is the absorption coefficient, Eg is the band gap, and A is a constant. Note that n = 1/2 and 2 represent indirect and direct allowed transitions, respectively.
Raman spectra were registered using a Horiba Jobin Yvon LabRAM HR UV-VIS-NIR Evolution Raman spectrometer (Horiba, Tokyo, Japan) equipped with an Olympus BX41 microscope (Olympus Corp., Tokyo, Japan) and an argon laser with a wavelength of 514.5 nm. To prevent overheating of the sample, the laser power in the focal spot with a diameter of ∼2 μm was less than 0.8 mW.

2.3. Testing the Catalytic Activity

The CO oxidation reaction was used to characterize the activity of the samples. The prompt thermal aging (PTA) regime was used [48,49]. A specimen of the material (300 mg; a fraction of 0.25–0.5 mm in size) was loaded into a flow-through quartz reactor. A reaction gas mixture containing CO (0.15 vol %), oxygen (14.0 vol %), and nitrogen (balance) was fed into the reactor. The temperature was raised from 50 to 320 °C (runs 1 and 2), 600 °C (runs 3 and 4), 800 °C (runs 5–6), 900 °C (runs 7–8), 1000 °C (runs 9–10), and 500 °C (run 11) at a heating rate of 10 °C/min. The total flow rate was 334 mL/min. The reaction mixture at the outlet of the reactor was analyzed using a ULTRAMAT 6 gas analyzer (Siemens, Munich, Germany). The CO concentration was measured every two seconds. The temperature of 50% conversion of CO (T50) was used as a criterion to compare the samples.
The apparent activation energy of CO oxidation was determined using the same setup. In this case, the loading of the sample was 100 mg. The conversion of CO was measured in an isothermal mode in a range of temperatures of 190–310 °C with a step of 10 °C. The normalized reaction rate (W) was calculated according to Equation (4):
W = (u/mNi) · XCO
where u is the molar flow rate of CO, mNi is the weight of Ni contained in the sample, and XCO is the CO conversion value. To calculate the apparent activation energy, the Arrhenius equation was used. The CO conversion values within the range from 1% to 10% only were used for the calculation.

3. Results and Discussion

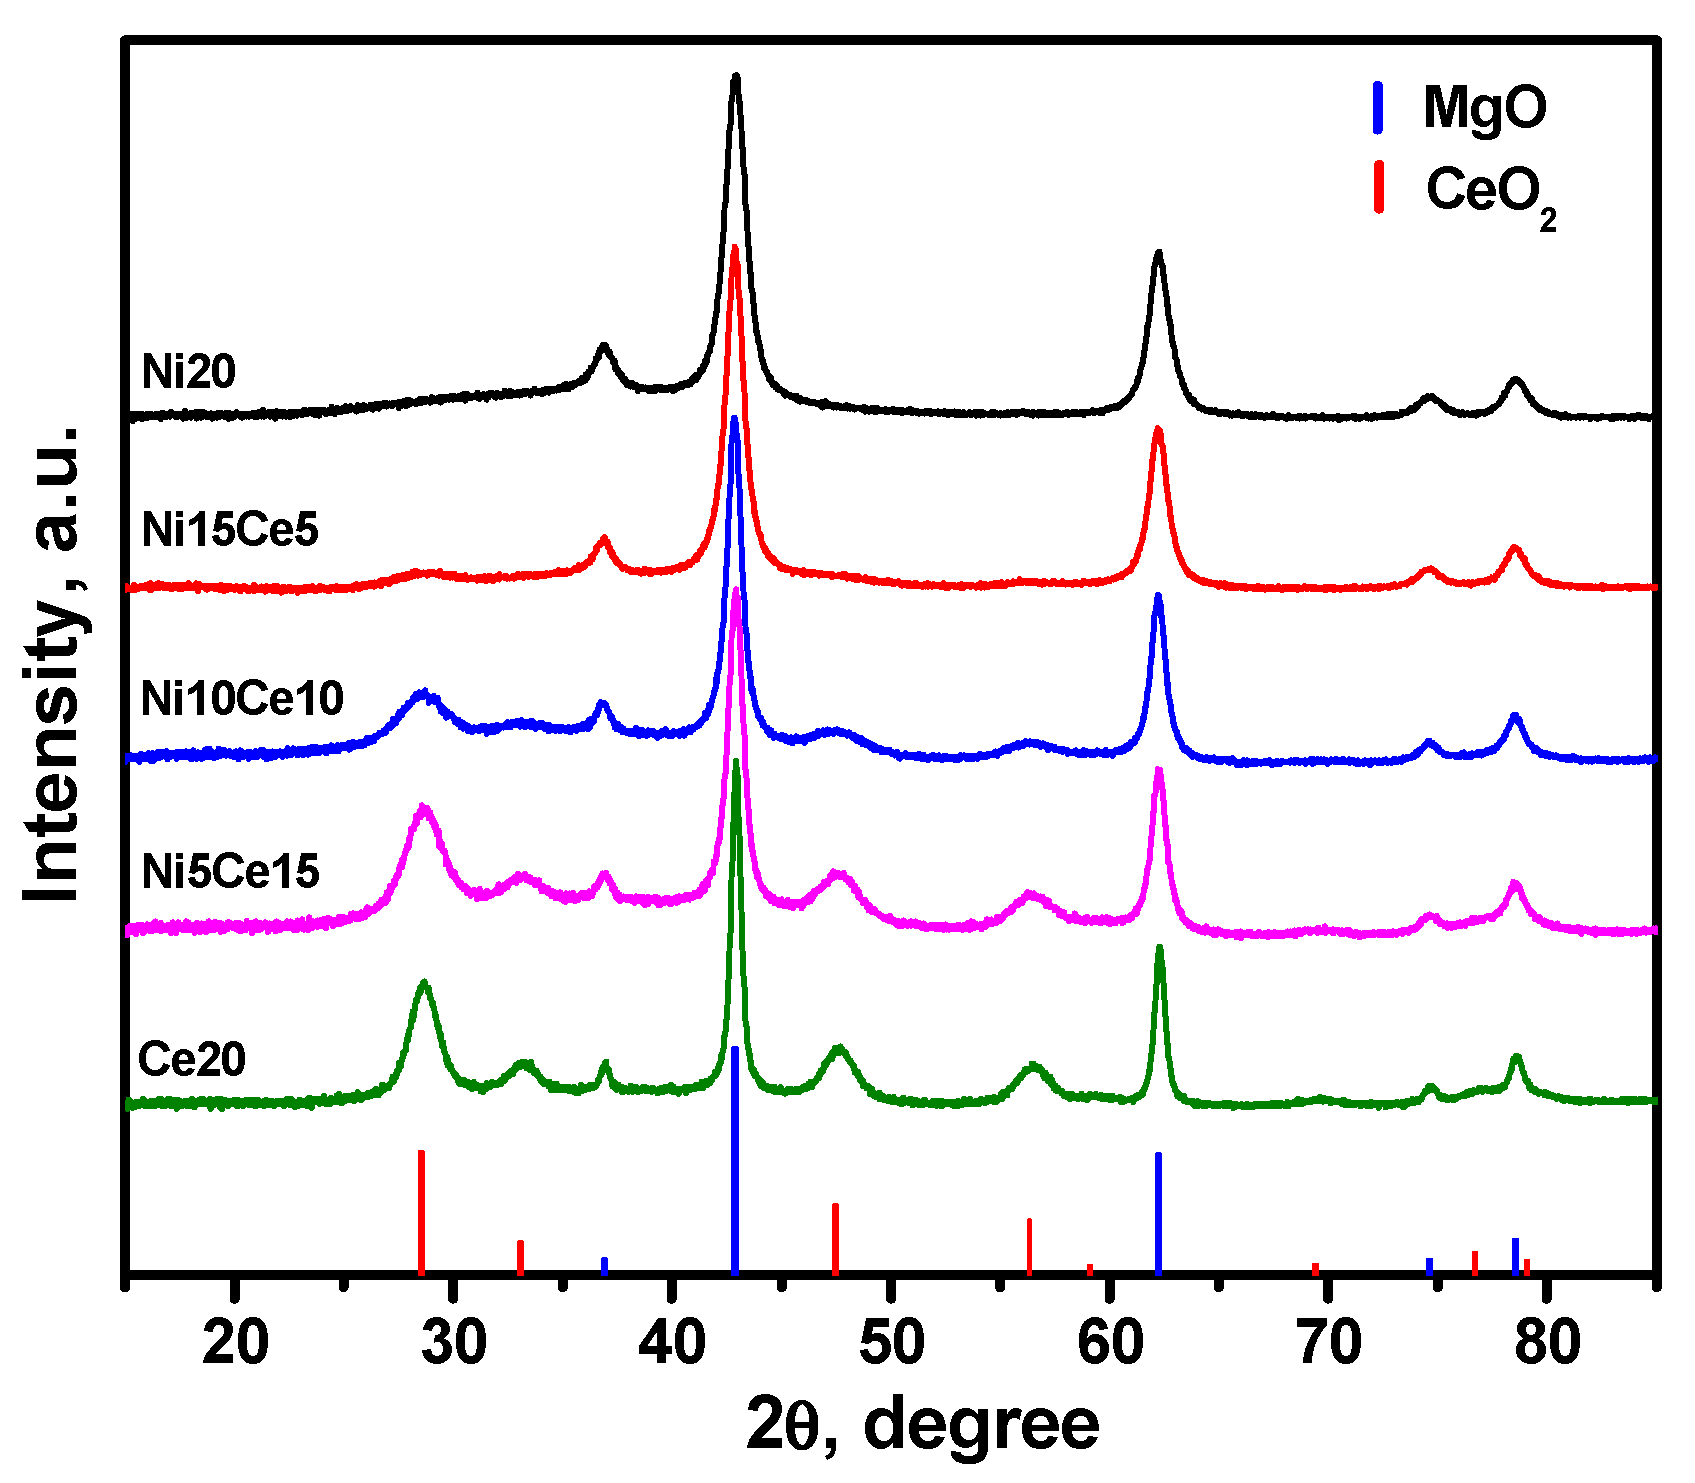
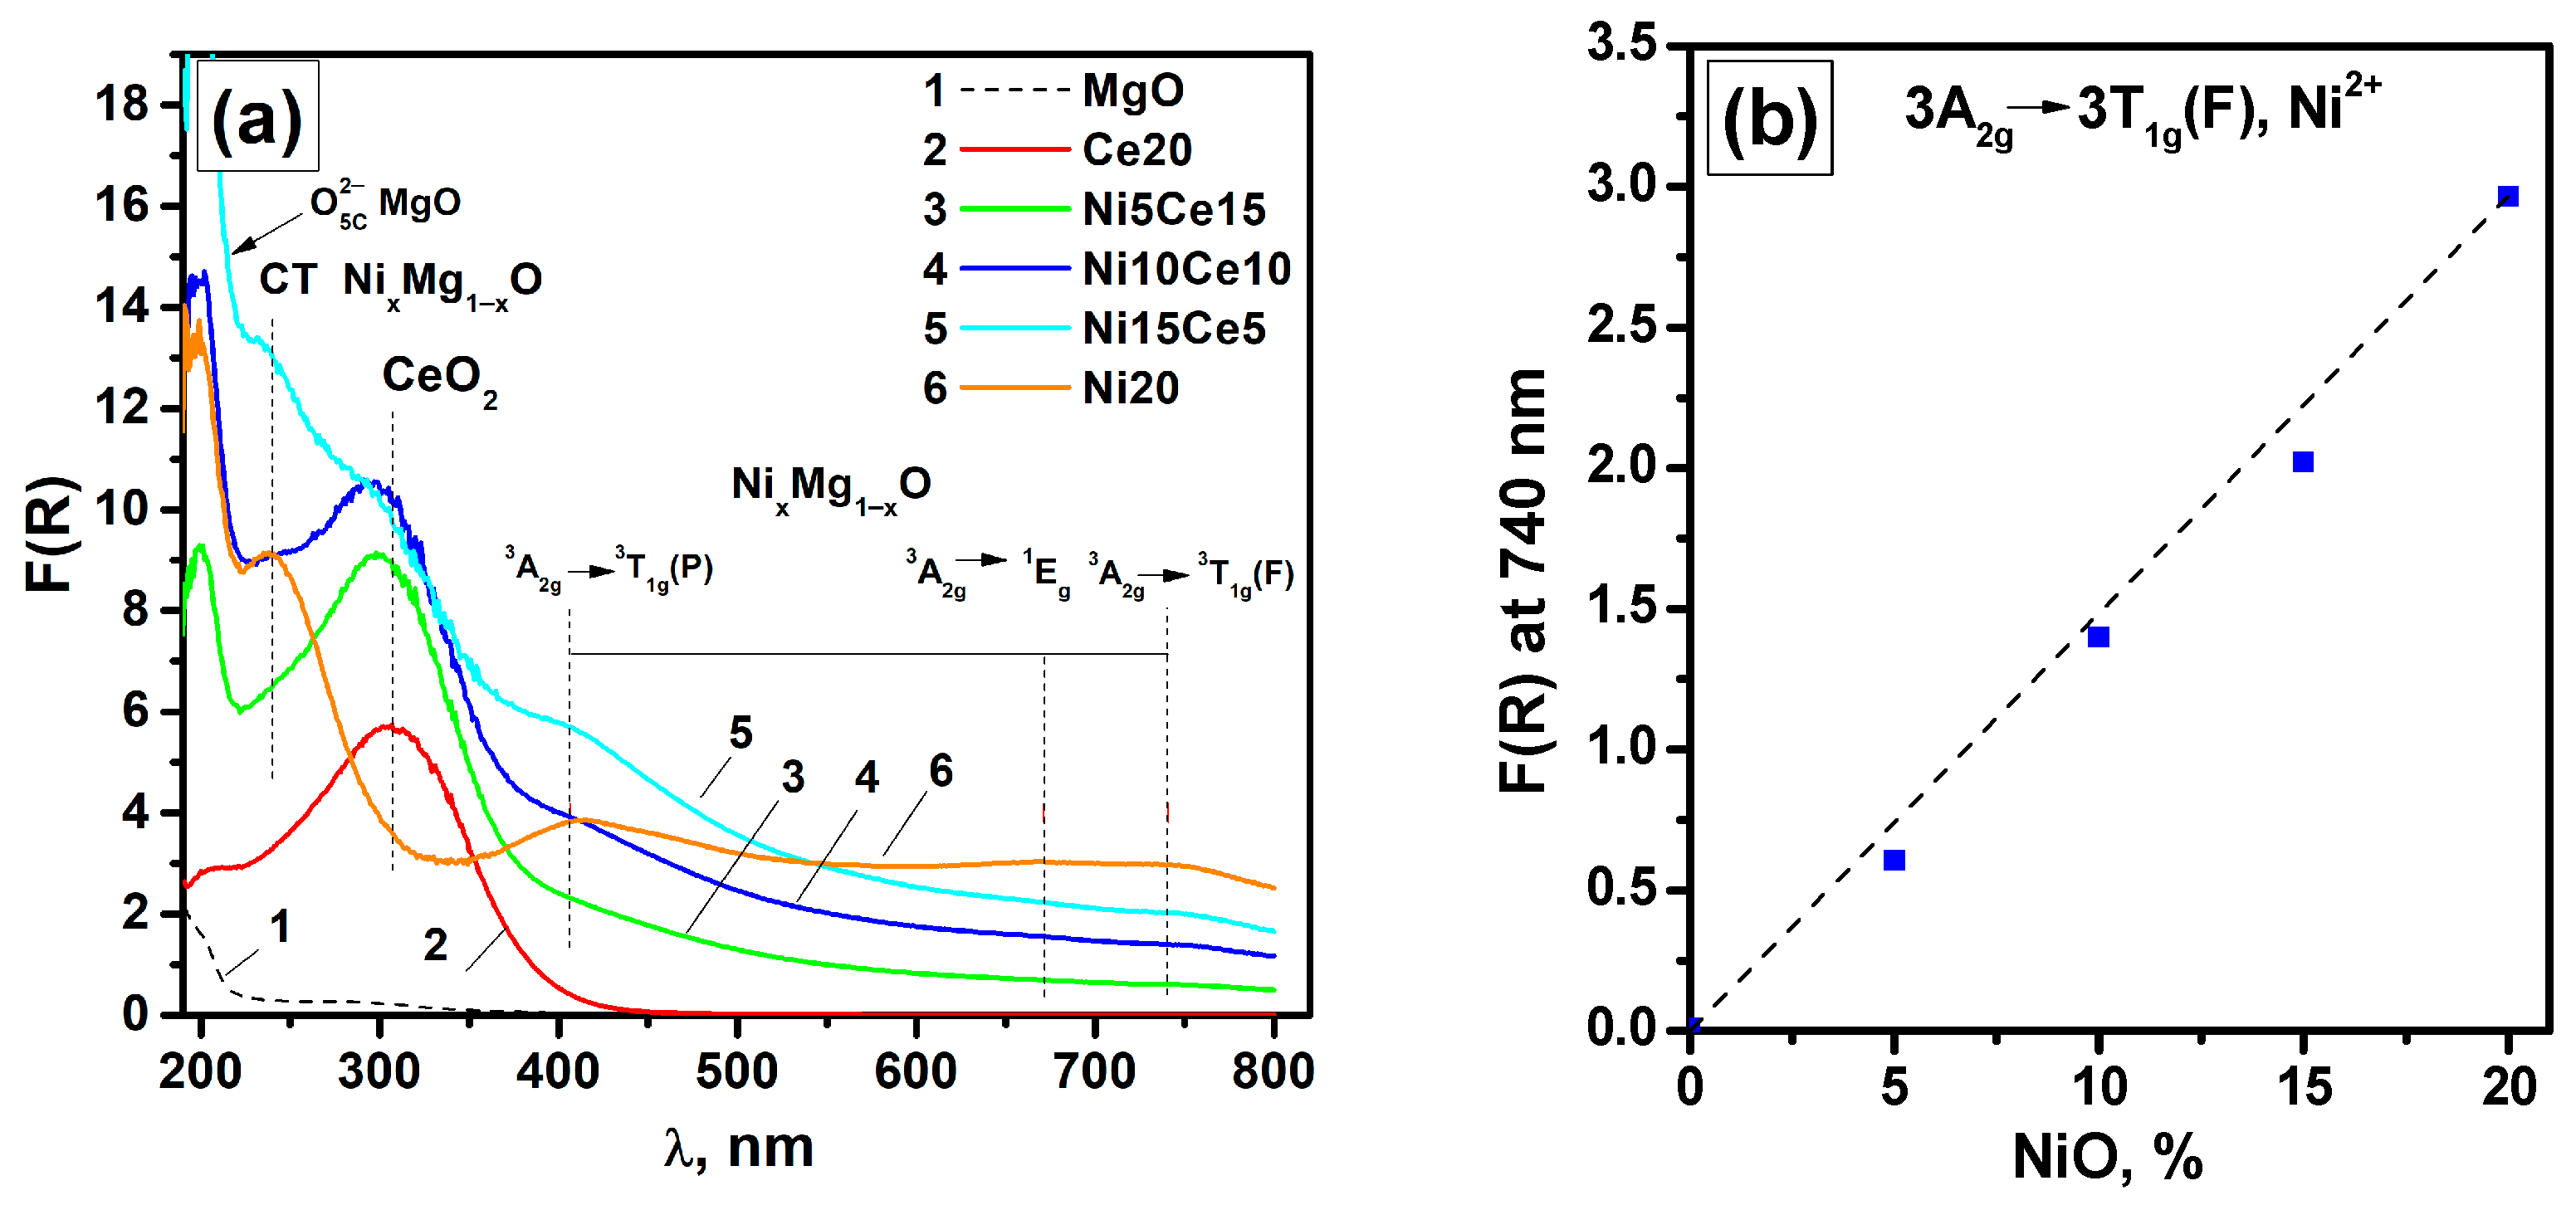
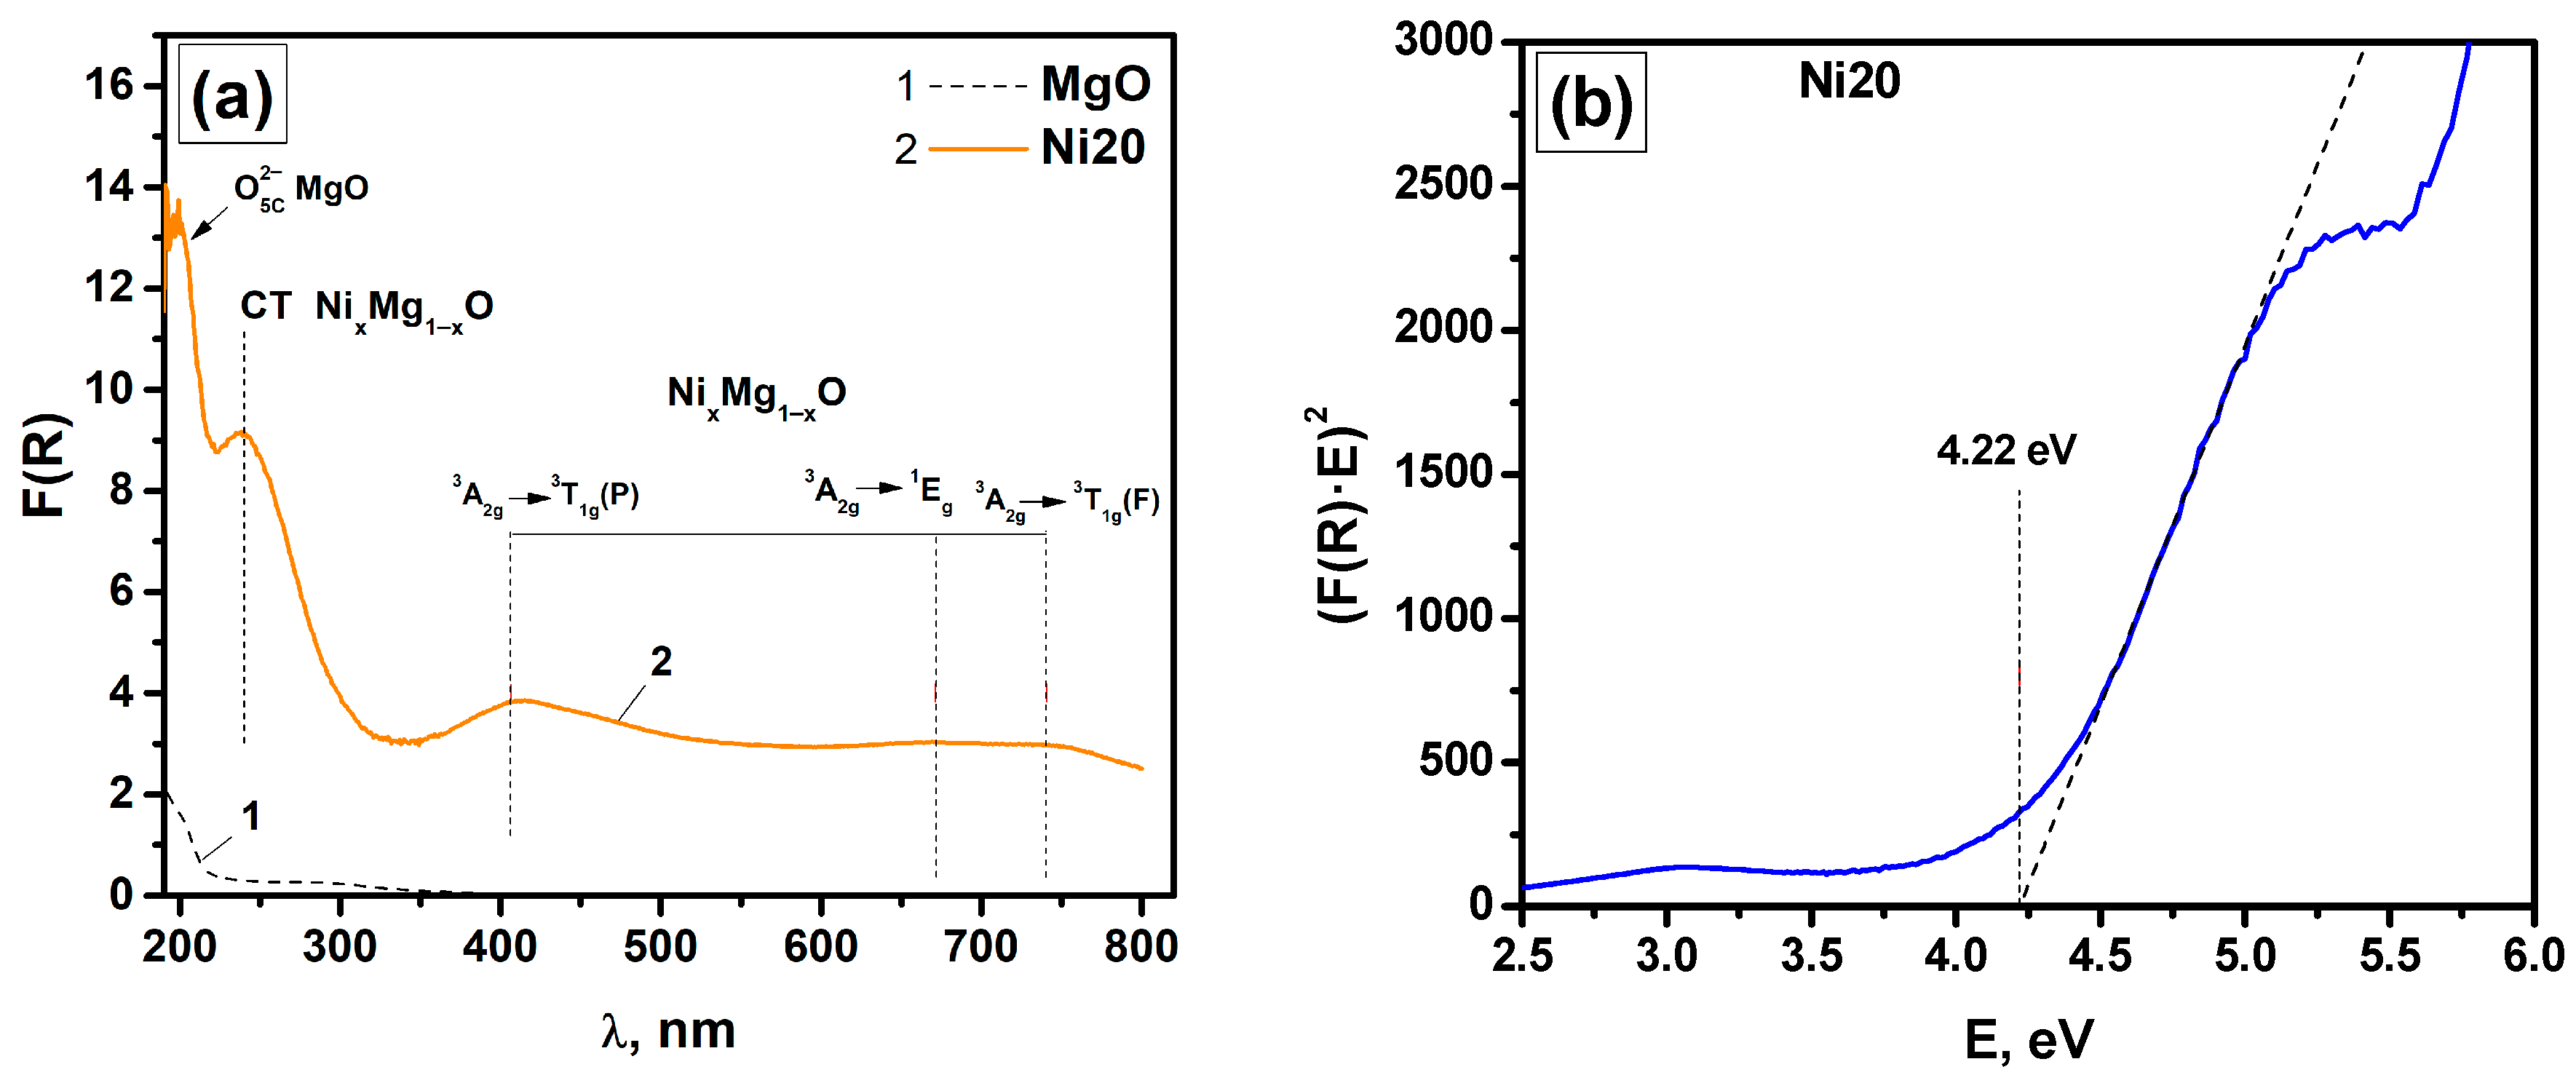
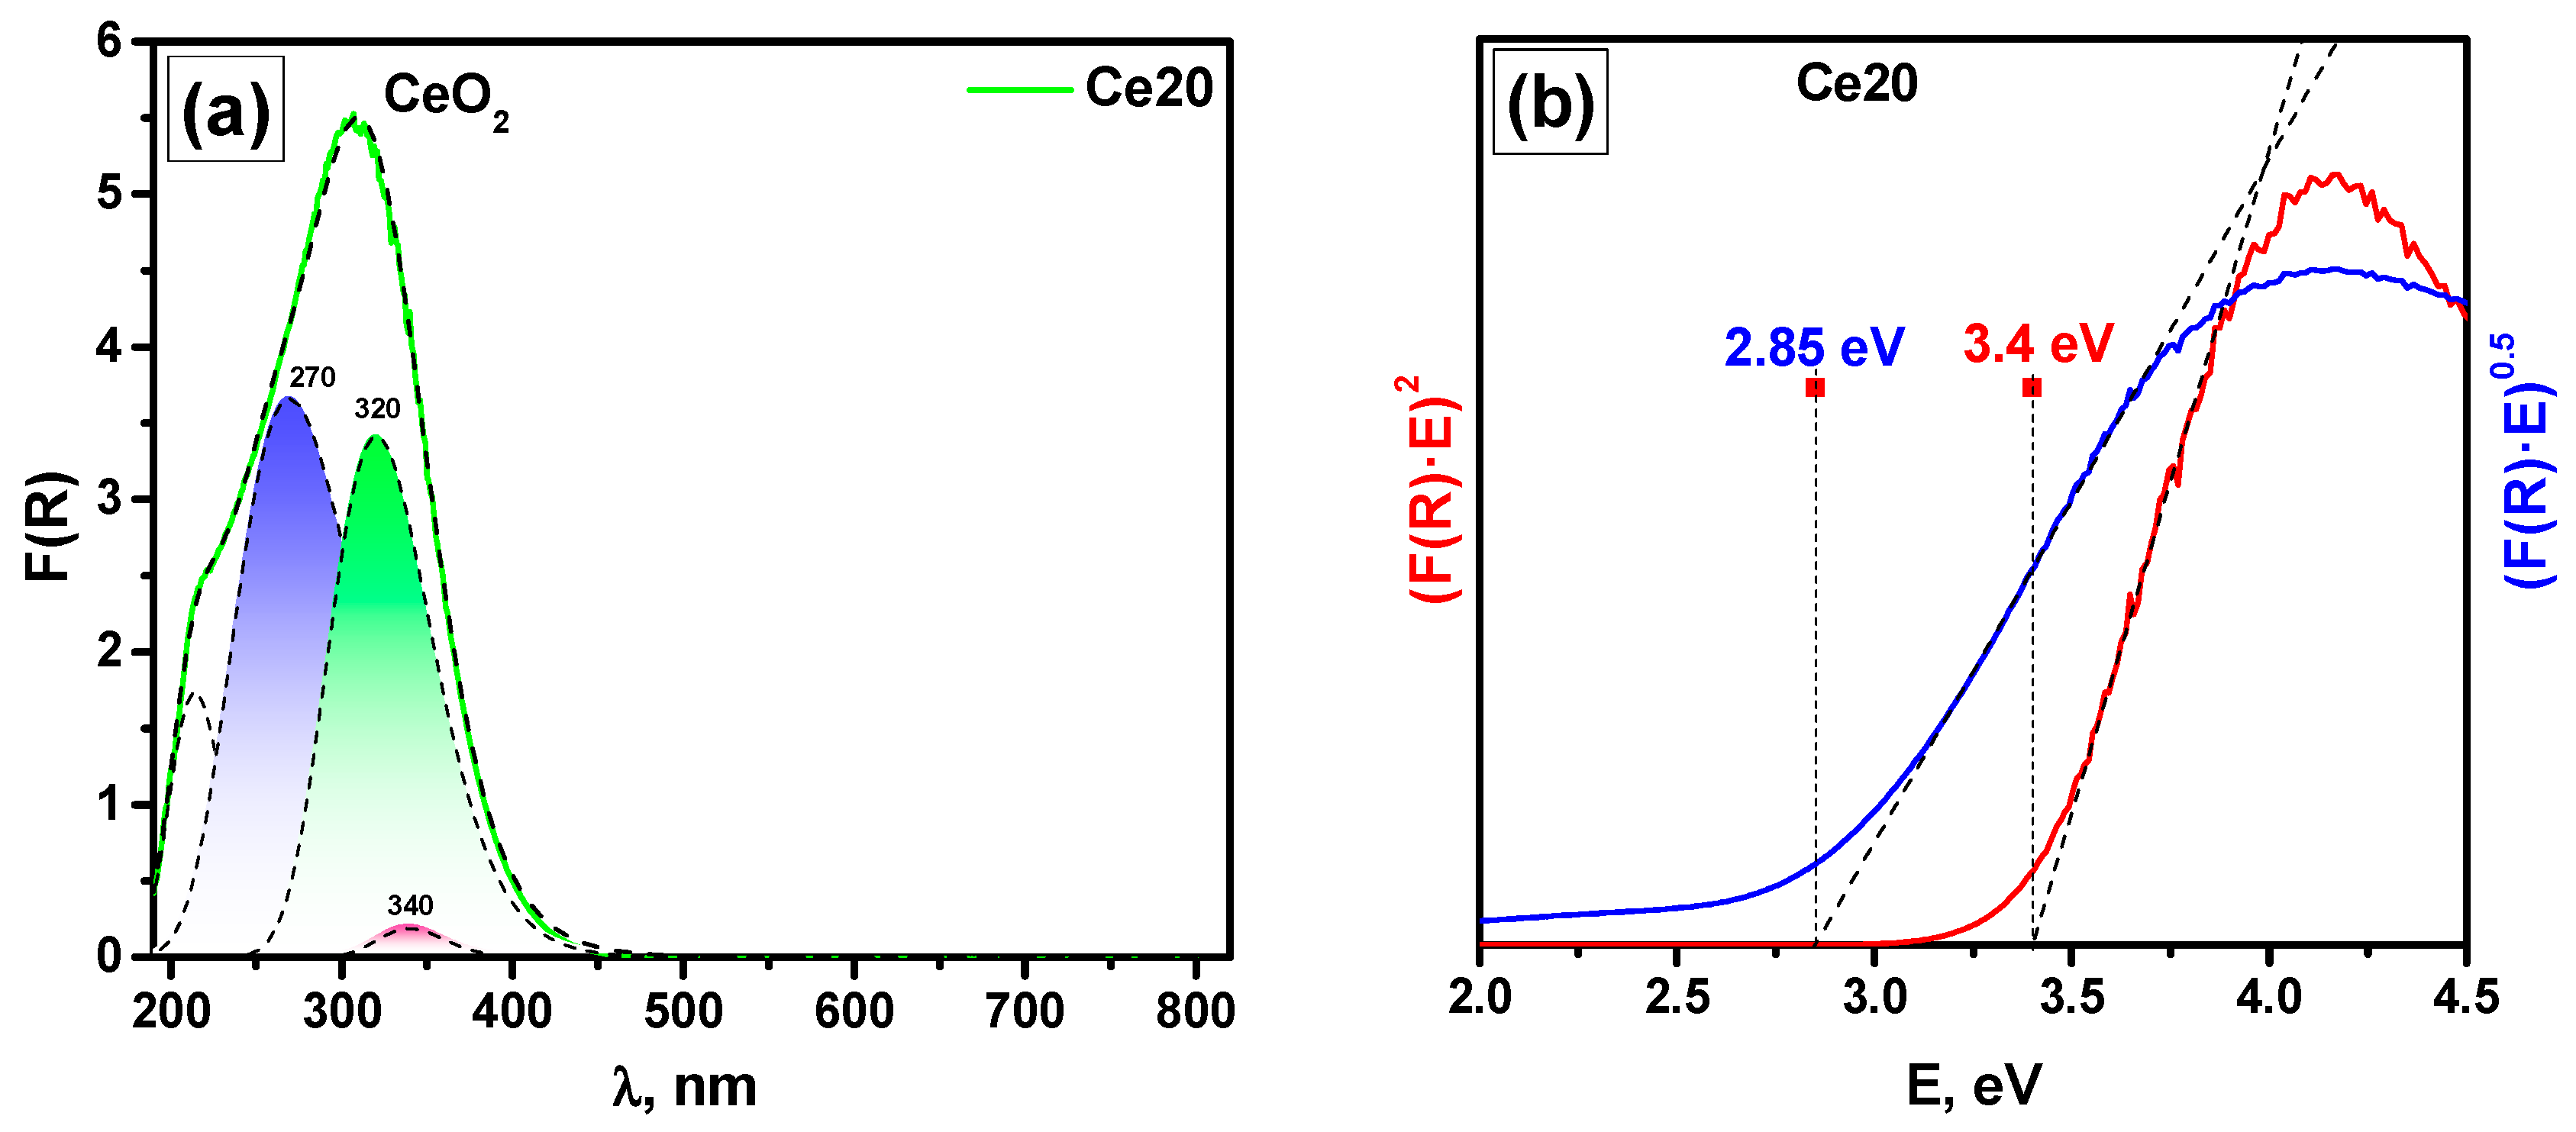
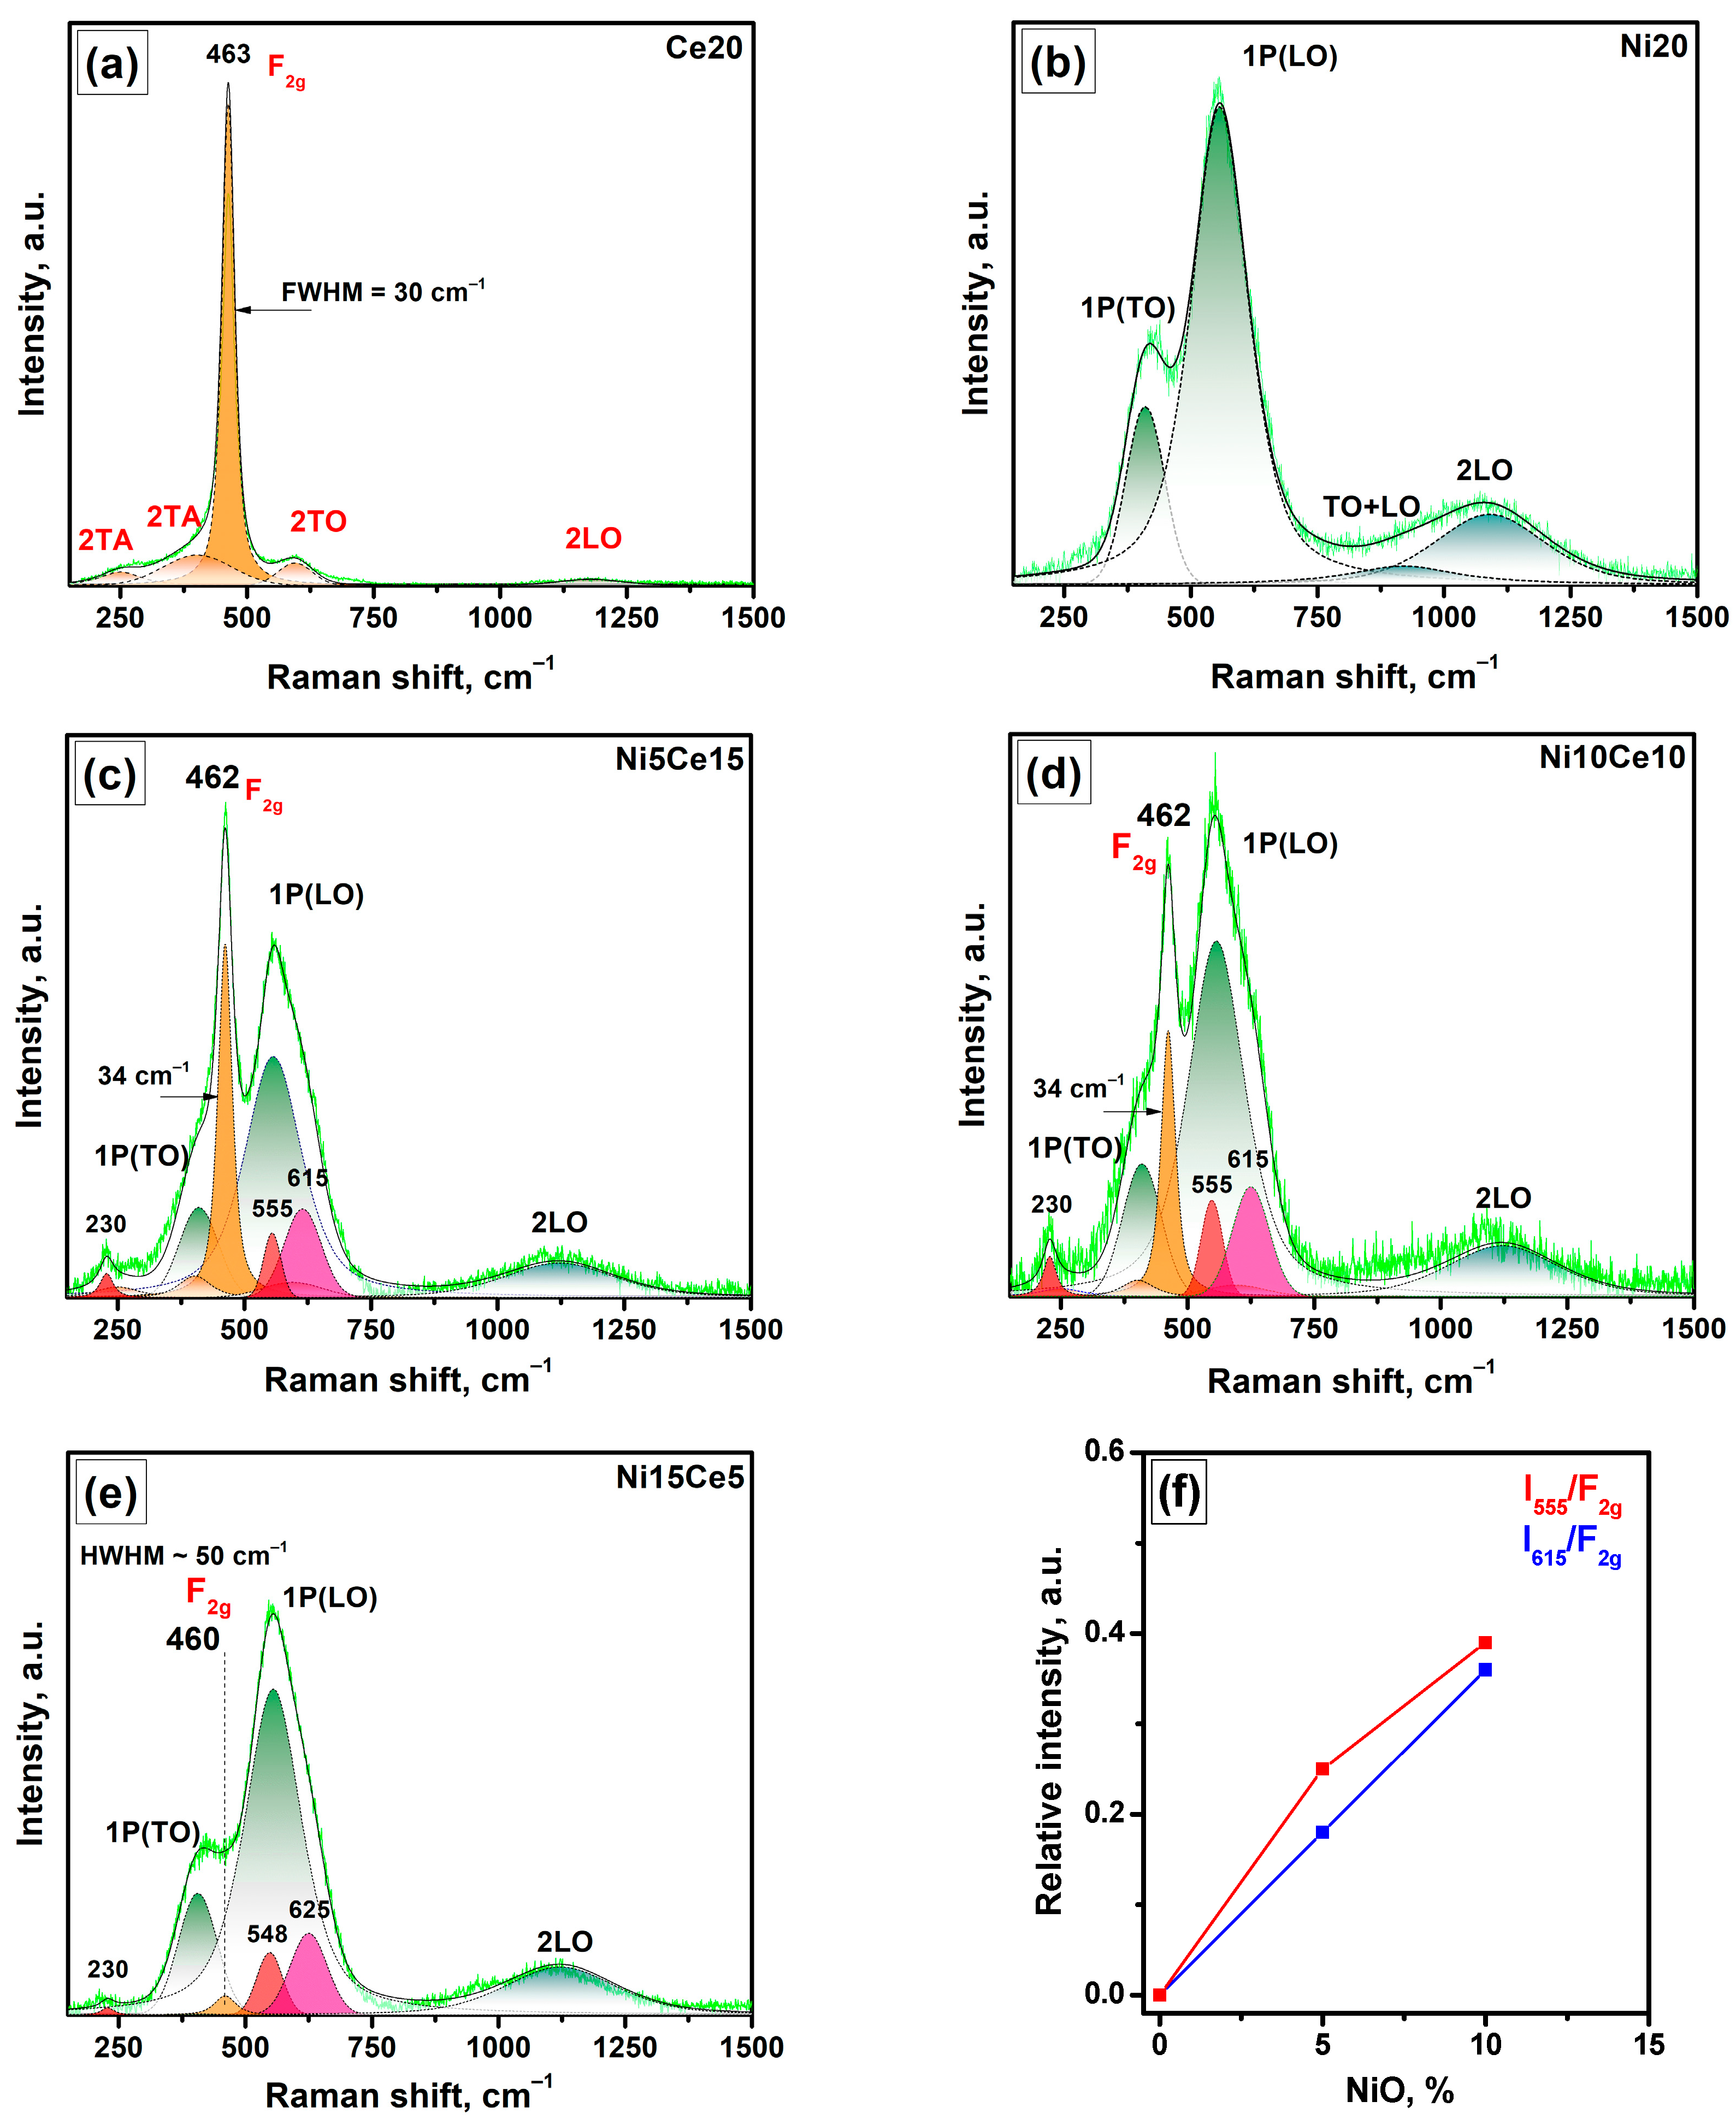
3.1. Characterization of the Composites

As was reported previously [42], magnesium oxide prepared via the sol-gel method possesses a specific surface area above 200 m2/g. The texture characteristics of the binary and ternary samples under study are shown in Table 2. Among these composites, the largest specific surface area was observed for the Ni15Ce5 sample. Then, an increase in the concentration of cerium oxide decreased the ABET value, and the lowest value of 79 m2/g corresponded to the Ce20 sample. The pore volume contrarily increased with an increase in the CeO2 concentration and reached the maximum value of 1.13 cm3/g in the case of the ternary Ni5Ce15 composite.
The characterization of the oxide ternary Ni-Ce-Mg-O samples via XRD analysis (Figure 1) revealed the presence of two phases of cubic-fluorite-structure CeO2 (JCPDS #34-0394) and rocksalt MgO (JCPDS #78-0430) only. The reflections attributed to CeO2 appeared at a CeO2 concentration as low as 5 wt%. This was notable because, no peaks of the second phase were observed even at a higher MxOy content of 15 wt% in the XRD patterns reported previously for other sol-gel-prepared M-Mg-O systems (where M is Cu, Fe, Ni, or Co) [42]. The absence of the reflections assigned to Ni species indicated the high dispersion of these species and the partial substitution of magnesium and cerium ions within the MgO and CeO2 lattices with Ni2+ ions. As can be seen in Table 2, the crystallite size estimated for the MgO phase decreased from 17 to 8 nm with an increase in the fraction of NiO, which agreed well with the nitrogen adsorption data. The crystallite size of the CeO2 phase ranged from 5.3 to 3.2 nm. The lattice parameter of NiO was lower than that of MgO. Therefore, the substitution with Ni2+ ions and the formation of NixMg1−xO solid solution should have shifted the reflections toward higher angles [50]. However, in the present case, no such shift was observed, whereas an opposite effect of the expansion of the lattice parameter appeared (Table 2) [51]. The same effect could be accounted for by an increase in the CeO2 lattice parameter with a decrease in particle size (Table 2) [52,53]. The amount of Ni2+ in the CeO2 lattice appeared to be quite low. Slightly lower values of the lattice parameter observed for the Ce20 sample could be attributed to the shrinkage of the CeO2 unit cell due to the difference in its lattice constant (0.541 nm) with respect to that of MgO (0.412 nm) [54].
Figure 2a shows the diffuse reflection UV–vis spectra of the pure MgO support and the Ce20, Ni5Ce15, Ni10Ce10, Ni15Ce5, and Ni20 samples. The absorption spectrum in the region of 190–220 nm corresponded to low-coordinated oxygen ions on the surface of magnesium oxide (6.6 eV for O2−5C ions with a coordination number of 5 and 5.6 eV for O2−4C ions with a coordination number of 4) with a characteristic particle size of about 10 nm [55].
The charge-transfer band of NixMg1−xO at 245 nm was resolved for two samples with a maximum NiO concentration only: Ni20 and Ni15Ce5. For the other three-component samples of this series, it was masked by an intense absorption band of CeO2 with a maximum of ∼300 nm. The charge-transfer bands of low-coordinate ions of Ce3+ at ∼265 nm (O2− → Ce3+), the charge-transfer band at ∼280 nm (O2− → Ce4+), and also the interband transition band at ∼325–350 nm (O2p → Ce4f) made a contribution to this band [56]. At the same time, the most interesting part of the absorption spectrum at 400–600 nm corresponded to oxygen vacancies in non-stoichiometric cerium oxide CeO2−x overlapped with a d-d transition 3A2g3T1g(P) in Ni2+ at 407 nm [56,57], which made the analysis of the absorption spectra of the three-component Ni-Ce-Mg-O samples rather complex. Nevertheless, the preliminary examination of the two-component Ni20 and Ce20 samples within the series under study should allow analyzing of the three-component samples.
According to the literature data, the absorption spectrum of NiO as well as the spectrum of NixMg1−xO in a wide range of concentrations (x) is determined by the Ni2+ ions located in the octahedral surround. It consists of an intense charge-transfer band O2−(2p) → Ni2+(3d) at 240–270 nm and unevenly widened bands at 407, 671, and 741 nm, which correspond to the d-d transitions 3A2g3T1g(P), 3A2g1Eg, and 3A2g3T1g(F), respectively [58]. This was also observed in the case of the Ni20 sample (Figure 3a). It should be noted that the dependence of the absorption value in the region of the 3A2g3T1g(F) Ni2+ transition at 740 nm on the nickel content of the samples (Figure 2b) was linear. Slightly smaller F(R) values for the CeO2-containing samples corresponded to the entry of a part of Ni2+ into the crystal lattice of CeO2. This explains the deviation of the real composition of samples from the calculated one.
The charge-transfer band defined the energy-gap width (Eg) for the NixMg1−xO particles. The value of Eg depended on the concentration (x) of Ni2+ ions in NixMg1−xO. It was experimentally determined that Eg for direct allowed transition lies in an interval ranging from 3.8 eV for NiO particles of ∼6 nm in size to 7.8 eV for pure MgO [59]. Taking into account the narrow range of particle sizes determined via XRD (Figure 1b), it can be supposed that the dimensional effects connected to an increase in the energy-gap width with the decrease in the particle size of NixMg1−xO particles were less significant than those related to the formation of solid solutions [60,61].
Based on the stoichiometry for the homogeneous Ni0.2Mg0.8O2 solid solution (20 wt% of NiO), the band-gap width should have been Eg ∼ 4.68 eV. The experimental value Eg ∼ 4.22 eV corresponded to particles with a nickel content as in Ni0.62Mg0.38O. This value was close to that obtained earlier for the similar Ni-Mg-O oxide system (15 wt% NiO) synthesized using the sol-gel method at pH = 1 [40]. When comparing UV–vis data with XRD results, it should be taken into account that in the case of a wide distribution of particles for Ni content, the Eg value will be determined by a portion of the particles with a concentration of Ni above average, integrally contributing enough to the absorption spectrum to form a band-gap edge.
The diffusion reflection spectrum of the Ce20 sample after subtraction of the spectrum of the MgO support is presented in Figure 4a. As can be seen, it was represented by a wide band with a maximum of ∼300 nm. Such charge-transfer bands for low-coordinated Ce3+ ions as O2− → Ce3+ and O2− → Ce4+ at ∼265 and ∼280 nm, respectively, as well as an interband transition band (O2p → Ce4f) at ∼325 nm contributed to this band [56].
The valence zone of stoichiometric CeO2 mainly consists of O2p states and the conduction zone consists of Ce5d states. There is a narrow band of Ce4f between them. The gap between the conduction Ce5d band and the valence band O2p is ∼6 eV [62,63,64]. Experimental data for the band-gap width O2p → Ce4f obtained by Bremsstrahlung isochromat spectroscopy (BIS) and photoluminescence provided values of 2.6–3.39 eV [62,65]. With the formation of oxygen vacancies in the non-stoichiometric CeO2−x, local distortion of the lattice occurs, and the Ce4f band is split into two bands: Ce4ffilled and Ce4fempty. Existing experimental data indicate that the Ce4ffilled band lies in the range ∼2.0–2.4 eV above the valence band [66]. The reduction limit for non-stoichiometric cerium oxide is Ce2O3 where all cerium ions are in the oxidation state of Ce3+. The main difference in the zone structure of Ce2O3 with respect to CeO2−x is the fusion of the Ce4fempty and Ce5d bands in the conduction zone [64]. The experimental value of the energy of the absorption edge for Ce2O3 (Ce4ffilled → Ce4f/Ce5d), which can be taken as an estimate of the band-gap width, is 2.4 eV [67]. Thus, it can be expected that the formation of a non-stoichiometric cerium oxide CeO2−x should be accompanied by the appearance of a band at ∼410–420 nm, which, upon further reduction of CeO2−x, will form a band gap Eg ∼ 2.0–2.4 eV.
Based on the literature, the following set of Gaussian functions converted from the energy scale to the wavelength scale in nm was used to approximate the absorption band for the Ce20 sample (Figure 4): with a maximum at 270 nm (3.66 eV and HWHM = 1.43 eV) and with a maximum at 320 nm (3.87 eV and HWHM = 0.85 eV). In addition, one more peak at 214 nm (5.79 eV and HWHM = 1.0 eV) corresponding to the edge of the band O2p → Ce5d in CeO2 was used. Further, this information was considered as auxiliary since only a part of the absorption spectrum at λ > 240 nm was attractive to compare the spectra of the NiO-containing samples. This set of bands was suitable as is for approximating all the samples under consideration except for the interband transition band (O2p → Ce4f) at 320 nm, for which a small adjustment was required in the case of the NiO-containing samples.
The dependences of (F(R)∙E)2 and (F(R)∙E)0.5 on the photon energy E presented in Figure 4b determined the band-gap width Eg for the direct (3.4 eV) and indirect (2.85 eV) allowed transitions in the Ce20 sample. Taking into account the known experimental data for the values of the band-gap width with respect to the particle sizes of CeO2 [68,69,70], the particle sizes for the samples under study were estimated to be ∼4–4.5 nm. This value was close to the value of ∼5 nm obtained from the XRD analysis (Table 2).
As can be seen for the Ce20 sample (Figure 4a), in the wavelength region above 400 nm, there were no features indicating the formation of the Ce3+ states and the associated O-vacations that could result from the incorporation of Mg2+ into the CeO2 lattice [71,72]. According to the Raman spectra, which will be discussed in detail below, there were also no signs of the formation of oxygen vacancies. Therefore, it can be concluded that no noticeable incorporation of Mg2+ into the CeO2 lattice occurred with the synthesis method used. However, it cannot be ruled out that when synthesizing the three-component samples (Ni15Ce5, Ni10Ce10, and Ni5Ce15), part of Mg2+ ions could enter the CeO2 lattice along with Ni2+ ions. In this study, Ce20 was used as a reference sample to investigate the incorporation of Ni2+ into the CeO2 lattice for the cases of the Ni-Ce-Mg-O samples.
To simulate the formation of a non-stoichiometric oxide CeO2−x, the as-prepared Ce20 sample was reduced with CO at 500 °C (Figure 5a). The absorption bands that appeared at 420 nm (2.94 eV and HWHM ∼ 0.65 eV) were associated with the formation of Ce3+ species and the associated O-vacations, and the band at 555 nm (2.23 eV and HWHM ∼ 1.35 eV) could be assigned to the surface oxygen vacancies [57]. The latter completely disappeared after oxidation at room temperature. To restore the original stoichiometry and reduce the intensity of the band at 420 nm, higher oxidation temperatures of 250–350 °C are required [73]. Similar behavior of the sample was observed during its reduction in hydrogen. With an increase in the reduction temperature and an increase in the proportion of Ce3+ states and the associated O-vacations, the band at 420 nm formed a band gap with the width values of ∼2.0–2.4 eV [67]. According to the literature data, the surface of CeO2 only is reducible at 500 °C, while a higher temperature of 650 °C is required for the reduction of bulk Ce4+ species [74,75]. Note that the data presented for the Ce20 sample reduced with CO at 500 °C (Figure 5a) were limited due to the need to avoid texture change when characterizing the initial state of the sample [57,74]. Reduction of the sample under mild conditions only slightly decreased the band-gap values for direct (3.36 eV) and indirect (2.8 eV) allowed transitions (Figure 5b).
In order to analyze the Ni-Ce-Mg-O samples and study the incorporation of Ni2+ into the CeO2 lattice, Figure 6a shows the diffuse reflectance UV–vis spectra of Ni5Ce15, Ni10Ce10, and Ni15Ce5 after subtraction of the spectrum of the Ni20 sample with the intensity corrected according to real absorption values in the field of transition 3A2g3T1g(F) Ni2+ at 740 nm. The spectrum of the pristine Ce20 sample is given for comparison. As the content of NiO in the samples increased, there was a monotonous and close to linear increase in the absorption intensity of the band at 400 nm (Figure 6b), which can be attributed to both the Ce3+ states and the associated O-vacancies and the d-d transitions of Ni2+, which occupied the lattice position of Ce4+ and the associated O-vacancies. In this case, a noticeable decrease in the band-gap (Eg) values for direct allowed transitions was observed for the sample with the maximum NiO content only. This indicated that in our case, the maximum concentration of Ni2+ in the CeO2 lattice was less than 2–3% when the effects associated with the rearrangement of the CeO2 structure appeared as a change in the band-gap width [76,77]. Dependence of the Urbach energy (EU) on the NiO content in the samples (Figure 6b) also indicated an increase in the amount of defects.
Figure 7 presents a detailed curve fitting for the diffuse reflection UV–vis spectra of the Ni5Ce15 and Ni15Ce5 samples after subtraction of the spectrum of the Ni20 sample with corrected intensity. The corresponding dependences (F(R)∙E)2 and (F(R)∙E)0.5 on the photon energy E characterizing the band-gap (Eg) values for direct and indirect allowed transitions are shown as well.
Compared to the original curve fitting set for the as-prepared Ce20 sample (Figure 4a), minor changes in the position of the interband transition band O2p → Ce4f from 320 to 313–314 nm (2.95 eV and HWHM ∼ 0.85 eV) were required. This can be interpreted as the appearance of a new band at 306 nm (4.06 eV and HWHM ∼ 0.65 eV) when the intensity of the initial band at 320 nm (3.87 eV and HWHM ∼ 0.85 eV) decreased. This finding correlated well with the electronic density of states (DOSs) analysis carried out by Miran and Jaf [78], which showed that Ni integration led to some shrinkage of Ce4f states.
The absorption band with a peak at 400 nm observed for the Ni5Ce15 sample (Figure 7a), the intensity of which increased linearly with an increase in the NiO content (Figure 6b), was well described by one broad Gaussian band at 3.1 eV with an HWHM of ∼1.35 eV. Only for the Ni15Ce5 sample (Figure 7c) did less intense absorption bands related to the formation of Ce3+ states and the associated O-vacancies and the surface vacancies characteristic of the reduced state of the Ce20 sample (Figure 5a) appear.
Changes in the position of the interband transition band for the Ni5Ce15 sample appeared as a small increase in the Eg values from 3.4 to 3.44 eV for direct allowed transitions (Figure 7b). As can be seen, the absorption band at 400 nm for both the Ni5Ce15 (Figure 7b) and Ni15Ce5 (Figure 7d) samples formed a band gap of ∼1.54–1.55 eV for indirect allowed transitions, thus indicating the formation of localized states of Ni2+ and the associated O-vacancies between the valence and conduction bands.
For direct allowed transitions, the Eg values, which were determined by the position of the interband transition band (Figure 7b,d), were just slightly decreased in the band-gap width from 3.44 to 3.4 eV, which was lower than the uncertainty of this method due to the presence of defects of various nature [79], particle size effects (3.2–5.3 nm, according to XRD), and subtraction of the spectra of NixMg1−xO. An increase in the amount of tailing (Urbach tail) with Ni doping was also observed.
When Ni2+ cations are embedded in the fluorite lattice, they can have up to eight oxygen neighbors versus six in the case of NiO. The charge compensation can lead to the formation of up to two oxygen vacancies near the Ni2+ cation. Thus, Ni2+ would be surrounded by only four oxygen atoms in square-planar coordination, which is responsible for a significant change in the absorption spectrum of Ni2+ compared to NiO and for the reduced band-gap energy [76]. Experimental data from X-ray absorption near edge spectroscopy (XANES) at the Ce L3 edge showed that Ni substitution also resulted in the conversion of a reasonable amount of Ce4+ ions to Ce3+ [76,77,80]. Computational simulations have shown that the addition of Ni into ceria would reduce the band-gap width to 1.55–1.75 eV [78], which agreed well with the data obtained in this study.
In our case, when concentrations of Ni2+ cations embedded in the CeO2 lattice were small, only a detailed analysis of the structure of the absorption bands via curve fitting of the diffuse reflection UV–vis spectra allowed us to characterize the changes in structure that occurred. Approaches based only on the analysis of the band gap, which are commonly applied to such systems, are not informative enough.
As seen in Figure 8, the Raman spectra of the Ni-Ce-Mg-O samples were determined by the intensive lines of CeO2 and NiO. Against their background, no lines corresponding to the first and second order of Raman modes for MgO nanocrystals were visible [81,82], which was due to the very low intensity of scattering in MgO.
Curve fitting of the experimental Raman spectrum of the Ce20 sample (Figure 9a) was dominated by a first-order active F2g band at 463 cm−1 (HWHM ∼ 30 cm−1) of CeO2, which was slightly shifted with regard to single crystal ceria (465 cm−1) [83,84]. This band was associated with the stretching of the Ce−O bond for eight-fold coordinated Ce4+ in the cubic fluorite structure. Second-order weak Raman bands at 250, 402, and 595 cm−1 have been assigned to 2TA and 2TO modes, and the broad band at 1178 cm−1 has been ascribed to 2LO modes [83,85]. It should be noted that no evident shift in the position of the F2g mode with respect to pristine ceria and no features in the spectrum at 570–620 cm−1 associated with the formation of oxygen vacancies [71] were seen. This indicated that in our case, the concentration of Mg2+ impurity ions in CeO2 was small, which was consistent with the data from UV–vis spectroscopy (Figure 4a).
Raman scattering of the 20%NiO-MgO samples (Figure 9b) for frequency shifts larger than 150 cm−1 allowed us to identify the main contributions from one-phonon 1P(TO) modes at 440 cm−1, 1P(LO) modes at 560 cm−1, and two-phonon 2LO modes at 1100 cm−1 for the NixMg1−xO solid solutions. The two-phonon bands (2P(TO) modes at 740 cm−1 and TO + LO modes at 925 cm−1) were less pronounced [86,87]. In comparison with the Raman spectrum of pure NiO [88,89], the intensity of the two-magnon (2M) band at ∼1400 cm−1 decreased rapidly for crystallites size smaller than 100 nm. At the same time, in the presence of the substitutional disorder as in NixMg1−xO [86], the two-magnon (2M) band experienced significant broadening and disappeared completely at x ≤ 0.6 even for polycrystalline samples.
For the presented Raman spectra of the Ni20 sample (Figure 9b), one can observe a decrease in the two-phonon band intensity relative to the one-phonon contribution and a more pronounced 1P(TO) band compared to pure NiO. This provided a possibility to estimate x in the range of ∼0.5–0.6 since two-phonon bands disappeared at x ≤ 0.4 [86]. This estimate corresponded to the x value of ∼0.6 calculated for this sample using the band-gap (Eg) value obtained from the UV–vis diffuse reflection spectra.
For curve fitting of the experimental Raman spectrum of the Ni-Ce-Mg-O samples (Figure 9c–e), a set of Gaussian functions was used. Note that the ratios of their intensities corresponded to those for the Ce20 (Figure 9a) and Ni20 (Figure 9b) samples. This made it possible to approximate all experimental spectra with the exception of the F2g band of CeO2. As can be seen in Figure 9c–e, with an increase in the NiO content from 5 to 10%, there was only a slight displacement and expansion of the F2g band of CeO2 to 463 cm−1 (HWHM ∼ 30 cm−1). At the same time, the relative intensities of the emerging new lines at 555–615 cm−1, which indicated the formation of oxygen vacancies and reduced Ce3+ ions in CeO2 [83], showed a linear ascending dependence on the total NiO content in the samples (Figure 9f). The additional band at ∼230 cm−1 (HWHM ∼ 30 cm−1) had a significantly smaller half-width with respect to the 2TA vibration mode of the lattice at ∼250 cm−1 (HWHM ∼ 100 cm−1) observed for the Ce20 sample (Figure 9a). This band is usually assigned to O−Ce longitudinal stretching of atoms in the outermost layers of CeO2 (111) surfaces [83], which has an increased intensity for smaller ceria nanoparticles. The very close character of the Raman spectra related to NiO species in this series (Figure 9b–e) allowed us to conclude that the estimate made above for x ∼ 0.5–0.6 in the composition of NixMg1−xO solution solutions could be applied to all samples.
For the Ni15Ce5 sample (Figure 9e), the F2g band of CeO2 was further shifted to 460 cm−1 and widened to HWHM ∼ 50 cm−1, which agreed with the UV–vis spectroscopy data. Along with this, in this case, the intensity of the F2g band was much lower than one might expect. This may have been due to a change in the morphology of the particles for Ni15Ce5 with respect to other samples of this series accompanied, for example, by the decoration of CeO2 particles with NixMg1−xO particles. Another possible reason may have been a relatively low concentration of CeO2. However, the characteristic value of the shift along with the widening of the F2g band in comparison with the known experimental Raman data for Ce1−xNixO2 [76,77] made it possible to estimate the concentration of Ni in CeO2 for Ni15Ce5 as x ∼ 1–2%.
Thus, the characterization of the prepared composites via optical methods well confirmed the partial substitution of Ce4+ ions by Ni2+, although their concentration was about 2–3% according to various estimates. With the growth in the NiO/CeO2 ratio, the concentration of Ni2+ ions that substituted cerium ions grew as well. At the same time, the entry of Mg2+ ions into the CeO2 lattice was not found. Unlike the XRD analysis, both the UV–vis and Raman spectroscopy methods confirmed the formation of NixMg1−xO solid solutions. The data presented suggest a similar interaction between NiO and MgO in all samples under study. To conclude this section, the advantages of using the detailed fitting analysis of the UV–vis and Raman spectra for studying the properties of multicomponent systems have been shown. The described approaches can be used in the future for in-depth analysis of the complex interactions in various nanocrystalline oxides.

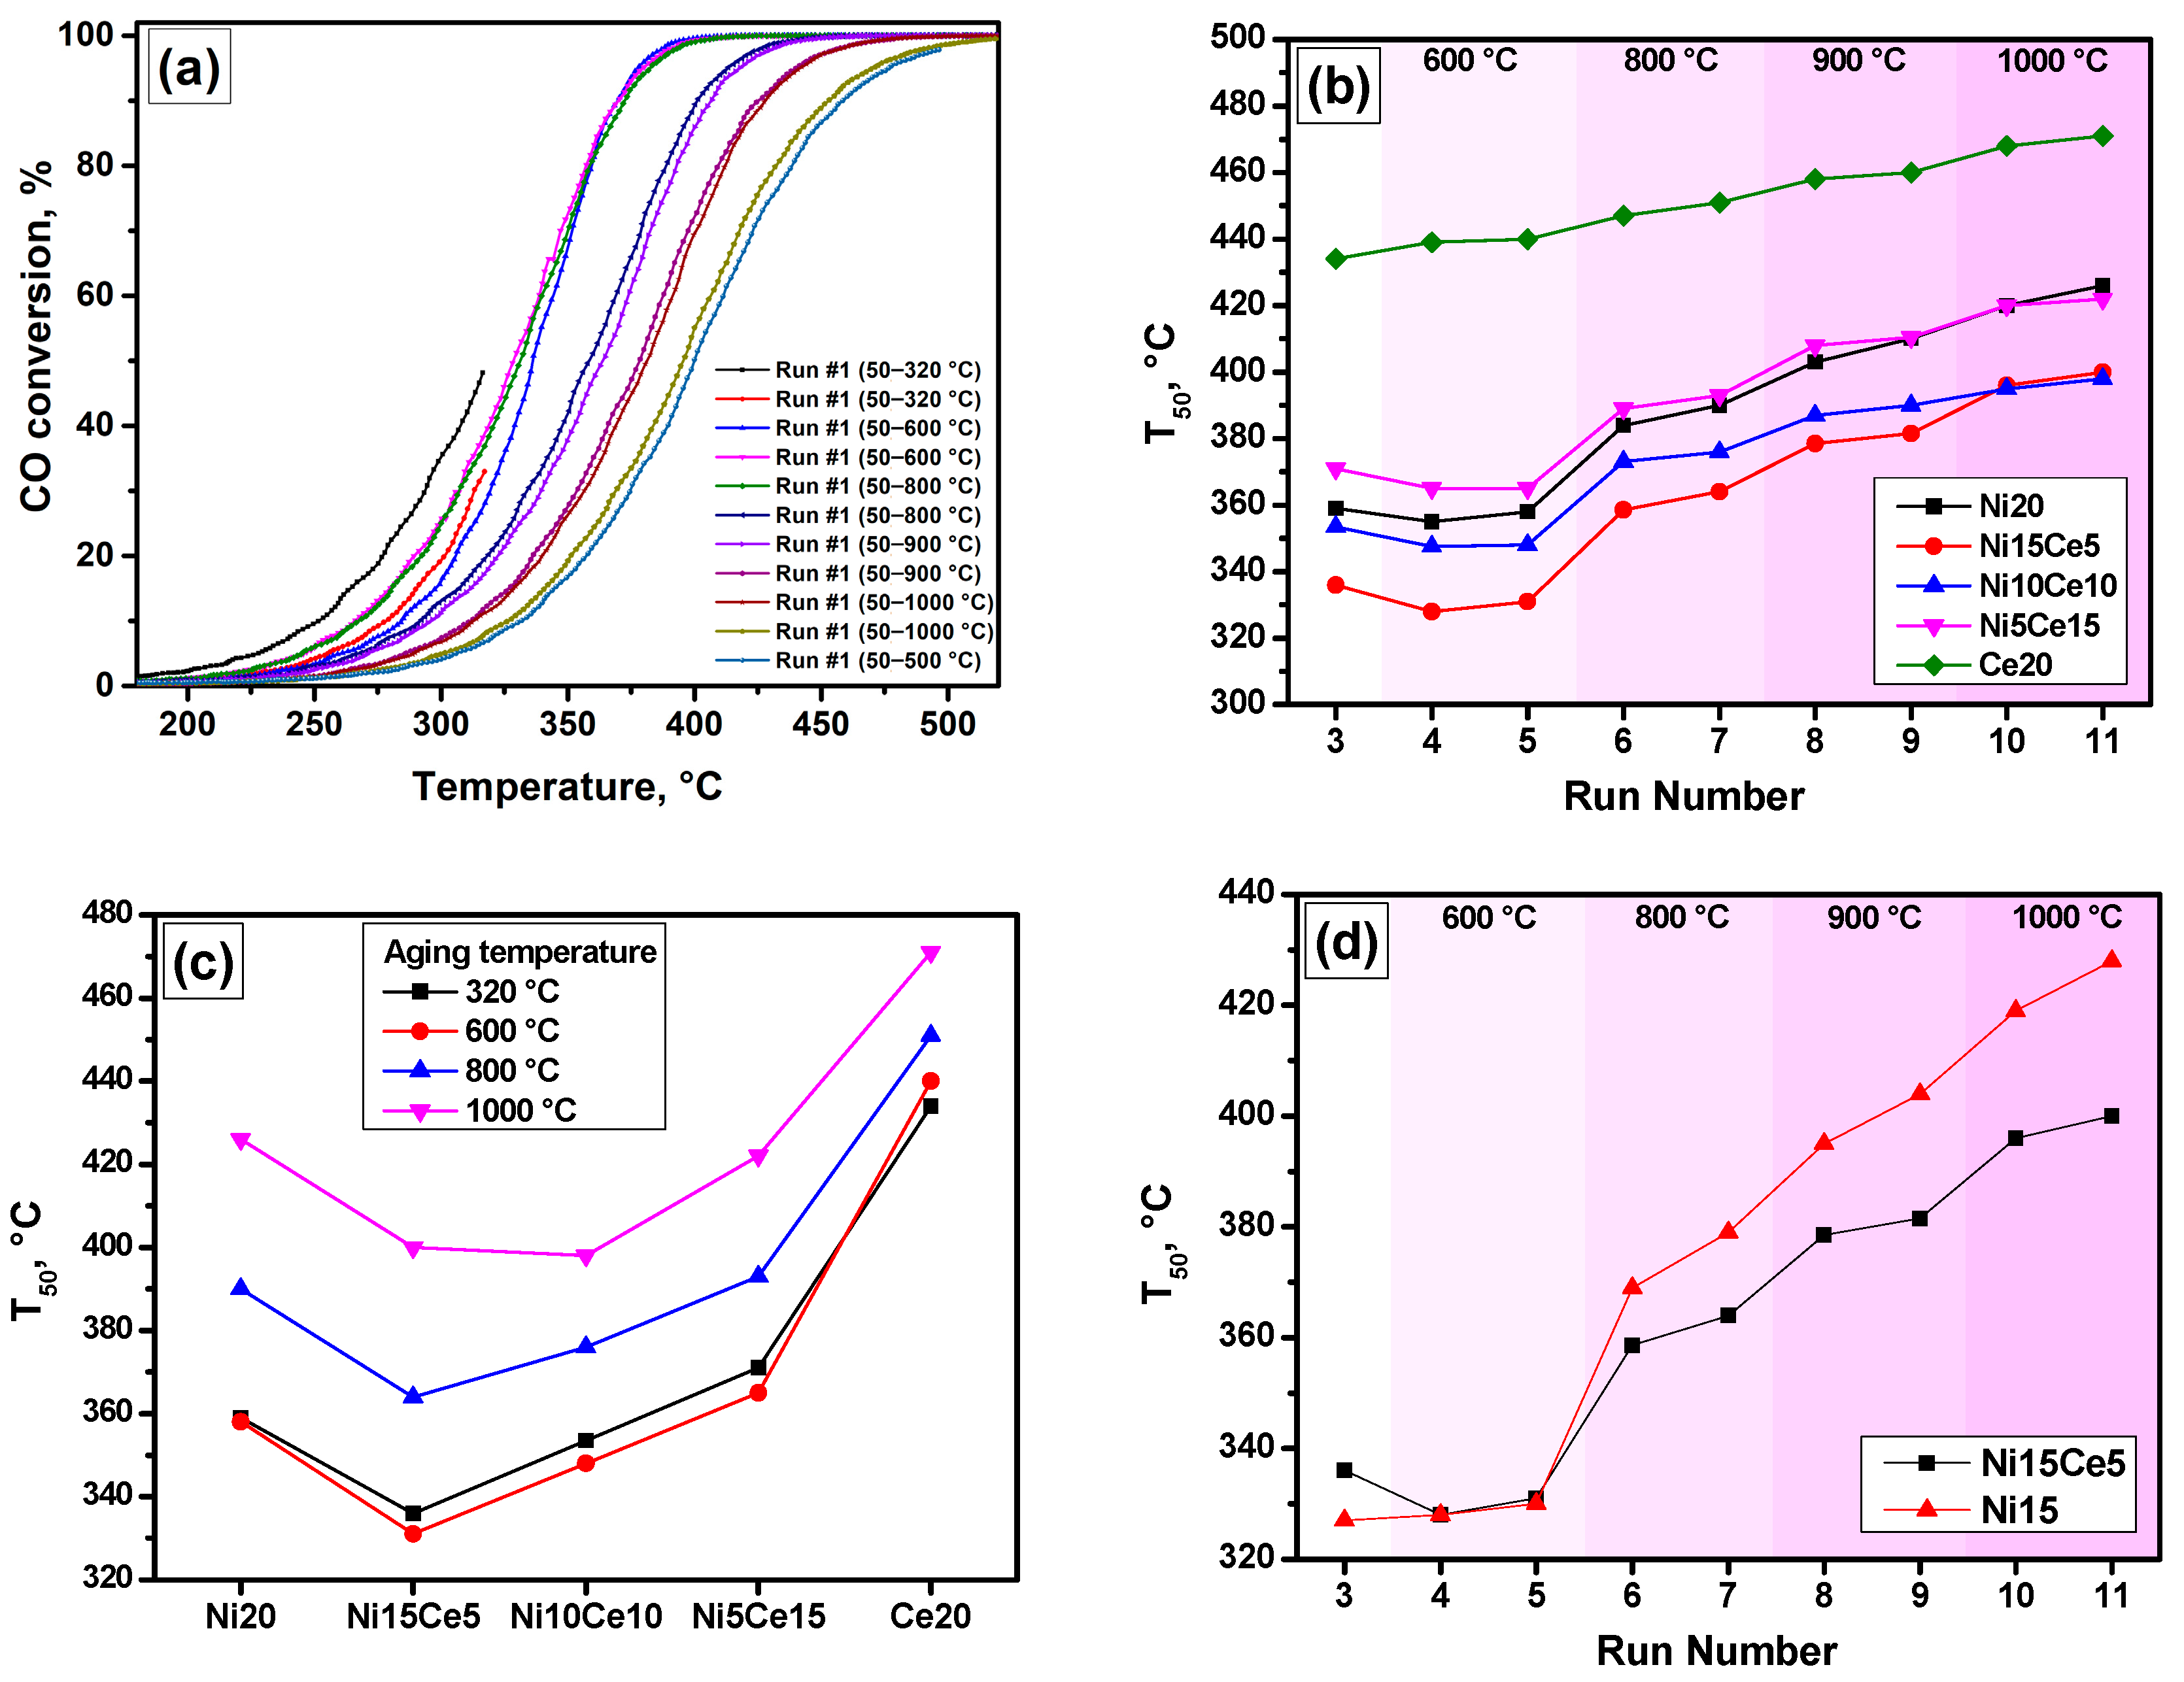
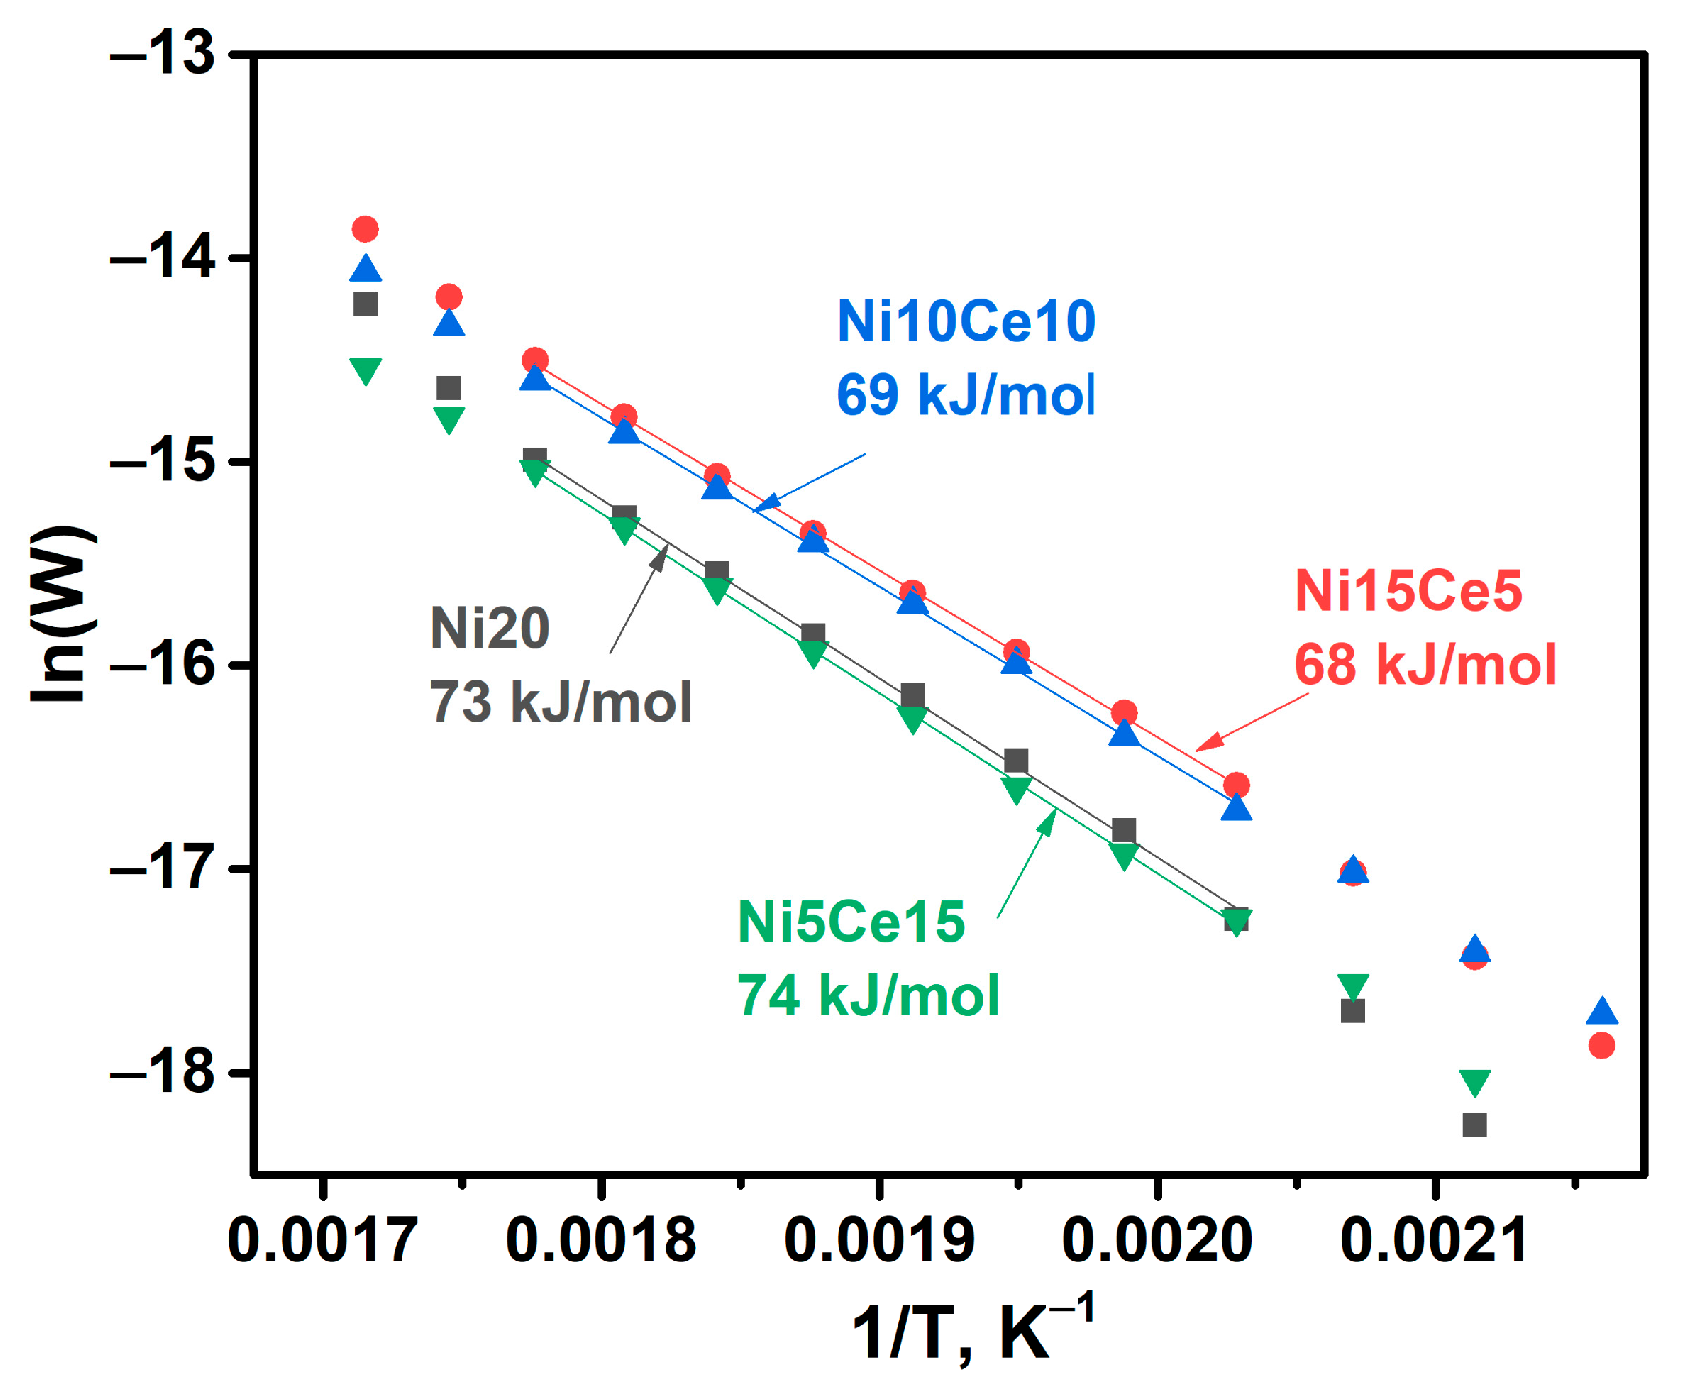
3.2. Catalytic Performance of the Composites in the Oxidation of CO

The catalytic performance of the prepared MgO-based composites was tested in the model reaction of CO oxidation. Each sample was tested in 11 heating/cooling runs in a prompt thermal aging (PTA) regime. Such a regime considered an increase in the final temperature of each second run (as described in Section 2.3). As an example, Figure 10a shows the light-off curves of CO conversion recorded in the PTA regime for the Ni10Ce10 sample. The first curve corresponds to the initial contact of the sample with the reaction mixture. Positions of the second and third curves reflect the initial steady-state catalytic performance. Then, after aging at 600 °C, a slight reactivation effect can be observed when the curves are shifted toward lower temperatures. Further runs correspond to the aging at 800, 900, and 1000 °C. As can be seen, in these cases, the curves are shifted toward higher temperatures, thus indicating a gradual decrease in the activity of the sample.
The comparison of the T50 values in 11 consecutive runs for all the samples is shown in Figure 10b. It can be clearly seen that the Ce20 sample exhibited the worst catalytic performance due to the absence of nickel species, which are responsible for catalytic activity. Oppositely, the Ni15Ce5 sample demonstrated the best performance. In general, the samples can be ranked by the T50 criterion as follows: Ni15Ce5 > Ni10Ce10 > Ni20 > Ni5Ce15 >> Ce20. A markedly higher specific surface area of the Ni15Ce5 sample (Table 2) may have contributed to a higher available surface area of the active component and, as a consequence, to better catalytic behavior. After aging at 600 °C, the reactivation effect mentioned above was observed for all nickel-containing samples (Figure 10b,c). Despite the noticeable deactivation of all the composite samples during the further increase in the aging temperature to 800, 900, and 1000 °C, their thermal stabilities were different. Thus, the Ni10Ce10 and Ni5Ce15 samples seemed to be more stable if compared with the Ni20 and Ni15Ce5 composites. After aging at 1000 °C, the activity row of the samples can be written as follows: Ni10Ce10 ≈ Ni15Ce5 > Ni5Ce15 ≈ Ni20 >> Ce20.
Figure 10d compares the activity of the Ni15Ce5 sample with a sample containing 15 wt% NiO and 85 wt% MgO (labeled as Ni15), which was studied previously [40,90]. At the initial stages of the catalytic test, both samples behaved similarly. It is important to note that the Ni15 sample possessed a comparable value of specific surface area (154 m2/g). However, the ternary Ni15Ce5 composite sample exhibited substantially greater thermal stability after aging in the reaction mixture at temperatures of 800 °C and above. This indicated the important role of the presence of ceria within the composition of the composite material and its interaction with active species of nickel.
Table 3 summarizes the catalytic data for the Ni-containing samples under study. Despite the fact that the Ni15Ce5 sample showed the highest values of CO conversion, the specific activity decreased with an increase in the nickel content. However, the apparent activation energy values for all samples were close to each other and lay within the experimental error (Table 3, Figure 11). This may indicate a similar mechanism of the reaction. It should be emphasized, however, that the observed values of 68–73 kJ/mol were somewhat higher than the values of 50 ± 5 kJ/mol known for supported NiO-containing catalysts and catalysts based on bulk NiO [36,38,91,92]. These values refer mainly to the temperature range below 200 °C. It is likely that this was a consequence of the formation of NixMg1−xO solid solutions.
The observed effects can be explained as follows. It is natural to assume that the properties of Ni-Ce-Mg-O are defined by the complex interactions between all components of the composite system. As shown by optical spectroscopy techniques, in the studied samples, partial substitution of Ce4+ ions with Ni2+ ions accompanied by the formation of vacancies occurred. However, most of the nickel ions were still included in NixMg1−xO solid solutions of various compositions. Therefore, part of the Ni2+ ions appeared in the volume of the support, which negatively affected the catalytic performance. On the other hand, this made it possible to maintain a high dispersion of nickel species.
Recent studies of CO oxidation on NiO/CeO2 catalysts showed the decisive role of the interactions near the NiO-CeO2 interface in this reaction [36,38]. Thus, oxygen activated on the CeO2 surface reacted with CO adsorbed on NiO, resulting in an intensification of the process. In the ternary Ni-Ce-Mg-O composites, CeO2 was present in the form of nanosized crystallites. Such a small size of CeO2 crystallites provided enhanced contact between them and individual surface Ni2+ ions and small NiO particles, which increased their activity in CO oxidation. Another factor that could influence the catalytic performance is dispersion of NiO species. Thus, an increase in Ni dispersion was observed in the systems of similar compositions upon addition of CeO2 [21,22,23].

4. Conclusions

In this work, three-component Ni-Ce-Mg-O composites were synthesized via the sol-gel method using nitrates as precursors. The textural characteristics of the samples were found to depend strongly on their composition. The highest surface area was observed in the case of the Ni15Ce5 sample, which contained 15 wt% NiO and 5 wt% CeO2. An increase in the concentration of CeO2 was accompanied by the enlargement of the CeO2 and MgO crystallites. Detailed investigation of the samples by means of diffuse reflectance UV–vis and Raman spectroscopies demonstrated that Mg2+ ions did not substitute Ce ions in the CeO2 lattice. However, in the Ni-containing samples, approximately 2–3% of the Ce4+ ions were substituted by Ni2+, thus resulting in the formation of vacancies. The interaction of NiO with MgO seemed to be much stronger in relation to its interaction with CeO2. The formation of NixMg1−xO solid solutions was confirmed using UV–vis spectroscopy, and the average composition was estimated as Ni0.60Mg0.40O. The catalytic performance of the prepared composites was examined in CO oxidation. At temperatures of 320 °C and below, the Ni20 and Ni5Ce15 samples demonstrated the worst activity among all nickel-containing samples. In terms of the T50 values, the initial activity row of the samples was as follows: Ni15Ce5 > Ni10Ce10 > Ni20 > Ni5Ce15 >> Ce20. Thermal aging of the samples at 1000 °C revealed the thermal stability of the samples, and the activity row was changed as follows: Ni10Ce10 ≈ Ni15Ce5 > Ni5Ce15 ≈ Ni20 >> Ce20. At the same time, very close values of the apparent activation energy were determined for all nickel-containing samples, which indicated a similar mechanism of CO oxidation over the composites under study. Thereby, the observed differences in the CO oxidation performance of the Ni-containing composites can be attributed to the partial substitution of Ce3+ ions by Ni2+ ions, the formation of NixMg1−xO solid solutions, and the interactions on the NixMg1−xO–CeO2 interface.
To sum up, this work expanded the available toolkit of synthetic methods by applying the simplified sol-gel approach to the preparation of Ni-Ce-Mg-O oxide systems. In addition, the effectiveness of comparatively simple optical spectroscopy techniques such as UV–vis and Raman spectroscopy for studying complex interactions in the NiO-CeO2-MgO system was also highlighted. As for the further development of this work, Ni/CeO2-MgO systems are known to be effective catalysts for many industrially important processes. The performance of the Ni-Ce-Mg-O systems described here will be evaluated in the dry reforming of methane, and the effect of CeO2 addition on the resistance of the catalysts toward carbon formation will be studied.

Author Contributions

Conceptualization, A.A.V.; methodology, G.B.V. and V.O.S.; investigation, G.B.V. and V.O.S.; writing—original draft preparation, G.B.V. and V.O.S.; writing—review and editing, A.A.V.; visualization, A.A.V.; supervision, A.A.V. All authors have read and agreed to the published version of the manuscript.

Funding

This work was supported by the Ministry of Science and Higher Education of the Russian Federation (project No. AAAA-A21-121011390054-1).

Institutional Review Board Statement

Not applicable.

Informed Consent Statement

Not applicable.

Data Availability Statement

The data are contained within the article.

Acknowledgments

Characterization of the samples was performed using the equipment of the Center of Collective Use’s “National Center of Catalysts Research”.

Conflicts of Interest

The authors declare no conflict of interest. The funders had no role in the design of the study; in the collection, analyses, or interpretation of data; in the writing of the manuscript; or in the decision to publish the results.

References

  1. Kaskow, I.; Sobczak, I.; Ziolek, M.; Corberán, V.C. The effect of support properties on n-octanol oxidation performed on gold-silver catalysts supported on MgO, ZnO and Nb2O5. Mol. Catal. 2020, 482, 110674. [Google Scholar] [CrossRef]
  2. Ju, X.; Liu, L.; Zhang, X.; Feng, J.; He, T.; Chen, P. Highly Efficient Ru/MgO Catalyst with Surface-Enriched Basic Sites for Production of Hydrogen from Ammonia Decomposition. ChemCatChem 2019, 11, 4161–4170. [Google Scholar] [CrossRef] [Green Version]
  3. Moogi, S.; Nakka, L.; Potharaju, S.S.P.; Ahmed, A.; Farooq, A.; Jung, S.-C.; Rhee, G.H.; Park, Y.-K. Copper promoted Co/MgO: A stable and efficient catalyst for glycerol steam reforming. Int. J. Hydrogen Energy 2021, 46, 18073–18084. [Google Scholar] [CrossRef]
  4. Jing, Y.; Wang, G.; Ting, K.W.; Maeno, Z.; Oshima, K.; Satokawa, S.; Nagaoka, S.; Shimizu, K.-I.; Toyao, T. Roles of the basic metals La, Ba, and Sr as additives in Al2O3-supported Pd-based three-way catalysts. J. Catal. 2021, 400, 387–396. [Google Scholar] [CrossRef]
  5. Peng, S.-Y.; Xu, Z.-N.; Chen, Q.-S.; Wang, Z.-Q.; Chen, Y.; Lv, D.-M.; Lu, G.; Guo, G.-C. MgO: An excellent catalyst support for CO oxidative coupling to dimethyl oxalate. Catal. Sci. Technol. 2014, 4, 1925–1930. [Google Scholar] [CrossRef]
  6. Vedyagin, A.A.; Mishakov, I.V.; Ilyina, E.V. A step forward in the preparation of V–Mg–O catalysts for oxidative dehydrogenation of propane. J. Sol-Gel Sci. Technol. 2021, 97, 117–125. [Google Scholar] [CrossRef]
  7. Loder, A.; Siebenhofer, M.; Lux, S. The reaction kinetics of CO2 methanation on a bifunctional Ni/MgO catalyst. J. Ind. Eng. Chem. 2020, 85, 196–207. [Google Scholar] [CrossRef]
  8. Huang, J.; Li, X.; Wang, X.; Fang, X.; Wang, H.; Xu, X. New insights into CO2 methanation mechanisms on Ni/MgO catalysts by DFT calculations: Elucidating Ni and MgO roles and support effects. J. CO2 Util. 2019, 33, 55–63. [Google Scholar] [CrossRef]
  9. Li, P.; Chen, R.; Lin, Y.; Li, W. General approach to facile synthesis of MgO-based porous ultrathin nanosheets enabling high-efficiency CO2 capture. Chem. Eng. J. 2021, 404, 126459. [Google Scholar] [CrossRef]
  10. Guo, Y.; Tan, C.; Sun, J.; Li, W.; Zhang, J.; Zhao, C. Biomass ash stabilized MgO adsorbents for CO2 capture application. Fuel 2020, 259, 116298. [Google Scholar] [CrossRef]
  11. Hu, Y.; Guo, Y.; Sun, J.; Li, H.; Liu, W. Progress in MgO sorbents for cyclic CO2 capture: A comprehensive review. J. Mater. Chem. A 2019, 7, 20103–20120. [Google Scholar] [CrossRef]
  12. Song, D.H.; Jung, U.H.; Kim, Y.E.; Im, H.B.; Lee, T.H.; Lee, K.B.; Koo, K.Y. Influence of Supports on the Catalytic Activity and Coke Resistance of Ni Catalyst in Dry Reforming of Methane. Catalysts 2022, 12, 216. [Google Scholar] [CrossRef]
  13. Gendy, T.S.; El-Salamony, R.A.; El-Temtamy, S.A.; Ghoneim, S.A.; El-Hafiz, D.R.A.; Ebiad, M.A.; Naggar, A.M.E. Optimization of Dry Reforming of Methane over a Ni/MgO Catalyst Using Response Surface Methodology. Chem. Eng. Technol. 2022, 45, 1087–1099. [Google Scholar] [CrossRef]
  14. Zanganeh, R.; Rezaei, M.; Zamaniyan, A. Preparation of nanocrystalline NiO–MgO solid solution powders as catalyst for methane reforming with carbon dioxide: Effect of preparation conditions. Adv. Powder Technol. 2014, 25, 1111–1117. [Google Scholar] [CrossRef]
  15. Zuo, Z.; Liu, S.; Wang, Z.; Liu, C.; Huang, W.; Huang, J.; Liu, P. Dry Reforming of Methane on Single-Site Ni/MgO Catalysts: Importance of Site Confinement. ACS Catal. 2018, 8, 9821–9835. [Google Scholar] [CrossRef]
  16. Wang, Y.-H.; Liu, H.-M.; Xu, B.-Q. Durable Ni/MgO catalysts for CO2 reforming of methane: Activity and metal–support interaction. J. Mol. Catal. A Chem. 2009, 299, 44–52. [Google Scholar] [CrossRef]
  17. Ruckenstein, E.; Hu, Y.H. Carbon dioxide reforming of methane over nickel/alkaline earth metal oxide catalysts. Appl. Catal. A Gen. 1995, 133, 149–161. [Google Scholar] [CrossRef]
  18. Zhou, H.; Zhang, T.; Sui, Z.; Zhu, Y.-A.; Han, C.; Zhu, K.; Zhou, X. A single source method to generate Ru-Ni-MgO catalysts for methane dry reforming and the kinetic effect of Ru on carbon deposition and gasification. Appl. Catal. B Environ. 2018, 233, 143–159. [Google Scholar] [CrossRef]
  19. Song, Y.; Ozdemir, E.; Ramesh, S.; Adishev, A.; Subramanian, S.; Harale, A.; Albuali, M.; Fadhel, B.A.; Jamal, A.; Moon, D. Dry reforming of methane by stable Ni–Mo nanocatalysts on single-crystalline MgO. Science 2020, 367, 777–781. [Google Scholar] [CrossRef]
  20. Singha, R.; Shukla, A.; Sandupatla, A.; Deo, G.; Bal, R. Synthesis and catalytic activity of a Pd doped Ni–MgO catalyst for dry reforming of methane. J. Mater. Chem. A 2017, 5, 15688–15699. [Google Scholar] [CrossRef]
  21. Kim, B.-J.; Jeon, K.-W.; Na, H.-S.; Lee, Y.-L.; Ahn, S.-Y.; Kim, K.-J.; Jang, W.-J.; Shim, J.-O.; Roh, H.-S. Reducible oxide (CeO2, ZrO2, and CeO2-ZrO2) promoted Ni-MgO catalysts for carbon dioxide reforming of methane reaction. Korean J. Chem. Eng. 2020, 37, 1130–1136. [Google Scholar] [CrossRef]
  22. Khajenoori, M.; Rezaei, M.; Meshkani, F. Characterization of CeO2 promoter of a nanocrystalline Ni/MgO catalyst in dry reforming of methane. Chem. Eng. Technol. 2014, 37, 957–963. [Google Scholar] [CrossRef]
  23. Khajenoori, M.; Rezaei, M.; Meshkani, F. Dry reforming over CeO2-promoted Ni/MgO nano-catalyst: Effect of Ni loading and CH4/CO2 molar ratio. J. Ind. Eng. Chem. 2015, 21, 717–722. [Google Scholar] [CrossRef]
  24. Qiujie, S.; Chengwei, L.; Weiqing, C. Hydrogen production from steam reforming of ethanol over Ni/MgO-CeO2 catalyst at low temperature. J. Rare Earths 2009, 27, 948–954. [Google Scholar]
  25. Cao, L.; Ni, C.; Yuan, Z.; Wang, S. Correlation between catalytic selectivity and oxygen storage capacity in autothermal reforming of methane over Rh/Ce0.45Zr0.45RE0.1 catalysts (RE = La, Pr, Nd, Sm, Eu, Gd, Tb). Catal. Commun. 2009, 10, 1192–1195. [Google Scholar] [CrossRef]
  26. Di Sarli, V.; Landi, G.; Di Benedetto, A.; Lisi, L. Synergy Between Ceria and Metals (Ag or Cu) in Catalytic Diesel Particulate Filters: Effect of the Metal Content and of the Preparation Method on the Regeneration Performance. Top. Catal. 2021, 64, 256–269. [Google Scholar] [CrossRef]
  27. Di Sarli, V.; Landi, G.; Lisi, L.; Di Benedetto, A. Ceria-coated diesel particulate filters for continuous regeneration. AIChE J. 2017, 63, 3442–3449. [Google Scholar] [CrossRef]
  28. Jiang, L.; Wei, M.; Xu, X.; Lin, Y.; Lü, Z.; Song, J.; Duan, X. SOx Oxidation and Adsorption by CeO2/MgO: Synergistic Effect between CeO2 and MgO in the Fluid Catalytic Cracking Process. Ind. Eng. Chem. Res. 2011, 50, 4398–4404. [Google Scholar] [CrossRef]
  29. Sun, S.; Sun, H.; Guan, S.; Xu, S.; Wu, C. Integrated CO2 capture and methanation on Ru/CeO2-MgO combined materials: Morphology effect from CeO2 support. Fuel 2022, 317, 123420. [Google Scholar] [CrossRef]
  30. Taira, K. Dry reforming reactions of CH4 over CeO2/MgO catalysts at high concentrations of H2S, and behavior of CO2 at the CeO2-MgO interface. J. Catal. 2022, 407, 29–43. [Google Scholar] [CrossRef]
  31. Ivanova, A.; Moroz, B.; Moroz, E.; Larichev, Y.V.; Paukshtis, E.; Bukhtiyarov, V. New binary systems Mg–M–O (M = Y, La, Ce): Synthesis and physico-chemical characterization. J. Solid State Chem. 2005, 178, 3265–3274. [Google Scholar] [CrossRef]
  32. Ruckenstein, E.; Hang Hu, Y. Methane partial oxidation over NiO/MgO solid solution catalysts. Appl. Catal. A Gen. 1999, 183, 85–92. [Google Scholar] [CrossRef]
  33. Ahadzadeh, M.; Alavi, S.M.; Rezaei, M.; Akbari, E. Propane dry reforming over highly active NiO-MgO solid solution catalyst for synthesis gas production. Mol. Catal. 2022, 524, 112325. [Google Scholar] [CrossRef]
  34. Wang, Y.; Li, B.; Xiao, Y.-S.; Liu, Z.-W. NiO-MgO Prepared by the Complex-Decomposition Method as a Catalyst for Carbon Dioxide Reforming of Methane. Processes 2023, 11, 596. [Google Scholar] [CrossRef]
  35. Barzegari, F.; Kazemeini, M.; Rezaei, M.; Farhadi, F.; Keshavarz, A. Propane steam reforming on mesoporous NiO–MgO–SiO2 catalysts for syngas production: Effect of the MgO/SiO2 molar ratio. Int. J. Hydrogen Energy 2020, 45, 24840–24858. [Google Scholar] [CrossRef]
  36. Tang, C.; Li, J.; Yao, X.; Sun, J.; Cao, Y.; Zhang, L.; Gao, F.; Deng, Y.; Dong, L. Mesoporous NiO–CeO2 catalysts for CO oxidation: Nickel content effect and mechanism aspect. Appl. Catal. A Gen. 2015, 494, 77–86. [Google Scholar] [CrossRef]
  37. Zhang, H.; Zhang, Z.; Liu, Y.; Fang, X.; Xu, J.; Wang, X.; Xu, X. Band-Gap Engineering: A New Tool for Tailoring the Activity of Semiconducting Oxide Catalysts for CO Oxidation. J. Phys. Chem. Lett. 2021, 12, 9188–9196. [Google Scholar] [CrossRef]
  38. Zou, W.; Ge, C.; Lu, M.; Wu, S.; Wang, Y.; Sun, J.; Pu, Y.; Tang, C.; Gao, F.; Dong, L. Engineering the NiO/CeO2 interface to enhance the catalytic performance for CO oxidation. RSC Adv. 2015, 5, 98335–98343. [Google Scholar] [CrossRef]
  39. Li, Z.; Feng, X.; Gu, Z.; Lu, C.; Li, D.; Zhu, X.; Jiang, L.; Deng, G.; Li, K. Enhanced performance of the CeO2-MgO oxygen carrier by NiO for chemical looping CO2 splitting. Fuel Proc. Technol. 2022, 225, 107045. [Google Scholar] [CrossRef]
  40. Veselov, G.B.; Karnaukhov, T.M.; Stoyanovskii, V.O.; Vedyagin, A.A. Preparation of the nanostructured Ni-Mg-O oxide system by a sol–gel technique at varied pH. Nanomaterials 2022, 12, 952. [Google Scholar] [CrossRef]
  41. Karnaukhov, T.M.; Veselov, G.B.; Cherepanova, S.V.; Vedyagin, A.A. Sol-Gel Synthesis and Characterization of the Cu-Mg-O System for Chemical Looping Application. Materials 2022, 15, 2021. [Google Scholar] [CrossRef] [PubMed]
  42. Vedyagin, A.A.; Mishakov, I.V.; Karnaukhov, T.M.; Krivoshapkina, E.F.; Ilyina, E.V.; Maksimova, T.A.; Cherepanova, S.V.; Krivoshapkin, P.V. Sol–gel synthesis and characterization of two-component systems based on MgO. J. Sol-Gel Sci. Technol. 2017, 82, 611–619. [Google Scholar] [CrossRef]
  43. Vedyagin, A.A. Nanostructured systems based on magnesium oxide: The synthesis and application in sorption and catalytic processes. Russ. Chem. Bull. 2023, 72, 335–344. [Google Scholar] [CrossRef]
  44. Veselov, G.B.; Karnaukhov, T.M.; Bauman, Y.I.; Mishakov, I.V.; Vedyagin, A.A. Sol-Gel-Prepared Ni-Mo-Mg-O System for Catalytic Transformation of Chlorinated Organic Wastes into Nanostructured Carbon. Materials 2020, 13, 4404. [Google Scholar] [CrossRef] [PubMed]
  45. Patterson, A.L. The Scherrer Formula for X-ray Particle Size Determination. Phys. Rev. 1939, 56, 978–982. [Google Scholar] [CrossRef]
  46. Boehm, H.-P.; Knözinger, H. Nature and Estimation of Functional Groups on Solid Surfaces. In Catalysis: Science and Technology; Anderson, J.R., Boudart, M., Eds.; Springer: Berlin/Heidelberg, Germany, 1983; pp. 39–207. [Google Scholar] [CrossRef]
  47. Tauc, J. Optical Properties of Amorphous Semiconductors. In Amorphous and Liquid Semiconductors; Springer: New York, NY, USA, 1974; pp. 159–220. [Google Scholar] [CrossRef]
  48. Vedyagin, A.A.; Stoyanovskii, V.O.; Plyusnin, P.E.; Shubin, Y.V.; Slavinskaya, E.M.; Mishakov, I.V. Effect of metal ratio in alumina-supported Pd-Rh nanoalloys on its performance in three way catalysis. J. Alloys Compnd. 2018, 749, 155–162. [Google Scholar] [CrossRef]
  49. Vedyagin, A.A.; Volodin, A.M.; Stoyanovskii, V.O.; Kenzhin, R.M.; Plyusnin, P.E.; Shubin, Y.V.; Mishakov, I.V. Effect of alumina phase transformation on stability of low-loaded Pd-Rh catalysts for CO oxidation. Top. Catal. 2017, 60, 152–161. [Google Scholar] [CrossRef]
  50. Kuzmin, A.; Mironova, N. Composition dependence of the lattice parameter in solid solutions. J. Phys. Condensed. Matter. 1998, 10, 7937. [Google Scholar] [CrossRef]
  51. Cimino, A.; Porta, P.; Valigi, M. Dependence of the Lattice Parameter of Magnesium Oxide on Crystallite Size. J. Am. Ceram. Soc. 1966, 49, 152–156. [Google Scholar] [CrossRef]
  52. Prieur, D.; Bonani, W.; Popa, K.; Walter, O.; Kriegsman, K.W.; Engelhard, M.H.; Guo, X.; Eloirdi, R.; Gouder, T.; Beck, A.; et al. Size Dependence of Lattice Parameter and Electronic Structure in CeO2 Nanoparticles. Inorg. Chem. 2020, 59, 5760–5767. [Google Scholar] [CrossRef]
  53. Deshpande, S.; Patil, S.; Kuchibhatla, S.V.; Seal, S. Size dependency variation in lattice parameter and valency states in nanocrystalline cerium oxide. Appl. Phys. Lett. 2005, 87, 133113. [Google Scholar] [CrossRef]
  54. Zhao, P.; Huang, Z.; Mao, Y.; Wang, Y.; Takashi, G. Preparation of (100)-oriented CeO2 film on (100) MgO single crystal substrate by laser chemical vapor deposition using solid precursor. Ceram. Int. 2014, 40, 15919–15923. [Google Scholar] [CrossRef] [Green Version]
  55. Stankic, S.; Müller, M.; Diwald, O.; Sterrer, M.; Knözinger, E.; Bernardi, J. Size-Dependent Optical Properties of MgO Nanocubes. Angew. Chem. Int. Ed. 2005, 44, 4917–4920. [Google Scholar] [CrossRef]
  56. Bensalem, A.; Muller, J.C.; Bozon-Verduraz, F. Faraday communications. From bulk CeO2 to supported cerium–oxygen clusters: A diffuse reflectance approach. J. Chem. Soc. Faraday Trans. 1992, 88, 153–154. [Google Scholar] [CrossRef]
  57. Laachir, A.; Perrichon, V.; Badri, A.; Lamotte, J.; Catherine, E.; Lavalley, J.C.; El Fallah, J.; Hilaire, L.; Le Normand, F.; Quéméré, E.; et al. Reduction of CeO2 by hydrogen. Magnetic susceptibility and Fourier-transform infrared, ultraviolet and X-ray photoelectron spectroscopy measurements. J. Chem. Soc. Faraday Trans. 1991, 87, 1601–1609. [Google Scholar] [CrossRef]
  58. Hüfner, S. Electronic structure of NiO and related 3d-transition-metal compounds. Adv. Phys. 1994, 43, 183–356. [Google Scholar] [CrossRef]
  59. Niedermeier, C.A.; Råsander, M.; Rhode, S.; Kachkanov, V.; Zou, B.; Alford, N.; Moram, M.A. Band gap bowing in NixMg1−xO. Sci. Rep. 2016, 6, 31230. [Google Scholar] [CrossRef] [Green Version]
  60. Thota, S.; Shim, J.H.; Seehra, M.S. Size-dependent shifts of the Néel temperature and optical band-gap in NiO nanoparticles. J. Appl. Phys. 2013, 114, 214307. [Google Scholar] [CrossRef]
  61. Hosny, N.M. Synthesis, characterization and optical band gap of NiO nanoparticles derived from anthranilic acid precursors via a thermal decomposition route. Polyhedron 2011, 30, 470–476. [Google Scholar] [CrossRef]
  62. Wuilloud, E.; Delley, B.; Schneider, W.D.; Baer, Y. Spectroscopic Evidence for Localized and Extended f-Symmetry States in CeO2. Phys. Rev. Lett. 1984, 53, 202–205. [Google Scholar] [CrossRef]
  63. Mullins, D.R.; Overbury, S.H.; Huntley, D.R. Electron spectroscopy of single crystal and polycrystalline cerium oxide surfaces. Surf. Sci. 1998, 409, 307–319. [Google Scholar] [CrossRef]
  64. Kullgren, J.; Castleton, C.W.M.; Müller, C.; Ramo, D.M.; Hermansson, K. B3LYP calculations of cerium oxides. J. Chem. Phys. 2010, 132, 054110. [Google Scholar] [CrossRef] [PubMed] [Green Version]
  65. Chai, C.; Yang, S.; Liu, Z.; Liao, M.; Chen, N. Violet/blue photoluminescence from CeO2 thin film. Chinese Sci. Bull. 2003, 48, 1198–1200. [Google Scholar] [CrossRef]
  66. Castleton, C.W.M.; Kullgren, J.; Hermansson, K. Tuning LDA + U for electron localization and structure at oxygen vacancies in ceria. J. Chem. Phys. 2007, 127, 244704. [Google Scholar] [CrossRef] [PubMed]
  67. Prokofiev, A.V.; Shelykh, A.I.; Melekh, B.T. Periodicity in the band gap variation of Ln2X3 (X = O, S, Se) in the lanthanide series. J. Alloys Compnd. 1996, 242, 41–44. [Google Scholar] [CrossRef]
  68. Masui, T.; Fujiwara, K.; Machida, K.-I.; Adachi, G.-Y.; Sakata, T.; Mori, H. Characterization of Cerium(IV) Oxide Ultrafine Particles Prepared Using Reversed Micelles. Chem. Mater. 1997, 9, 2197–2204. [Google Scholar] [CrossRef]
  69. Tsunekawa, S.; Fukuda, T.; Kasuya, A. Blue shift in ultraviolet absorption spectra of monodisperse CeO2−x nanoparticles. J. Appl. Phys. 2000, 87, 1318–1321. [Google Scholar] [CrossRef]
  70. Arul, N.S.; Mangalaraj, D.; Chen, P.C.; Ponpandian, N.; Viswanathan, C. Strong quantum confinement effect in nanocrystalline cerium oxide. Mater. Lett. 2011, 65, 2635–2638. [Google Scholar] [CrossRef]
  71. Alla, S.K.; Mandal, R.K.; Prasad, N.K. Optical and magnetic properties of Mg2+ doped CeO2 nanoparticles. RSC Adv. 2016, 6, 103491–103498. [Google Scholar] [CrossRef]
  72. Zimou, J.; Nouneh, K.; Talbi, A.; Gana, L.E.; El-Habib, A.; Hsissou, R.; Addou, M. Influence of manganese rate on structural, optical and electrochemical properties of CeO2 thin films deposited by spray pyrolysis: Supercapacitor applications. J. Rare Earths 2022, 40, 1611–1618. [Google Scholar] [CrossRef]
  73. Pfau, A.; Schierbaum, K.D. The electronic structure of stoichiometric and reduced CeO2 surfaces: An XPS, UPS and HREELS study. Surf. Sci. 1994, 321, 71–80. [Google Scholar] [CrossRef]
  74. Yao, H.; Yao, Y.Y. Ceria in automotive exhaust catalysts: I. Oxygen storage. J. Catal. 1984, 86, 254–265. [Google Scholar] [CrossRef]
  75. Capdevila-Cortada, M.; Vilé, G.; Teschner, D.; Pérez-Ramírez, J.; López, N. Reactivity descriptors for ceria in catalysis. Appl. Catal. B Environ. 2016, 197, 299–312. [Google Scholar] [CrossRef] [Green Version]
  76. Kumari, K.; Aljawfi, R.N.; Vij, A.; Chae, K.H.; Hashim, M.; Alvi, P.A.; Kumar, S. Band gap engineering, electronic state and local atomic structure of Ni doped CeO2 nanoparticles. J. Mater. Sci. Mater. Electron. 2019, 30, 4562–4571. [Google Scholar] [CrossRef]
  77. Barrio, L.; Kubacka, A.; Zhou, G.; Estrella, M.; Martínez-Arias, A.; Hanson, J.C.; Fernández-García, M.; Rodriguez, J.A. Unusual Physical and Chemical Properties of Ni in Ce1−xNixO2−y Oxides: Structural Characterization and Catalytic Activity for the Water Gas Shift Reaction. J. Phys. Chem. C 2010, 114, 12689–12697. [Google Scholar] [CrossRef]
  78. Miran, H.A.; Jaf, Z.N. Electronic and optical properties of nickel-doped ceria: A computational modelling study. Pap. Phys. 2022, 14, 140002. [Google Scholar] [CrossRef]
  79. Brik, M.G.; Srivastava, A.M.; Popov, A.I. A few common misconceptions in the interpretation of experimental spectroscopic data. Opt. Mater. 2022, 127, 112276. [Google Scholar] [CrossRef]
  80. Tiwari, S.; Rathore, G.; Patra, N.; Yadav, A.K.; Bhattacharya, D.; Jha, S.N.; Tseng, C.M.; Liu, S.W.; Biring, S.; Sen, S. Oxygen and cerium defects mediated changes in structural, optical and photoluminescence properties of Ni substituted CeO2. J. Alloys Compnd. 2019, 782, 689–698. [Google Scholar] [CrossRef]
  81. Ishikawa, K.; Fujima, N.; Komura, H. First-order Raman scattering in MgO microcrystals. J. Appl. Phys. 1985, 57, 973–975. [Google Scholar] [CrossRef]
  82. Manson, N.B.; Von der Ohe, W.; Chodos, S.L. Second-Order Raman Spectrum of MgO. Phys. Rev. B 1971, 3, 1968–1972. [Google Scholar] [CrossRef]
  83. Schilling, C.; Hofmann, A.; Hess, C.; Ganduglia-Pirovano, M.V. Raman Spectra of Polycrystalline CeO2: A Density Functional Theory Study. J. Phys. Chem. C 2017, 121, 20834–20849. [Google Scholar] [CrossRef]
  84. Filtschew, A.; Hofmann, K.; Hess, C. Ceria and Its Defect Structure: New Insights from a Combined Spectroscopic Approach. J. Phys. Chem. C 2016, 120, 6694–6703. [Google Scholar] [CrossRef]
  85. Weber, W.H.; Hass, K.C.; McBride, J.R. Raman study of CeO2: Second-order scattering, lattice dynamics, and particle-size effects. Phys. Rev. B 1993, 48, 178–185. [Google Scholar] [CrossRef]
  86. Cazzanelli, E.; Kuzmin, A.; Mariotto, G.; Mironova-Ulmane, N. Study of vibrational and magnetic excitations in NicMg1−cO solid solutions by Raman spectroscopy. J. Phys. Conden. Matter 2003, 15, 2045. [Google Scholar] [CrossRef] [Green Version]
  87. Mironova-Ulmane, N.; Kuzmin, A.; Steins, I.; Grabis, J.; Sildos, I.; Pärs, M. Raman scattering in nanosized nickel oxide NiO. Phys. Conf. Ser. 2007, 93, 012039. [Google Scholar] [CrossRef]
  88. Dietz, R.E.; Parisot, G.I.; Meixner, A.E. Infrared Absorption and Raman Scattering by Two-Magnon Processes in NiO. Phys. Rev. B 1971, 4, 2302–2310. [Google Scholar] [CrossRef]
  89. Dietz, R.E.; Brinkman, W.F.; Meixner, A.E.; Guggenheim, H.J. Raman Scattering by Four Magnons in NiO and KNiF3. Phys. Rev. Lett. 1971, 27, 814–817. [Google Scholar] [CrossRef]
  90. Karnaukhov, T.M.; Vedyagin, A.A.; Cherepanova, S.V.; Rogov, V.A.; Mishakov, I.V. Sol–gel synthesis and characterization of the binary Ni–Mg–O oxide system. J. Sol-Gel Sci. Technol. 2019, 92, 208–214. [Google Scholar] [CrossRef]
  91. Cimino, A.; Gazzoli, D.; Indovina, V.; Moretti, G.; Occhiuzzi, M.; Pepe, F. High and low surface area NiO–MgO and CoO–MgO solid solutions: A study of XPS surface composition and CO oxidation activity. Top. Catal. 1999, 8, 171–178. [Google Scholar] [CrossRef]
  92. Xu, X.; Li, L.; Huang, J.; Jin, H.; Fang, X.; Liu, W.; Zhang, N.; Wang, H.; Wang, X. Engineering Ni3+ Cations in NiO Lattice at the Atomic Level by Li+ Doping: The Roles of Ni3+ and Oxygen Species for CO Oxidation. ACS Catal. 2018, 8, 8033–8045. [Google Scholar] [CrossRef]
Figure 1. XRD patterns for the studied samples.
Jcs 07 00251 g001
Figure 2. (a) Diffuse reflectance UV–vis spectra of the samples under study: MgO (1); Ce20 (2); Ni15Ce5 (3); Ni10Ce10 (4); Ni15Ce5 (5); Ni20 (6). (b) Dependence of the absorption value () in the region of the 3A2g3T1g(F) Ni2+ transition at 740 nm on the nickel content in the samples. Dash lines show the linear approximation.
Jcs 07 00251 g002
Figure 3. (a) Diffuse reflectance UV–vis spectra of the samples: MgO (1); Ni20 (2). (b) Dependences of (F(R)·E)2 on the photon energy (E) characterizing the band-gap Eg values for direct allowed transitions for the Ni20 sample. Dash line shows how the Eg value was determined.
Jcs 07 00251 g003
Figure 4. (a) Diffuse reflectance UV–vis spectra of the Ce20 sample after subtraction of the spectrum of the MgO support. (b) Dependences of (F(R)·E)2 (red) and (F(R)·E)0.5 (blue) on the photon energy (E) characterizing the band-gap width (Eg) values for direct and indirect allowed transitions for the Ce20 sample. Dash lines show how the Eg values were determined.
Jcs 07 00251 g004
Figure 5. (a) Diffuse reflectance UV–vis spectra of the Ce20 sample reduced with CO at 500 °C after subtraction of the spectrum of the MgO support. (b) Dependences of (F(R)∙E)2 (red) and (F(R)∙E)0.5 (blue) on the photon energy E characterizing the band-gap (Eg) values for direct and indirect allowed transitions for the Ce20 sample reduced with CO. Dash lines show how the Eg values were determined.
Jcs 07 00251 g005
Figure 6. (a) Diffuse reflectance UV–vis spectra of the MgO support; the Ce20 sample; and the Ni5Ce15, Ni10Ce10, and Ni15Ce5 samples after subtraction of the spectrum of the Ni20 sample with corrected intensity. (b) Dependences of the absorption intensity of the d-d Ni2+ band at 400 nm (), the band-gap (Eg) values () for direct allowed transitions, and the Urbach energy (EU) () on the NiO content in the samples.
Jcs 07 00251 g006
Figure 7. Curve fitting of diffuse reflectance UV–vis spectra of the Ni5Ce15 (a) and Ni15Ce5 (c) samples after subtraction of the spectrum of the Ni20 sample with corrected intensity. Dependences of (F(R)·E)2 (red) and (F(R)·E)0.5 (blue) on the photon energy E characterizing the band-gap (Eg) values for direct and indirect allowed transitions for these samples are shown ((b) and (d), respectively). Dash lines show how the Eg values were determined.
Jcs 07 00251 g007
Figure 8. Experimental Raman spectra of the three-component Ni-Ce-Mg-O composites and the reference two-component Ce20 and Ni20 samples.
Jcs 07 00251 g008
Figure 9. Experimental Raman spectra of the powder samples of MgO-based composites: (a) Ce20; (b) Ni20; (c) Ni5Ce15; (d) Ni10Ce10; (e) Ni15Ce5. Dependence of relative intensities of lines I555/F2g and I615/F2g on the content of NiO in the samples is shown in (f).
Jcs 07 00251 g009
Figure 10. Light-off curves of CO oxidation recorded in the PTA regime for the Ni10Ce10 sample (a). Comparison of T50 values in 11 consecutive runs for the samples under study (b). Comparison of T50 values at various aging temperatures for the samples under study (c). Comparison of thermal stability of the Ni15Ce5 sample with the Ni15 sample reported previously [40] (d).
Jcs 07 00251 g010
Figure 11. Arrhenius plots for the Ni-containing composites obtained in the temperature range of 190–310 °C. The experimental points of CO conversion above 1% and below 15% only were selected for the linear fitting.
Jcs 07 00251 g011
Table 1. The composition of the samples studied in the present work.
SampleNiO Loading, wt%CeO2 Loading, wt%
Ni20200
Ni15Ce5155
Ni10Ce101010
Ni5Ce15515
Ce20020
Table 2. Textural characteristics and quantitative XRD data for the studied samples.
SampleABET, m2/gVpore, cm3/gMgOCeO2
a, ÅD, nma, ÅD, nm
Ni201180.524.2127.9--
Ni15Ce51660.624.2159.45.4113.2
Ni10Ce101240.714.21610.95.4053.2
Ni5Ce151141.134.21510.65.3984.3
Ce20790.574.21416.85.3945.3
Table 3. Data on CO oxidation over Ni-containing composites in the catalytic experiments performed under stationary isothermal conditions (mcat = 100 mg).
SampleConversion, %Specific Reaction Rate, μmol/(s∙gNi)Activation Energy, kJ/mol
250 °C270 °C250 °C270 °C
Ni202.85.20.621.1273 ± 2
Ni15Ce54.78.31.362.4168 ± 3
Ni10Ce104.57.81.943.4069 ± 3
Ni5Ce152.64.82.224.1974 ± 3
Disclaimer/Publisher’s Note: The statements, opinions and data contained in all publications are solely those of the individual author(s) and contributor(s) and not of MDPI and/or the editor(s). MDPI and/or the editor(s) disclaim responsibility for any injury to people or property resulting from any ideas, methods, instructions or products referred to in the content.

