Article

Statistical Analysis of the Ultimate Strength of Filaments, Tows and Minicomposites

1
LMPS-ENS, Université Paris-Saclay, 4, Avenue des Sciences, CS 30008, 91192 Gif-sur-Yvette, France
2
MATEIS, INSA-Lyon, 7 Avenue Jean Capelle, 69621 Villeurbanne, France
*
Author to whom correspondence should be addressed.
J. Compos. Sci. 2023, 7(6), 239; https://doi.org/10.3390/jcs7060239
Submission received: 18 April 2023 / Revised: 26 May 2023 / Accepted: 2 June 2023 / Published: 8 June 2023
(This article belongs to the Special Issue Feature Papers in Journal of Composites Science in 2023)

Abstract

:
The present paper investigates the failure of SiC and alumina-fiber-reinforced minicomposites in relation to the strength distributions of filaments, and the failure behavior of the reinforcing dry tows. The strength data are measured on single-filament, dry-tow and minicomposite specimens using tensile tests under commonly used test condition of strain-controlled loading. Pertinence of the normal distribution of strengths at different length scales is assessed using the construction of p-quantile diagrams, and the pertinence of the Weibull distribution was assessed by comparing to the normal distribution function. SiC and alumina minicomposites exhibited significantly different failure behaviors. Comparison with filament strength distributions and the behavior of the underlying tow in relation to the loading condition (stress- or strain-controlled conditions) allows for the interpretation of the results. The sensitivity of the results to loading conditions is highlighted. Various scenarios of minicomposite failure are discussed as alternatives to the stress concentration induced by clusters of broken fibers. It appears that the failure of alumina-fiber-reinforced minicomposites is stable and dictated by the highest-strength filaments, whereas the SiC-fiber-reinforced minicomposites exhibited premature failure that is attributed to the microstructural imperfections that induced overstressing by the fiber or fiber/matrix interactions.

1. Introduction

The ultimate strength of composites is an important issue in many applications. Theories for treating the failure of composite materials did not succeed to the same extent as those developed for the monolithics materials. In fact, after numerous efforts extending over approximately five decades, many uncertainties and controversies still remain in predicting composite failure [1]. Several modelling approaches are available in the literature to predict the longitudinal tensile failure of fiber-reinforced polymers; however, a systematic, blind and unbiased comparison between the predictions from the different models and against experimental data has not been performed [2]. Significant discrepancies between the predictions of the different modeling approaches for fiber-break density evolution, cluster formation and ultimate strength have been reported in the literature [2]. The comparison of blind model predictions against detailed computed tomography experiments showed that the understanding of the micromechanics of longitudinal tensile failure of composites needs to be developed further [2]. In [3], it was found that the current definition for a cluster of broken fibers can lead to erroneous results, depending on the material system. Talreja [1] critically reviewed some of the main failure theories for composite materials in an effort to understand their deficiencies. He came to the conclusion that determining the criticality conditions associated with failure requires the analyses of the first events of failure at the micro-level and their subsequent development, leading to macro-level failure. Thus the failure prediction necessarily involves a multi-scale analysis [1].
The tensile failure of composites reinforced by brittle fibers is dictated by the failure of the fibers carrying the load. For the polymer matrix composites, the breaking strength of the fibers is much greater than the strength of the matrix, and for the ceramic matrix composites, it is greater than the strength of the damaged matrix. Therefore, the fibers determine the ultimate strength of the composites.
The filaments exhibit brittle linear elastic behavior. The fracture of brittle fibers is induced by inherent flaws that have a random location and severity. The tensile strength is a variate; it is characterized by the cumulative distribution function. The Weibull model is the most commonly considered for the simplicity of the power law [4]. Alternative distributions have been shown to be appropriate for brittle materials [5,6,7,8,9,10,11,12,13,14] and fibers [15,16,17,18,19,20,21].
However, assessment of the pertinence of the Weibull function for the description of statistical distribution is questioned in the literature [15,18,21,22,23,24,25,26,27,28]. Usually, authors fit the Weibull function to a so-called Weibull plot of strength data. However, this method has been shown to be biased due to the construction of the empirical Weibull plot that tends to exaggerate the extremes of the distribution, and by the size of the dataset considered [15,18,21]. Recently, an approach that tries to overcome these difficulties has been applied to various brittle ceramic and carbon fibers [15,
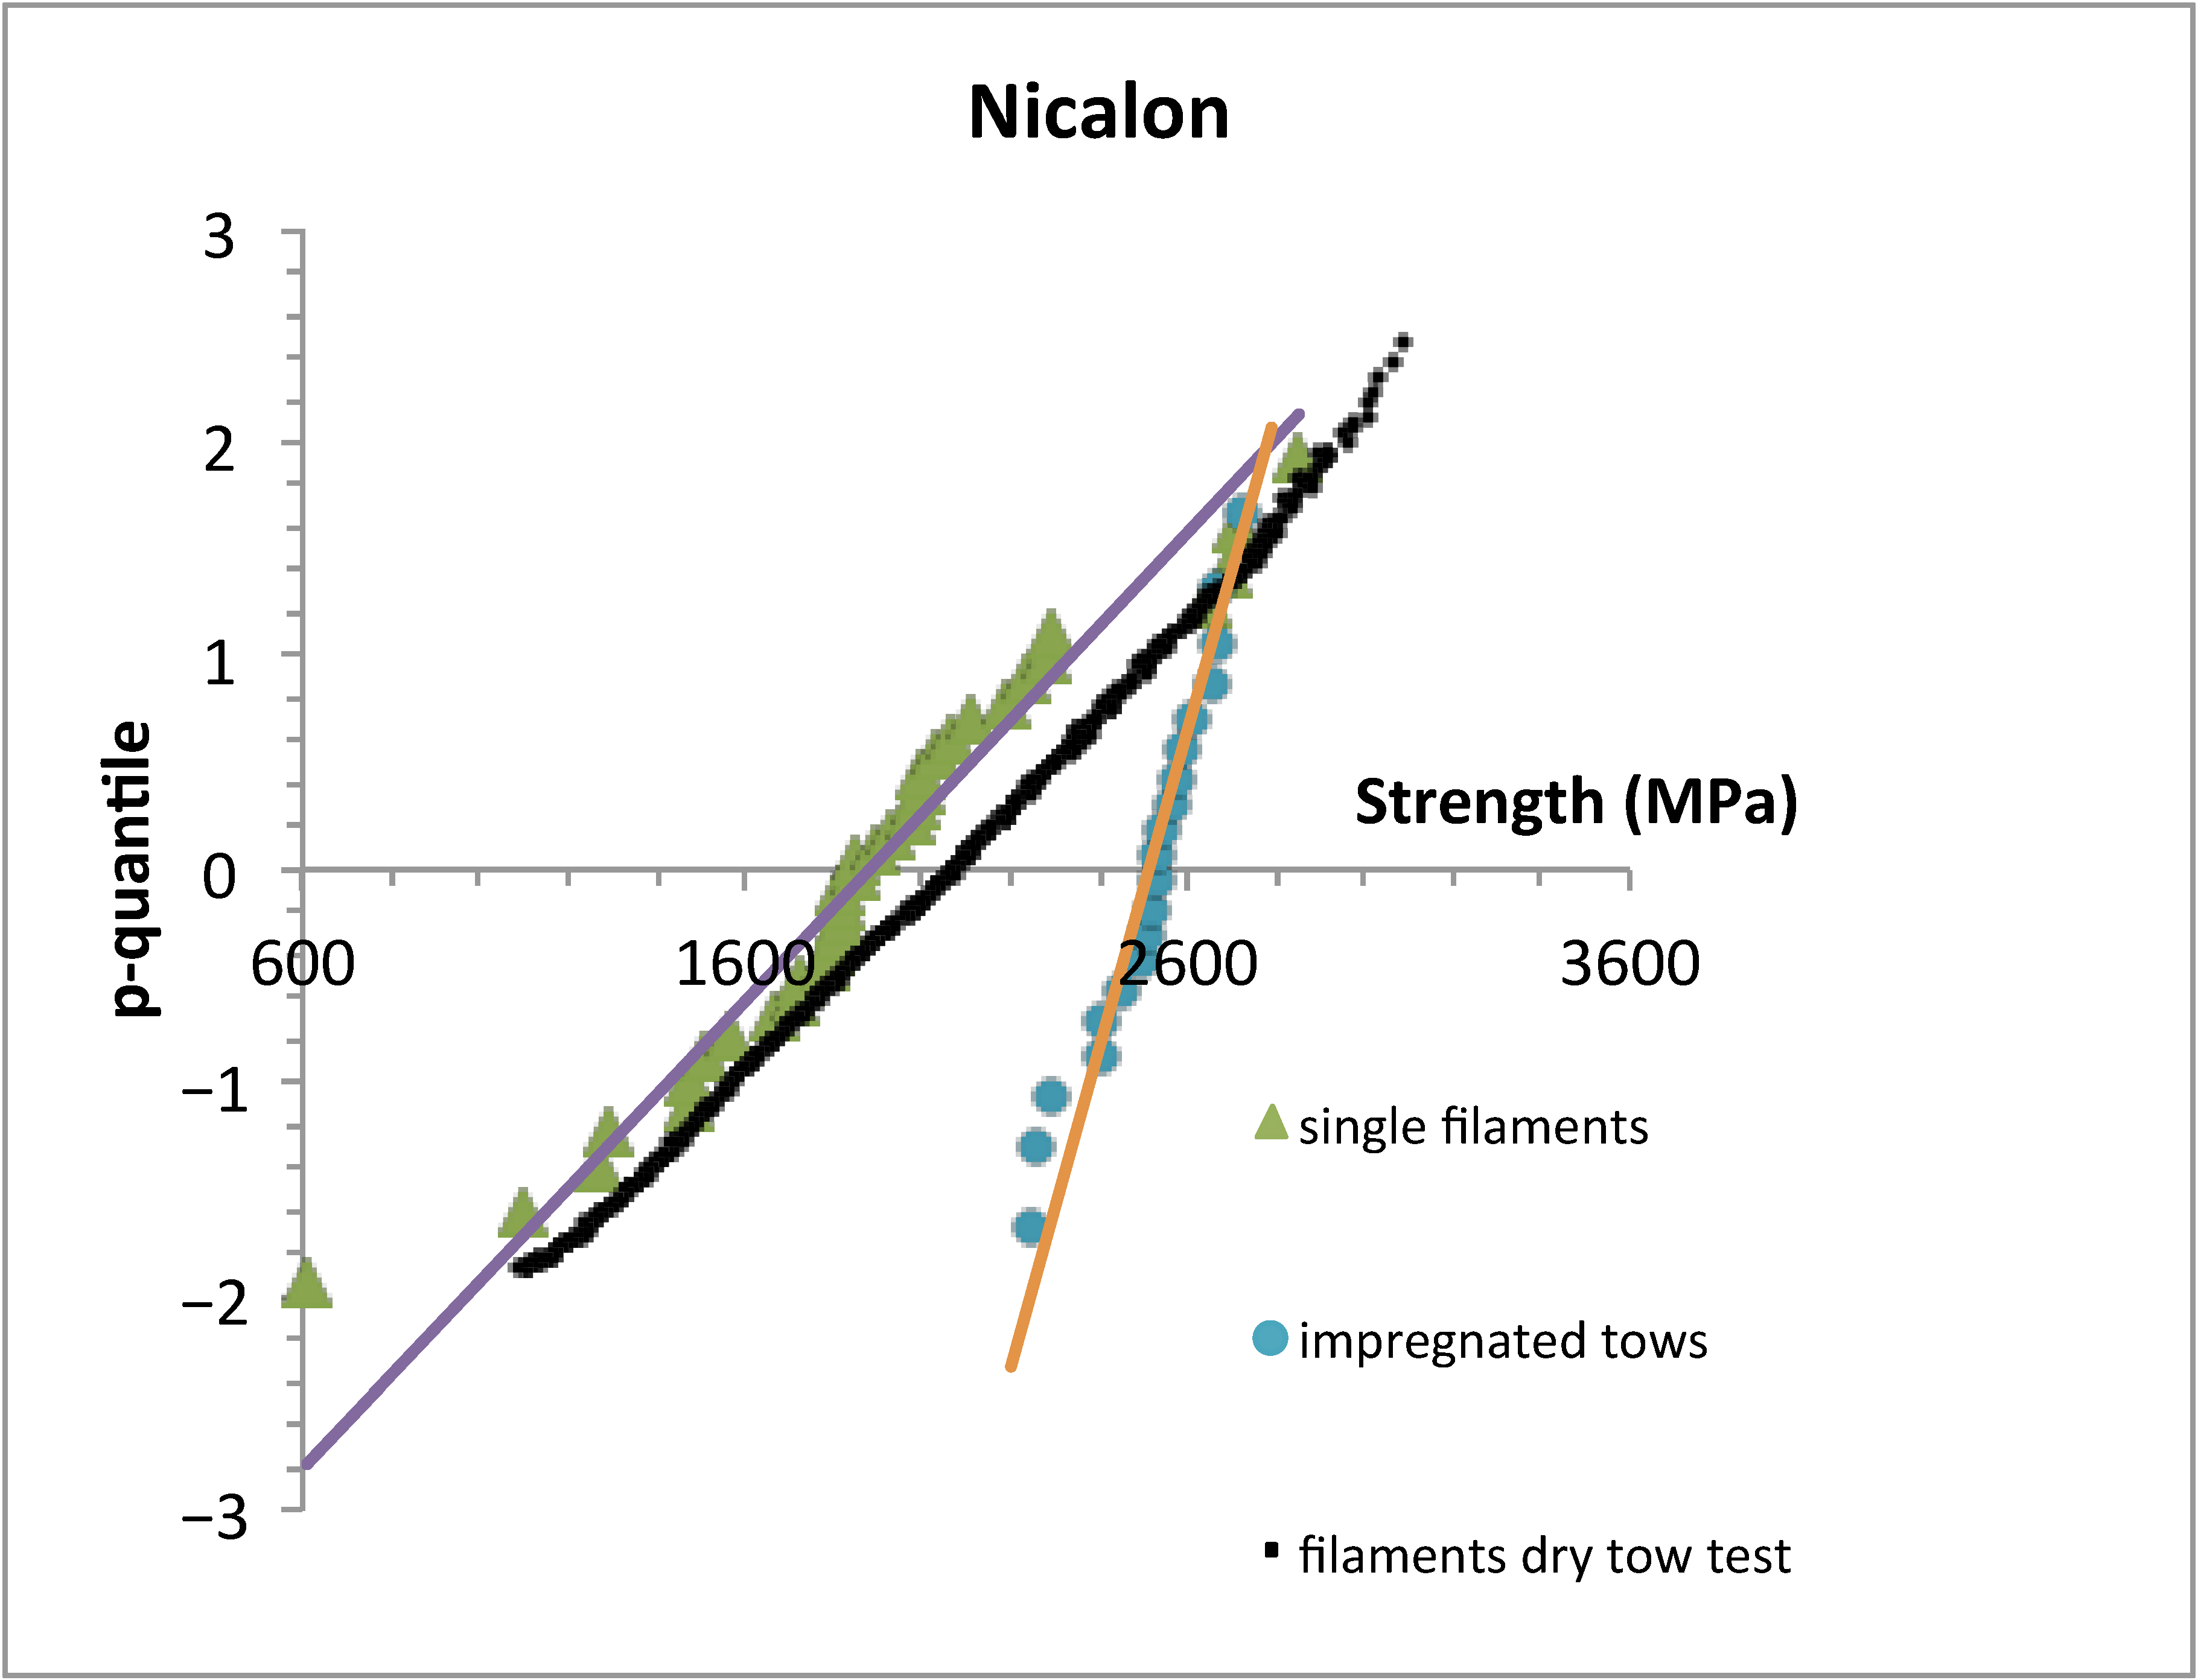
19]. The strength data are derived from a tensile test on a multifilament tow. Then, when the p-quantile diagram of the strength data is linear, it means that the data follow a normal distribution. The pertinence of the Weibull distribution function is assessed by comparison to the normal distribution of data. This approach was applied to establish the distribution functions of the filament and minicomposite strengths of the present paper.
Small-diameter reinforcing fibers, such as carbon and ceramic fibers, are produced as multifilament tows. A tensile test on a single multifilament tow has been proven to provide a large set of filament strength data [29,30,31,32,33,34].
Minicomposites consist of composite specimens reinforced by a single tow [35,36,37,38]. This specimen size is a convenient length scale to investigate the mechanical behavior in relation to the fiber properties. It has been widely applied to ceramic matrix composites to establish the microstructure–property relationships [37,38]. In the present paper, it is used to investigate the failure of the minicomposites with respect to the filament strength statistical distribution.
Weibull’s theory is not directly applicable to composite materials because the parallel fiber structure violates the weakest link principle [35]. The probabilistic theory for polymer matrix composites emerged from the successive works of several authors [39,40,41,42,43,44,45] based on the application of Weibull statistics. Considering the loading condition of monotonically increasing stress, the following failure mechanism was assumed [39]: when a fiber breaks, it is unloaded over a short distance only on either side of the break (ineffective length), and the load carried by this portion of the broken fiber must be redistributed into the matrix and/or the surrounding fibers. Thus, the surviving neighboring fibers experience a stress concentration that will cause a second fiber to fail and initiate a cluster; then, the stress concentration will be increased. Eventually, an i-plet of a critical order or a group of failed adjacent fibers will be formed, at which point the failure will spread from fiber to fiber, with no further increase in stress being required to sustain the process. In this model, the growing i-plet is essentially regarded as a Griffith crack which remains stable until it achieves a critical size, when it propagates in an unstable manner across the entire section. The stress concentration factor is defined as the ratio between the local stress in the intact fiber and the remote stress [46]. Various equations of the stress concentration factor generated by an i-plet have been proposed. They give results with significant variations [46]. Wagner calculated milder values than expected when taking into account the effect of both material and geometrical parameters [46]. However, the inherent magnitude of the critical stress concentration factor that characterizes the composite resistance to failure propagation was not available, which made comparison to the stress concentration factor generated by the i-plet, and thus the evaluation of the criticality of i-plets impossible.
The assumption of the monotonically increasing stress and the resulting overloading in intact fibers from the load released by a broken fiber implies stress-controlled loading conditions. A different situation prevails under strain-controlled loading that is commonly applied during tensile tests. When the applied strain is kept constant, the force on the fibers decreases because the compliance is a bijective function of damage size. This situation is investigated in the present paper in order to highlight the significance of the loading conditions for composite materials and experimental results.
The objective of the present paper is to investigate the failure of polymer matrix minicomposites reinforced with SiC and alumina fibers, in relation to the underlying reinforcing filament strength distribution, and the condition of stress- or strain-controlled loading. Various scenarios of minicomposite failure alternative to the stress concentration induced by clusters of broken fibers are discussed.

2. Theory

2.1. P-Quantile zp(ε) Diagram

The p-quantile diagram zp(ε) was used in a previous paper to demonstrate that the filament flaw strength is a Gaussian variable [15]. It is a graphical method of comparing a Gaussian distribution to a set of data. When X is a Gaussian variable, with μ = mean and s = standard deviation, and N is a variable of the standard normal distribution, the equation is as follows:
P X < x = P X μ s < x μ s = P N < z = Φ ( z )
where P(.) is the cumulative probability that X < x, and Φ is the cumulative standard normal distribution of variable z, and
z = x μ s
when the linearity of the relation zp(xp) (Equation (2)) is observed on a set of xp data, one may assume that the xp data are occurrences of the same Gaussian variable. Then, the plot of p-quantile zp vs. xp indicates whether X is a Gaussian variable. p is the value of cumulative probability:
P X < x p = p
The diagram is constructed as follows: the p-quantile zp is derived from the cumulative standard normal distribution function Φ. The equation of the p-quantile zp diagram is:
z p = Φ 1 p = x p μ s
zp is extracted easily from Φ using a computer or tables that are available in textbooks.

2.2. Normal Distribution

The mean and the standard deviation were derived from the slope 1/s and the intercept μ/s of the p-quantile vs. failure stres zp(σ) straight line. This allows for the cumulative normal distribution functions to be calculated using the following equations for positive-strength values:
P N Σ σ = 0 σ f ( σ ) d σ
where f(σ) is the density of probability. f(σ) = 0 and PN = 0 when σ ≤ 0, as the flaws cannot grow under compression: f σ = 1 s 2 π e x p   [ ( σ μ ) 2 2 s 2 ] for σ.

2.3. Weibull Distribution

When applicable, the Weibull distribution function is an alternative expression of cumulative probability P:
P w Σ < σ = 1 exp σ σ l m   for σ > 0
where m is the shape parameter (or the Weibull modulus), and σ l is the scale factor.
The Weibull parameters are estimated from s and μ using the first moment of the Weibull distribution:
s μ = Γ 1 + 2 m Γ 2 1 + 1 m 1 1.2 m
σ l = μ Γ 1 + 1 m
where Γ (.) is the Gamma function.
The following equation of the Weibull distribution has been proposed for the composite failure from i-plets [35,36,45]:
P w Σ < σ = 1 e x p σ σ l m t
where mt = i* mf, mt is the Weibull modulus relative to minicomposite strength distribution and mf is the one characteristic of the filament strength distribution. i* represents the size of the cluster of breaks (i-plet) at the onset of instability and fracture for that particular stress.
The applicability of the Weibull distribution was assessed by fitting the Weibull equation to the normal distribution of the strength data.

3. Experimental

3.1. Preparation of Specimens

Batches of about 20 specimens were prepared from bundles extracted from a single spool of silicon carbide (Nicalon) and a single spool of alumina (Sumitomo) fibers. The main characteristics of the fibers are given in Table 1.
Suitable lengths of bundles were cut at 120 mm. The test specimens of the minicomposites (single tow reinforced epoxy composites) and single filaments with a 75 mm gauge length were then prepared. Single filaments were extracted from three different bundles.
The Sumiepoxy epoxy (Sumitomo) that exhibits excellent wetting properties on alumina and silicon carbide was selected as the matrix for the minicomposites.
The ends of the minicomposites were sealed to tubes (typically syringe needles) that were then introduced into the jaws of the testing machine. They were bonded to the needles using an acrylic resin that was introduced using a syringe. Figure 1 shows the holder for the preparation of test specimen batches.
The bundle cross-sectional areas were determined from the bundle weight [34] prior to the test minicomposite specimen preparation. The average cross-sectional areas were 0.081 mm2 and 0.2 mm2 for the SiC and the alumina bundles, respectively (Table 1). The low values of standard deviation and coefficient of variation reveal the very small variation of tow cross-sectional areas (Table 1).
Window-type specimens were prepared for single-filament testing [47] (Figure 2). The stretched single filaments were bonded to two identical plates of material, each containing a central window. The height of the windows set the gauge length to 75 mm. The filament diameters were measured via optical microscopy prior to testing (Table 1). The values of standard deviation and coefficient of variation of the SiC filament diameters were quite high when comparing to the cross-sectional areas of tows and diameters of alumina filaments. The range of SiC filament diameters agrees with the previous results obtained via SEM and laser diffractometry [48,49,50].

3.2. Tensile Tests

Tensile tests were carried out on a tensile testing machine, with 5 N load cell for tests on single filaments, and a tensile testing machine with 500 N load cell for tests on minicomposites. The cross-head displacement rate was set to 7.5 mm/min (strain rate 0.1/min) [34,47]. The strains were measured on minicomposites using a light extensometer with a 30 mm reference length.
The strengths of the minicomposites and single filaments were derived from the maximum force recorded during the tests and the measured values of the fiber diameter for single filaments (single filaments having a cylindrical cross section) and the cross-sectional area of the dry tows, assuming that the load carried by the epoxy matrix was negligible (Table 1).
The tensile behavior of the SiC dry tows under a constant strain rate was determined in a previous paper [18]. The validity of the derived distribution of filament strengths was assessed in [19]. Therefore, the results from SiC dry-tow tests are regarded as the reference for the behavior of minicomposites.
The fracture surfaces of the test specimens were inspected using SEM.

4. Results

4.1. P-Quantile Diagrams for Filaments and Minicomposites

Figure 3 and Figure 4 show that all data points pertain to straight lines. The values of the correlation coefficients in Table 2 and Table 3 indicate a strong correlation between p-quantiles and strengths, which provides evidence that the respective strength data are Gaussian variables.
The diagram obtained from the SiC single-filament tests agrees with that obtained from the SiC dry-tow testing. However, the strengths measured on the single filaments were smaller than those measured on tows. This effect was also observed in [49]. It may be attributed to the difference in the sample size (35 from single-filament testing, 1000 from tow testing), as discussed in a previous paper [19]. Typically, the mean strength value tends to increase with the amount of data. It might also be attributed to the uncertainty in the filament Young’s modulus value used for the determination of the strengths from the strain data of the tows. However, the variability in Young’s modulus is generally quite small.
The minicomposite strengths also follow a normal distribution. It seems logical to consider that they characterize the filaments that trigger ultimate failure. These critical filaments have strengths between 2200 MPa and 2800 MPa.
Table 2 and Table 3 summarize the data that were extracted from the sets of experimental strength data. The unimodal linearity of the p-quantile diagrams indicates that single populations of flaws dictated the filament failure. It was not possible to identify the sites of the original failure of the tows and minicomposites via microscopy because of the large number of broken filaments in the fractured surfaces (Figure 5). However, fractographic examination of the minicomposites revealed the presence of two distinct families of filament-fractured surfaces (Figure 6):
filaments exhibiting a fracture mirror, indicating that they failed individually from a flaw;
fibers exhibiting a smooth fracture surface, suggesting that they did not fail individually from a flaw, but instead from a crack initiated in a neighboring filament.

4.2. Cumulative Distributions of the Strengths of Filaments and Minicomposites

A good agreement between normal (Pn) and Weibull (PW) cumulative distributions was observed (Figure 7 and Figure 8). The values of the correlation coefficients indicate a strong correlation of the probability Pn with the strengths, and also of the Weibull and normal distribution functions (Table 2 and Table 3).
The comparison at a given strength of cumulative distributions of the filaments and minicomposite strengths gives the probabilities of the fracture Pf of the filaments in strength distribution equivalent to the rank (=N0. Pf; N0 is the initial number of filaments in dry tow). For instance, for the SiC fiber minicomposites, the low extreme strength of 2243 MPa corresponds to the filament having the probability Pf = 0.64 in the filament strength distribution derived from the tow test, and having Pf = 0.8 in the filament strength distribution derived from tests on single filaments. Pf = 0.64 indicates that 64% of the filaments were broken when the minicomposite started to fail. Note that for alumina-reinforced minicomposites, Pf = 0.98, which means that 980 out of 1000 filaments were broken when the minicomposite failed. From this point of view, the SiC minicomposites broke earlier. Note that the values of Pf depend on the filament strength distribution considered that is derived either from dry-tow or single-filament tests. The distribution derived from dry tow tensile behavior gives lower values. However, as discussed in an earlier paper, it is the pertinent distribution [19]. The important point for the SiC minicomposites is that Pf at a high extreme was smaller than the maximum, which indicates that a number of filaments were not broken when the minicomposites failure started.

4.3. Probability Density Functions of the Filaments and Minicomposites

Figure 9 compares the probability density functions of the filament and minicomposite strengths. They confirm the above assumption that the SiC-reinforced minicomposites exhibited premature failure compared to the alumina-reinforced minicomposites. They also indicate that SiC- and alumina-reinforced minicomposites have comparable strengths, although alumina filaments exhibited weaker strengths.

5. Discussion

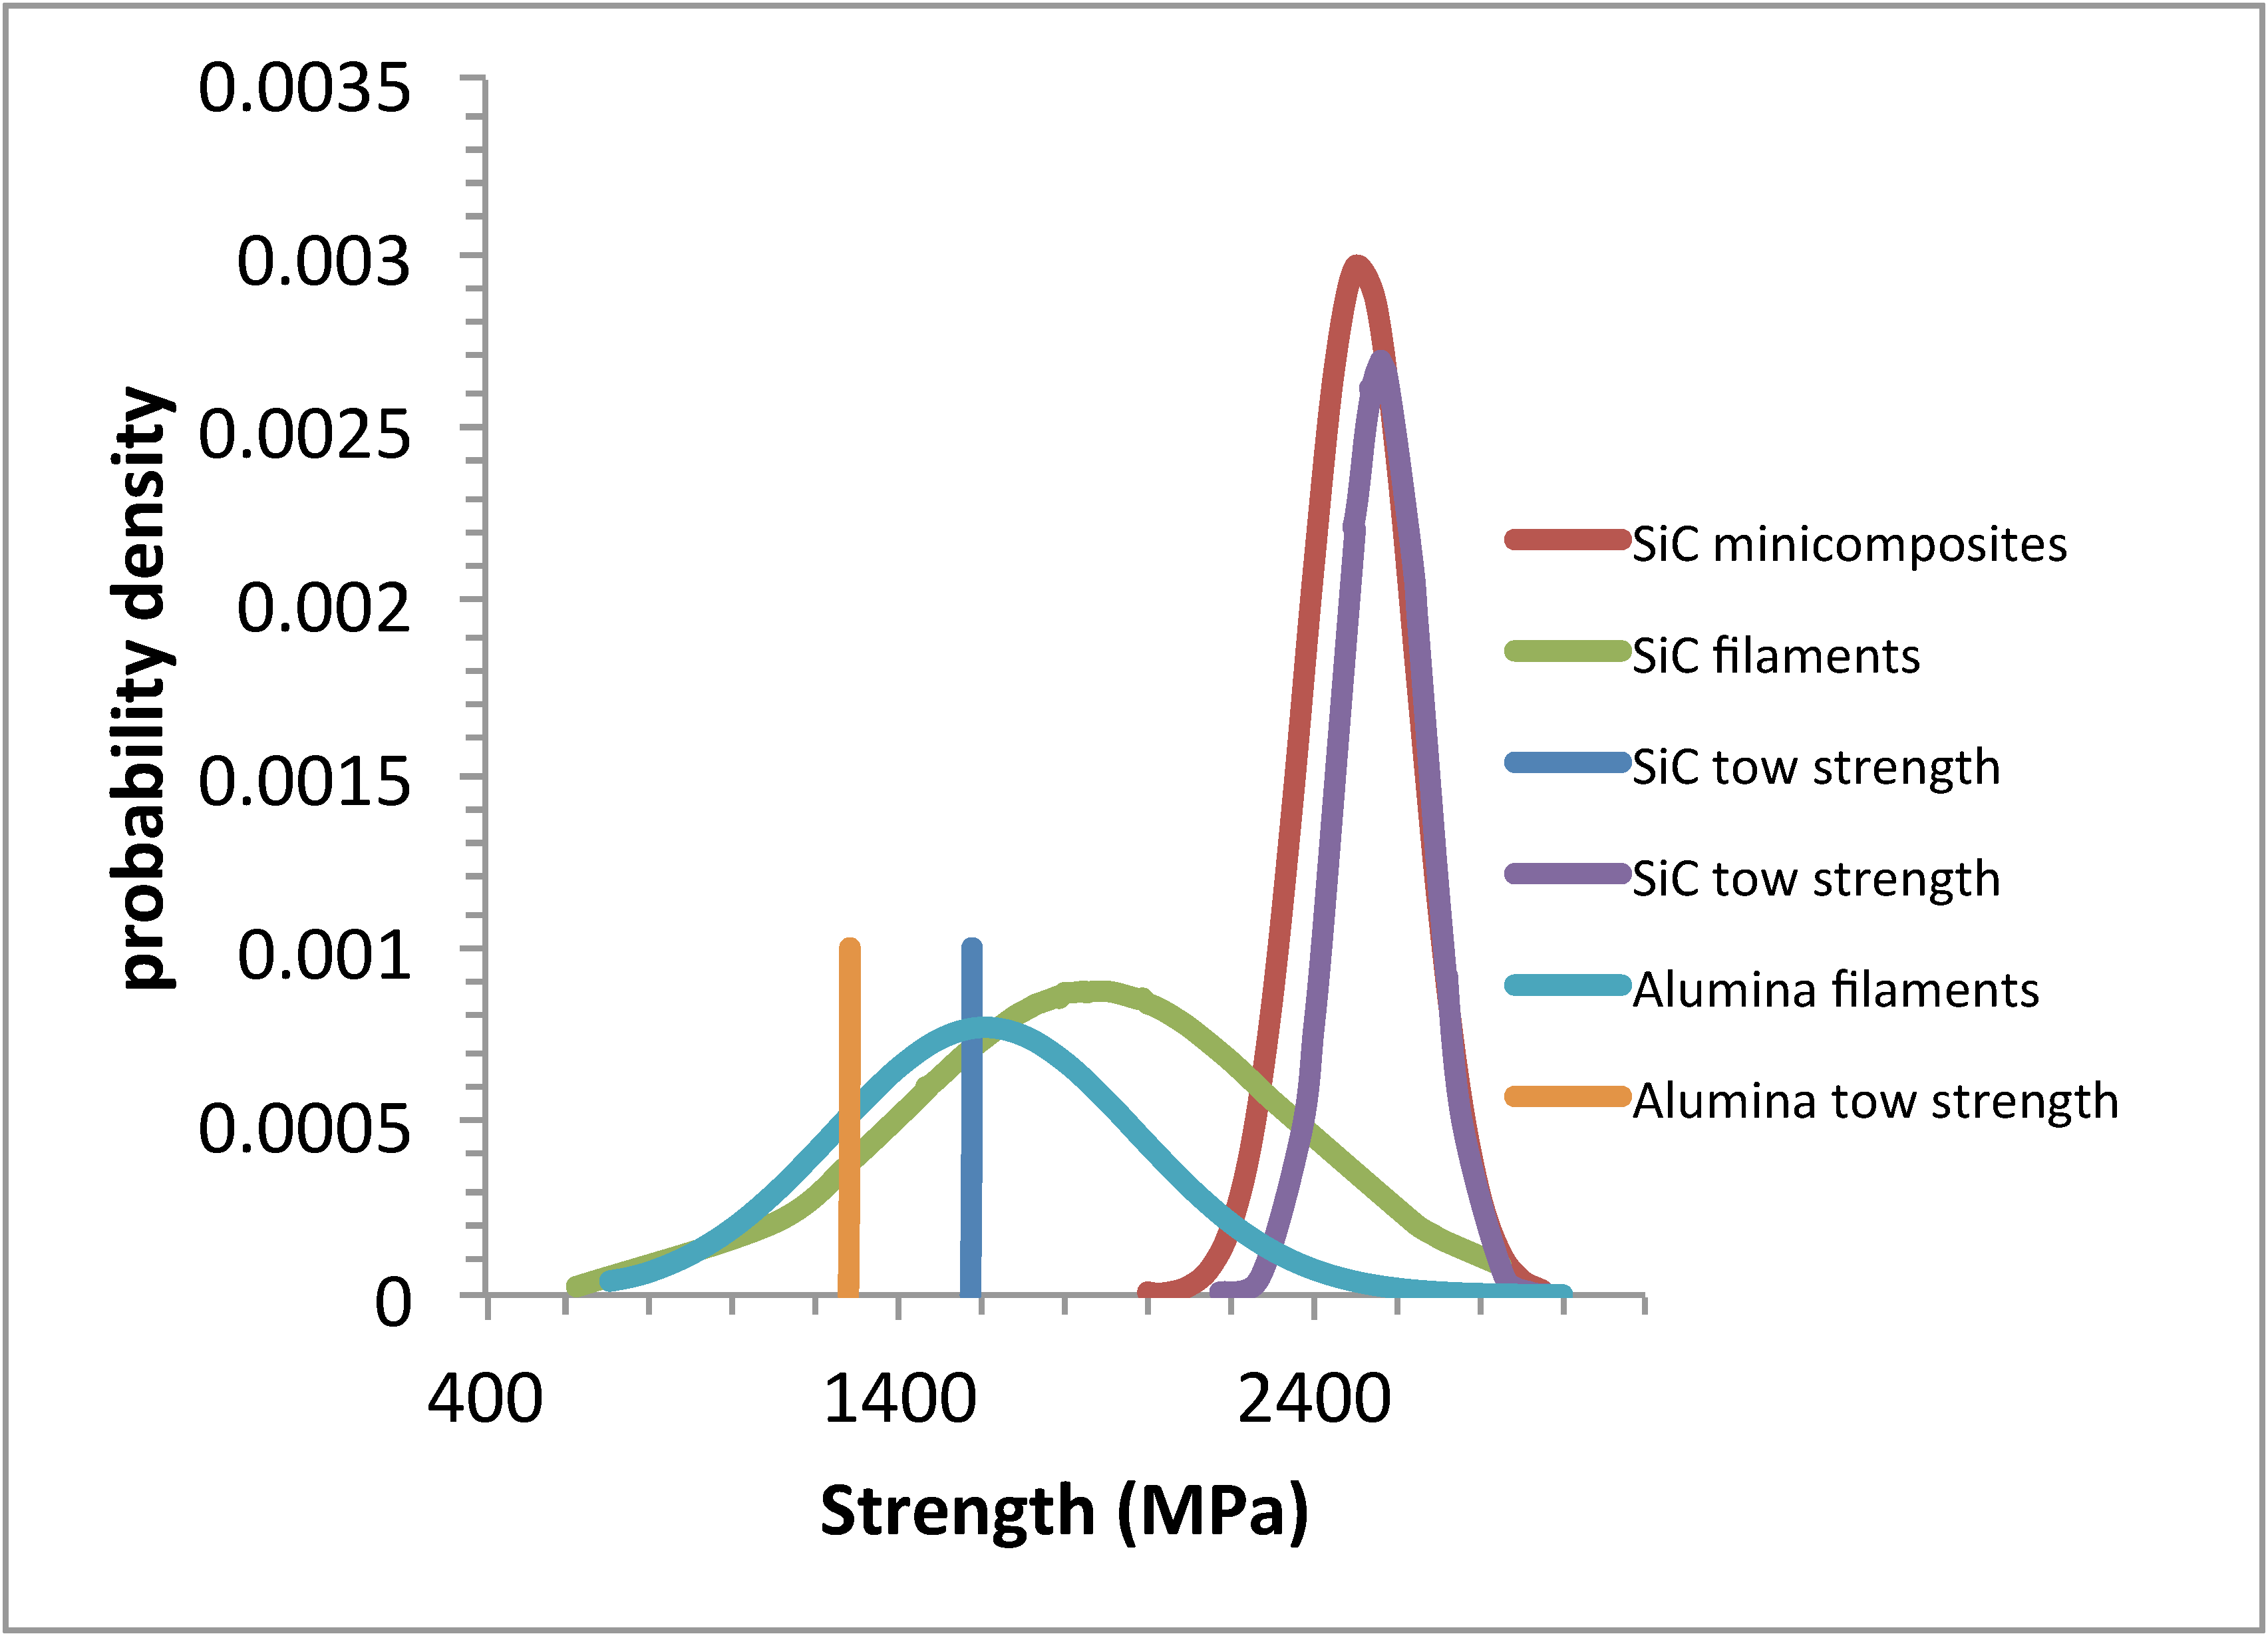
One of the main outcomes of the comparison of the filament and minicomposite strength distributions is that alumina minicomposites failed from the strongest filaments, whereas most of the SiC-reinforced minicomposites exhibited premature failure. This difference between the minicomposite types and the source of ultimate failure warrant further analysis.

5.1. Tensile Behavior

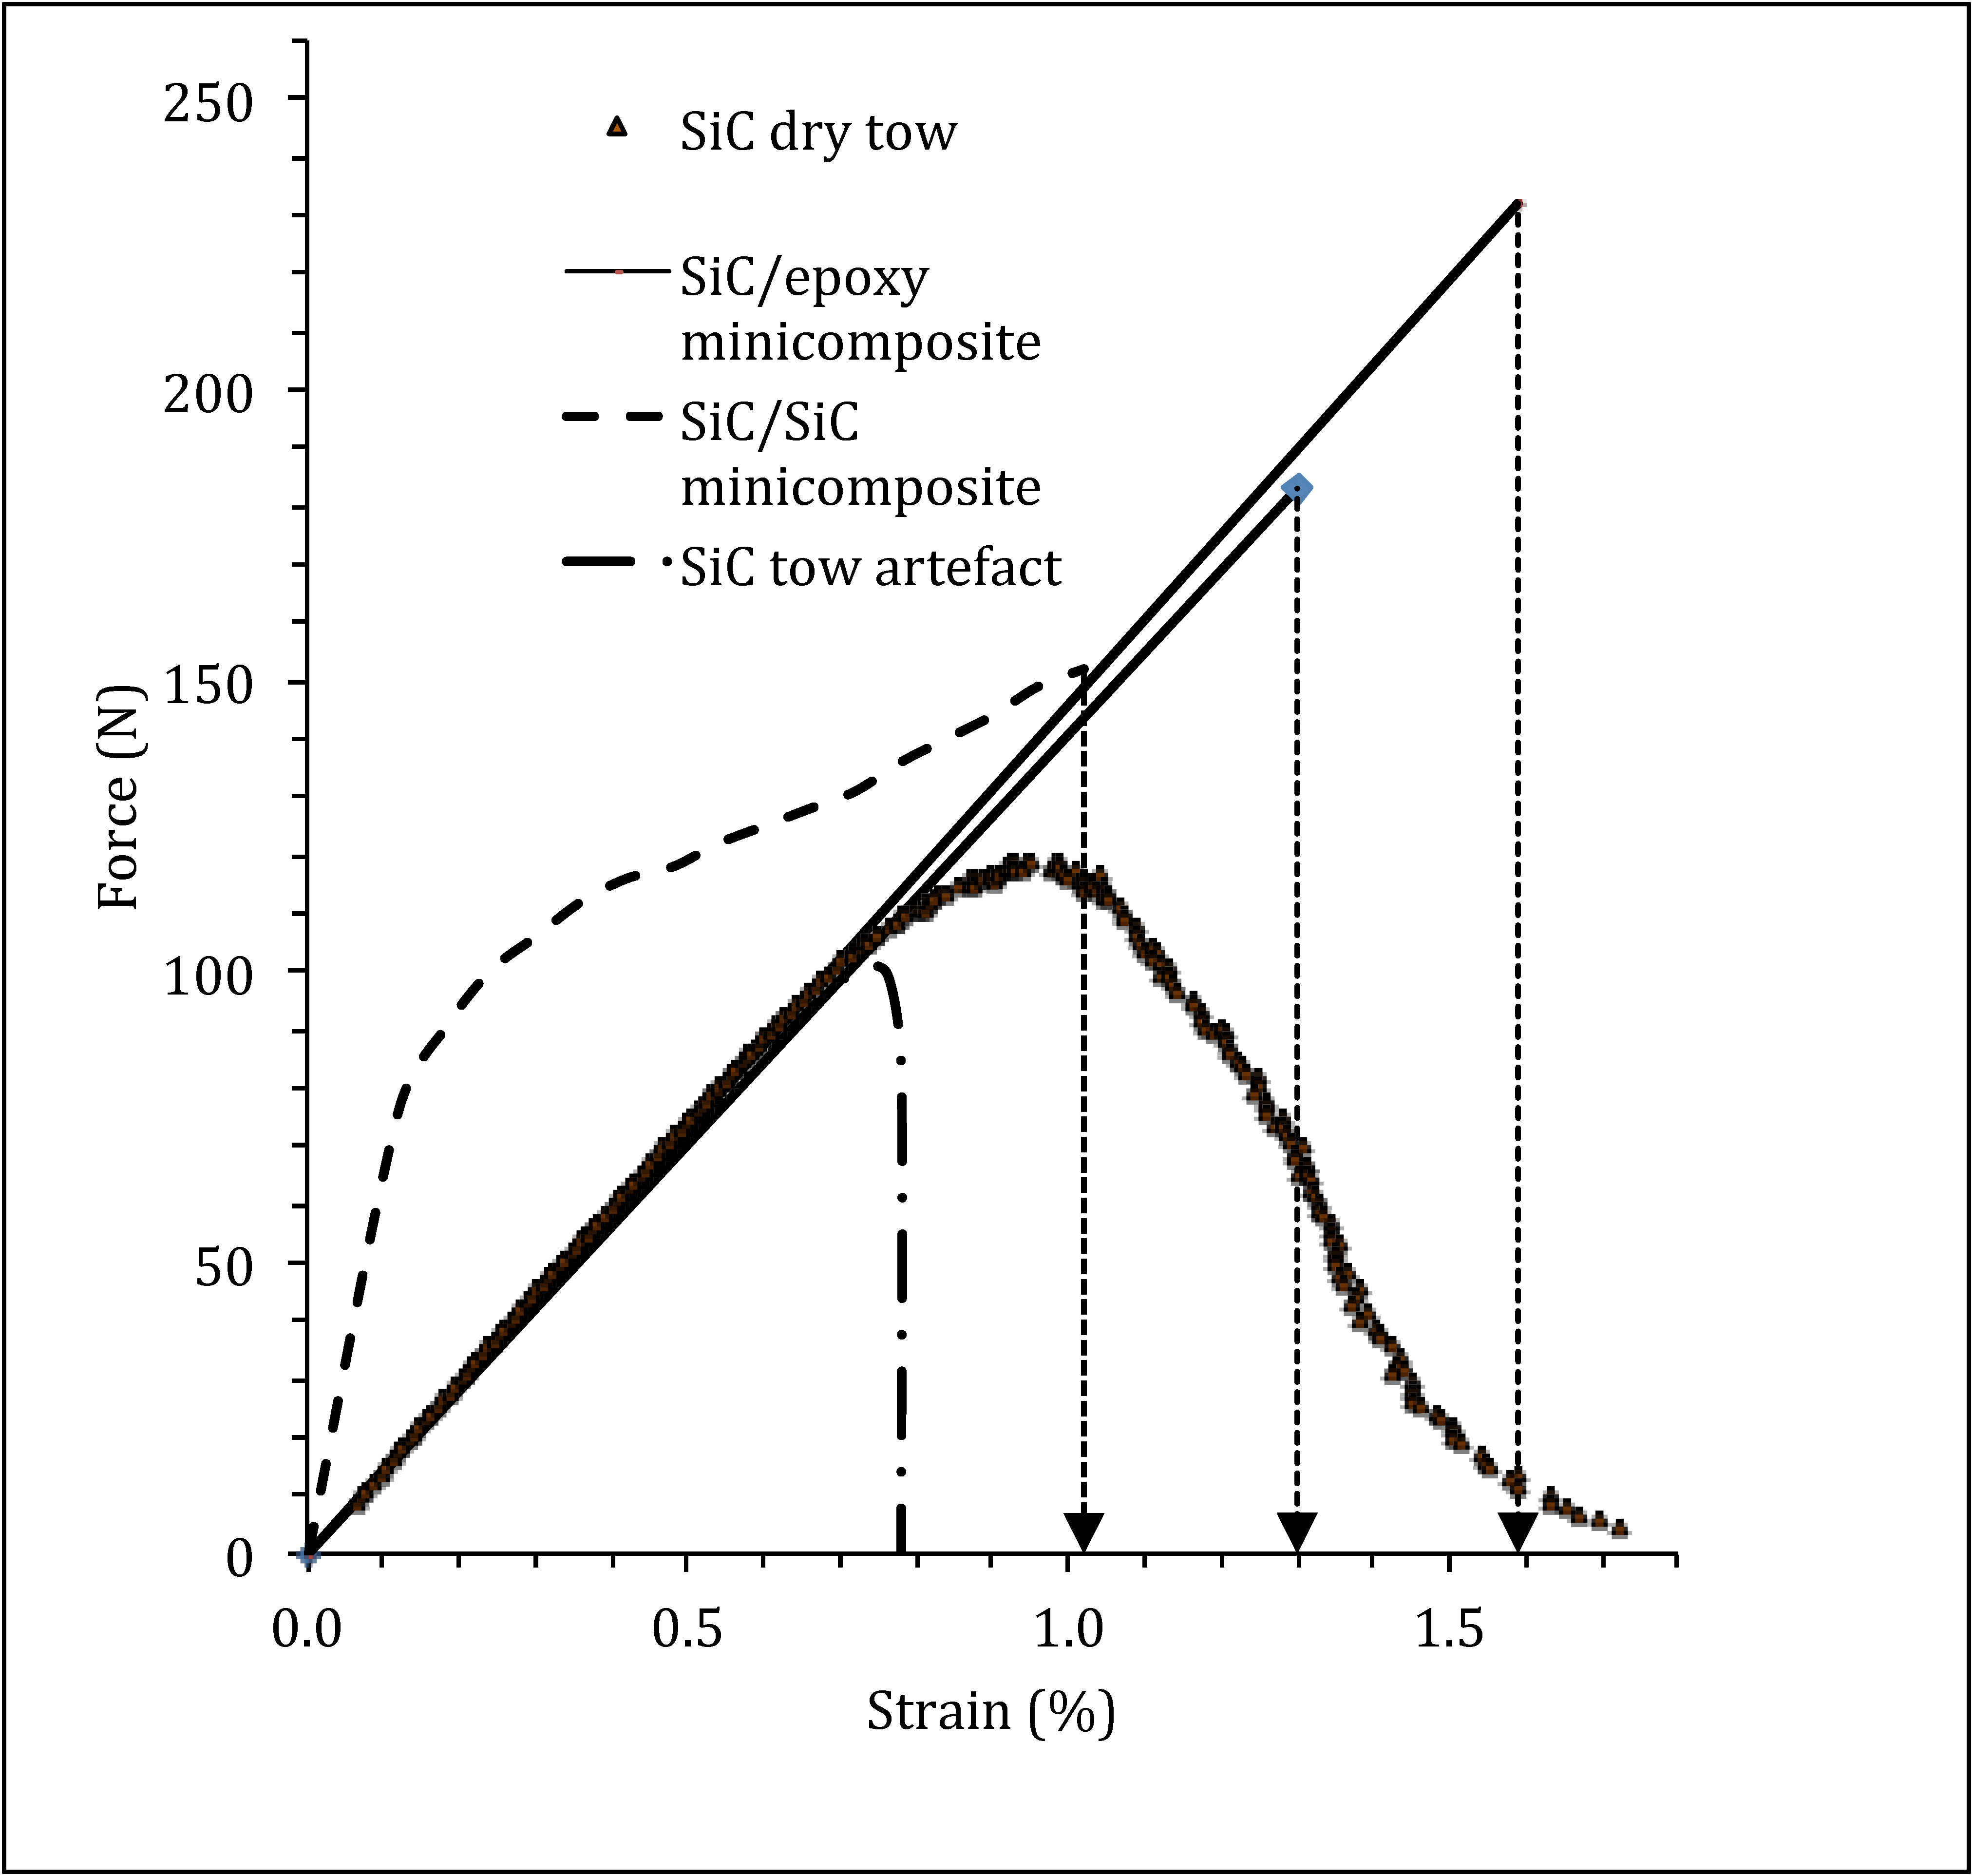
Figure 10 compares typical tensile force–strain curves obtained on various SiC-tow-based specimens: dry tow, SiC matrix minicomposite (stiff and brittle matrix) and epoxy matrix minicomposite (compliant matrix). A similar complete set of behaviors on alumina-tow-based specimens was not available, since premature failures were observed during dry-tow testing and the minicomposites with a ceramic matrix were not available.
The single filaments exhibit a linear elastic behavior until ultimate brittle failure. The force–strain curve of the single filaments tested individually was not represented for practical reasons, since the forces on single filaments are comparatively very small and display a wide variability.
The dry tows exhibit a non-linear elastic damageable behavior governed by the successive failures of the filaments under loading condition of a constant strain rate. It is worth stressing that under such a loading condition, all the filaments in the tow fail in a stable mode, successively and independently, in the absence of an artefact [15]. This theoretical behavior was obtained experimentally with a lubricant to relieve the interfilament friction [15]. The ultimate failure of tow is dictated by the strongest filament. Therefore, the strength of dry tow under these conditions of a constant strain rate is given by the strength of the strongest filament.
The theoretical behavior of tows under strain-controlled loading condition can be affected by overloading. The premature failure of dry tows was observed [32] when a lubricant was not used as a result of fiber interfriction that generated local overload (Figure 10). Fiber friction was detected as low-energy amplitude acoustic emission signals (30 dB), whereas higher-energy amplitudes (80 dB) show fiber fractures.
Overload under constant strain rate can also be generated in the presence of a ceramic matrix (stiff and brittle) that can share the load. SiC/SiC minicomposites exhibit a non-linear elastic damageable behavior governed by the matrix damage (by multiple cracking), and then subsequently, by successive failures of the weakest single filaments. Ultimate failure is caused by the release of the load shared by the matrix that induces high stress on the fibers (Figure 10). This step occurs at a force close to the maximum force observed on the dry tow tensile curve (Figure 10).
The epoxy minicomposites exhibited a linear elastic damageable behavior (Figure 10). The damage was caused by the failure of the filaments in the progressive mode up to a certain point of instability (
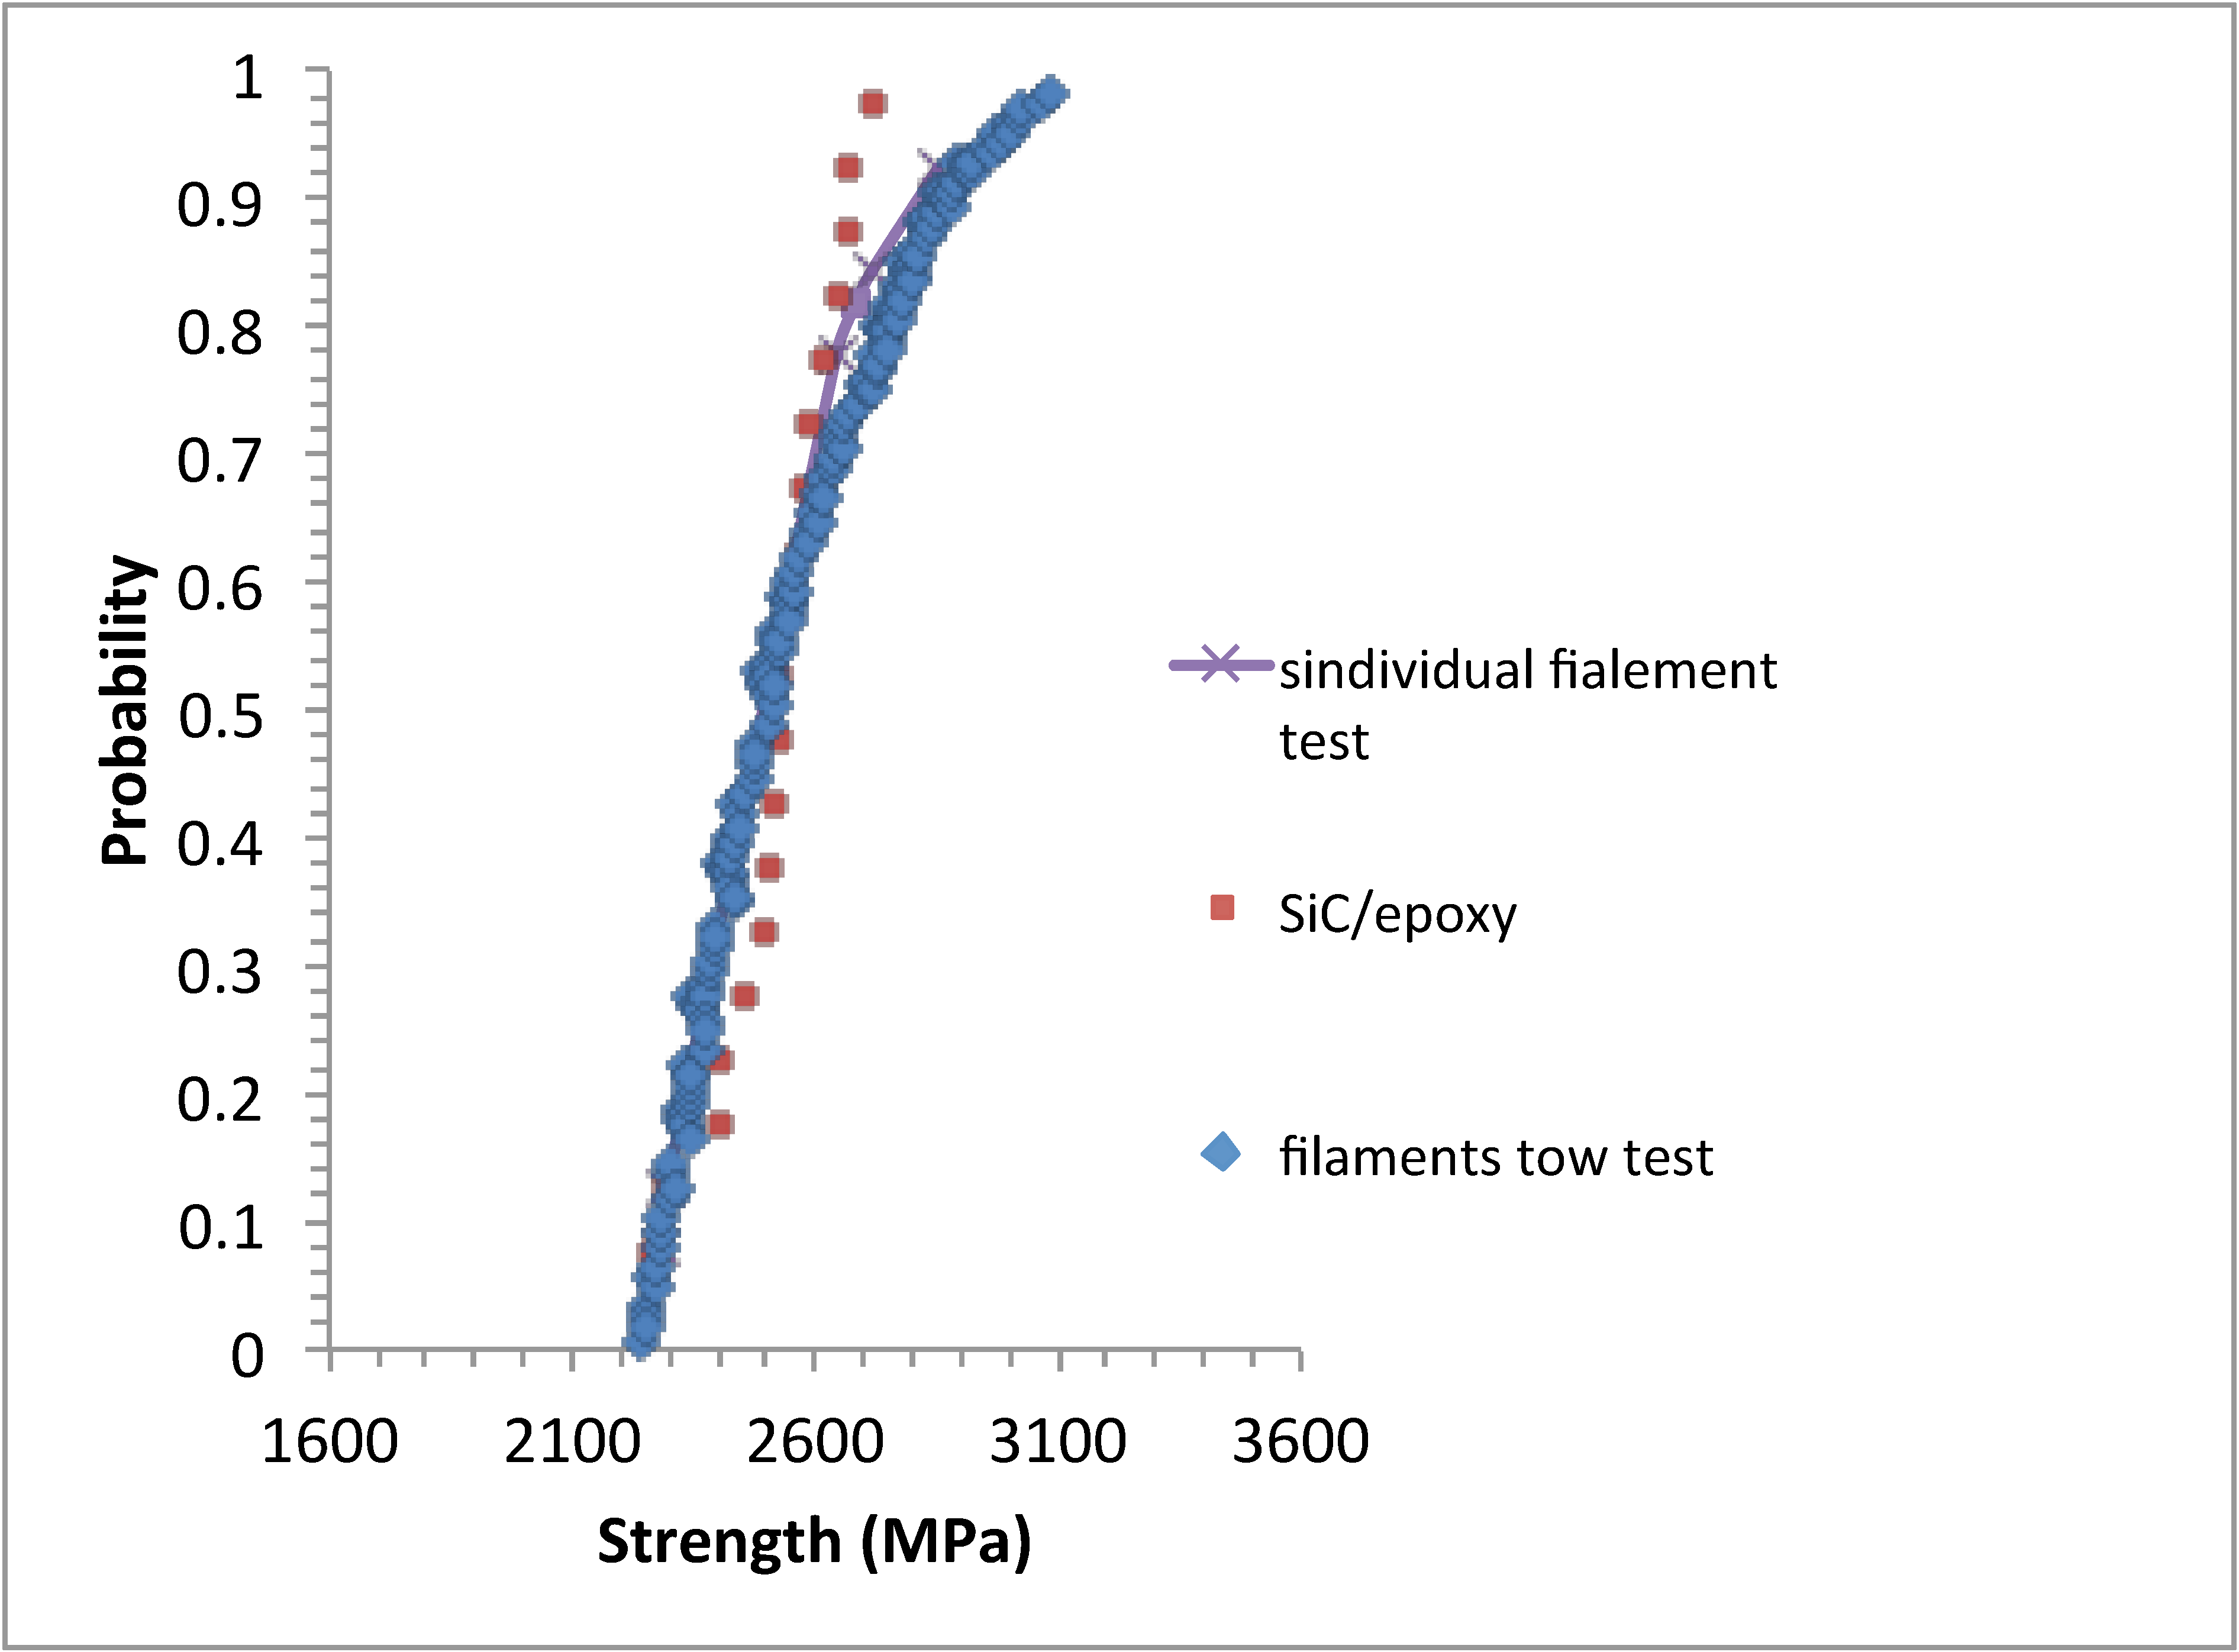
Figure 10). The ultimate strengths of the epoxy minicomposites exhibit some scatter, as discussed previously. Regarding the SiC/epoxy minicomposites, the force–strain curve of reinforcing dry tows suggests that the stable failure mode should theoretically last until the failure of the strongest filament. Therefore, it can be considered that most SiC-reinforced minicomposites experienced premature ultimate failure. In the literature [36,39,45], there was no way to determine whether the failure of C/epoxy and SiC/epoxy composites was premature. The failure was attributed to overloading of the neighboring fibers via stress transfer through the matrix, and the growth of the clusters of adjacent fiber breaks to a critical unstable size for the results obtained under strain-controlled loading conditions [36,39,45].

5.2. Influence of the Loading Condition on Instability in a Dry Tow

The loading conditions significantly affect the tensile behavior of dry tows. Under load-controlled conditions, the force on tow is kept constant during filament breakage so that the force operating on the breaking filament is shared equally by the surviving filaments. The failure of a filament thus induces overloading on the surviving fibers by an increment.
Δ σ i = σ i N 0 i
where i denotes the fiber that failed (according to an ascending strength order) and σi is the stress that was operating on this fiber before the failure. i also denotes the corresponding number of broken fibers.
Ultimate failure occurs when Δ σ i ( σ i + 1 σ i ) , whatever the i (Figure 11). σi+1 is the strength of the fiber having rank i+1. This condition is expressed as:
d σ a d P d σ d P
where σa is the stress operating on the filaments under force-controlled load and σ is the filament strength (Equation (13) is derived from Equation (6)).
σ a = F N 0 ( 1 P ) S f
σ = σ l L n 1 1 P 1 m
The filament strength gradient in a tow is Δ σ = d σ d P Δ P . From Equation (13), it follows that:
Δ σ = σ m 1 P   L n ( 1 1 P ) Δ P
When ΔP = 1/N0, N0 being the initial number of filaments carrying the load, Δσ measures the difference between two successive filament strengths of the cumulative distribution (Figure 11).
The critical fiber in a tow that triggers instability and fracture is defined by the particular value of probability (αc) derived from Equation (11) (Figure 11). αc corresponds to the maximum force of the tensile curve obtained under strain-controlled conditions.
P = α c = 1 e x p   ( 1 m )
Figure 11 compares the stress increase Δσ under a constant load with the strength gradient Δσ in the tow. It shows that under such loading condition, the overstress induced by the fracture of the critical filament exceeds the stress gradient for filament probabilities > 0.17. When global load-sharing conditions prevail, the ultimate failure occurs when Δσ = 1 or 4 MPa, and when P = αc = 0.17 (Equation (15)).
According to theory, the maximum forces of fiber tows should not be scattered [32,41,51]. This feature was observed experimentally [19]; however, this trend may be affected by an artefact [32].
Under strain-controlled conditions, there is no overloading of the surviving fibers when a fiber fails. The strain on filaments is kept constant by boundary conditions during the fiber break: Δε = 0 when fiber i fails and the force on the surviving filaments decreases according to fracture mechanics (the compliance is a bijective function of damage size), then Δσ < 0. This effect is well illustrated by the experimental results obtained on dry tows: (i) the force–strain curve exhibits force relaxation under constant strain when fiber failure is caused by stress corrosion [51], and (ii) the tensile force–strain curve shown in Figure 10 does not exhibit instability until the complete failure of the tow.
The understanding of the ultimate failure of minicomposites requires consideration of the loading conditions, the behavior of the underlying tow and the respective behaviors of alumina- and SiC-reinforced minicomposites.

5.3. Relationship between Filaments and Minicomposites: Truncation of Filament p-Quantile Diagrams and Cumulative Distribution Function (CDF)

This section compares the truncated p-quantile diagrams and cdf of the filament strengths with those of the minicomposite in order to characterize the strength distribution of those filaments that initiated the ultimate failure of the minicomposites.
The truncated p-quantile diagrams were derived from the cdf of the filament strengths that were truncated at the values of probability P* = Pf, as identified in Section 4.2 (Table 4). Truncated probabilities were calculated using equation: Pt = (Pi − P*)/(1 − P*), where Pi is the initial values of probabilities. The truncated p-quantile diagrams were then derived from the values of Pt (Equation (4)), and 156 data points were obtained for the truncated diagrams of the SiC filament strengths generated using the tow test.
The distribution obtained from the tests on SiC single filaments was truncated at P* = 0.8, according to the results reported in Section 4.2. The amount of data after truncation was quite small (6 data).
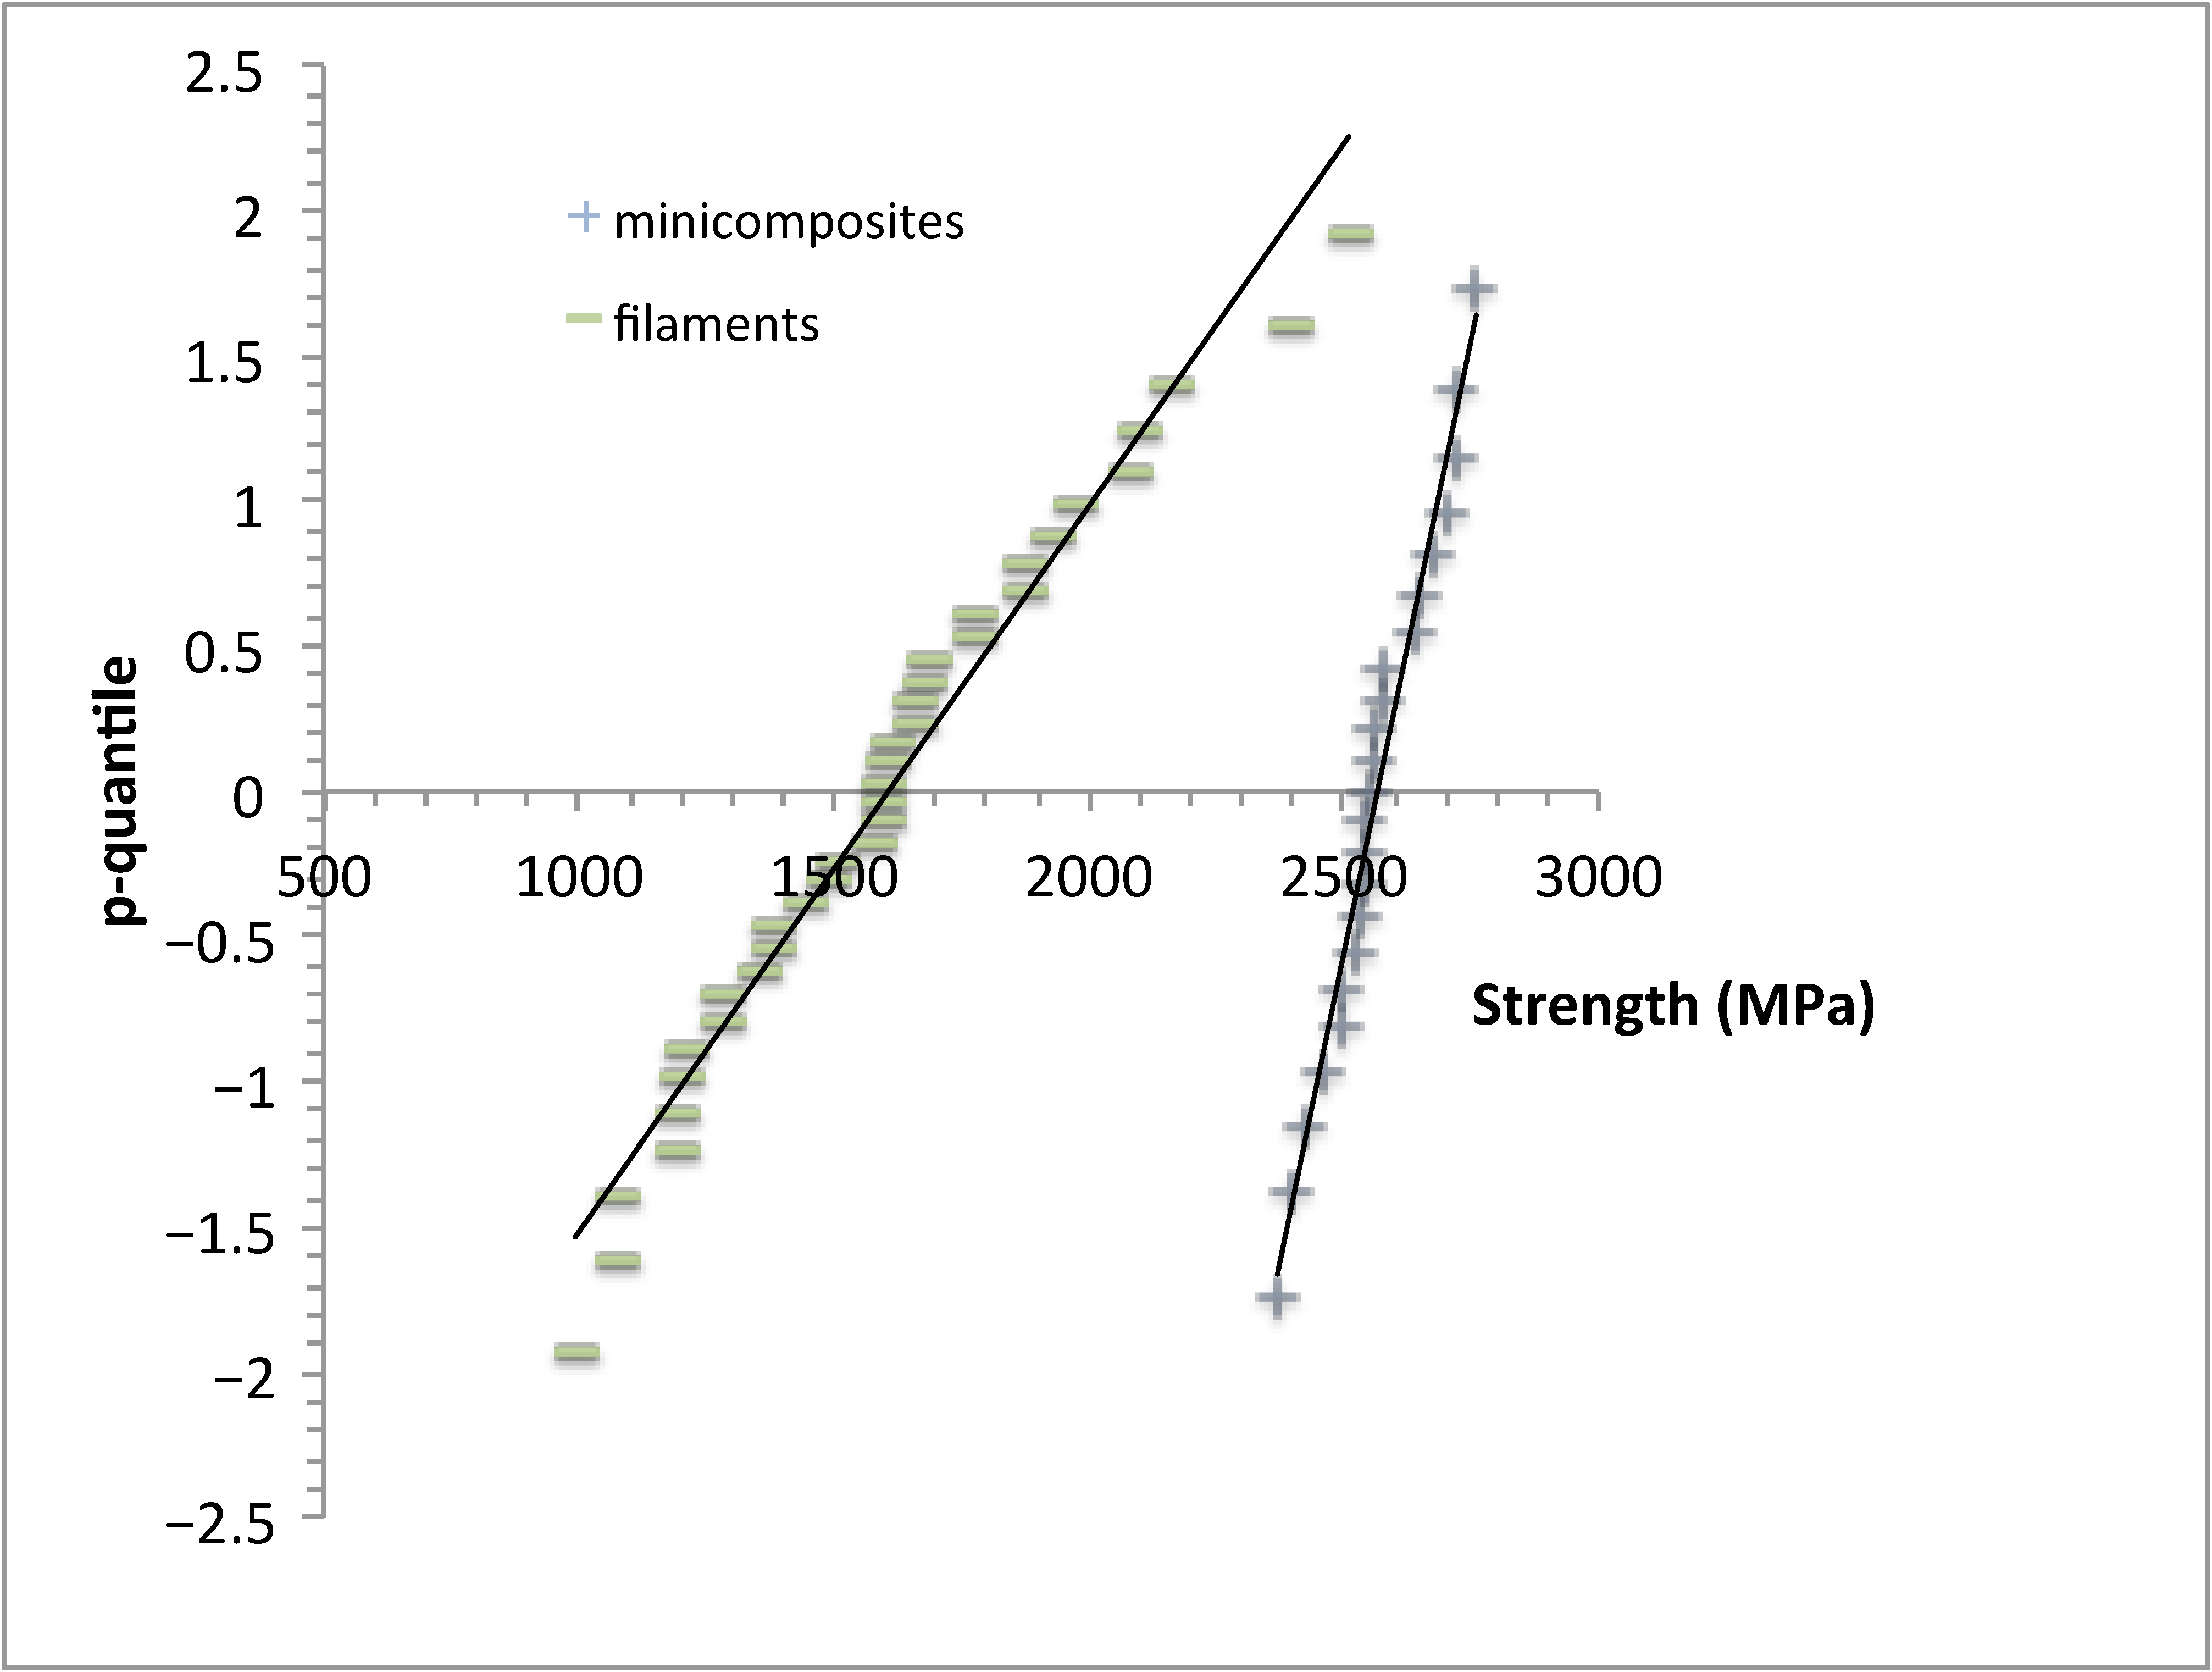
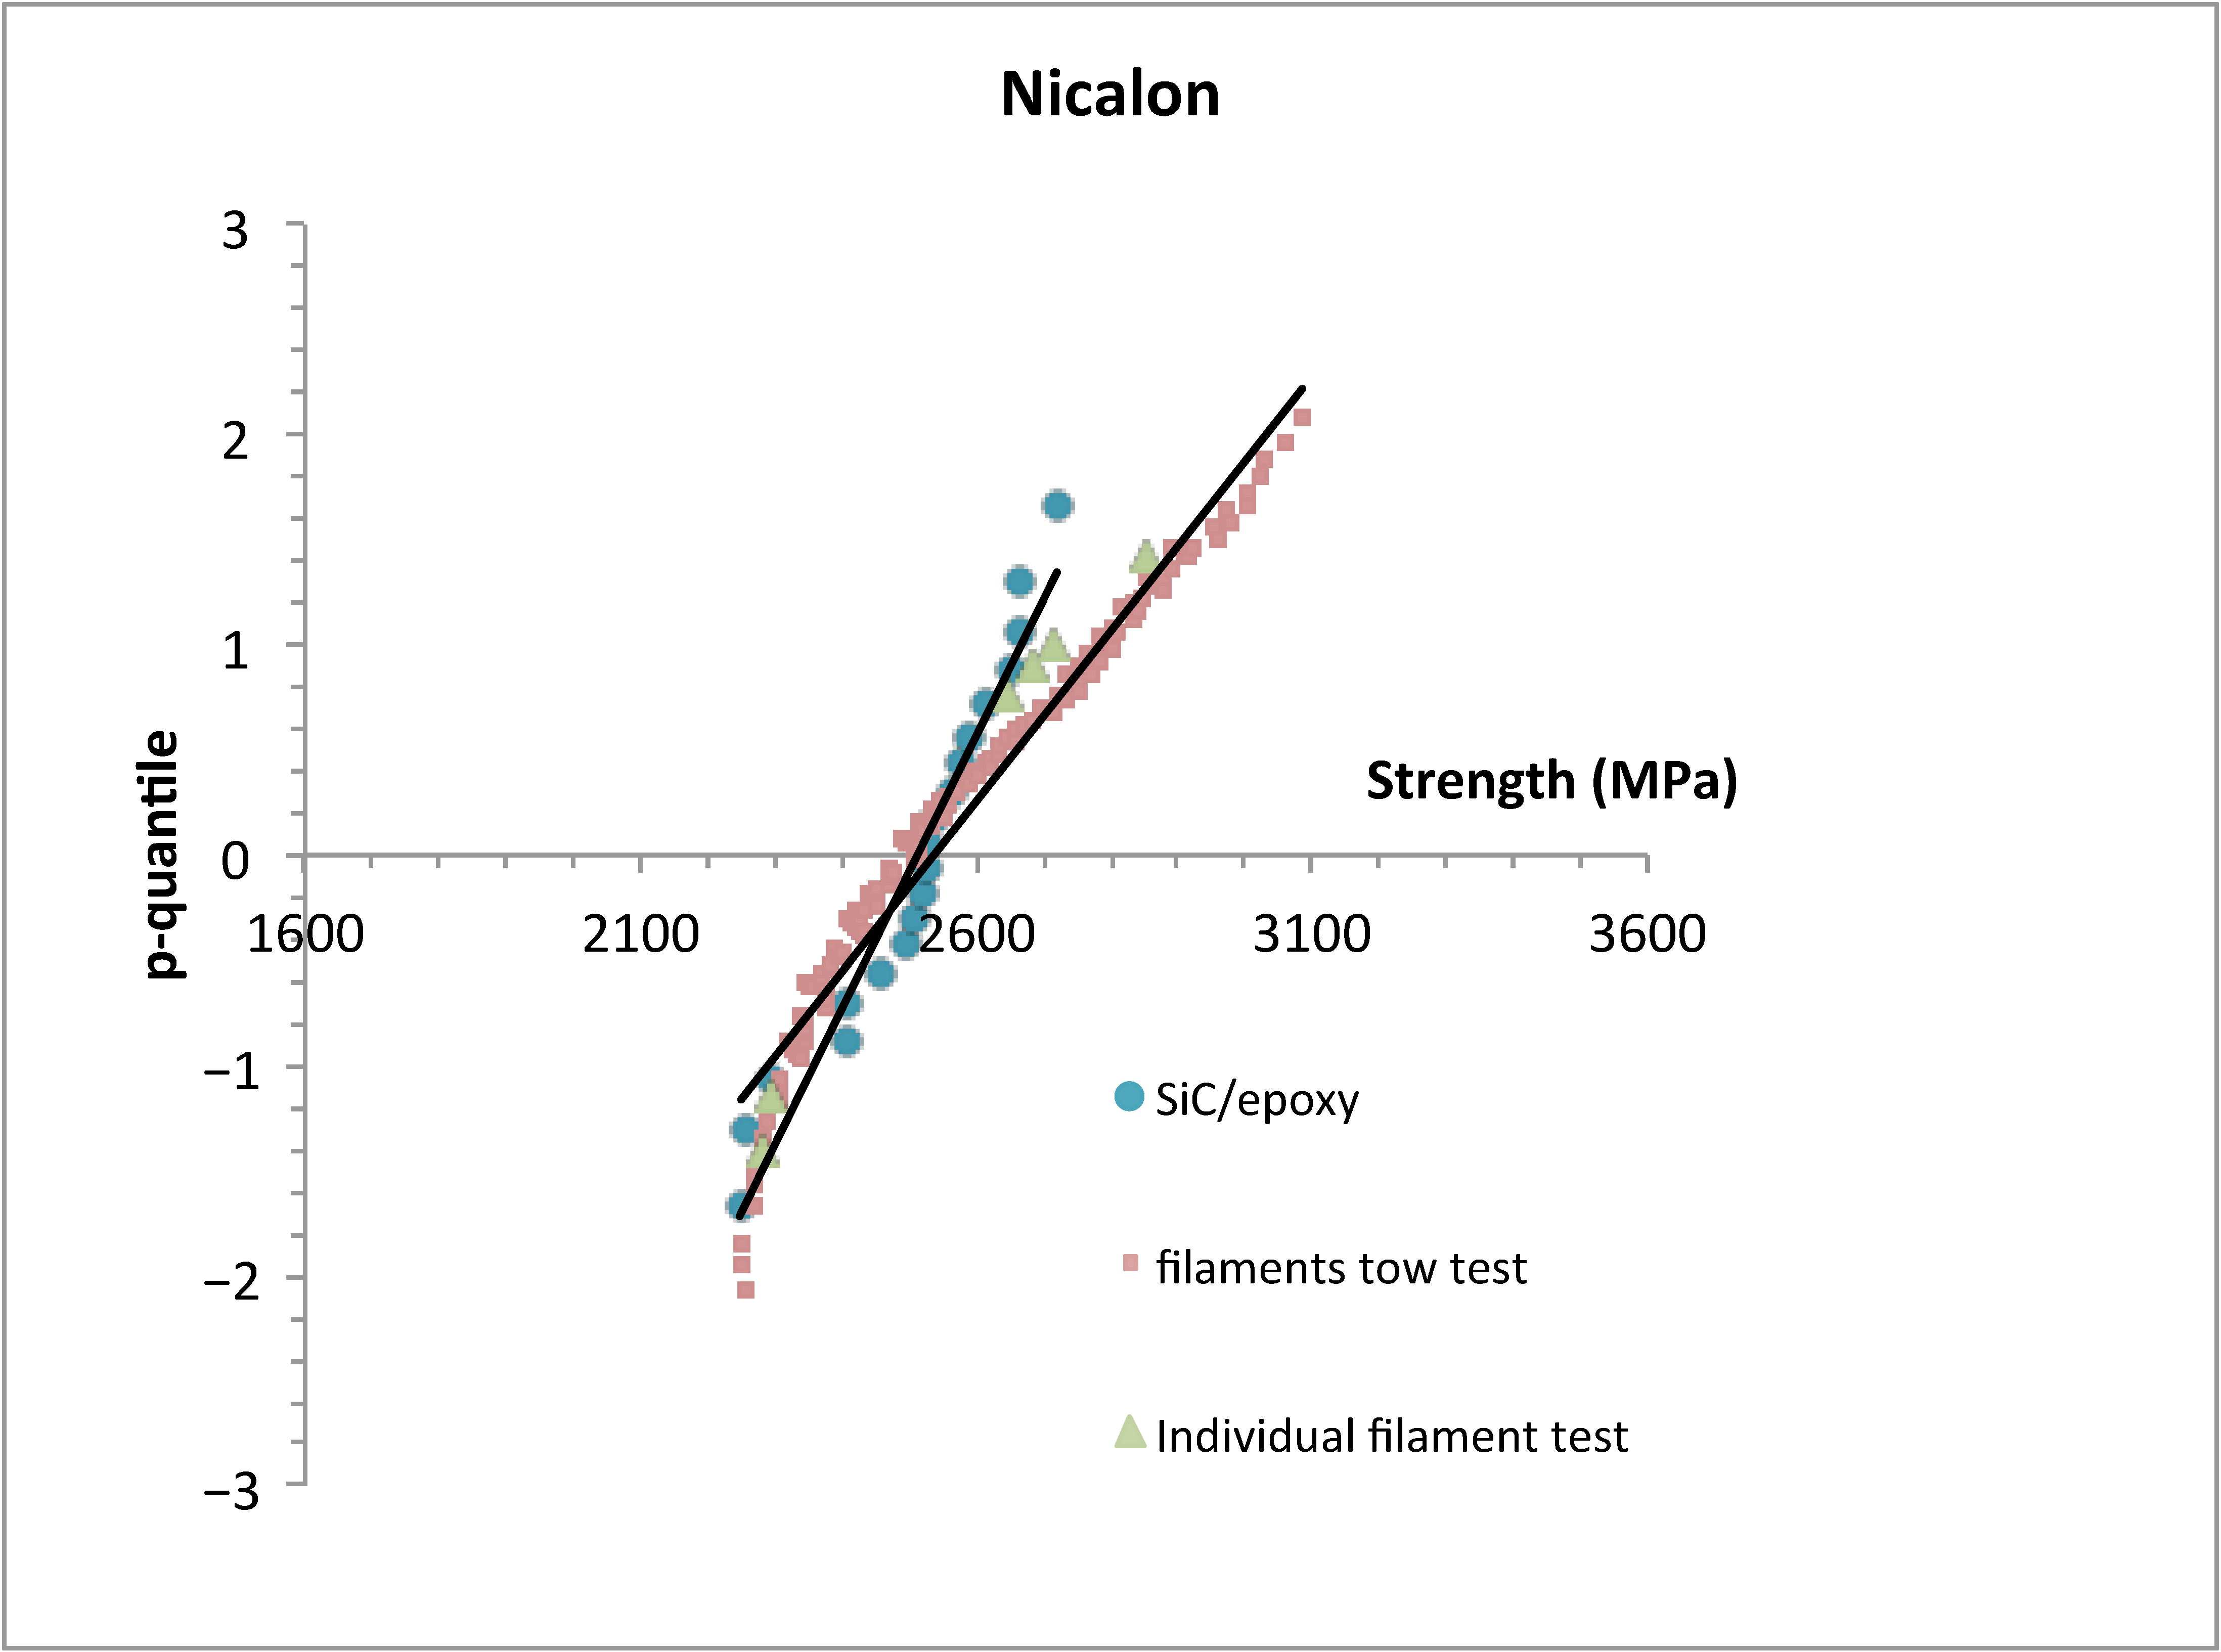
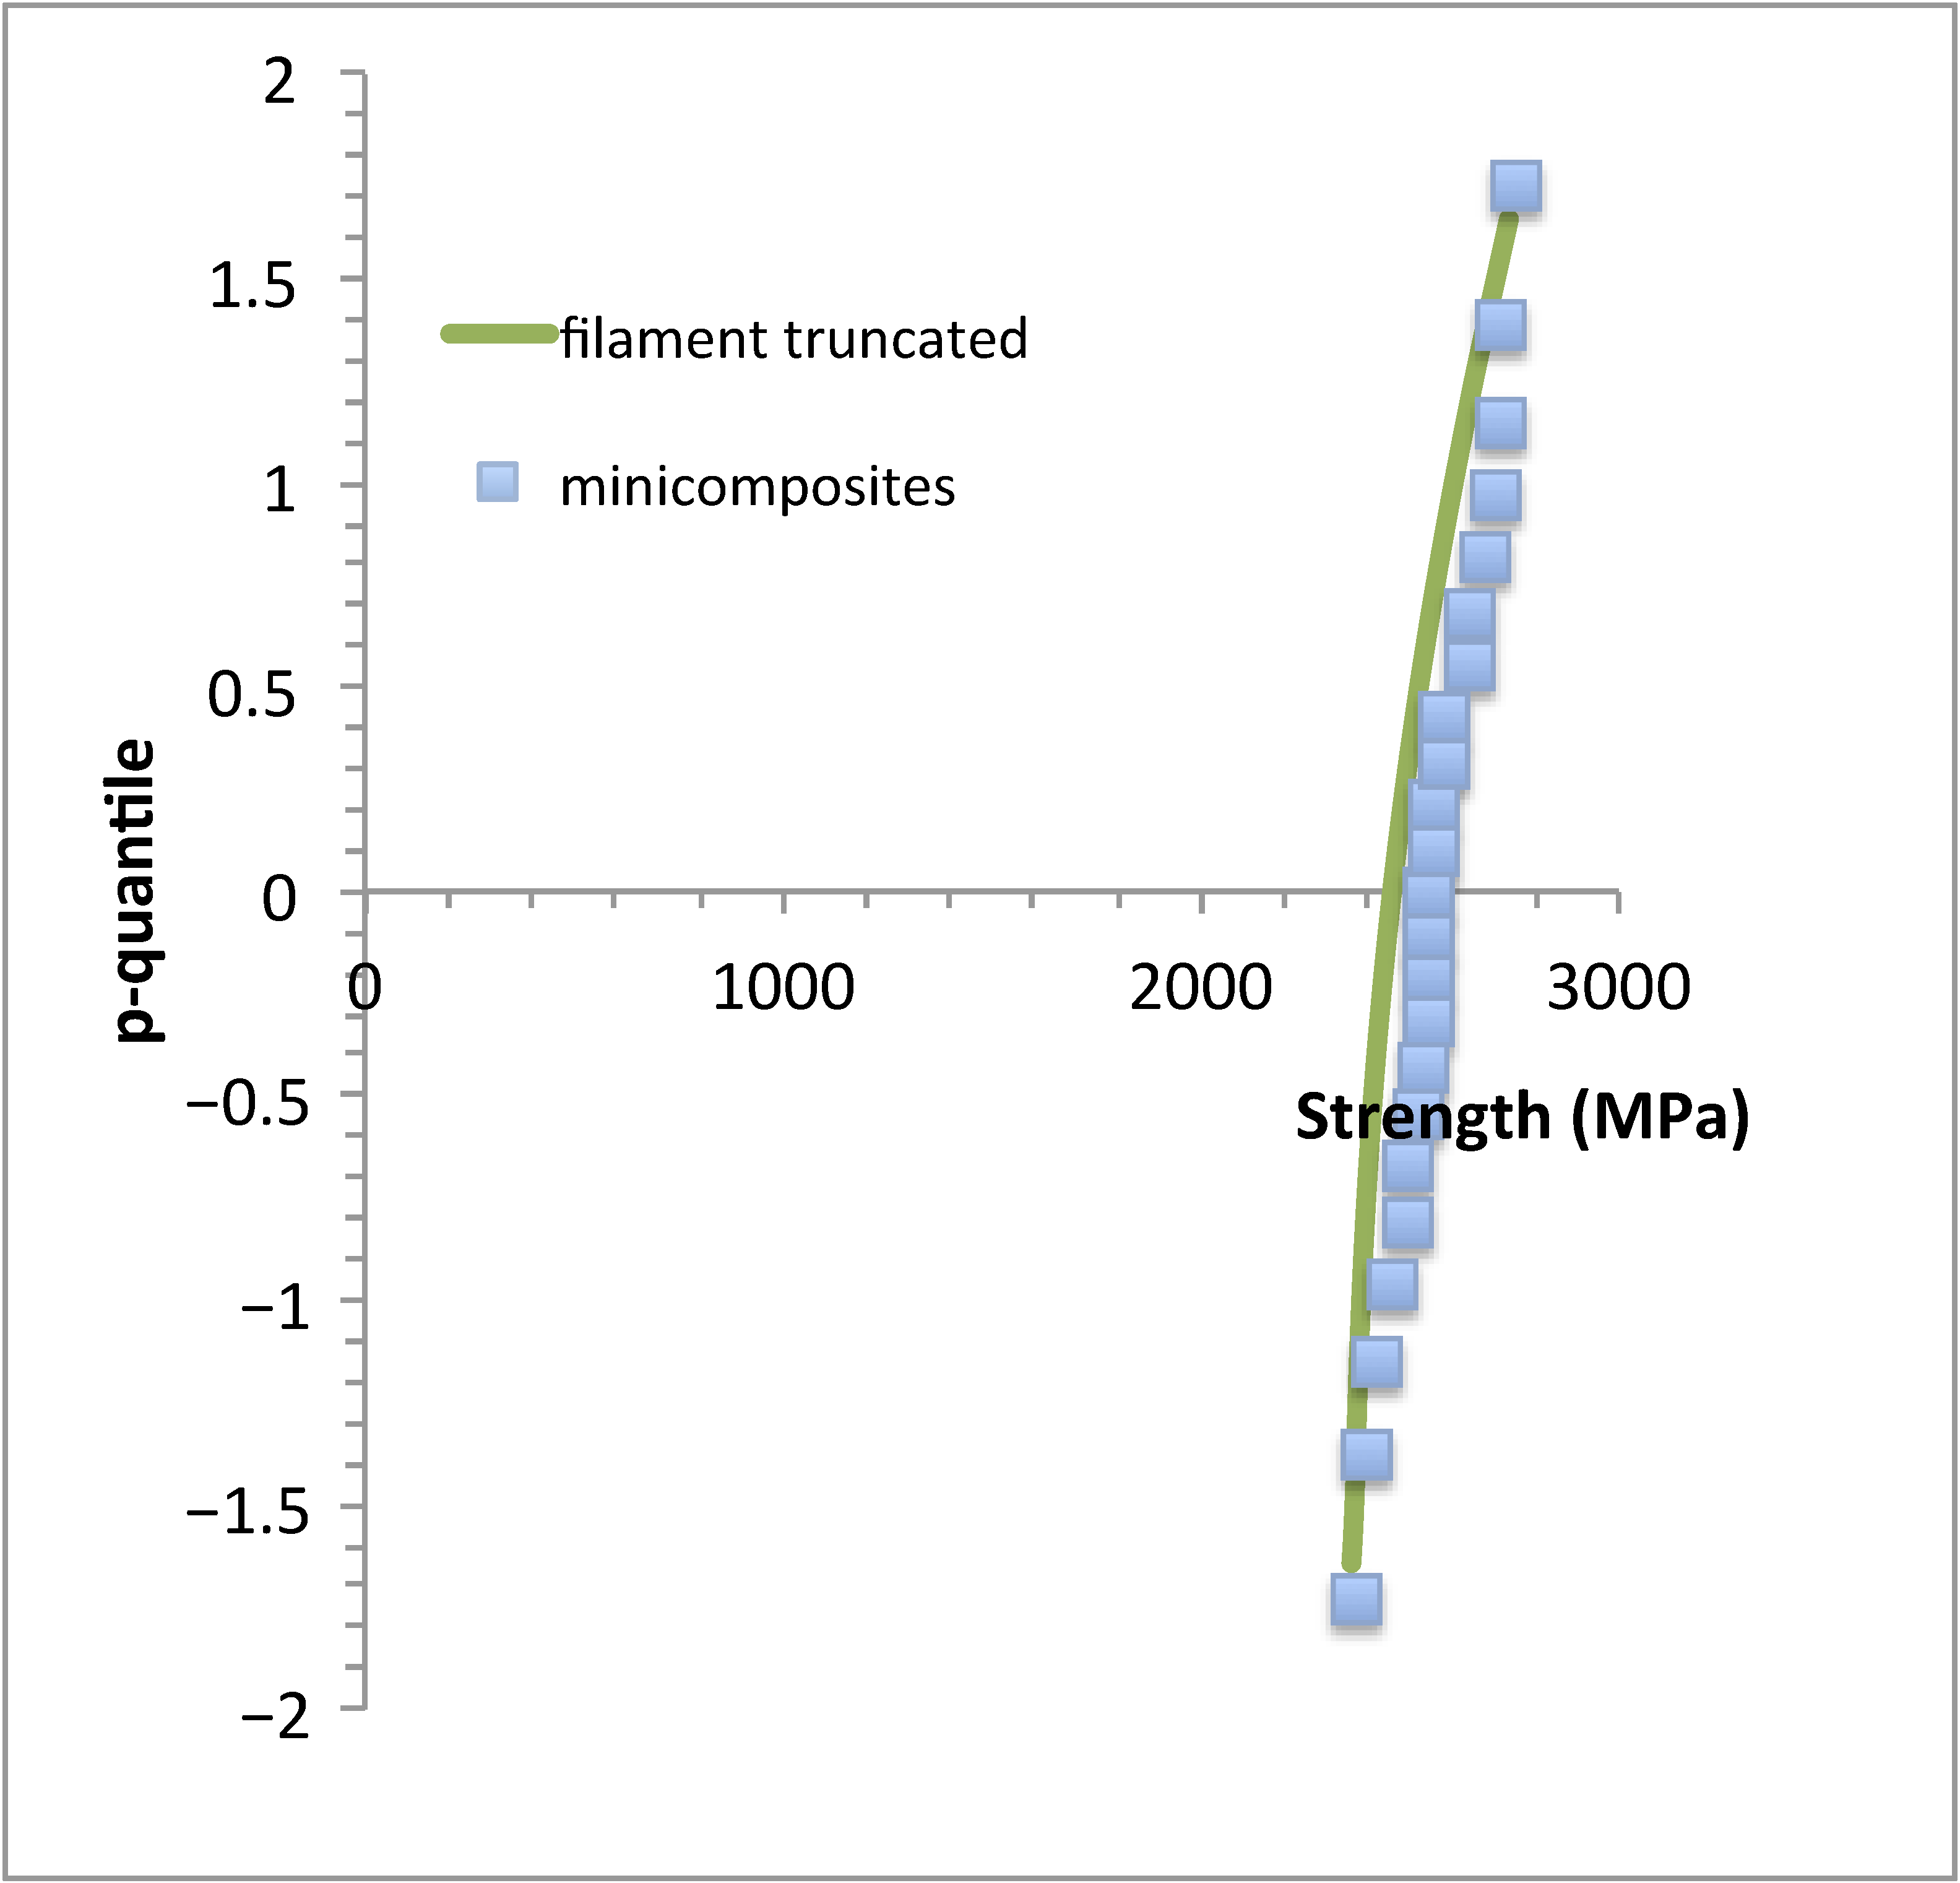
There is discrepancy between the p-quantile diagram of the SiC-reinforced minicomposites and the truncated p-quantile diagrams of the filament strengths (Figure 12): the filaments strengths were larger than minicomposite strengths at strengths > 2600 MPa, and agreed with the minicomposite strengths at strengths < 2600 MPa. Note that the truncated p-quantile diagrams of filament strengths determined using tow or single-filament testing coincide.
The values of the correlation coefficients indicate a strong correlation between the p-quantiles and strengths. The truncated p-quantile diagrams can be approximated by straight lines, indicating that the truncated distributions of the filament strengths are characterized by normal distribution functions.
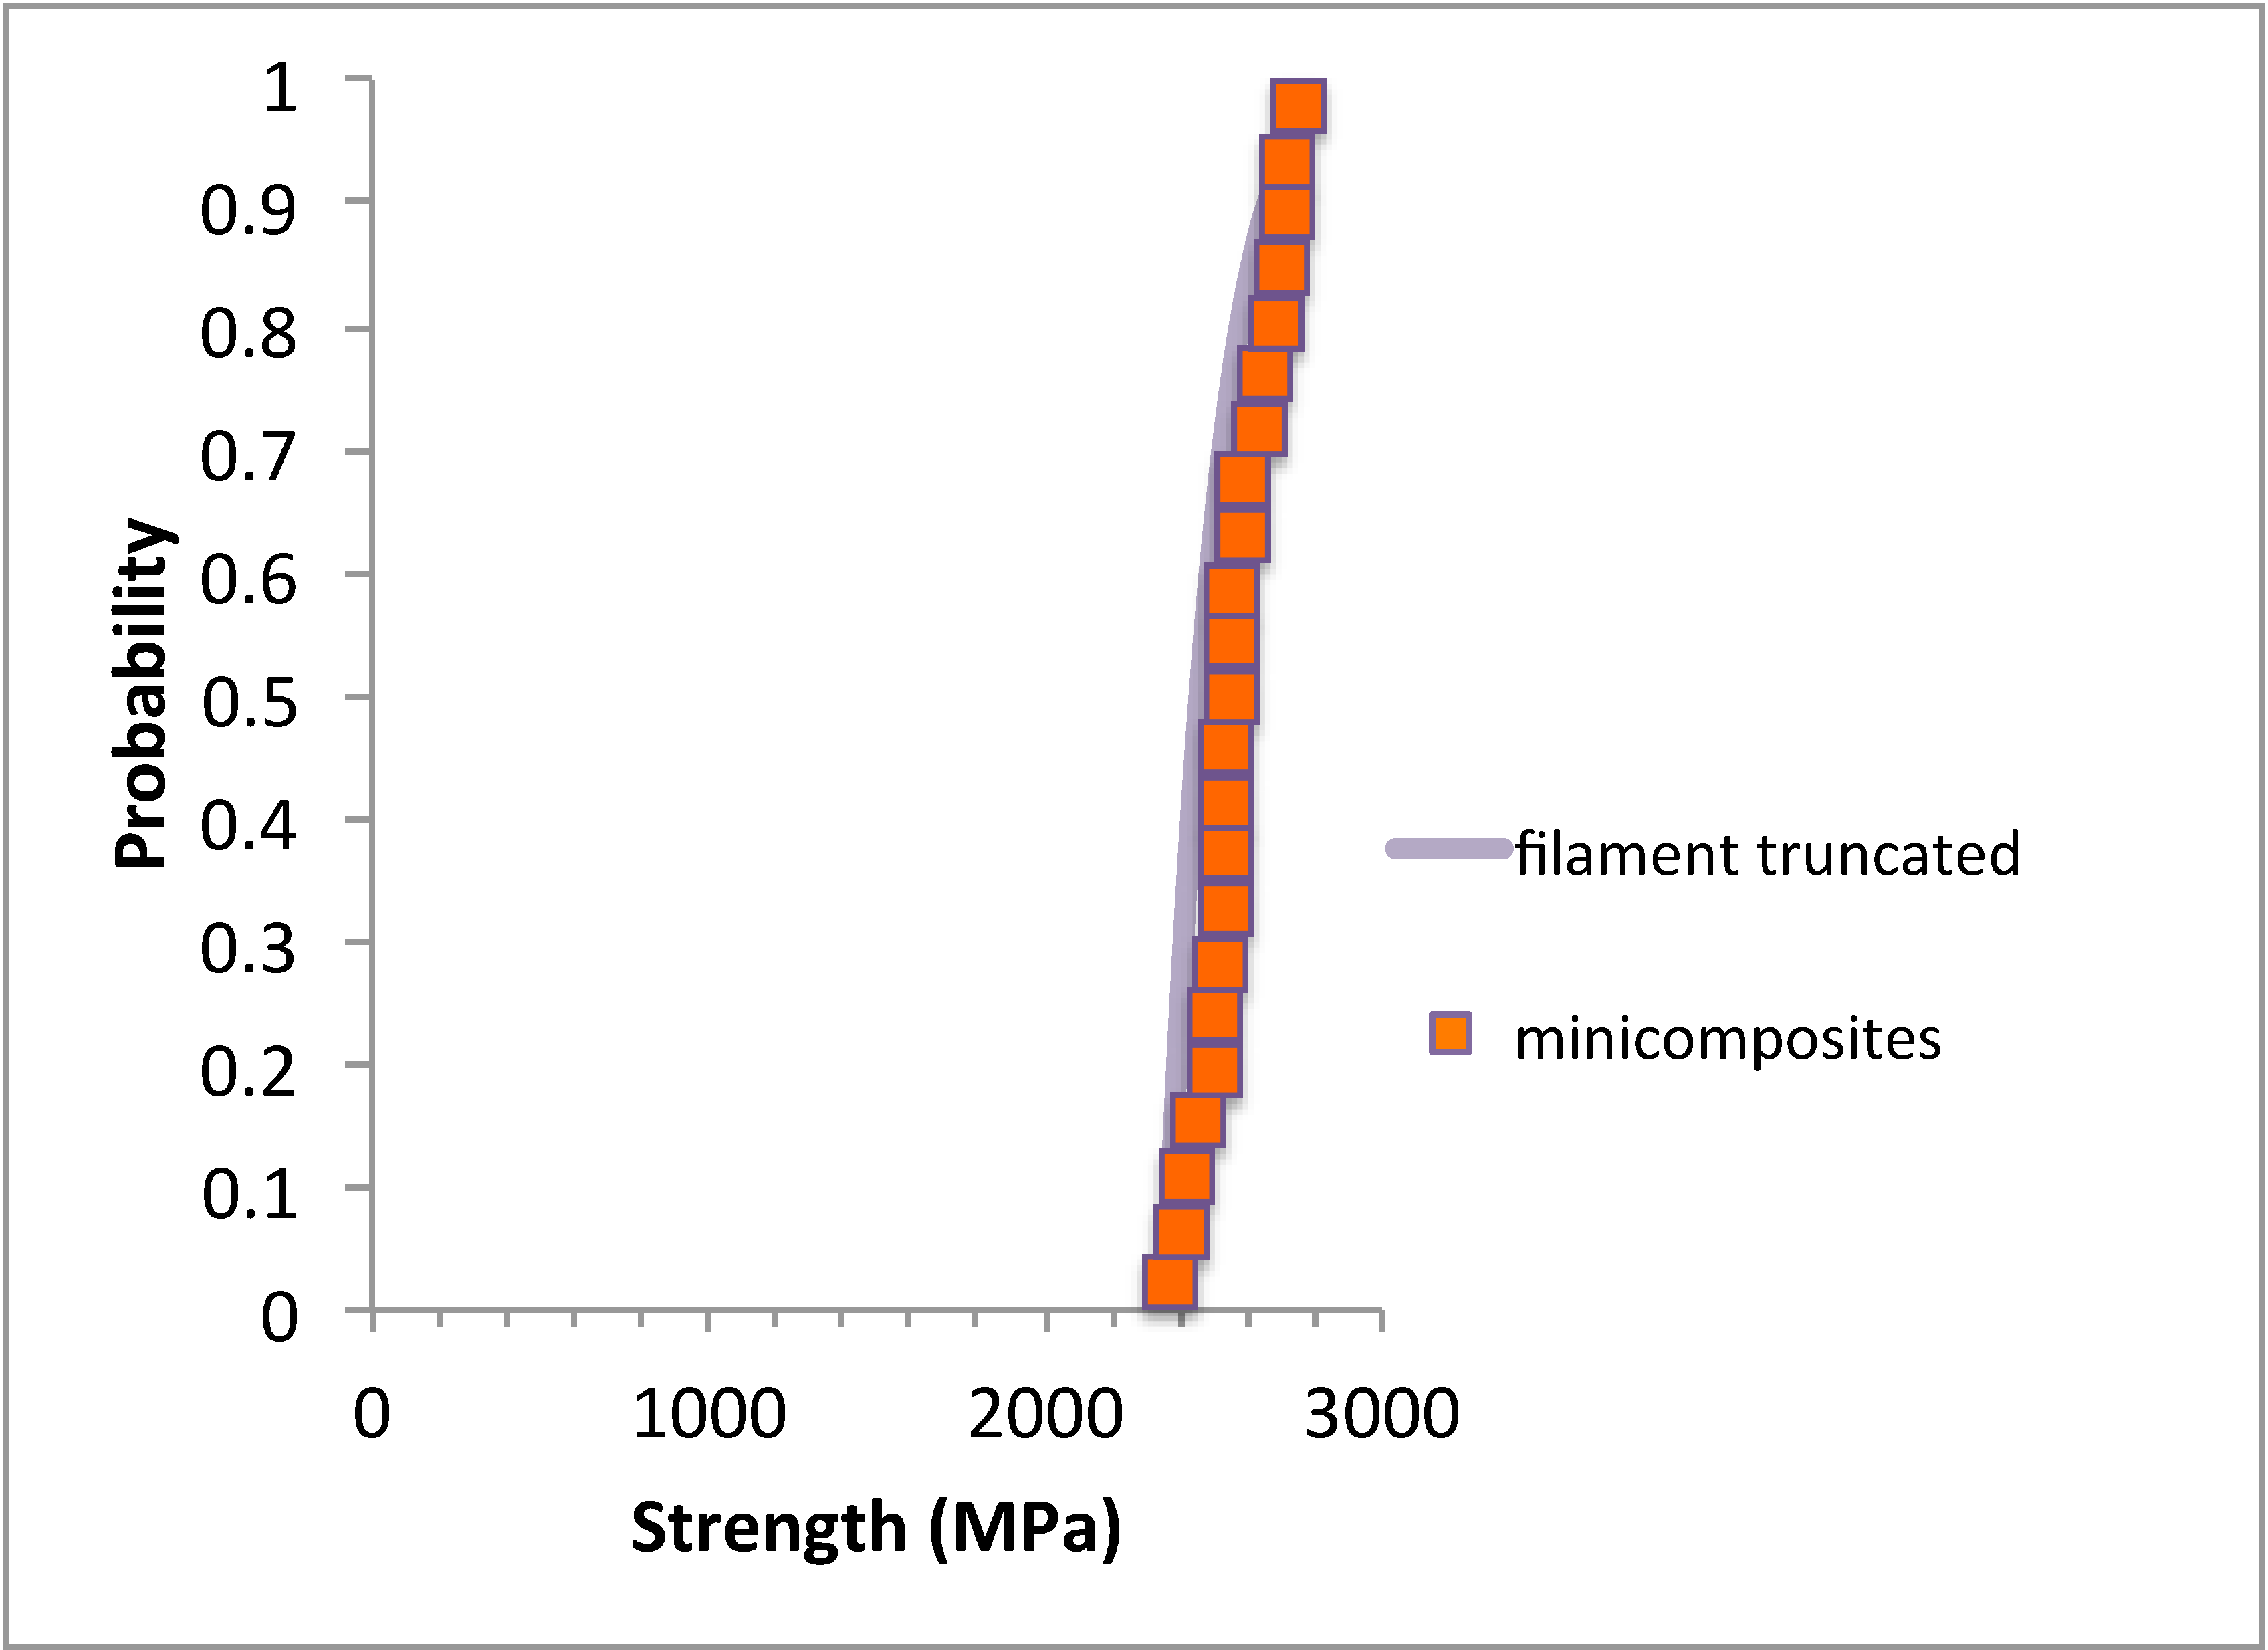
The SiC truncated cdf shows a trend similar to that shown by the truncated p-quantile diagrams (Figure 13). The coefficients of correlation also indicate a strong correlation between probability and strength data (Table 4). Note that as before, the truncated cdf is not dependent on the origin of the filament strength data: tow or single-filament testing. These discrepancies suggest a weakening from the overloading of the SiC minicomposites with respect to the underlying tows.
The cdf of alumina filament strengths was truncated at P* = 0.98, according to the results in Section 4.2. A satisfactory agreement was obtained between the minicomposite p-quantile diagram and the truncated p-quantile diagram of filament strengths (Figure 14). The truncated cdf showed a trend similar to that shown by the p-quantile diagram (Figure 15). The coefficients of correlation showed a strong correlation of p-quantiles and probabilities with the filament strengths (Table 4). This suggests that the ultimate failure of the alumina minicomposites was caused by a critical filament that was probably the strongest one. It may be thought that the stress concentration at the vicinity of the broken fiber ends was limited.

5.4. I-Plets

According to theory [35,43,45], the ratios of the Weibull moduli of the minicomposites and filaments gave the following sizes of possible critical i*-plets (or the size of fiber clusters): i* = 4 for SiC- and i* = 6 for alumina-reinforced minicomposites (Table 2 and Table 3). However, the concept of i-plet implicitly assumes that there is overloading resulting from the local sharing of the force carried by the fiber that broke. This assumption is valid under load-controlled conditions, but not under strain-controlled conditions that cause relief of the load operating on the filaments. However, other sources of overloading can be anticipated: first, a sudden release of elastic energy when a fiber breaks that would generate severe transient stresses ([39] and ref therein) and dynamic stress concentration [52]; and second, the local interfiber and fiber/matrix interaction or friction. This latter phenomenon is realistic, as shown by the premature failure of the dry tows tested without lubricant under strain-controlled conditions in Figure 10. Furthermore, it might be enhanced by the variability in SiC filament diameters that was pointed out earlier in the paper. Identifying the detailed mechanisms that govern this particular mode of loading requires further investigation.
Assuming the presence of overloading under strain-controlled conditions, various possible modes of premature failure are discussed in the following sections.

5.5. Filament Strength Gradient

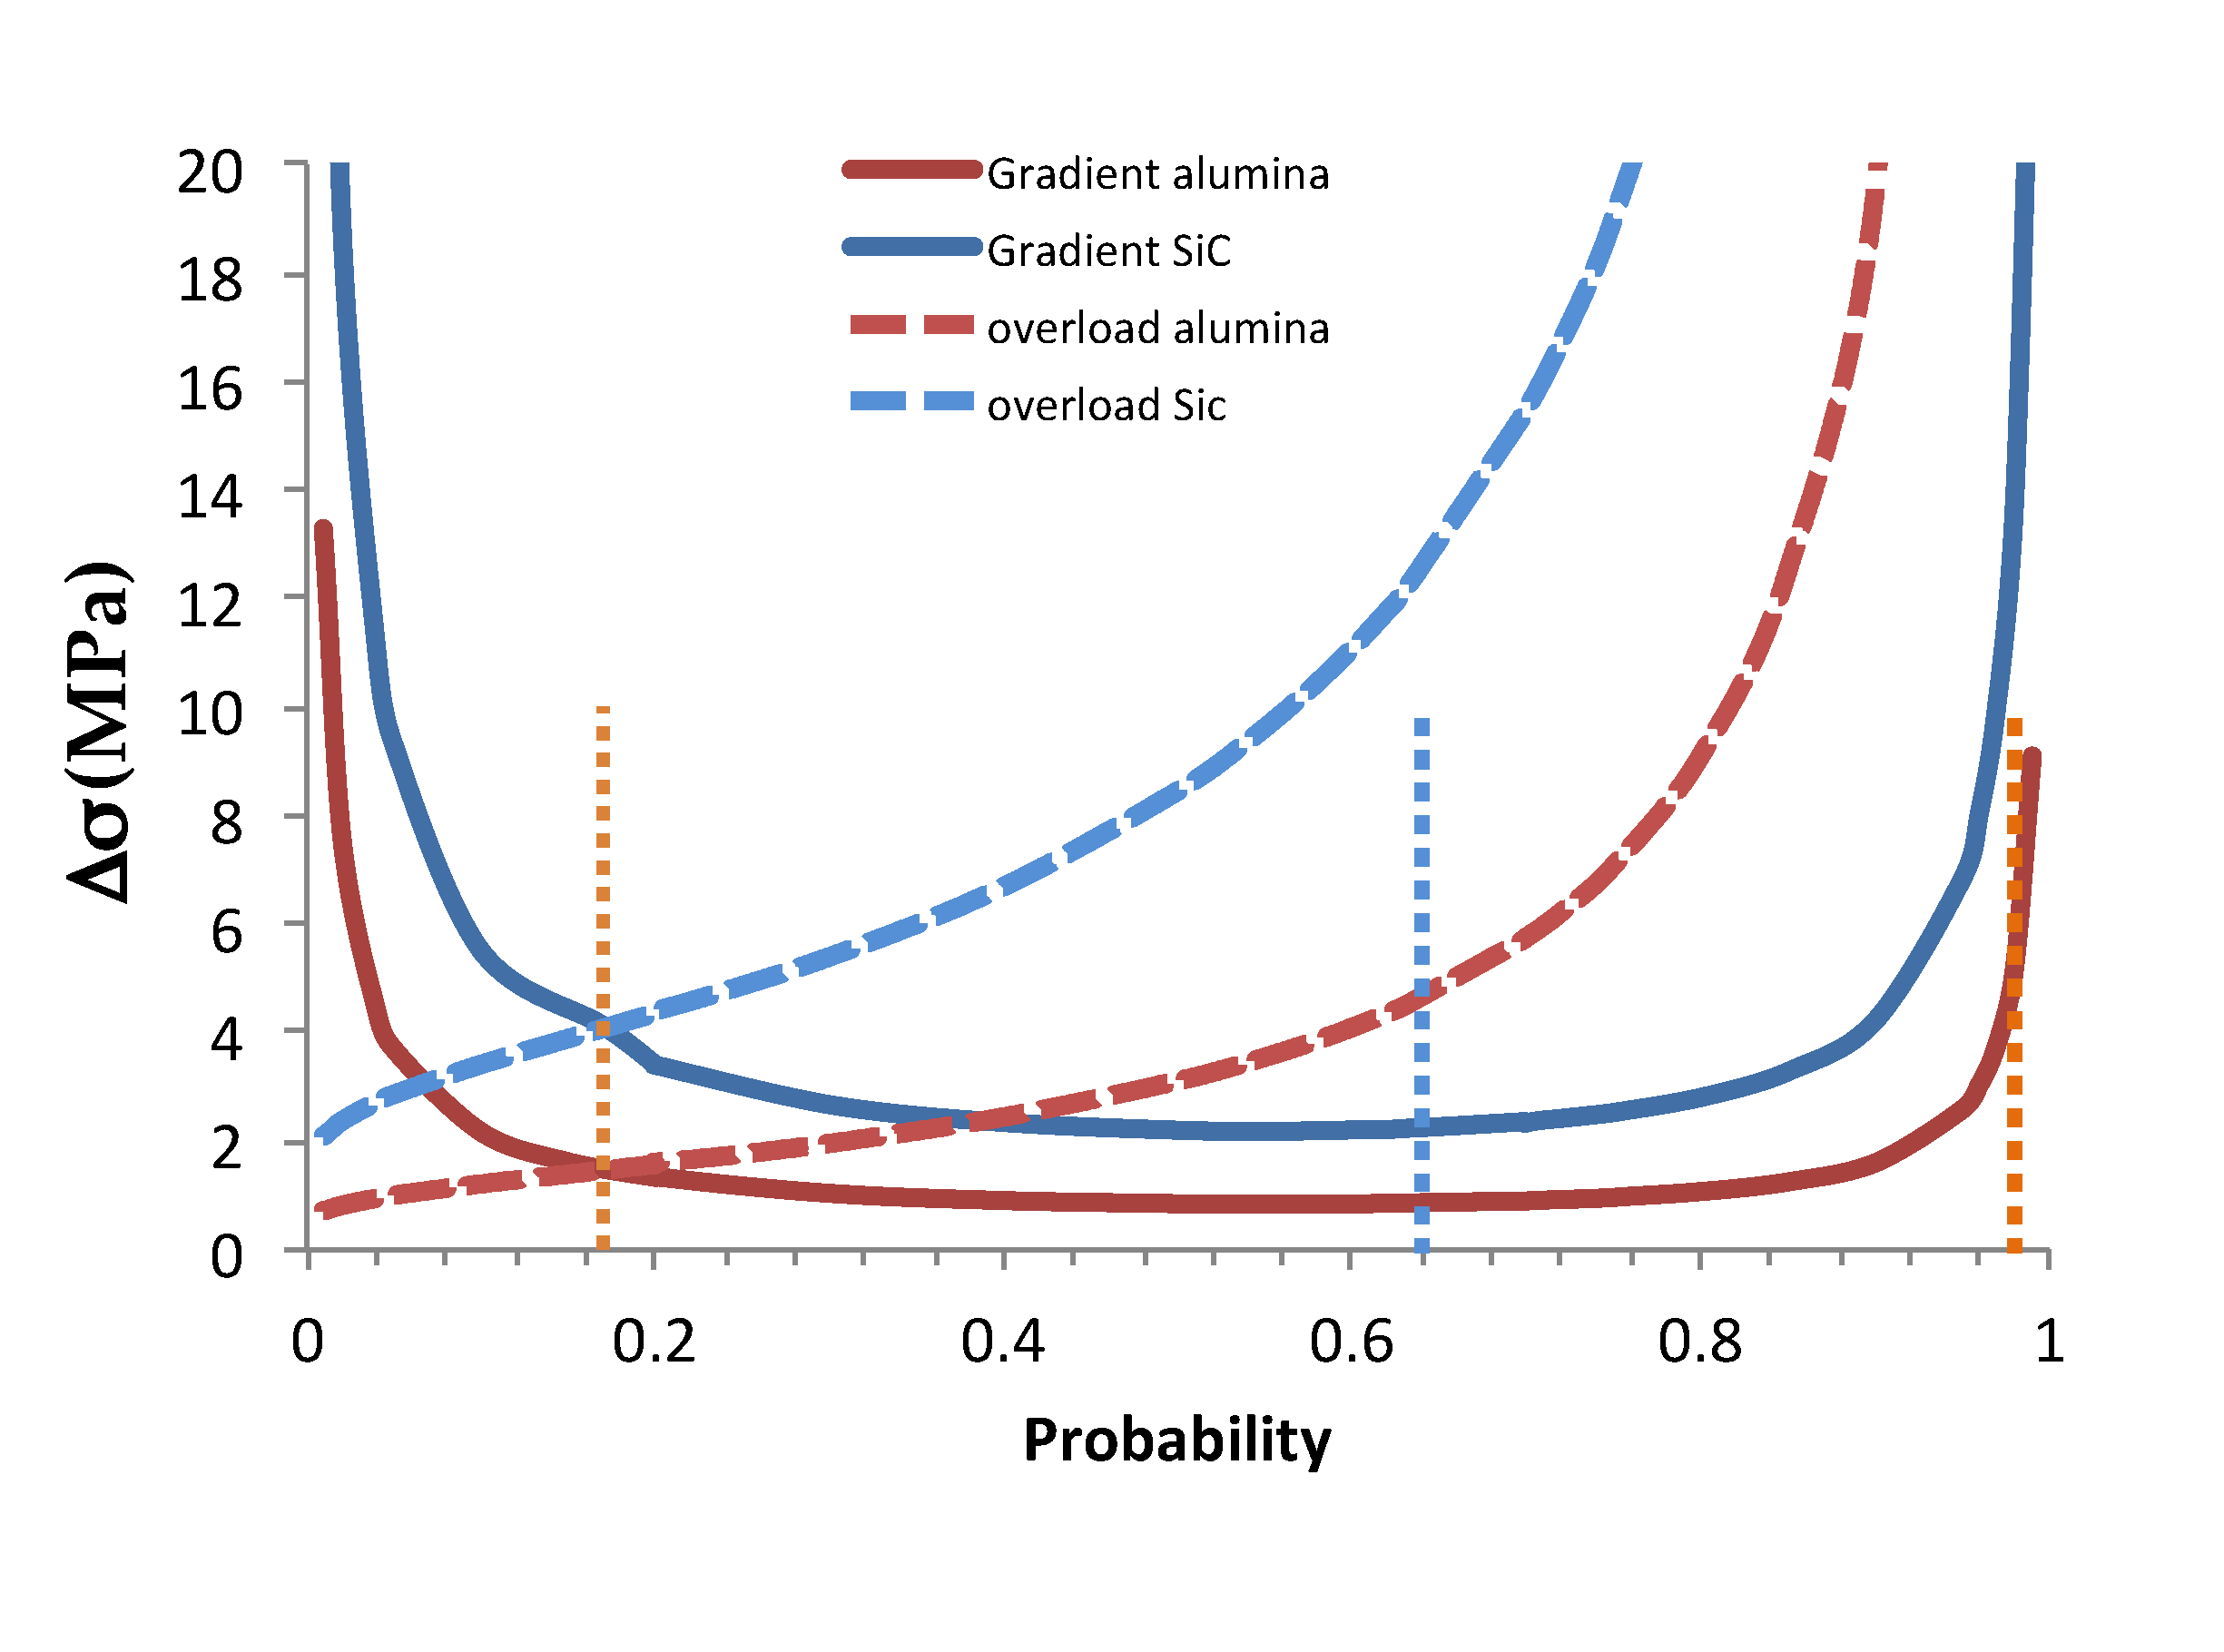
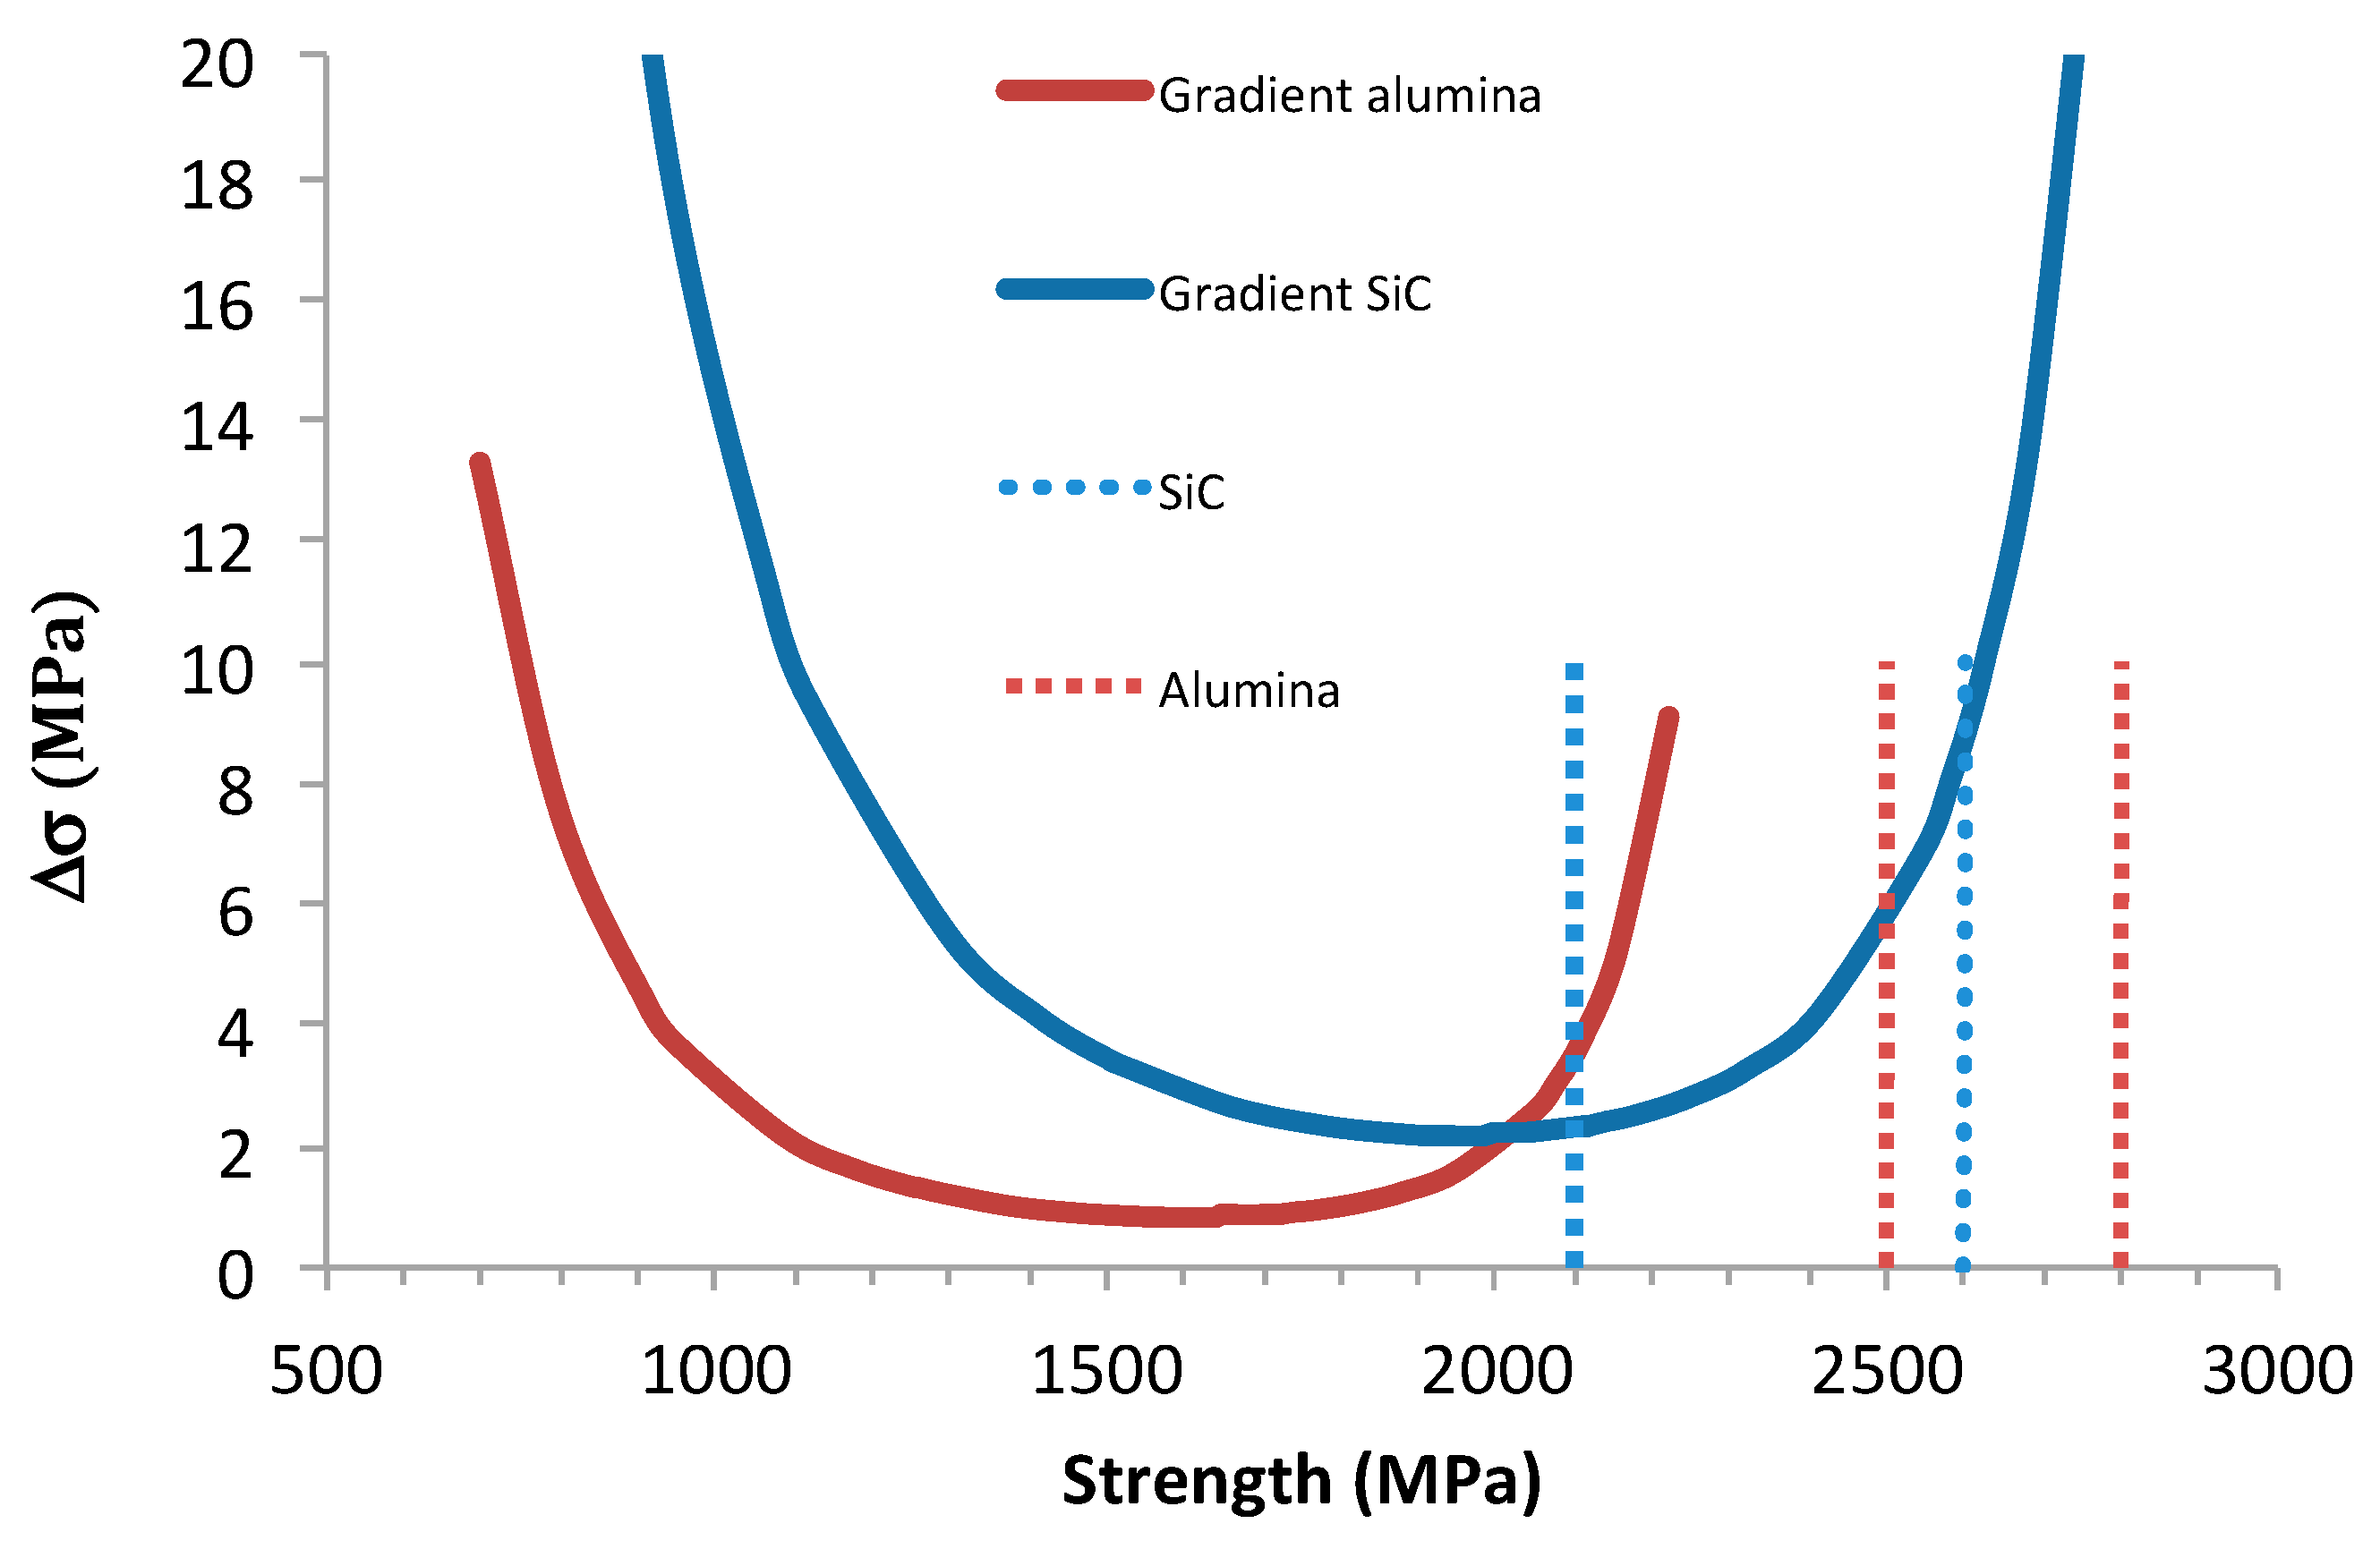
Figure 16 shows that Δσ was quite small over a wide range of filament probabilities (0.2 < P < 0.8) and strengths: Δσ < 2 MPa for alumina and 4 MPa for SiC, depending on the number of filaments in the tow. The failure of minicomposites did not occur at the filament probability Pf < 0.64. A few SiC-reinforced minicomposites failed when Δσ was minimal, i.e., when the sensitivity to overloading was maximal. By contrast, it should be noted that the alumina-reinforced minicomposites did not fail in the domain when Δσ is minimal, although Δσ was smaller than that for SiC. They failed instead at a larger Δσ, at the filament probability Pf ≥ 0.98. This indicates that during the tensile test under controlled deformation, no sufficient load increase occurred that would cause the failure of several fibers that would trigger the ultimate failure of the alumina-reinforced minicomposites. By contrast, the results indicate that overstressing may contribute to the premature ultimate failure of the SiC minicomposites at a filament probability p > 0.64, which may agree with the i-plet concept and associated stress concentration. The results are consistent with the previous ones on truncated filament strength distributions. Usually, under strain-controlled loading conditions, there is theoretically no reloading when a fiber fails. However, transient stresses more severe than that calculated for stable static conditions ([39] and ref therein) may operate due to the sudden release of elastic energy when a fiber breaks.
The issue of filament fragmentation may be raised. One may think that it was not significant in the stable regime of damage since the strength of the broken fibers is increased by the scale effect. However, if it operated, it may be thought that it would not affect the mode of ultimate failure.
It is worth pointing out again the significance of the loading condition. Under force-controlled conditions, Figure 11 shows that the overload caused by the fracture of the critical filament is sufficient to cause the premature failure of a dry tow. When global load-sharing conditions prevail, the ultimate failure of a SiC tow occurs when Δσ = 3.72 MPa. This is obtained when dσa/dP > dσ/dP, for p = 0.17 (Equation (15)). At this stage, overstressing is applied on all the fibers. From these results, it can be inferred that under force-controlled conditions, weakened behavior can be expected for the minicomposites in the absence of a filament cluster.

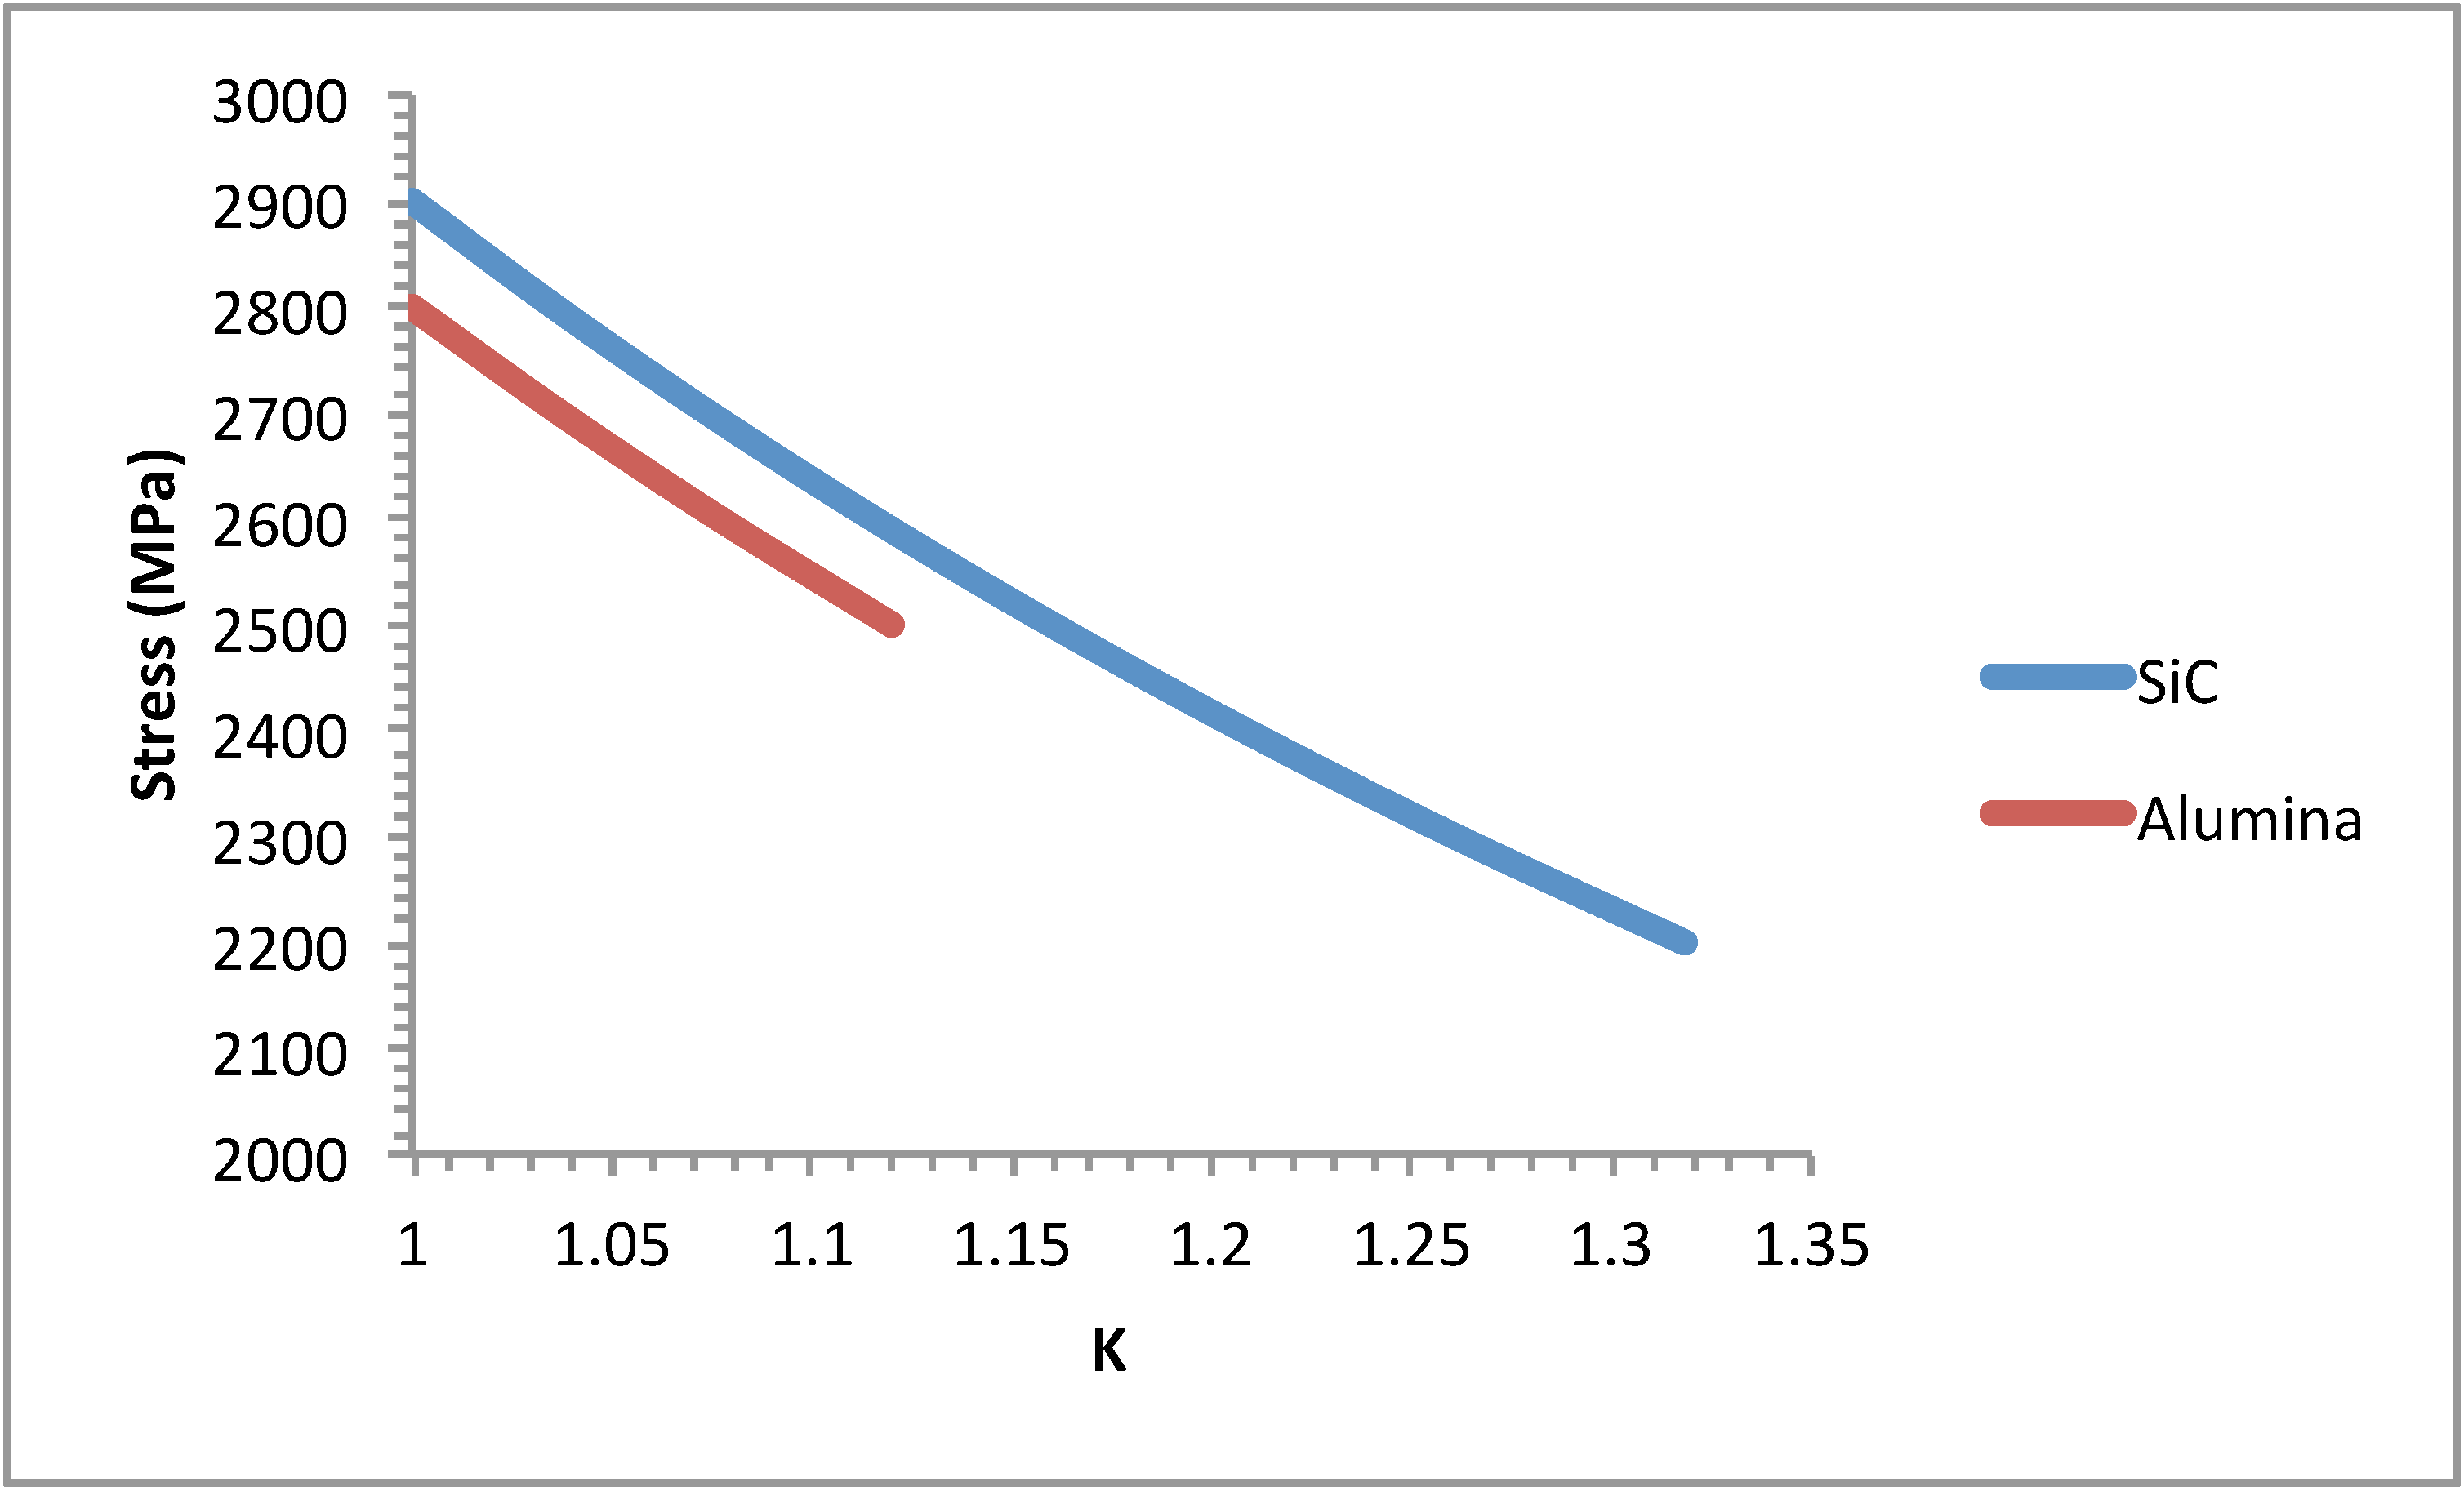
5.6. Stress Concentration under Strain-Controlled Conditions

If the presence of broken fibers and clusters induced a stress concentration, the value of the critical stress concentration factor required for the failure of any remaining intact fibers can be expressed as:
K c = σ m a x σ a = σ a + Δ σ σ a
where σmax is the highest extreme of filament strength distribution and σa is the stress operating on the filaments. Failure would occur when the local stress exceeds the highest filament strength, since this local stress would exceed the strength of any adjacent filament. Therefore, the failure of any adjacent filament would be able to trigger ultimate failure.
Figure 17 shows critical stress concentration factors between 1.005 and 1.29 for the SiC-reinforced minicomposites, and 1.007 < Kc < 1.12 for the alumina-reinforced minicomposites. The dependence of Kc on stress agrees with a logical expectation of a higher Kc at a lower stress to reach σmax. Failure would occur when the stress concentration factor induced by the broken filaments (Kq) exceeds Kc. This range of Kc is significantly smaller than most of the values of Kq calculated using various models in the literature [46]. Wagner calculated milder values when taking into account the effect of both material and geometrical parameters that compare with the current Kc values. This suggests that ultimate failure would be caused by a cluster of broken filaments. However, the origin of the overload and the proper calculation of the induced stress concentration factor under strain-controlled condition remain an issue.
Furthermore, the smaller value of Kc for alumina-reinforced minicomposites indicates that these minicomposites would be less resistant to the stress concentration in the presence of the cluster of broken filaments when compared to SiC-reinforced minicomposites. This is not consistent with the higher value of Pf > 0.98 for alumina-reinforced minicomposites, and the respective ranges of minicomposite strengths: 2200–2600 MPa for SiC-reinforced minicomposites < 2500–2800 MPa for alumina-reinforced minicomposites (Figure 16).

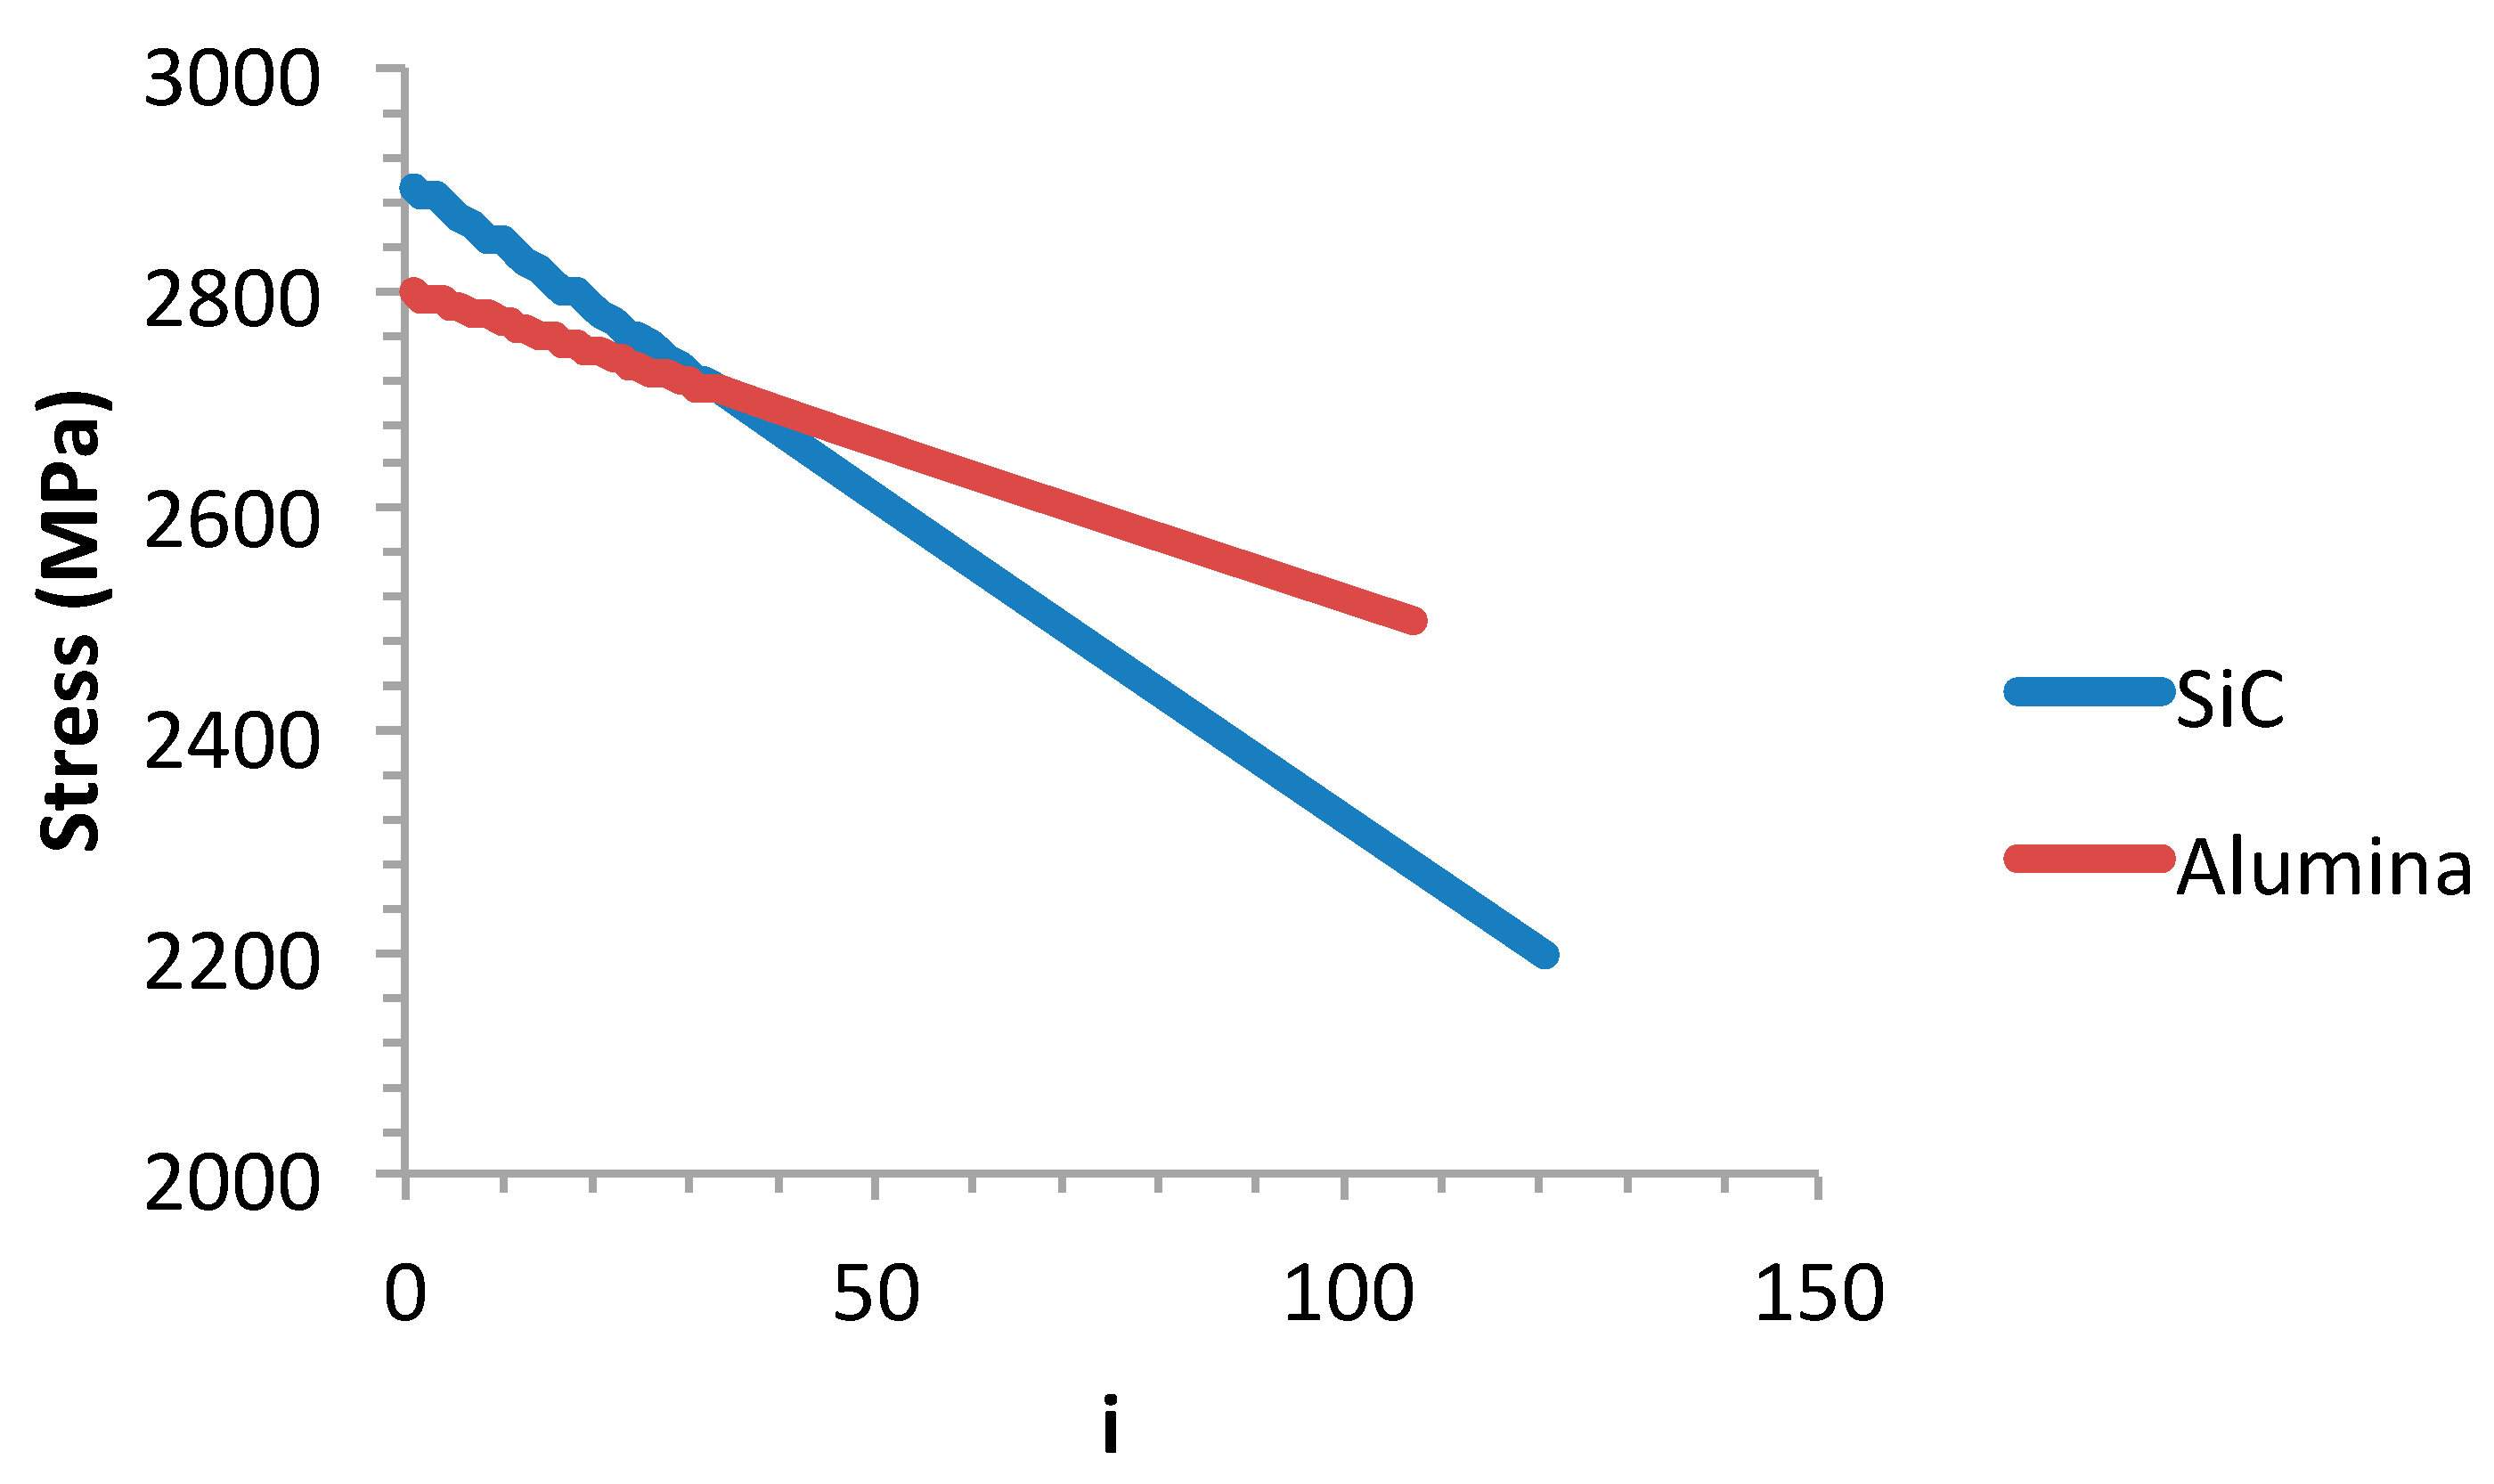
5.7. Stress Concentration by the Reduction in Section

Stress concentration may be induced by the presence of several broken fibers not necessarily as a cluster, but with the fracture located in the same section plane. The stress concentration factor resulting from the reduction in the load-carrying section is given by the following equation:
K c s = N 0 N 0 i
where i is the number of filaments broken in the same section plane.
Figure 18 shows the relation between the applied stress at the failure and the number of broken filaments:
σ a = σ m a x K c s
It appears that more than 100 filaments broken in the same section plane are required to generate the ultimate failure at 2600 MPa for alumina-reinforced minicomposites and 2200 MPa for SiC-reinforced minicomposites. This phenomenon may be regarded as realistic, as this critical number of filaments is smaller than the number of filaments broken at the ultimate failure initiation: more than 320 and 980, respectively, in the SiC- and the alumina-reinforced minicomposites, which can occur under strain-controlled conditions. It can be noted in Figure 18 that a single cluster of four or six filaments can cause failure only at very high stresses close to 2800–2900 MPa that exceed the maximum strengths of the minicomposites (shown on Figure 12). Thus, clusters of four or six filaments are not able to induce failure by the process of stress concentration through the reduction in the minicomposite sectional area.

5.8. Variability in the Results of SiC- and Alumina- Reinforced Minicomposites

The values of smaller predicted critical i-plets and premature failure stresses against the higher stress concentration factor Kc for the SiC-reinforced minicomposites is not consistent when comparing with alumina-reinforced minicomposites. Thus, both minicomposites possessed the same matrix type and fibers in the same range of strengths and elastic modulus. However, alumina-reinforced minicomposites contained more fibers than the SiC-reinforced minicomposites: 1000 against 500. Furthermore, the SiC filaments displayed wide variability of the average dimeter (reflected by the values of standard deviation and coefficient of variation in Table 1) and also of the diameter along the fiber axis [48], which may affect microstructure and enhance the presence of imperfections such as fiber contact points and interactions. Furthermore, good adhesion to resins is a feature claimed for this alumina fiber type.
Note that the critical i*-plets would probably have a constant size, according to the unimodal linearity of the p-quantile diagrams. The variability in the stress concentration factor Kq may be a source of minicomposite strength variability. The influence of various parameters on the stress concentration factor Kq has been discussed in the literature, including ineffective length, fiber-packing arrangement, geometrical parameters (such as longitudinal distance from break, fiber content, interfibre spacing [46]) and material properties (Ef/Em, Gm/Ef) [46].

6. Conclusions

A significant difference in the failure of SiC- and alumina-reinforced minicomposites was observed. A bundle of arguments supported that most of the SiC-reinforced minicomposites experienced premature failure due to microstructure imperfections, including the possible weaker adhesion of the matrix to the fibers and the diffuse interactions of the fibers and the matrix that may be related to the variability in filament diameter. The alumina-reinforced minicomposites experienced a stable failure mode until the ultimate failure from the strongest filament. The effect of the stress concentration induced by the reduction in the section resulting from the fracture of a hundred filaments in the same section plane is a possible alternative fracture origin under strain-controlled loading conditions.
The linearity of the p-quantile diagrams shows that the strength of the filaments and minicomposites is a Gaussian variable. The normal cumulative distribution of the strengths was then well fitted by the Weibull distribution function. This approach, based on p-quantile diagrams for the assessment of the normal distribution and comparison of the Weibull distribution to the normal distribution, allowed for the assessment of the Weibull model. These results open new perspectives for the analysis of reliability of composite structures. This issue is the topic of future work.
The results question the contribution of critical i-plets to the ultimate failure of epoxy matrix minicomposites under strain-controlled conditions of loading. The severity of the i-plets is measured by a stress concentration factor that results from the size of the critical cluster of broken filaments from the filament packing arrangement and essentially the presence of the extra tensile load on adjacent fibers. The tensile behavior of the underlying fiber tow indicates that ultimate failure is dictated by the strongest filament under strain-controlled conditions and the failure of a critical filament that causes instability by load-sharing under force-controlled conditions of loading.
Under the strain-controlled conditions described in the present paper, overloading from the failure of a filament was not realistic according to fracture mechanics, and was not supported by the behavior of the underlying filament tow. The analysis indicates that the behavior of minicomposites is theoretically governed by the behavior of the underlying tow, in the absence of an artefact. The presence of an artefact is responsible for premature fracture. Force-controlled conditions are also expected to cause premature fracture, depending on the sharing of the force carried by the breaking filament. This issue can be investigated using tests carried out under force-controlled conditions. However, it should be pointed out that in most tests and applications, the specimens and components are essentially subjected to strain-controlled conditions. Therefore, the issue of the loading mode is of primary significance for the analysis, modeling and prediction of the fracture for epoxy matrix composites.
The issue of loading conditions (strain- versus stress-controlled) appears to be an original feature of epoxy matrix composites. A weaker strength can be expected under load-controlled conditions when compared to strain-controlled conditions. The filament strength gradient determines the premature failure of the dry tows under controlled load conditions, and of ceramic matrix composites under strain-controlled loading conditions.
The ultimate failure of epoxy composites is governed by the reinforcing multifilament tows, and its variability involves the erratic contribution of several parameters.

Author Contributions

Conceptualization, J.L. and M.R.; methodology, J.L. and M.R.; investigation, J.L. and M.R.; resources, J.L. and M.R.; writing—original draft preparation, J.L. and M.R.; writing—review and editing, J.L. and M.R. All authors have read and agreed to the published version of the manuscript.

Funding

This research received no external funding.

Data Availability Statement

The data may be shared upon request.

Conflicts of Interest

The authors declare no conflict of interest.

References

  1. Talreja, R. Assessment of the fundamentals of failure theories for composite materials. Compos. Sci. Technol. 2014, 105, 190–201. [Google Scholar] [CrossRef]
  2. Bunsell, A.; Gorbatikh, L.; Morton, H.; Pimenta, S.; Sinclair, I.; Spearing, M.; Swolfs, Y.; Thionnet, A. Benchmarking of strength models for unidirectional composites under longitudinal tension. 2018 Compos. Part A Appl. Sci. Manuf. 2018, 111, 138–150. [Google Scholar] [CrossRef] [Green Version]
  3. Tavares, R.P.; Guerrero, J.M.; Otero, F.; Turon, A.; Mayugo, J.A.; Costa, J.; Camanho, P. Effects of local stress fields around broken fibres on the longitudinal failure of composite materials. Int. J. Solids Struct. 2019, 156–157, 294–305. [Google Scholar] [CrossRef]
  4. Weibull, W.A. statistical distribution function of wide applicability. J. Appl. Mech. 1951, 18, 293–297. [Google Scholar] [CrossRef]
  5. Freudenthal, A. Chapter 6. In Fracture; Liebowitz, H., Ed.; Academic Press: New York, NY, USA, 1968; Volume II. [Google Scholar]
  6. Gumbel, E. Statistics of Extremes; Columbia University Press: New York, NY, USA, 1968. [Google Scholar]
  7. De Jayatilaka, A.S.; Trustrum, K. Statistical approach to brittle fracture. J. Mat. Sc. 1977, 10, 1426–1430. [Google Scholar] [CrossRef]
  8. Argon, A.S.; McClintock, F.A. Mechanical Behavior of Materials; Addison-Wesley: Reading, MA, USA, 1966. [Google Scholar]
  9. Batdorf, S.B.; Crose, J.G. A statistical theory for the fracture of brittle structures subjected to nonuniform polyaxial stresses. J. Appl. Mech. Trans. ASME 1974, 41, 459–464. [Google Scholar] [CrossRef]
  10. Lamon, J. Ceramics reliability: Statistical analysis of multiaxial failure using the Weibull approach and the Multiaxial Elemental Strength Model. J. Am. Ceram. Soc. 1990, 73, 2204–2212. [Google Scholar] [CrossRef]
  11. Lamon, J.; Evans, A.G. Statistical Analysis of Bending Strengths for Brittle Solids: A Multiaxial Fracture Problem. J. Am. Ceram. Soc. 1993, 66, 177–182. [Google Scholar] [CrossRef]
  12. Lamon, J. Statistical approaches to failure for ceramic reliability assessment. J. Am. Ceram. Soc. 1998, 71, 106–112. [Google Scholar] [CrossRef]
  13. Lamon, J. Brittle Fracture and Damage of Brittle Materials and Composites: Statistical–Probabilistic Approaches; Elsevier Ltd.: London, UK; ISTE Press Ltd.: Oxford, UK, 2016. [Google Scholar]
  14. Lu, C.; Danzer, R.; Fischer, F.D. Fracture statistics of brittle materials: Weibull or normal distribution. Phys. Rev. E 2002, 65, 067102. [Google Scholar] [CrossRef] [Green Version]
  15. Lamon, J.; R’Mili, M. Investigation of flaw strength distributions from tensile force-strain curves of fiber tows. Compos. Part A 2021, 145, 106262. [Google Scholar] [CrossRef]
  16. Peirce, F.T. Tensile Tests for Cotton Yarns-“The Weakest Link”. J. Textile Inst. Trans. 1926, 17, 355–368. [Google Scholar]
  17. Sakai, T. Effect of Yarn Length on Tensile Strength and Its Distribution. Ph.D. Thesis, Georgia Institute of Technology, Atlanta, GA, USA, November 1970. [Google Scholar]
  18. R’Mili, M.; Godin, N.; Lamon, J. Flaw strength distributions and statistical parameters for ceramic fibres: The Normal distribution. Phys. Rev. E 2012, 85, 1106–1112. [Google Scholar]
  19. Lamon, M.; R’Mili, M. Investigation of specimen size effects on p-quantile diagrams and normal distributions of critical flaw strengths in fiber tows. J. Compos. Sci. 2022, 6, 171. [Google Scholar] [CrossRef]
  20. Foray, G.; Descamps-Mandine, A.; R’Mili, M.; Lamon, J. Statistical flaw strength distributions for glass fibres: Correlation between bundle test and AFM-derived flaw size density functions. Acta Mater. 2012, 60, 3711–3718. [Google Scholar] [CrossRef]
  21. Lamon, J.; R’Mili, M.; Reveron, H. Investigation of statistical distributions of fracture strengths for flax fibre using the tow-based approach. J. Mat. Sci. 2016, 51, 8687–8698. [Google Scholar] [CrossRef]
  22. Gong, J. A new probability index for estimating Weibull modulus for ceramics with least square method. J. Mater. Sci. Lett. 2000, 19, 827–829. [Google Scholar] [CrossRef]
  23. Barnett, V. Probability plotting methods and order statistics. J. R. Statist. Soc. 1975, C24, 95–108. [Google Scholar] [CrossRef]
  24. Watson, A.S.; Smith, R.L. An examination of statistical theories for fibrous materials in the light of experimental data. J. Mater. Sci. 1985, 20, 3260–3270. [Google Scholar] [CrossRef]
  25. Paramonov, Y.; Andersons, J. A family of weakest link models for fiber strength distribution. Composites. Part A 2007, 38, 1227–1233. [Google Scholar] [CrossRef]
  26. Phani, K.K. A new modified Weibull distribution function for the evaluation of the strength of silicon carbide and alumina fibres. J. Mater. Sci. 1988, 23, 2424–2428. [Google Scholar] [CrossRef]
  27. Amaniampong, G.; Burgoyne, C.J. Statistical variability in the strength and failure strain of aramid and polyester yarns. J. Mater. Sci. 1994, 29, 5152. [Google Scholar] [CrossRef]
  28. Bergman, B. On the estimation of the Weibull modulus. J. Mater. Sci. Let. 1984, 3, 689–692. [Google Scholar] [CrossRef]
  29. R’Mili, M.; Moevus, M.; Godin, N.; Lamon, J. Statistical fracture of E-glass fibers using a bundle test and acoustic emission monitoring. Compos. Sci. Technol. 2008, 68, 1800–1808. [Google Scholar] [CrossRef] [Green Version]
  30. Chi, Z.; Chou, T.W.; Shen, G. Determination of single fiber strength distribution from fiber bundle testings. J. Mater. Sci. 1984, 19, 3319–3324. [Google Scholar] [CrossRef]
  31. R’Mili, M.; Bouchaour, T.; Merle, P. Estimation of Weibull parameters from loose bundle tests. Compos. Sci. Technol. 1996, 56, 831–834. [Google Scholar] [CrossRef]
  32. Calard, V.; Lamon, J. Failure of fibres bundles. Compos. Sci. Technol. 2004, 64, 701–710. [Google Scholar] [CrossRef]
  33. European Standard EN 1007-5; Advanced Technical Ceramics—Ceramic Composites—Methods of Test for Reinforcements Determination of Distribution of Tensile Strengths and of Tensile Strains to Failure of Filaments within a Multifilament Tow at Ambient Temperature. European Committee for Standardization: Bruxelles, Belgique, 1998.
  34. International Standard ISO 22459; Fine Ceramics (Advanced Ceramics, Advanced Technical Ceramics)—Reinforcement of Ceramic Composites—Determination of Distribution of Tensile Strength and Tensile Strain to Failure of Filaments within a Multifilament Tow at Ambient Temperature. International Organization for Standardization: Geneva, Switzerland, 2020.
  35. Bader, M.G.; Smith, R.L.; Pitkethly, M.J. Probabilistic models for hybrid composites. In Proceedings of ICCM-VI & ECCM-2; Matthews, F.L., Buskell, N.C.R., Hodgkinson, J.M., Morton, J., Eds.; Elsevier Applied Science: London, UK, 1987; pp. 5.481–5.495. [Google Scholar]
  36. Otani, H.; Phoenix, S.L.; Petrina, P. Matrix effects on lifetime statistics for carbon fiber-epoxy microcomposites in creep rupture. J. Mat. Sci. 1991, 26, 1955–1970. [Google Scholar] [CrossRef]
  37. Lissart, N.; Lamon, J. Damage and failure in ceramic matrix minicomposites: Exprimental study and model. Acta Mater. 1997, 45, 1025–1044. [Google Scholar] [CrossRef]
  38. Naslain, R.; Lamon, J.; Pailler, R.; Bourrat, X.; Guette, A.; Langlais, F. Micro/minicomposites: A useful approach to the design and development of non-oxide CMC. Compos.—Part A: Appl. Sci. 1999, 30, 537–547. [Google Scholar] [CrossRef]
  39. Bader, M.G. Tensile strength of uniaxial composites. Sci. Eng. Compos. Mater. 1988, 1, 1–11. [Google Scholar] [CrossRef]
  40. Daniels, H.E. The statistical theory of the strength of bundles of threads. I. Proc. R. Soc. Lond. 1945, A 183, 404–435. [Google Scholar]
  41. Rosen, B.W. Tensile failure of fibrous composites. AIAA J. 1964, 2, 1985–1991. [Google Scholar] [CrossRef]
  42. Zweben, C. Tensile failure of fiber composites. AIAA J. 1968, 6, 2325–2331. [Google Scholar] [CrossRef]
  43. Harlow, D.G.; Phoenix, S.L. Probability distributions for the strength of composite materials; I and II. Int. J. Fract. 1981, 17, 347–372, 601–630. [Google Scholar] [CrossRef]
  44. Smith, R.L.; Phoenix, S.L.; Greenfield, M.; Henstengurg, R.B.; Pitt, R.E. Lower-tail approximations for the probability of failure in fibrous systems with hexagonal geometry. Proc. R. Soc. 1983, A 388, 353–391. [Google Scholar]
  45. Batdorf, S.B. Tensile strength of unidirectionally reinforced composites. I. J. Reinf. Plast. Compos. 1982, 1, 153–164. [Google Scholar] [CrossRef]
  46. Wagner, H.D.; Eitan, A. Stress concentration factors in two-dimensional composites: Effects of material and geometrical parameters. Compos. Sci. Technol. 1993, 46, 353–362. [Google Scholar] [CrossRef]
  47. International Standard ISO 19630; Fine Ceramics (Advanced Ceramics, Advanced Technical Ceramics)—Methods of Test for Reinforcements—Determination of Tensile Properties of Filaments at Ambient Temperature. International Organization for Standardization: Geneva, Switzerland, 2017.
  48. Lissart, N.; Lamon, J. Statistical analysis of failure of SiC fibers in the presence of bimodal flaw populations. J. Mat. Sci. 1997, 32, 6107–6117. [Google Scholar] [CrossRef]
  49. Ikarashi, Y.; Ogasawara, T.; Okuizumi, S.; Aoki, T.; Davies, I.J.; Lamon, J. Direct comparison between monofilament and multifilament tow testing for evaluating the tensile strength distribution of SiC fibers. J. Eur. Cer. Soc. 2021, 42, 1928–1937. [Google Scholar] [CrossRef]
  50. McCartney, L.N.; Smith, R.L. Statistical theory of the strength of fiber bundles. ASME J. Appl. Mech. 1983, 105, 601–608. [Google Scholar] [CrossRef]
  51. R’Mili, M.; Lamon, J. Investigation of subcritical crack growth using load relaxation tests on fiber bundles. Acta Mater. 2011, 59, 2850–2857. [Google Scholar] [CrossRef]
  52. Bullegas, G.; Lamela, J.M.; Pimenta, S.; Pinho, S.T. On the role of dynamic stress concentrations and fracture mechanics in the longitudinal tensile failure of fiber-reinforced composites. Eng. Fract. Mech. 2020, 228, 106920. [Google Scholar] [CrossRef]
Figure 1. Device for tow and minicomposite test specimen preparation.
Jcs 07 00239 g001
Figure 2. Drawing of window-type specimen prepared for single-filament testing.
Jcs 07 00239 g002
Figure 3. p-quantile diagrams versus the strengths of the SiC single filaments determined using tests on either single filaments (this work) or dry tows [19] (derived from strains-to-failure for Ef = 180 GPa), and versus the strengths of the SiC/epoxy minicomposites.
Jcs 07 00239 g003
Figure 4. p-quantile diagrams versus the strengths of the alumina single filaments determined using tests on single filaments, and versus the strengths of the minicomposites.
Jcs 07 00239 g004
Figure 5. Micrograph showing a typical fracture surface of the minicomposite test specimen. Scale unit: 100 microns.
Jcs 07 00239 g005
Figure 6. SEM micrograph of the fracture surface of a minicomposite specimen showing the filaments with fracture mirrors and smooth fracture surfaces. The horizontal bar represents 10 microns.
Jcs 07 00239 g006
Figure 7. SiC CDF derived from the sets of experimental strengths. Pn filaments refer to the normal distribution of the strengths from the single-filament tests. Pn dry tow refers to the normal distribution of the filament strengths from tow testing. Dry-tow strength was derived using Equation (15) (discussed later). PW refers to the Weibull distribution.
Jcs 07 00239 g007
Figure 8. Alumina CDF derived from the sets of experimental strengths. Pn refers to the normal distribution of the strengths. PW refers to the Weibull distribution. Dry-tow strength was derived using Equation (15) (discussed later).
Jcs 07 00239 g008
Figure 9. Probability density functions f(σ) for the SiC and alumina filaments and minicomposites (gaussian distribution). Additionally indicated by the vertical solid lines are the strengths of the dry tows derived using Equation (15) (discussed later).
Jcs 07 00239 g009
Figure 10. Comparison of the minicomposites and reinforcing tow: typical tensile force–strain curves obtained on SiC dry tow, SiC/SiC minicomposite and SiC/epoxy minicomposites tested under a constant strain rate. Additionally shown is the behavior of a tow that experienced premature failure (referred to as SiC tow artefact). The extreme curves of the SiC/epoxy minicomposites are represented.
Jcs 07 00239 g010
Figure 11. Gradient Δσ of the filament strengths in SiC and alumina fiber tows vs. filament probability in strength distribution. Additionally shown is the stress increase on surviving fibers when filament i fails under constant force. Moreover, indicated by the vertical dotted lines are the probabilities of the critical filament under constant force for alumina and SiC fiber tows, and the values of filament probability Pf at low-strength extremes of the minicomposites.
Jcs 07 00239 g011
Figure 12. Comparison of p-quantile diagrams for the SiC/epoxy minicomposites with truncated p-quantile diagrams for the filament strengths from the tow test and tests on individual filaments.
Jcs 07 00239 g012
Figure 13. Comparison of cdf for the SiC/epoxy minicomposites with a truncated cdf derived from the distributions of the filament strengths measured on individual filaments and on tow.
Jcs 07 00239 g013
Figure 14. Comparison of p-quantile diagrams for the alumina/epoxy minicomposites with truncated p-quantile diagrams for the filament strengths.
Jcs 07 00239 g014
Figure 15. Comparison of cdf for alumina/epoxy minicomposites with a truncated cdf for the filament strengths.
Jcs 07 00239 g015
Figure 16. Gradient Δσ of filament strengths for SiC and alumina fiber tows vs. strength. Additionally indicated are the strength intervals for the minicomposites (vertical dotted lines).
Jcs 07 00239 g016
Figure 17. Critical stress concentration factors for the ultimate failure of SiC- and alumina-reinforced minicomposites.
Jcs 07 00239 g017
Figure 18. Influence of the number of broken fibers in a section plane of the minicomposites on the ultimate strength.
Jcs 07 00239 g018
Table 1. Main characteristics of fibers.
SiCAlumina
Measured filament diameter
Mean (μm)16.6318.97
Standard deviation (μm)1.980.71
Coefficient of variation (%)11.923.75
Density2.553.25
Tensile modulus (GPa)180–200210–250
Number of filaments per tow5001000
Measured tow cross-sectional area
Mean (mm2)0.08090.2003
Standard deviation (mm2)0.00150.0024
Coefficient of variation (%)1.891.22
Table 2. Characteristics of SiC filaments and SiC epoxy minicomposites derived from tensile tests.
Minicomposites Filaments 1 Filaments 2
Young’s Modulus (GPa)180
Mean strength (MPa)251218692080
Strength standard deviation (MPa) 134455432
m22.54.95.72
i* = mm/mf4--
σl (MPa)257720362250
αc (%)--0.16
Pf-0.80.64
Coeff. correlation
p-quantile vs. strength0.970.960.998
Pn vs. PW0.990.970.999
Pn vs. strength0.990.970.980
1 Tests on single filaments. 2 Tow testing.
Table 3. Characteristics of the alumina filaments and alumina epoxy minicomposites derived from tensile tests.
MinicompositesFilaments
Young’s Modulus (GPa)260
Mean strength (MPa)25661606
Strength standard deviation (MPa) 105366
m29.45.3
i* = mm/mf5.6-
σl (MPa)26181665
αc (%)-0.17
Pf-0.98
Correlation coefficient
p-quantile vs. strength
0.986 0.986
Correlation coefficient
Pn vs. PW
0.99 0.97
Correlation coefficient
Pn vs. strength
0.98 0.98
Table 4. Correlation coefficients for truncated p-quantile diagrams and cumulative distributions of filament strengths. Additioanlly given is the truncation probability P*.
P* Corrrelation Coefficient
p-Quantile vs. Strength
Correlation Coefficient
Pt Strength
SiCfilaments from the tow test0.640.980.97
SiCindividual filaments0.80.990.98
Aluminaindividual filaments0.980.960.95
Disclaimer/Publisher’s Note: The statements, opinions and data contained in all publications are solely those of the individual author(s) and contributor(s) and not of MDPI and/or the editor(s). MDPI and/or the editor(s) disclaim responsibility for any injury to people or property resulting from any ideas, methods, instructions or products referred to in the content.

