Article

Effect of Roller Pressure and Base Prepreg Layer on Tensile and Flexural Properties of CFRP Laminates Fabricated Using Automated Fiber Placement

by
Eldho Mathew
* and
Sunil Chandrakant Joshi
*
School of Mechanical & Aerospace Engineering, Nanyang Technological University, Singapore 639 798, Singapore
*
Authors to whom correspondence should be addressed.
J. Compos. Sci. 2023, 7(3), 101; https://doi.org/10.3390/jcs7030101
Submission received: 14 February 2023 / Revised: 28 February 2023 / Accepted: 6 March 2023 / Published: 7 March 2023
(This article belongs to the Special Issue Feature Papers in Journal of Composites Science in 2023)

Abstract

:
Composites can be manufactured in numerous ways. Among the available methods, Automated Fiber Placement (AFP) is the most advanced and latest technology utilized by companies for aerospace and other projects. Although it offers many benefits, it has unique manufacturing challenges and quality issues. The presence of tow placement defects such as tow gaps, tow overlaps, twisted tows, incomplete tows, and missing tows in the AFP process are causes for concern as these lead to a decrease in the mechanical performance of the fabricated parts. Although it is not possible to completely avoid the occurrence of defects, optimizing key process parameters is a possible way to minimize them. Roller pressure is one such parameter. If it is too high, it can lead to wider and thinner tows and if it is too low, the towpreg may not stick properly to the substrate and hence, not conform to curvatures. In this work, test layups of different configurations using carbon (T700SC-24K-50C) towpreg with epoxy (UF 3376-100) as the matrix system were prepared at different compaction roller pressures (2 bar, 3.5 bar, and 5 bar), with and without the presence of base prepreg layers. Tensile and bending tests were respectively carried out according to ASTM D3039 and ASTM D7264 to study the effects of these process parameters on the layup defects. From the test results, it is found that using a compaction roller pressure of 3.5 bar and a base prepreg layer of the same material as the towpreg, leads to minimum defects, and hence, to the best tensile and bending properties.

1. Introduction

Composite materials are widely used in aerospace and other sectors including automotive, marine, sports, etc., primarily owing to their ability to be tailored according to the user’s requirements and the future is expected to see an increase in demand. They are lighter than metallic materials, possess better specific mechanical properties, and provide excellent resistance against fatigue and corrosion. They also offer unique challenges. Since the associated material costs are high, choosing a suitable manufacturing technique is of paramount importance [1,2,3,4]. There are numerous methods currently employed to manufacture composites. While the specific method to be selected depends largely on the material system, traditional manufacturing techniques such as vacuum bag molding, compression molding, pultrusion, filament winding, and resin transfer molding are widely used. Although these techniques are preferred, they often are labor-intensive. With the advancement of robotics and the software industry, newer techniques such as Automated Tape Layup (ATL) and Automated Fiber Placement (AFP) have gained more popularity, with the latter particularly suited for generating structures having curved geometries. However, these techniques are not yet mature. There is a lot of scope for improvement, especially in terms of product quality, reliability, and integrity [1,2,5,6,7,8,9,10,11,12,13,14,15].
AFP offers numerous advantages over traditional manufacturing methods, including customization of layers, the orientation of tows within and between different layers, hybridization opportunities, lesser material wastage, repeatability, time savings, etc. The method also comes with certain drawbacks. During the AFP process, it is vital to control process variables such as tow tension, heating temperature, and roller pressure to ensure the quality of the final part. However, the fabrication of parts with complicated shapes and curvilinear fiber paths would still result in an unwanted mismatch in the tow boundaries. This can lead to the introduction of tow gaps or overlaps, or both [16,17,18,19,20,21]. Although this can be minimized with the help of fiber placement software, it cannot be completely avoided. On top of this, gaps and overlaps would occur randomly during the tow placement process, mainly owing to the tolerances of the placement head and the towpreg. Previous works in the field of AFP have showcased the significant role played by tow uniformity and tow gaps, as well as interface characteristics on the overall quality of the cured composite parts [8,22,23]. Buckling, pull-up, and lack of alignment of tows to the set path are all demerits of the process. Some of the common defects associated with AFP like tow gaps, tow overlaps, missing and incomplete tows, and tow pull-up are depicted in Figure 1. In addition to this, the tows which are placed may be twisted due to improper storage of the towpreg rolls or during shipping. Also, tows may be missing in a few locations during the placement process [8,16,24,25,26,27]. Integrity between the placed tows, joining, alignment, and lifting of tows, tow gaps, overlaps, twisting, and missing tows, all offer unique challenges, hampering the potential of the process [6,8,25,28].
Figure 2 depicts some of the effects of these shortcomings on various properties, including strengths in tension, compression, in-plane shear, and open-hole tension and compression. Gaps and overlaps were induced respectively by taking away and adding two tows (tow width of 5 mm) directly above each other. Half gap or overlap was induced by taking away two tows (tow width of 5 mm) and adjusting them by half tow width. All the defects were inserted in the middle layer of the respective test specimens, halfway along the width [25]. From Figure 2, it is very clear that these inherent shortcomings need to be addressed correctly to fully exploit the advantages of the AFP process. Therefore, there is a need to investigate various techniques which can help to decrease the occurrence of tow placement defects. The initiation of tow defects and their accumulation greatly depends on the interaction between the roller and towpreg being placed [29]. While inadequate roller pressures result in low bond strength between different towpreg layers, leading to possible defects, higher roller pressures result in an insufficient amount of resin between towpreg layers [30,31].
The current study used carbon (T700SC-24K-50C) towpreg with epoxy (UF 3376-100) as the matrix system procured from TCR composites, USA. A six-axis KR 240 R2900 ultra robot made by KUKA was used for fiber placement, and the layup program was written using Kuka Robot Language (KRL). Test laminates were fabricated at three different roller pressures (2 bar, 3.5 bar, and 5 bar). For half of the laminates, the layup was carried out on a base prepreg layer of the same material as the towpreg while for the other half, the prepreg layers were added once the towpreg layers were laid. In the latter case, roller pressure was also applied on both the top and bottom surfaces after adding the prepreg layers to ensure a fair comparison. All the laminates were cured in an autoclave as per the manufacturer’s specified cure cycle. Tensile and bending tests were then performed on the fabricated specimens according to ASTM D3039 and ASTM D7264 guidelines [32,33].

2. Materials and Methods

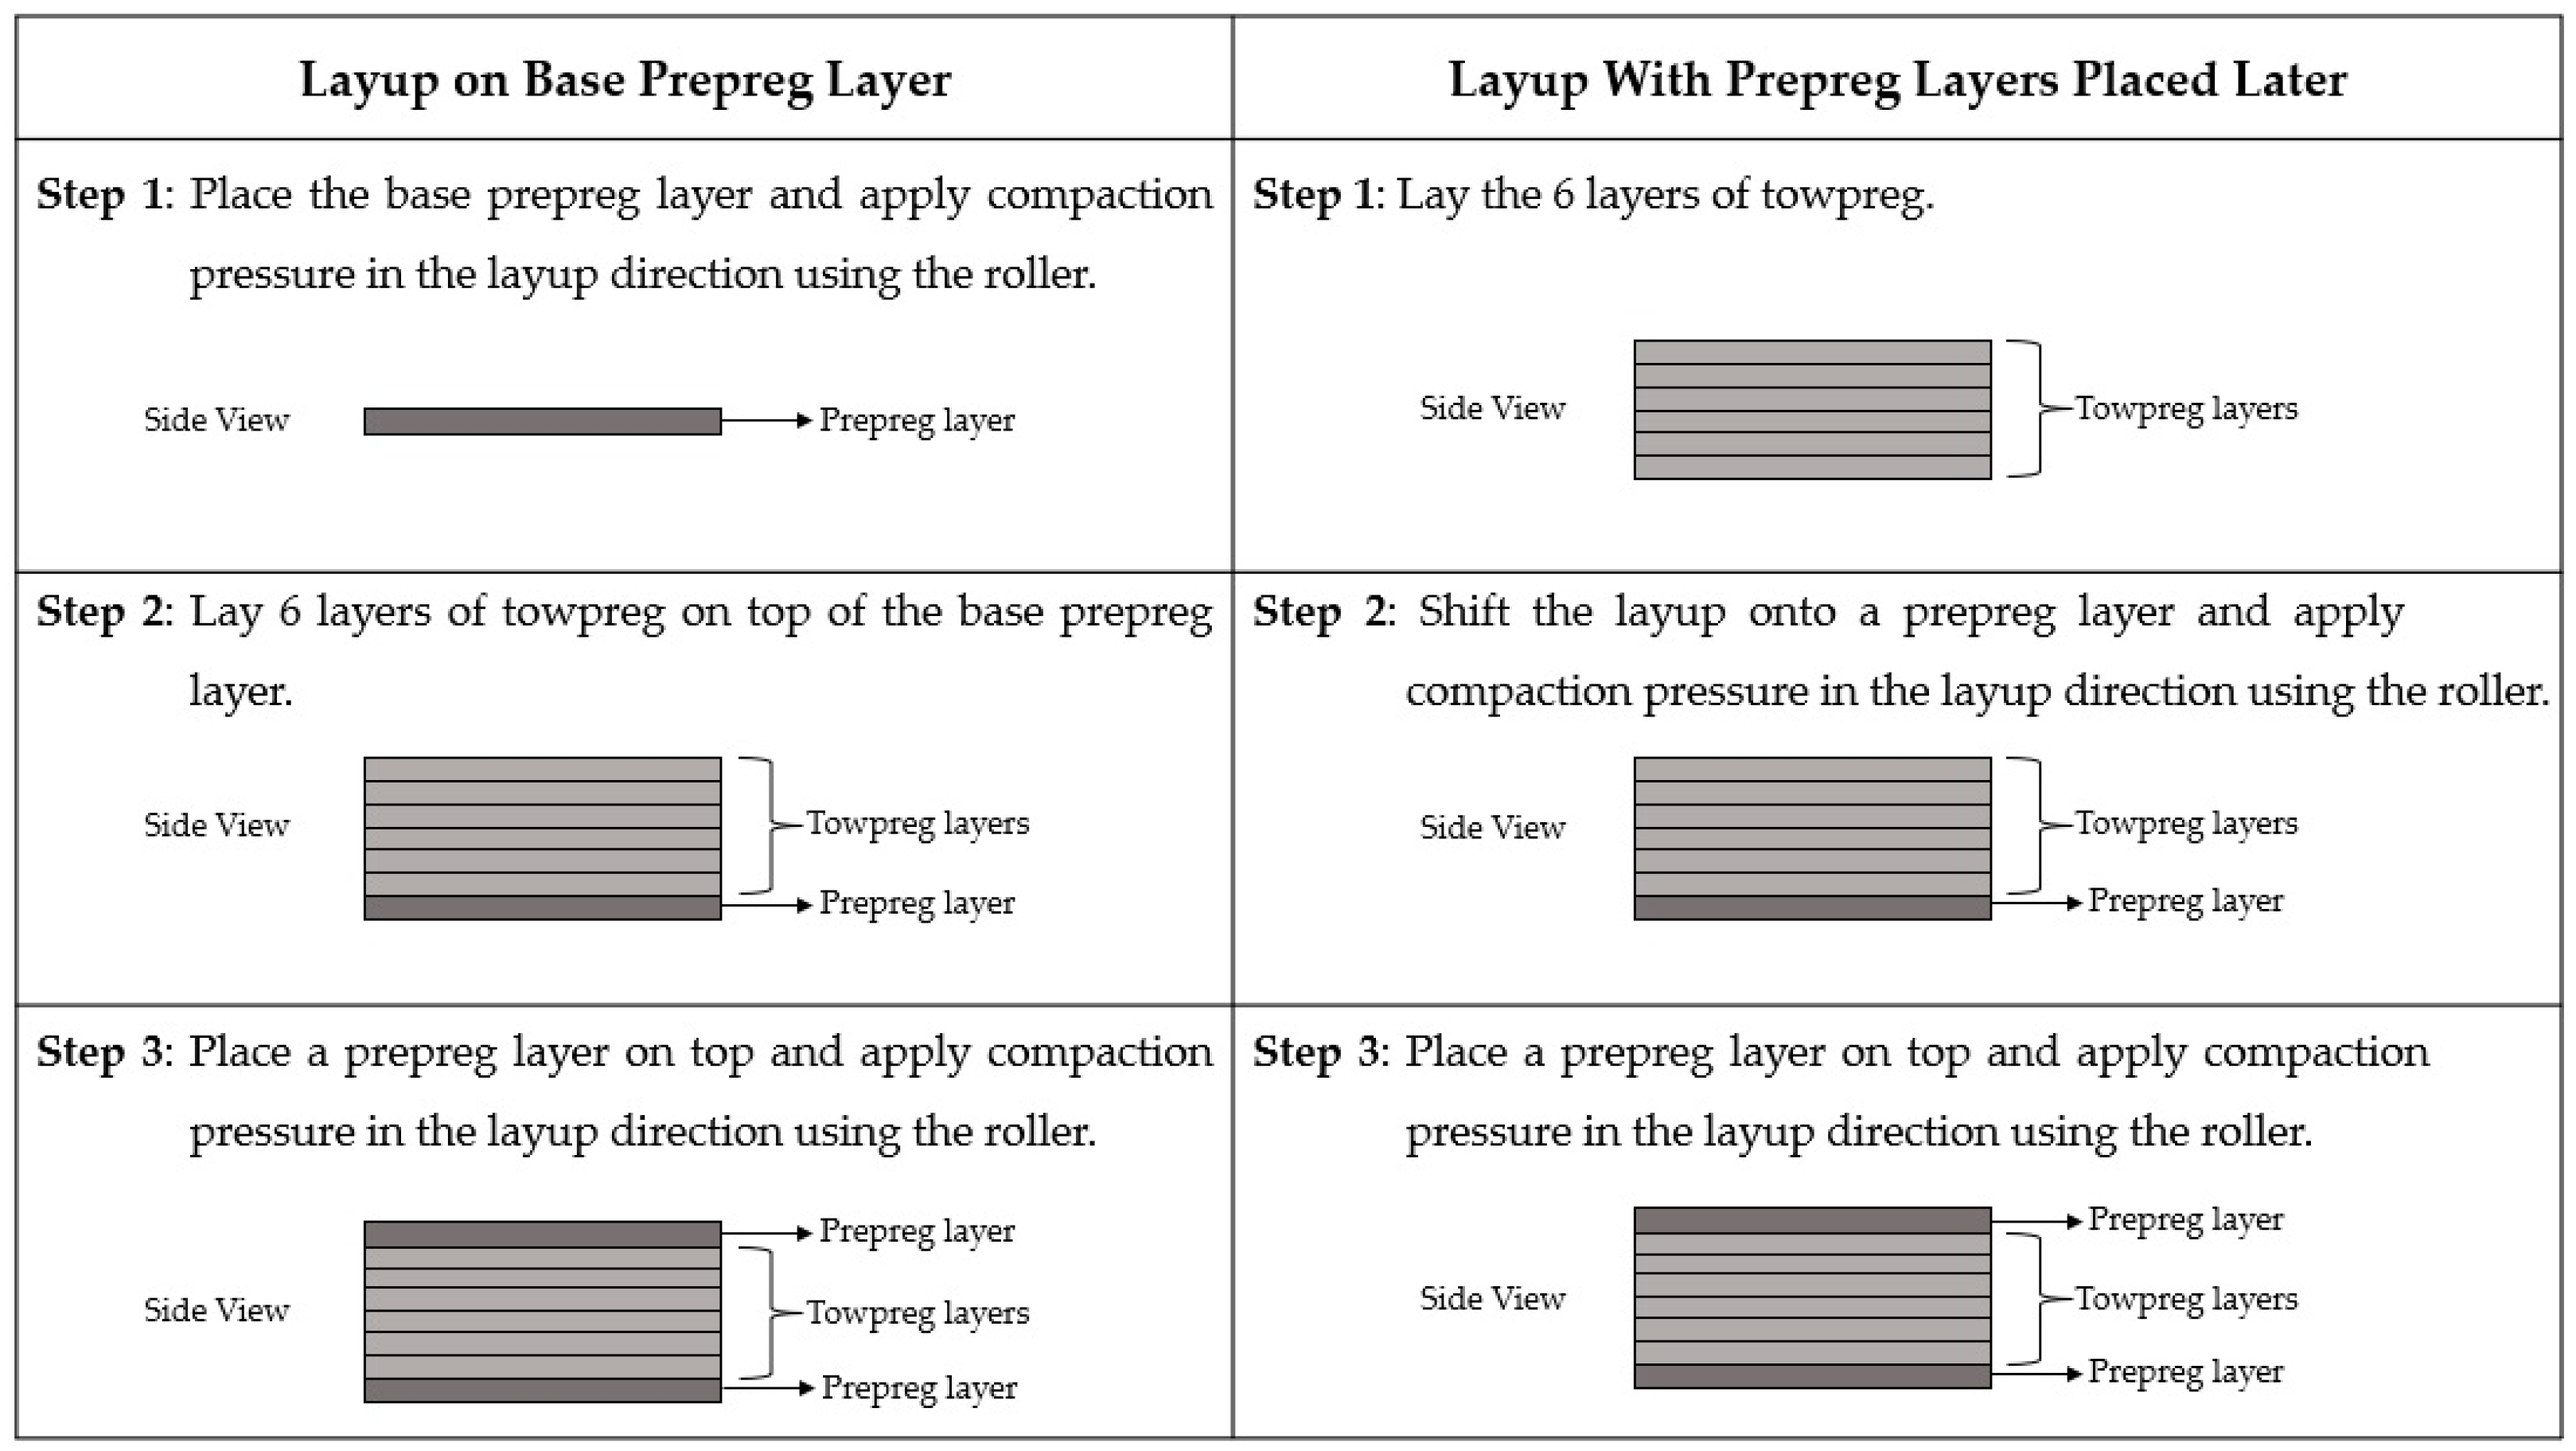
2.1. Sample Preparation
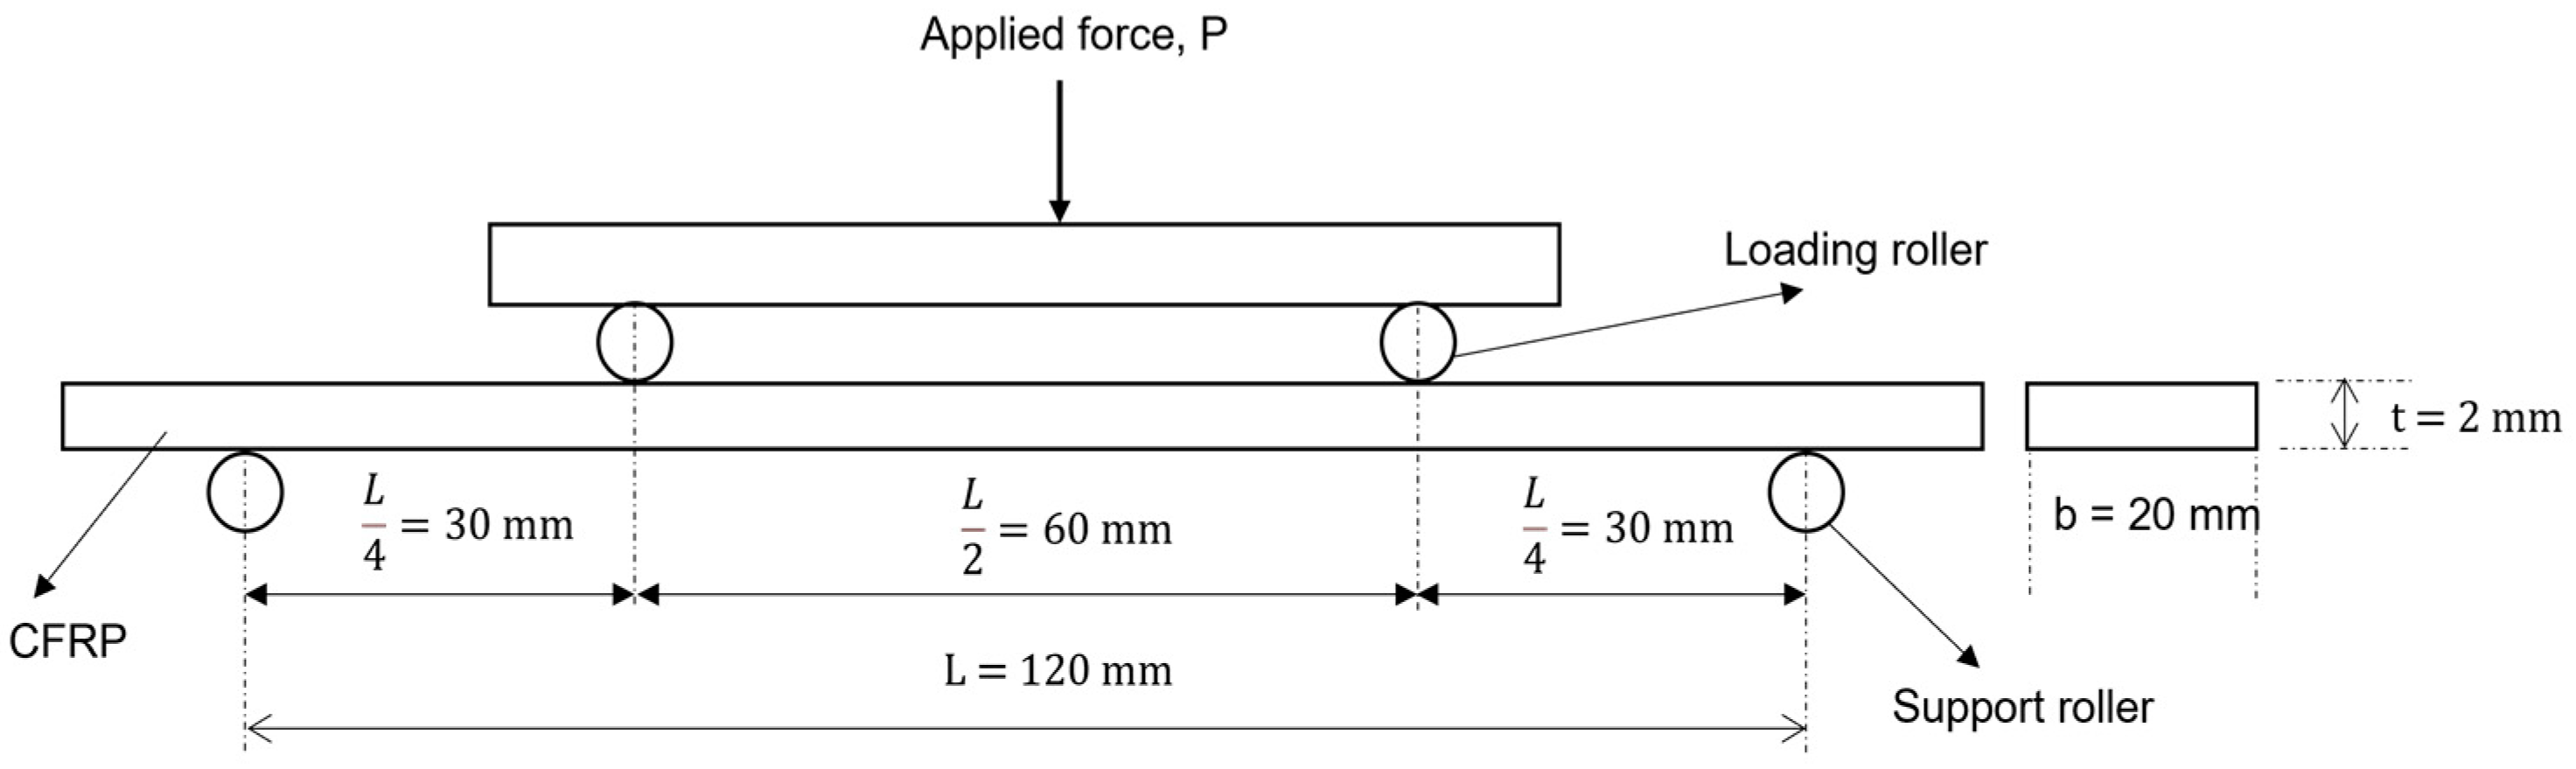
To study the influences of roller pressure and base layer, six different batches of laminates (ten specimens in each batch) were made; thirty specimens each for tensile and bending tests. For all the laminates, an eight-layer layup measuring (300 × 150) mm was made with the top and bottom layers consisting of prepreg and the other six layers of towpreg. For studying the effect of roller pressure, three different roller pressures were used viz 2 bar, 3.5 bar, and 5 bar. To understand the effect of the base layer, three layups were made on top of a base prepreg layer while for the other three, the prepreg layers were added once the towpreg layers were laid. The steps followed in both the cases and schematics are shown in Figure 3.
Table 1 summarizes the nomenclature of all twelve fabricated laminates.
All the laminates were cured in an autoclave as per the manufacturer’s specified cure cycle (uniform pressure of 72 psi, dwell temperature of 121 °C for 240 min) and are depicted in Figure 4. The cured laminates were then cut into smaller test specimens using abrasive waterjet cutting in accordance with the respective ASTM standards and are shown in Figure 5 [32,33,34]. The cross sections of the cut test specimens were examined under an optical microscope to make sure that there were no delaminations introduced due to the waterjet cutting process.

2.2. Test Methods

Tensile and bending tests were performed using two separate SHIMADZU Universal Testing Machines with a 100 kN load cell and 10 kN load cell, respectively.
Test specimens conforming to ASTM D3039 were used to determine the tensile properties of all the batches of composites. The tensile specimen is a rectangular, uniformly thick CFRP specimen. The schematic of the specimen is depicted in Figure 6. Since the layups were highly unidirectionally dominant and the testing was to failure along the fiber direction, tabs were used. Rectangular tabs fabricated using woven carbon-epoxy prepregs were attached at both ends of the test specimens. Sandpaper was used to roughen the surfaces of both the tabs as well as the specimens to improve the adhesion. An epoxy-based film adhesive, Redux 609 was used for the attachment. The attached specimens were cured in the autoclave at 120 °C for 1 h under 40 psi uniform pressure to ensure proper bonding between the tabs and the substrate. The tabs help to alleviate the failure of the specimen closer to the grips.
A uniform head speed of 1 mm/min was used for all the tensile tests. The specimens were tested to failure and the displacement and force data was saved for data analysis. Because of the parameters being studied and the cutting of laminates, some dimensional non-uniformity was expected. Hence, the obtained test results were normalized to account for these non-uniformities during the analysis.
The ultimate tensile strength of all the test specimens was calculated using Equation (1).
σ ult , t = P m a x A
where,
σult,t—Ultimate tensile strength, MPa.
P m a x —Maximum tensile force before failure, N.
A —Average cross-sectional area, mm2.
The bending properties of all the batches of composites were calculated based on the four-point bending test. ASTM D7264 guidelines were used to determine the specimen dimensions. Like the tensile specimen, the bending specimen is also rectangular and uniformly thick, made from CFRP. The schematic of the same is depicted in Figure 7.
To prevent the potential slipping of the specimen during four-point bending, the areas on the specimen meeting the support and loading rollers were sanded using sandpaper. A constant displacement rate of 2 mm/min was used for testing. All the specimens were tested to failure and the force and displacement data were used for analyzing the bending behavior. Like the analysis of tensile specimens, the determined bending properties were normalized to account for any dimensional non-uniformities.
Equation (2) was used to calculate the ultimate bending strength of all the test specimens.
σ ult , b = 3 P p e a k L 4 b t 2
where,
σult,b—Ultimate bending strength, MPa.
P p e a k —Peak applied force before failure, N.
L —Support span, mm.
b —Width of the test specimen, mm.
t —Thickness of the test specimen, mm.

3. Results and Discussions

The results of both the tensile and bending tests carried out on all the batches of laminates are presented in this section.

3.1. Tensile Tests

Figure 8 shows a typical tensile specimen before and after the test. After the start of the test, small fiber breaks were audible intermittently. This corresponded with the slight drops in the force-displacement plot. After a while, these noises subsided but returned towards the end of the test. Individual fibers broke and the remaining fibers tried to carry the tensile load. Fiber breaks became more frequent and eventually, the specimens failed. The tensile specimens followed an explosive type of failure. The failure area was within the gage section around the middle. The three-part code for the observed failure mode according to ASTM D3039 is XGM. From the obtained force and displacement data of each specimen, the maximum tensile force per unit width and ultimate tensile strength parameters were calculated for comparing different sets of laminates. These two parameters were chosen to ensure a fair comparison amidst any potential dimensional non-uniformity. In total, three tensile specimens slipped during testing, one each from TY2_A, TY3_A, and TY6_A. Since none of the batches had more than one specimen which had slipped, these specimens were considered outliers and were not included during the analysis.
Figure 9 shows the effect of roller pressure on maximum tensile force per width for layups without a base prepreg layer. The maximum tensile force per width is the least for a roller pressure of 2 bar. It increases to a maximum at a 3.5 bar roller pressure before decreasing when the roller pressure is increased to 5 bar. When compared with roller pressures of 2 bar and 5 bar, the increase with a roller pressure of 3.5 bar is 11% and 5.4%, respectively. A similar trend is also observed in Figure 10, which shows this effect for a layup on the base prepreg layer. When compared with roller pressures of 2 bar and 5 bar, the increase with a roller pressure of 3.5 bar in this case is 6.3% and 4.1%, respectively. From Figure 9 and Figure 10, it is evident that a roller pressure of 3.5 bar results in a higher maximum tensile force per width when compared with roller pressures of 2 bar and 5 bar for both the layup with and without base prepreg layer.
The reason for the initial increase is the better cohesion observed between the towpreg and the substrate, which has a positive effect by enhancing the buckling resistance. A roller pressure of 2 bar is observed to fall below the threshold pressure required for good cohesion. When the roller pressure is further increased to 5 bar, it was observed that the towpreg exhibits a tendency to stick to the roller more than the substrate. Also, at 5 bar roller pressure, due to the increased pressure being applied on the towpreg, it deforms, resulting in a wider and thinner tow. The increased tow width leads to misalignments in tow boundaries during placement, which leads to tow placement defects like tow gaps and overlaps. The observed variations were between 0.5 mm and 1.5 mm. In addition, the total thickness varies at locations of tow defects; tow gaps, missing tows, and incomplete tows lead to a decrease while tow overlaps and twisted tows lead to an increase. These defects accumulate, leading to the trend shown in Figure 9 and Figure 10. Roller pressures of 2 bar and 5 bar often result in the tow pull-up phenomenon depicted in Figure 11.
The occurrence of tow pull-ups is similar to the spring-back phenomenon commonly found during forming of sheet metal. The lift-ups were absent at a roller pressure of 3.5 bar. This might be because 3.5 bar is a good compromise between the positive effects of increased cohesion and the negative effects of increased tow width.
Table 2 summarises the maximum tensile force per unit width for different sets of specimens. The highest and lowest values for maximum tensile force per unit width are observed for laminates TY1_A and TY6_A, respectively. When compared with TY6_A, the increase is 24.51% for TY1_A. The coefficient of variation for all the sets of specimens is found to be less than 5%.
The variation in the maximum tensile force per unit width for all the batches of laminates is shown in Figure 12. A clear pattern is evident; the specimens with a base prepreg layer (TY1_A, TY3_A, and TY5_A) perform better than the respective ones without a base prepreg layer (TY2_A, TY4_A, and TY6_A). The improvement in maximum tensile force/width obtained by using a base prepreg layer is 17.11%, 12.18%, and 13.58%, respectively for roller pressures of 2 bar, 3.5 bar, and 5 bar. The improvement is highest for a roller pressure of 2 bar. This is expected as the base prepreg layer will help to nullify the issue of insufficient cohesion between the towpreg and the substrate. The physical bond between the towpreg and prepreg layer is better than the one between the towpreg and the substrate.
The effect of roller pressure and base layer on ultimate tensile strength for layups without a prepreg base layer is shown in Figure 13. The ultimate tensile strength increases from 1802.76 MPa at 2 bar roller pressure to 1983.38 MPa at 3.5 bar roller pressure before decreasing to 1864.01 MPa as the pressure is increased further to 5 bar. The change is similar to that observed for the maximum tensile force per width.
Figure 14 shows the effect of roller pressure and base layer on ultimate tensile strength for layups on a prepreg base layer. The ultimate tensile strength at roller pressure of 3.5 bar is 5.5% and 3.5% higher than those at 2 bar and 5 bar roller pressures. The addition of the prepreg base layer improves the ultimate tensile strength at all the tested roller pressures.
The calculated ultimate tensile strengths of different batches of laminates are tabulated in Table 3. TY6_A and TY1_A are found to have the lowest and highest ultimate tensile strength, respectively. The corresponding observed increase is 21.61%. The maximum coefficient of variation among all the batches of specimens is 5.4%.
Figure 15 depicts the effect of roller pressure and a base layer on ultimate tensile strength for all batches of laminates. As observed for the maximum tensile force per width, the laminates with a prepreg base layer (TY1_A, TY3_A, and TY5_A) fare better than the corresponding ones without a prepreg base layer (TY2_A, TY4_A, and TY6_A). With the use of the prepreg base layer, the ultimate tensile strength improved from 1802.76 MPa to 2078.85 MPa, 1983.38 MPa to 2192.42 MPa, and 1864.01 MPa to 2117.09 MPa, respectively for roller pressures of 2 bar, 3.5 bar, and 5 bar. These translate to an improvement of 15.32%, 10.54%, and 13.58%, respectively.

3.2. Bending Tests

Figure 16 shows a typical bending specimen under test. From the obtained force and displacement data of each specimen, the maximum bending force per width and ultimate bending strength parameters were calculated for comparing different sets of laminates.
Figure 17 illustrates the effect of roller pressure and base layer on maximum bending force per width for layups without a prepreg base layer. The maximum bending force per width increases by 14.88% from 33.55 N/mm to 38.54 N/mm with the increase in roller pressure from 2 bar to 3.5 bar. It then decreases by 5.91% with a further increase in roller pressure to 5 bar. A similar trend is also observed in Figure 18, which depicts the effect of roller pressure and base layer on maximum bending force per width for layups on a base prepreg layer; the value increases initially with roller pressure before decreasing. The maximum bending force per unit width at a roller pressure of 3.5 bar is 7.6% and 2% higher than those at 2 bar and 5 bar roller pressures, respectively.
The maximum bending force per unit width for different batches of specimens is tabulated in Table 4. TY1_B with 41.09 N/mm exhibited the highest maximum bending force per unit width while TY6_B with 33.55 N/mm exhibited the lowest. The maximum calculated coefficient of variation among all the sets of laminates is 6.06%.
The effect of roller pressure and a base layer on maximum bending force per unit width for all laminates is depicted in Figure 19. It is clear from the figure that laminates made on a prepreg base layer (TY1_B, TY3_B, and TY5_B) exhibit higher maximum bending force per unit width than the corresponding ones without a prepreg base layer (TY2_B, TY4_B, and TY6_B). The use of a prepreg base layer helped to improve the maximum bending force per unit width from 33.55 N/mm to 38.20 N/mm, 38.54 N/mm to 41.09 N/mm, and 36.39 N/mm to 40.30 N/mm, respectively, for roller pressures of 2 bar, 3.5 bar, and 5 bar. These correspond to an increase of 13.87%, 6.64%, and 9.72%, respectively.
Figure 20 shows the effect of roller pressure and base layer on ultimate bending strength for layups without a prepreg base layer. The ultimate bending strength is observed to be the lowest for a roller pressure of 2 bar (710.64 MPa) and increases to a maximum at a roller pressure of 3.5 bar (801.42 MPa) before decreasing with a further increase in roller pressure to 5 bar (761.15 MPa). When compared with roller pressures of 2 bar and 5 bar, a roller pressure of 3.5 bar corresponds to an increase in ultimate bending strength of 12.8% and 5.3%, respectively.
The effect of roller pressure and base layer on ultimate bending strength for layups on a prepreg base layer is shown in Figure 21. The ultimate bending strength increases by 4.74% from 823.25 MPa at 2 bar roller pressure to 862.34 MPa at 3.5 bar roller pressure. It then decreases by 3.09% to 835.73 MPa when the roller pressure is further increased to 5 bar. When compared with roller pressures of 2 bar and 5 bar, a roller pressure of 3.5 bar corresponds to an increase in ultimate bending strength of 4.7% and 3.2%, respectively. The variation of ultimate bending strength is similar to the variation of maximum bending force per unit width observed earlier in Figure 17 and Figure 18.
The ultimate bending strength of all the batches of laminates is indicated in Table 5. The highest and lowest values for ultimate bending strength are observed for laminates TY1_B and TY6_B, respectively. When compared with TY6_B, the increase is 21.34% for TY1_B. The maximum coefficient of variation among all the sets of specimens is 7.2%. It is evident that the use of a prepreg base layer has helped to improve the ultimate bending strength at all three tested roller pressures.
The laminates with a prepreg base layer (TY1_B, TY3_B, and TY5_B) perform better than the corresponding ones without a prepreg base layer (TY2_B, TY4_A, and TY6_B) as shown in Figure 22. With the use of the prepreg base layer, the ultimate bending strength improved from 710.64 MPa to 823.25 MPa, 801.42 MPa to 862.34 MPa, and 761.15 MPa to 835.73 MPa, respectively, for roller pressures of 2 bar, 3.5 bar, and 5 bar. These translate to an improvement of 15.84%, 7.6%, and 9.79%, respectively.

3.3. Failure Modes

All the failed bending specimens (TY1_B to TY6_B) were observed under an optical microscope to better understand the failure modes. Both intralaminar and interlaminar failures were present in all specimens. Matrix cracks, shear cracks, delamination, matrix fracture, and fiber breaks were identified. Above and below the mid-plane, the stresses induced are respectively tensile and compressive in nature.
The specimens with a layup on top of a base prepreg layer (TY1_B, TY3_B, and TY5_B) exhibited slightly different characteristics when compared with the specimens made on top of a base prepreg layer (TY2_B, TY4_B, and TY6_B). Optical microscopic images of two bending specimens, TY1_B and TY2_B (one from each group) in the gage section near the loading pin after testing are shown in Figure 23a,b. As is evident, more pronounced damage and developed cracks are found in the layup made without a prepreg base layer. Delamination between the prepreg layer and the adjacent towpreg layer is also found in Figure 23b. Extensive damage including fiber splitting, fiber fracture, and matrix failure due to shear were found on the compressive side within the gage section, closer to the prepreg layer. Very little or no proof of damage was found on the tensile side.

4. Conclusions

The main conclusions obtained from the present research work using carbon (T700SC-24K-50C) towpreg with epoxy (UF 3376-100) as the matrix system are listed below:
  • When compared with roller pressures of 2 bar and 5 bar, a roller pressure of 3.5 bar corresponds to an increase in maximum tensile force per unit width of 11% and 5.4%, respectively, for a layup without any prepreg base layer, and 6.3% and 4.1%, respectively, for a layup on a prepreg base layer of the same material. For a layup without any prepreg base layer, the ultimate tensile strength at roller pressure of 3.5 bar is 10% and 6.4% higher than those at 2 bar and 5 bar roller pressures, respectively. The corresponding increase for a layup on a prepreg base layer of the same material is 5.5% and 3.5%, respectively. It is observed that a 2 bar roller pressure cannot provide the necessary adhesion between different layers while a roller pressure of 5 bar is higher than required and leads to thinner and wider tows. Hence, a roller pressure of 3.5 bar was found to be optimum.
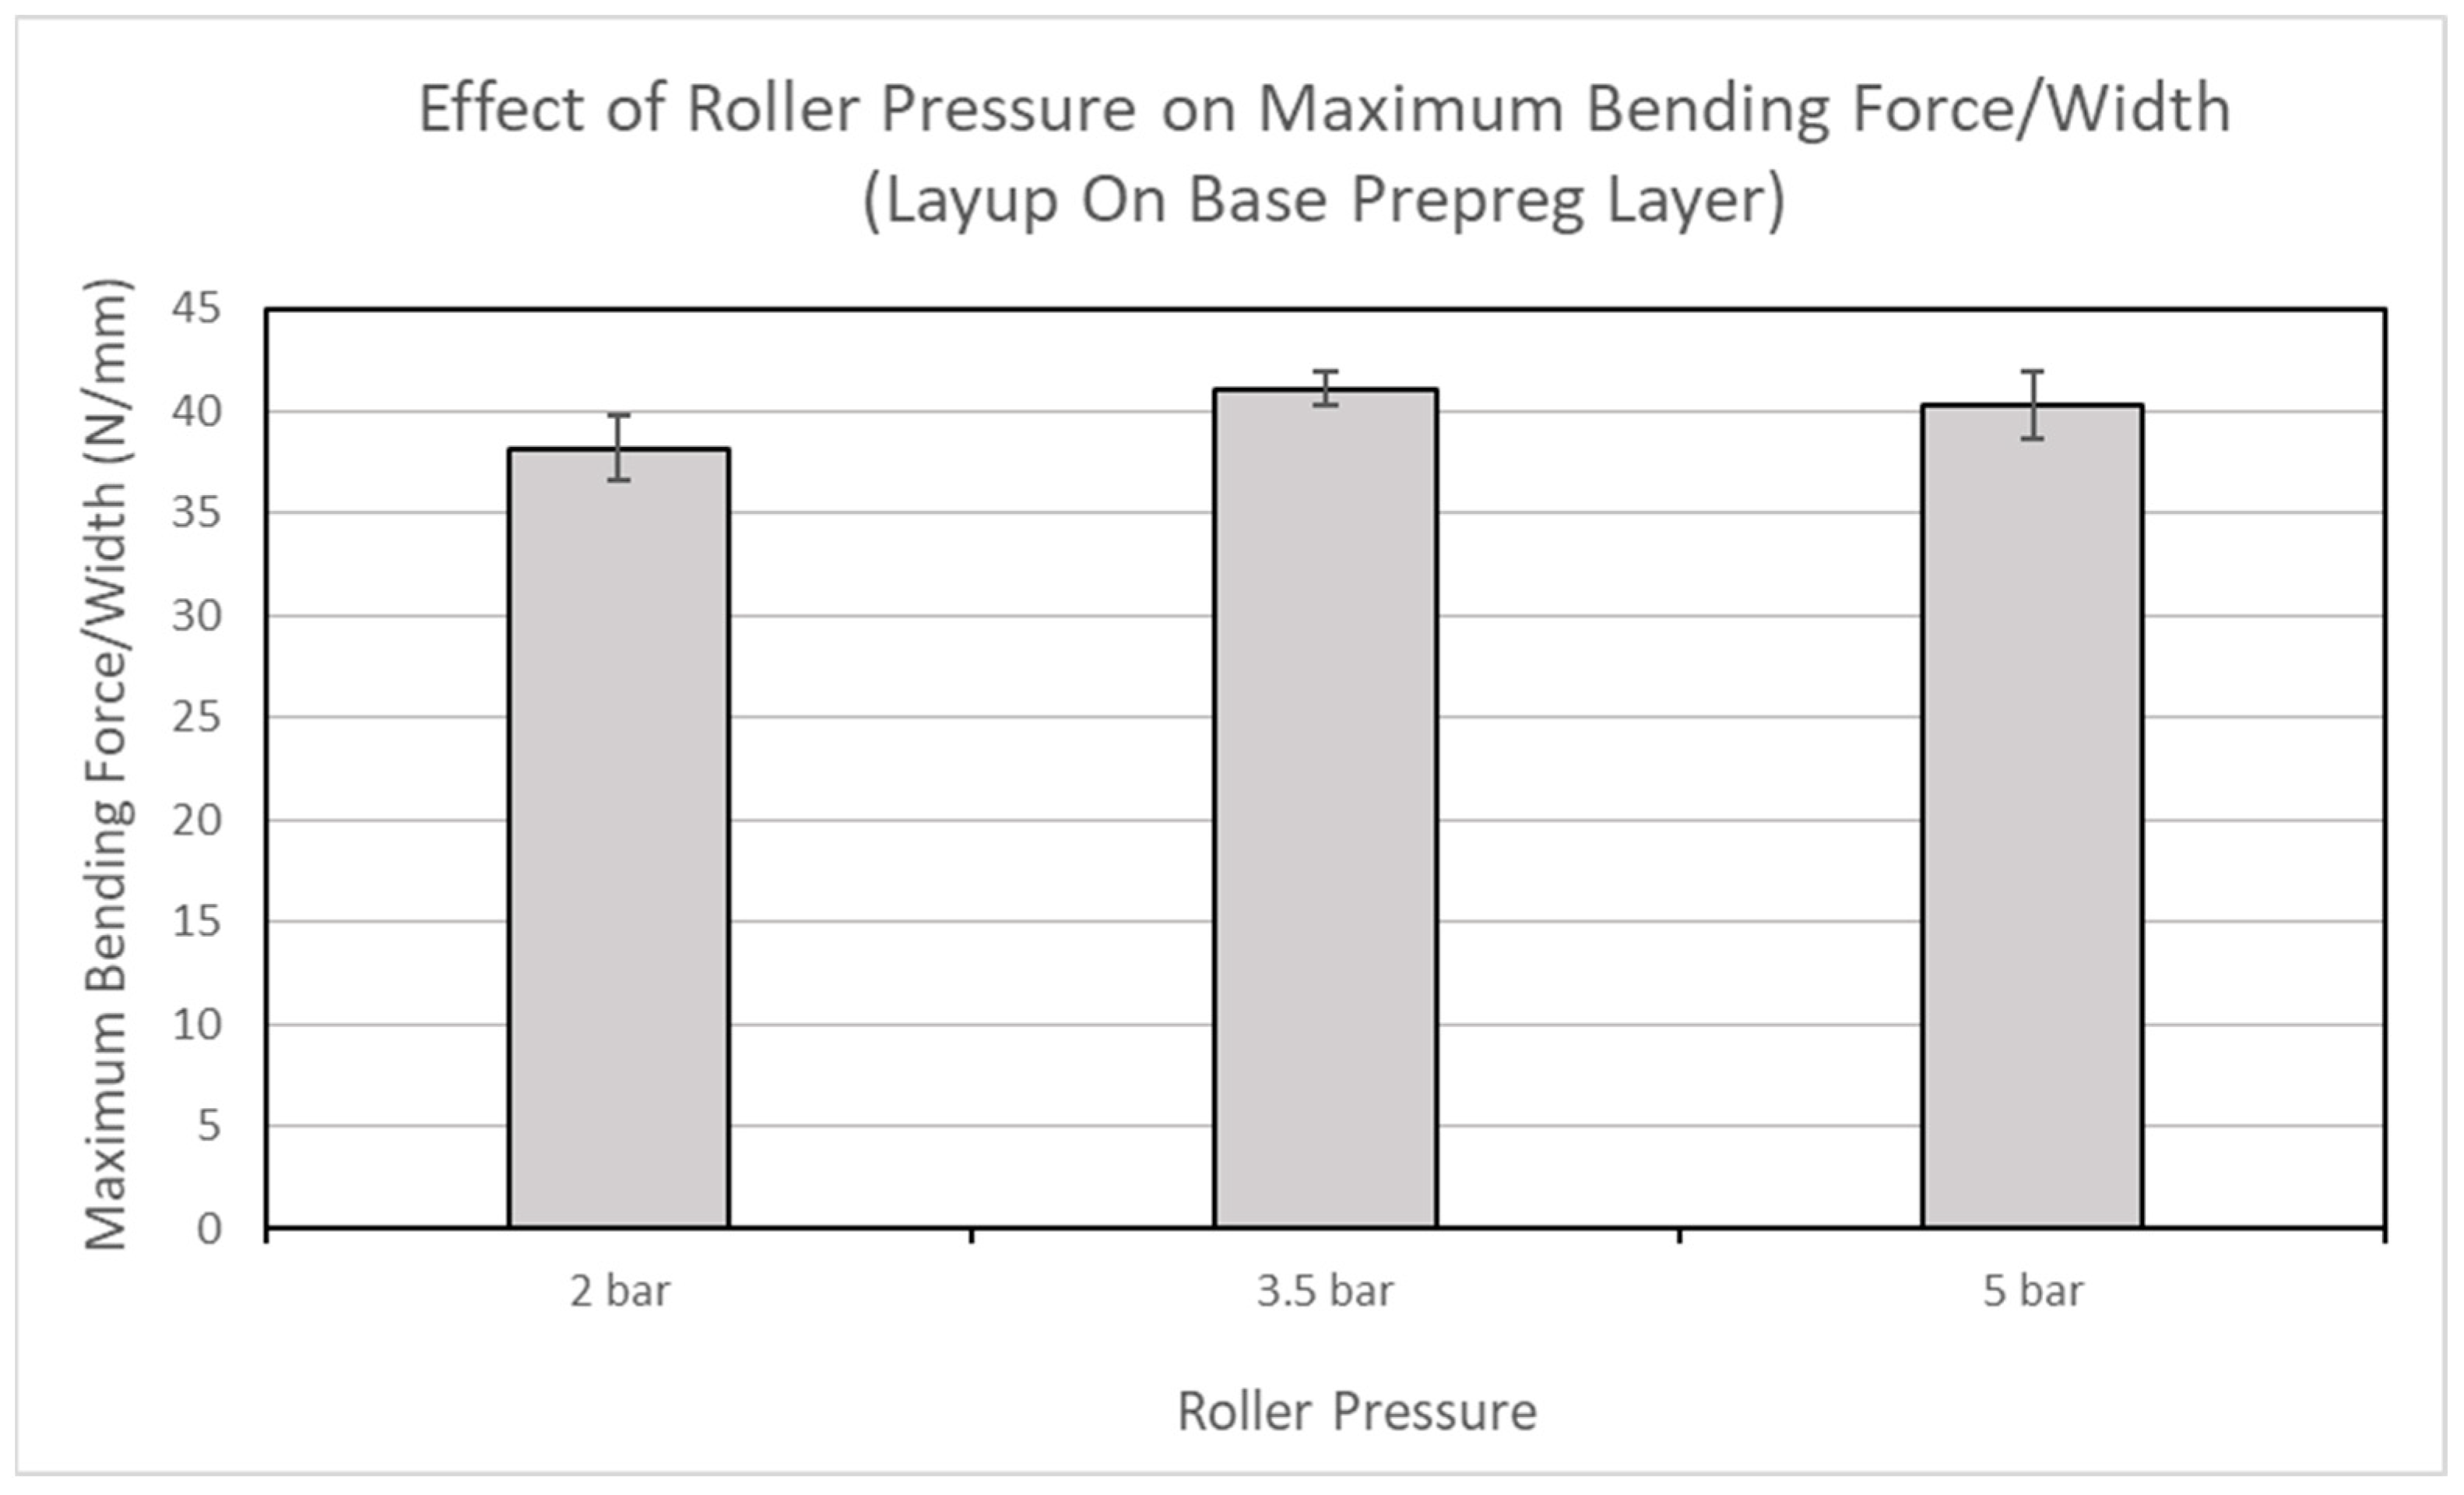
  • For a layup without any prepreg base layer, the maximum bending force per unit width increases by 14.9% from 33.55 N/mm to 38.54 N/mm with the increase in roller pressure from 2 bar to 3.5 bar. It then decreases by 5.9% with a further increase in roller pressure to 5 bar. For a layup on a prepreg base layer of the same material, the maximum bending force per unit width at a roller pressure of 3.5 bar is 7.6% and 2% higher than those at 2 bar and 5 bar roller pressures, respectively. When compared with roller pressures of 2 bar and 5 bar, a roller pressure of 3.5 bar corresponds to an increase in ultimate bending strength of 12.8% and 5.3%, respectively, for a layup without any prepreg base layer, and 4.7% and 3.2%, respectively, for a layup on prepreg base layer of the same material. It is noticed that a roller pressure of 3.5 bar is a good compromise between the positive effects of increased cohesion between the roller and the substrate and the negative effects of increased tow width.
  • The maximum tensile force per unit width at roller pressures of 2 bar, 3.5 bar, and 5 bar for a layup on a prepreg base layer of the same material increased by 17.1%, 12.2%, and 13.6%, respectively, when compared with a layup without a prepreg base layer. The corresponding increase in ultimate tensile strength is 15.3%, 10.5%, and 13.6%, respectively. When compared with a layup without a prepreg base layer, the maximum bending force per unit width at roller pressures of 2 bar, 3.5 bar, and 5 bar for a layup on a prepreg base layer of the same material increased by 13.9%, 6.6%, and 10.7%, respectively. The corresponding increase in ultimate bending strength is 15.8%, 7.6%, and 9.8%, respectively. It is observed that the prepreg base layer of the same material had better adhesion with the adjacent towpreg layer and aided in hindering delamination between the two layers.

Author Contributions

Conceptualization, E.M.; methodology, E.M. and S.C.J.; software, E.M.; validation, E.M. and S.C.J.; formal analysis, E.M.; investigation, E.M.; resources, S.C.J.; data curation, E.M.; writing—original draft preparation, E.M.; writing—review and editing, E.M. and S.C.J.; visualization, E.M.; supervision, S.C.J.; project administration, S.C.J.; funding acquisition, S.C.J. All authors have read and agreed to the published version of the manuscript.

Funding

This research received no external funding.

Data Availability Statement

The data presented in this study are available upon request from the corresponding author.

Acknowledgments

The authors gratefully thank Nanyang Technological University for all its support during the study.

Conflicts of Interest

The authors declare no conflict of interest.

References

  1. Daniel, I.M. Engineering Mechanics of Composite Materials, 2nd ed.; Oxford University Press: New York, NY, USA, 2006. [Google Scholar]
  2. Jones, R.M. Mechanics of composite Materials, 2nd ed.; Taylor & Francis: Philadelphia, PA, USA, 1999. [Google Scholar]
  3. Arns, J.-Y.; Oromiehie, E.; Arns, C.; Prusty, B.G. Micro-CT analysis of process-induced defects in composite laminates using AFP. Mater. Manuf. Process. 2021, 36, 1561–1570. [Google Scholar] [CrossRef]
  4. Chen, J.; Fu, K.; Li, Y. Understanding processing parameter effects for carbon fibre reinforced thermoplastic composites manufactured by laser-assisted automated fibre placement (AFP). Compos. Part A Appl. Sci. Manuf. 2021, 140, 106160. [Google Scholar] [CrossRef]
  5. Mallick, P.K. Composites Engineering Handbook, 11th ed.; M. Dekker: New York, NY, USA, 1997. [Google Scholar]
  6. Faye, S.; Carroll, G. Automated processes for composite aircraft structure. Ind. Robot. Int. J. 2006, 33, 117–121. [Google Scholar] [CrossRef]
  7. Fairuz, A.M.; Sapuan, S.M.; Zainudin, E.S.; Jaafar, C.N.A. Polymer composite manufacturing using a pultrusion process: A review. Am. J. Appl. Sci. 2014, 11, 1798–1810. [Google Scholar] [CrossRef]
  8. Lukaszewicz, D.H.J.A.; Ward, C.; Potter, K.D. The engineering aspects of automated prepreg layup: History, present and future. Compos. Part B 2012, 43, 997–1009. [Google Scholar] [CrossRef]
  9. Mertiny, P.; Ellyin, F. Influence of the filament winding tension on physical and mechanical properties of reinforced composites. Compos. Part A 2002, 33, 1615–1622. [Google Scholar] [CrossRef]
  10. Mitschang, P.; Hildebrandt, K. 8-Polymer and composite molding technologies for automotive applications. In Advanced Materials in Automotive Engineering; Rowe, J., Ed.; Woodhead Publishing: Cambridge, UK, 2012; pp. 210–229. [Google Scholar] [CrossRef]
  11. Park, C.H.; Lee, W.I. 3-Compression Molding in Polymer Matrix Composites; Woodhead Publishing: Cambridge, UK, 2012; pp. 47–94. [Google Scholar]
  12. Park, S.B.; Lee, D.W.; Song, J.I. Fabrication and Evaluation of Mechanical Properties of Carbon/Epoxy Square Tube Using Pressure Bag Molding and Compared with Autoclave Method. Int. J. Precis. Eng. Manuf. 2018, 19, 441–446. [Google Scholar] [CrossRef]
  13. Potter, K.D. The early history of the resin transfer molding process for aerospace applications. Compos. Part A 1999, 30, 619–621. [Google Scholar] [CrossRef]
  14. Todd, R.H. Manufacturing Processes Reference Guide, 1st ed.; Allen, D.K., Alting, L., Eds.; Industrial Press: New York, NY, USA, 1994. [Google Scholar]
  15. He, Y.; Jiang, J.; Qu, W.; Ke, Y. Compaction pressure distribution and pressure uniformity of segmented rollers for automated fiber placement. J. Reinf. Plast. Compos. 2022, 41, 427–443. [Google Scholar] [CrossRef]
  16. Belnoue, J.P.H.; Mesogitis, T.; Nixon-Pearson, O.J.; Kratz, J.; Ivanov, D.S.; Partridge, I.K.; Potter, K.D.; Hallett, S.R. Understanding and predicting defect formation in automated fibre placement pre-preg laminates. Compos. Part A Appl. Sci. Manuf. 2017, 102, 196–206. [Google Scholar] [CrossRef]
  17. Lukaszewicz, D.H.J.A.; Potter, K.D.; Eales, J. A concept for the in situ consolidation of thermoset matrix prepreg during automated lay-up. Compos. Part B Eng. 2013, 45, 538–543. [Google Scholar] [CrossRef]
  18. Chinesta, F.; Leygue, A.; Bognet, B.; Ghnatios, C.; Poulhaon, F.; Bordeu, F.; Barasinski, A.; Poitou, A.; Chatel, S.; Maison-Le-Poec, S. First steps towards an advanced simulation of composites manufacturing by automated tape placement. Int. J. Mater. Form. 2014, 7, 81–92. [Google Scholar] [CrossRef] [Green Version]
  19. Lichtinger, R.; Hörmann, P.; Stelzl, D.; Hinterhölzl, R. The effects of heat input on adjacent paths during Automated Fibre Placement. Compos. Part A Appl. Sci. Manuf. 2015, 68, 387–397. [Google Scholar] [CrossRef]
  20. Gangloff, J.J.; Simacek, P.; Sinha, S.; Advani, S.G. A process model for the compaction and saturation of partially impregnated thermoset prepreg tapes. Compos. Part A Appl. Sci. Manuf. 2014, 64, 234–244. [Google Scholar] [CrossRef]
  21. Zacherl, L.; Shadmehri, F.; Rother, K. Determination of convective heat transfer coefficient for hot gas torch (HGT)-assisted automated fiber placement (AFP) for thermoplastic composites. J. Thermoplast. Compos. Mater. 2023, 36, 73–95. [Google Scholar] [CrossRef]
  22. Lamontia, M.A.; Gruber, M.B.; Tierney, J.J.; Gillespie, J., Jr.; Jensen, B.J.; Cano, R.J. In situ thermoplastic ATP needs flat tapes and tows with few voids. In Proceedings of the 30th International SAMPE Europe Conference, Paris, France, 23–25 March 2009. [Google Scholar]
  23. Khan, M.A.; Mitschang, P.; Schledjewski, R. Identification of some optimal parameters to achieve higher laminate quality through tape placement process. Adv. Polym. Technol. 2010, 29, 98–111. [Google Scholar] [CrossRef]
  24. Lopes, C.S.; Gürdal, Z.; Camanho, P.P. Tailoring for strength of composite steered-fibre panels with cutouts. Compos. Part A 2010, 41, 1760–1767. [Google Scholar] [CrossRef]
  25. Croft, K.; Lessard, L.; Pasini, D.; Hojjati, M.; Chen, J.; Yousefpour, A. Experimental study of the effect of automated fiber placement induced defects on performance of composite laminates. Compos. Part A 2011, 42, 484–491. [Google Scholar] [CrossRef] [Green Version]
  26. Arif, M.; Asif, M.; Ahmed, I. Advanced composite material for aerospace application—A review. Int. J. Eng. Manuf. Sci. 2017, 7, 393–409. [Google Scholar] [CrossRef]
  27. Sawicki, A.; Minguett, P. The effect of intraply overlaps and gaps upon the compression strength of composite laminates. In Proceedings of the 39th AIAA/ASME/ASCE/AHS/ASC Structures, Structural Dynamics, and Materials Conference and Exhibit, Long Beach, CA, USA, 20–23 April 1998; American Institute of Aeronautics and Astronautics: Reston, VA, USA, 1998. [Google Scholar] [CrossRef]
  28. Marsh, G. Automating aerospace composites production with fibre placement. Reinf. Plast. 2011, 55, 32–37. [Google Scholar] [CrossRef]
  29. Bakhshi, N.; Hojjati, M. Effect of compaction roller on layup quality and defects formation in automated fiber placement. J. Reinf. Plast. Compos. 2020, 39, 3–20. [Google Scholar] [CrossRef]
  30. Jiang, J.; He, Y.; Ke, Y. Pressure distribution for automated fiber placement and design optimization of compaction rollers. J. Reinf. Plast. Compos. 2019, 38, 860–870. [Google Scholar] [CrossRef]
  31. Forcellese, A.; Greco, L.; Pieralisi, M.; Simoncini, M.; Trevisan, G. Mechanical properties of carbon fiber reinforced plastic obtained by the automatic deposition of an innovative towpreg. Procedia CIRP 2020, 88, 451–456. [Google Scholar] [CrossRef]
  32. ASTM D7264/D7264M-21; Standard Test Method for Flexural Properties of Polymer Matrix Composite Materials. ASTM: West Conshohocken, PA, USA, 2021. [CrossRef]
  33. ASTM D3039/D3039M-17; Standard Test Method for Tensile Properties of Polymer Matrix Composite Materials. ASTM: West Conshohocken, PA, USA, 2017. [CrossRef]
  34. Shanmugam, D.K.; Nguyen, T.; Wang, J. A study of delamination on graphite/epoxy composites in abrasive waterjet machining. Compos. Part A Appl. Sci. Manuf. 2008, 39, 923–929. [Google Scholar] [CrossRef]
Figure 1. Commonly found defects in the AFP process.
Jcs 07 00101 g001
Figure 2. Effects of defects encountered during the AFP process.
Jcs 07 00101 g002
Figure 3. Different layup types and the associated steps.
Jcs 07 00101 g003
Figure 4. Laminates fabricated to obtain tensile specimens (TY1_A to TY6_A) and bending specimens (TY1_B to TY6_B).
Jcs 07 00101 g004
Figure 5. (a) Cut tensile specimens (TY1_A to TY6_A) (b) Cut bending specimens (TY1_B to TY6_B).
Jcs 07 00101 g005
Figure 6. Tensile specimen schematic.
Jcs 07 00101 g006
Figure 7. Four-point bending specimen schematic.
Jcs 07 00101 g007
Figure 8. (a) Tensile specimen before test (b) Tensile specimen after test.
Jcs 07 00101 g008
Figure 9. Effect of roller pressure on maximum tensile force/width for layups without base prepreg layer.
Jcs 07 00101 g009
Figure 10. Effect of roller pressure and base layer on maximum tensile force/width for layups on prepreg base layer.
Jcs 07 00101 g010
Figure 11. Schematic showing the effect of roller pressure on tow lift-up.
Jcs 07 00101 g011
Figure 12. Effect of roller pressure and base layer on maximum tensile force/width for all laminates.
Jcs 07 00101 g012
Figure 13. Effect of roller pressure and base layer on ultimate tensile strength for layups without prepreg base layer.
Jcs 07 00101 g013
Figure 14. Effect of roller pressure and base layer on ultimate tensile strength for layups on prepreg base layer.
Jcs 07 00101 g014
Figure 15. Effect of roller pressure and base layer on ultimate tensile strength for all laminates.
Jcs 07 00101 g015
Figure 16. Bending specimen under test.
Jcs 07 00101 g016
Figure 17. Effect of roller pressure and base layer on maximum bending force/width for layups without prepreg base layer.
Jcs 07 00101 g017
Figure 18. Effect of roller pressure and base layer on maximum bending force/width for layups on prepreg base layer.
Jcs 07 00101 g018
Figure 19. Effect of roller pressure and base layer on maximum bending force/width for all laminates.
Jcs 07 00101 g019
Figure 20. Effect of roller pressure and base layer on ultimate bending strength for layups without prepreg base layer.
Jcs 07 00101 g020
Figure 21. Effect of roller pressure and base layer on ultimate bending strength for layups on prepreg base layer.
Jcs 07 00101 g021
Figure 22. Effect of roller pressure and base layer on ultimate bending strength for all laminates.
Jcs 07 00101 g022
Figure 23. Optical microscopic images of bending specimen in the gage section near the loading pin after testing (a) TY1_B—With prepreg base layer (b) TY2_B—Without prepreg base layer.
Jcs 07 00101 g023
Table 1. Specimen nomenclature based on roller pressure and base prepreg layer.
Sr. No.Laminate LabelRoller Pressure (bar)Layup on Top of Base Prepreg Layer?Number of Specimens
TensileBendingTensileBending
1TY1_ATY1_B3.5Yes55
2TY2_ATY2_B3.5No55
3TY3_ATY3_B5Yes55
4TY4_ATY4_B5No55
5TY5_ATY5_B2Yes55
6TY6_ATY6_B2No55
Table 2. Maximum tensile force per unit width for different batches of specimens.
Laminate LabelMaximum Force/Width
Mean (N/mm)Standard Deviation (N/mm)Coefficient of Variation (%)
TY1_A4589.44100.752.20
TY2_A4091.1750.621.24
TY3_A4408.2428.860.65
TY4_A3881.16143.073.69
TY5_A4316.6328.700.66
TY6_A3685.96148.554.03
Table 3. Ultimate tensile strength for different batches of specimens.
Laminate LabelUltimate Tensile Strength
Mean (MPa)Standard Deviation (MPa)Coefficient of Variation (%)
TY1_A2192.4240.421.84
TY2_A1983.3851.162.58
TY3_A2117.0977.563.66
TY4_A1864.0179.924.29
TY5_A2078.85112.345.4
TY6_A1802.7679.44.4
Table 4. Maximum bending force per unit width for different batches of specimens.
Laminate LabelMaximum Bending Force/Width
Mean (N/mm)Standard Deviation (N/mm)Coefficient of Variation (%)
TY1_B41.090.832.03
TY2_B38.542.346.06
TY3_B40.31.614
TY4_B36.391.674.58
TY5_B38.21.624.23
TY6_B33.551.424.25
Table 5. Ultimate bending strength for different batches of specimens.
Laminate LabelUltimate Bending Strength
Mean (MPa)Standard Deviation (MPa)Coefficient of Variation (%)
TY1_B862.3424.672.95
TY2_B801.4257.567.18
TY3_B835.7313.711.59
TY4_B761.1514.511.91
TY5_B823.2531.653.84
TY6_B710.6419.542.75
Disclaimer/Publisher’s Note: The statements, opinions and data contained in all publications are solely those of the individual author(s) and contributor(s) and not of MDPI and/or the editor(s). MDPI and/or the editor(s) disclaim responsibility for any injury to people or property resulting from any ideas, methods, instructions or products referred to in the content.

