1. Introduction
The use of fibre-reinforced composite (FRC) materials has grown exponentially in recent years because of the attractive properties that they exhibit compared to conventional isotropic materials. While they pose an attractive proposition, issues such as the long manufacturing time, poor recyclability and difficult joinability all present challenges to the composites industry. Continuous fibre-reinforced thermoplastic (FRTP) composites aim to meet the challenges posed by thermoset FRCs. With the increasing demand for FRTP components comes a drive for improved FRTP sheet manufacturing processes. This includes improved process modelling, with the objective to reduce the reliance on costly and time-consuming trial-and-error methods and optimise process control. These simulations are a focus of much current research on a numerical level [
1,
2,
3,
4], including the generation of reliable material characterisation data to depict accurate material-forming behaviour.
The numerical characterisation and modelling of FRTPs, while similar to dry fabrics, is generally more complex because of the temperature and rate dependence of the viscoelastic material [
5]. The characterisation techniques used for FRTPs, however, are broadly similar to those for conventional thermoset composites. This is because all FRCs can be considered inextensible during forming. Therefore, several different modes of deformation, including intra-ply, inter-ply and out-of-plane mechanisms, are required to achieve sufficient geometric conformity in thermoforming processes [
6], as illustrated in
Table 1. While all these modes are important, one of the most prominent during the forming of woven FRC sheets is intra-ply shearing, as investigated by Sharma et al. [
7] and highlighted in
Table 1. The in-plane shear stiffness of a composite laminate is a dominant factor in the formation of wrinkles during forming, especially over areas of double curvature [
8]. It is therefore important that accurate intra-ply shear characterisation is conducted for input into forming simulations.
The two most common approaches adopted to evaluate FRTP laminate intra-ply shearing are picture frame tests and bias extension tests [
10]. Picture frame testing describes the rhombus shearing of a laminate when tensile forces are applied across its opposing corners after being mounted in a bespoke rig [
10,
11,
12,
13,
14,
15,
16,
17]. In contrast, bias extension testing involves clamping a rectangular piece of woven or cross-ply material such that the tows are oriented at ±45° to the applied tensile force [
8,
10,
17,
18,
19,
20,
21,
22,
23]. Picture frame testing is difficult with FRTPs because of the edge effects associated with the cool clamps, difficulties maintaining perfect specimen alignment (critical for picture frame analysis) and maintaining the larger specimens at a constant temperature over the whole surface [
14]. While work to overcome these issues is ongoing, such as that by Mattner et al. [
15], bias extension tests can be considered a viable alternative; the yarns in the centre shear zone are all free at both of their ends. They therefore do not experience any tension during testing, reducing the impact of edge effects caused by the material clamping. Furthermore, bias extension specimens are usually smaller, therefore making consistent sheet heating easier to achieve. Bias extension tests are typically accurate up to
40° shear angle, after which intra-ply slip (relative movement between individual tows) starts to occur because of the free edges [
10].
While FRTP shear characterisation has advanced greatly in recent years, to the authors’ knowledge, there are no published studies analysing the effects of non-isothermal conditions on thermoplastic composite shear behaviour. During FRTP sheet forming, even in short-cycle matched-die forming, significant through-thickness (out-of-plane) temperature distributions have been reported because of the significantly lower tool temperatures [
3]. A combination of high tool–laminate conduction and relatively low laminate through-thickness conduction leads to the rapid cooling of perhaps a single ply at the tool interface, yet the bulk laminate temperature may remain high for much longer periods of time. Since a large proportion of the intra-ply shearing occurs in the very final stages of a matched-die process, once no more in-plane bending can be accommodated [
24], a significant amount of shearing may occur while under this non-isothermal thermal profile. This behaviour is only exacerbated in alternative forming processes such as diaphragm forming [
25] or HyVR hybrid forming [
26], in which the slower processing speed results in larger through-thickness temperature distributions. The magnitude of the non-isothermal conditions is, no doubt, influenced by the laminate thickness, an effect that is not captured in the majority of current studies that only investigate single-ply shear behaviour.
The aim of this work was to ascertain the effect of non-isothermal through-thickness conditions on the shear behaviour of multi-ply FRTP laminates, in direct comparison to conventional isothermal studies. For the remainder of this work, the reference to the non-isothermal direction, through the laminate thickness, has been omitted for clarity. The methodology was based around novel non-isothermal bias extension shear tests, validated with non-isothermal hemisphere thermoforming. This forms part of a wider research agenda to increase the accuracy of material data for use within simulation routines. In particular, this work follows on from the recent state of the art in FRTP shearing published by Mattner et al. [
16], in which the shear behaviour of woven and non-crimp-fabric (NCF) FRTPs was investigated at near processing (isothermal) conditions. The direct implications of this work are significant regarding tool temperatures and forming time, both of which influence the magnitude of the non-isothermal profile that may be present during forming.
2. Testing Methodology
2.1. Material
All tests were carried out with carbon-fibre-reinforced polyamide-6 (CF-PA6) laminates, denoted ‘BÜFA
® WF-tex CF-PA6 4/8p 2 × 2T 0/90′, produced by BÜFA Thermoplastic Composites GmbH & Co. KG. The laminates exhibited a woven 2/2 twill architecture, with a fibre content of 50
3 wt%, as provided by the manufacturer. Two thicknesses of CF-PA6 sheet were obtained for testing, 4-ply (0.96 mm thick) and 8-ply (1.92 mm thick), in order to evaluate the effect of sheet thickness on the magnitude of the non-isothermal profile. The specimens were waterjet cut from the supplied sheets, measuring 210 mm (length) by 50 mm (width), allowing for 30 mm of clamping at each end. Therefore, the testing area measured 150 × 50 mm, exhibiting an aspect ratio of 3. An aspect ratio of at least 2.5 is recommended in the literature [
23,
27] to increase the homogeneity of the distribution of shear deformation in the sample. Each ply in the laminate was oriented at 0/90° to reduce the likelihood of inter-ply effects at lower shear angles. The full material properties, as supplied by the manufacturer, can be found in
Table 2.
2.2. Thermal Profiles
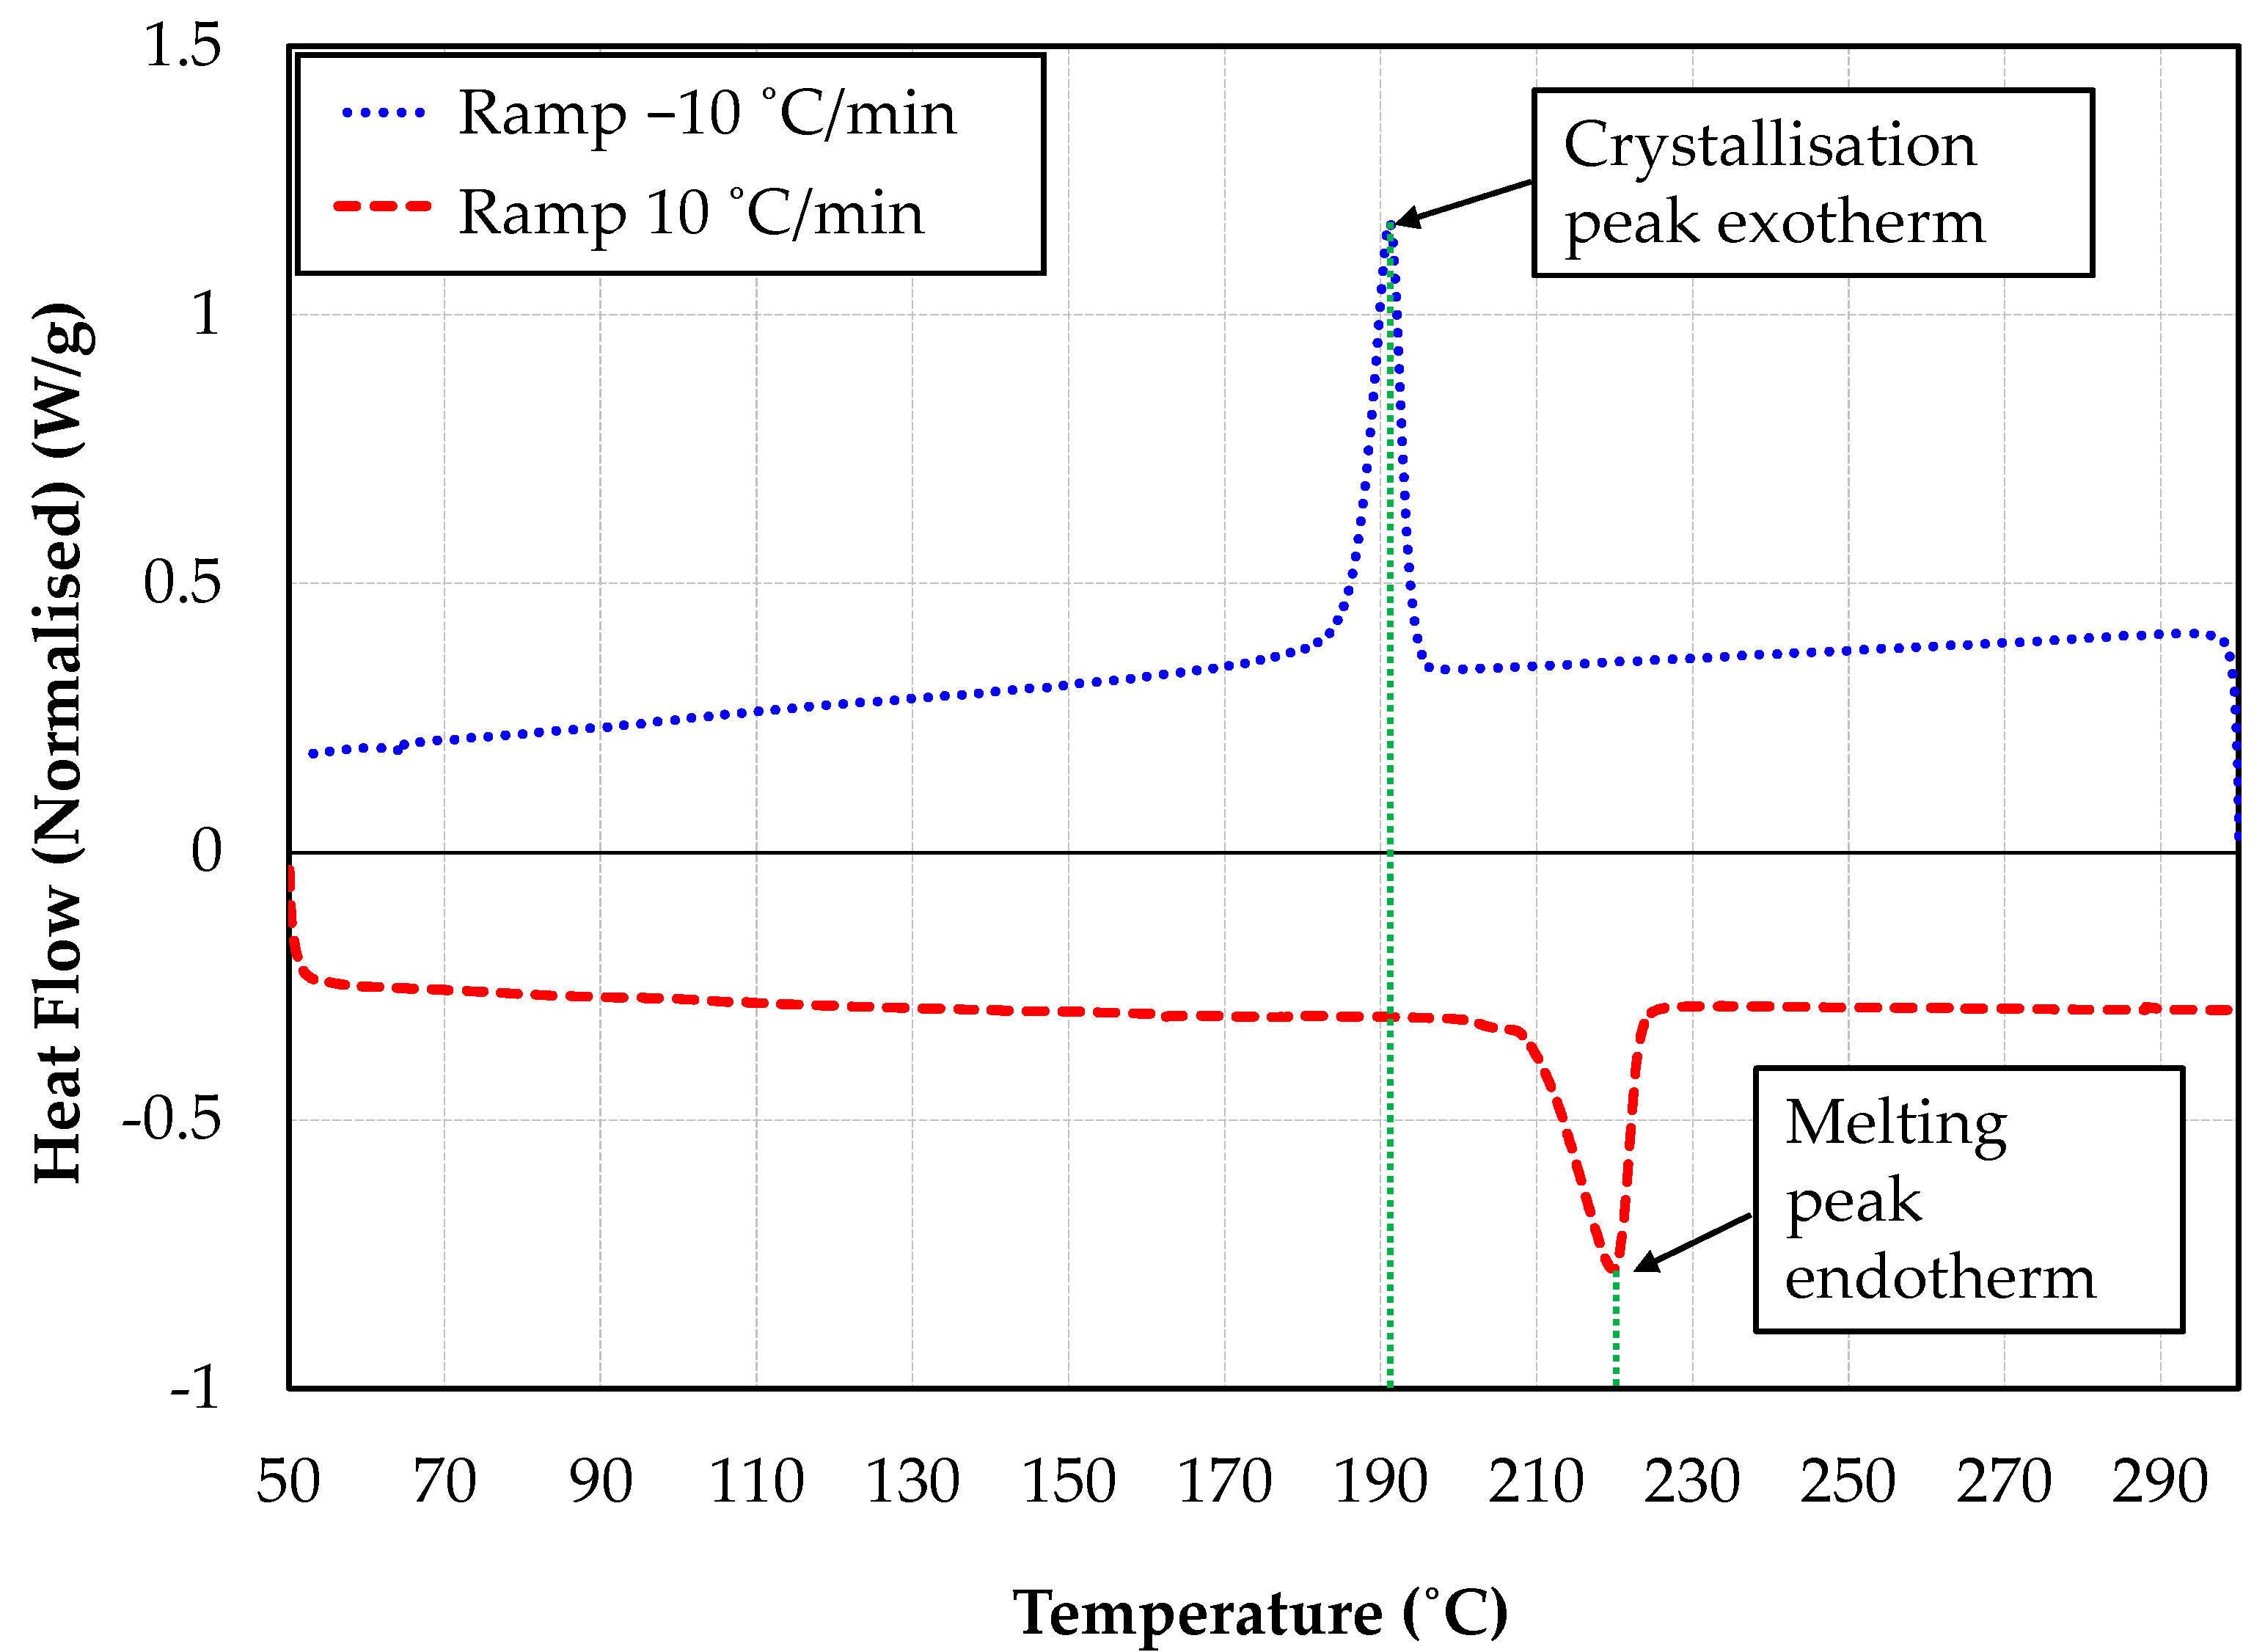
The thermal behaviour of the CF-PA6 laminates was determined using differential scanning calorimetry (DSC). A small sample of CF-PA6 was heated from 50 °C at 10 K/min up to a maximum of 300 °C, from which it was cooled at the same rate down to 50 °C. The results from the DSC testing are illustrated in
Figure 1, positive heat flow being in the exothermic direction. It is shown that the sample was fully melted at a temperature of approximately 220 °C, and for a cooling rate of 10 K/min, the onset of crystallisation was approximately 190–195 °C. The crystallisation onset point for PA6 is, however, heavily linked to the cooling rate, as shown by Kugele et al. [
28].
Since the aim of this work was to compare the shear behaviour of both isothermal and non-isothermal laminates, five initial isothermal temperatures were devised for testing: 190 °C (onset of crystallisation), 210 °C, 230 °C, 250 °C and 270 °C. This temperature range allowed the authors to capture the intra-ply shear behaviour of CF-PA6 laminates at a range of thermal conditions. It was considered unnecessary to evaluate temperatures below 190 °C because of the vast increase in shear force that would be expected post-crystallisation. Furthermore, the authors felt 270 °C was at the top of the materials-forming window, with further increases in temperature yielding no change in the polymer’s mechanical properties.
For the non-isothermal testing, the work of Wang et al. [
3] illustrated that a temperature difference of 40 °C is achievable between the upper and lower faces of a laminate during forming. To further test the influence of non-isothermal conditions, two more temperature profiles of 20 °C and 60 °C between the temperatures on the front and back faces were also devised. These three non-isothermal profiles were used in conjunction with the five isothermal values, with the front face maintained at one of the given isothermal values, and the rear face either 20 °C, 40 °C or 60 °C cooler, respectively. This methodology was applied only up until the rear face temperature was as cool as 190 °C, as any further cooling was deemed to vastly reduce specimen mobility because of the onset of crystallisation.
A thermal test matrix was devised for the experiments, illustrating the five isothermal conditions and nine non-isothermal conditions (
Table 3). The test matrix does not include the different sample thicknesses experimented, or the repeats conducted for each test.
2.3. Bias Extension Testing
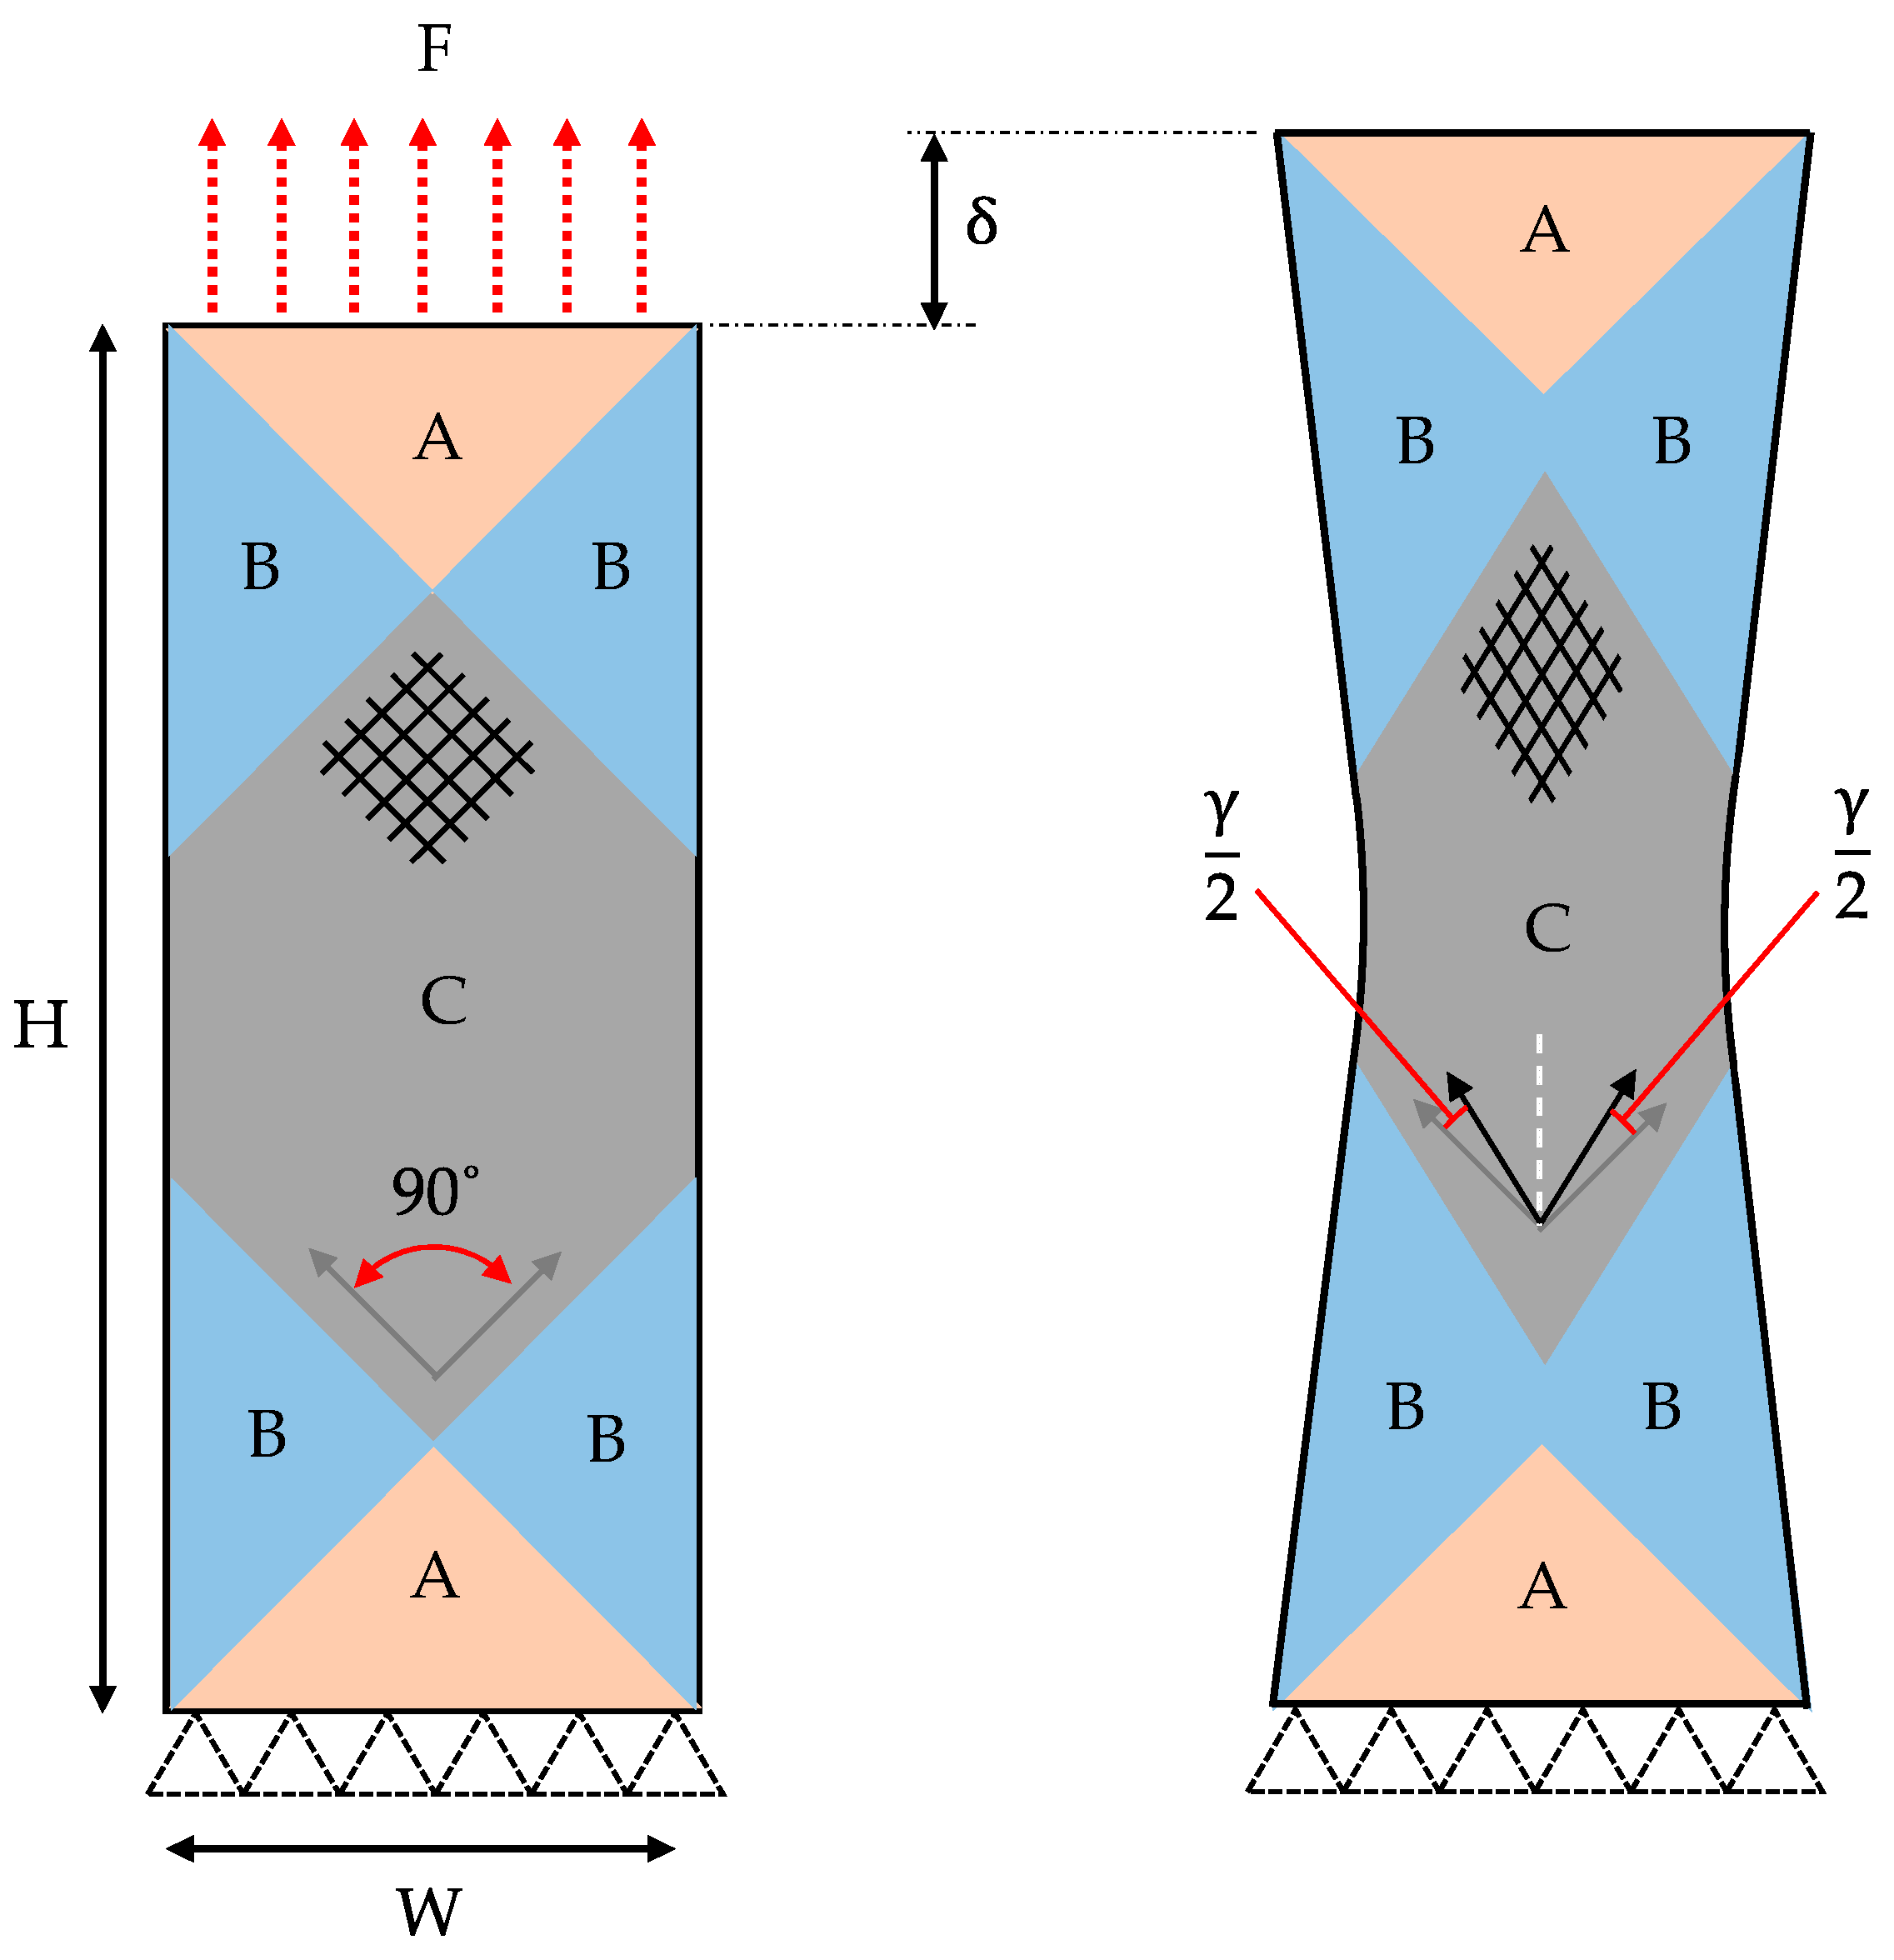
The bias extension test deforms the rectangular FRTP composite specimen by stretching it parallel with the long side of the specimen, originally at 45° to both weft and warp directions. The fibrous nature of the woven laminate leads to three distinct shear zones: A, B and C (
Figure 2). Zone A consists of a region of undeformed material; hence, the shear angle,
, equals zero. Zone C is the region of particular interest, where pure shear is enacted on the specimen because of both weft and warp yarns having free ends. Zone B is a region in which one yarn direction is clamped at its end, therefore exhibiting a shear strain approximately half that of zone C.
The shear angle in zone C,
, can be related to the vertical displacement of the upper gripper of the tensile tester,
[
17]:
where H and W are the height and width of the specimen, respectively. This equation is applicable up until slippage between individual tows (intra-ply slip) occurs; this limiting shear angle is material dependent, usually lying between 40 and 50° [
10].
Many previous works use the derivation from Cao et al. [
21] for the normalised shear force with respect to the shear angle, related to the specimen dimensions and applied tensile force. This relationship is rate independent and assumes that the power produced because of the external force is dissipated in zones B and C. Harrison and Hartel [
22] conducted a thorough investigation into the different normalisation methods available, concluding that for a rate-dependent material, an alternative derivation by Harrison et al. [
10] is likely the most suitable for numerical compatibility with a simulation routine. This derivation is based on a Newtonian fluid approximation and is aimed at reducing the ‘shear softening effect’ outlined by Machado et al. [
19]. The softening effect is a phenomenon in which the shear force with respect to the shear angle is underestimated because of region C not only dominating the shear-strain response but also the shear-strain rate response. The normalised shear force, F
sh, can therefore be expressed as:
where F is the axial force. Furthermore, X, a function of shear angle, can be defined as:
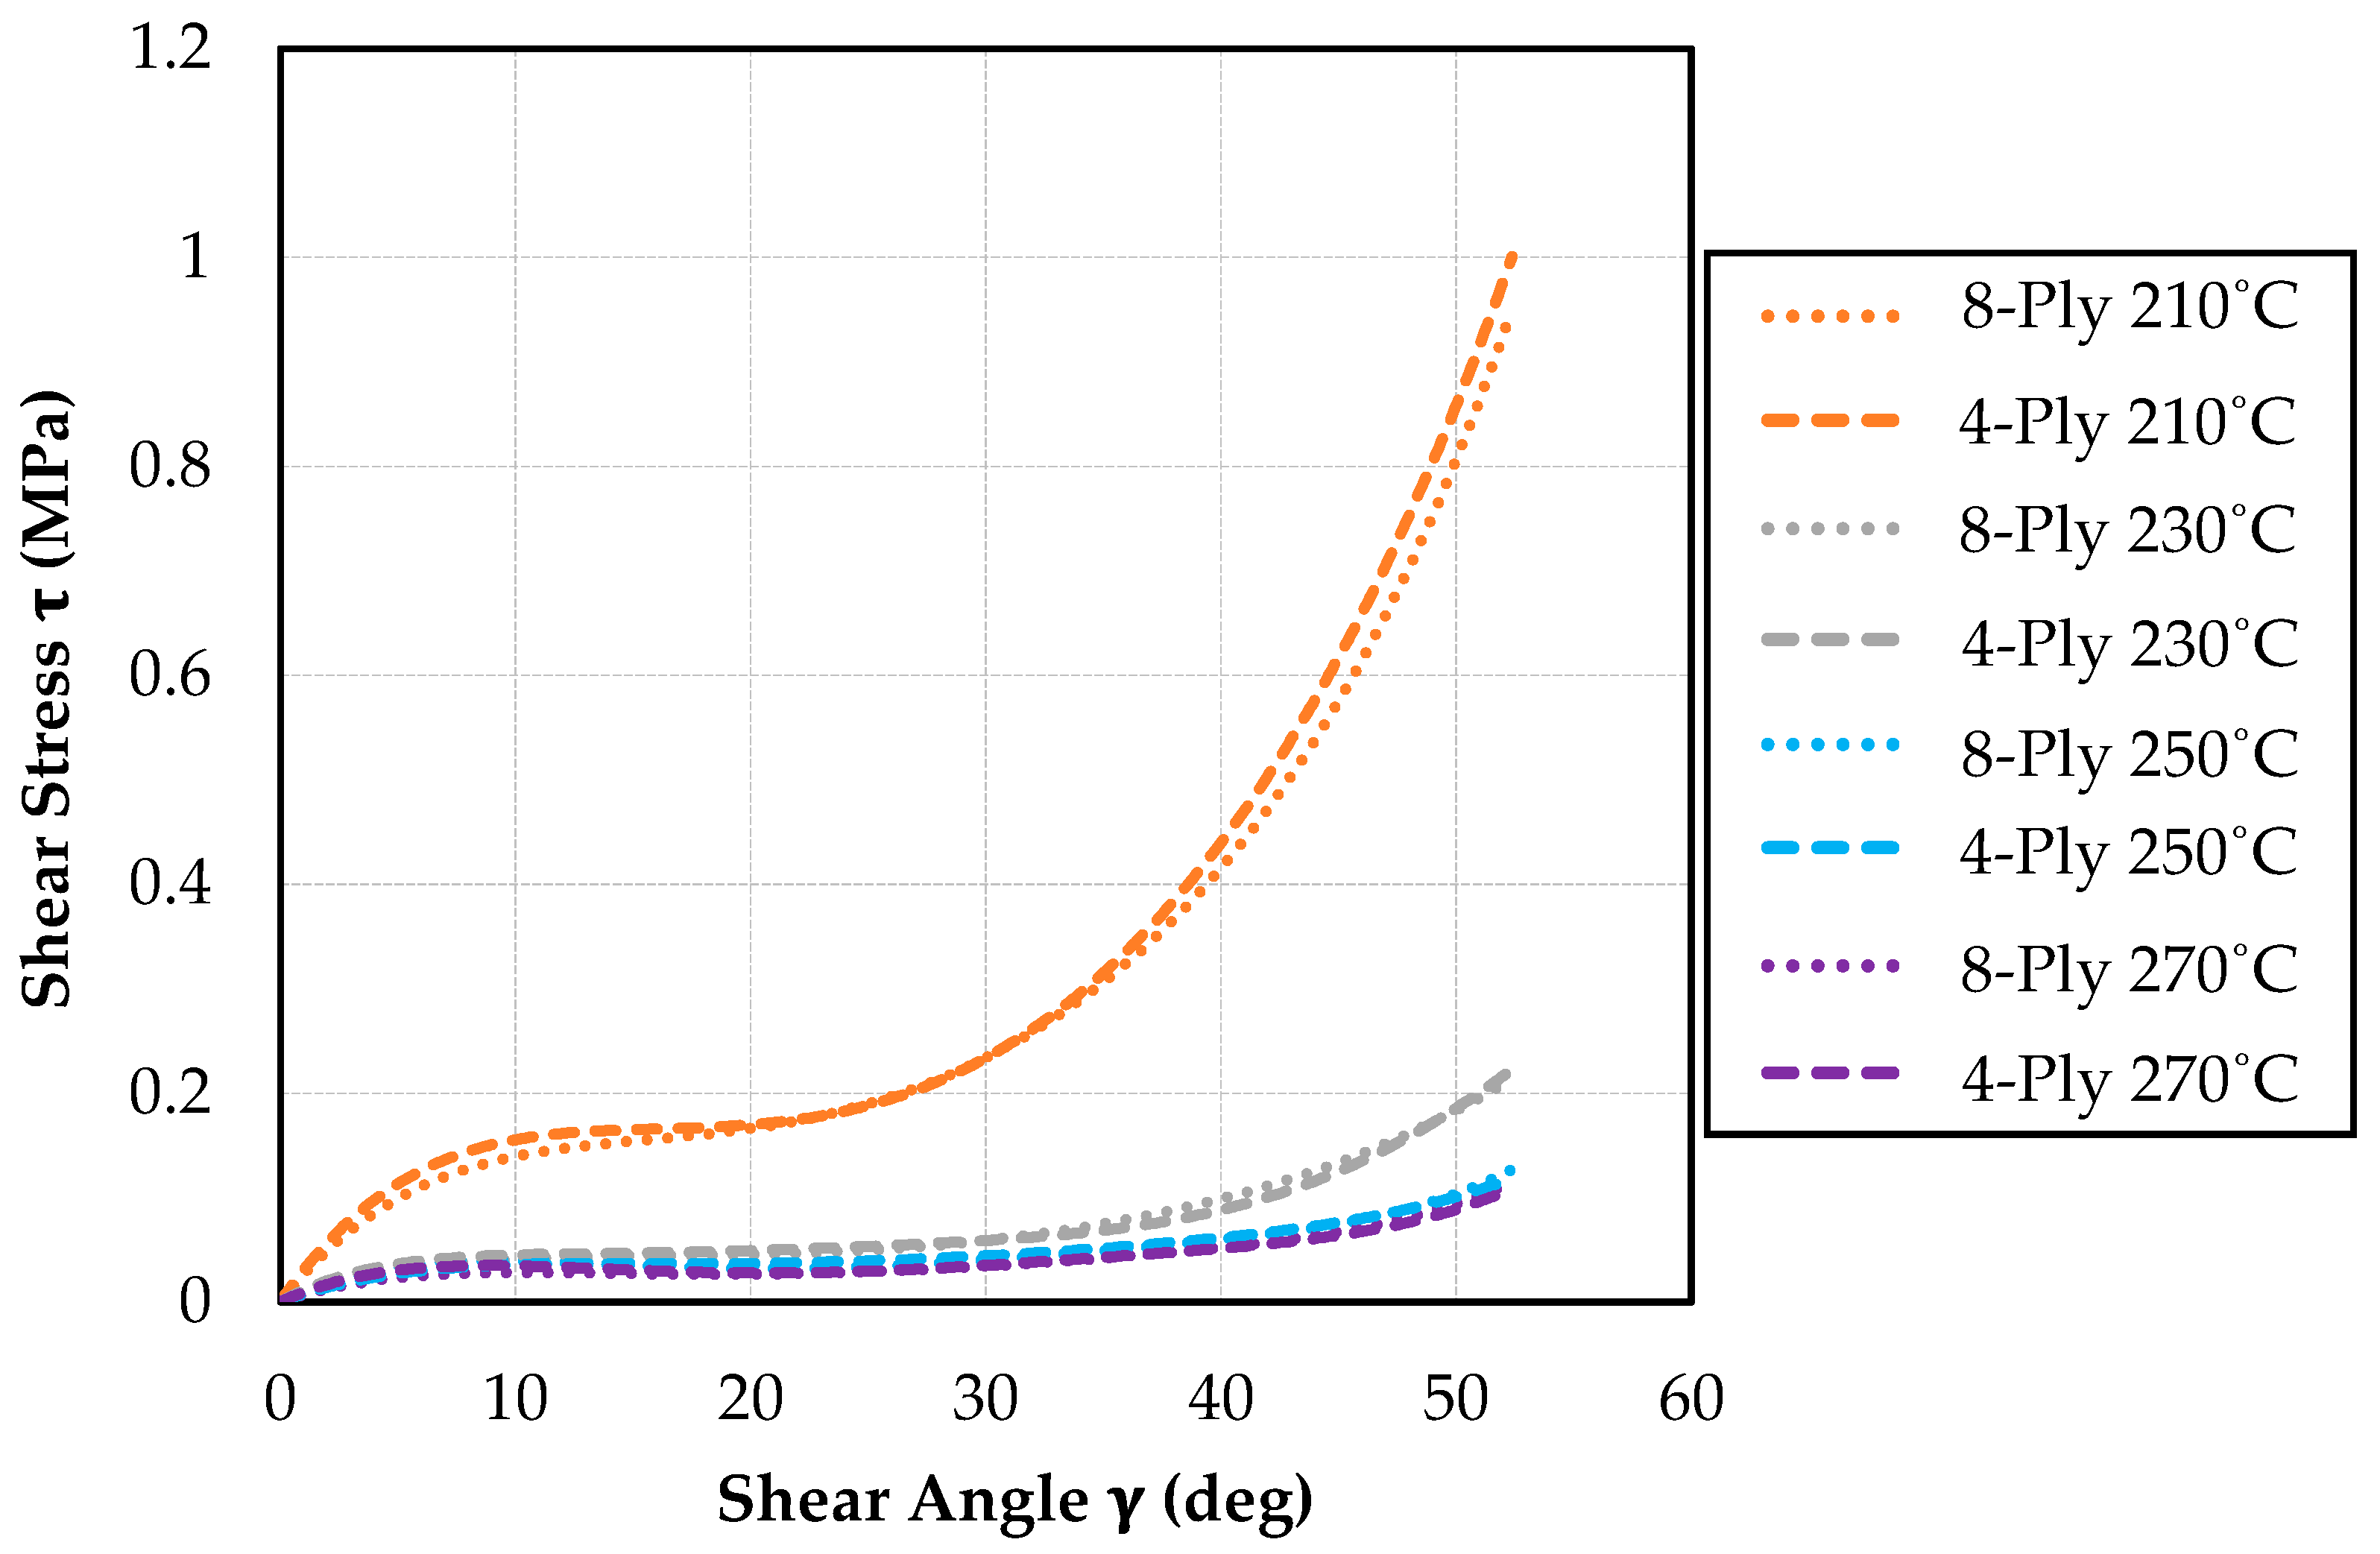
Finally, the shear stress, , can be calculated by dividing the normalised shear force by the specimen thickness, t. These equations enabled the authors to produce normalised shear force versus shear stress curves for each dataset.
2.4. Experimental Procedure
Bias extension tests were conduced using an Instron 5581 Universal Testing Machine, equipped with a 1 kN load cell. The specimens themselves were mounted to the Instron using custom grips that included two RS PRO Mica heating pads each. The heating pads reduced the specimen edge effects caused by the otherwise cool clamps and provided a more consistent value of the specimen height, H, with no solid regions present at either end. The clamps operated using two sprung bolts each to compensate for the slight reduction in laminate thickness during heating that causes normal fastenings to become loose. Since this study concerned non-isothermal temperatures, a conventional environmental chamber would not have been applicable for this study. Because of this, mounted on each side of the laminate was a 3000 W Sealey IWMH3000 Infrared Quartz Heater, chosen because of the short-to-medium-wave IR emitter response time. The heaters were angled at 5.8° to reduce the influence of convective heating at the top of the specimen.
During the bias extension testing, the temperature of each specimen face was monitored using two Calex PC21MT-4 Type K thermocouple infrared temperature sensors. These non-contact temperature probes were calibrated by the manufacturer to be within
°C, up to 300 °C. The sensors formed part of a closed-loop system, in which the IR heaters were controlled in a proportional–integral–derivative (PID) loop to maintain steady surface temperatures. The temperature controllers were calibrated with a low proportional value, therefore eliminating the possibility of an overshoot (heating) or undershoot (cooling) in surface temperature. A schematic of the full experimental setup is illustrated in
Figure 3.
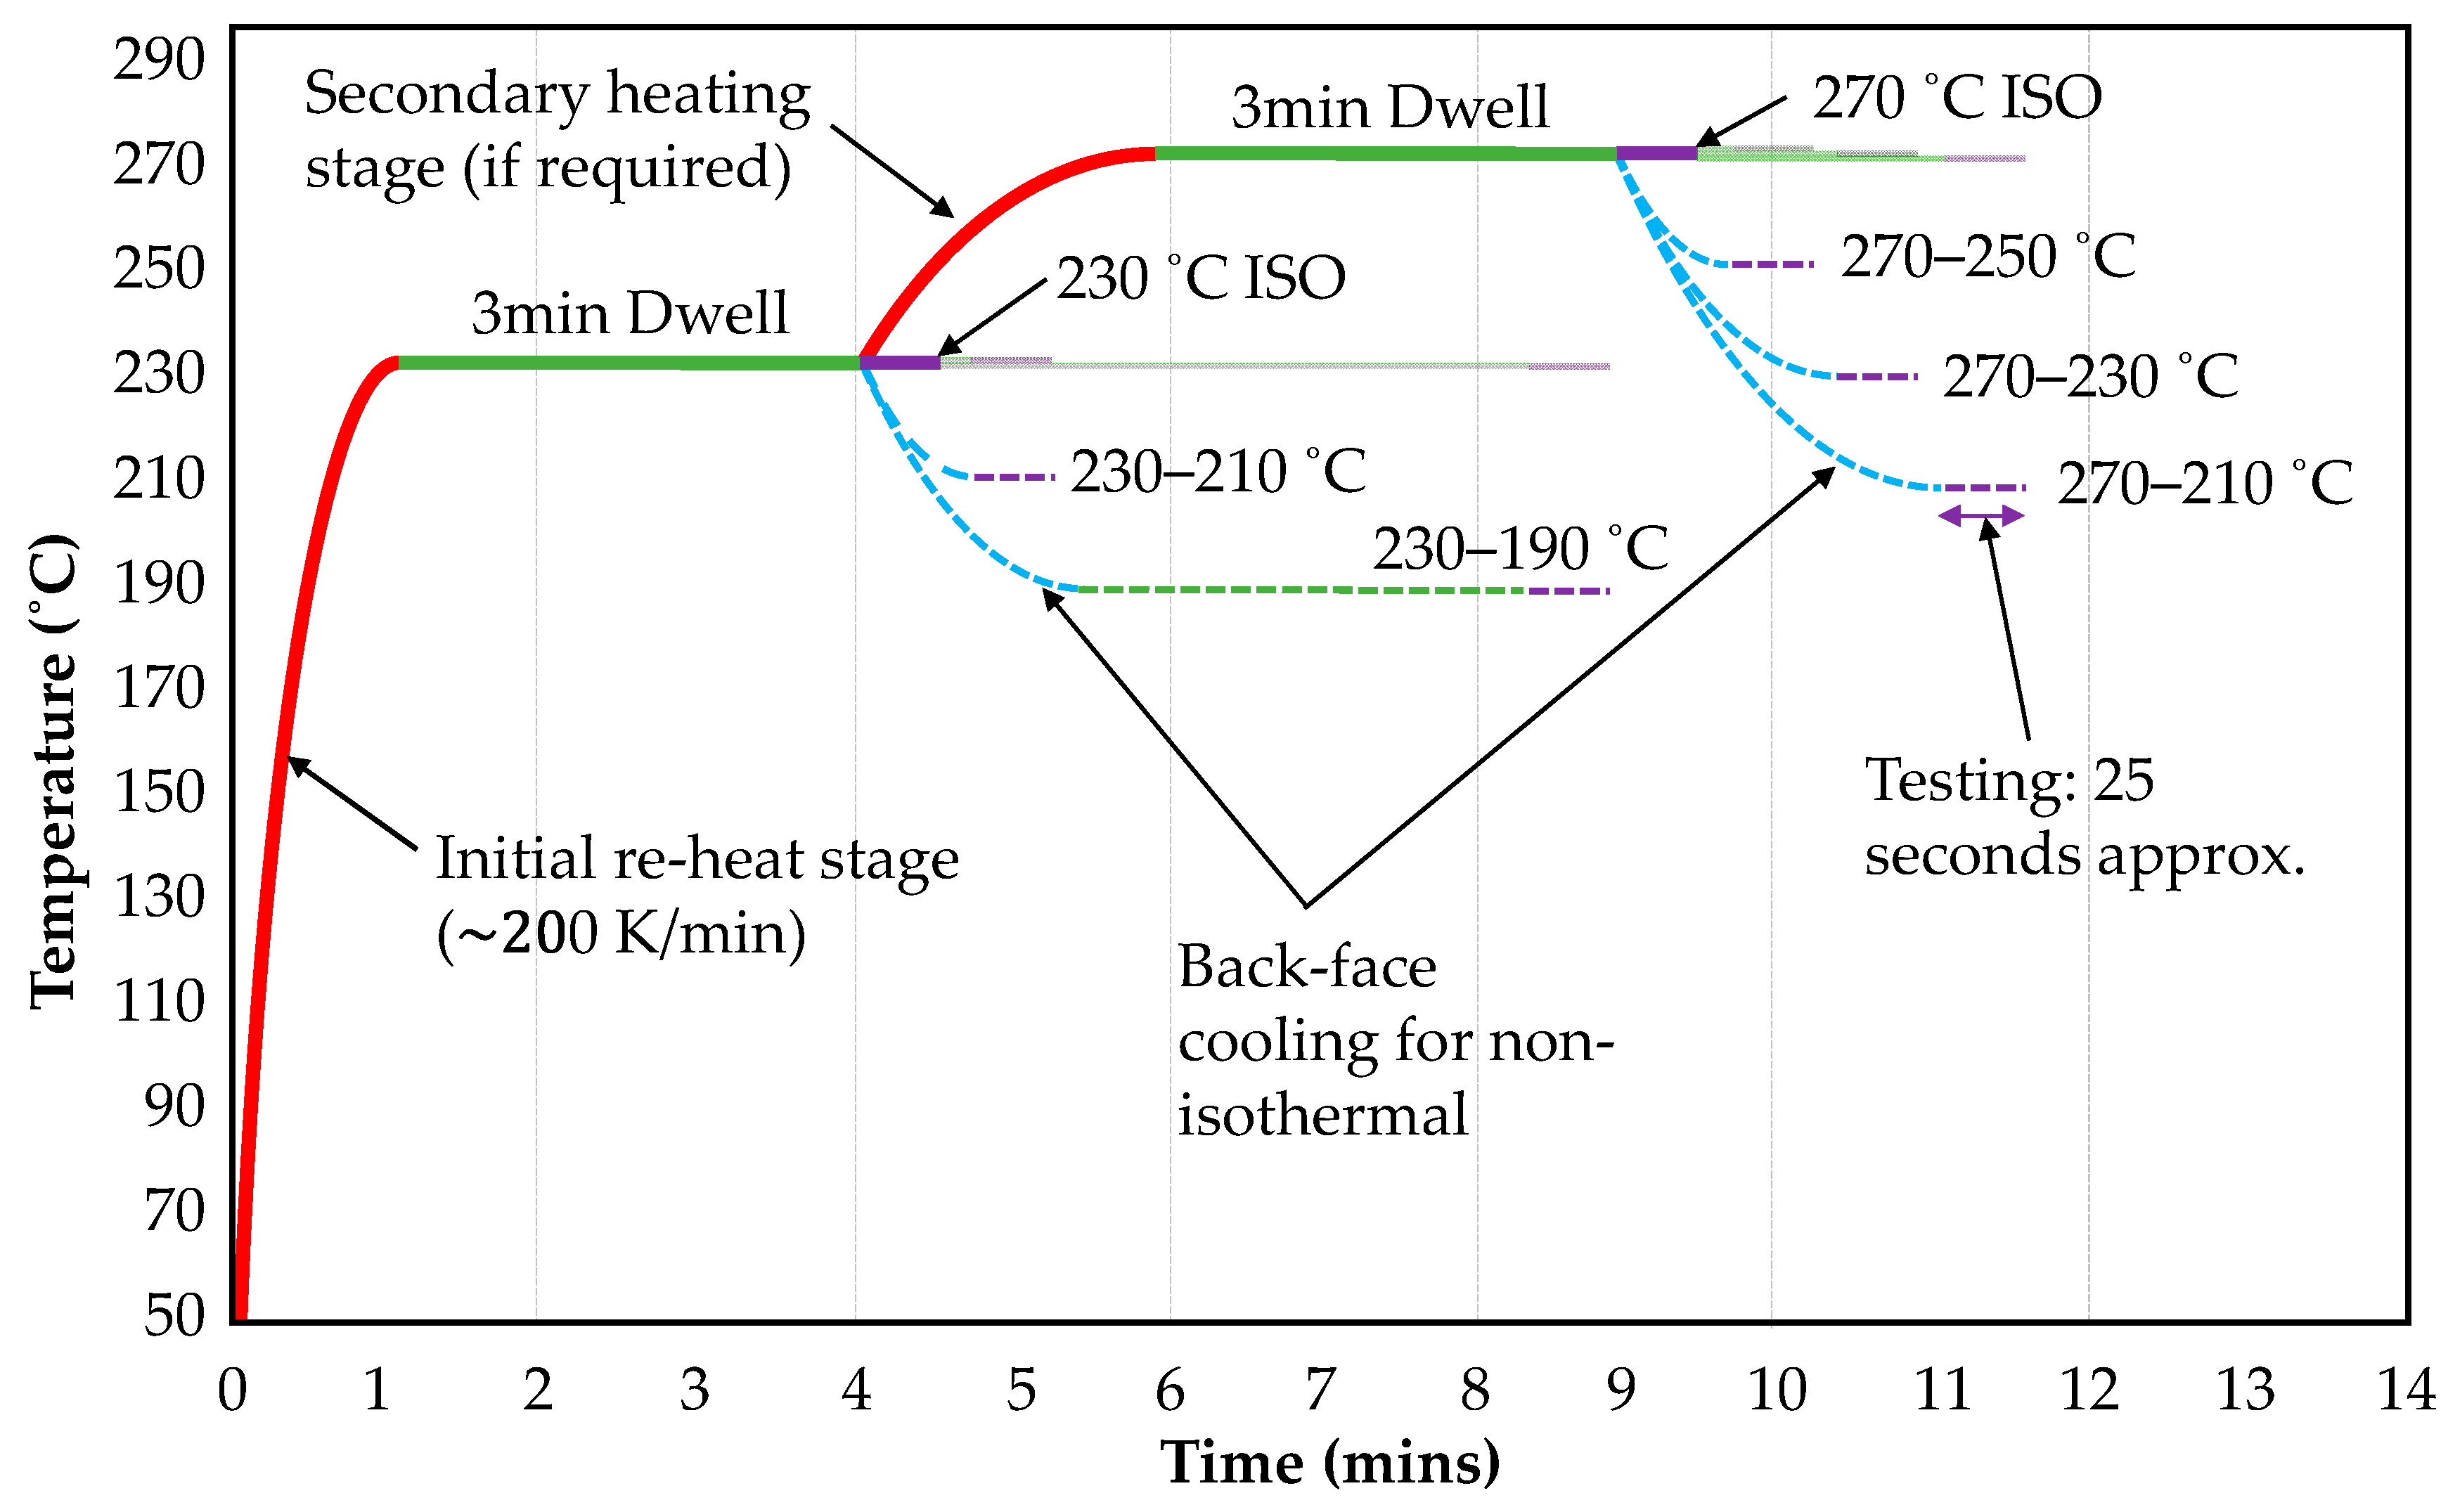
All specimens were heated isothermally up to 230 °C and held at this point for 3 min. This was to allow the specimens to melt fully, as prescribed by the DSC testing. Furthermore, this replicated the material re-heat stage of an FRTP thermoforming routine, in which a laminate is heated before the forming stage, therefore more accurately recreating real-world forming conditions. Each specimen was then heated or cooled to the desired isothermal temperature and held for a further 2 min to allow the thermal profile to reach equilibrium. Finally, for the non-isothermal tests, one of the heaters was regulated to cool the rear face of specimens (denoted the ‘cold side’) to the desired non-isothermal temperature, while the other heater maintained the temperature of the front face of the specimens (denoted the ‘hot side’) at a constant level. The non-isothermal tests began as soon as the cold side temperature reached to the desired value, with the aim being to accurately replicate the profile of a non-isothermal laminate during forming. An exception to this was tests conducted with a cold-side temperature of 190 °C, where a final 3 min dwell existed before testing, such that the laminate cooling rate did not influence the crystallisation behaviour. The thermal history of all 270 °C and 230 °C isothermal and non-isothermal tests are illustrated in
Figure 4.
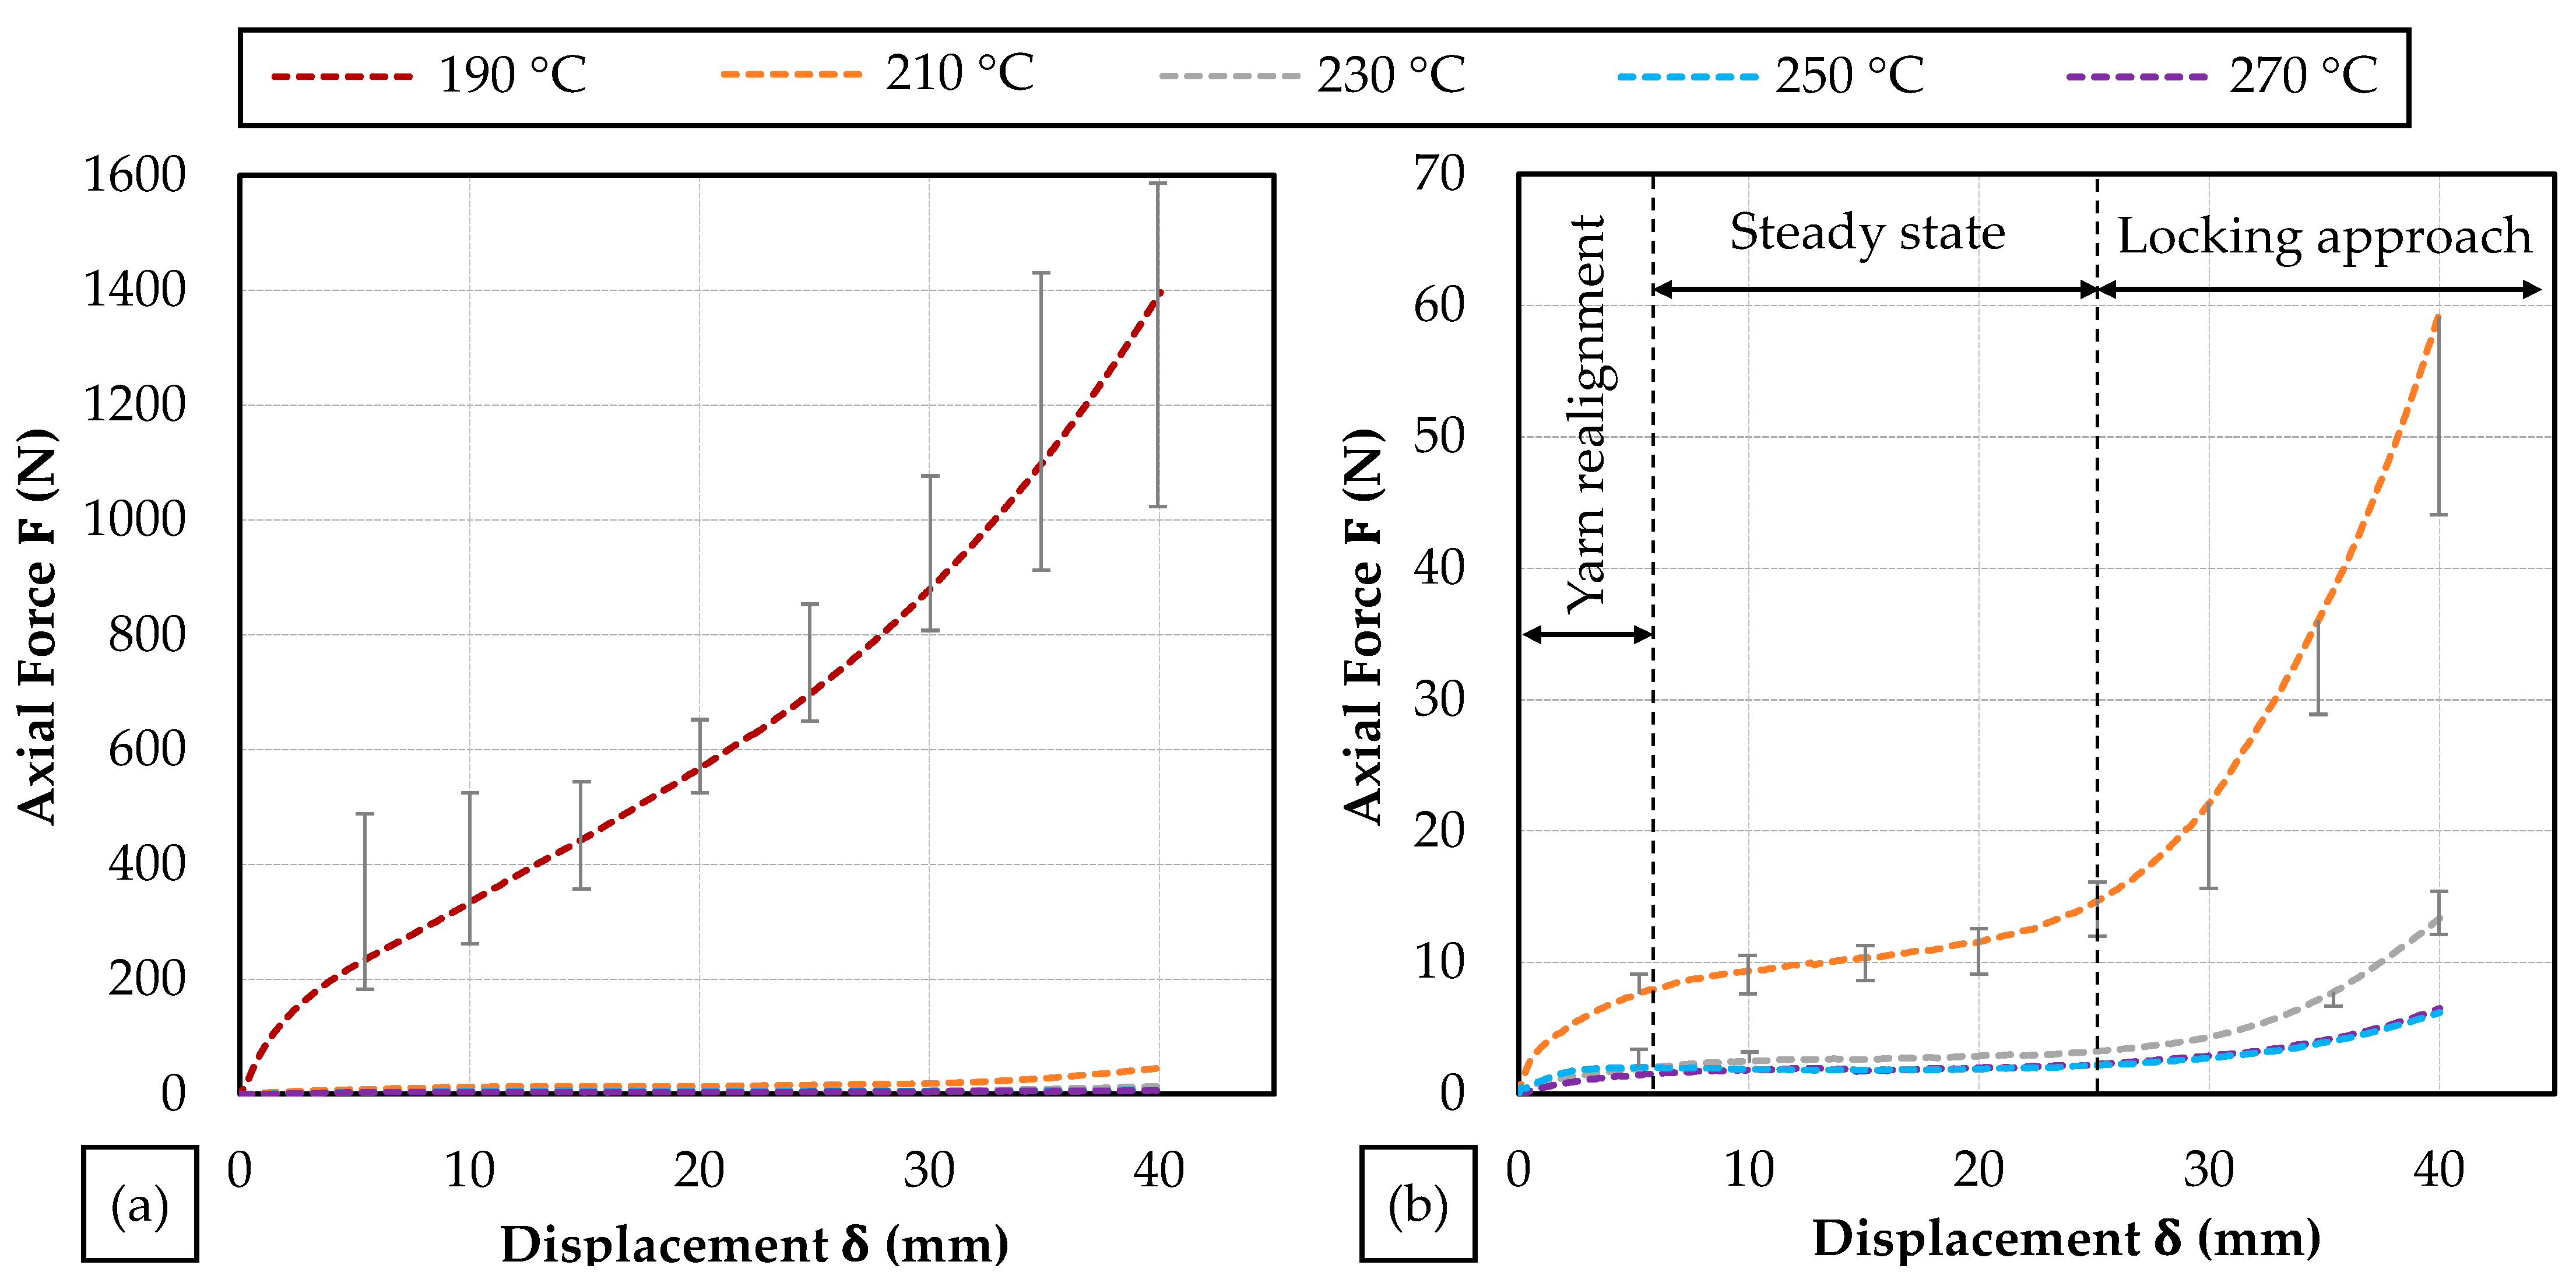
The samples were extended in the universal testing machine at a constant rate of 100 mm/min to a displacement of 42 mm, which was enough to capture specimen shear behaviour up to fibre locking. Only 40 mm displacement was required for the desired results; however, an overshoot of 2 mm was deemed necessary because of the deceleration of the universal testing machine as it approached maximum displacement. Force versus displacement data were recorded every 10 ms for each sample, and two repeats were undertaken to increase experimental reliability.
4. Discussion
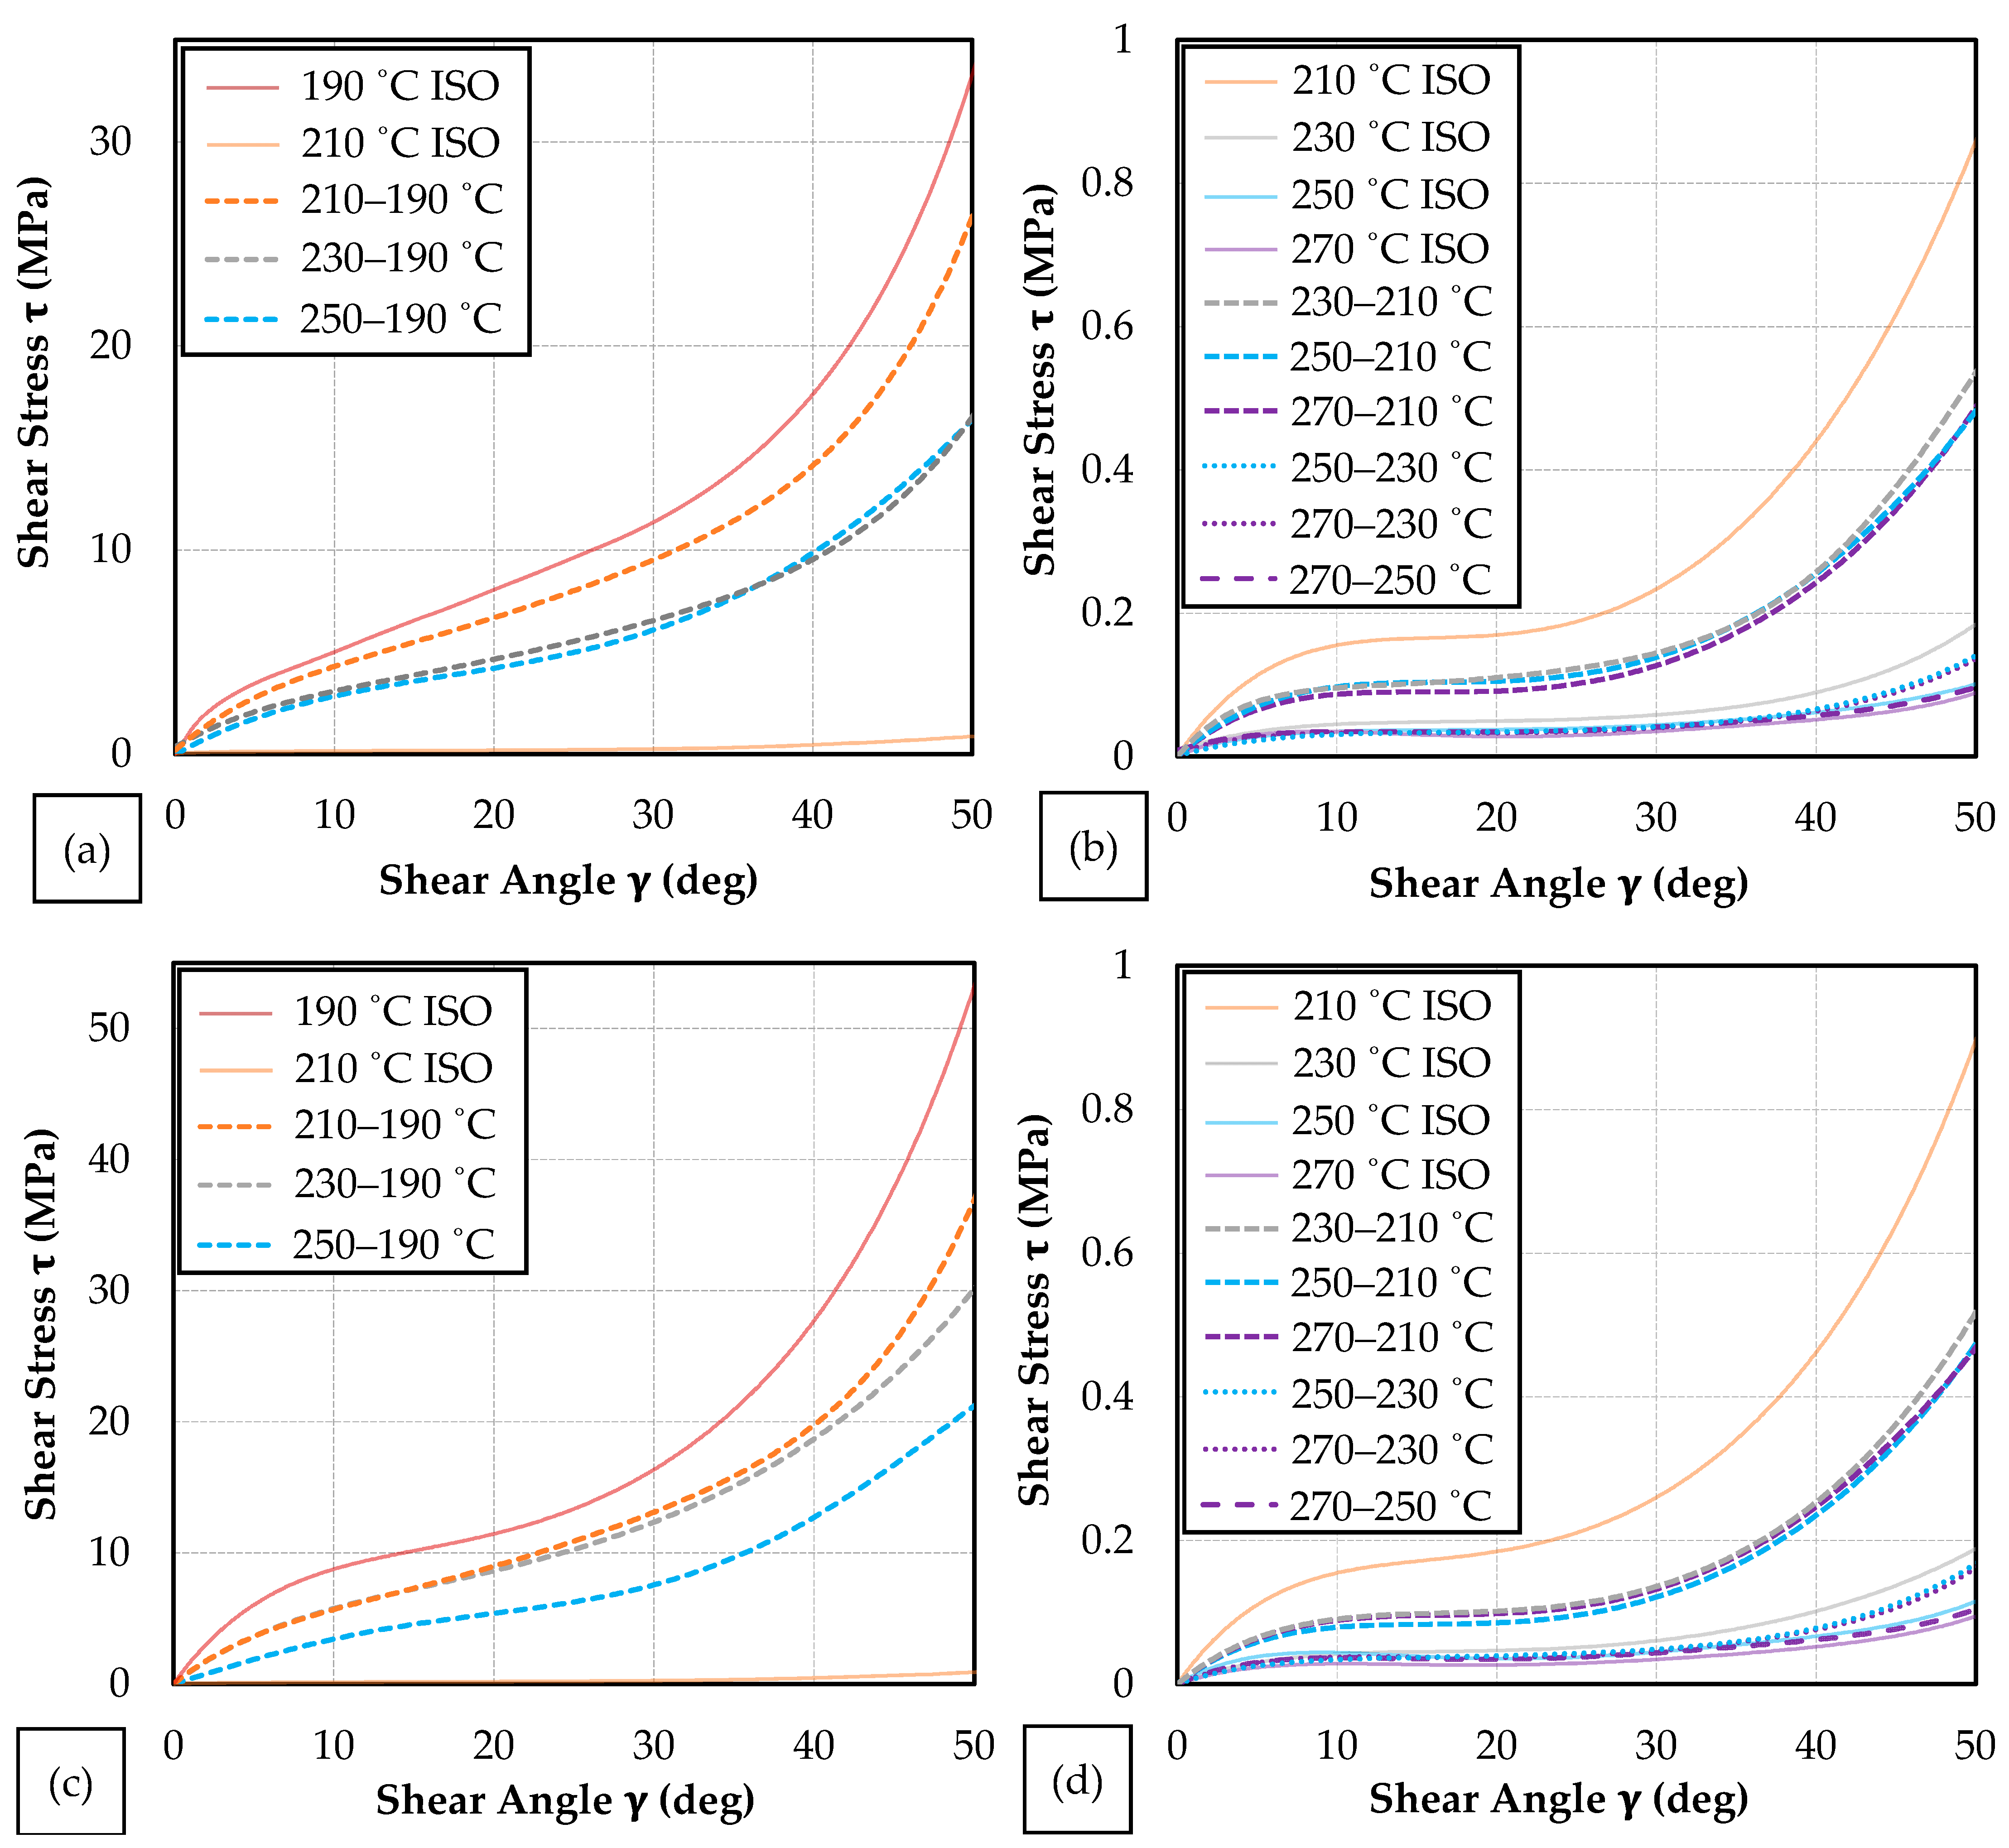
The results illustrate that a non-isothermal laminate above the crystallisation onset point, subjected to intra-ply shear deformation, yields a shear curve profile that lies within the bounds of the two respective isothermal profiles. This can be seen as individual clusters of non-isothermal data (
Figure 9b,d), where the shear behaviour of each laminate is heavily skewed by a cooler rear face. These results are what one may expect, the total shear force being a summation of the force exerted from each individual ply at its own respective temperature, assuming a linear thermal profile through the laminate thickness. This is a reasonable assumption to make for the non-isothermal bias extension testing, as the experimental conditions warrant only convective heat loss from the laminate during testing. While the in-plane conductivity of FRTP laminates is considered to be small, it is still an order of magnitude higher than the level of convection from each face. This therefore creates an approximately linear out-of-plane thermal profile, meaning that the temperature of each ply, through the laminate thickness, can be linearly interpolated accordingly.
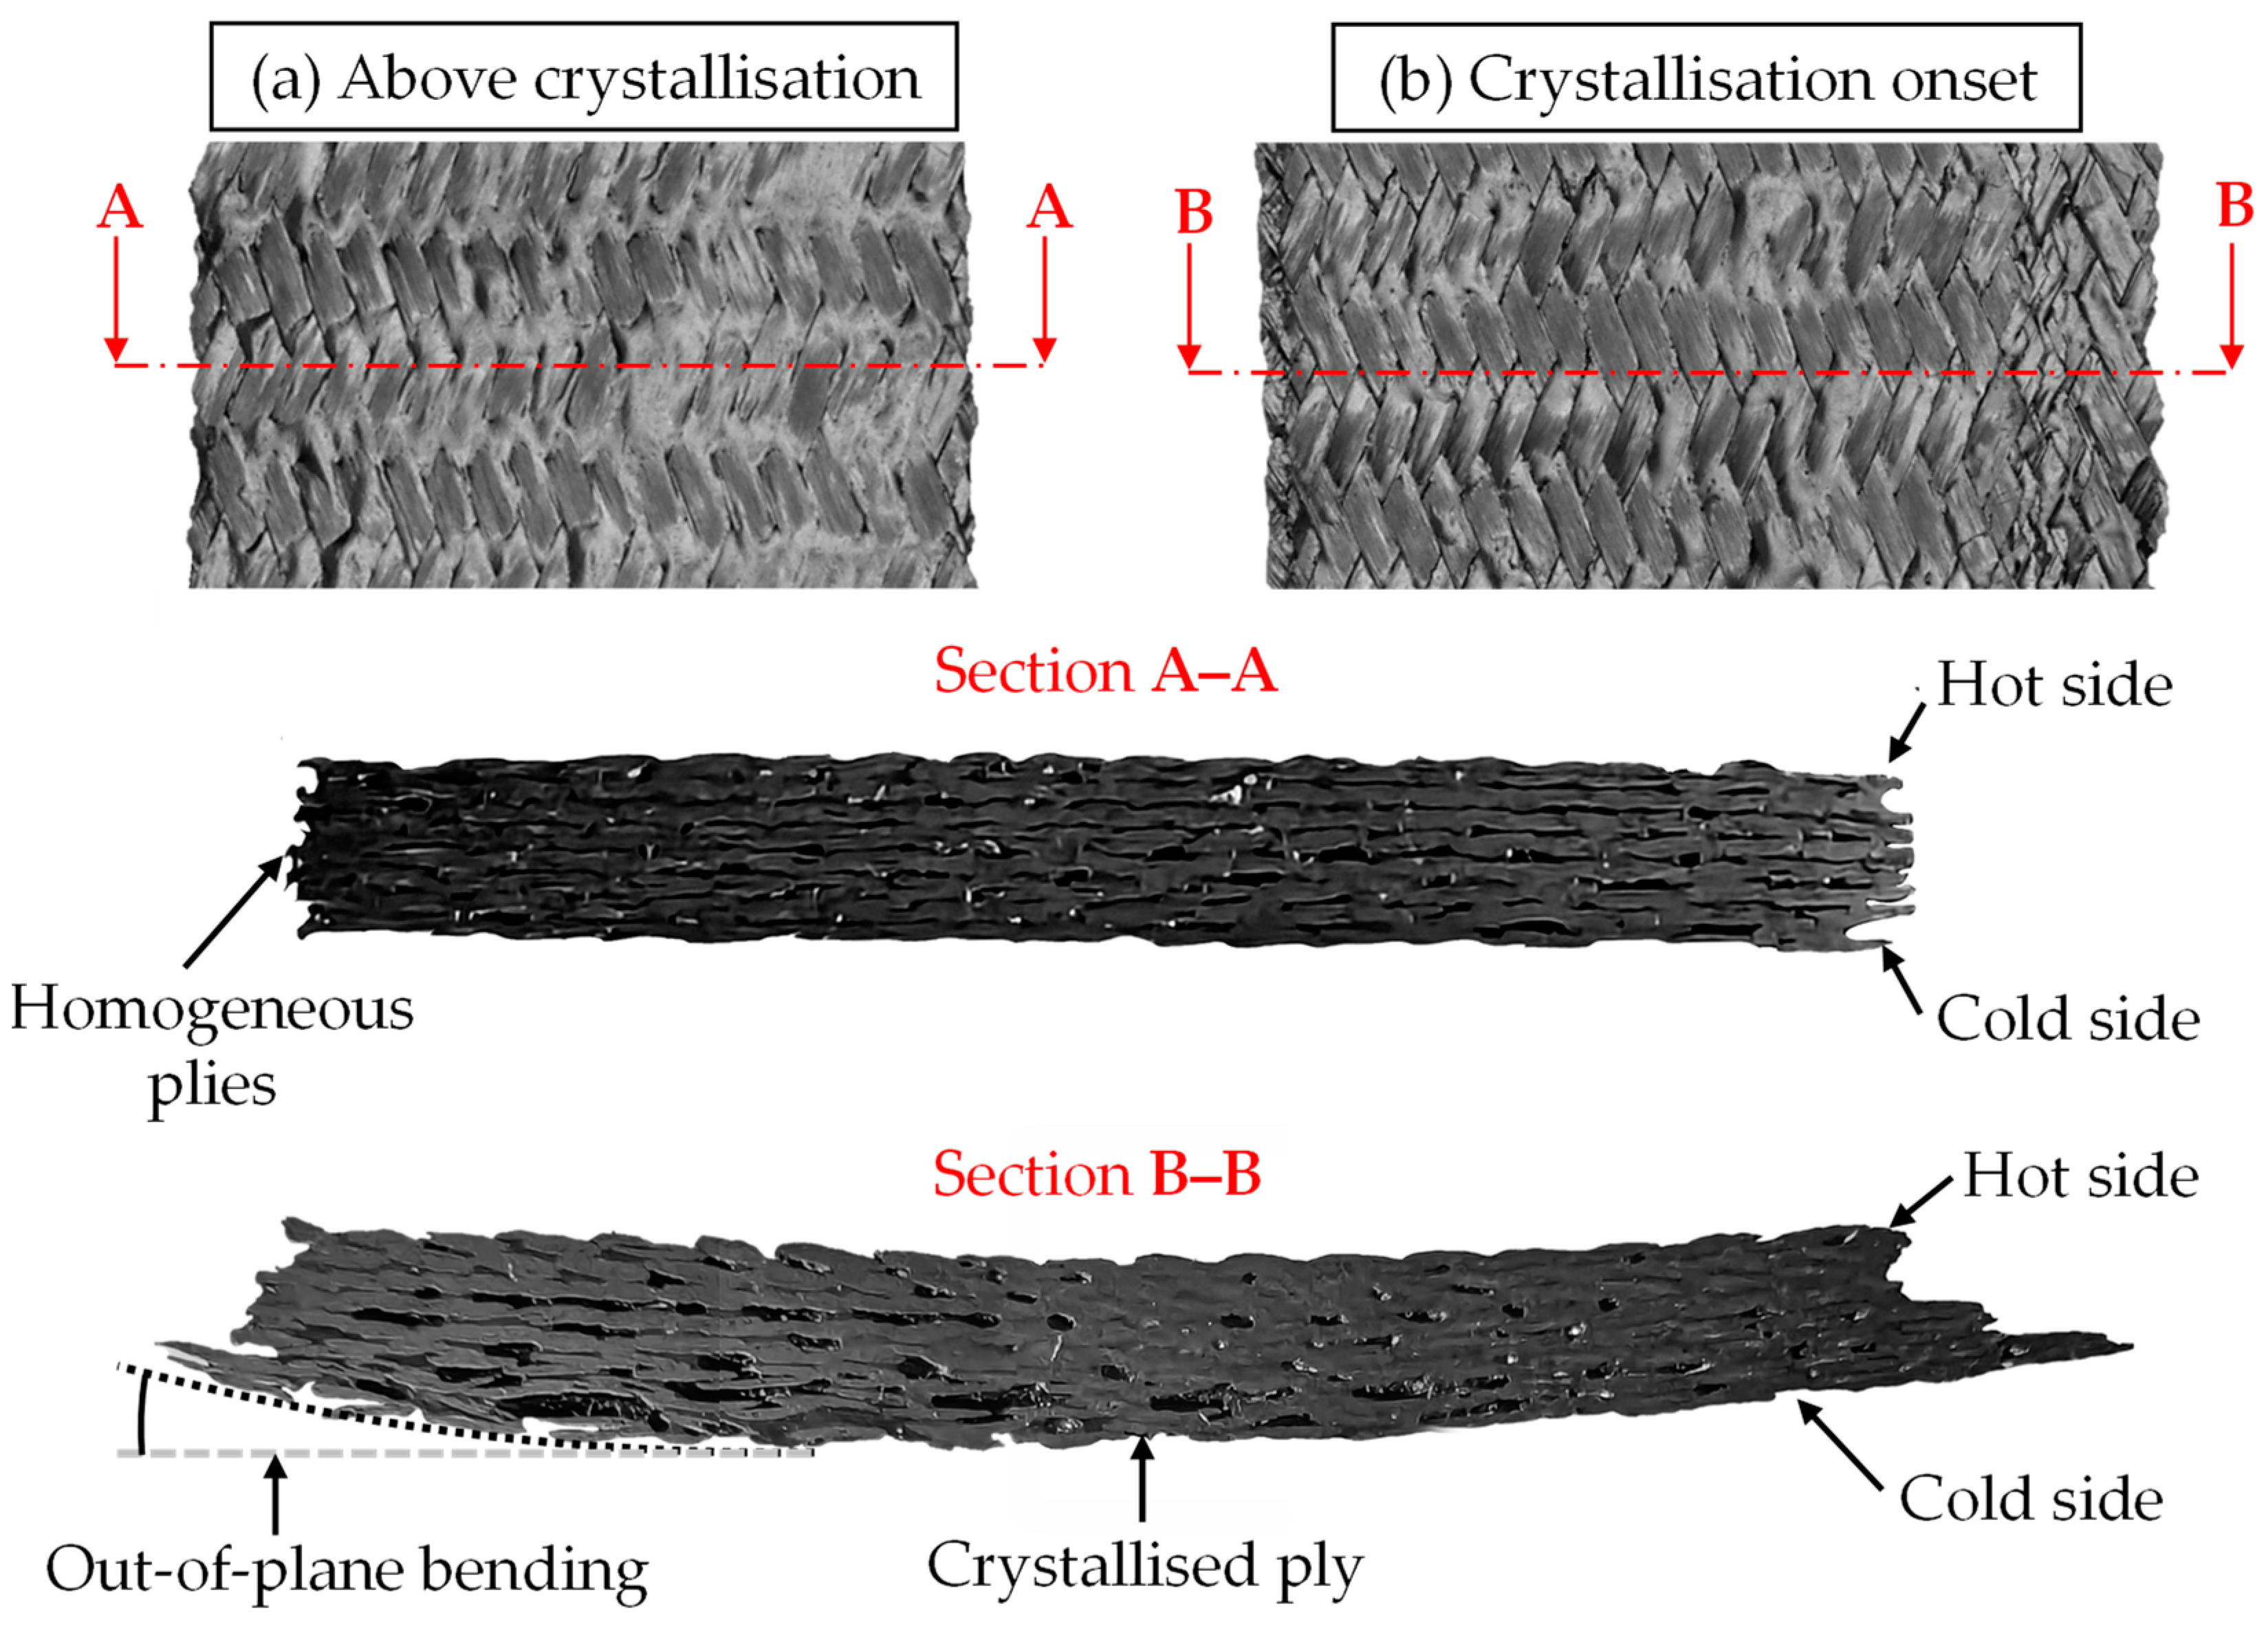
Once the crystallisation point was met, however, as per the DSC data illustrated in
Figure 1, the same correlation did not appear to be present. This is due to other methods of deformation, including inter-ply slip and out-of-plane bending, having a severe impact on bias extension results. This effect is illustrated in
Figure 6; all plies in a FRTP specimen above crystallisation deform in a homogeneous nature, with consistent shear angles in each ply within the laminate. Upon the onset of crystallisation, however, there is a clear ‘stepping’ of plies through the thickness, as the cold-ply temperature is too low to allow shearing to take place. This illustrates that Equation (4) is not necessarily valid for these temperatures and absolute results should be taken as an indication only because of their erroneous nature. Even if other methods of deformation have taken place for these samples, there is clearly a dramatic effect when one laminate face approaches crystallisation onset. In this case, laminate shear stresses increased by over 200×, even if just one of the plies was restricting movement.
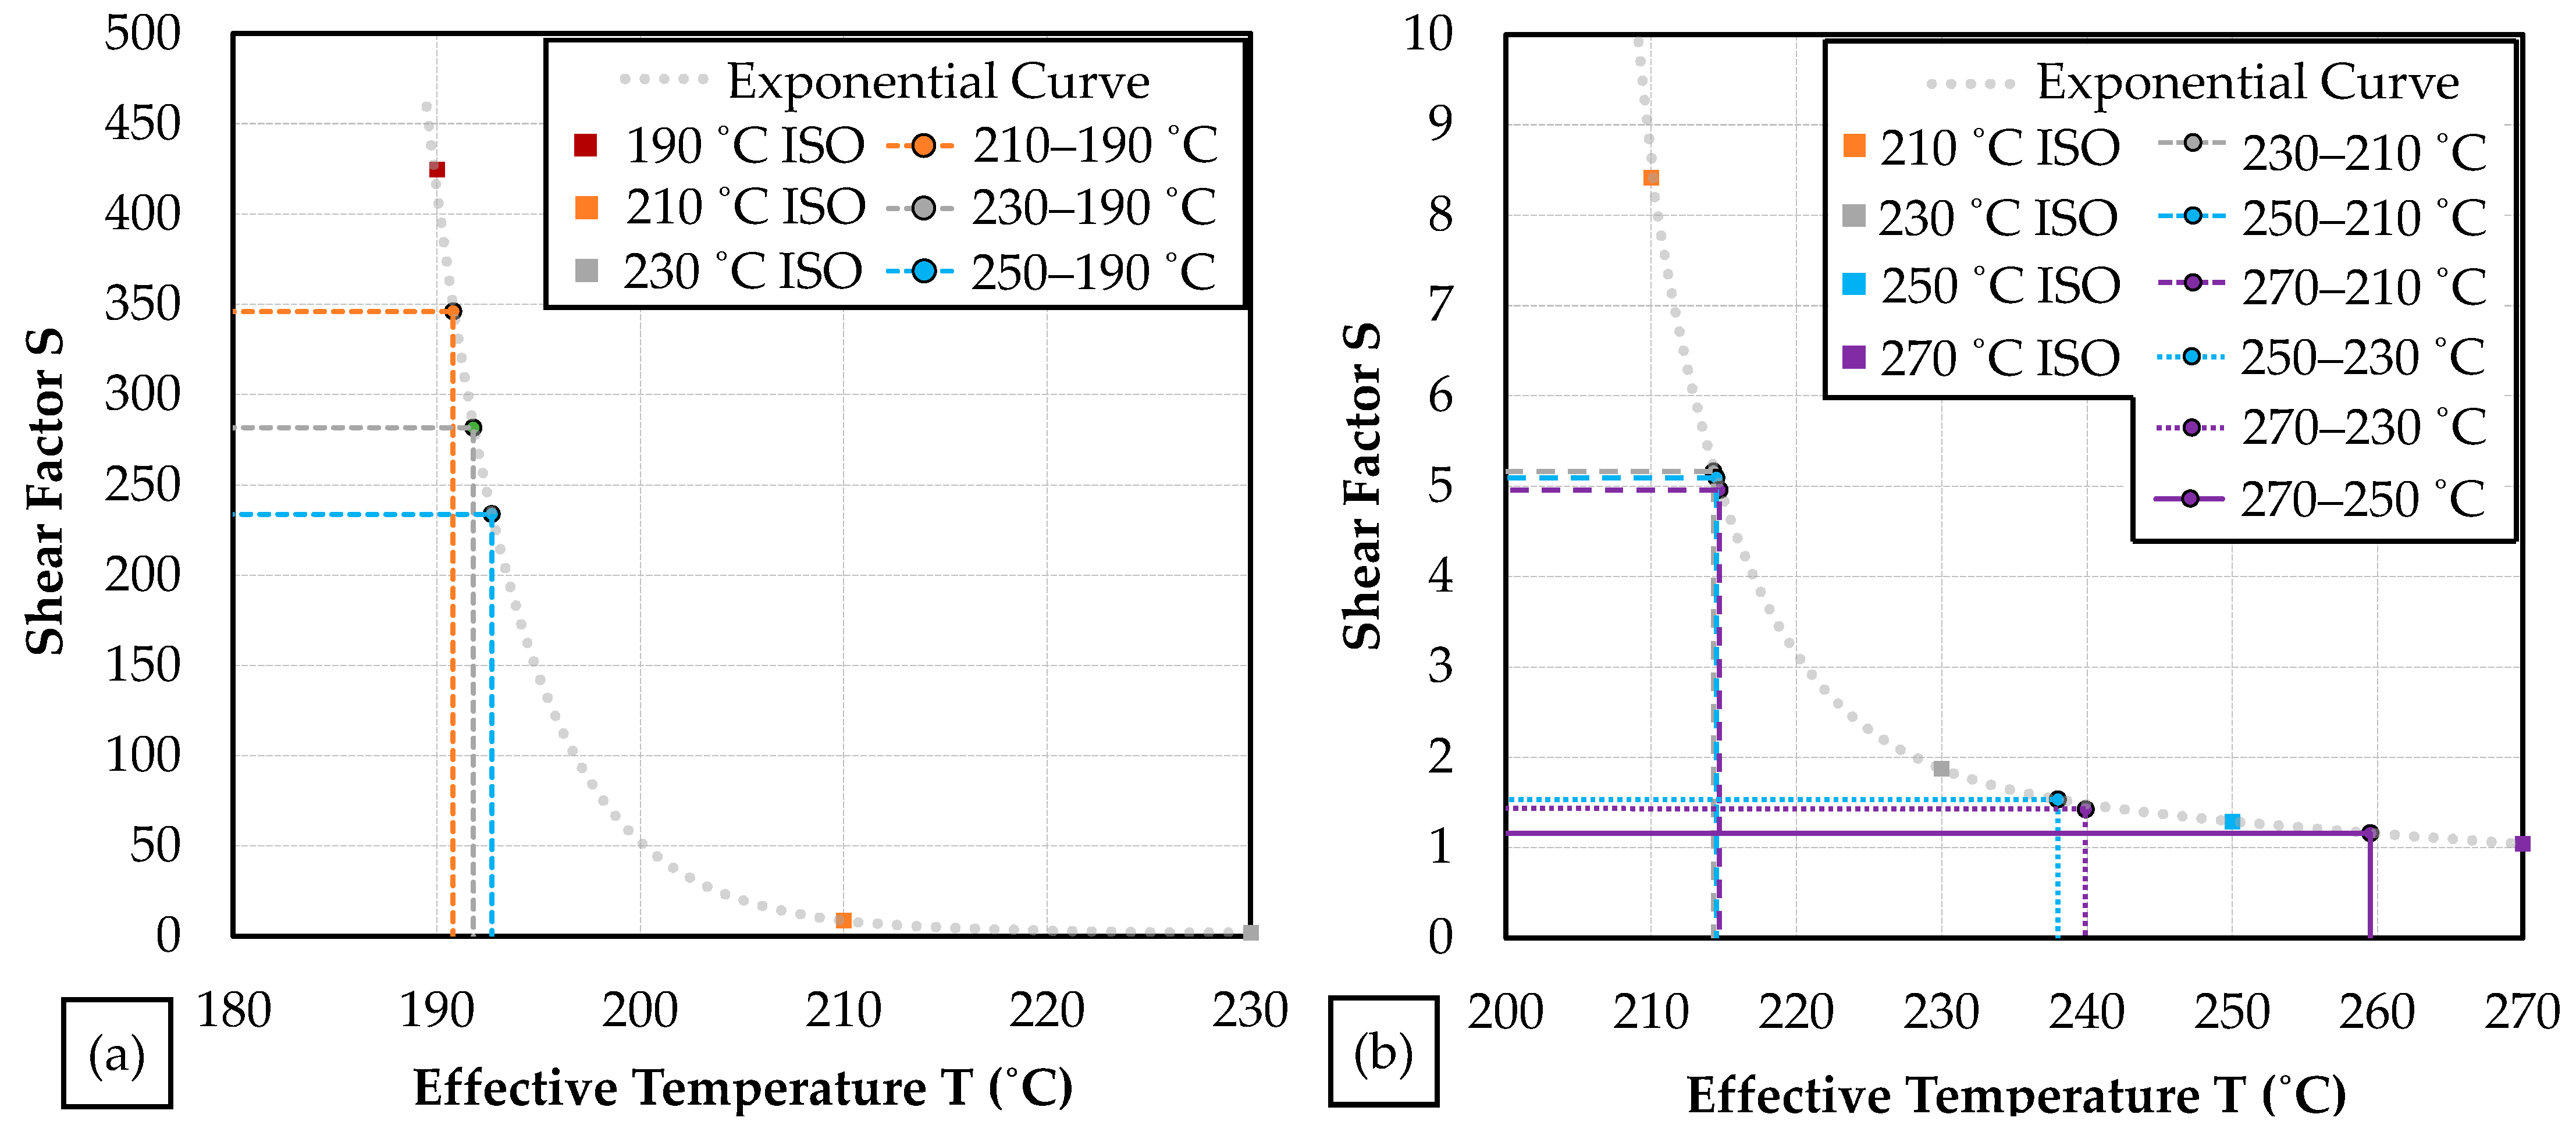
The adopted parameterisation procedure allowed for ‘effective temperatures’ to be hypothesised: an isothermal temperature value that approximately replicates the behaviour of a non-isothermal laminate. This allows for a better understanding of the influence of non-isothermal conditions when compared to conventional isothermal studies.
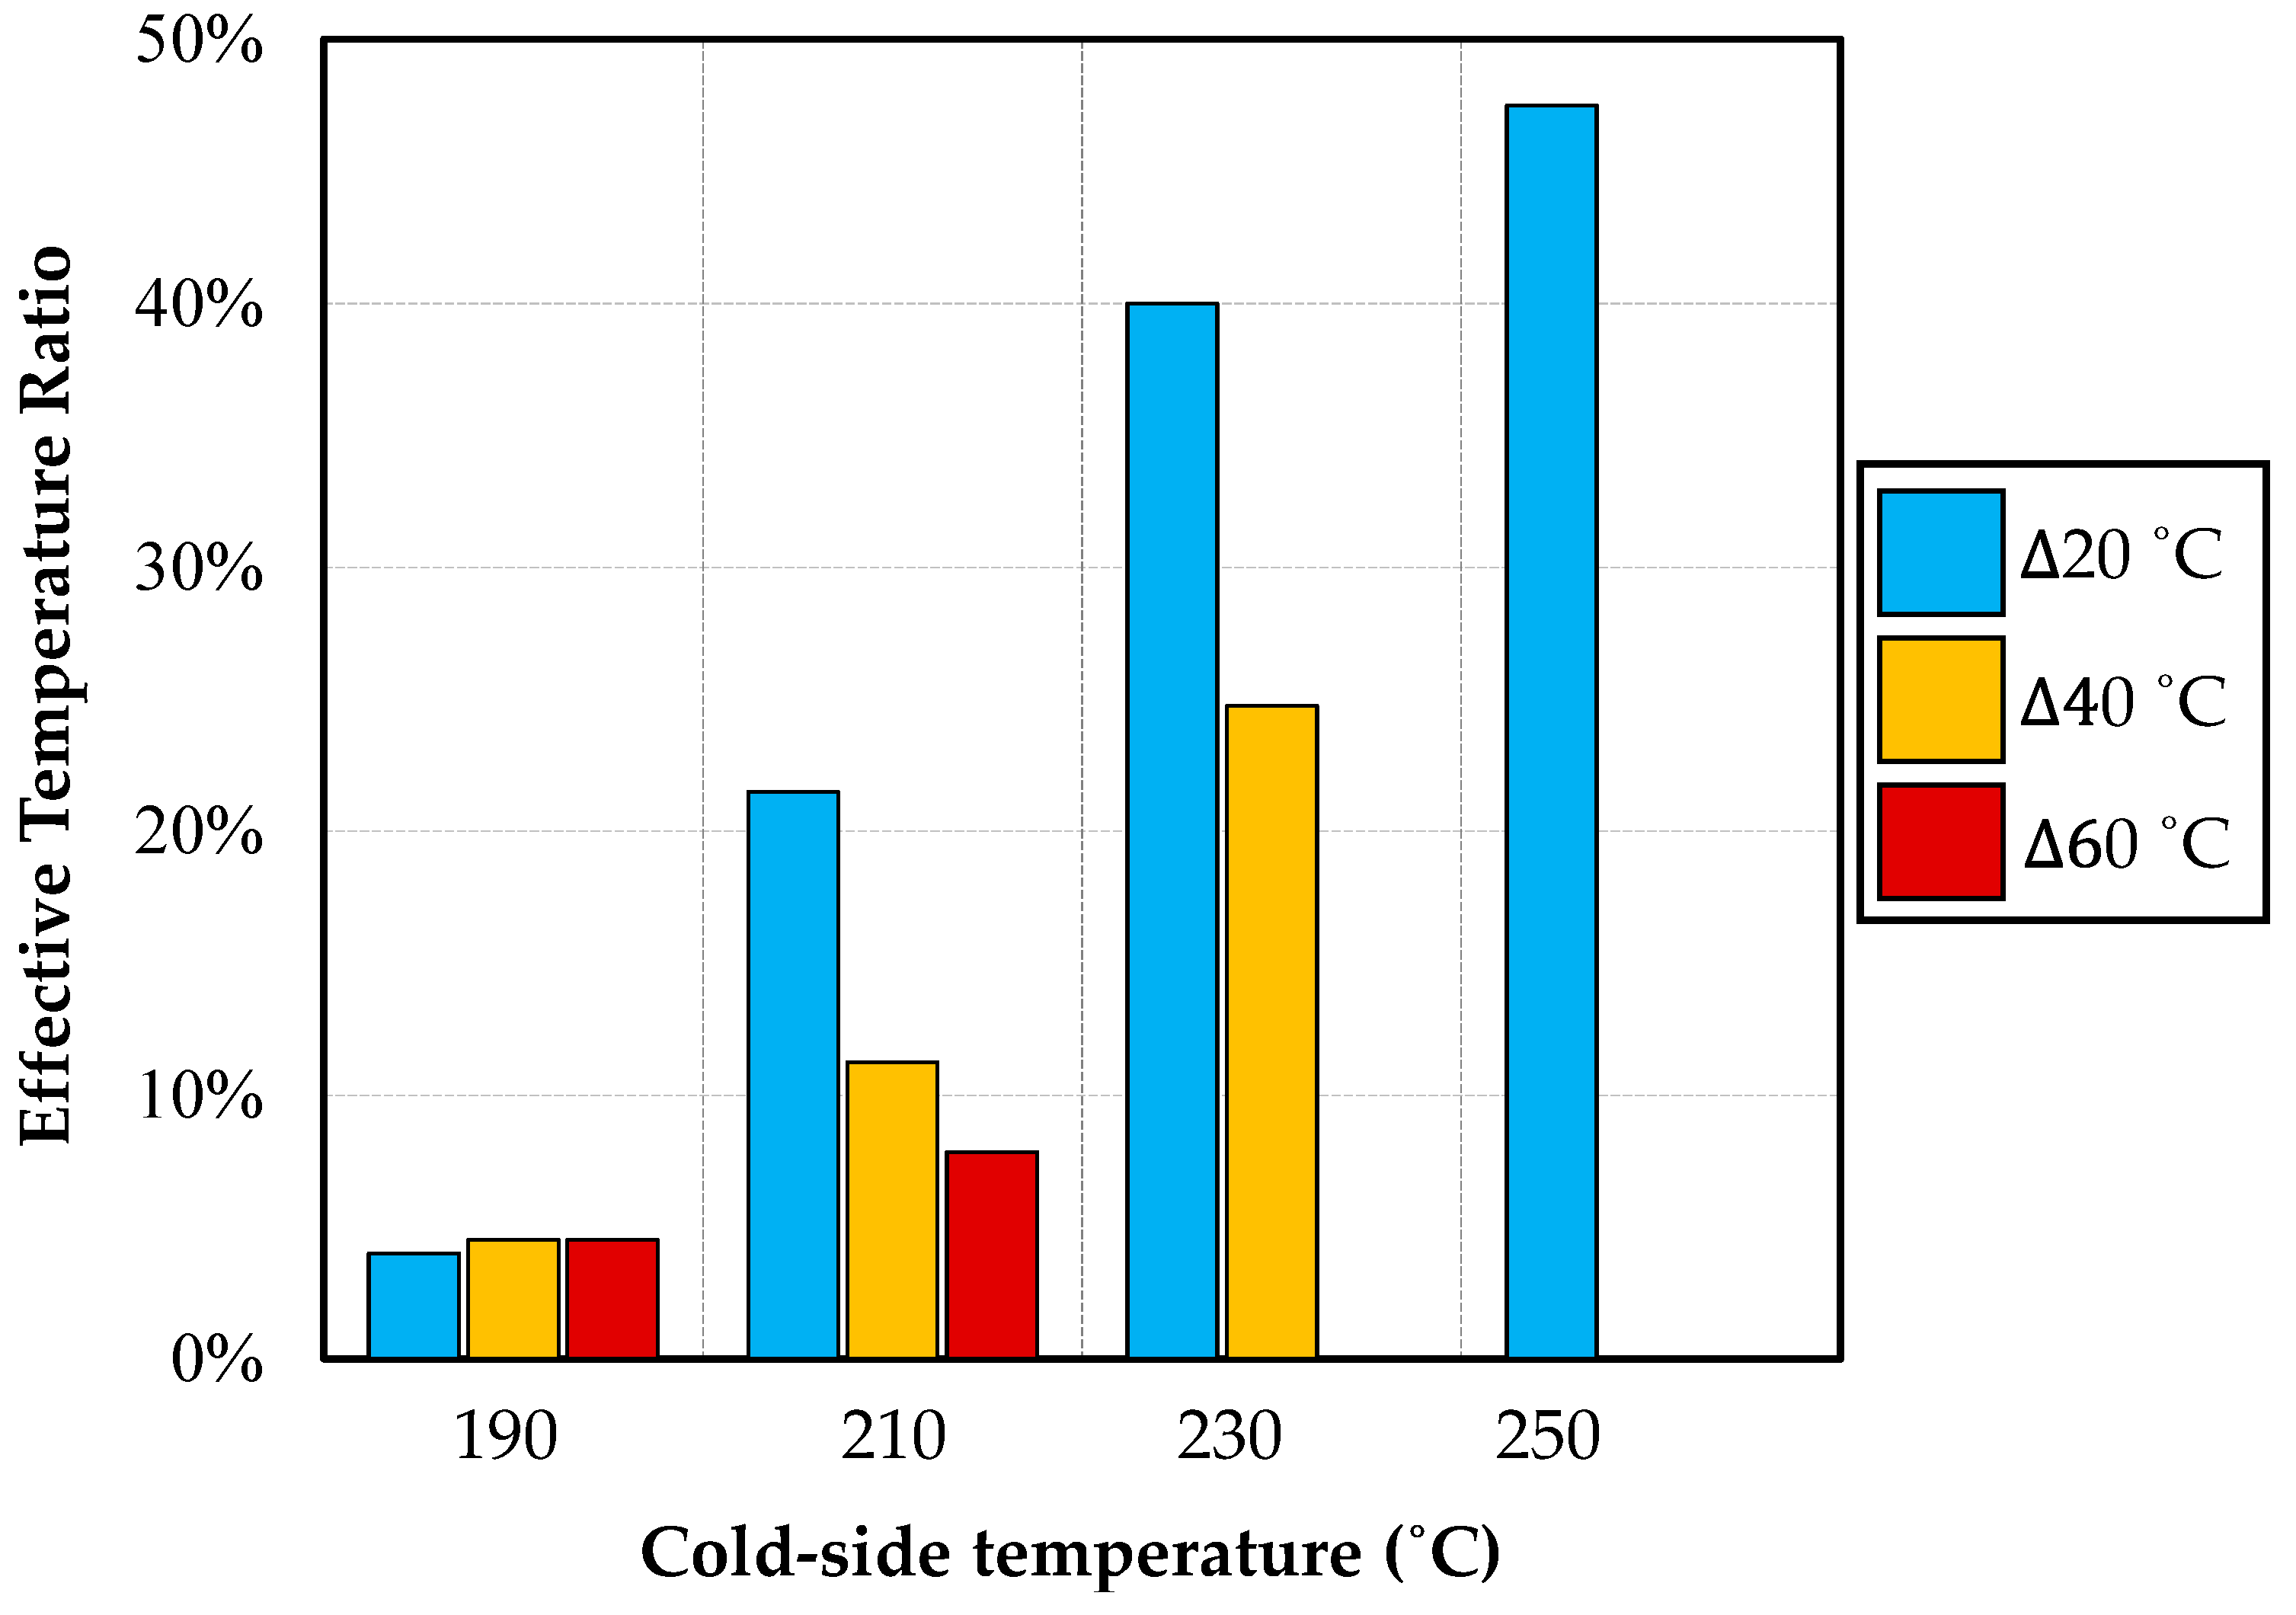
Figure 11 illustrates that as the temperature of the coldest face of a laminate decreases towards the onset of crystallisation, the effective temperature of the whole sample is more heavily skewed towards the temperature of the cold face. This results in much higher shear stress values as the presence of a single cold ply is enough to heavily impair the shearing of the laminate. It also illustrates that bigger temperature differences through the thickness of a laminate result in further decreases in the effective laminate temperature as a percentage of the two non-isothermal faces (effective temperature ratio). This implies that the temperature of the cold ply of a non-isothermal laminate is heavily linked to its shear response, largely regardless of the temperature of other plies.
The implications from the effective temperature values are that, for successful FRTP thermoforming, the temperature of each laminate ply requires careful monitoring; a single cold ply can dictate the forming behaviour of a whole laminate. As detailed above, it is assumed that the non-isothermal conditions simulated in this work enforce a linear through-thickness temperature distribution because of the convective nature of cooling from each laminate surface. In a conventional thermoforming routine, however, conductive cooling is the primary mechanism upon the initiation of laminate-mould contact. Mould temperatures are usually minimised to initiate cooling and reduce the demoulding time. This conductive interface has the potential to reduce the linearity of the through-thickness thermal profile because of low out-of-plane conductivity. The occurrence of a nonlinear out-of-plane thermal distribution in thermoforming routines is different to the linear (assumed) profile in the bias extension tests, as illustrated in
Figure 12.
Conventional simulation tools operate using either an isothermal or linearly interpolated non-isothermal through-thickness thermal profile. However,
Figure 12 demonstrates that these assumptions may not replicate real-world thermoforming regimes because of the high mould–laminate conductivity. For these reasons, it is important to validate the findings of the non-isothermal intra-ply shear tests to assess their applicability to real-world conditions.
5. Validation
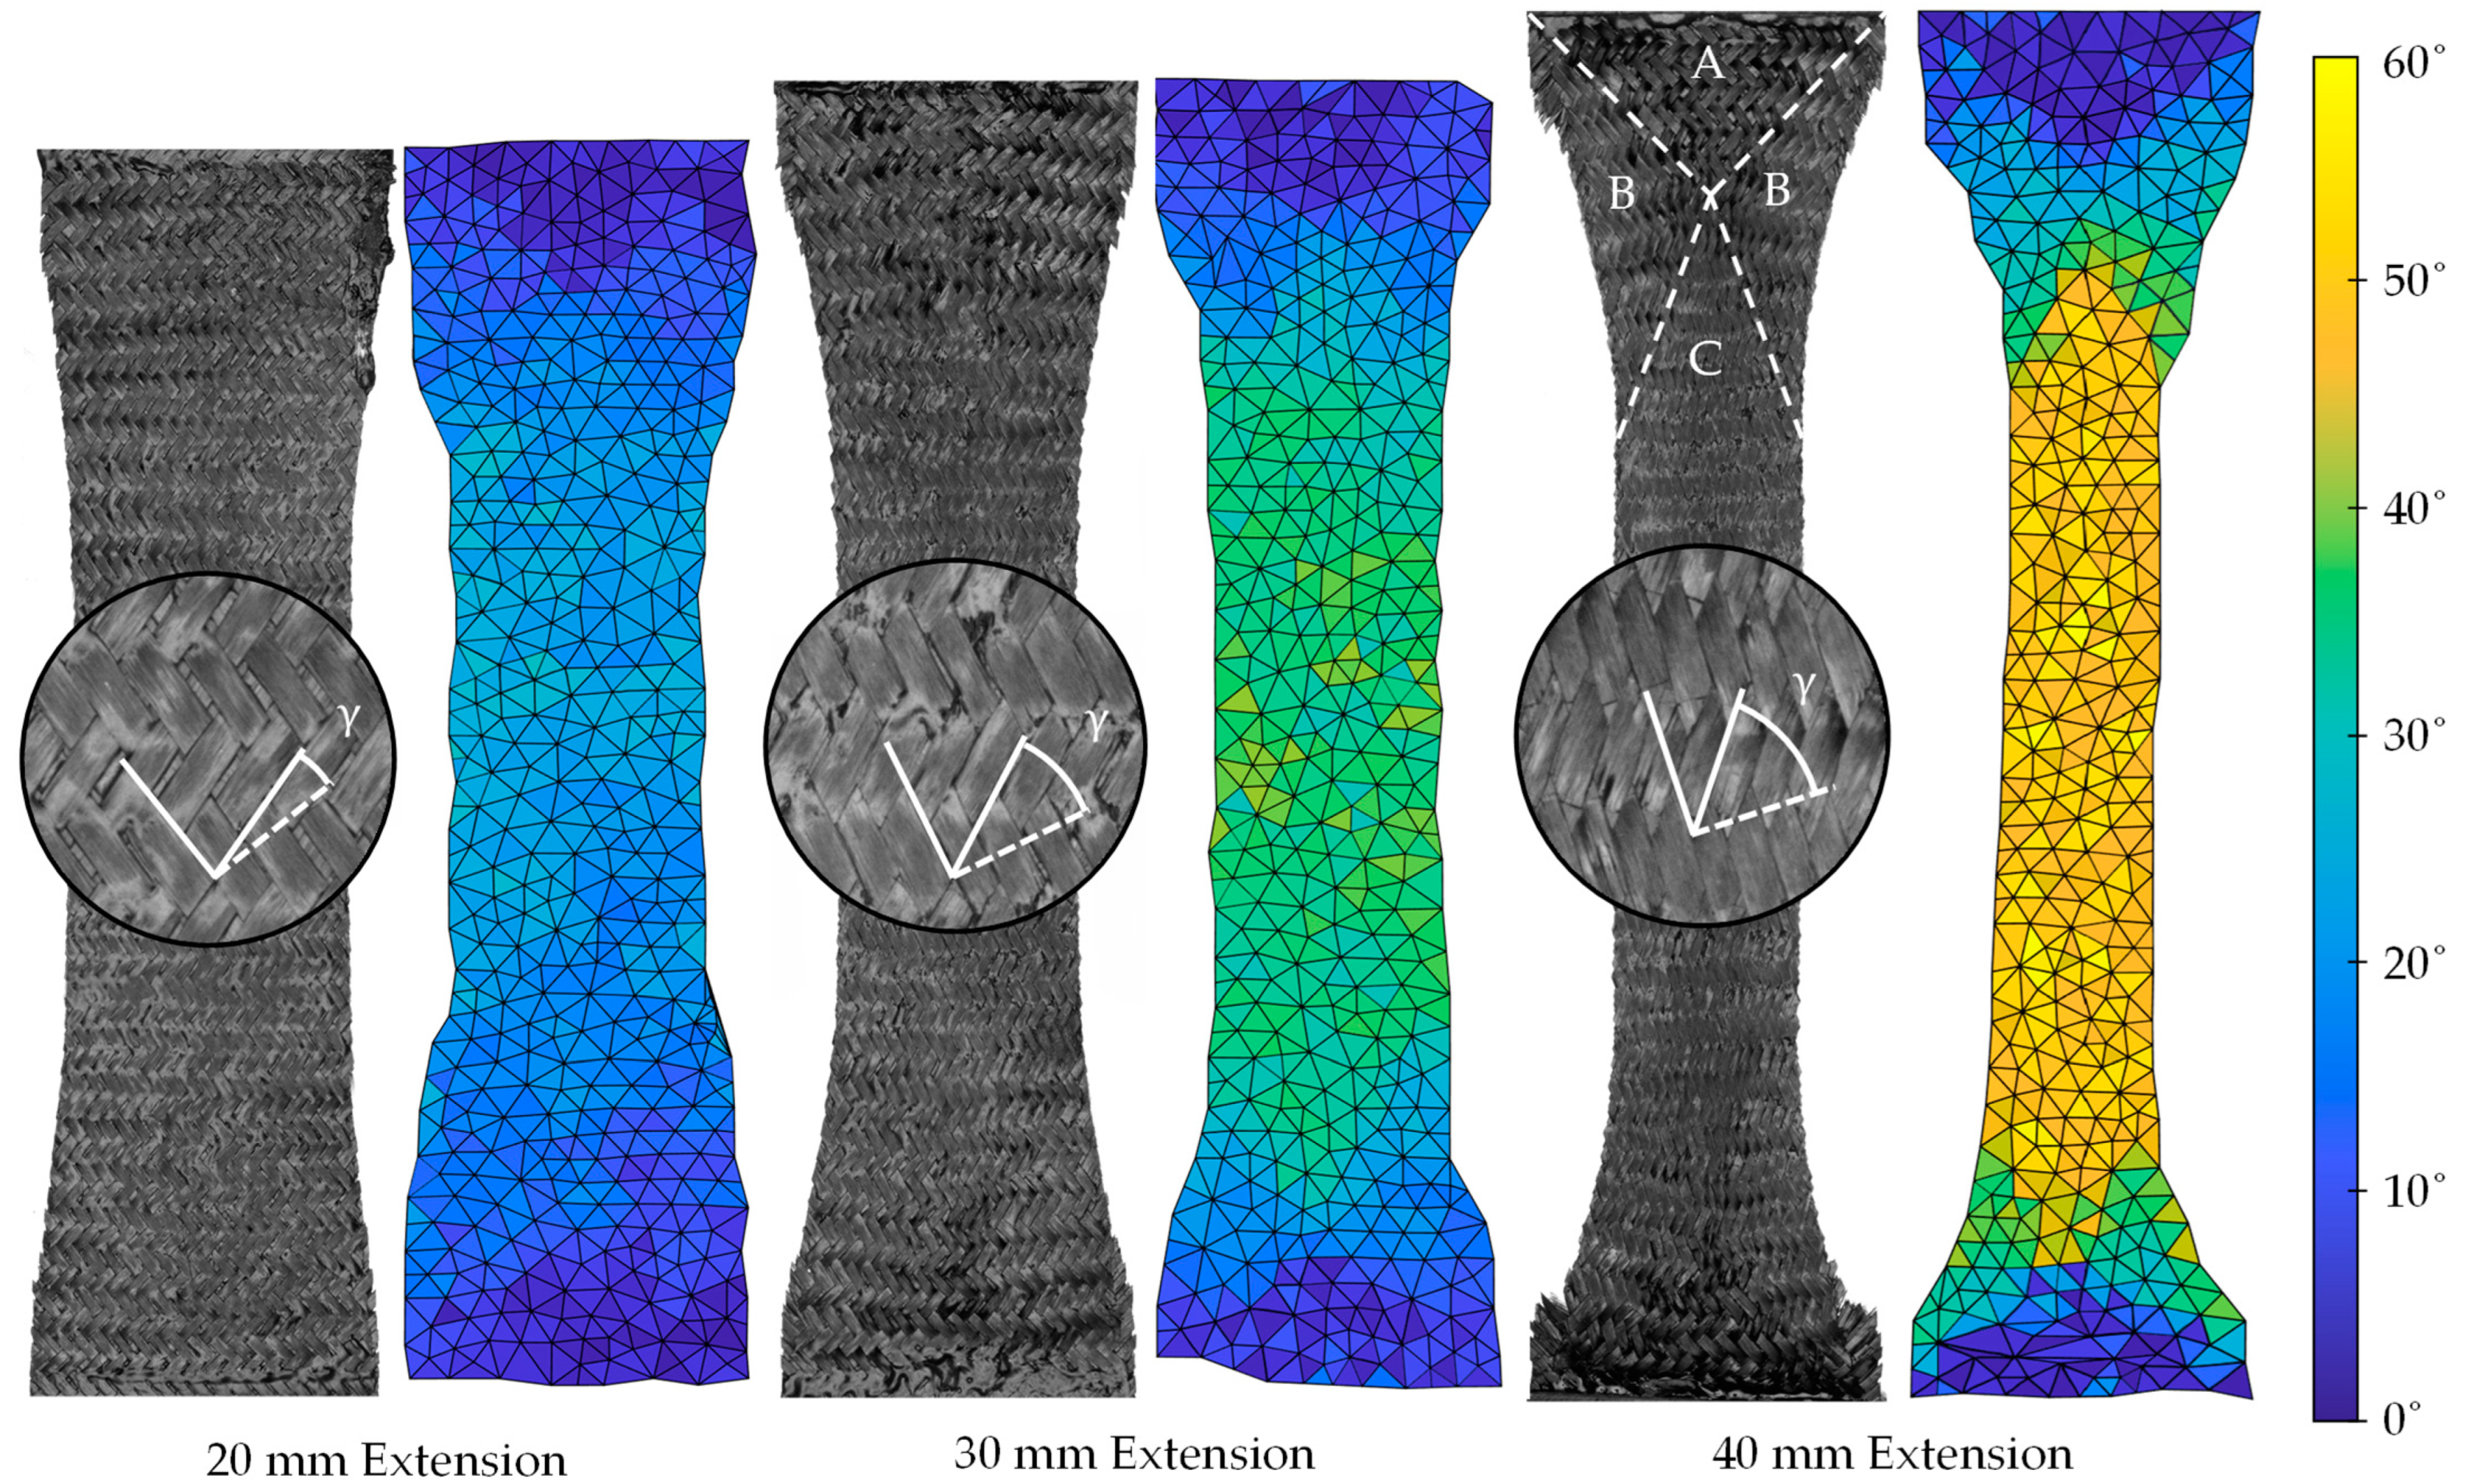
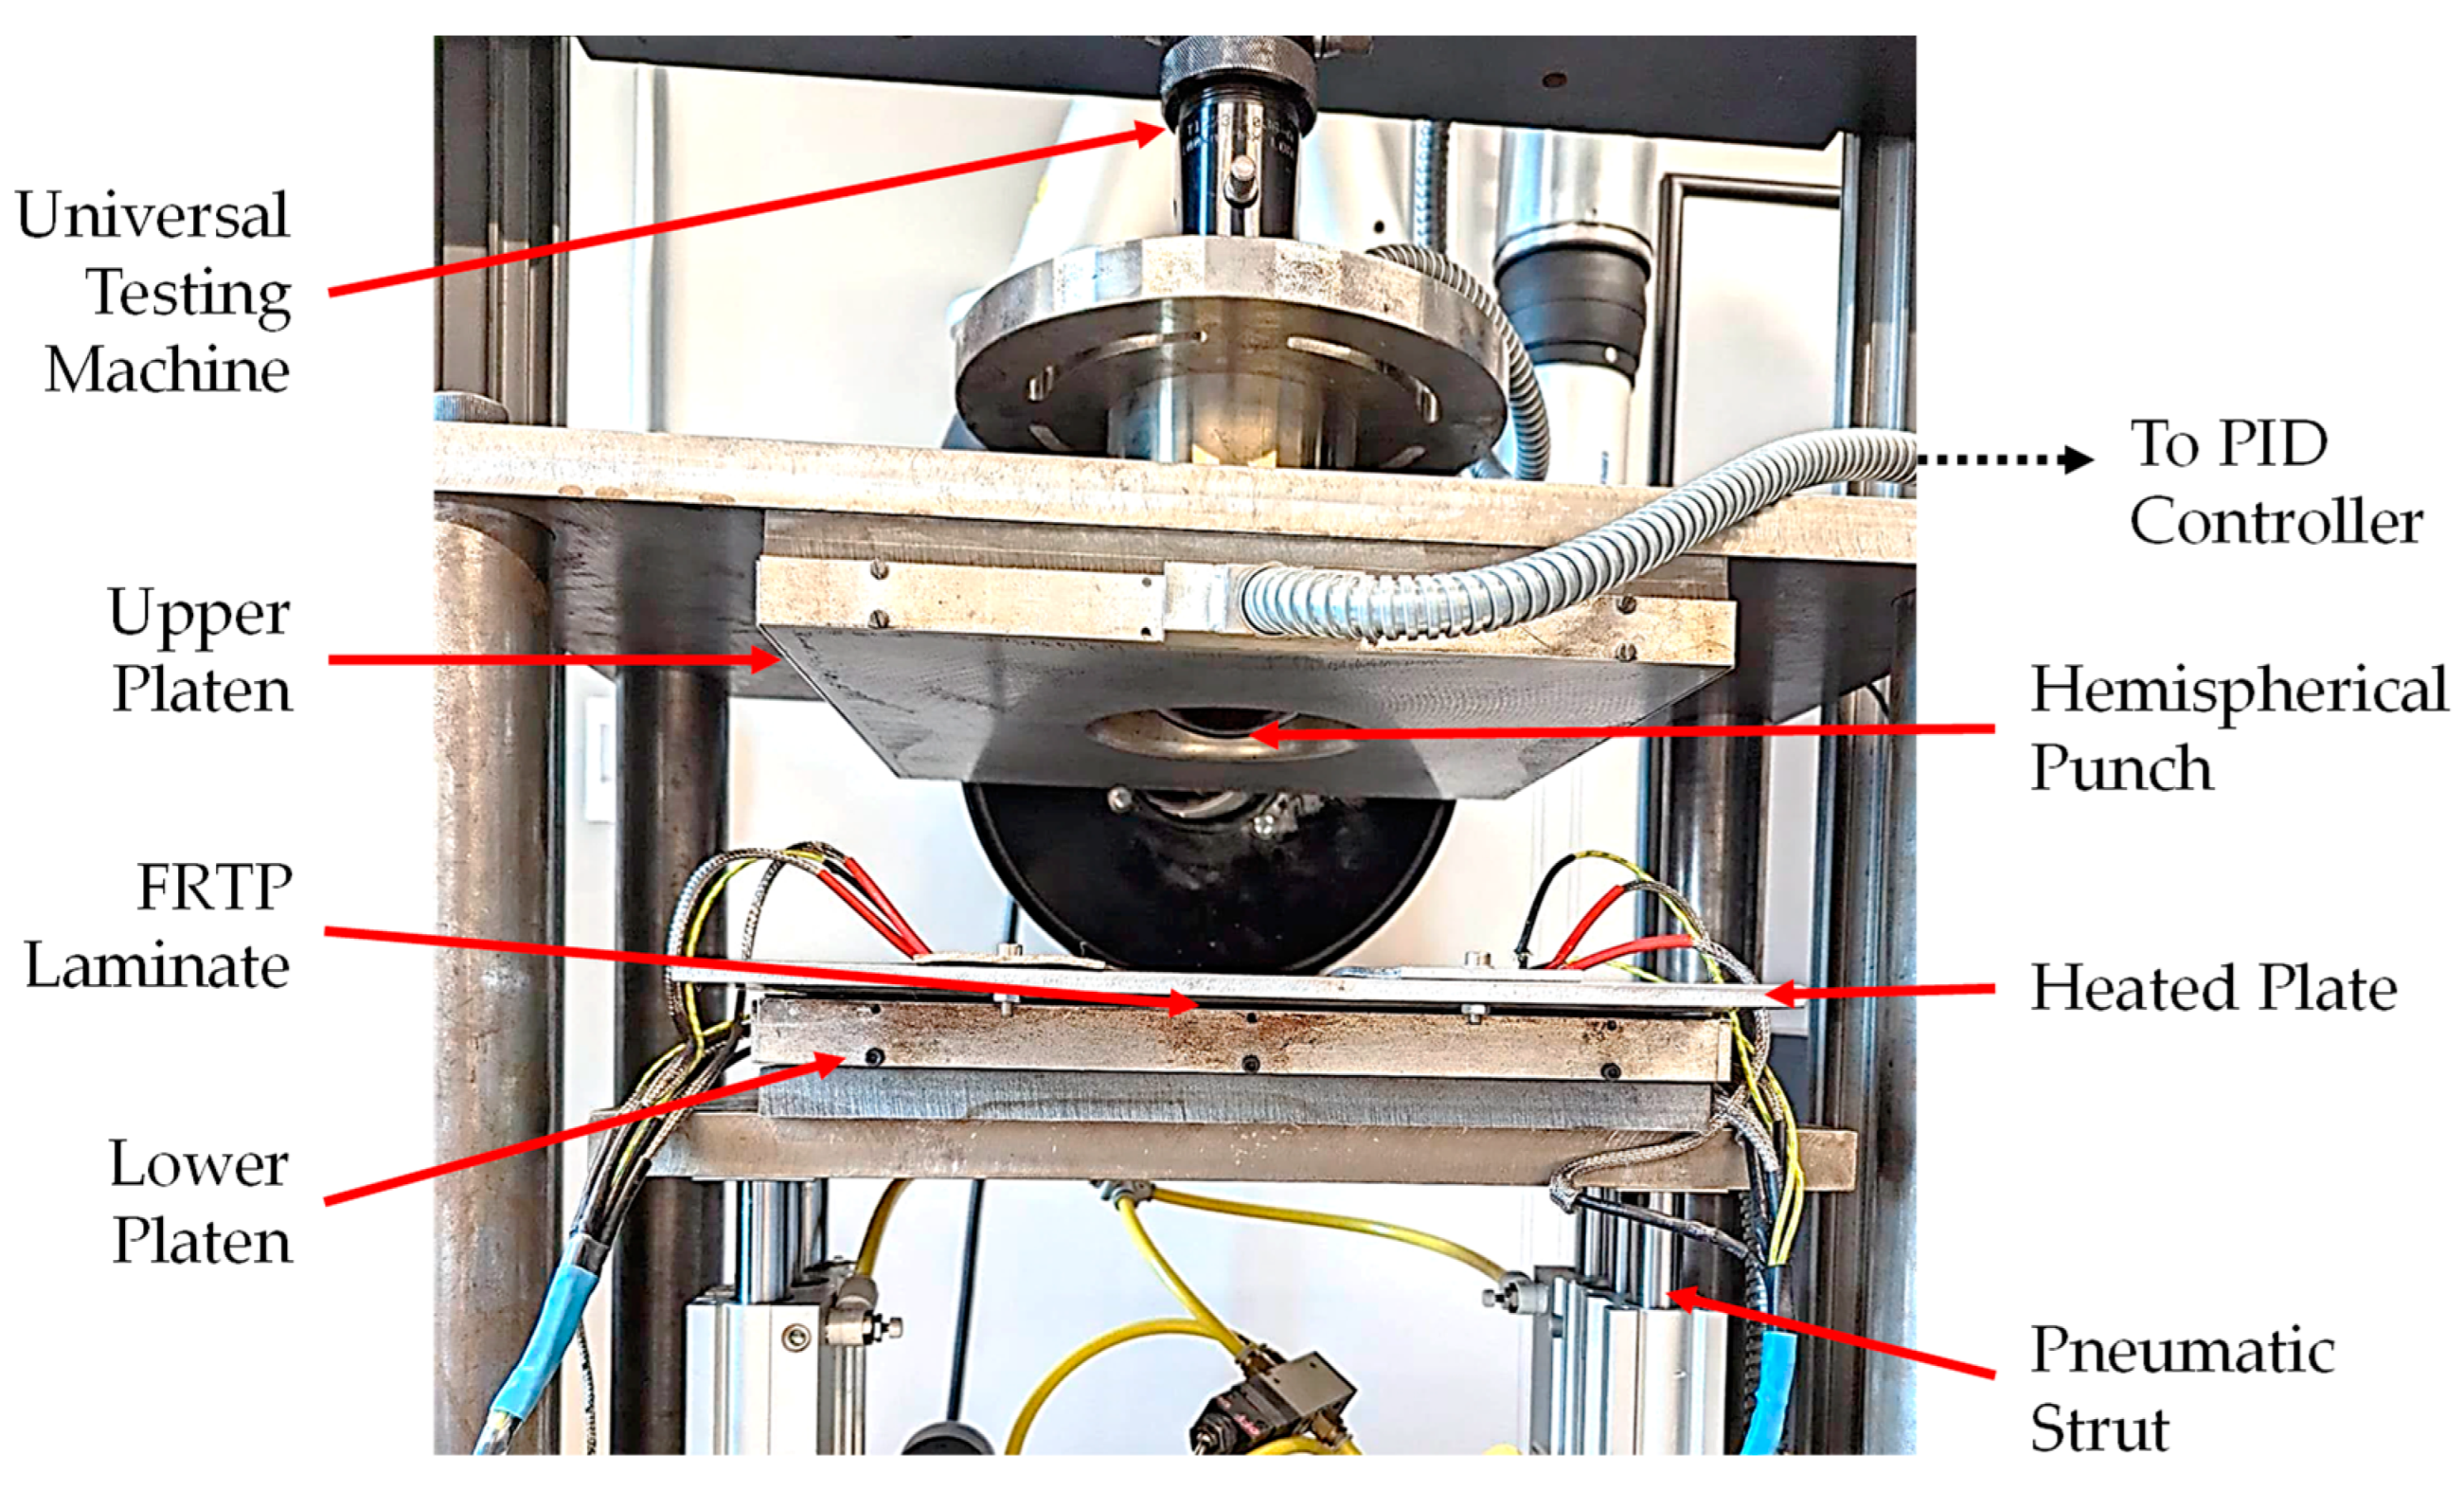
To assess the applicability of the experimental bias extension results to real-world thermoforming conditions, including the influence of tool temperature and cooling rate, a thermoforming validation exercise was conducted. Hemispheres were thermoformed at various non-isothermal conditions using a novel hemispherical punch attachment for the universal testing machine and a series of 300 × 300 mm 4-ply laminates. The laminates themselves were initially heated to an isothermal 250 °C between the lower platen (denoted the hot face) of the forming rig and a heated plate (both at 250 °C themselves). Once the laminate temperature stabilised (5 min dwell), the heated plate was removed to allow the lower platen to compress against the upper platen (denoted the cold face), via the actuation of four pneumatic struts, to a pressure of 0.15 Bar. The temperature of the upper platen was varied depending on the prescribed non-isothermal condition being tested. The seven different upper platen temperatures explored were 230 °C, 210 °C, 190 °C, 170 °C, 150 °C, 130 °C and 110 °C, creating the different non-isothermal conditions through the specimen thickness. Immediately after laminate–upper-platen contact was made, the universal testing machine lowered a 250 °C, 100 mm diameter hemispherical punch, at 500 mm/min, through the circular-holed platens to deform the FRTP laminate into a hemisphere. The novel punch apparatus is illustrated in
Figure 13.
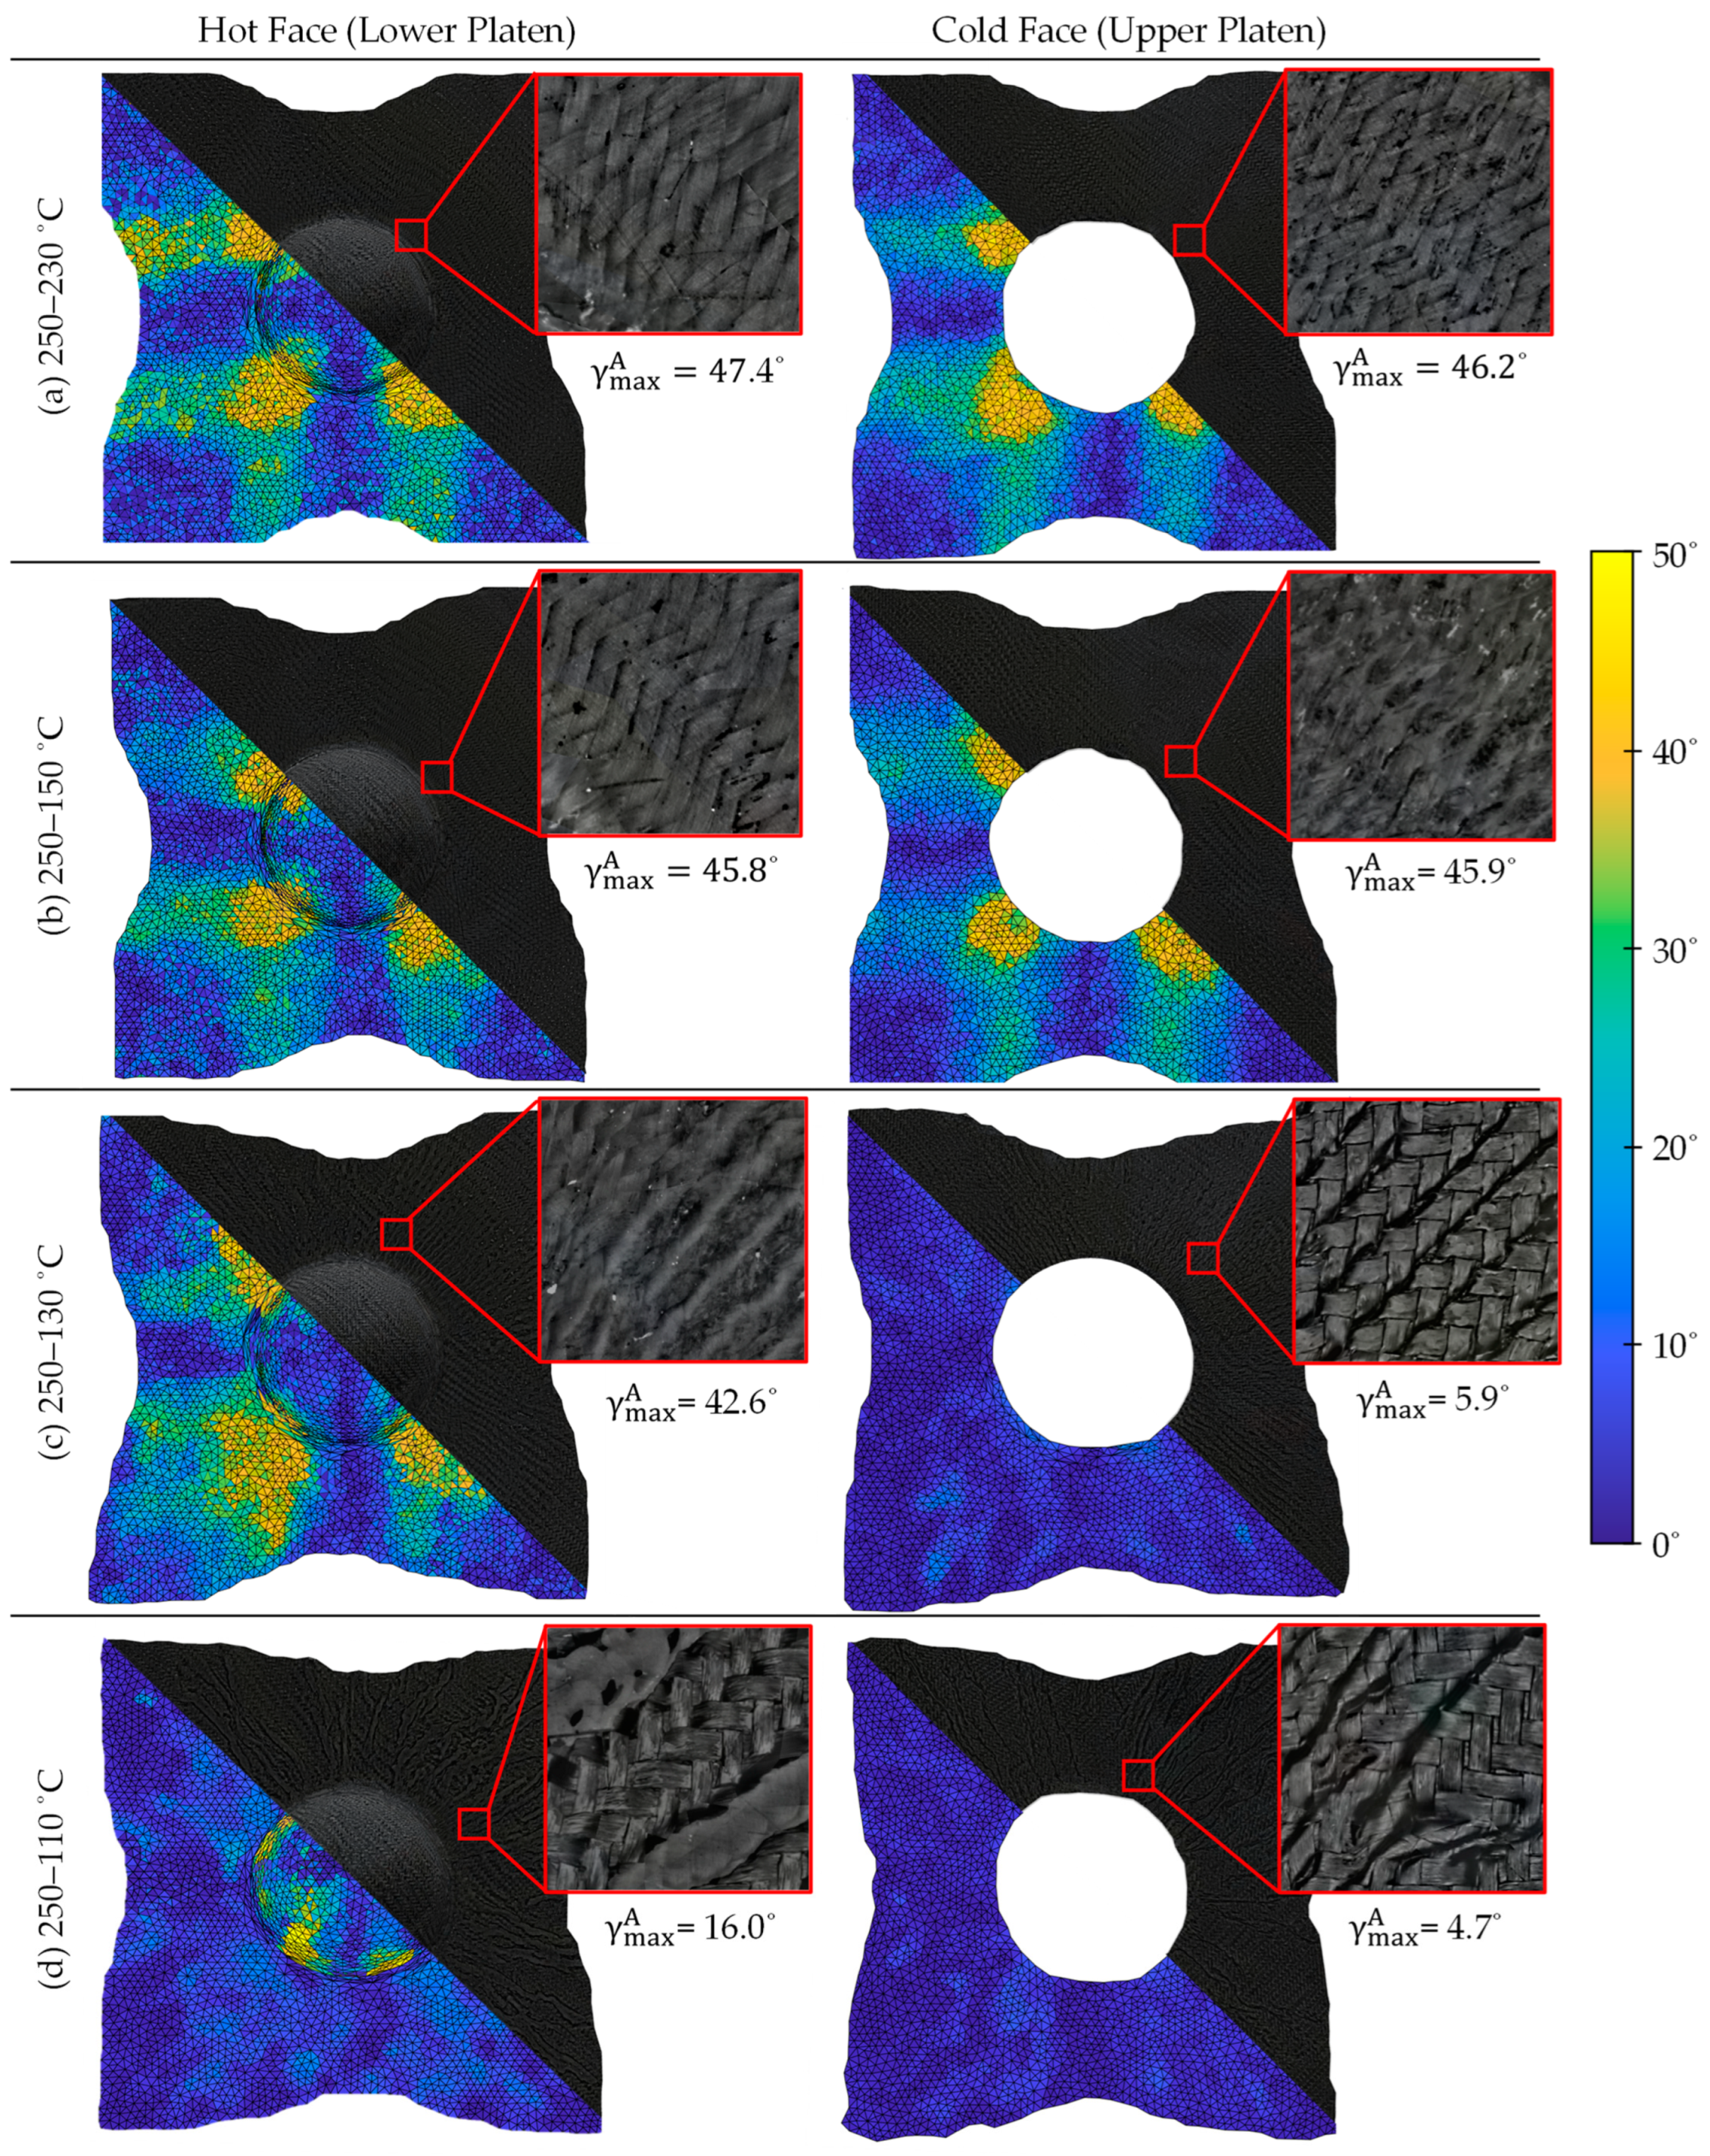
Upon completion of the thermoforming, the samples were scanned using an Apodius® Absolute Arm A73 with integrated scanner to obtain global fibre angles. A value for the maximum shear angle, , was produced by averaging the maximum shear angle from the four symmetrical quadrants, excluding the dome (formed isothermally).
Figure 14 illustrates the scanned results from the non-isothermal hemisphere forming. Each individual schematic represents a 50/50 cut between the image taken using the Apodius Arm and the MATLAB
® shear angle output. A blown-out view is also present to illustrate the localised shear angles in the high shear region for each hemispere.
There was little difference in the shear angles witnessed between the four smallest non-isothermal conditions experimented, 250–230 °C, 250–210 °C, 250–190 °C and 250–170 °C; therefore, only the former is illustrated in the figure (
Figure 14a). For all four of these specimens, the shear angles between the hot and cold faces were highly homogeneous. In the most extreme case, the maximum difference between the front and rear maximum shear angle was 1.7°. For the 250–230 °C laminate, the maximum (averaged) shear values were 47.4° and 46.2° for the hot and cold faces, respectively.
For the test at 250–150 °C (
Figure 14b), a small decrease in shear angle was observed on both sides of the laminate, with a maximum (quadrant average) of 45.8° on the hot face and 45.9° on the cold face. At this temperature, the increased resin viscosity constrained shearing on the cold side of the laminate; however, intra-ply shear was still the dominant deformation mechanism allowing the hemisphere to form. An explanation for a reduction in the hot-face shear angle, along with the cold face, is the presence of high levels of inter-ply friction ensuring the plies move in a homogeneous manner at this condition. The high resin viscosity is visible on the cold face as resin-rich areas in in the four hemisphere quadrants; the resin has been unable to flow away from these regions.
Further cooling of the specimen for the 250–130 °C (
Figure 14c) and 250–110 °C (
Figure 14d) tests resulted in a complete lock-up of the cold face because of the initiation of crystallisation. For the 250–130 °C hemisphere, there was still extensive shearing on the hot face. It is assumed that only one ply in this laminate had reached the crystallisation onset point, while the other plies could still shear accordingly. Since the cold face was unable to deform through shear, small wrinkles were present to allow mould conformity. These wrinkles, while only present on the coldest ply, marginally increased the laminate thickness. This therefore reduced resin consolidation, as can be seen on the hot face. The 250–110 °C hemispheres exhibited similar behaviour—however, with more plies at the crystallisation onset point leading to greater winkle amplitude. In this case, even the hot face was unable to shear sufficiently.
The results illustrate that, at cold non-isothermal conditions, the degradation in laminate shearing witnessed in the bias extension tests also occurs in thermoforming processes if the mould temperature is too low. As soon as crystallisation initiated in the coldest ply, shearing was no longer possible, resulting in wrinkling and a large degradation in the quality of the final part, even if the other plies sheared accordingly. This is the same effect as that illustrated in
Figure 6, where the cold ply at the crystallisation point did not deform with the other plies in the laminate. These findings suggest that knowing the temperature of the coldest ply during thermoforming is of critical importance. Even if nonlinear out-of-plane thermal distributions occurred, as may have been the case in the thermoformed hemispheres, the laminate behaviour was largely dictated by the coldest ply.
While the overall influence of non-isothermal conditions on the bias extension results is replicated in the hemispherical validation, the absolute temperatures between the two experiments are not comparable. While it is at 190 °C that the cool ply became highly restrictive because of the onset of crystallisation in the bias extension tests, this effect was instead present with a top platen at 130 °C in the hemispherical forming. These results are to be expected; the much greater cooling rate that the laminate would have experienced during the hemispherical forming subsequently reduced the temperature for the onset of crystallisation, as outlined by Kugele et al. [
28]. Moreover, the top ply would not have had sufficient time to cool down to match the tool temperature because of the low mould–laminate conductivity and short forming operation designed to replicate conventional thermoforming conditions.
These observations indicate that during thermoforming operations, the laminate temperature is dictated solely by the mould temperature and the mould–laminate thermal conductivity. If crystallisation has initiated in just a single ply, a severe reduction in laminate mobility and, therefore, part quality is probable.
6. Conclusions
Bias extension testing of both isothermal and non-isothermal carbon-fibre–PA6 laminates was conducted in this study to illustrate how non-isothermal out-of-plane conditions impact the intra-ply shear behaviour of a woven thermoplastic composites. The aim of the work was to simulate conditions that typically occur during thermoforming: one face of a laminate making mould contact, initiating the onset of non-isothermal conditions.
The non-isothermal testing, regardless of laminate thickness, resulted in shear stress curves lying at an average value between the respective isothermal curves from each laminate face. This, however, only applied for temperatures above the crystallisation onset point (>190 °C). This can be expected because of the anticipated linear out-of-plane thermal profile in the non-isothermal experiments, combined with the summation of intra-ply shear forces from each ply in the laminate. However, the same correlation did not hold once the crystallisation onset point was met, possibly because of the vast increase in stress that was witnessed for these tests. This resulted in other deformation mechanisms including out-of-plane bending and inter-ply slip. A parameterisation exercise allowed ‘effective temperatures’ to be calculated for each non-isothermal test, an isothermal value that replicated the non-isothermal condition. The effective temperatures at the crystallisation onset were within 5% of the cold-face temperature, concluding that even if only one ply has approached this point, the shear behaviour of an entire laminate is heavily compromised. This behaviour is less dramatic but still apparent at temperatures where the cold-face temperature exceeded the crystallisation onset. These results illustrate that the temperature of the coolest ply in a ply stack heavily influences FRTP shearing behaviour, therefore necessitating the accurate monitoring of ply temperatures during real-world forming processes.
A validation procedure followed, in which a series of FRTP hemispheres were thermoformed on a novel hemispherical punch rig. This reaffirmed the importance of accurate thermal monitoring for each ply. Again, once a single ply in the stack became too cool for shearing to take place, the forming quality of the final part was heavily compromised. Poor consolidation and the presence of wrinkles were identified in these respective hemispheres. The mould temperature at which shearing was inhibited was 130 °C, much lower than the crystallisation onset found through DSC measurements. This can be attributed to the vastly increased cooling rate and the low laminate–tool conductivity. There was little difference between the hemispheres that had not reached crystallisation, with the intra-ply shearing resistance low enough to not inhibit laminate forming. Moreover, high inter-ply friction maintained homogeneous shear angles in each ply in the laminate, again only changing once crystallisation initiated. Although nonlinear temperatures may have been present during the thermoforming exercise, the effect on shearing was minimal because of the overall laminate dependence on the behaviour of the coldest ply.
The correlation in forming behaviour between the thermoforming experiments and the bias extension tests validates the use of linearly interpolated temperatures during thermomechanical simulations. Linearly interpolated schemes will always incorporate the coolest plies (at the laminate extremities), therefore capturing the dominant shearing mechanisms. Consequently, isothermal studies are not recommended because of the implications a single ply can have on forming behaviour.
In conventional FRTP thermoforming, it is therefore necessary to accurately monitor mould and laminate temperatures to optimise the forming processes. Ideally, the mould temperature should be minimised, resulting in dramatically reduced de-moulding times, as laminate cooling is initiated instantaneously with the forming routine. While this will likely result in non-isothermal forming, this is not a concern, providing the temperature of each individual ply remains above the crystallisation onset point. Failing to do so will result in heavily reduced part quality with the onset of wrinkles likely to overcome the high shear resistance. The speed of the forming process and magnitude of mould–laminate conductivity are therefore major contributors to a thermoforming regime and heavily dictate minimum mould temperatures. The use of simulation is one method for which mould optimisation may be achieved; however, accurate thermal characterisation of both the laminate and mould is required to obtain reliable results. Since the cooling rate is not controlled in intra-ply shear testing, there is a possibility for large discrepancies between simulation and experimentation. This is due to the lack of correlation between material characterisation and real-world thermoforming, as outlined in the validation exercise. This, combined with the difficulties associated with bias extension tests, particularly at high shear angles, should be considered in future work to increase the accuracy of such characterisation exercises.


