Article

Excellent Hybrid Polyurethane-Graphite Filler Micro Powder as a Lightweight Structure

1
Department of Mechanical and Industrial Engineering, Gadjah Mada University, Jl. Grafika No.2, Yogyakarta 55281, Indonesia
2
Engineering Cluster, Singapore Institute of Technology, Singapore 138683, Singapore
3
PLN Research Institute, Jl. Duren Tiga Raya No.102, RT.8/RW.1, Kota Jakarta Selatan, Jakarta 12760, Indonesia
4
Department of Architecture and Planning, Gadjah Mada University, Jl. Grafika No. 2, Yogyakarta 55281, Indonesia
5
Research Center for Electrical Power and Mechatronics—National Research and Innovation Agency (BRIN), Jl. Sangkuriang, Dago, Kecamatan Coblong, Kota Bandung, Jawa Barat 40135, Indonesia
*
Author to whom correspondence should be addressed.
J. Compos. Sci. 2023, 7(10), 433; https://doi.org/10.3390/jcs7100433
Submission received: 11 September 2023 / Revised: 26 September 2023 / Accepted: 9 October 2023 / Published: 13 October 2023
(This article belongs to the Section Polymer Composites)

Abstract

:
Weight plays a significant role in the automotive and aerospace fields due to the demand of lightweight material structures. A lighter body in weight (BIW) and in structure can reduce fuel consumption, lessen emissions, and support the SDGs 9, 11, 12, and 13. Therefore, polyurethane (PU) foam is suitable for applications that require low weight. The characteristics of hybrid polyurethane-graphite micro were successfully evaluated in this study. Several tests have been used to characterize these structures, such as, compression, hardness, density, surface evaluation, and FTIR analysis. The results showed that the expansion and shrinkage variations lead to different shapes at specific ratios. Compression tests show that the highest value occurred at 0.84 kN, with a 4:1 ratio found in pure PU foam without any reinforcement. PU foam with 2% graphite filler showed the highest results at the 4:1 ratio with a value of 0.45 kN. Furthermore, the highest hardness test result was 37.7 SHD. Density testing indicates that the highest value is obtained from specimens with a 4:1 ratio of 0.077 g/cm3. FTIR testing reveals that adding graphite as a filler alters the chemical bonds during the formation of solid PU foam. Surface observations show that adding graphite as a filler influences the variation in material structure formation. All the evaluation has tended to conclude the present combination as suitable for lightweight structures applications.

1. Introduction

Composite laminates and their materials that support the technology of lightweight structures are developed by researchers based on different materials such as, carbon fibers, glass fibers, naturals-based materials, matrix composites, powder metallic-based materials, and different polymeric materials [1,2,3,4,5,6,7]. A body that is lighter in weight (BIW) and in structure will produce fewer emissions, use less fuel, and fulfil Sustainable Development Goals (SDGs) 9 in industry, innovation, and infrastructure, 11 in sustainable cities and communities, 12 in responsible consumption and production, and 13 in climate action. One of the promising polymeric materials used by different sectors is polyurethane foam (PU foam). It has advantages due to its lightweight nature, durability, heat, sound insulation properties, and ability to form structures in various shapes and sizes on various substrates [8,9,10,11,12,13,14,15]. The shape and size of the PU foam reaction can follow the medium or mold created according to the requirements, and this change in shape is influenced by the mixture of two materials [16], namely polyol and isocyanate liquids. When these two liquids are mixed, they undergo a polyurethanation reaction and form solid PU foam [17,18,19].
Polyurethane is widely used in various industries for lightweight structural applications. It is due to its efficiency in production processes and direct application to the target [20,21,22,23]. In the formation process of solid PU foam, there is a material expansion process, which is the advantage of PU foam formation. One example of its application in structures can be found in filling empty spaces within a structural system as shown in Figure 1a–c, which is one of the factors leading to structural failure. This system is more robust without adding significant weight due to the relatively low density of PU foam [24]. The mixing reaction of the two components for PU foam reach the endpoint of the expansion process. This expansion process is an advantage of this material in terms of flexibility. During PU foam production, various additives such as catalysts, surfactants, fillers, and reinforcements can be added to modify the properties and characteristics of the material [25,26,27]. Comparing different mixing ratios of polyurethane foam can result in the formation of new properties that are either better or worse, depending on the mixing ratio of the two foam-forming materials [28,29]. In this regard, composites are the primary answer for structural problems because combining these materials can result in better physical and chemical changes, making composite applications suitable for specific design purposes [30,31,32]. Therefore, reducing filler content is a critical strategy to balance superior mechanical performance and polymer composites [33,34,35,36]. Similiar to PU foam, it has been reported that using graphite powder as a filler affects the mechanical strength due to the load-bearing structure, as shown by Zefeng et al. [37]. Previous research conducted by Ji-Hyun Kim et al. [38] showed that the pore structure size of graphite foam affects mechanical strength and thermal conductivity. P.E Romero et al. [39] has made a polyurethane foam using a 3D printed mold for car seat back.
Furthermore, in previous research conducted by Syed Muhammad et al. [40], PU foam was mixed using natural fillers such as eggshell, hazelnut, chitin, and cellulose. It proved to improve material performance regarding mechanical, morphological, and thermal properties. The amount of filler given in the mixing process can affect the formation of voids or cracks, increasing failures in the PU foam material. The paper explains that the more natural filler is given, the more voids and cracks are formed in some parts of the specimen. Hyeon Choe et al. [41] researched CaCO3 filler, which has been treated and compared with raw CaCO3. It is shown that treated CaCO3 filler can reduce the size of microvoids formed in the PU foam production process. The next study conducted by Dorota Głowacz et al. [42] showed that mixing biowaste-based fillers, such as sunflower husk, rice husk, and buckwheat husk, could affect the size of the voids in the PU foam itself, which affects the mechanical properties during testing. Then, the testing conducted by Yuliang Qu [43] by modifying the size of the pores in PU foam greatly affects the performance of the resulting PU foam material. Thus, it can be concluded from previous research that the structure size, rod size, and voids in PU foam during manufacturing significantly affect the material’s performance. The selection of graphite powder is also not separated from its advantages, such as high-temperature resistance, conductivity, and water absorption.
The appropriate reaction for the mixing ratio is still discussed and studied. This is because reactions with different mixing ratios affected the expansion of PU foam. Previous studies reported by Tian Xiao et al. [44] have shown that the pore size of graphite foam significantly affects mechanical performance and load resistance. This allows for density, strength, and stiffness control, enabling widespread use in various industries. The ratio between isocyanate and polyol can also affect the final result of the PU foam formation reaction. This research is conducted because polyurethane materials exhibit different properties depending on the different mixing ratios. The hardness level and stiffness vary, and elasticity can also be affected. The addition of graphite powder can also affect the mechanical properties of polyurethane. Graphite powder acts as a filler that strengthens the polyurethane matrix, thus increasing tensile strength, hardness, and resistance to deformation. This research aims to discuss and identify the differences in the effects of different ratios on the emerging properties from the final reaction of PU foam formation and then compare them with graphite powder. The addition of fillers affects the material’s expansion and differences in strength. The gap in the previous work showed that a few studies still discuss the expansion of PU foam related to the material mixing ratio and the influence of filler. This article discusses the characteristics of PU foam related to different mixing ratios and the addition of graphite powder as a micro-filler. The present study also identified the influence of mixing ratios on the expansion properties of PU foam in terms of mechanical strength.

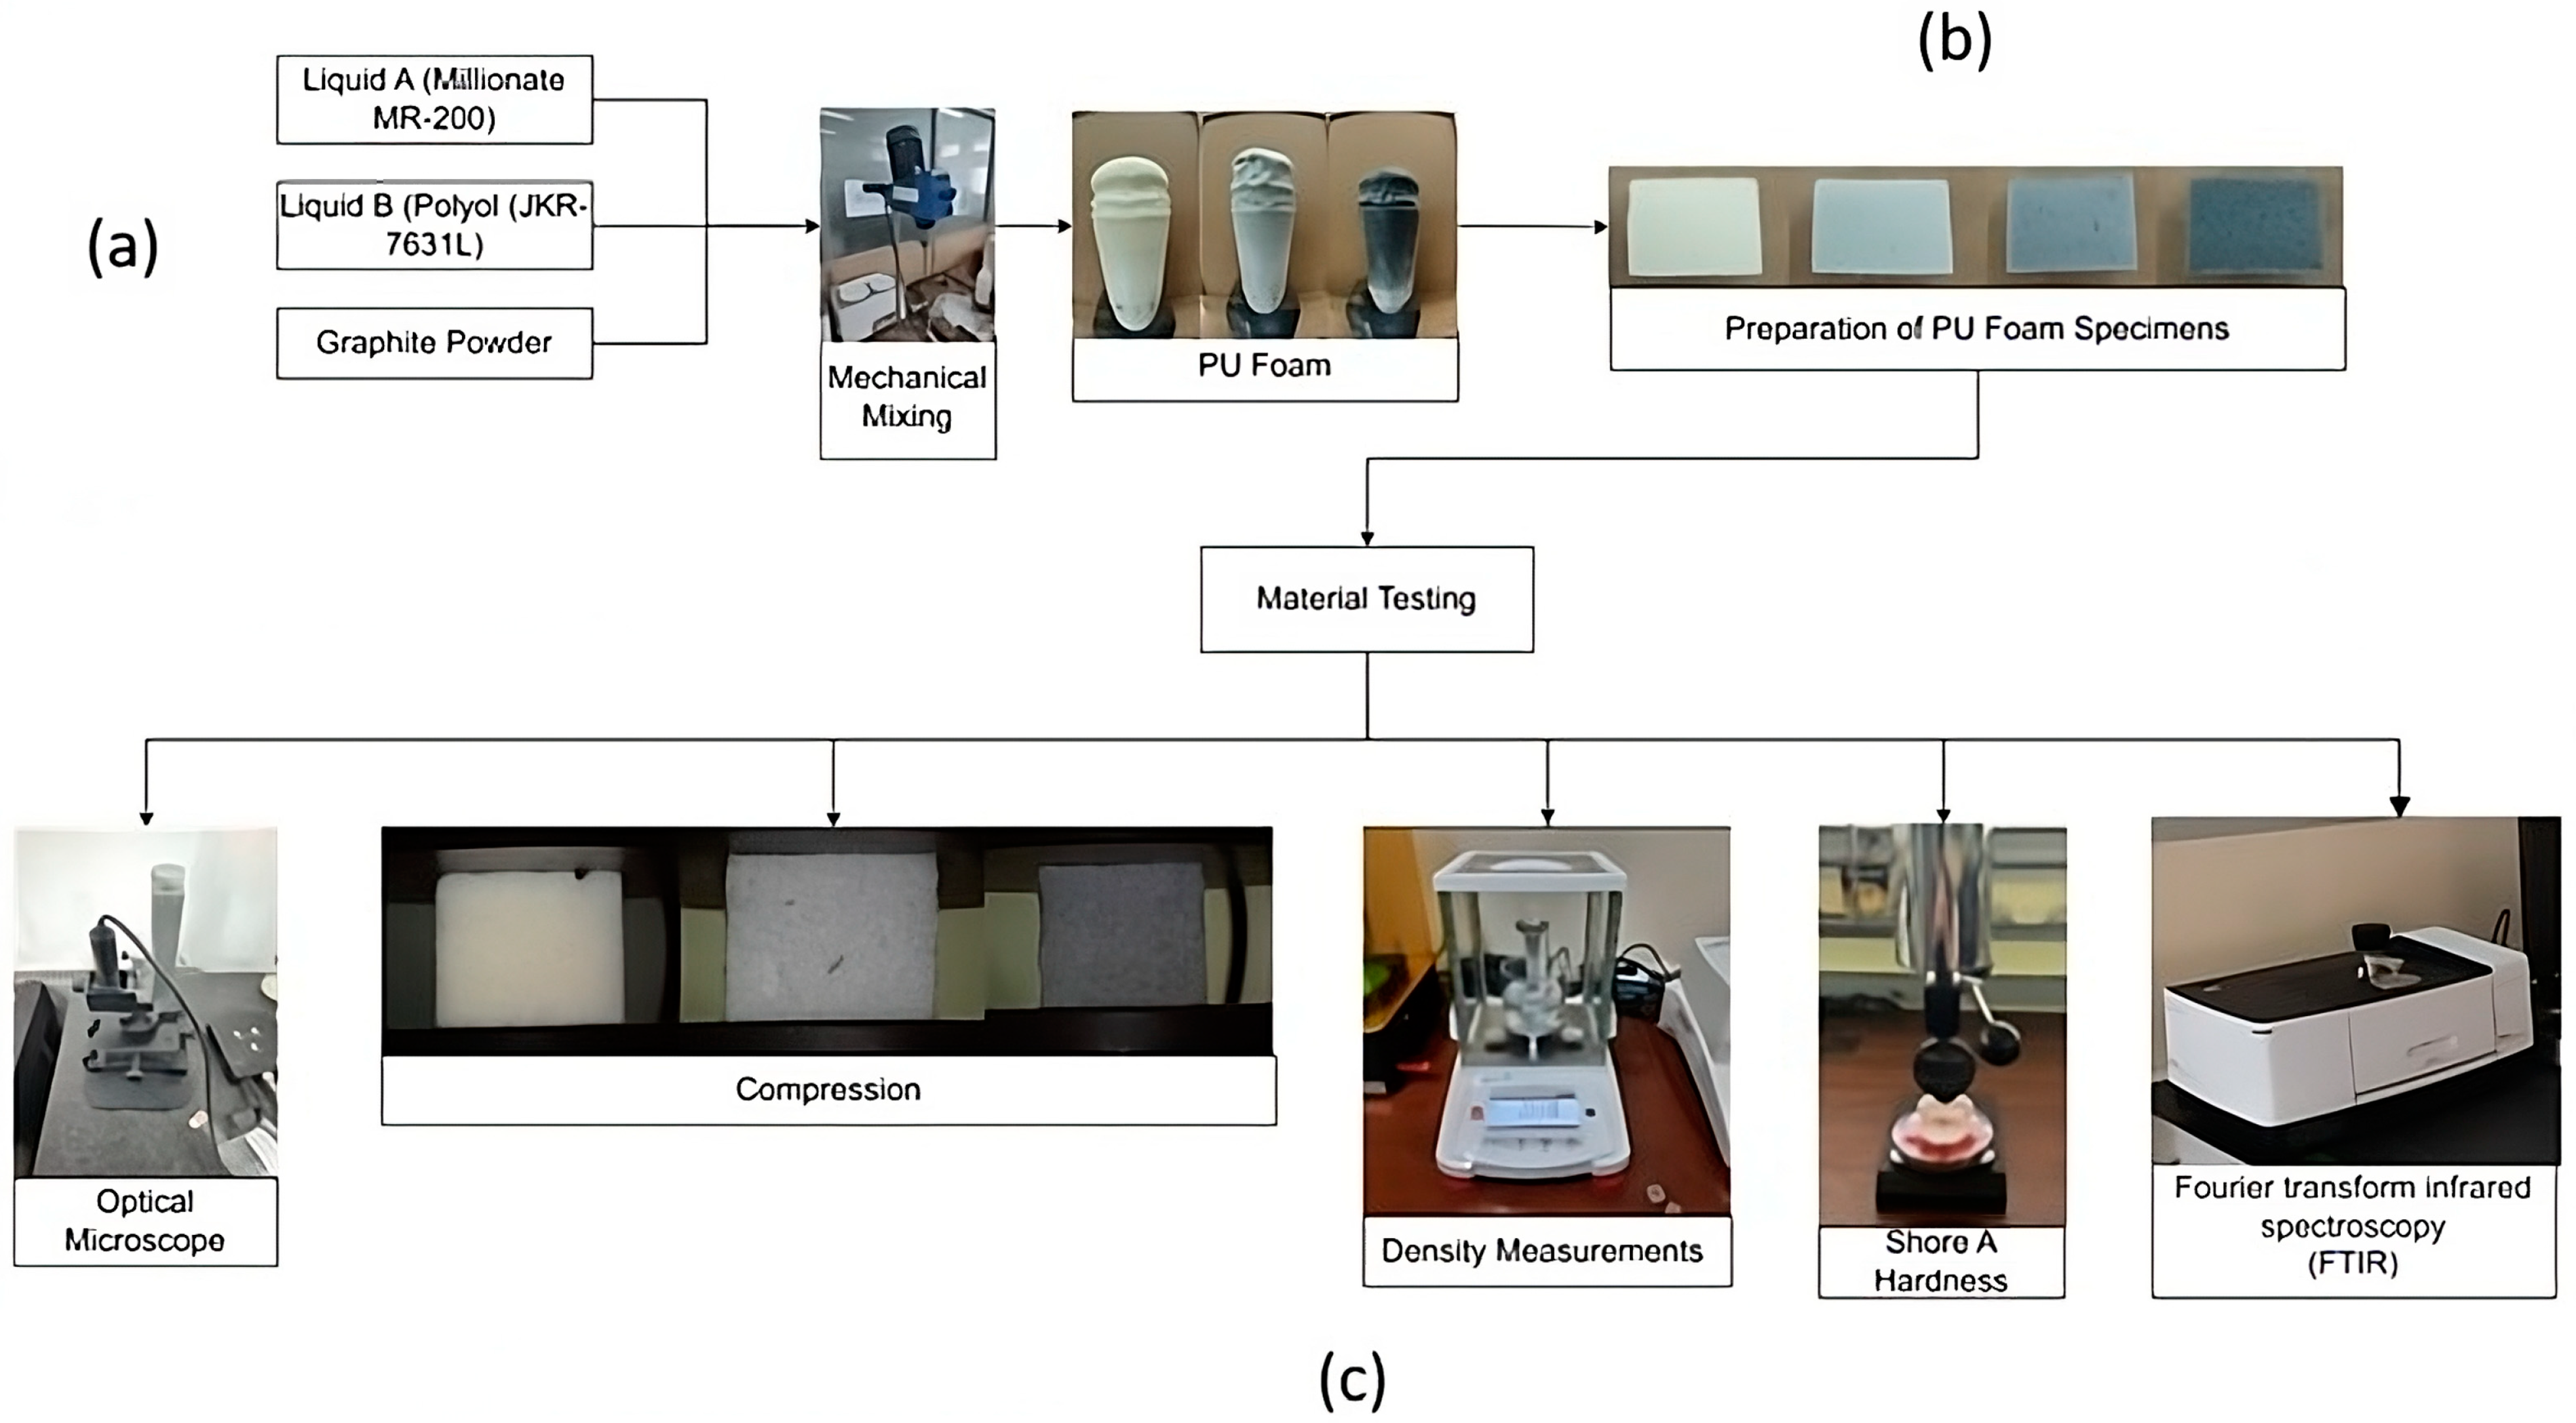
2. Materials and Methods

2.1. Materials

In this study, two materials were used: liquid A (Millionate MR-200), which is a polyisocyanate commonly used to make rigid polyurethane foam systems, and liquid B (Polyol (JKR-7631L)), which is a polyether containing water, catalysts, and silicone surfactants. When mixed these two materials, liquids A and B, react to form a rigid PU foam [45,46,47,48]. The materials are bought from PT Justus Kimiaraya, Indonesia, as the manufacturer of all polyurethane materials. Table 1 shows the properties of the PU foam and Table 2 shows graphite powder used in this study.

2.2. Methods

In manufacturing solid PU foam, this study uses two materials in the form of mixed liquids to obtain a polyurethanization reaction to form solid foam. The first material consists of liquid A/Millenium MR-200, known as polyisocyanate. This liquid is an elastic polymer, which expands when combined with Liquid B/Polyol (JKR-7631L) isocyanate liquid. The mixing results are then placed in a plastic cup of the same size (15 cm high), which has a significant development reaction and fills the volume of the media container. The mixing proportions for the production of PU foam as specimens are as follows.
The use of the ratios listed in Table 3 is a fixed variable carried out in this study as a reference in the mixing process. Using these ratios directly results in different expansion effects in each mixture. Hybrid PU foam was created by adding filler in the form of graphite powder. There are six types of specimen mixtures produced in PU foam, including pure PU foam without a mixture of graphite powder (0%), PU foam with a 1% graphite filler mixture, PU foam with a 2% graphite filler mixture, PU foam with a 3% graphite filler mixture, PU foam with a 4% graphite filler mixture, and PU foam with a 5% graphite filler mixture. The graphite filler mixture is obtained from a percentage of the total weight of 40 g and divided by the percentage of graphite used.
In the mixing process, graphite powder is added to Liquid A, then mixed using a mechanical mixer for 1 h for each specimen. After adding the filler powder to Liquid A, the next step is to react it into PU foam by combining it with Liquid B. After mixing the two components, the mixture is then allowed to expand and is left for 24 h to observe the different reactions that occur. If we look at Figure 2, after mixing Liquid A and B, a reaction occurs that forms PU foam. The temperature set during the curing process is 20–25 °C.
PU system that consists of 2 different materials are mixed to form reactions. The first reaction occurs between isocyanate and polyol, resulting in the formation of polyurethane. The second reaction involves the reaction between producing polyurea and CO2 gas as chemical blowing agents. The reaction process in the PU system can be seen in Table 4.
Furthermore, Figure 2b shows that the reacted PU foam is prepared as specimens for material testing. The specimens used have dimensions of 40 mm × 40 mm × 30 mm, following the ASTM D1621 testing standard [50]. Figure 2c explains that the prepared specimens are tested according to the standard.
Calculating the compressive strength of the specimen is done by dividing the load by the horizontal cross-sectional area at the beginning of the specimen. If a compressive modulus value is requested, select any suitable point along the straight section of the load–deformation or load–strain curve of the specimen to be tested. Note the load and measure the deformation or strain at that point. Calculation of apparent modulus is as follows [34]:
EC = WH/AD
Ec = modulus of elasticity in compression, Pa (psi);
W = load, N (lbf);
H = initial specimen height, m (in.);
A = initial horizontal cross-sectional area, m2 (in2);
D = deformation.
The estimated standard deviation can be calculated as follows [34]:
S = ( x 2 n x ¯ 2 ) / ( n 1 )
S = estimated standard deviation;
x = value of a single observation;
n = number of observations; and
x ¯ = arithmetic mean of the set of observations.
Material testing included optical microscopy, compression, density, hardness, and material characteristics testing using the FTIR method [45,51,52,53,54]. The compression speed was set at 2.5 mm/minute until the yield point was reached or the specimen had been compressed to 13% of the initial thickness before compression. Destructive testing includes compress and hardness testing carried out on the specimen. Hardness testing on PU foam material uses a Shore A (HA) Durometer. Hardness data are taken for 3 specimens at each ratio on nine surfaces in the test, data are obtained from the output generated by the testing machine, and all data are displayed in the system owned by the testing machine. The displacement, deformation, and other phenomena results were recorded and stored using digital equipment, specifically a Dino-lite USB microscope with a size specification of 200–400 mm. Density tests were conducted to determine the density value of the test specimens using the OHAUS Density meter machine. Characteristic test, using an FTIR machine with the SHIMADZU brand IRSpirit type, intended to see the bonding of compounds that occur in the test specimen.

3. Results

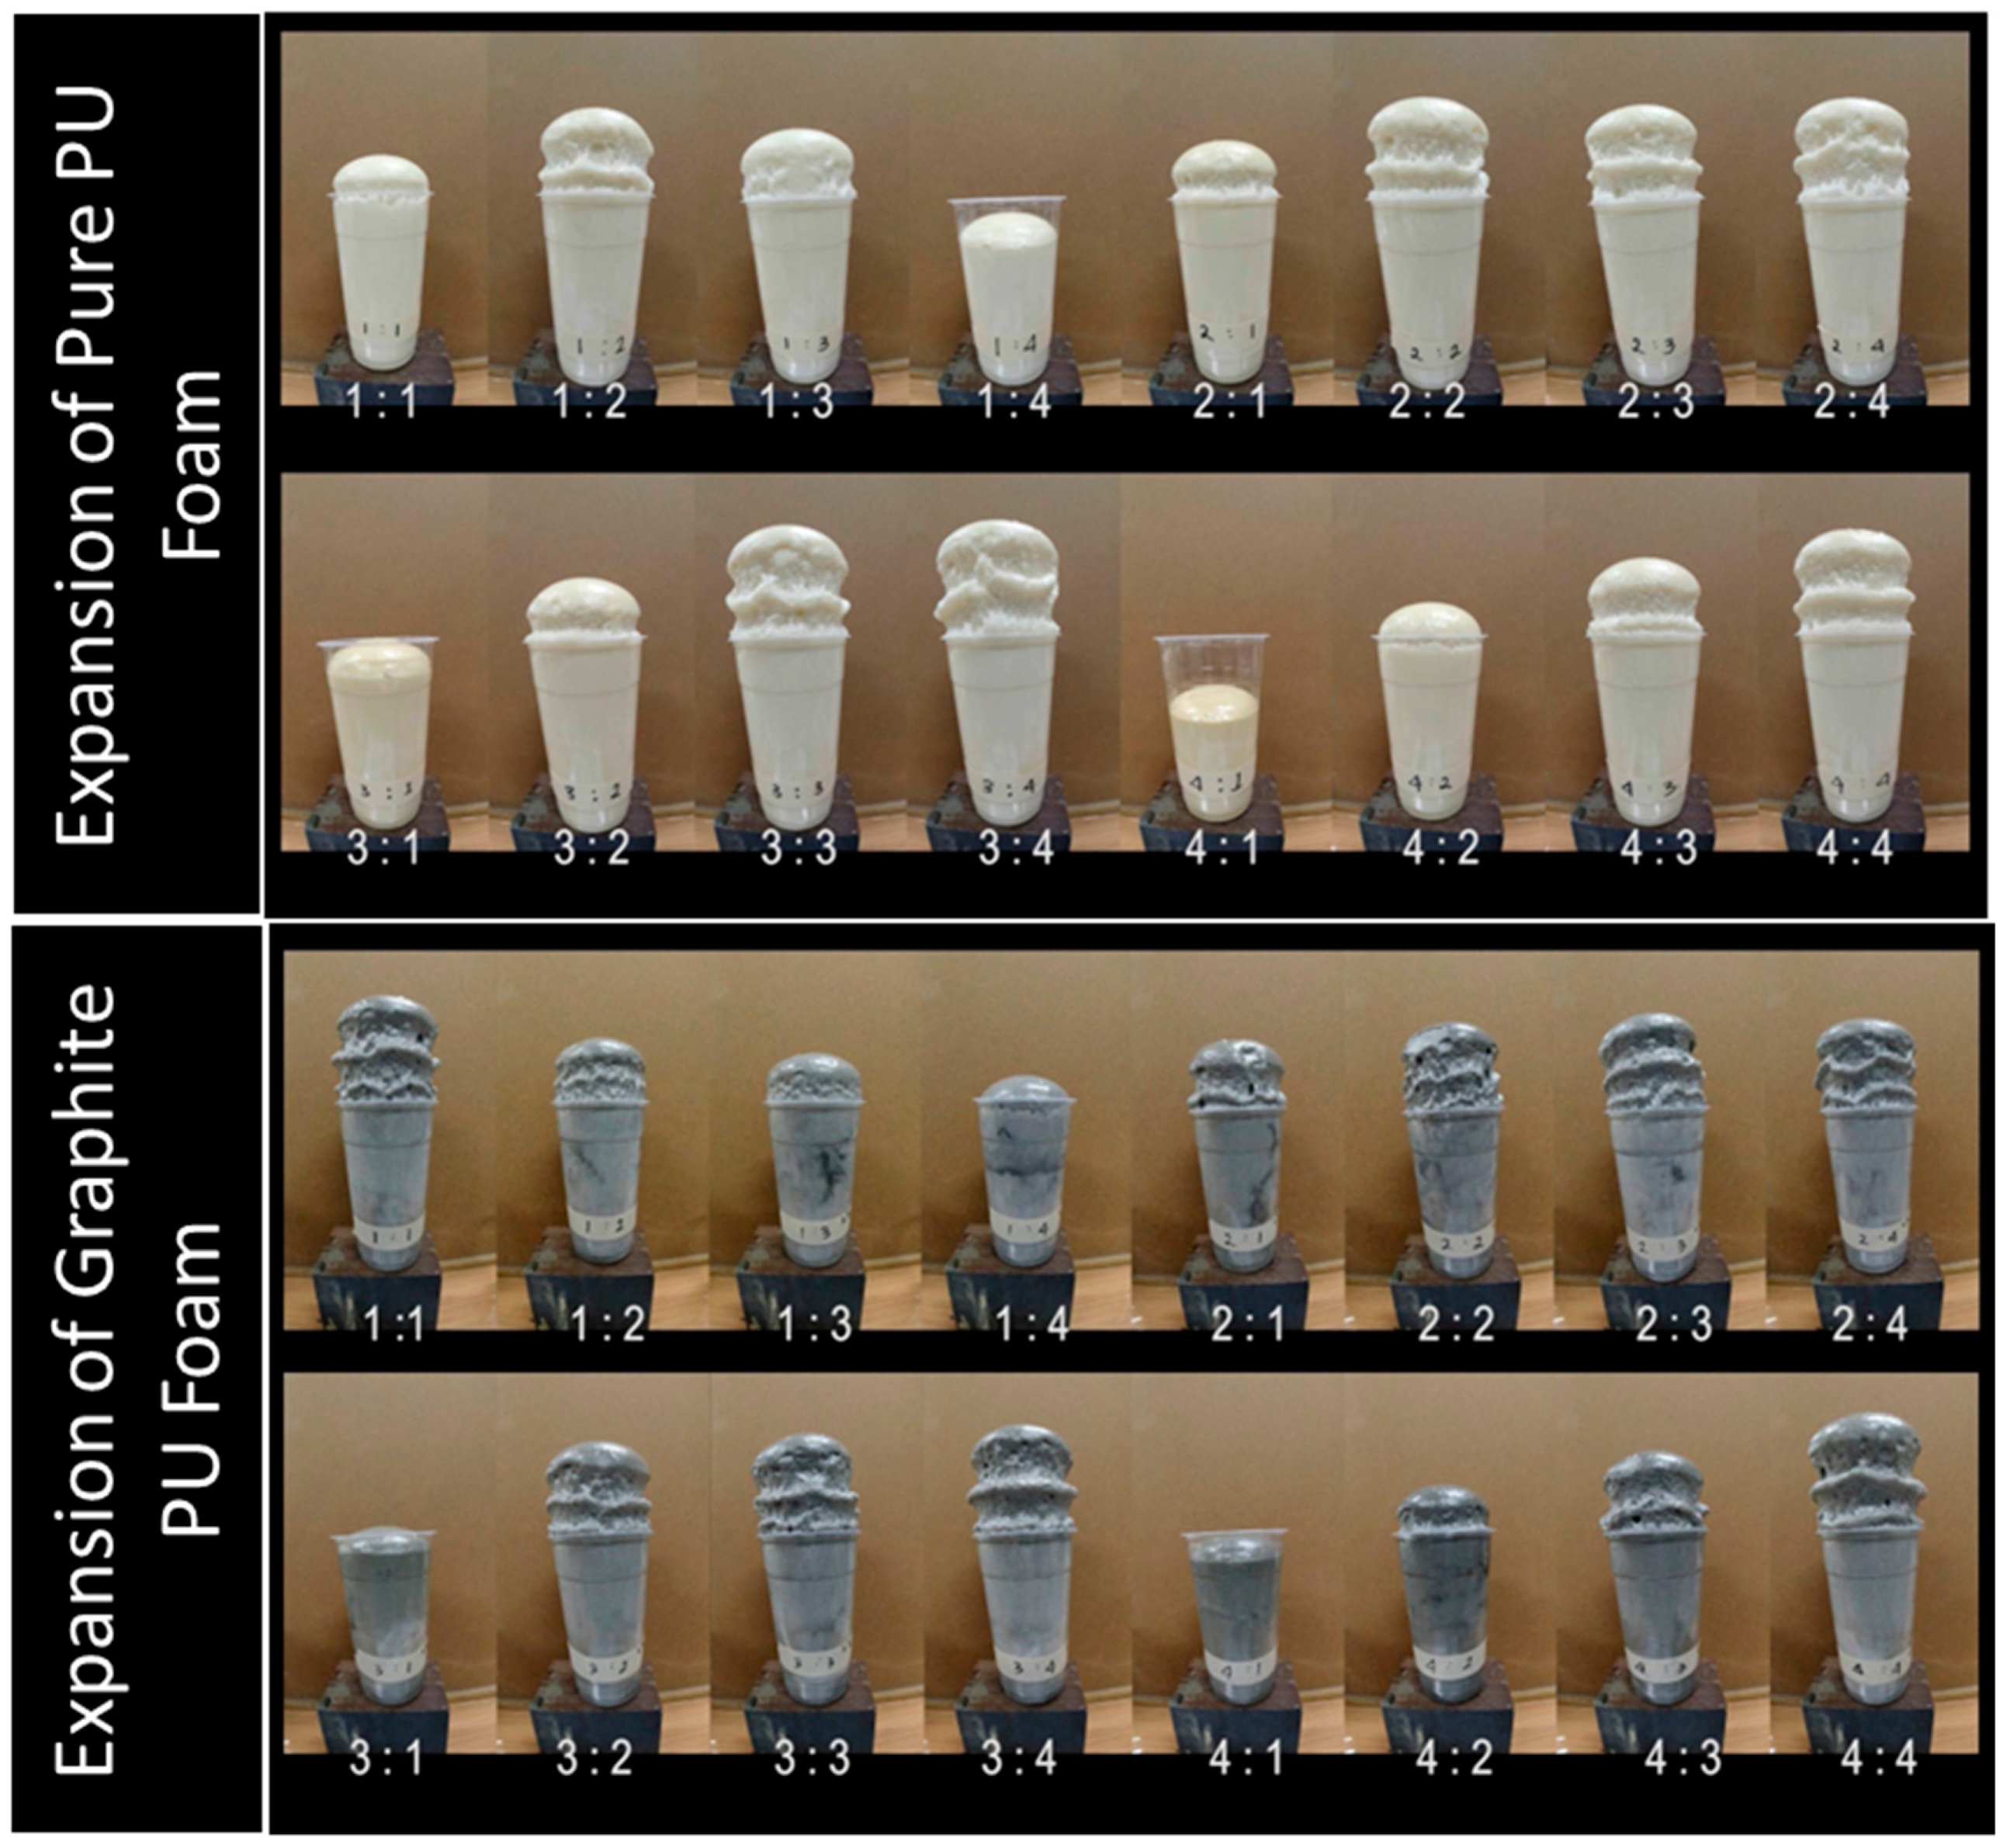
3.1. Expansion of Pure PU Foam and PU Foam Graphite Filler

As in Figure 3, the reaction for manufacturing PU foam can also be seen in Appendix A Figure A1. Specimen reactions of all ratios are shown in Figure A1; at point (a), A1 is the result of the development of PU foam without using graphite powder as reinforcement. When compared with the ratio used, there are visible differences. Expansion is different for each ratio, and the highest PU foam development is obtained from the mixture between the most dominant liquid B. The development of PU foam dominated by liquid A has a lower development due to the ability of the polyol or reactor, which cannot react with the entire isocyanate liquid because the amount is less. However, specimens that produce low expansion have a denser structural density.
The expansion at each variable ratio is different. As seen in Figure 3, there is a significant variation from one ratio to another. All growth foam of all specimen can be seen in real time that added in the supplementary materials in the video-based file. This indicates that the material used in PU foam formation affects the foam reaction. At a ratio of 4:1, the amount of liquid A, an isocyanate, is more than liquid B, which is a polyol reaction liquid. The amount of liquid polyol is insufficient to react with the larger amount of isocyanate. At a 4:1 ratio, polyurethane formation still occurs, but the resulting expansion is less significant than in other ratios. In contrast, the resulting expansion is greater when compared to ratios using a greater amount of polyol, such as the 1:2 ratio, which contains less isocyanate liquid. Furthermore, the addition of graphite powder filler affects the expansion reaction, such as the 3% and 5% results. The expansion is greater when compared to PU foam at other levels. However, the results of this reaction have a significant impact on the density of each specimen. The observations regarding expansion, when compared to the compression test results, are interrelated. Density increases as expansion decreases and vice versa. The greatest expansion results in the lowest density. This is very interesting because expansion affects the structure that occurs in the reaction.
In Table 5, the results of hardening from the manufacture of PU foam specimens have their own differences depending on the ratio used. The results of specimen hardening at all ratios can be seen in Appendix A Figure A2. All are listed in full in Figure A2, and when viewed, specimens marked in red are specimens that have shrunk after curing for 24 h. The size of the specimen after the curing process has changed, and some specimens do not experience changes after curing for 24 h, which are marked in black.
Table 5 shows that liquid mixtures A and B used for PU foam production show differences in foam development. The liquid with a ratio dominated by polyol does not harden and tends to shrink after 24 h of standing, as shown in Table 5 in the figure given by the red line, while the mixture dominated by isocyanate liquid hardens and does not shrink after 24 h of standing. A larger amount of reactor liquid in the PU foam formation process causes imperfections in the solid foam development process, but development can be optimized if the polymer elastomer liquid is more than the reactor liquid. In the ratio with the use of the same ratio as 1:1 experiencing the phenomenon of re-shrinkage after cutting, the specimen formed with the size of the cube looks perfect after cutting, but after 8 h of settling back, the cube specimen at a ratio of 1:1 in the mixture of pure PU and modified graphite filler experiences shrinkage again resulting in specimens that are not perfect in shape. The ratio of 1:2 to 1:4 and all specimens marked in red experienced significant shrinkage from the initial reaction formation. The production of PU foam dominated by liquid B (polyol) resulted in imperfectly hardened specimens that could not be used in mechanical testing. In general, the reaction was not perfect. The ability of the reactor liquid could not help the process of maximizing foam development because the liquid to be reacted was not in the appropriate portion. Specimens marked in red tend to be mushy and do not have good stiffness like specimens with images marked in black. Specimens with good hardening results and that avoid material shrinkage will be discussed in the results.

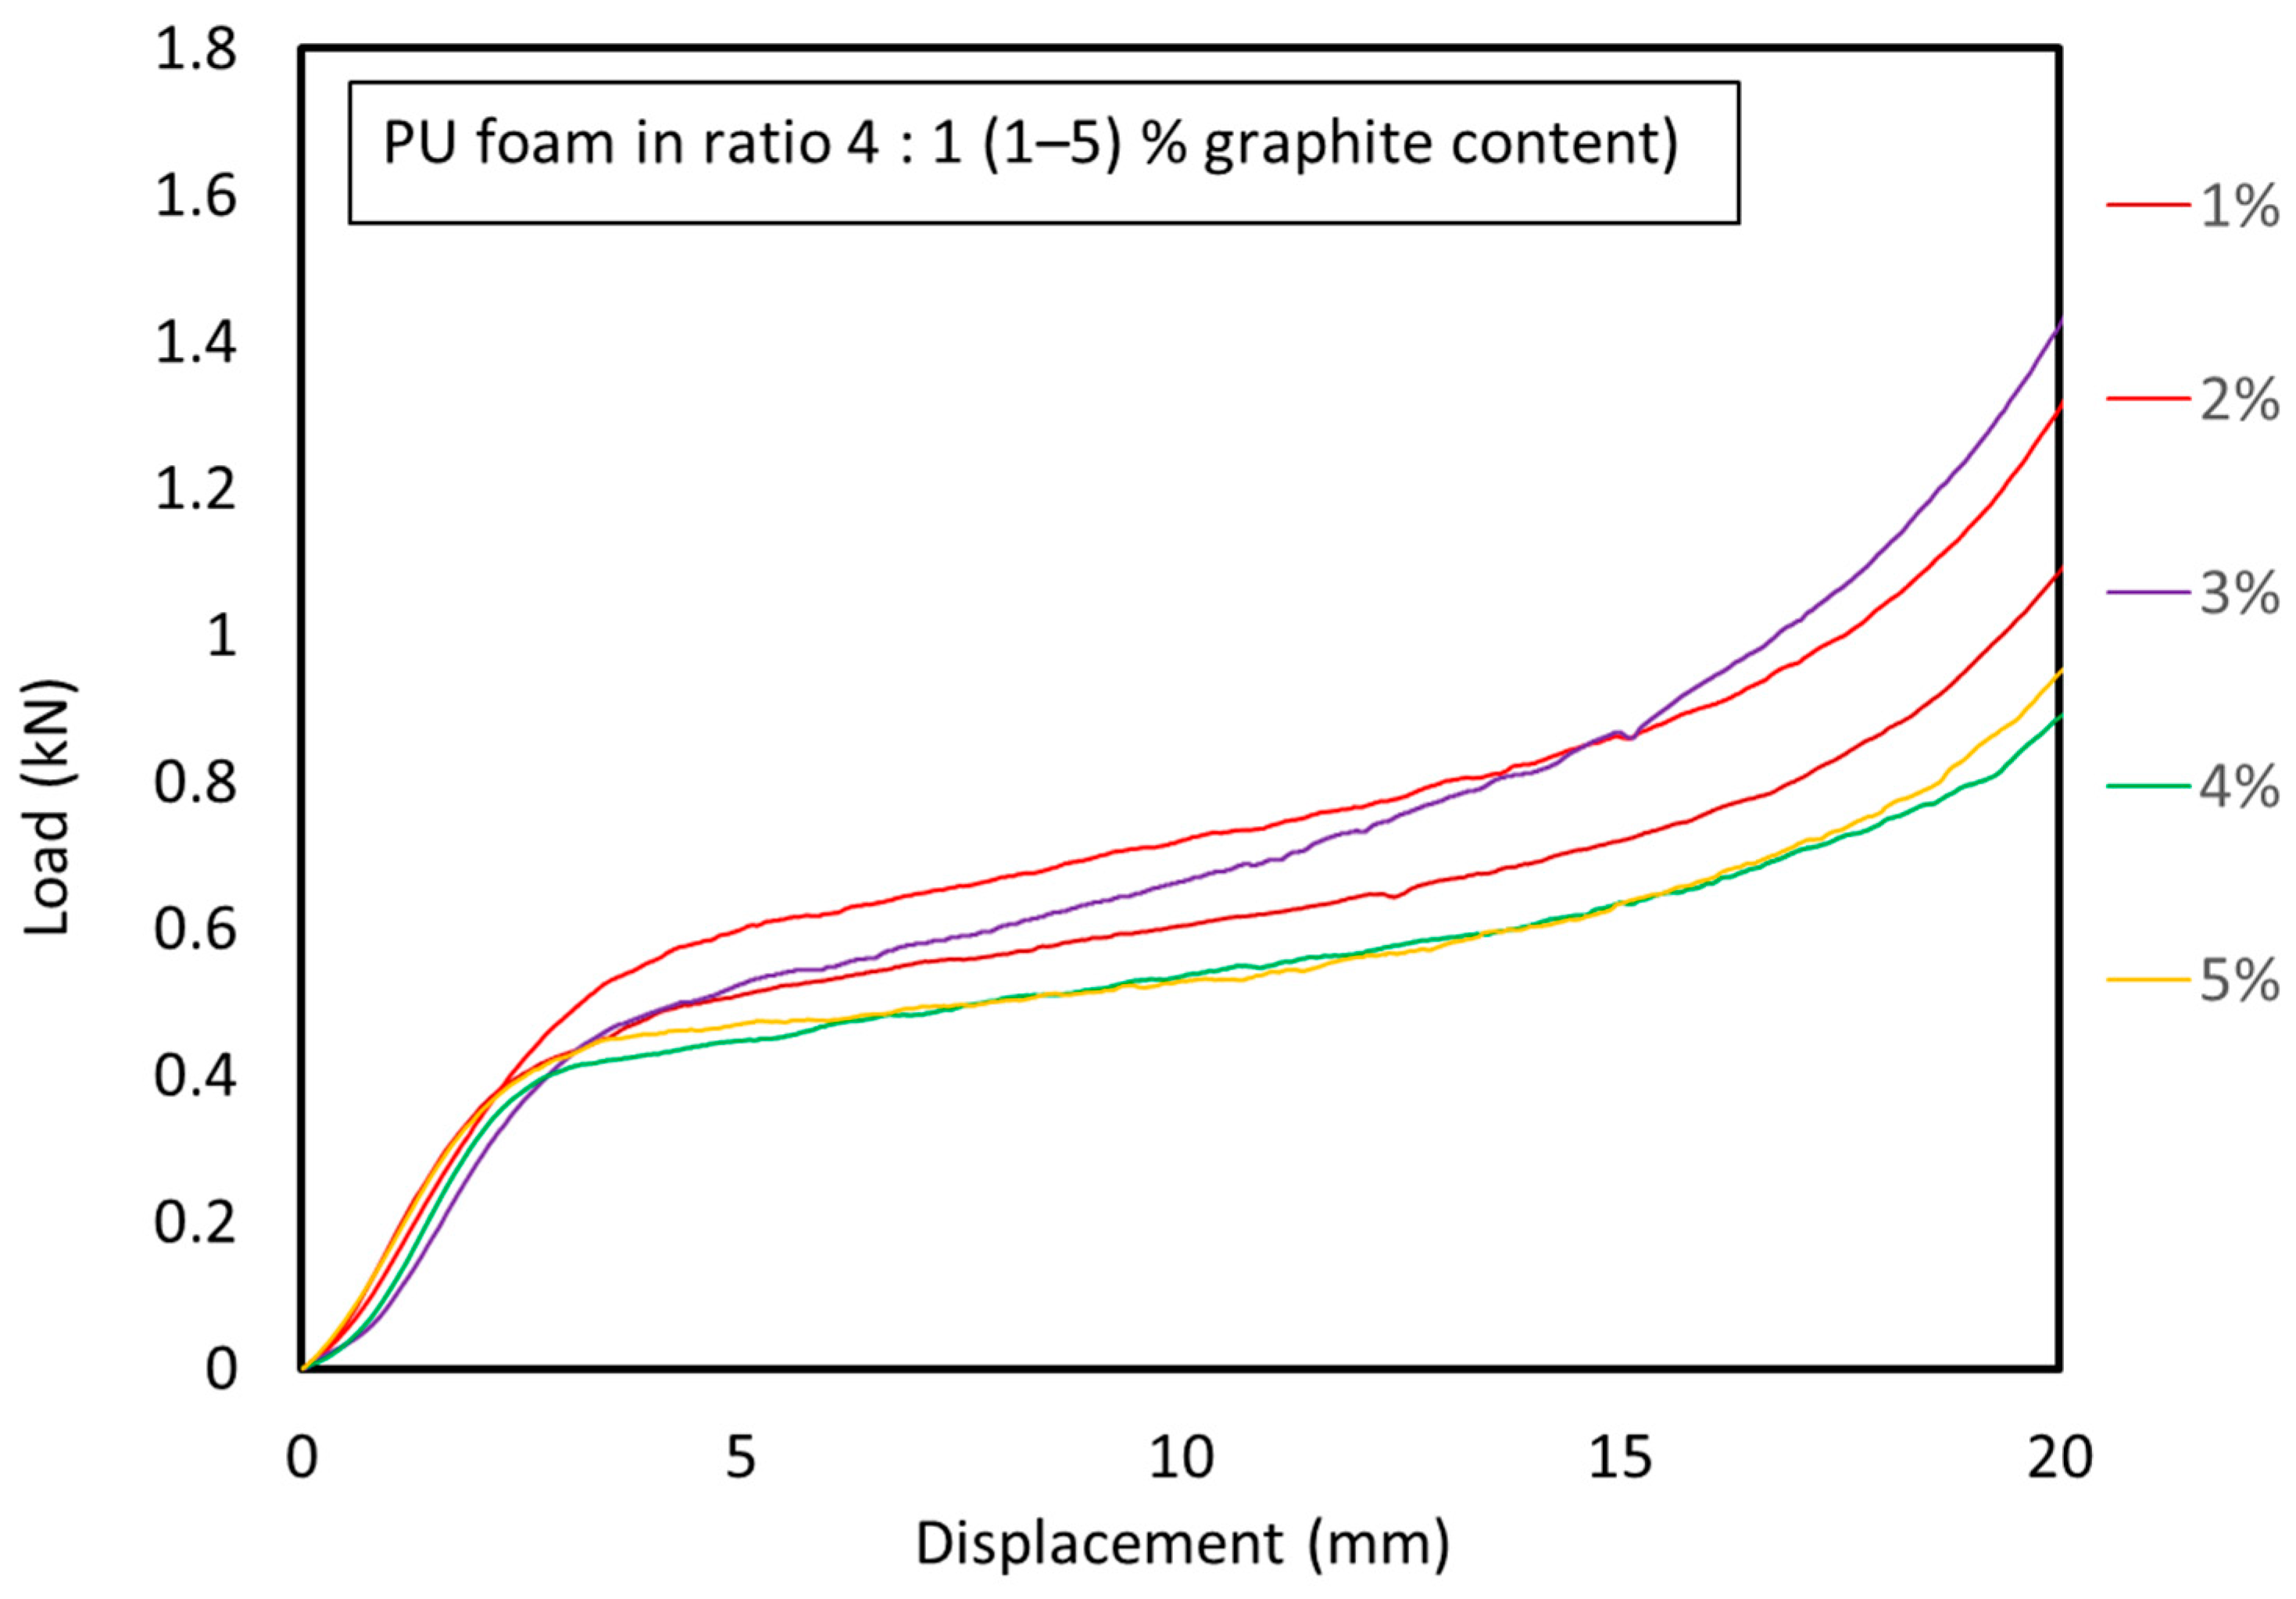
3.2. Compression Test
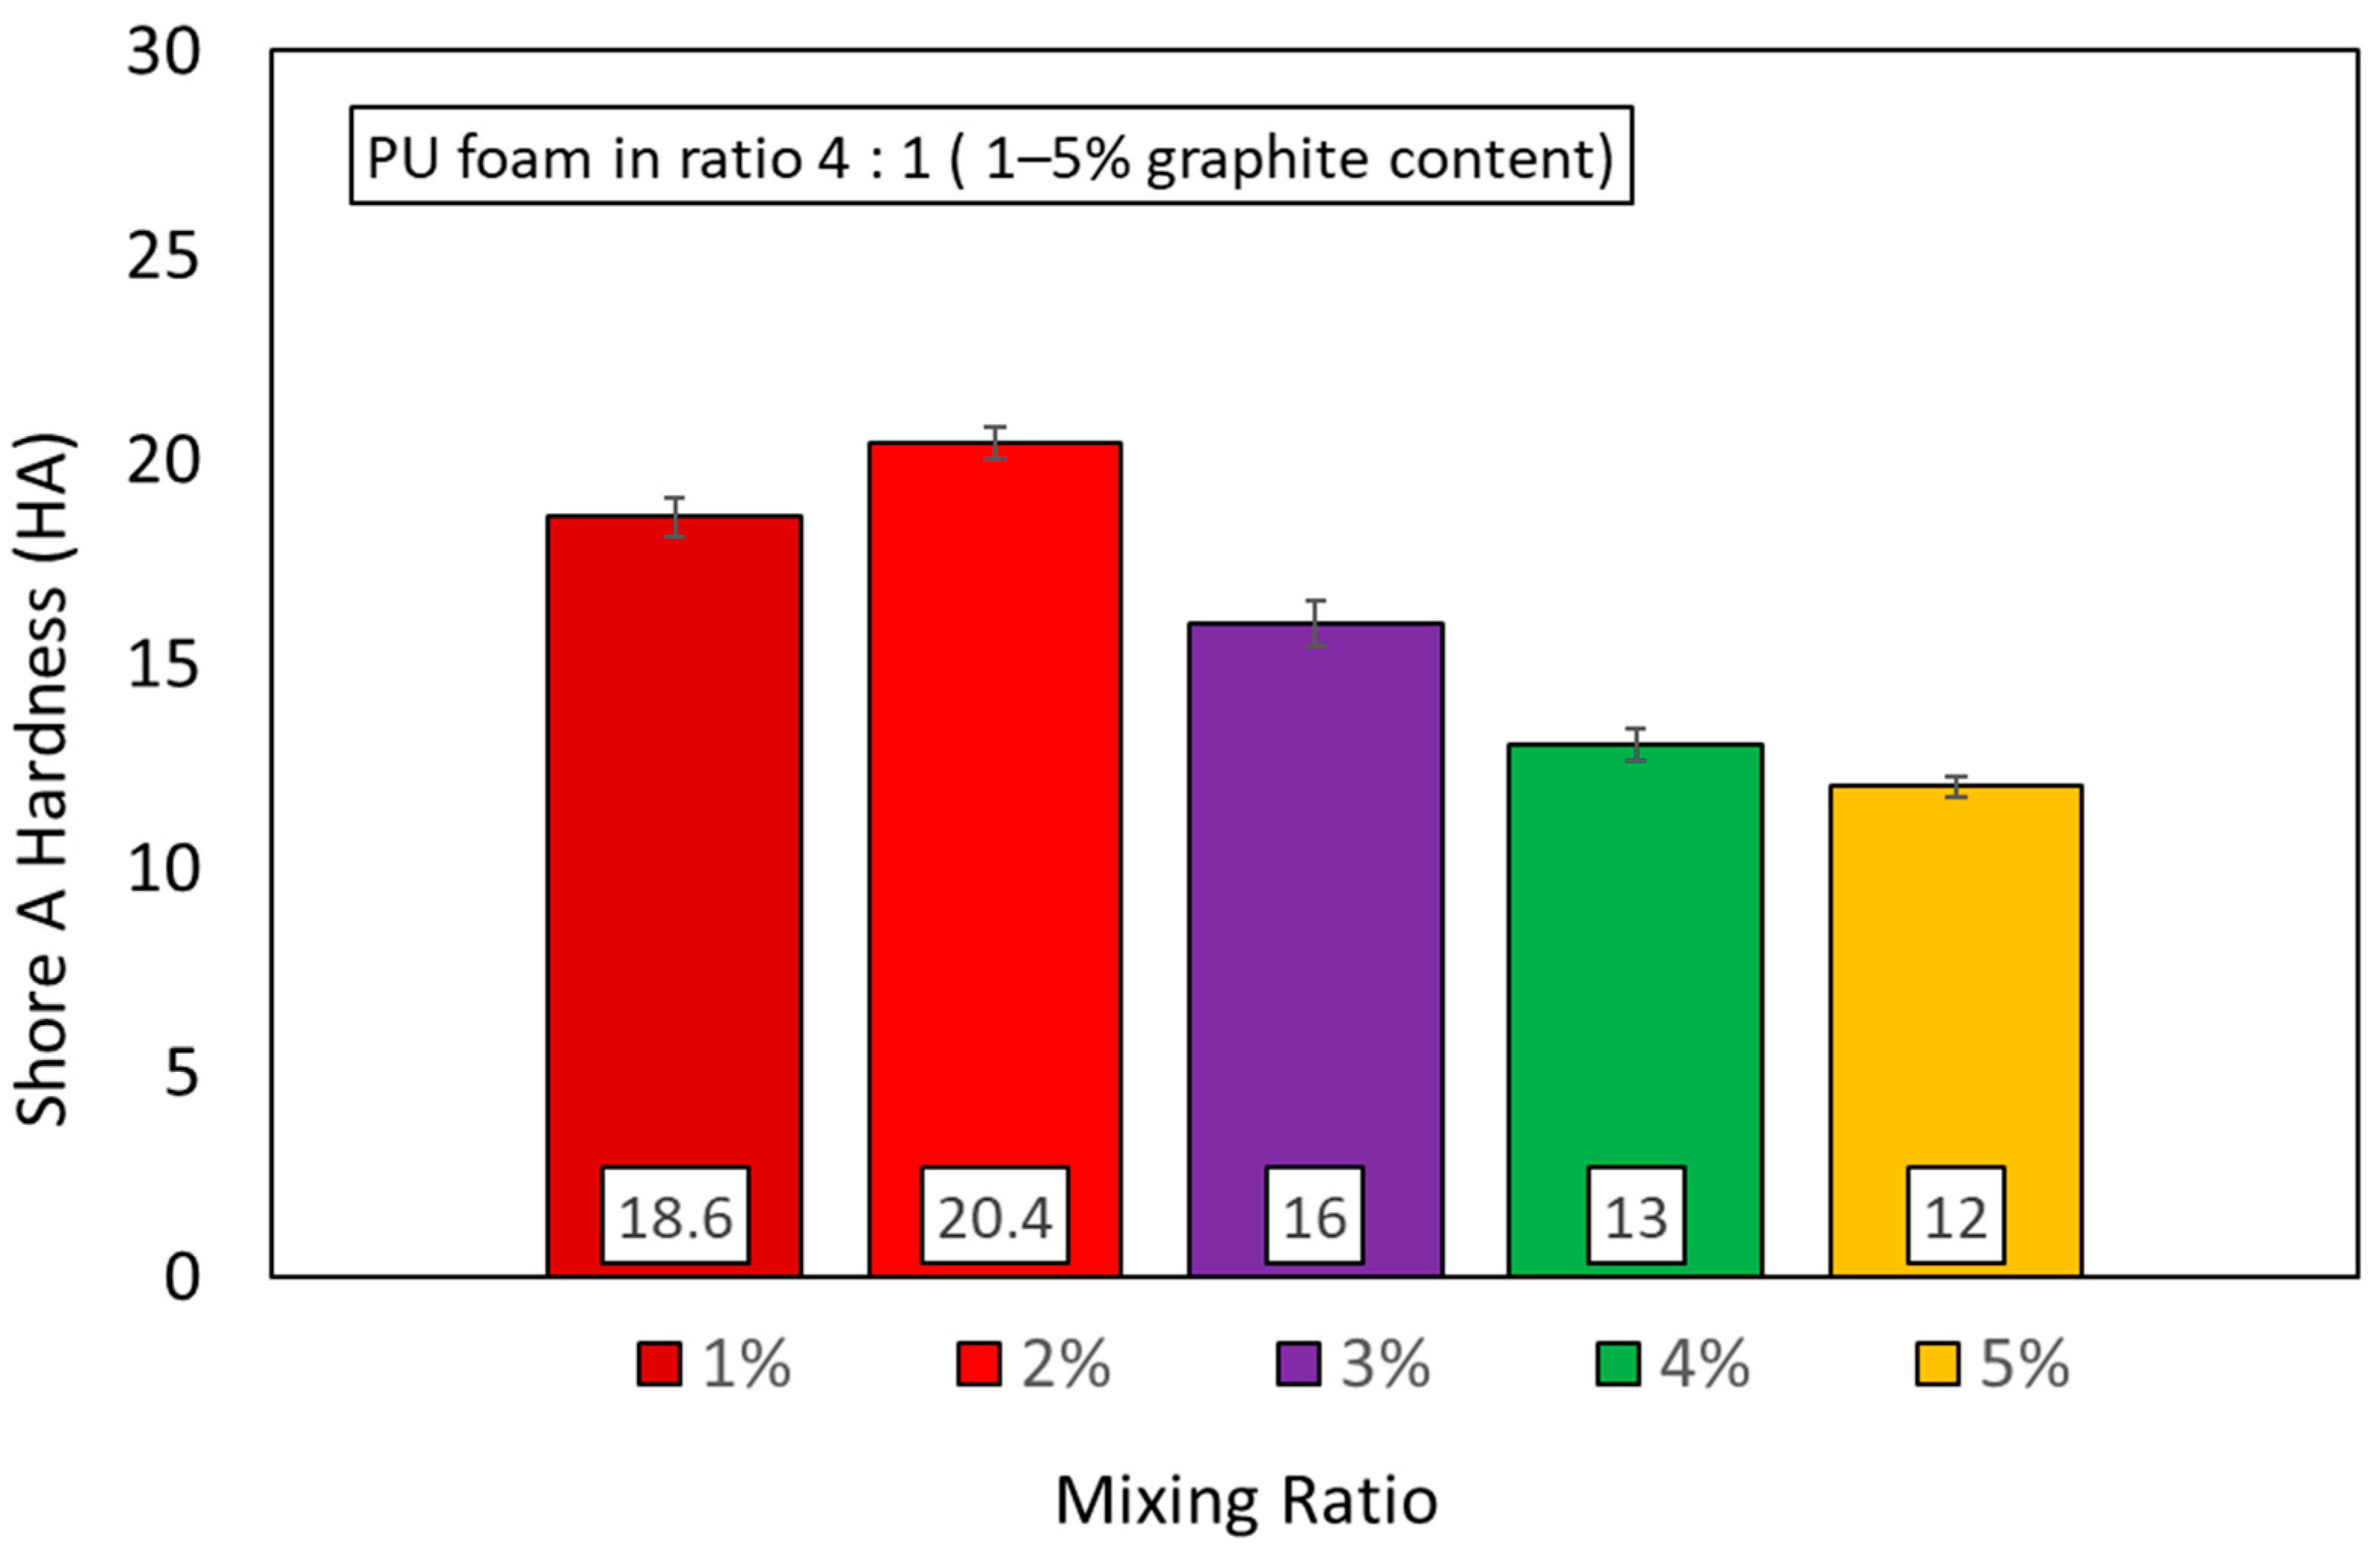
In Figure 4, it can be observed that there are differences in material strength associated with displacement when subjected to compressive loads. PU foam with a loading ratio of 4:1 and graphite powder reinforcement showed the highest results at 2% graphite content. The material’s resistance to compressive testing decreases as the graphite content increases. Details of compression testing of all specimens can be seen in Appendix A Figure A3, where there are results of compression testing data on pure PU foam specimens and PU foam with graphite filler.
The highest value is found in the specimen with a ratio of 4:1, with a value of 0.84 kN, followed by the second highest value in the 3:1 ratio with a value of 0.55 kN in pure PU foam specimen. The specimen with the highest resistance is found in the PU foam specimen with a mixing ratio of 4:1. The microstructure formed from the mixing process at this ratio has a denser density than other ratios. In Appendix A Figure A3b, representing PU foam with 1% graphite filler, the highest value is found in the 4:1 ratio with a value of 0.42 kN, and the second highest value is found in the 3:1 ratio with a value of 0.40 kN. Figure 3c, representing PU foam with 2% graphite filler, shows the highest value in the 4:1 ratio with a value of 0.49 kN. If we look at the compression test results for PU foam with 3%, 4%, and 5% graphite filler, as shown in Appendix A Figure A3d–f, there is also a significant decrease from the 4:1 and 3:1 ratio. PU foam mixtures dominated by liquid A, which is isocyanate, exhibit greater resistance in compression testing due to the hardness of the material formed during the PU foam manufacturing process as well as the density formed within the PU foam structure. The denser or larger the structure, the greater the material’s resistance. In the compression test results for specimens with graphite filler at presentations of 1–5%, the highest value is found in the specimen with a 2% graphite filler presentation with a value of 0.49 kN at 4:1. When compared to the expansion results from Figure 3, the expansion in the 4:1 ratio is smaller compared to that in other ratios. The larger the expansion in a ratio, the lower the density formed and vice versa. In the 4:1 ratio, the specimen shows smaller expansion than the others but exhibits resistance to load in the compression test.

3.3. Hardness Test

In Figure 5, comparison between PU foam with a mixture of 1–5% graphite content in the ratio 4:1 can be observed. The highest hardness is obtained from PU foam with a mixture of 2% graphite. Detailed hardness test of all specimens can be seen in Appendix A Figure A4. In that section, it explains all the results of the hardness tests carried out at all mixing ratios in the manufacture of PU foam, then the hardness test of PU foam with a mixture of graphite as a filler is also listed.
Looking at Figure 5, the highest result from the hardness testing for all specimens of 0–5% PU foam is in the PU foam modified with 2% graphite filler at a ratio of 4:1, measuring 20.4 HA. The addition of graphite filler actually makes the material more brittle. When examining Appendix A Figure A4, the hardness test results from point (a–b) show a relatively significant increase and decrease. The increase in hardness values becomes noticeable and dominant at a 4:1 ratio in the PU foam specimens with a 2% graphite mixture. However, in some ratios within this mixture, there is also a decrease in hardness values. However, the most dominant is the 4:1 ratio with a 2% graphite mixture. The decrease starts to occur as the graphite content increases. If we look at points (d–e) in Appendix A Figure A4, it is evident that all ratios experience a significant decrease in hardness levels. At the reference point of the 4:1 ratio in the specimens with 0% graphite mixture or pure PU foam, the hardness value is 18.8 HA. With a 1% graphite mixture, PU foam obtains a hardness value of 20.4 HA. Hardness increases with the 2% graphite mixture, reaching a value of 20.4 HA. The hardness decreases with the 3% mixture at a 4:1 ratio, measuring 16 HA, and then with the 4% graphite mixture at 13 HA, and the smallest value is in the specimen with 5% graphite PU foam mixture at 12 HA. The density of the structure influences the magnitude of these hardness values. The 2% graphite mixture has the most optimal structure density. As the graphite content increases, the structure formation within the PU foam becomes less perfect.

3.4. Density

Figure 6 compares PU foam with mixtures of 1–5% graphite content at a ratio of 4:1. The results show that PU foam specimens with a mixture of 1% graphite have the highest density with a value of 69 kg/m3. Then, along with the increase in the level of graphite given and the decreasing density value obtained, the provision of graphite in the PU foam manufacturing process tends to reduce the density owned because the reaction produced in the PU foam manufacturing process cannot occur optimally and is bound by graphite powder. The highest density obtained from PU foam graphite filler is with 1% graphite. Detailed density tests of all specimens can be seen in Appendix A Figure A5. In Figure A5, point (a) is the result of testing pure PU foam, and it is found that the 4:1 ratio has the highest density value. Almost all density tests on PU foam specimens at A5 point (a–f) purely or with a mixture of graphite powder show the highest density results at a ratio of 4:1.
During the testing and calculation, the highest density value is observed in the 0% filler test, which is obtained at a ratio of 4:1 with a value of 0.0772 g/cm3. The same trend is also observed in the 1% graphite filler ratio, with a 0.0687 g/cm3 density. In the 2% test, the density decreased to 0.0583 g/cm3. Then, there was a significant increase and decrease in the 3% ratio with a density of 0.0624 g/cm3 and 4% with a density of 0.0558 g/cm3, respectively. In the 5% test, the graphite filler increased with a 0.0612 g/cm3 density. These results demonstrate that the graphite mixture affects the density level in the specimen. As shown in Figure 2, this is related to the amount of expansion. The higher the expansion, the smaller the density produced from the specimen tested. Conversely, when there is less expansion, the weight of the specimen gathers more tightly, allowing for an increase in density.

3.5. FTIR

Characterization of a PU foam graphite filler can be viewed using FTIR (Figure 7). The spectrum of graphite gave the absorption spectra of C=C at 1632 cm−1 and of a new intense band C=O at 1722 cm−1; C=l identified as halo carbon compounds are chemicals in which covalent bonds link one or more carbon atoms with one or more halogen atoms, then the N-O compound bond at wavenumber 1550 cm−1 are called the nitrous compound. Nitro compounds are organic compounds that contain one or more nitro functional groups. The nitro group is one of the reactors. In this case, the nitro group is acidic. These results are consistent with the research that PU foam has absorption peaks of functional groups, C=O, C=C, N=O, and C=l, which indicates that the specimen material has been formed from graphite. The FTIR spectra of graphite (Figure 4c) exhibit a band at 3426 cm−1 due to O-H stretching. The band at 1631 cm−1 appears due to C=C stretching. The band at 1198 cm−1 is attributed to the presence of C-O stretching. The 2% graphite filler specimen shows an increase that indicates the energy uptake of this compound is quite high compared to other specimens. The result obtained is the most efficient thru-bonding reaction of the PU foam with graphite powder.

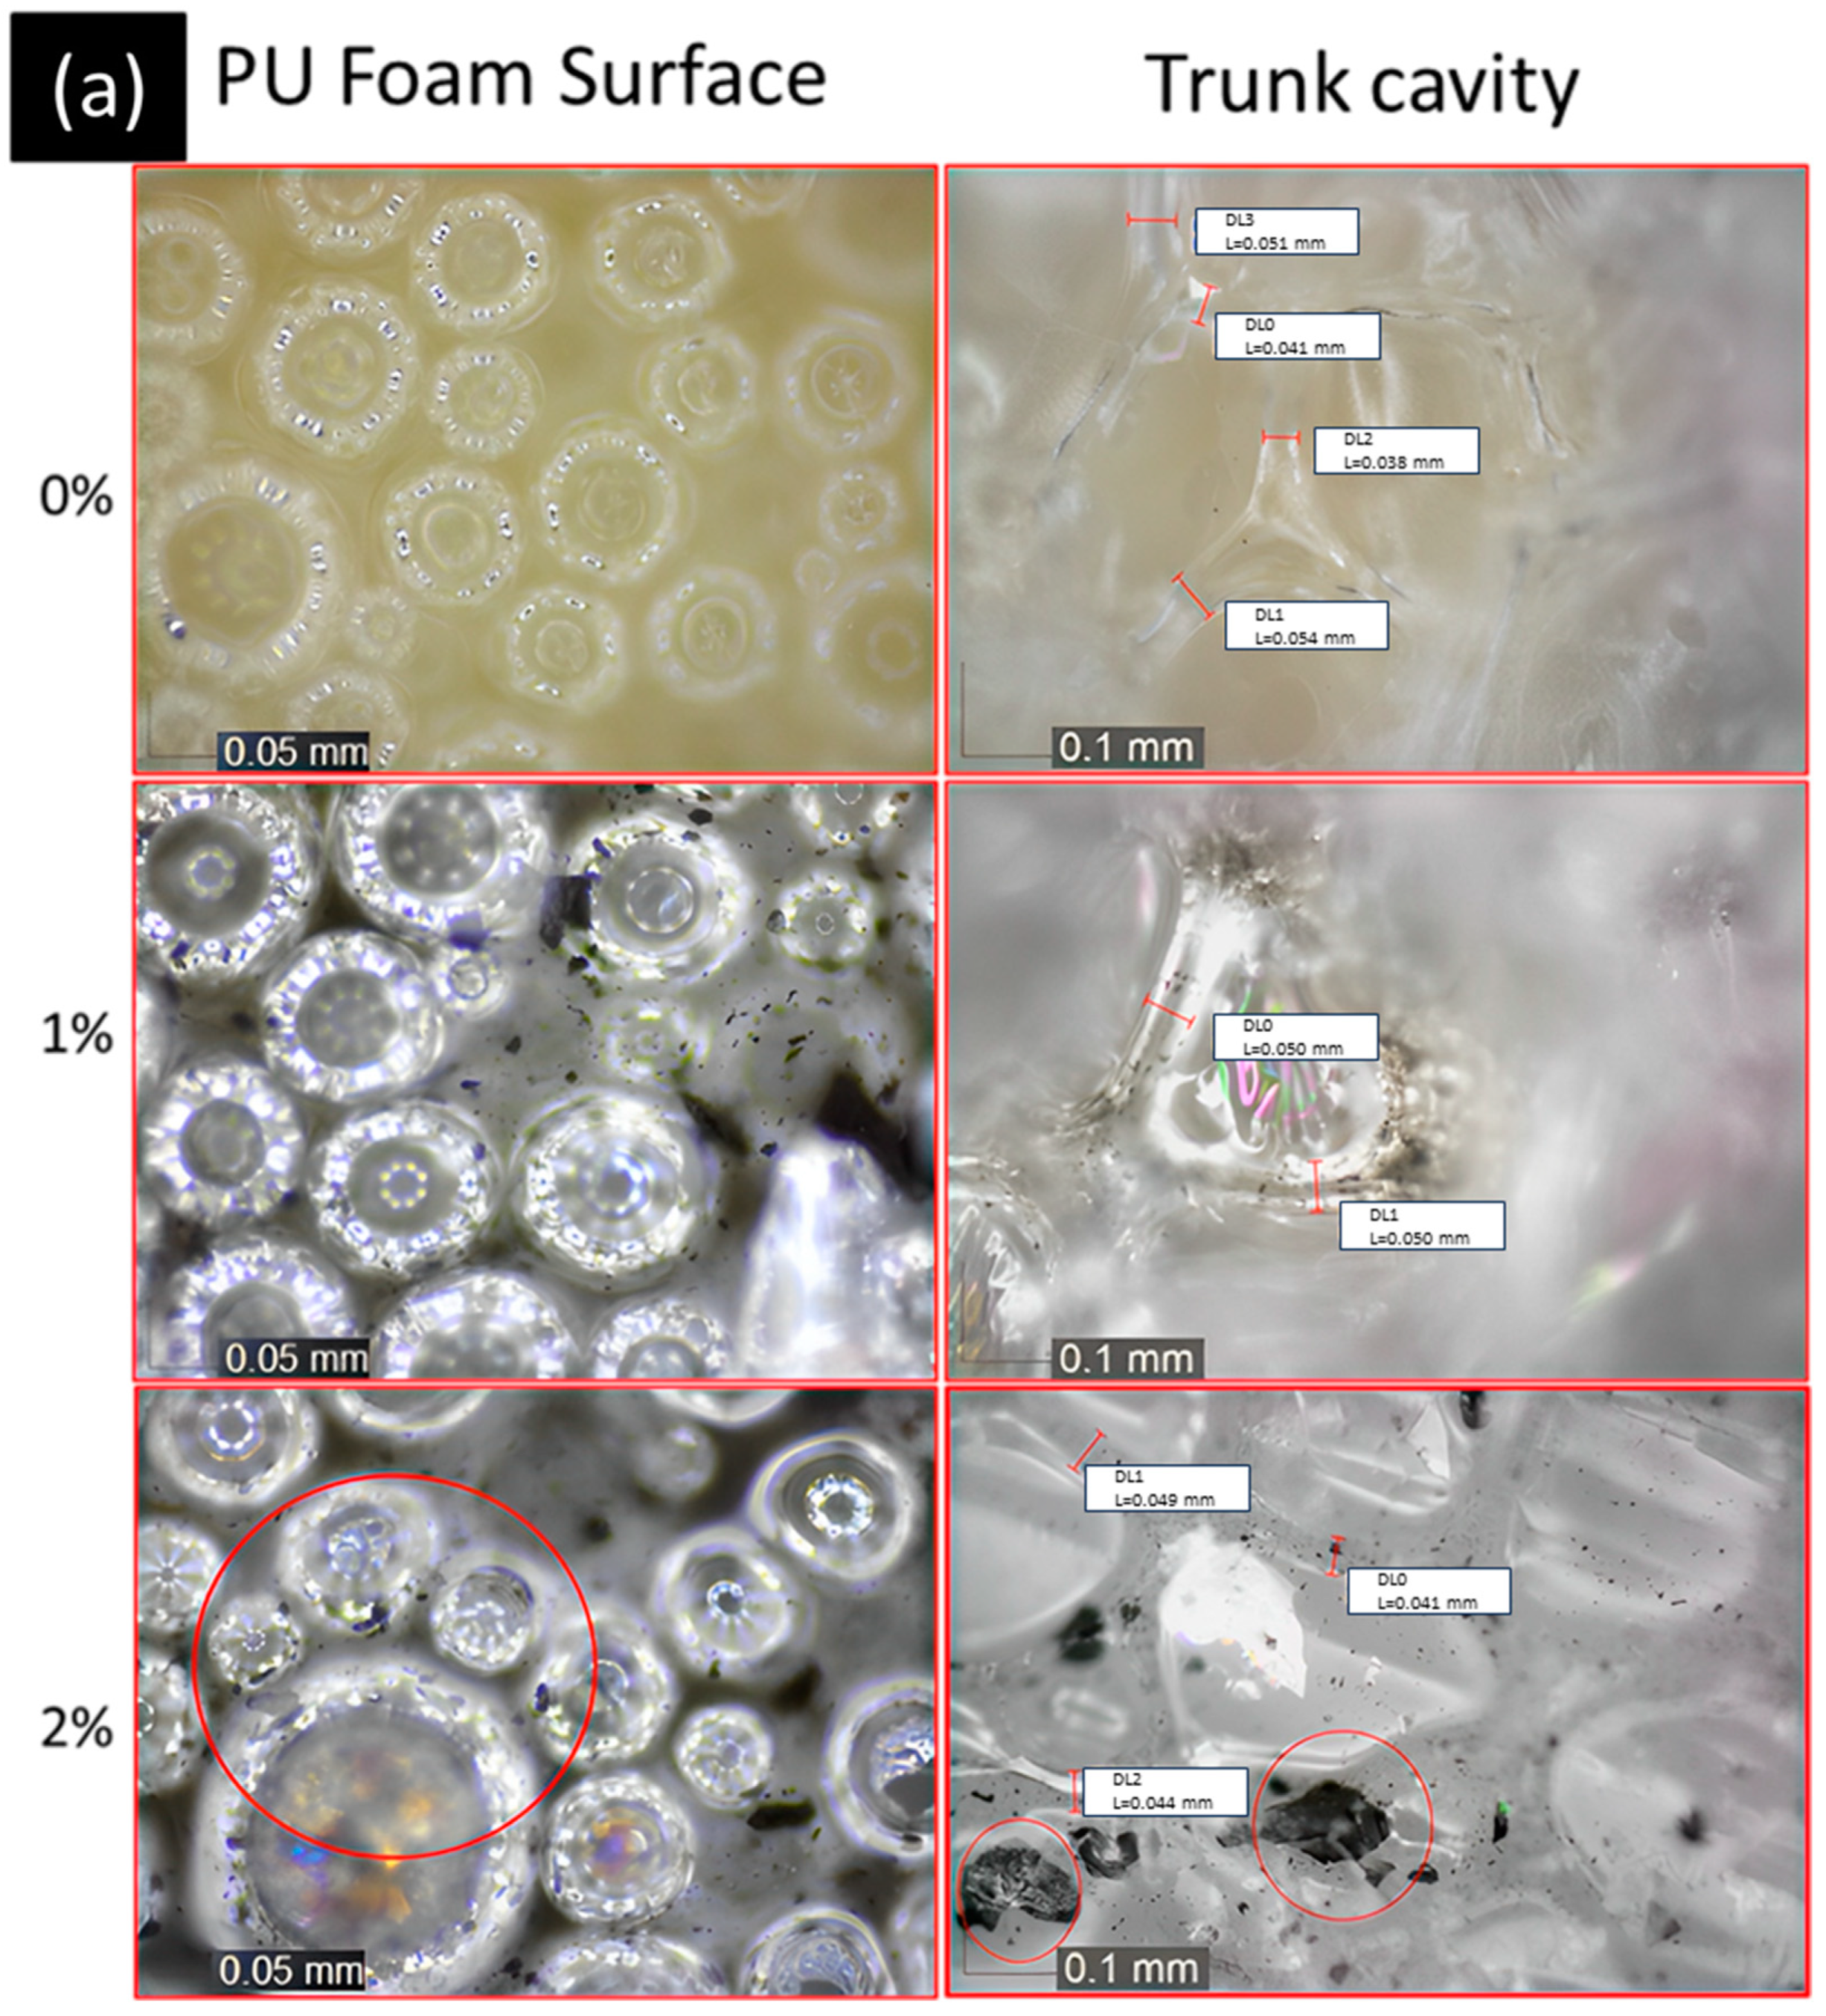
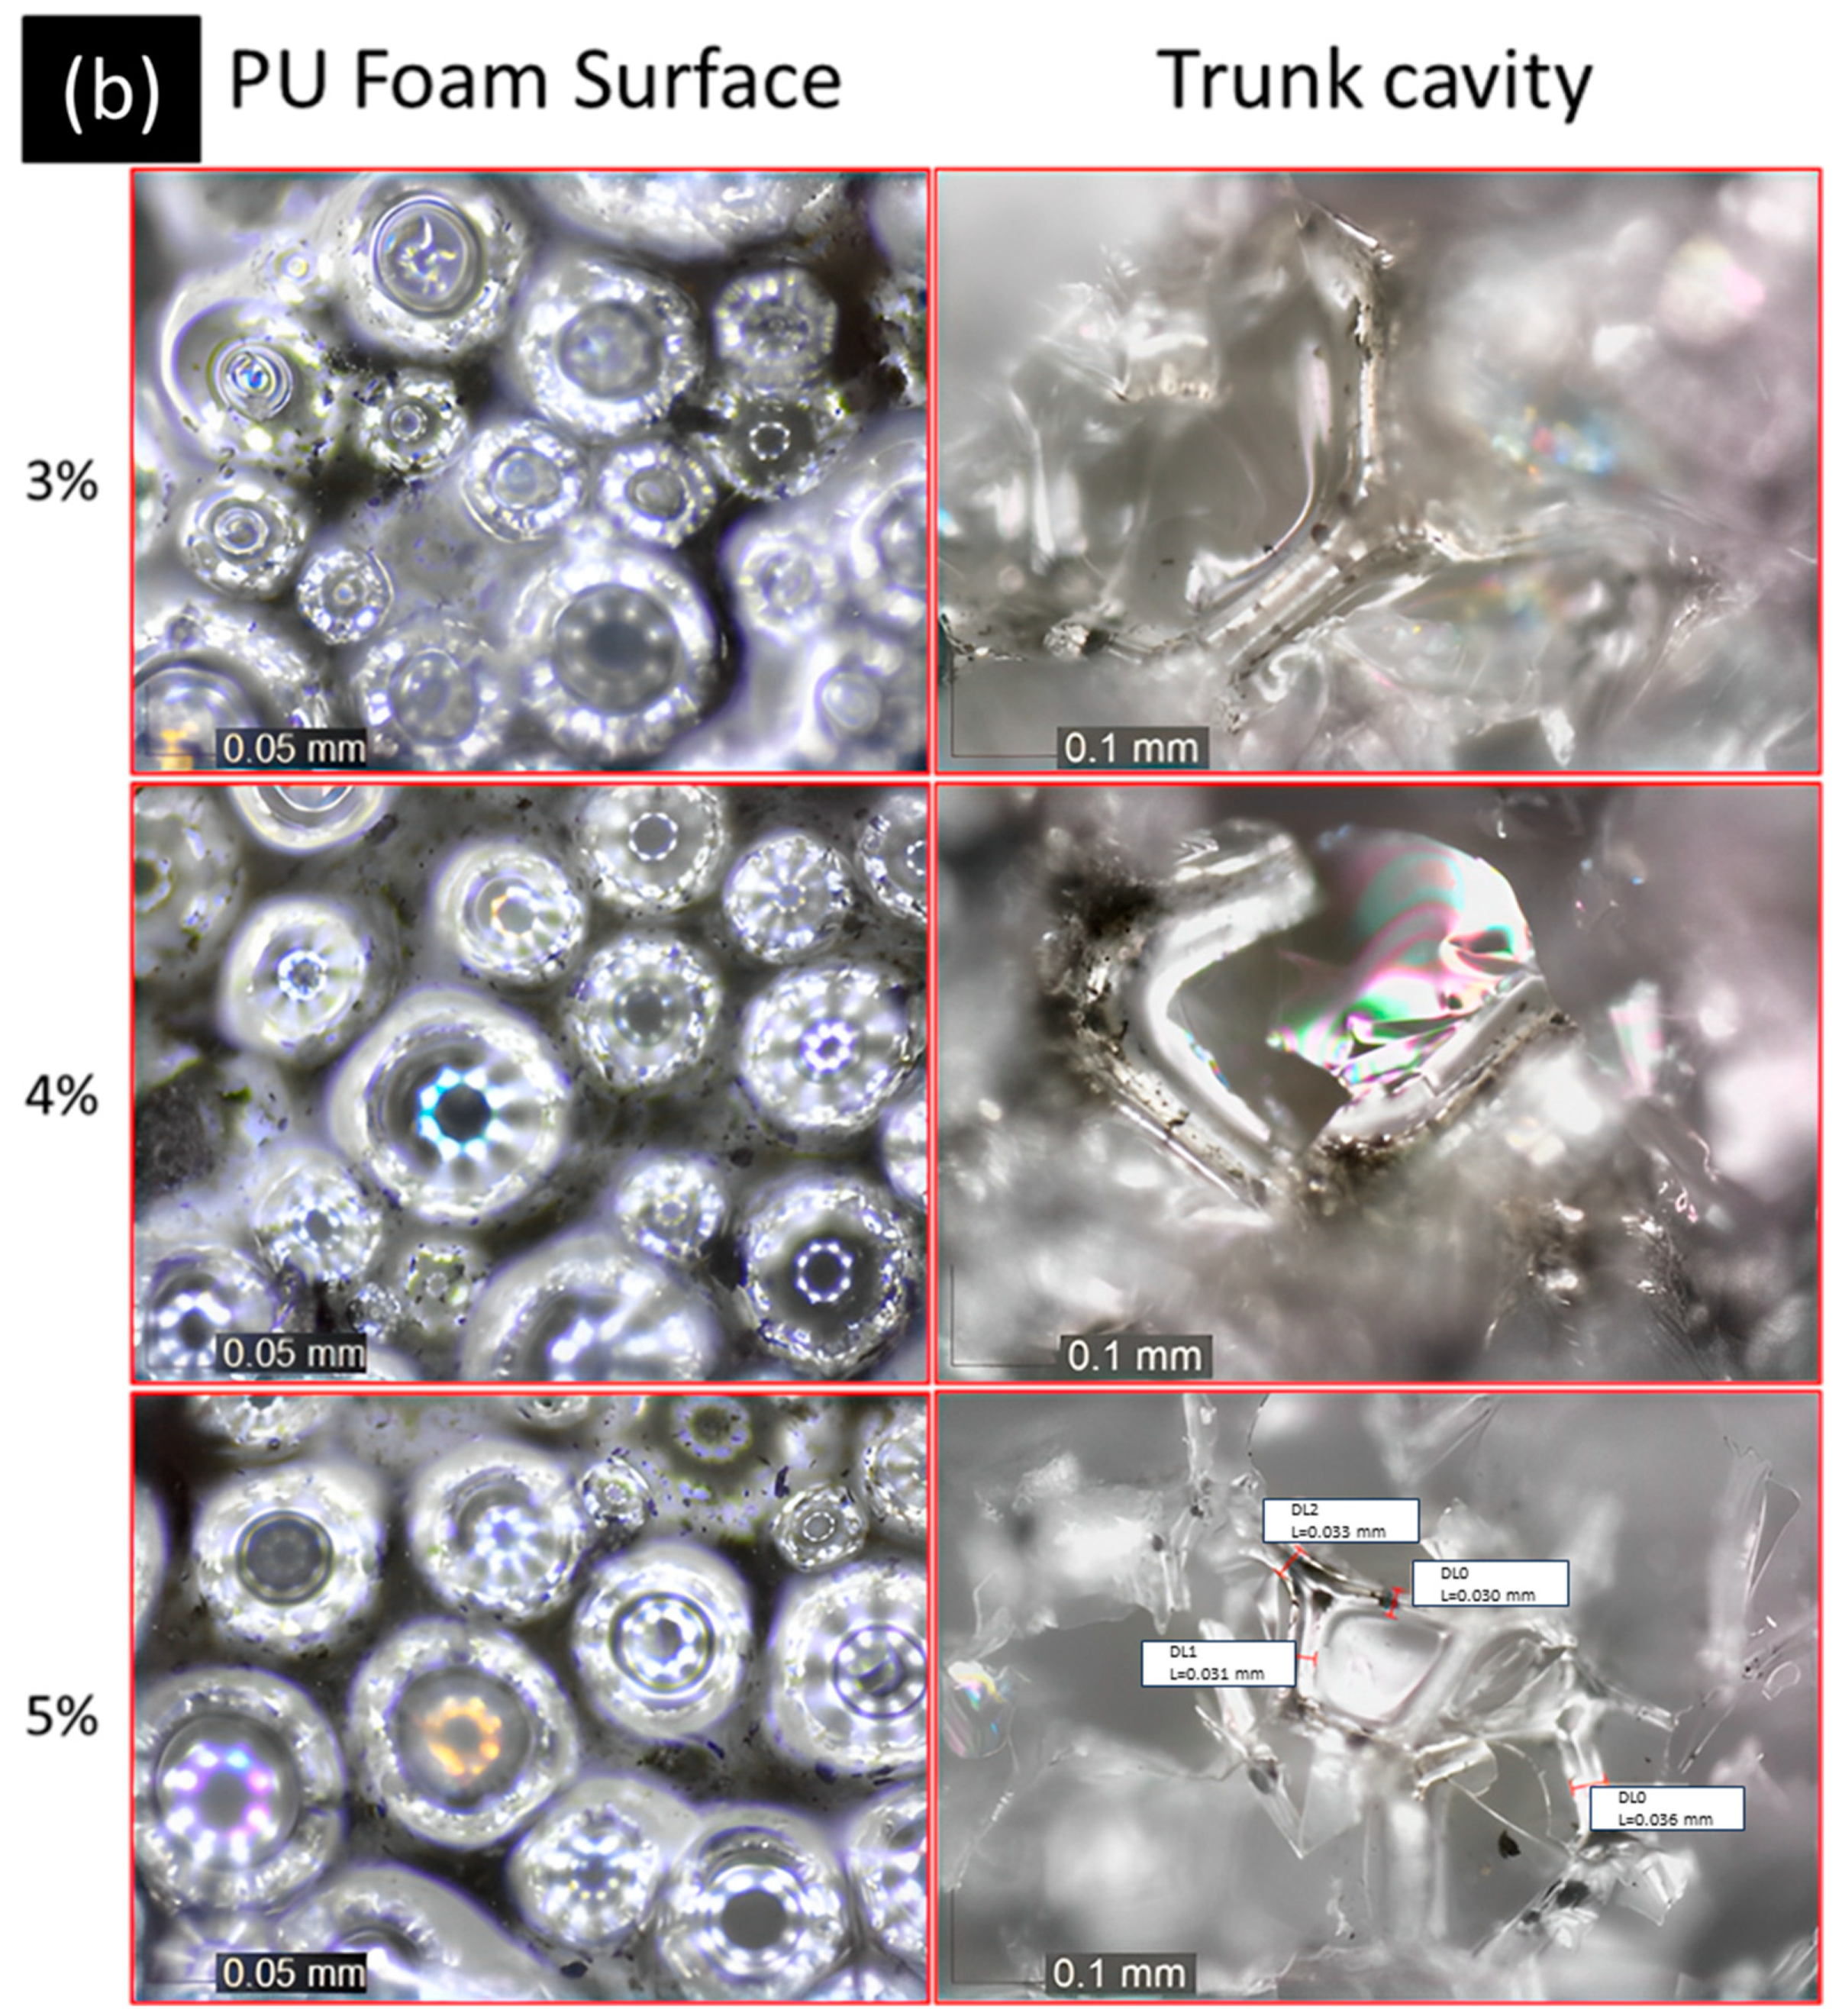
3.6. Structure Analysis

This observation is made to determine whether the provision of graphite filler affects the size of the rod cavity contained in PU foam solid, then see the surface formed from the difference in the PU foam manufacturing process. When viewed from Figure 8 points a and b in the PU foam surface observation section, it can be seen that the provision of graphite still does not affect the size of the voids formed at the provision of 0–1% graphite, but changes in the size of the voids have begun to form in 2–5% graphite mixing. If observed at 2% mixing, many variations of voids are formed, and the size has become inconsistent. Graphite mixing also affects the size of the cavity rod in the PU foam structure. Pure PU foam has a cavity rod size ranging from 0.054 to 0.051 mm. This size decreases as the graphite filler increases until the PU foam specimen in the 5% mixture; the average cavity rod size ranges from 0.036 to 0.030 mm. The size of this cavity rod affects the strength of the material. The provision of graphite can increase the material’s ability in terms of mechanics but in an optimal portion.

4. Discussion

The difference in ratio between liquid A and liquid B caused different reactions of the PU foam mixture, resulting in different expansion and shrinkage after the designated time. These differences in expansion lead to variations in the density structure of each specimen. Several cases showed that the growth foam that occurred at room temperature (25 °C) affected the shrinkage of the specimens. Among all the ratios, the ratio dominated by mixture A, which is isocyanate, does not experience shrinkage. The density that occurs and is observed in compression tests shows that this ratio is superior in strength. The addition of graphite powder as a filler in the PU foam affects the size of the rods when observed using an optical microscope. In specimens that do not use a graphite filler, the size of the samples in the structure is larger. The provision of graphite as a filler for the foaming effect is influenced by the barrier effect phenomenon, which results from the size of the expansion that occurs and the size of the cavity rods formed from the PU foam manufacturing process [55,56]. This graphite acts as a medium to contain the expansion from the polyurethanation reaction. The more the graphite content is given, the greater the expansion that is restrained.
The size of the structure is proportional to the amount of load the specimen can withstand. The FTIR test shows a different graph (2347 wavelength) on the bond of the C=O=C carbon dioxide compound. Among all the combinations, 2% graphite specimens show differences and indicate strong bonding. It can produce peak graphs due to the compounds’ higher energy absorption intensity. These findings are strengthened by the compression results, indicating that the data are valid. The application of PU and its fillers are prospected and can be used in different applications such as buildings, structures, vehicles, batteries, lightweight systems, and other applications that apply gap-filling techniques [16,57,58,59,60,61]. However, application of polyurethane is very wide. This paper aims to suggest the use of polyurethane in a lightweight structure such as in automotive and aerospace fields due to the necessity of lightweight structures. By using the optimal portion and ratio, an increase in its mechanical properties can be slightly significant.

5. Conclusions

The hybrid polyurethane–graphite micro powder as a filler material was successfully manufactured, characterized, and evaluated in the present study. There are conclusions drawn from the collected data, which can be summarized as follows:
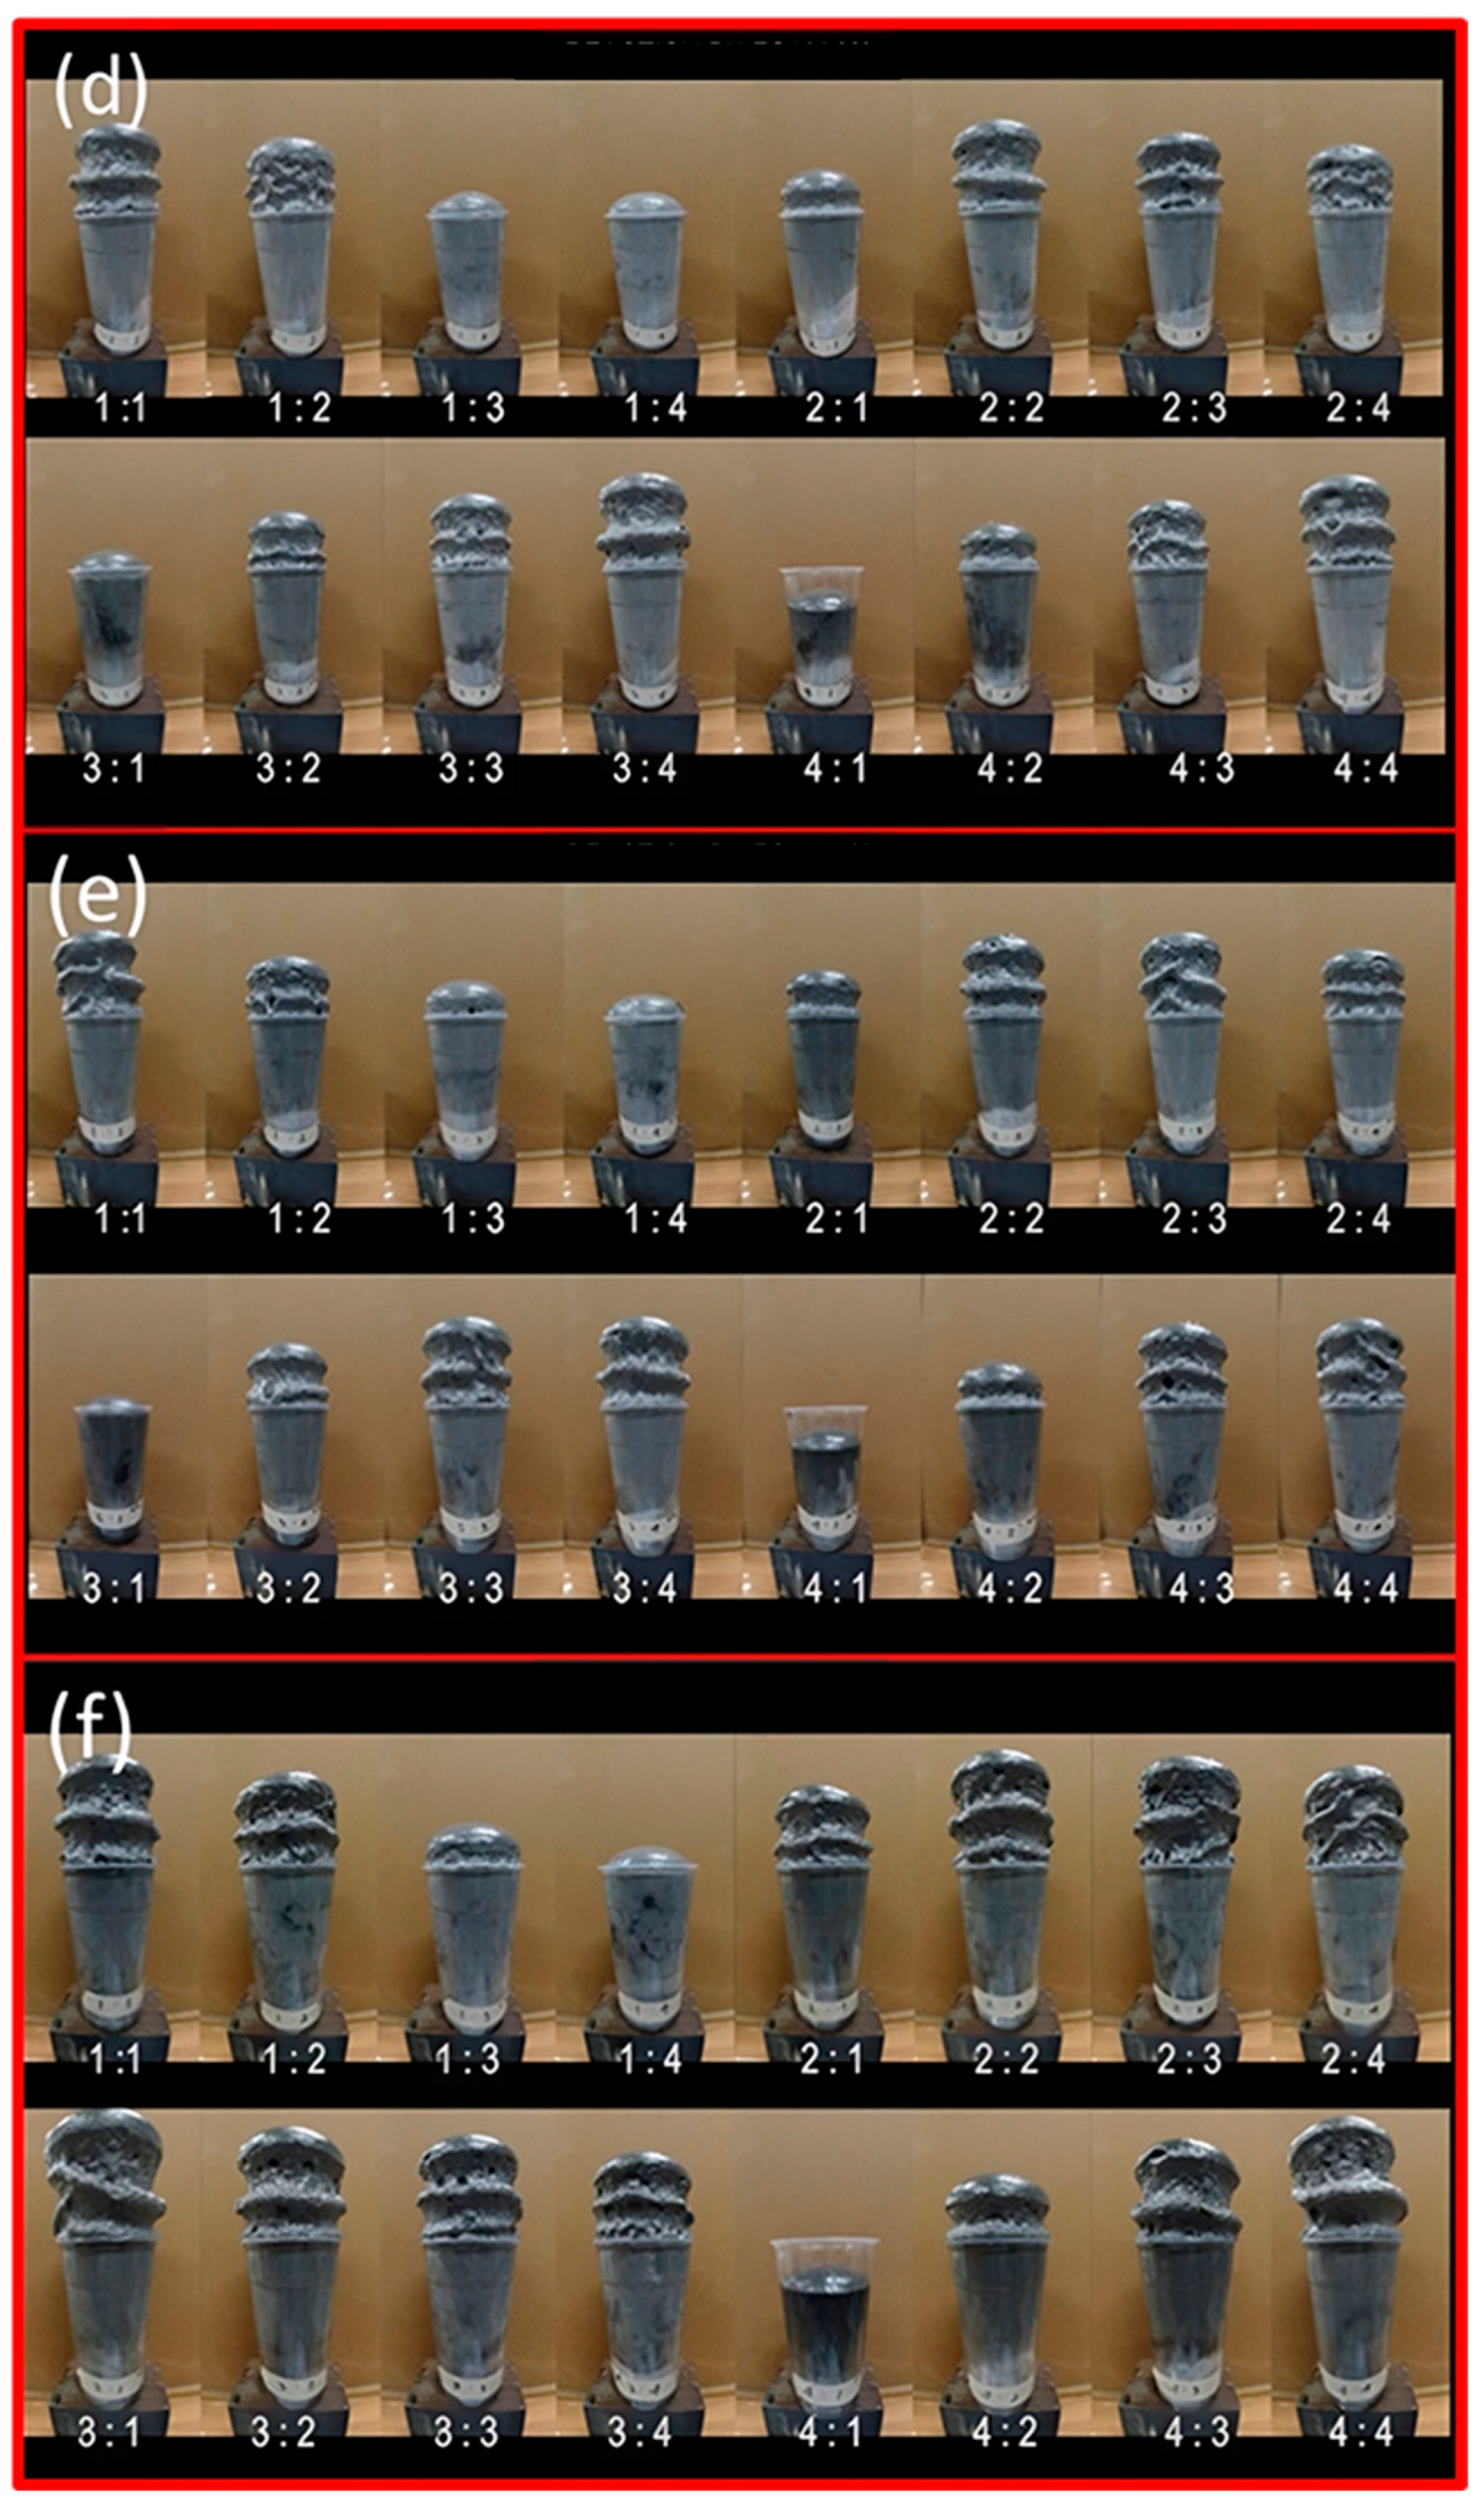
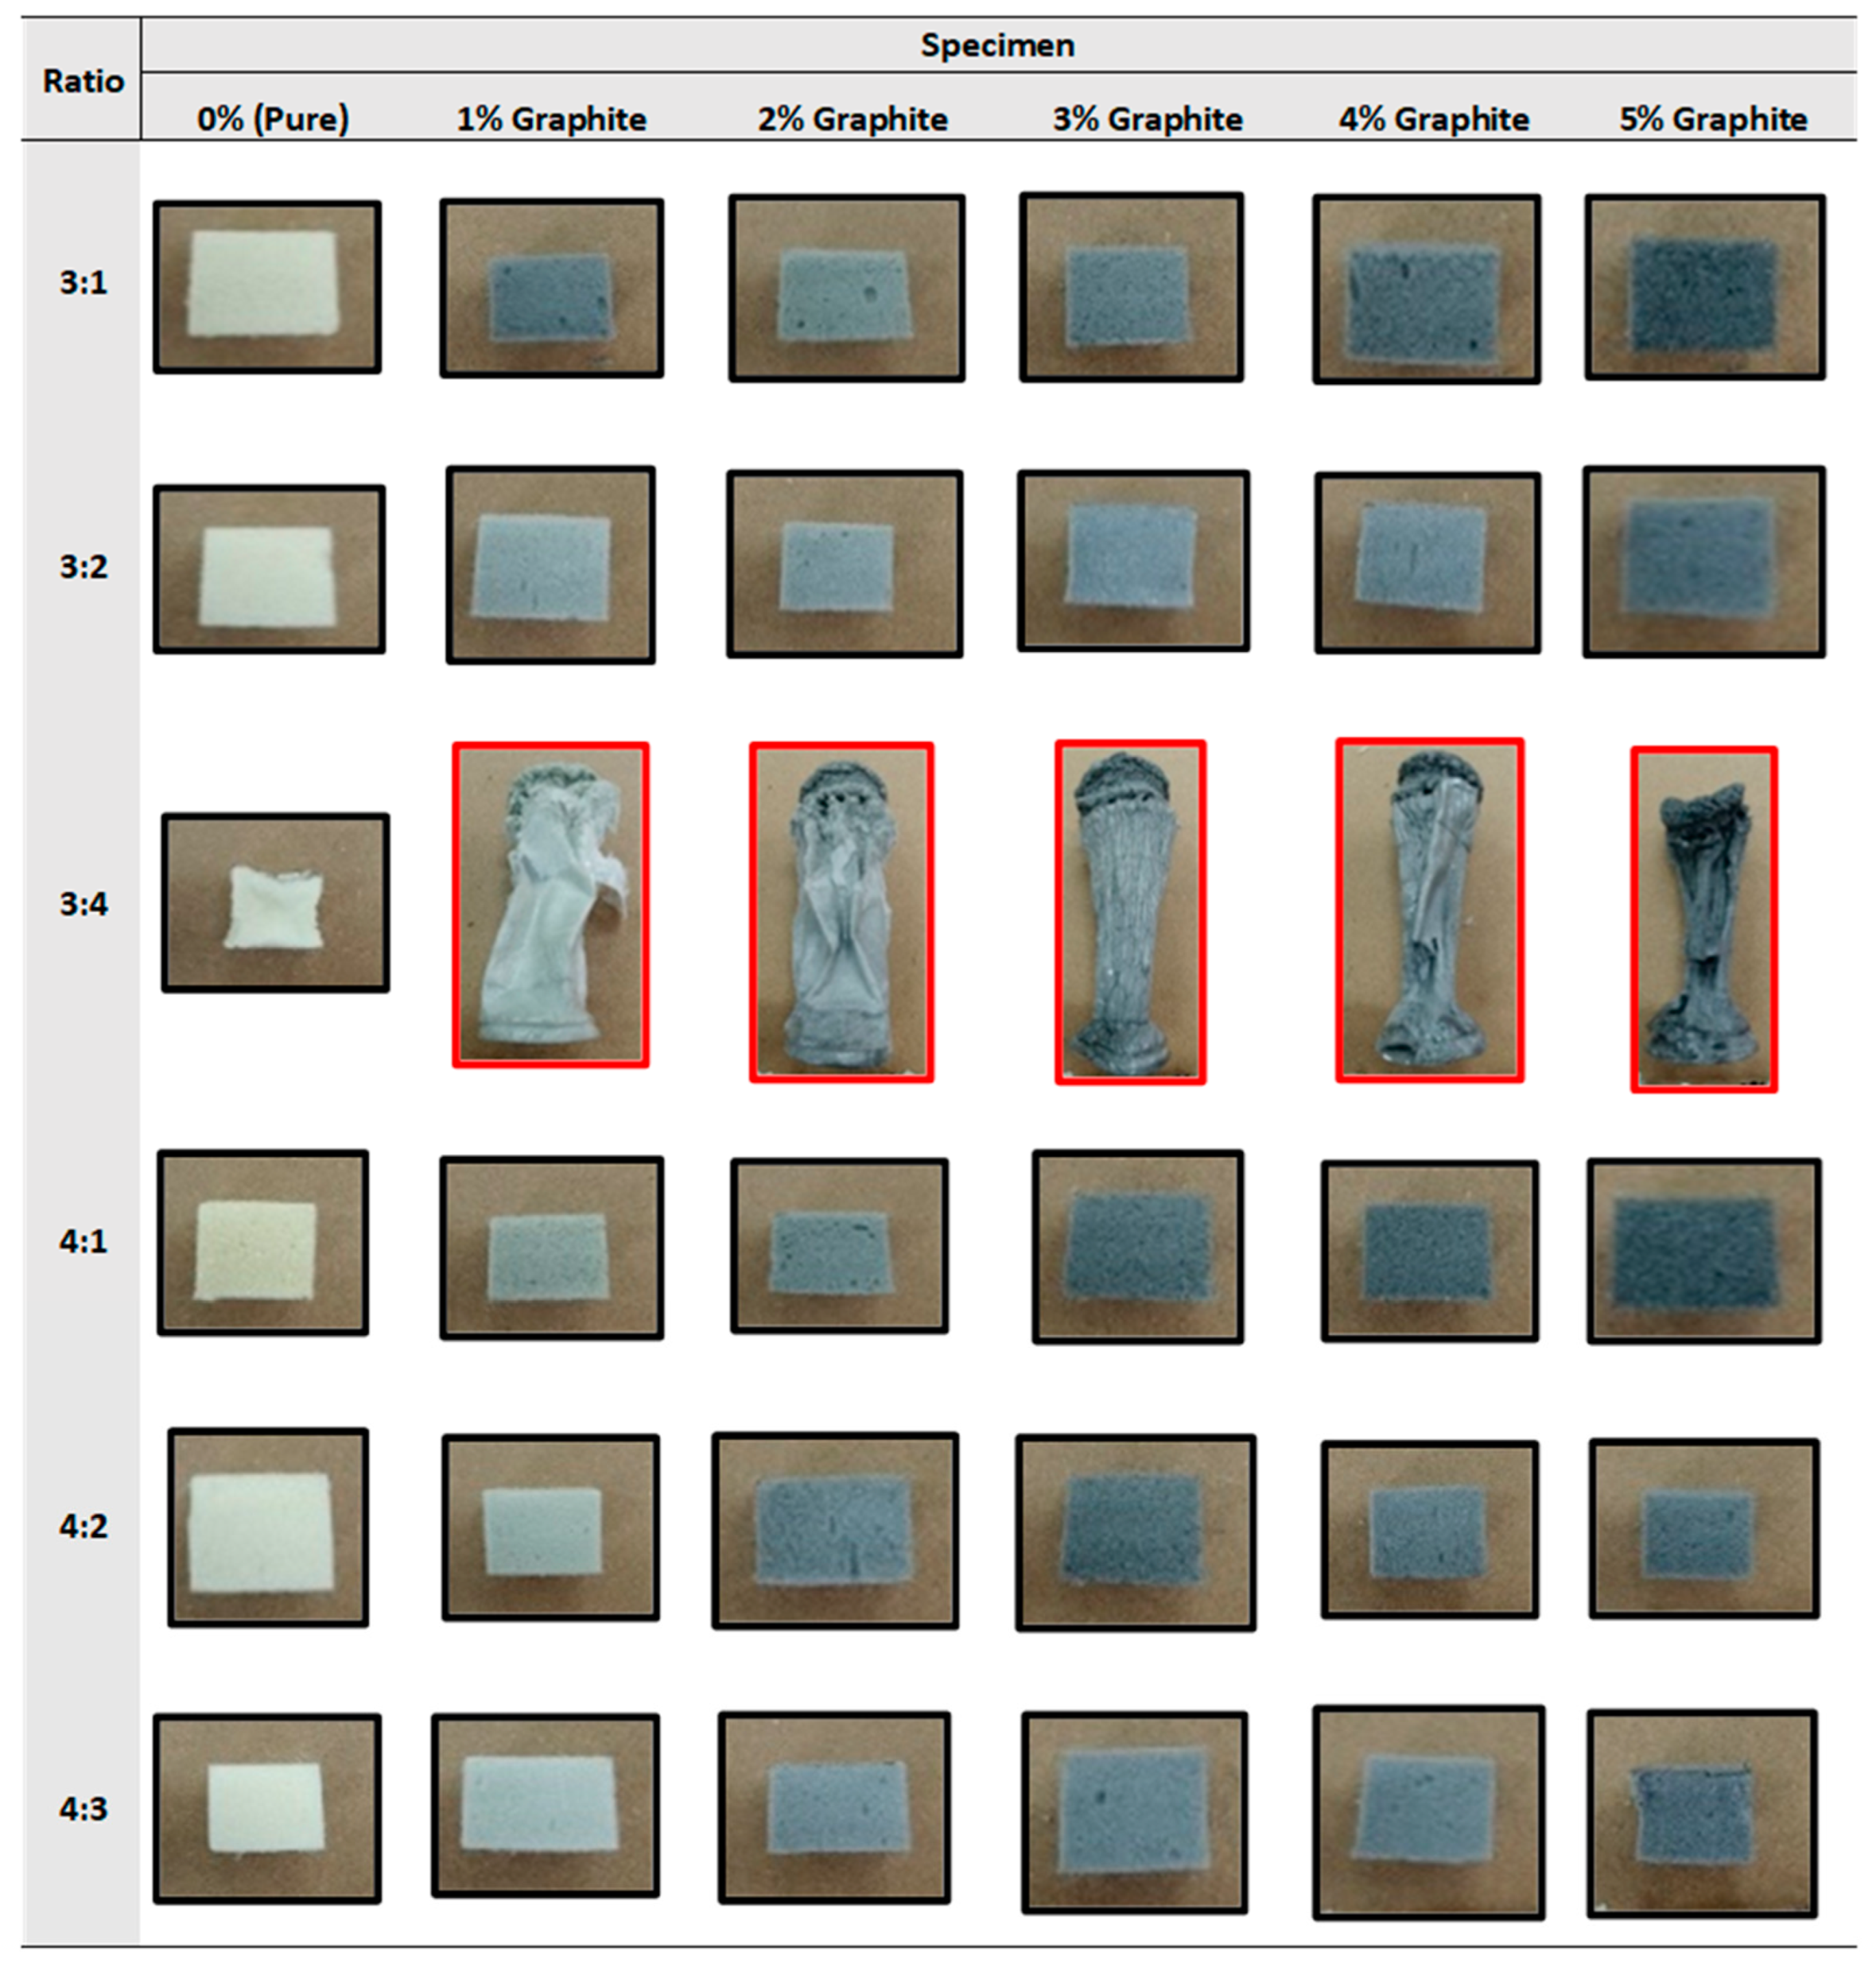
  • The shrinkage in PU foam material was dominated by polyol liquid. Although hardening did occur, the shape and volume of the material changed after the 24 h resting period. On the other hand, PU foam material dominated by isocyanate experiences good hardening and does not experience significant shrinkage. This is because the mixing reaction is balanced at this ratio.
  • The best ability of the material to withstand compressive loads is found in PU foam with a mixture ratio of 4:1. It proved that the more dominant isocyanate content has an important effect on the durability of PU foam material.
  • Reactions during the PU foam manufacturing process result in various expansions and contractions. Reactions with larger values have relatively lower densities and vice versa. As shown in the 4:1 ratio, it has the least expansion reaction but with a higher density.
  • Graphite as the most optimal filler is at a ratio of 2%, seen from all mechanical test results, which show the highest results at this ratio. It benefits from a density value lower than the ratio of 3:1 in density testing by mixing 2% graphite, which has a higher density.
  • The provision of graphite as reinforcement in the PU foam manufacturing process affects the size and formation of voids contained in PU foam; the size of the rod varies with the reduction or increase of graphite filler. The size of the rod affects the density of the material and the durability of the material.
  • The manufacture of materials with a lower weight but good material resistance is an advantage of using lightweight materials. PU foam can be used for this material as a lightweight, cheap, efficient, and environmentally friendly structure.

Supplementary Materials

The following supporting information can be downloaded at: https://www.mdpi.com/article/10.3390/jcs7100433/s1, Video S1: Video real growth of the specimen related to Figure 2.

Author Contributions

A.D.N. (Alvin Dio Nugroho): Investigation, Writing—original draft, Writing—review & editing, Conceptualization, Methodology, Data curation. D.A.: Writing—review & editing. H.: Supervision, Writing—review & editing. J.: Writing—review & editing. S.T.: Writing—review & editing. A.D.N. (Ariyana Dwiputra Nugraha): Writing—review & editing. A.K.: Writing—review & editing. B.P.: Writing—review & editing. M.A.M.: Supervision, Conceptualization, Methodology, Writing—original draft, Writing—review & editing, Project administration, Funding acquisition. All authors have read and agreed to the published version of the manuscript.

Funding

The umbrella project was applied in the present work. The present study was supported by Hibah RIIM (2022–2023) with the No. 82/II/7/HK/2022 for the source material. Sundar received Hibah Postdoctoral UGM 2023 with No: 3662/UN1.P.II/Dit-Lit/PT.01.03/2023 for the program and stay period at Gadjah Mada University 2023.

Data Availability Statement

Data will be shared upon request to the author.

Acknowledgments

The authors want to thank the anonymous reviewers who gave constructive suggestions to the present paper.

Conflicts of Interest

The authors declare no conflict of interest.

Appendix A

Figure A1. Detailed expansion of all specimens. (a) Reaction PU foam on 0% graphite filler, (b) Reaction PU foam on 1% graphite filler, (c) Reaction PU foam on 2% graphite filler, (d) Reaction PU foam on 3% graphite filler, (e) Reaction PU foam on 4% graphite filler, (f) Reaction PU foam on 5% graphite filler.
Jcs 07 00433 g0a1aJcs 07 00433 g0a1b
Figure A2. Detailed shrinkage of all specimens.
Jcs 07 00433 g0a2aJcs 07 00433 g0a2b
In Figure A2 is the making of PU foam specimens that have shrunk after curing for 24 h. Specimens marked in red do not experience complete hardening so that the level of hardness and elasticity properties is different from specimens marked in black. Moreover, after curing for 24 h and hardening that occurs almost all occur quite well. in the 3:4 ratio marked in red is a specimen that has shrunk.
Figure A3. Detailed compression tests of all samples. Detailed compression tests of all samples. (a) Pure PU foam, (b) 1% graphite filler PU foam, (c) 2% graphite filler PU foam, (d) 3% graphite filler PU foam, (e) 4% graphite filler PU foam, (f) 5% graphite filler PU foam.
Jcs 07 00433 g0a3
Figure A4. Detailed hardness tests of PU specimens. (a) 0% graphite filler Pure PU foam, (b) 1% graphite filler PU foam, (c) 2% graphite filler PU foam, (d) 3% graphite filler PU foam, (e) 4% graphite filler PU foam, (f) 5% graphite filler PU foam.
Jcs 07 00433 g0a4
Figure A5. Detailed density tests of PU specimens. (a) 0% graphite filler Pure PU foam, (b) 1% graphite filler PU foam, (c) 2% graphite filler PU foam, (d) 3% graphite filler PU foam, (e) 4% graphite filler PU foam, (f) 5% graphite filler PU foam.
Jcs 07 00433 g0a5

References

  1. Liu, W.; Peng, T.; Kishita, Y.; Umeda, Y.; Tang, R.; Tang, W.; Hu, L. Critical life cycle inventory for aluminum die casting: A lightweight-vehicle manufacturing enabling technology. Appl. Energy 2021, 304, 117814. [Google Scholar] [CrossRef]
  2. Panthapulakkal, S.; Raghunanan, L.; Sain, M.; Kc, B.; Tjong, J. Natural Fiber and Hybrid Fiber Thermoplastic Composites: Advancements in Lightweighting Applications; Woodhead Publishing: Sawston, UK, 2017; ISBN 9780081008003. [Google Scholar]
  3. Andrei, G.; Dima, D.; Andrei, L. Lightweight Magnetic Composites for Aircraft Applications. J. Optoelectron. Adv. Mater. 2006, 8, 726–730. [Google Scholar]
  4. Mallick, P.K. Materials, Design and Manufacturing for Lightweight Vehicles; Woodhead Publishing: Sawston, UK, 2020. [Google Scholar]
  5. Muflikhun, M.A.; Yokozeki, T.; Aoki, T. The strain performance of thin CFRP-SPCC hybrid laminates for automobile structures. Compos. Struct. 2019, 220, 11–18. [Google Scholar] [CrossRef]
  6. Nugraha, A.D.; Nuryanta, M.I.; Sean, L.; Budiman, K.; Kusni, M.; Muflikhun, M.A. Recent Progress on Natural Fibers Mixed with CFRP and GFRP: Properties, Characteristics, and Failure Behaviour. Polymers 2022, 14, 5138. [Google Scholar] [CrossRef]
  7. Muflikhun, M.A.; Yokozeki, T. Systematic analysis of fractured specimens of composite laminates: Different perspectives between tensile, flexural, Mode I, and Mode II test. Int. J. Light. Mater. Manuf. 2023, 6, 329–343. [Google Scholar] [CrossRef]
  8. Zhang, L.; Zhang, M.; Zhou, Y.; Hu, L. The study of mechanical behavior and flame retardancy of castor oil phosphate-based rigid polyurethane foam composites containing expanded graphite and triethyl phosphate. Polym. Degrad. Stab. 2013, 98, 2784–2794. [Google Scholar] [CrossRef]
  9. Sengupta, R.; Bhattacharya, M.; Bandyopadhyay, S.; Bhowmick, A.K. A review on the mechanical and electrical properties of graphite and modified graphite reinforced polymer composites. Prog. Polym. Sci. 2011, 36, 638–670. [Google Scholar] [CrossRef]
  10. Chen, D.; Yang, J.; Chen, G. The physical properties of polyurethane/graphite nanosheets/carbon black foaming conducting nanocomposites. Compos. Part A Appl. Sci. Manuf. 2010, 41, 1636–1638. [Google Scholar] [CrossRef]
  11. Gama, N.; Costa, L.C.; Amaral, V.; Ferreira, A.; Barros-Timmons, A. Insights into the physical properties of biobased polyurethane/expanded graphite composite foams. Compos. Sci. Technol. 2016, 138, 24–31. [Google Scholar] [CrossRef]
  12. Gayathri, R.; Vasanthakumari, R.; Padmanabhan, C. Sound Absorption, Thermal and Mechanical Behavior of Polyurethane Foam Modified With Nano Silica, Nano Clay and Crumb Rubber Fillers. Int. J. Sci. Eng. Res. 2013, 4, 301–308. [Google Scholar]
  13. Saint-Michel, F.; Chazeau, L.; Cavaillé, J.-Y. Mechanical properties of high density polyurethane foams: II Effect of the filler size. Compos. Sci. Technol. 2006, 66, 2709–2718. [Google Scholar] [CrossRef]
  14. Cheng, J.-J.; Shi, B.-B.; Zhou, F.-B.; Chen, X.-Y. Effects of inorganic fillers on the flame-retardant and mechanical properties of rigid polyurethane foams. J. Appl. Polym. Sci. 2013, 131, 40253. [Google Scholar] [CrossRef]
  15. Modesti, M.; Lorenzetti, A.; Simioni, F.; Camino, G. Expandable graphite as an intumescent flame retardant in polyisocyanurate–polyurethane foams. Polym. Degrad. Stab. 2002, 77, 195–202. [Google Scholar] [CrossRef]
  16. Khalifa, M.; Anandhan, S.; Wuzella, G.; Lammer, H.; Mahendran, A.R. Thermoplastic polyurethane composites reinforced with renewable and sustainable fillers—A review. Polym. Technol. Mater. 2020, 59, 1751–1769. [Google Scholar] [CrossRef]
  17. Holdich, R. Fundamentals of Particle Technology; Midland Information Technology and Publishing: Leicestershire, UK, 2020. [Google Scholar]
  18. Hazell, P.J. Armour: Materials, Theory, and Design; CRC Press: Boca Raton, FL, USA, 2015. [Google Scholar]
  19. Simon, G.P. Polymer Blends and Alloys; Routledge: New York, NY, USA, 2019. [Google Scholar]
  20. Pang, X.; Xin, Y.; Shi, X.; Xu, J. Effect of different size-modified expandable graphite and ammonium polyphosphate on the flame retardancy, thermal stability, physical, and mechanical properties of rigid polyurethane foam. Polym. Eng. Sci. 2019, 59, 1381–1394. [Google Scholar] [CrossRef]
  21. Kausar, A. Polyurethane Composite Foams in High-Performance Applications: A Review. Polym. Technol. Eng. 2017, 57, 346–369. [Google Scholar] [CrossRef]
  22. Ciecierska, E.; Jurczyk-Kowalska, M.; Bazarnik, P.; Gloc, M.; Kulesza, M.; Kowalski, M.; Krauze, S.; Lewandowska, M. Flammability, mechanical properties and structure of rigid polyurethane foams with different types of carbon reinforcing materials. Compos. Struct. 2016, 140, 67–76. [Google Scholar] [CrossRef]
  23. Kim, J.-H.; Lee, H.-I.; Lee, Y.-S. The enhanced thermal and mechanical properties of graphite foams with a higher crystallinity and apparent density. Mater. Sci. Eng. A 2017, 696, 174–181. [Google Scholar] [CrossRef]
  24. Thirumal, M.; Khastgir, D.; Singha, N.K.; Manjunath, B.S.; Naik, Y.P. Effect of expandable graphite on the properties of intumescent flame-retardant polyurethane foam. J. Appl. Polym. Sci. 2008, 110, 2586–2594. [Google Scholar] [CrossRef]
  25. Callister Jr, W.D.; Rethwisch, D.G. Callister’s Materials Science and Engineering; John Wiley & Sons: Hoboken, NJ, USA, 2020. [Google Scholar]
  26. Nugraha, A.D.; Syahril, M.; Muflikhun, M.A. Excellent performance of hybrid model manufactured via additive manufacturing process reinforced with GFRP for sport climbing equipment. Heliyon 2023, 9, e14706. [Google Scholar] [CrossRef] [PubMed]
  27. Nugraha, A.D.; Ruli; Supriyanto, E.; Rasgianti; Prawara, B.; Martides, E.; Junianto, E.; Wibowo, A.; Sentanuhady, J.; Muflikhun, M.A. First-rate manufacturing process of primary air fan (PAF) coal power plant in Indonesia using laser powder bed fusion (LPBF) technology. J. Mater. Res. Technol. 2022, 18, 4075–4088. [Google Scholar] [CrossRef]
  28. Crawford, R.J.; Martin, P. Plastics Engineering; Butterworth-Heinemann: Oxford, UK, 2020. [Google Scholar]
  29. Farag, M.M. Materials and Process Selection for Engineering Design; CRC Press: Boca Raton, FL, USA, 2020. [Google Scholar]
  30. Li, M.; Du, M.; Wang, F.; Xue, B.; Zhang, C.; Fang, H. Study on the mechanical properties of polyurethane (PU) grouting material of different geometric sizes under uniaxial compression. Constr. Build. Mater. 2020, 259, 119797. [Google Scholar] [CrossRef]
  31. Park, K.-B.; Kim, H.-T.; Her, N.-Y.; Lee, J.-M. Variation of Mechanical Characteristics of Polyurethane Foam: Effect of Test Method. Materials 2019, 12, 2672. [Google Scholar] [CrossRef] [PubMed]
  32. Reghunadhan, A.; Thomas, S. Chapter 1-Polyurethanes: Structure, Properties, Synthesis, Characterization, and Applications. In Polyurethane Polymers; Thomas, S., Datta, J., Haponiuk, J.T., Reghunadhan, A., Eds.; Elsevier: Amsterdam, The Netherlands, 2017; pp. 1–16. [Google Scholar]
  33. Ye, L.; Meng, X.-Y.; Ji, X.; Li, Z.-M.; Tang, J.-H. Synthesis and characterization of expandable graphite–poly(methyl methacrylate) composite particles and their application to flame retardation of rigid polyurethane foams. Polym. Degrad. Stab. 2009, 94, 971–979. [Google Scholar] [CrossRef]
  34. Acuña, P.; Santiago-Calvo, M.; Villafañe, F.; Rodríguez-Perez, M.A.; Rosas, J.; Wang, D. Impact of expandable graphite on flame retardancy and mechanical properties of rigid polyurethane foam. Polym. Compos. 2018, 40, E1705–E1715. [Google Scholar] [CrossRef]
  35. Wolska, A.; Goździkiewicz, M.; Ryszkowska, J. Influence of graphite and wood-based fillers on the flammability of flexible polyurethane foams. J. Mater. Sci. 2012, 47, 5693–5700. [Google Scholar] [CrossRef]
  36. Panthapulakkal, S.; Raghunanan, L.; Sain, M.; Kc, B.; Tjong, J. Natural fiber and hybrid fiber thermoplastic composites. In Green Composites; Woodhead Publishing: Sawston, UK, 2017; pp. 39–72. [Google Scholar] [CrossRef]
  37. Li, Z.; Zhu, X.; Zhang, X.; Guo, S. Isotropic porous graphite foam/epoxy composites with outstanding heat dissipation and excellent electromagnetic interference shielding performances. Chem. Eng. J. 2023, 452, 139665. [Google Scholar] [CrossRef]
  38. Kim, J.H.; Jeong, E.; Lee, Y.S. Preparation and Characterization of Graphite Foams. J. Ind. Eng. Chemistry. 2015, 32, 21–33. [Google Scholar] [CrossRef]
  39. Romero, P.E.; Arribas-Barrios, J.; Rodriguez-Alabanda, O.; González-Merino, R.; Guerrero-Vaca, G. Manufacture of polyurethane foam parts for automotive industry using FDM 3D printed molds. CIRP J. Manuf. Sci. Technol. 2021, 32, 396–404. [Google Scholar] [CrossRef]
  40. Husainie, S.M.; Deng, X.; Abu Ghalia, M.; Robinson, J.; Naguib, H.E. Natural fillers as reinforcement for closed-molded polyurethane foam plaques: Mechanical, morphological, and thermal properties. Mater. Today Commun. 2021, 27, 102187. [Google Scholar] [CrossRef]
  41. Choe, H.; Lee, J.H.; Kim, J.H. Polyurethane composite foams including CaCO3 fillers for enhanced sound absorption and compression properties. Compos. Sci. Technol. 2020, 194, 108153. [Google Scholar] [CrossRef]
  42. Głowacz-Czerwonka, D.; Zakrzewska, P.; Oleksy, M.; Pielichowska, K.; Kuźnia, M.; Telejko, T. The influence of biowaste-based fillers on the mechanical and fire properties of rigid polyurethane foams. Sustain. Mater. Technol. 2023, 36, e00610. [Google Scholar] [CrossRef]
  43. Qu, Y.; Zhang, X.; Fu, Q.; Chen, X.; Deng, H. Fabrication of high-performance moisture-electric generators via synergistic effect between CNTs and TiO2 on porous PU structure. Compos. Sci. Technol. 2023, 241, 110105. [Google Scholar] [CrossRef]
  44. Xiao, T.; Yang, X.; Hooman, K.; Jin, L.; Yang, C.; Lu, T.J. Conductivity and permeability of graphite foams: Analytical modelling and pore-scale simulation. Int. J. Therm. Sci. 2022, 179, 107706. [Google Scholar] [CrossRef]
  45. Kumar, S.V.; Subramanian, J.; Giridharan, A.; Gupta, M.; Adhikari, A.; Gayen, M. Processing and characterization of organic PU foam reinforced with nano particles. Mater. Today Proc. 2021, 46, 1077–1084. [Google Scholar] [CrossRef]
  46. Kim, H.-G.; Kim, J.; Lee, H.-Y.; Yoon, J. Shear strength distribution of district heating pipe under accelerated aging condition with respect to PU foam density. Polym. Test. 2022, 110, 107567. [Google Scholar] [CrossRef]
  47. Lacki, P.; Derlatka, A.; Winowiecka, J. Analysis of the composite I-beam reinforced with PU foam with the addition of chopped glass fiber. Compos. Struct. 2019, 218, 60–70. [Google Scholar] [CrossRef]
  48. Seah, M.Q.; Ng, Z.C.; Lau, W.J.; Gürsoy, M.; Karaman, M.; Wong, T.-W.; Ismail, A.F. Development of surface modified PU foam with improved oil absorption and reusability via an environmentally friendly and rapid pathway. J. Environ. Chem. Eng. 2021, 10, 106817. [Google Scholar] [CrossRef]
  49. Wang, J.; Wang, H.; Geng, G. Flame-retardant superhydrophobic coating derived from fly ash on polymeric foam for efficient oil/corrosive water and emulsion separation. J. Colloid Interface Sci. 2018, 525, 11–20. [Google Scholar] [CrossRef]
  50. ASTM D1621; Standard Test Method for Compressive Properties of Rigid Cellular Plastics. ASTM: West Conshohocken, PA, USA, 2000.
  51. Shih, Y.-F.; Lin, S.-H.; Xu, J.; Su, C.-J.; Huang, C.-F.; Hsu, S.-H. Stretchable and biodegradable chitosan-polyurethane-cellulose nanofiber composites as anisotropic materials. Int. J. Biol. Macromol. 2023, 230, 123116. [Google Scholar] [CrossRef]
  52. Bhinder, J.; Agnihotri, P.K. Synthesis and characterization of poly-urethane foam doped with different nano-fillers. Mater. Today: Proc. 2019, 18, 1479–1488. [Google Scholar] [CrossRef]
  53. Zhang, J.; Hori, N.; Takemura, A. Influence of NCO/OH ratio on preparation of four agricultural wastes liquefied polyols based polyurethane foams. Polym. Degrad. Stab. 2020, 179, 109256. [Google Scholar] [CrossRef]
  54. Minnath, M.A.; Purushothaman, E. Blends and Interpenetrating Polymer Networks Based on Polyurethane Polymers With Natural and Synthetic Rubbers. Polyurethane Polym. 2017, 17–44. [Google Scholar] [CrossRef]
  55. Li, Y.; Zou, J.; Zhou, S.; Chen, Y.; Zou, H.; Liang, M.; Luo, W. Effect of expandable graphite particle size on the flame retardant, mechanical, and thermal properties of water-blown semi-rigid polyurethane foam. J. Appl. Polym. Sci. 2013, 131, 39885. [Google Scholar] [CrossRef]
  56. Qian, L.; Feng, F.; Tang, S. Bi-phase flame-retardant effect of hexa-phenoxy-cyclotriphosphazene on rigid polyurethane foams containing expandable graphite. Polymer 2013, 55, 95–101. [Google Scholar] [CrossRef]
  57. Wang, X.; Liu, Z.; Tang, Y.; Chen, J.; Mao, Z.; Wang, D. PVDF-HFP/PMMA/TPU-based gel polymer electrolytes composed of conductive Na3Zr2Si2PO12 filler for application in sodium ions batteries. Solid State Ionics 2020, 359, 115532. [Google Scholar] [CrossRef]
  58. Zhang, X.; Wu, W.; Hu, H.; Rui, Z.; Du, X.; Zhao, T.; Li, J. Multi-dimensional fillers synergistically enhanced thermal conductivity of TPU composites in selective laser sintering technology. Mater. Today Commun. 2022, 33, 104012. [Google Scholar] [CrossRef]
  59. Bashir, A.; Maqbool, M.; Lv, R.; Usman, A.; Aftab, W.; Niu, H.; Kang, L.; Bai, S.-L. Engineering of Interfacial Interactions Among BN And CNT Hybrid Towards Higher Heat Conduction Within TPU Composites. Compos. Part A Appl. Sci. Manuf. 2023, 167, 107428. [Google Scholar] [CrossRef]
  60. Zhu, P.; Weng, L.; Zhang, X.; Wang, X.; Guan, L.; Shi, J.; Liu, L. Enhanced dielectric performance of TPU composites filled with Graphene@poly(dopamine)-Ag core-shell nanoplatelets as fillers. Polym. Test. 2020, 90, 106671. [Google Scholar] [CrossRef]
  61. Fadlurrahman, Z.; Alandro, D.; Santos, G.N.C.; Muflikhun, M.A. Mechanical and chemical properties of matrix composite: Curing agent ratio, degassing process, and filler effect perspectives. J. Eng. Res. 2023. [Google Scholar] [CrossRef]
Figure 1. Mold printed in HIPS and polished via limonene immersion (1 min) used for the manufacture of car seat back: printed molds (before polishing (a); encased molds (95 × 65 × 40 mm3) (b); molds after polishing and casting and PUR foam part (c) (Ref [39]).
Jcs 07 00433 g001
Figure 2. PU foam mixing process, (a) PU A mixing process with graphite filler, which is then mixed with PU B for the reaction process until the final specimen, (b) specimen preparation, and (c)specimen testing.
Jcs 07 00433 g002
Figure 3. Manufacturing reaction of pure PU foam and PU foam with graphite reinforcement.
Jcs 07 00433 g003
Figure 4. Compression test of PU specimens at 4:1 ratio with different filler contents (1–5% graphite content).
Jcs 07 00433 g004
Figure 5. Hardness test of PU specimens with different filler contents (1–5% graphite filler) in ratio 4:1.
Jcs 07 00433 g005
Figure 6. Density of PU foam specimens with different filler contents.
Jcs 07 00433 g006
Figure 7. FTIR test on graphite-blended PU foam specimen.
Jcs 07 00433 g007
Figure 8. Observation of surface structure and cavity bar size of PU foam (a) 0% to 2%, and (b) 3% to 5%.
Jcs 07 00433 g008aJcs 07 00433 g008b
Table 1. PU foam material specifications.
Material (Polyurethane)TypeViscosityAppearance
Liquid A/Millenium MR-200Elastic polymer150–250Brown
Liquid B/Polyol (JKR-7631L)Reactor150–250Clear
Table 2. Micro-filler graphite powder.
Material PurityMeshMoistureAppearance
Graphite powder<98%200 microns0.5%Black
Table 3. Ratio of mixing.
RatioLiquid A
(Millionate MR-200)
Liquid B
(Polyol (JKR-7631L)
Total Weight (g)
1:150%50%40
1:233.30%66.70%40
1:325%75%40
1:420%80%40
2:166.70%33.33%40
2:340%60%40
2:433.30%66.70%40
3:175%25%40
3:260%40%40
3:442.90%57.10%40
4:180%20%40
4:266.70%33.30%40
4:357.10%42.90%40
Table 4. Reaction stages in PU foam [49].
Reaction StagesMaterialFormula
Polyurethane formationIsocyanate alcoholR–NCO + HO–R1
Gas production reaction (Step I)Amine Carbon dioxideR–NH2 + CO2↑+22 kcal/mole
Gas production reaction (Step II)Amine IsocyanateR-NH2 + R-NCO
Table 5. Shrinkage of PU foam reaction.
Re shrinkage of specimens after cutting Shrinking specimenFully hardened specimen
Pure PU foamJcs 07 00433 i001Jcs 07 00433 i002Jcs 07 00433 i003
PU foam with 1% graphite fillerJcs 07 00433 i004Jcs 07 00433 i005Jcs 07 00433 i006
PU foam with 2% graphite fillerJcs 07 00433 i007Jcs 07 00433 i008Jcs 07 00433 i009
PU foam with 3% graphite fillerJcs 07 00433 i010Jcs 07 00433 i011Jcs 07 00433 i012
PU foam with 4% graphite fillerJcs 07 00433 i013Jcs 07 00433 i014Jcs 07 00433 i015
PU foam with 5% graphite fillerJcs 07 00433 i016Jcs 07 00433 i017Jcs 07 00433 i018
Disclaimer/Publisher’s Note: The statements, opinions and data contained in all publications are solely those of the individual author(s) and contributor(s) and not of MDPI and/or the editor(s). MDPI and/or the editor(s) disclaim responsibility for any injury to people or property resulting from any ideas, methods, instructions or products referred to in the content.

