
Mechanical Properties of PLA Specimens Obtained by Additive Manufacturing Process Reinforced with Flax Fibers

Abstract
:1. Introduction
2. Materials and Methods
2.1. Design of Experiments
2.2. Materials
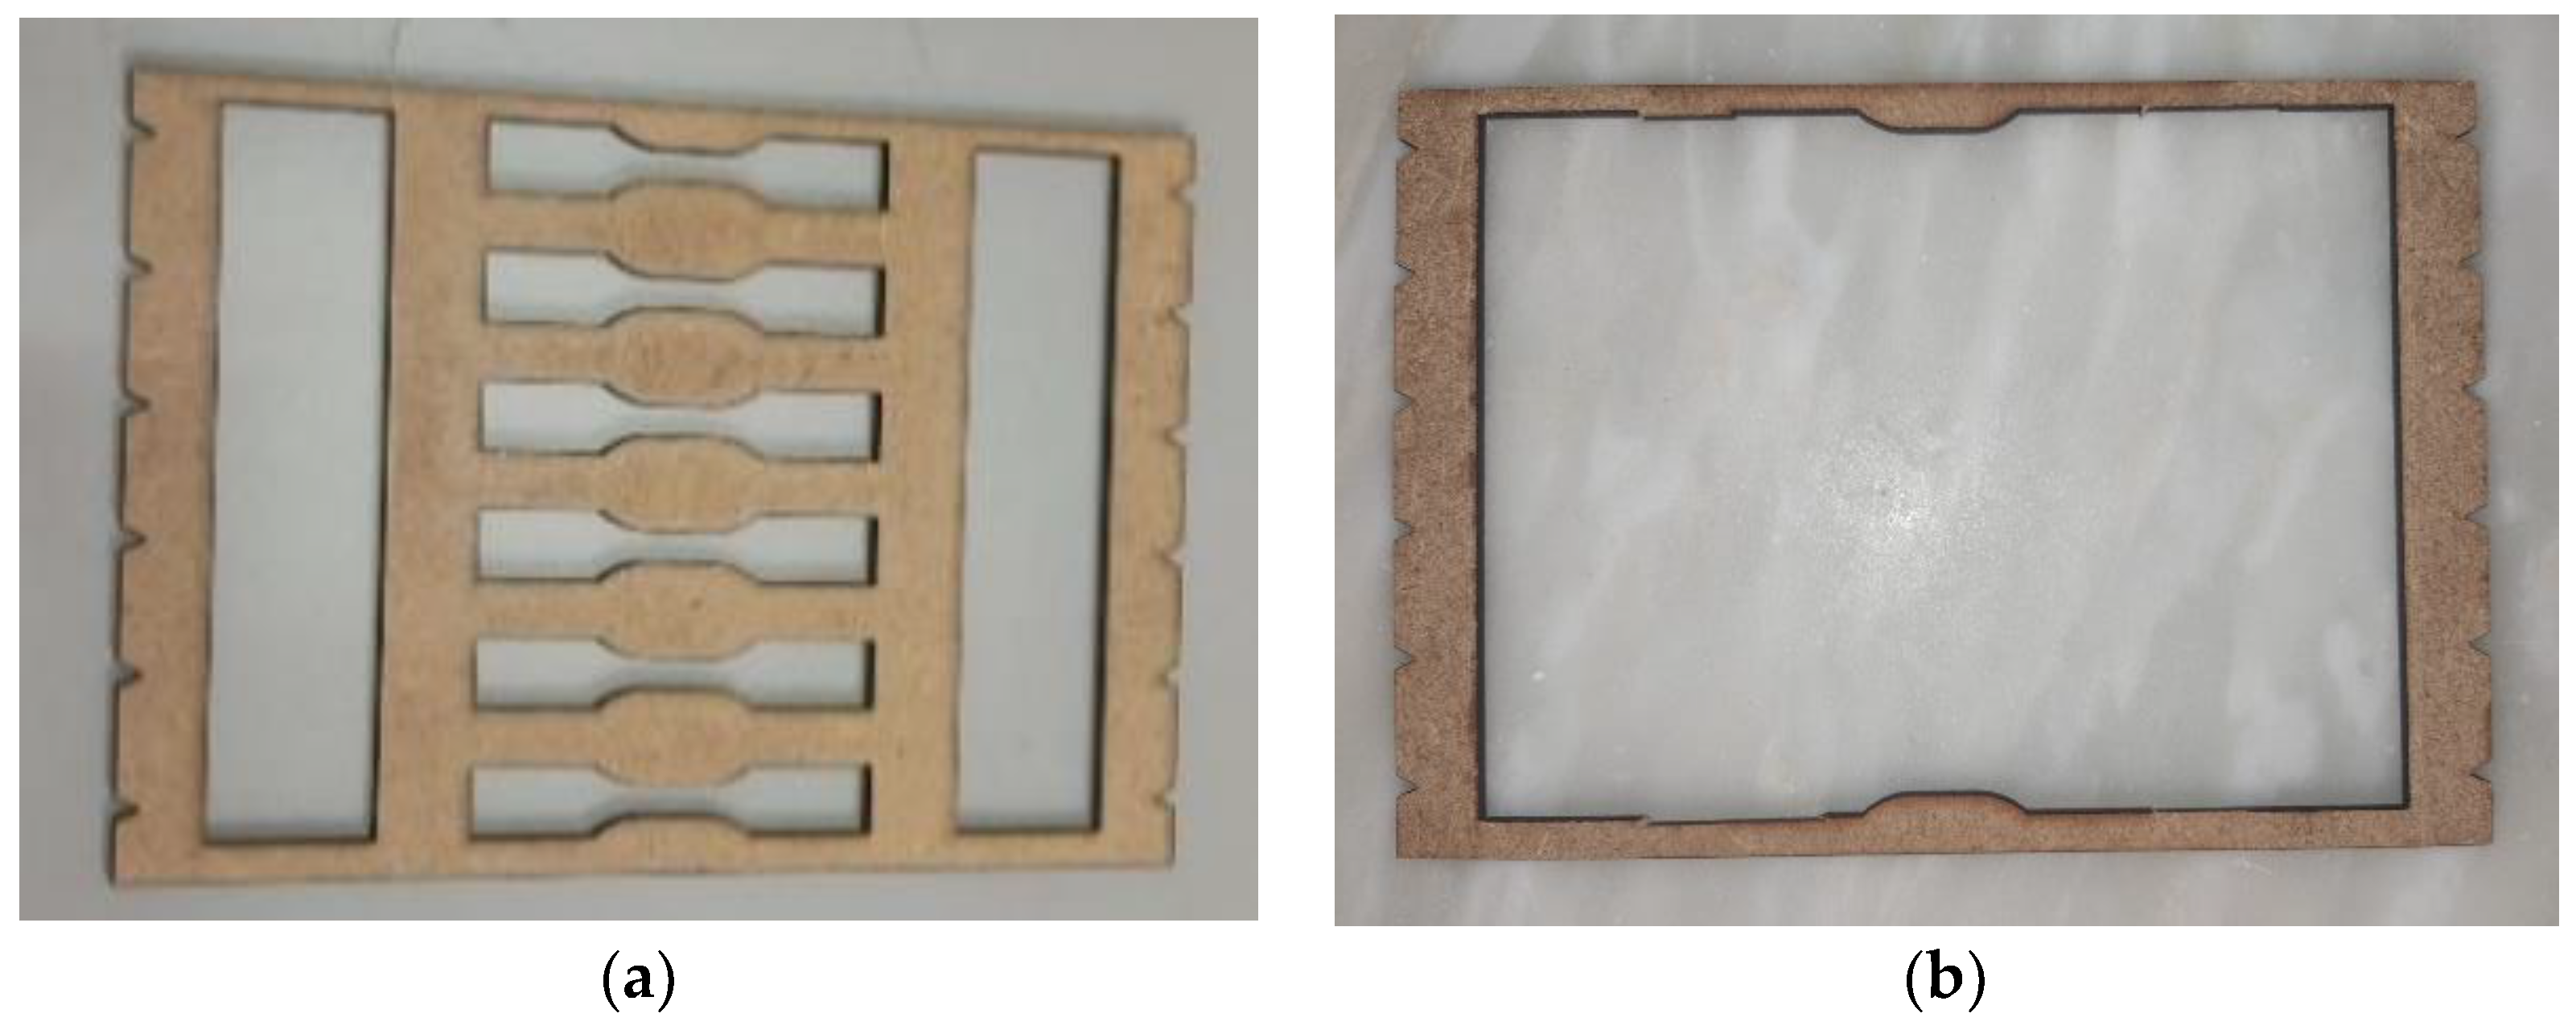
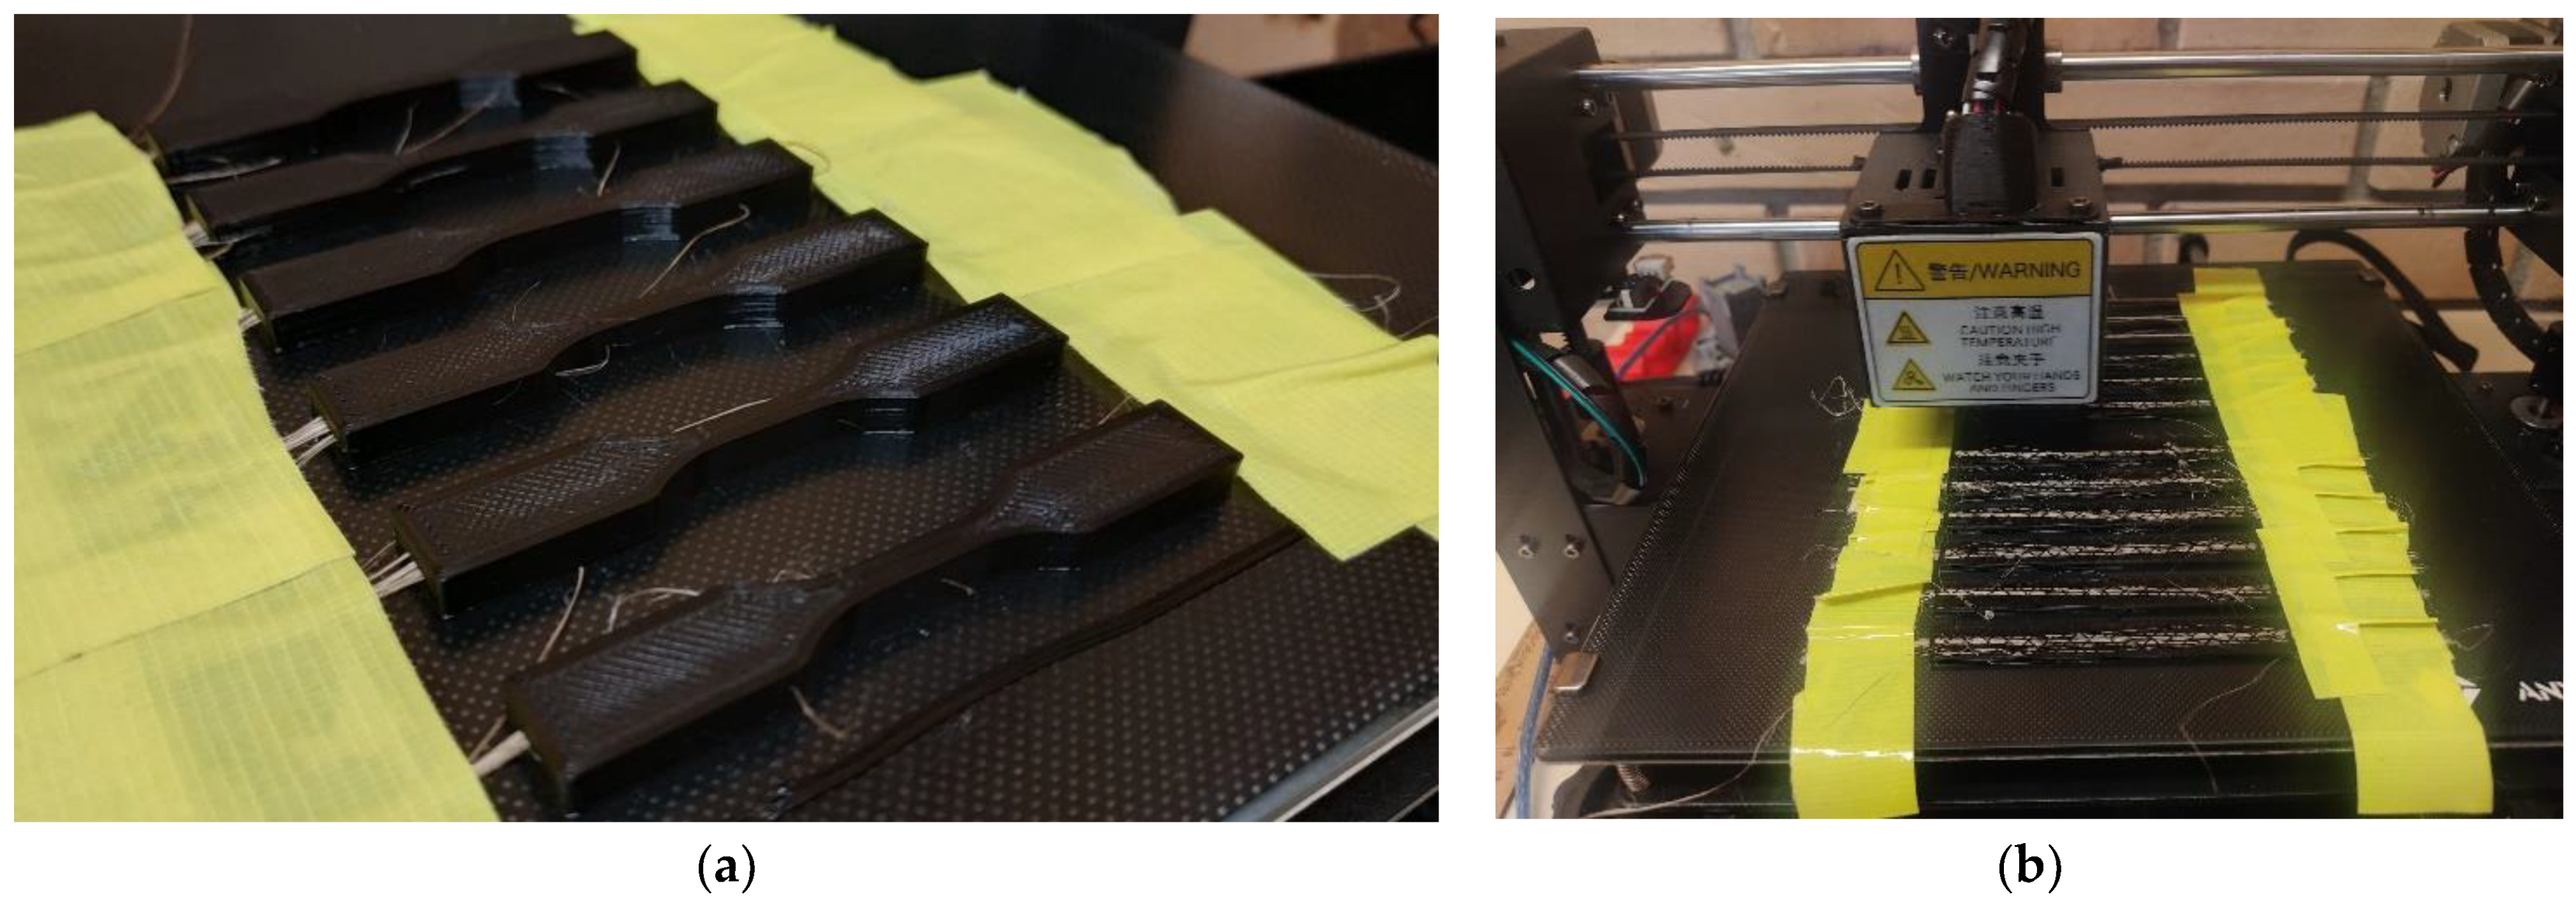
2.2.1. Specimens Manufacturing
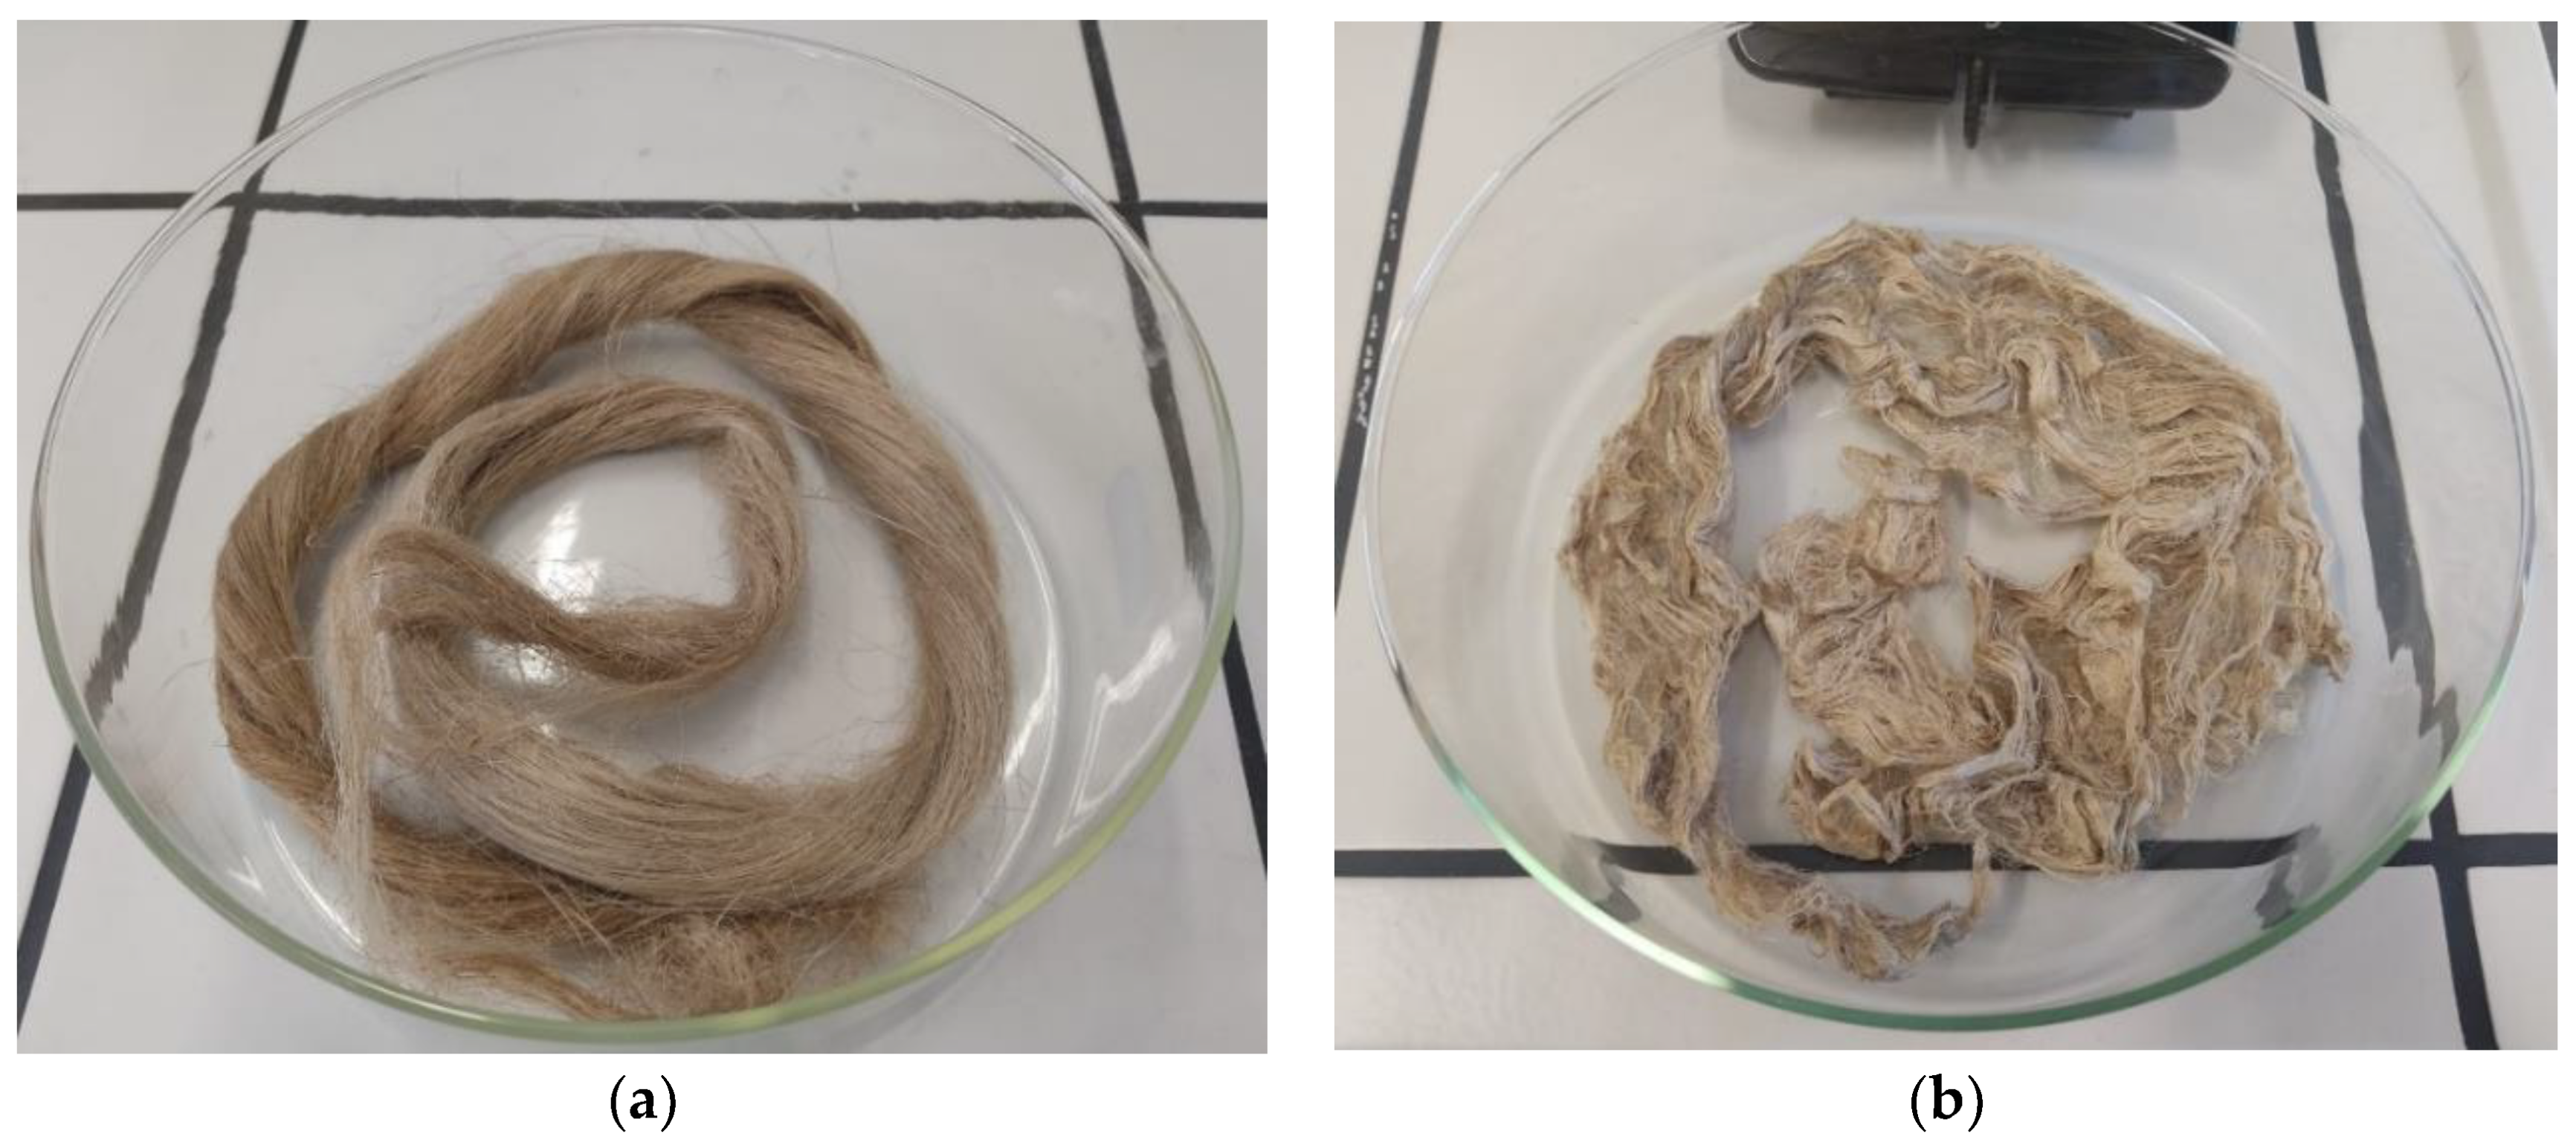
2.2.2. Chemical Surface Treatment
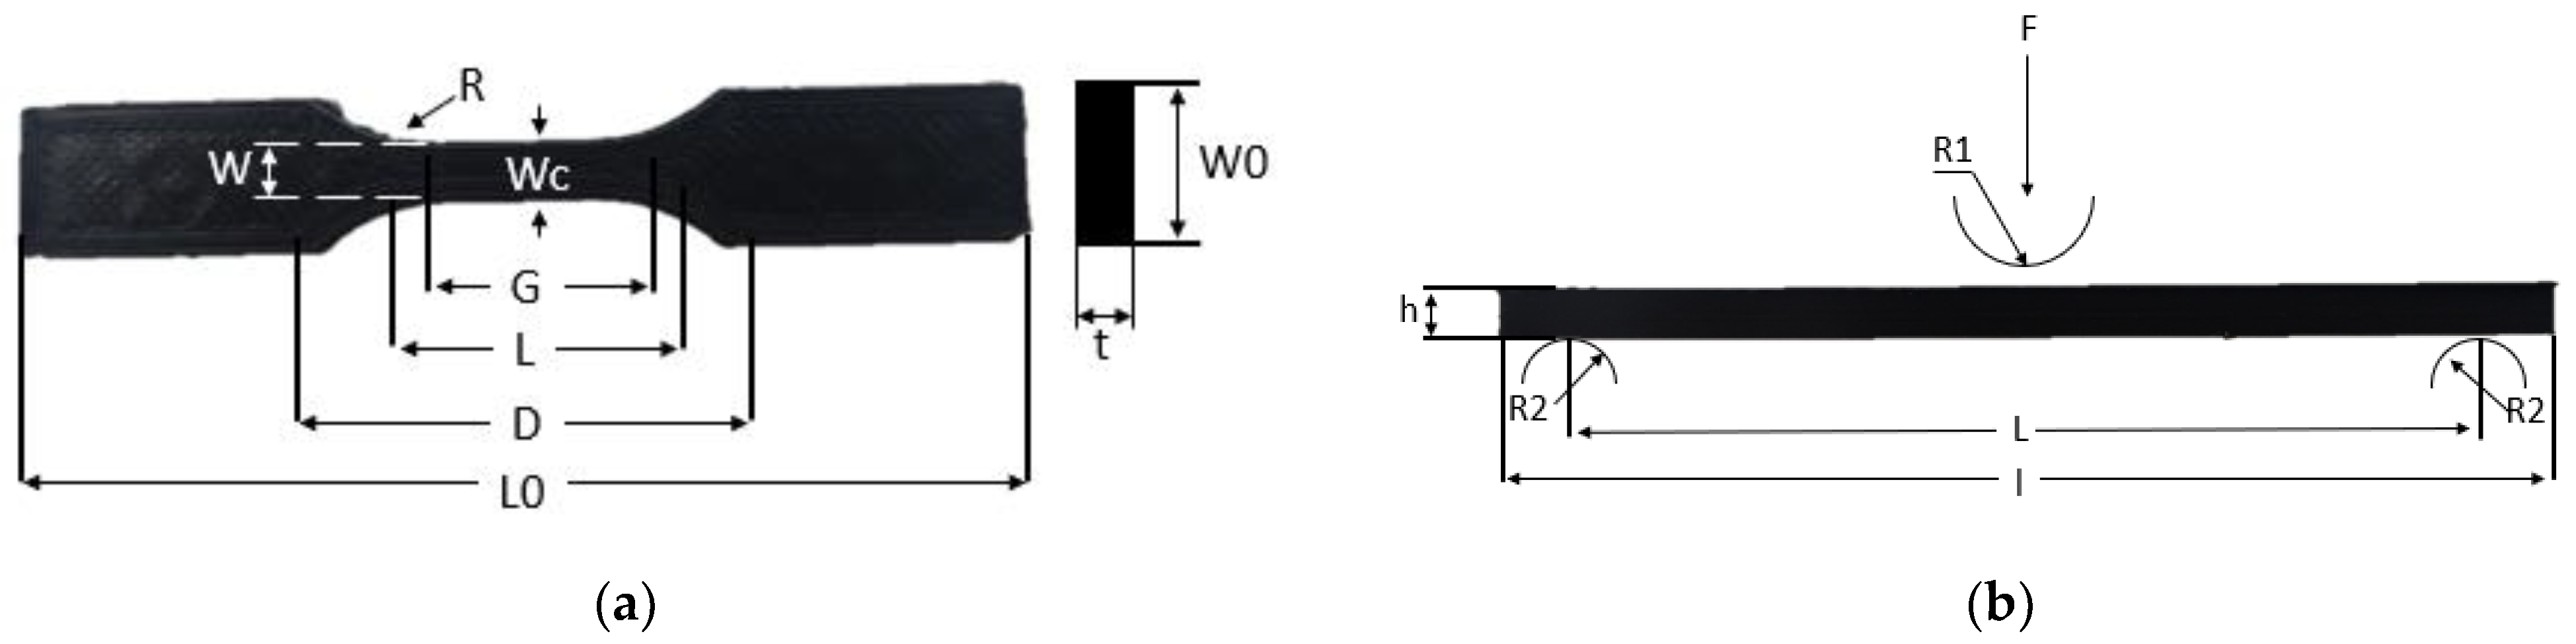
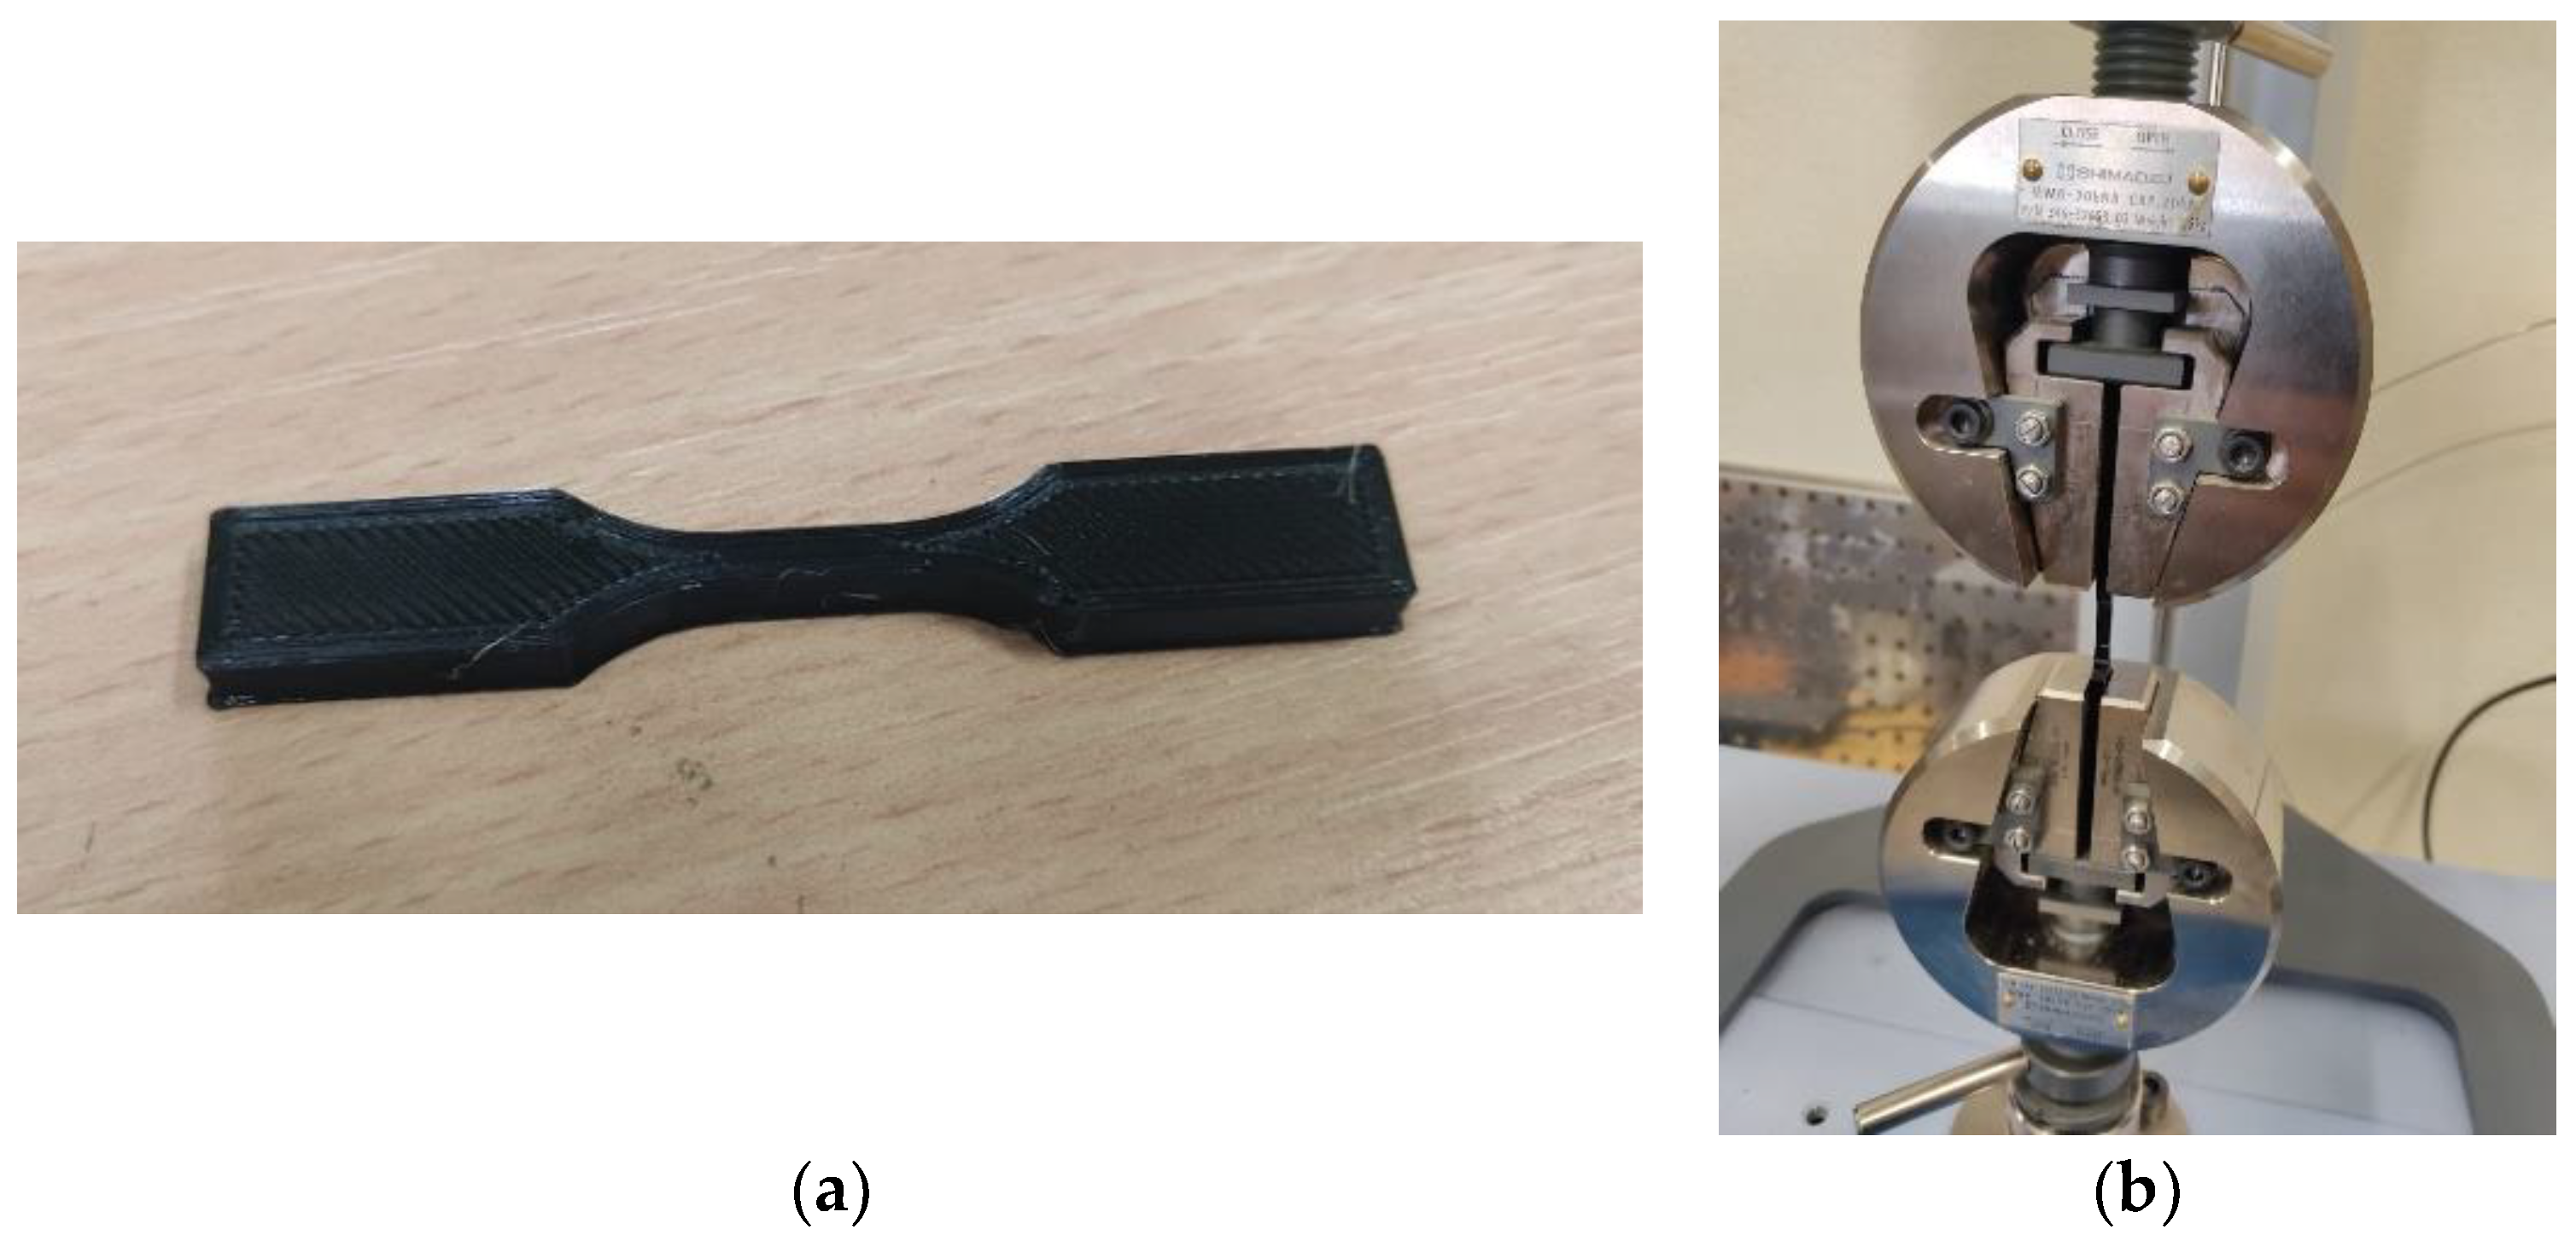
2.3. Tensile Tests
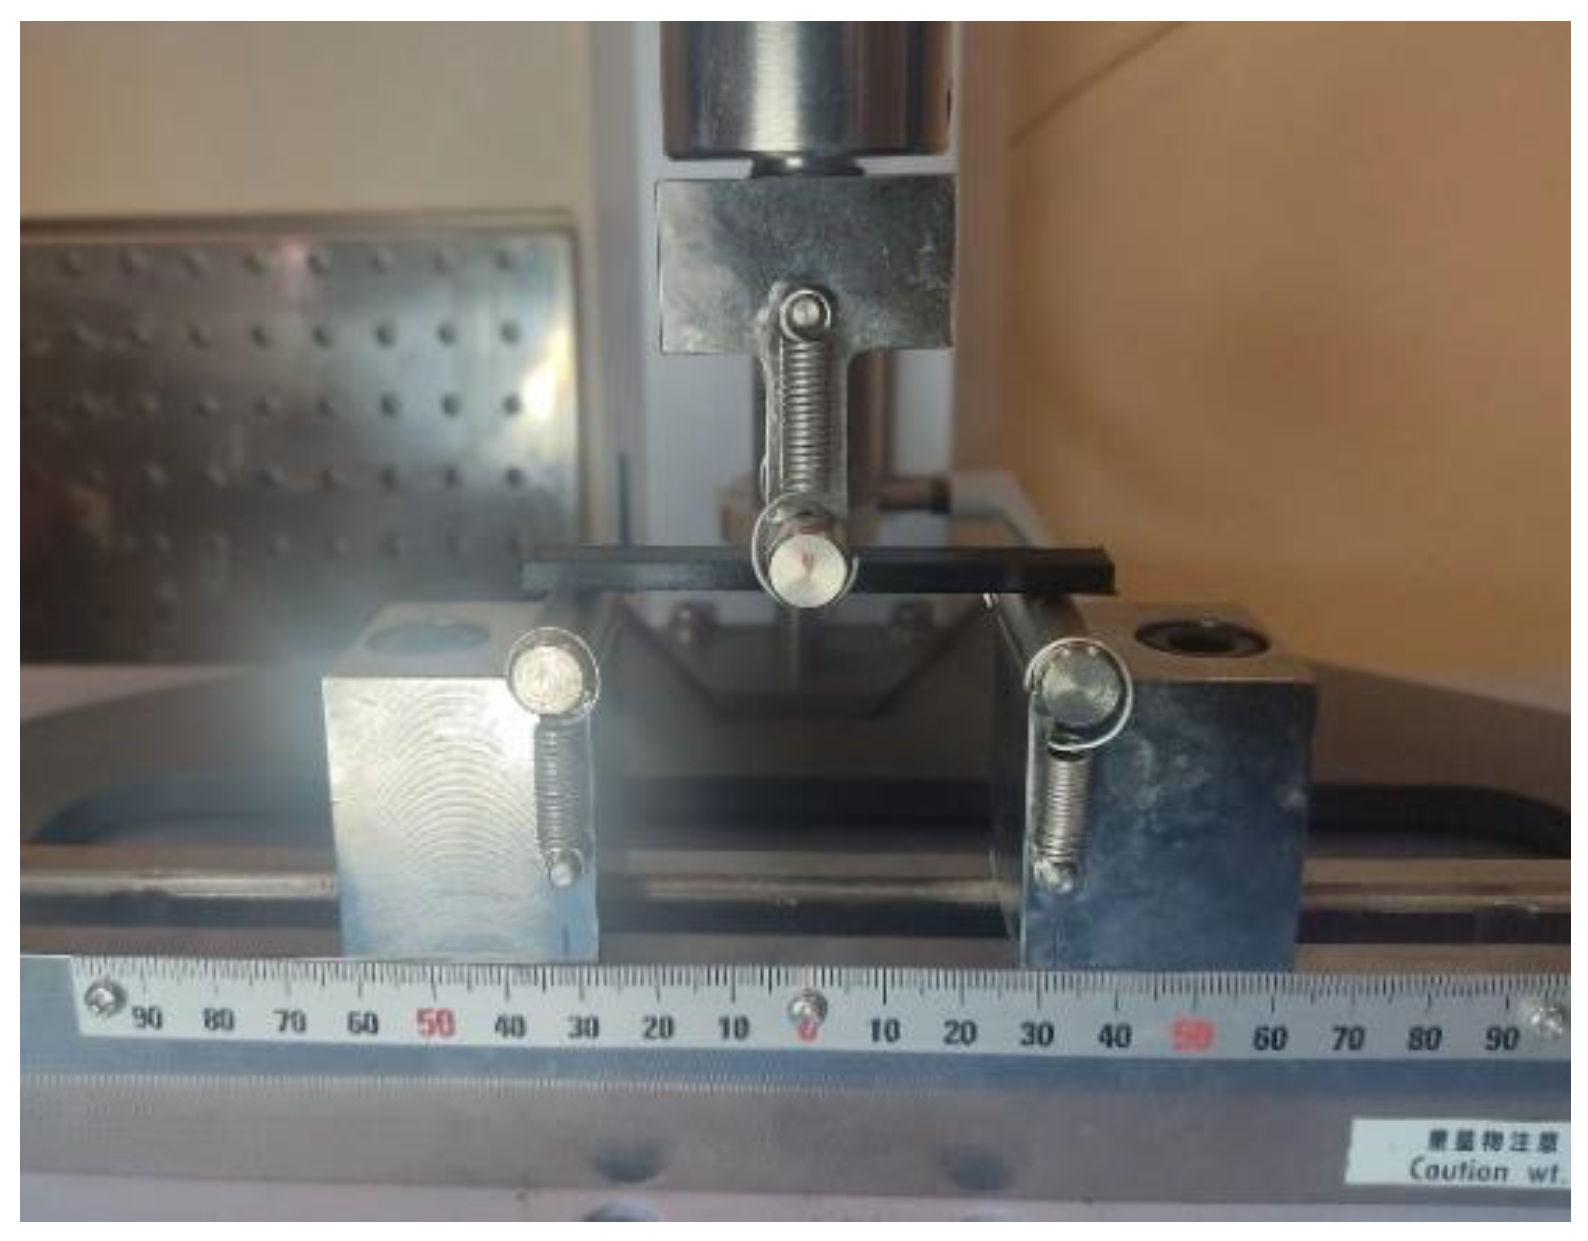
2.4. Flexural Tests
- V: Test speed (mm/min)
- ε′: Deformation rate of 1%/min
- L: Outer span (mm)
- h: Thickness (mm)
- σ: Bending stress at the outer surface (MPa)
- 𝑃: Load applied at the point (N)
- L: Specimen length (mm)
- b: Specimen width (mm)
- h: Specimen thickness (mm))
- ε: Deformation
- δ: Deflection—Distance of the lower or upper surface of the specimen in the middle of the span that has deviated from the initial position (mm)
- h: Specimen thickness (mm)
- L: Specimen length (mm)
3. Results and Discussion
Confirmation Tests
4. Conclusions
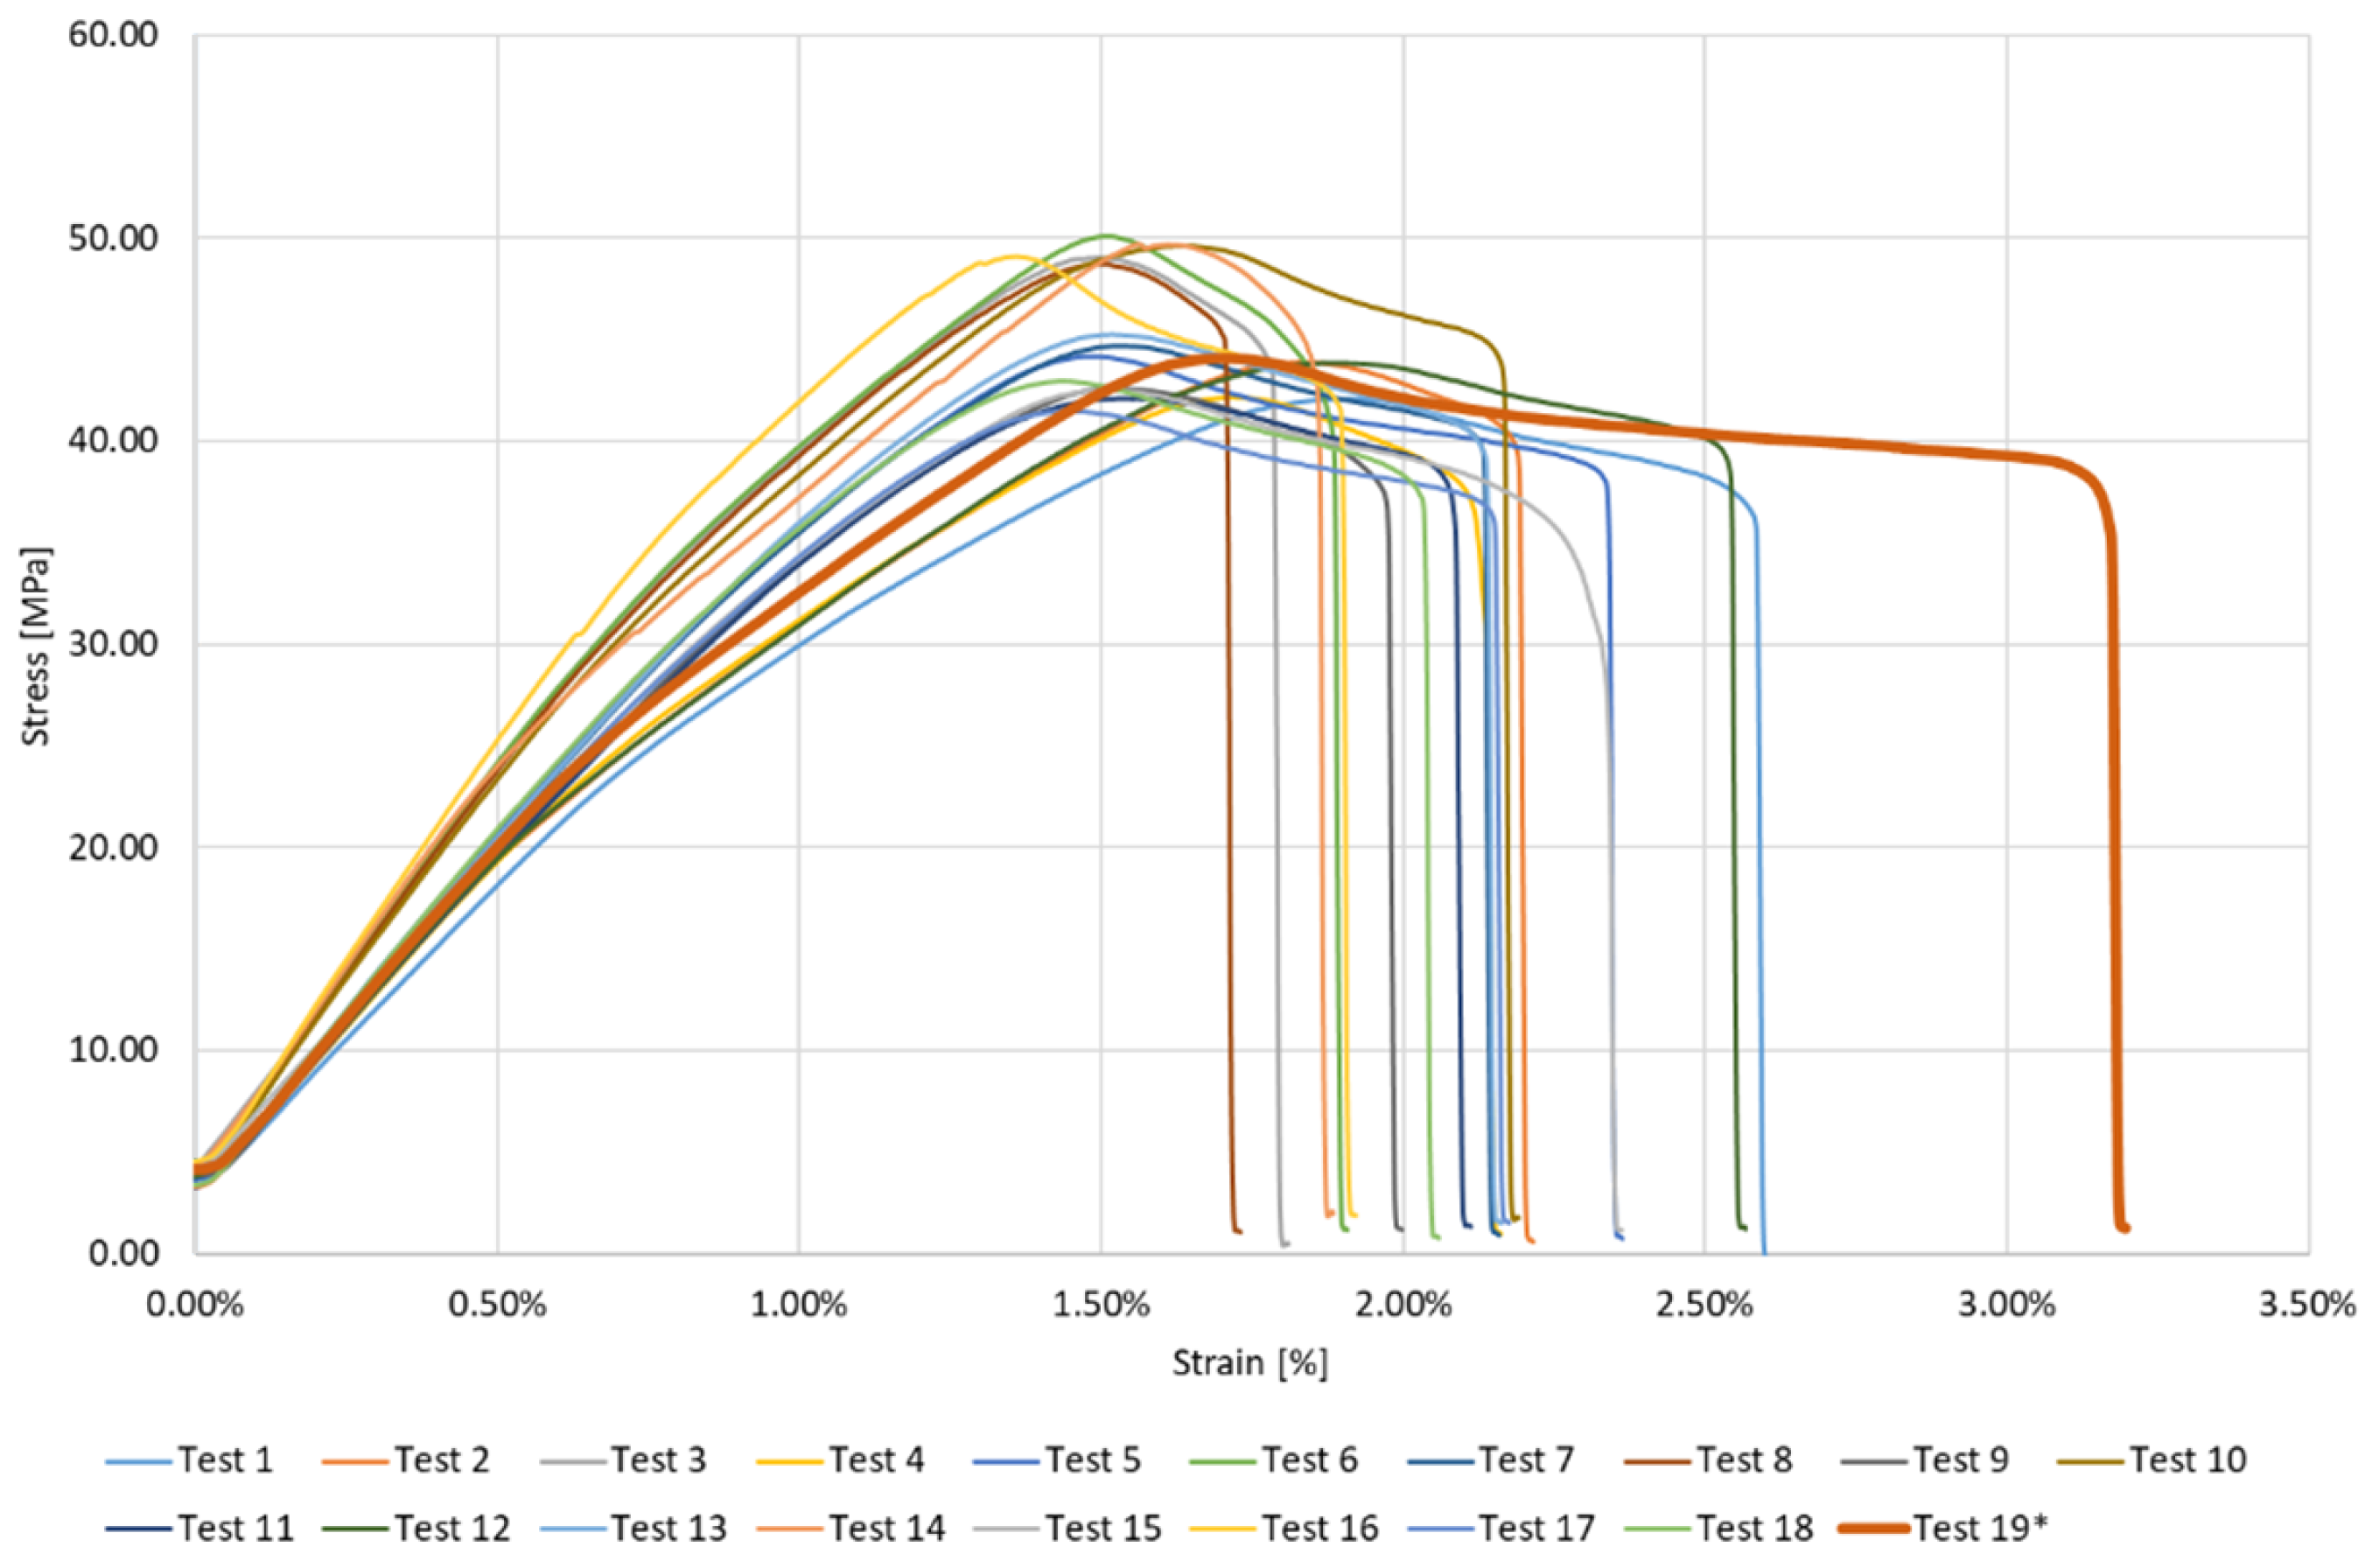
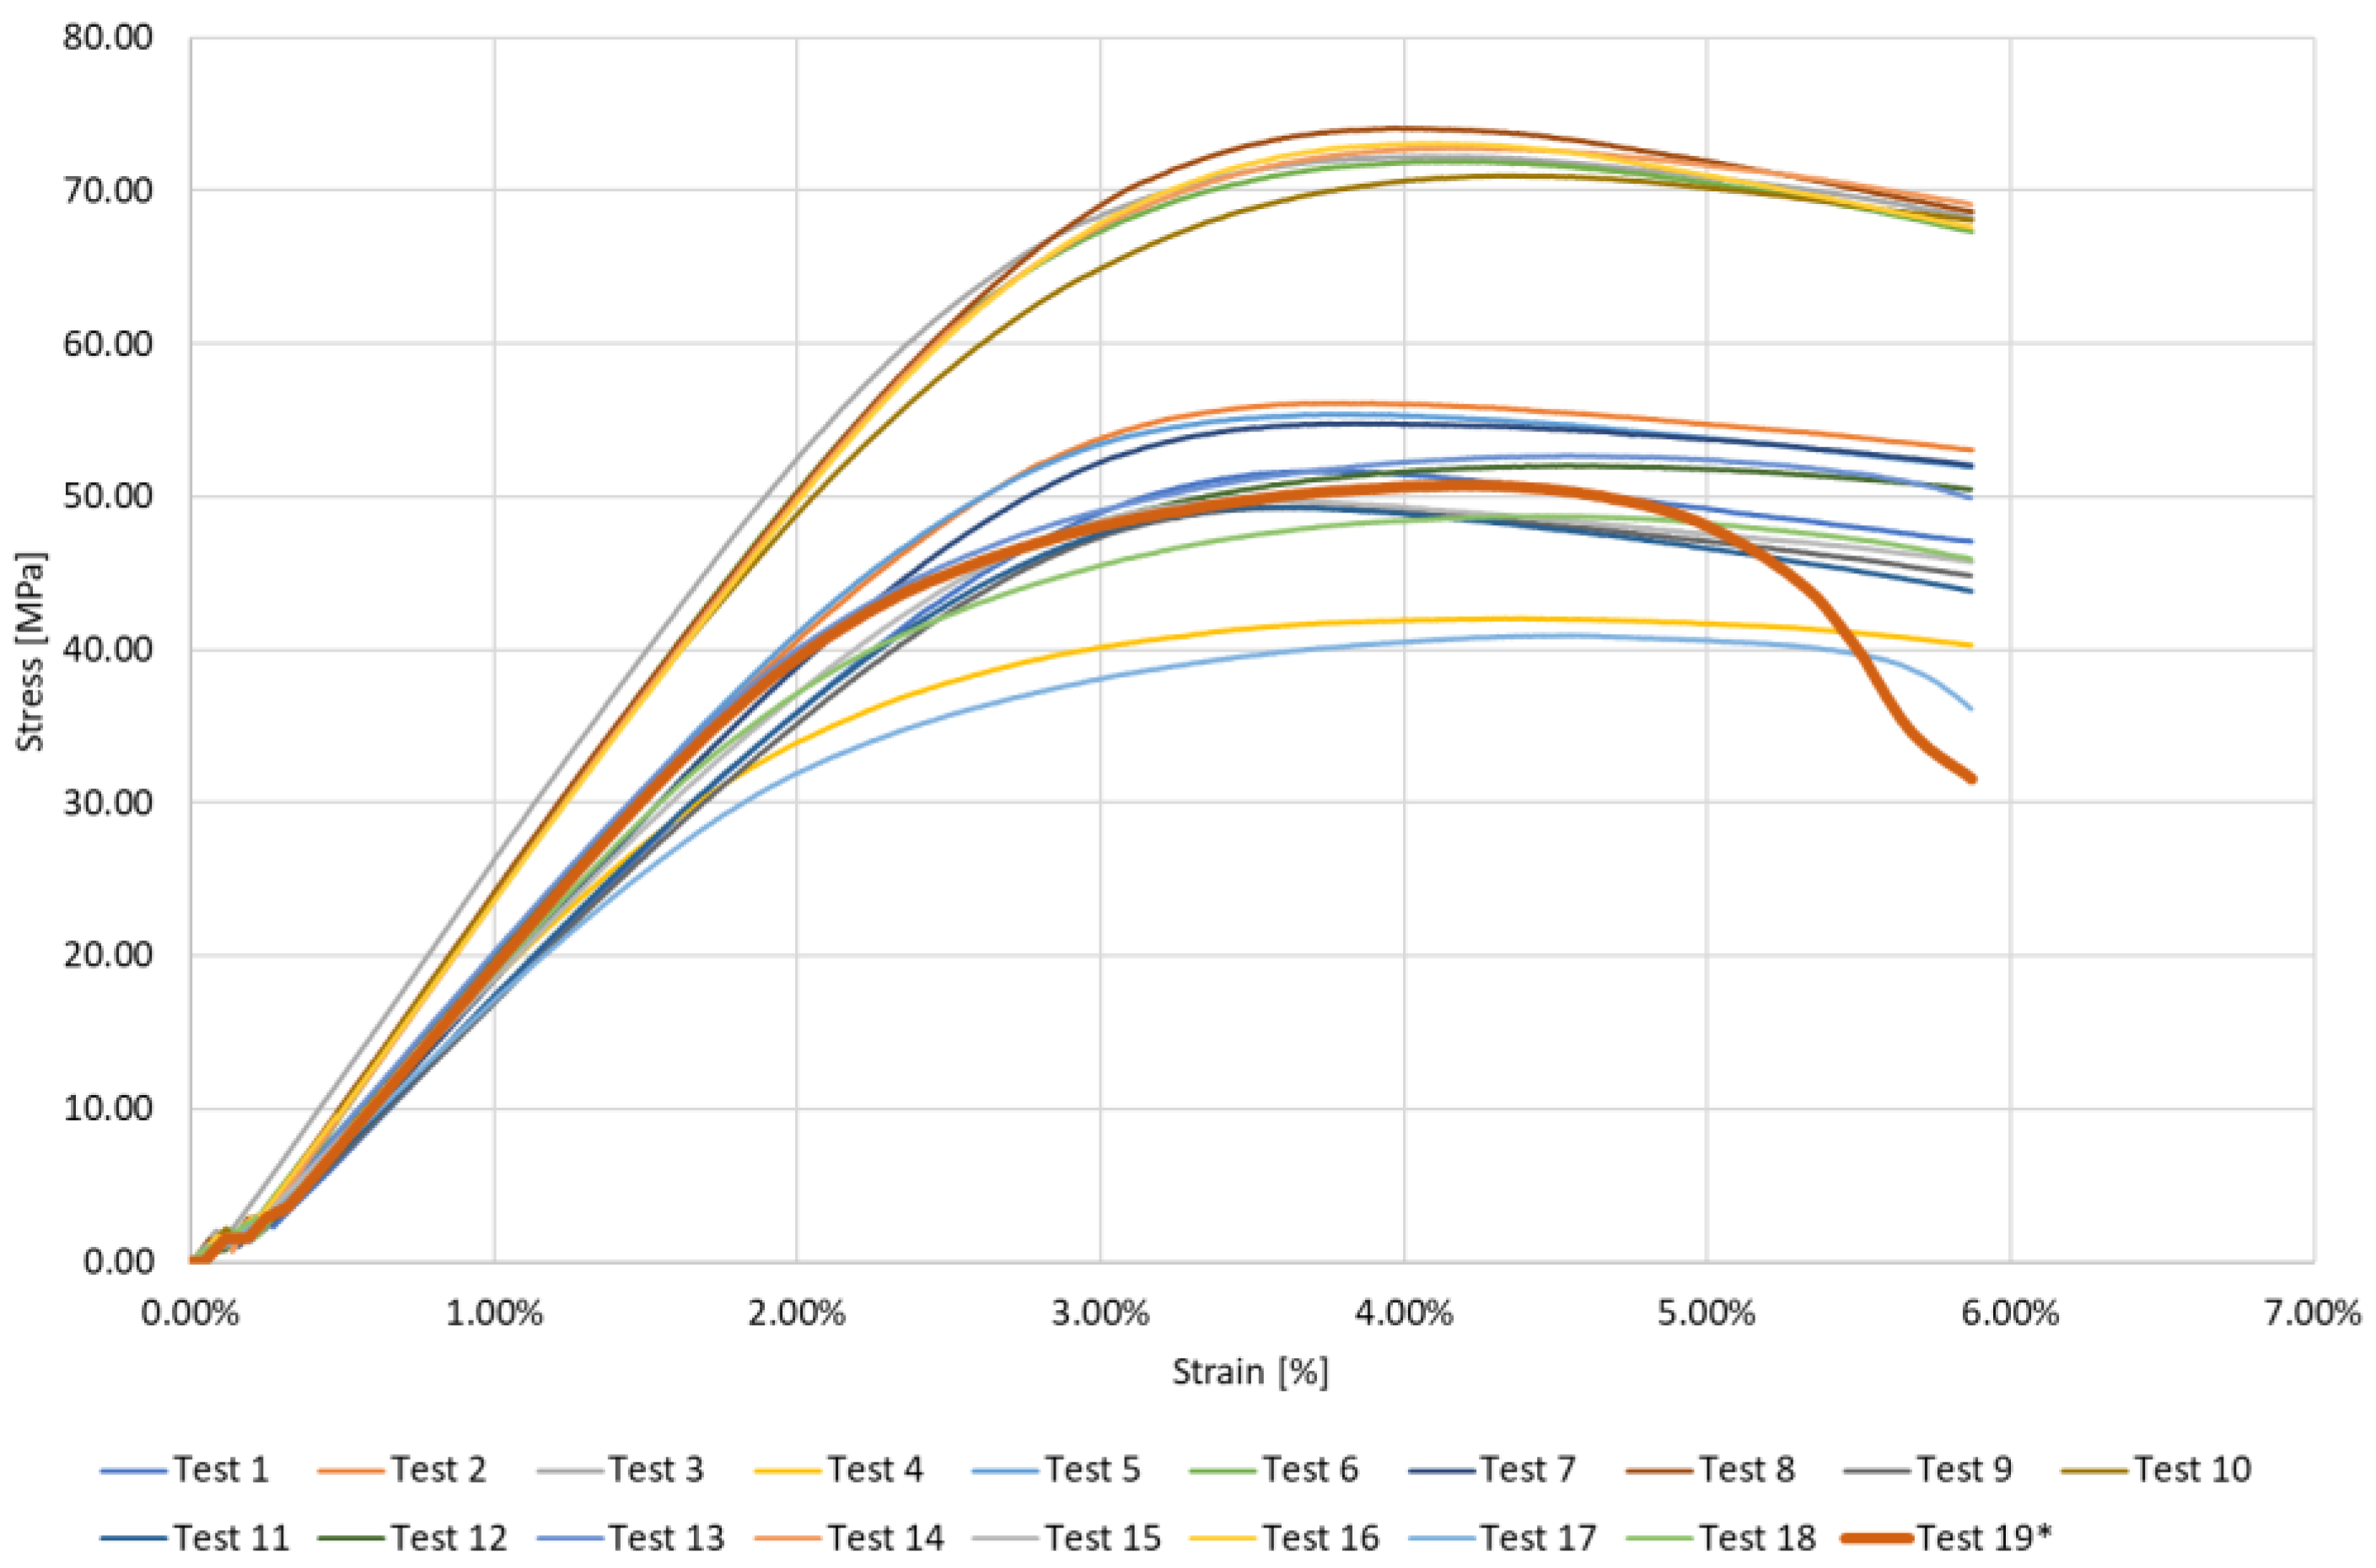
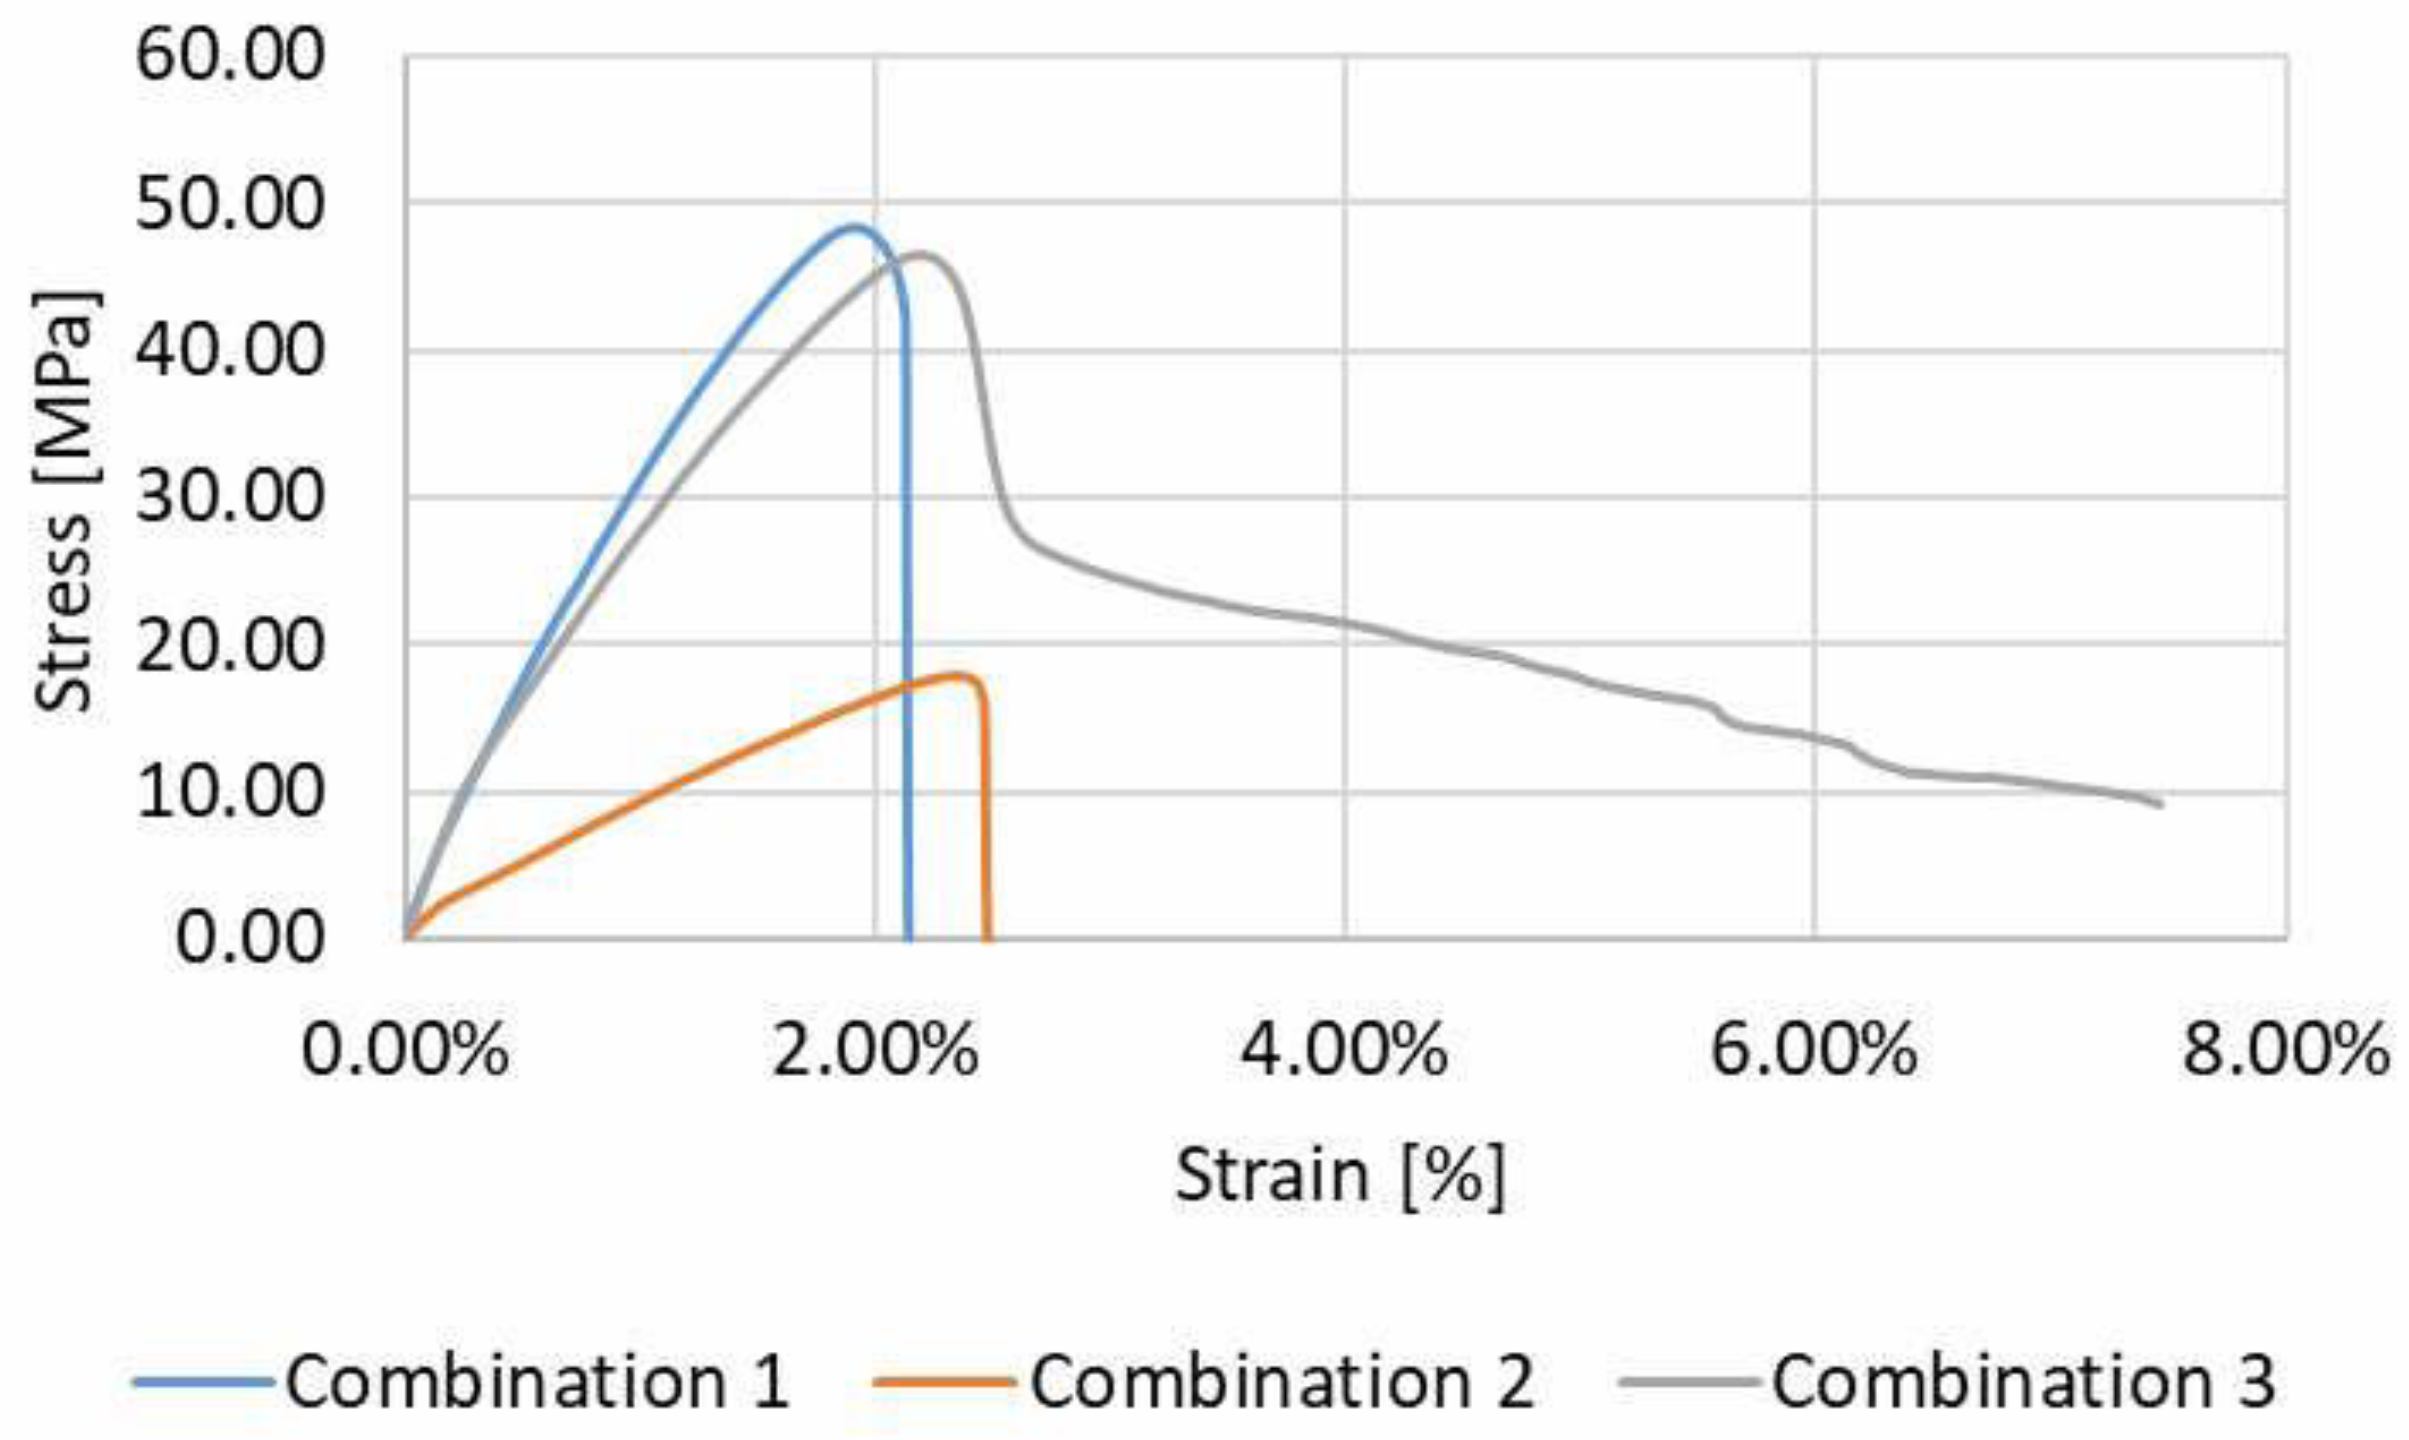
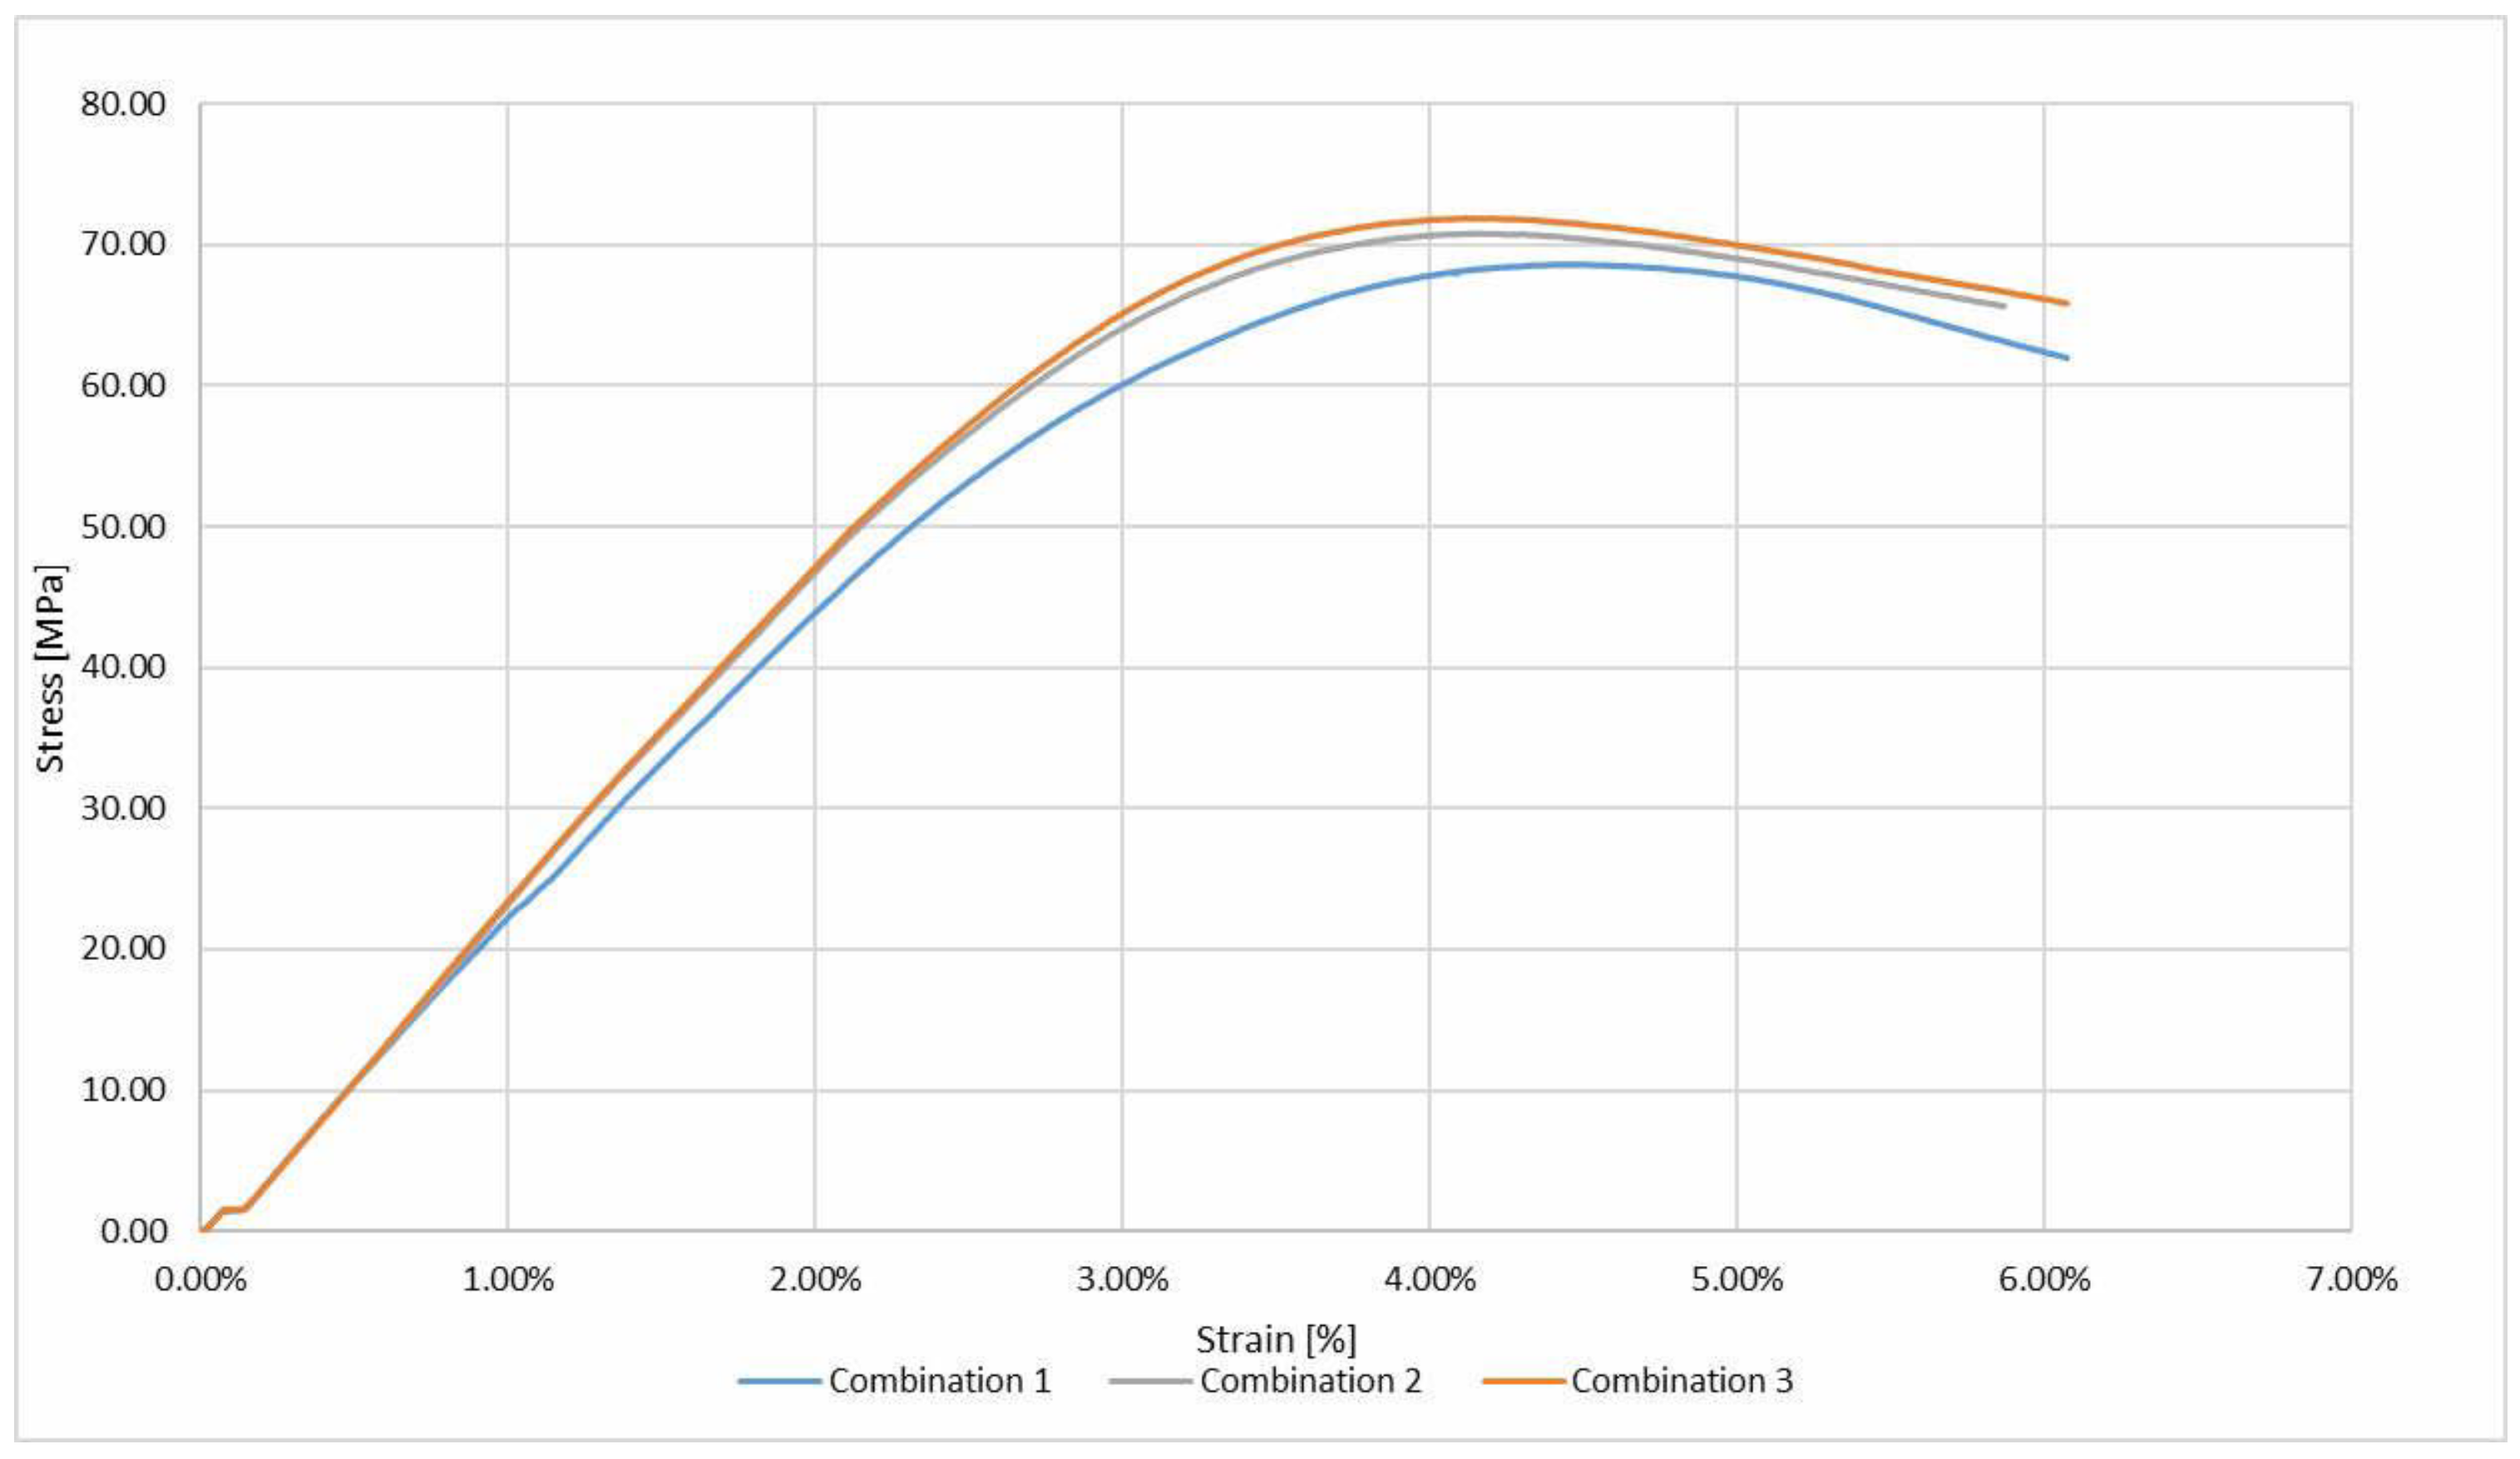
- The maximum stress for the tensile test is 49.96 MPa and for the bending is 72.94 MPa with a standard deviation of 0.89 MPa and 2.09 MPa, respectively. The values of the standard deviation are very low which is a sign that all specimens within groups have a very similar behavior. This observation could be an interesting feature for industrial applications, because it is possible to guarantee very similar properties for manufactured products by this process.
- The natural fiber reinforcement, for many combinations of control factors, improve the mechanical strength of the composite. Comparing the tensile strength of pure PLA with best result of the composite the values are 43.43 MPa and 49.96 MPa, respectively. The flexural test obtained a value of 53.55 MPa (PLA without fibers) compared to the maximum value of the flax fiber reinforced composite of 72.94 MPa. However, the pure PLA can be stronger than some combinations of NFPCs, thus, for example, the test 17 showed low values of mechanical strength (tensile and flexural) (41.09 MPa and 41.78 MPa, respectively).
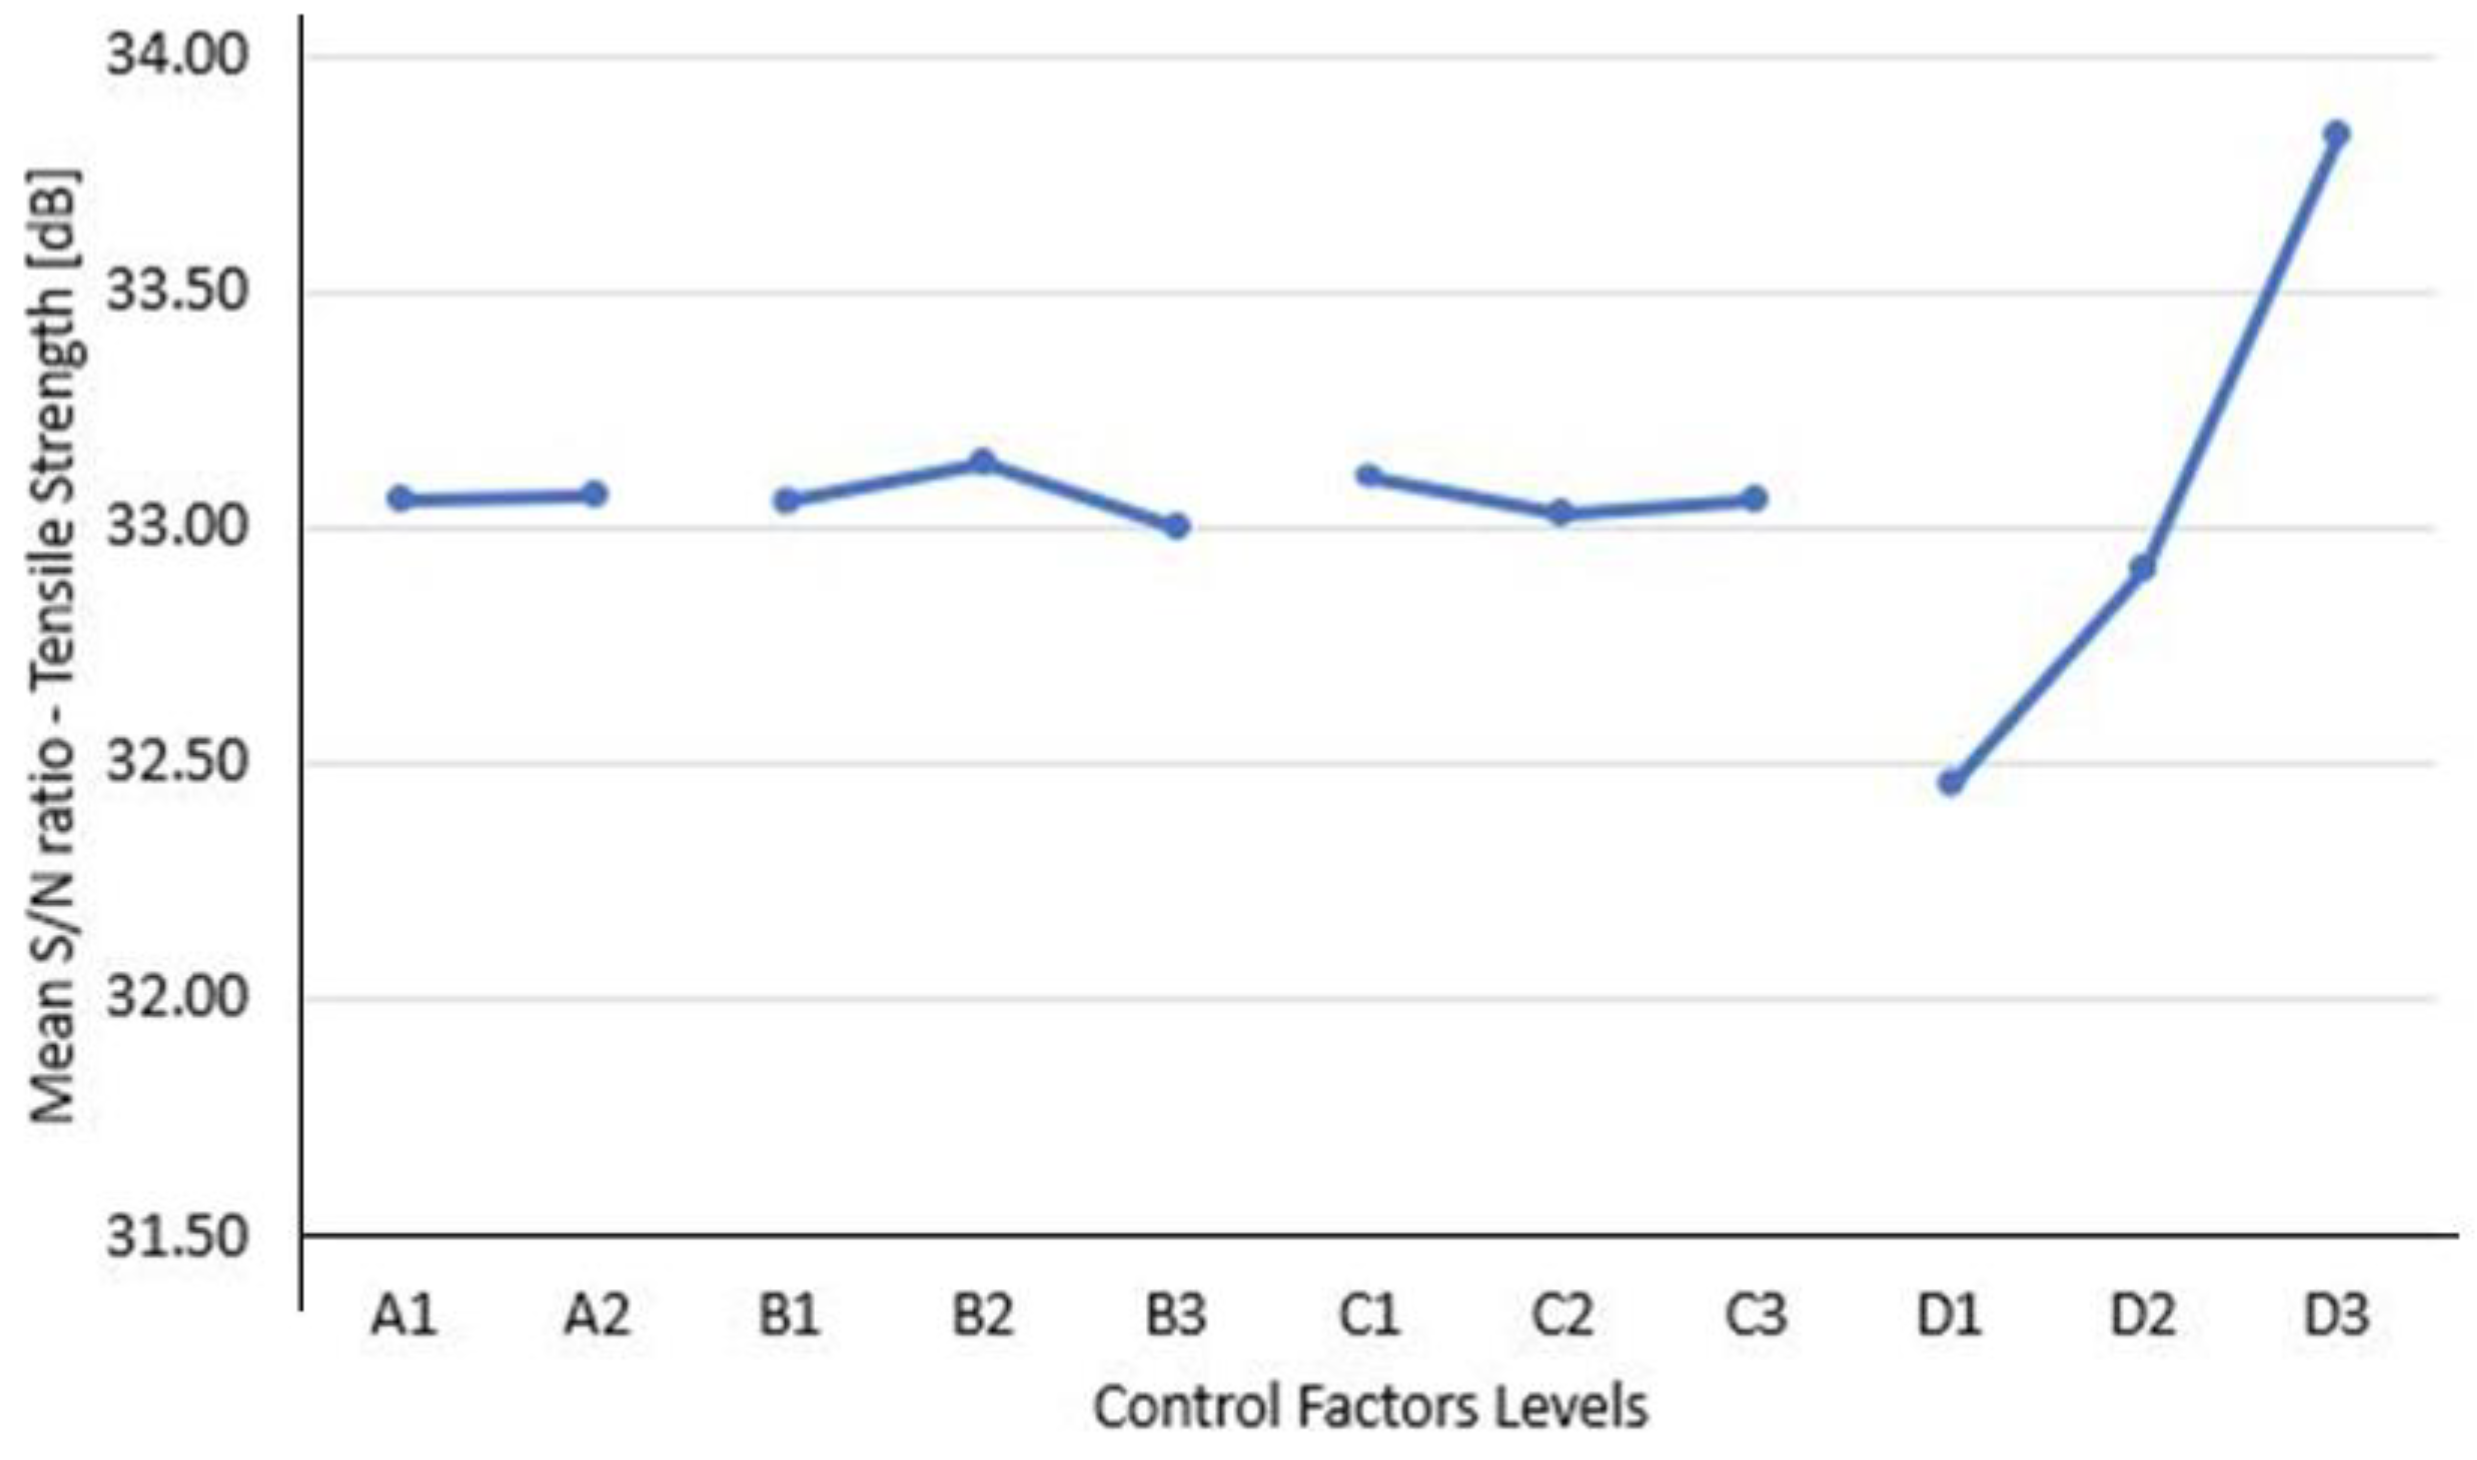
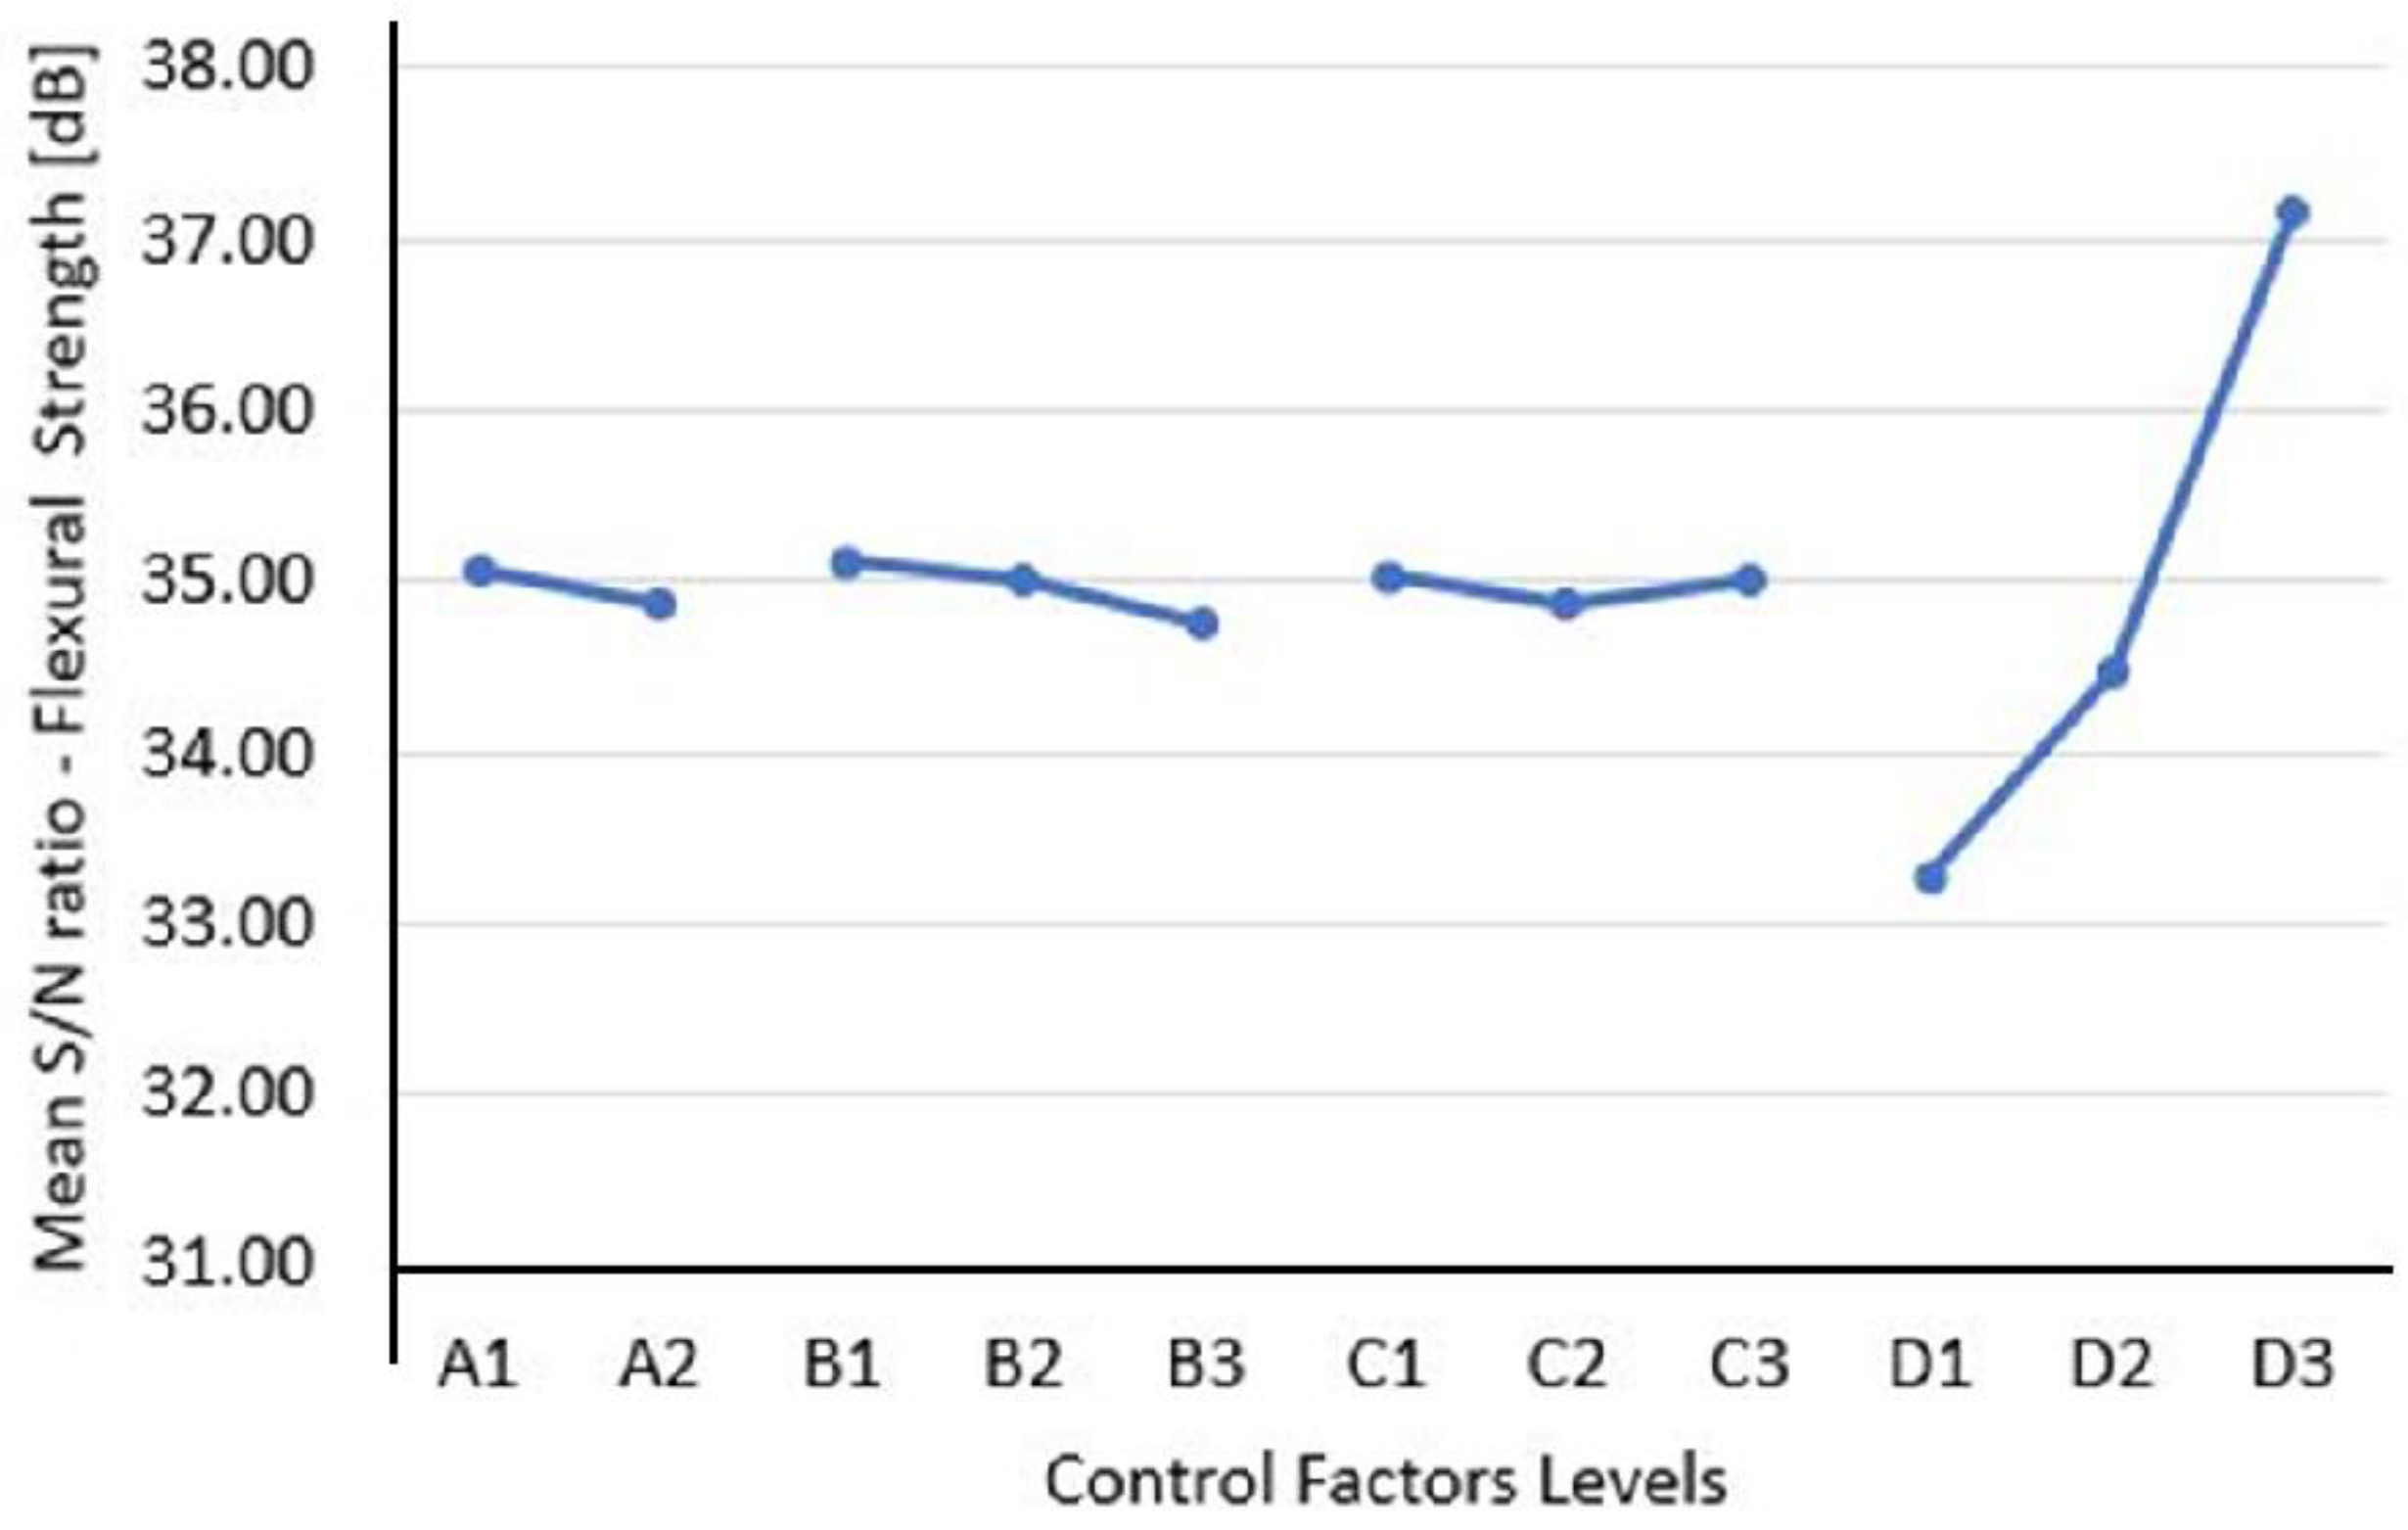
- With the Taguchi method, it was possible to determine the optimal combinations for maximum tensile and flexural strength. For tensile, the optimum combination is A1/A2, B2, C1 and D3, i.e., with/without chemical treatment, with a nozzle temperature of 200 °C, 10 fibers and an infill percentage of 100%. For bending, the optimal combination is A1, B1, C1 and D3, i.e., with chemical treatment, a nozzle temperature of 190 °C, 10 fibers and infill percentage of 100%.
- With the analysis of variance, it was found that the infill percentage was the parameter with the greatest contribution to the increase of tensile and flexural strength with percentages of 96.69% and 95.42%, respectively.
- After performing the confirmation tests with the optimal combinations obtained previously, the maximum values for the tensile and flexural strength were determined at 48.43 MPa and 71.90 MPa, respectively.
Author Contributions
Funding
Data Availability Statement
Conflicts of Interest
References
- Gibson, I.; Rosen, D.; Brent Stucker, M.K. Additive Manufacturing Technologies, 3rd ed.; Springer: Cham, Switzerland, 2021. [Google Scholar]
- Horn, T.J.; Harrysson, O.L.A. Overview of Current Additive Manufacturing Technologies and Selected Applications. Sci. Prog. 2012, 95, 255–282. [Google Scholar] [CrossRef] [PubMed]
- Krimi, I.; Lafhaj, Z.; Ducoulombier, L. Prospective Study on the Integration of Additive Manufacturing to Building Industry—Case of a French Construction Company. Addit. Manuf. 2017, 16, 107–114. [Google Scholar] [CrossRef]
- Hernandez Korner, M.E.; Lambán, M.P.; Albajez, J.A.; Santolaria, J.; Ng Corrales, L.d.C.; Royo, J. Systematic Literature Review: Integration of Additive Manufacturing and Industry 4.0. Metals 2020, 10, 1061. [Google Scholar] [CrossRef]
- Matos, F.; Godina, R.; Jacinto, C.; Carvalho, H.; Ribeiro, I.; Peças, P. Additive Manufacturing: Exploring the Social Changes and Impacts. Sustainability 2019, 11, 3757. [Google Scholar] [CrossRef] [Green Version]
- Souza, A.; Souza, M.S.; Pinho, D.; Agujetas, R.; Ferrera, C.; Lima, R.; Puga, H.; Ribeiro, J. 3D Manufacturing of Intracranial Aneurysm Biomodels for Flow Visualizations: Low Cost Fabrication Processes. Mech. Res. Commun. 2020, 107, 103535. [Google Scholar] [CrossRef]
- Ivey, M.; Melenka, G.W.; Carey, J.P.; Ayranci, C. Characterizing Short-Fiber-Reinforced Composites Produced Using Additive Manufacturing. Adv. Manuf. Polym. Compos. Sci. 2017, 3, 81–91. [Google Scholar] [CrossRef] [Green Version]
- Razvi, S.S.; Feng, S.; Narayanan, A.; Lee, Y.-T.T.; Witherell, P. A Review of Machine Learning Applications in Additive Manufacturing. In Proceedings of the 39th Computers and Information in Engineering Conference, Anaheim, CA, USA, 18–21 August 2019; American Society of Mechanical Engineers: New York, NY, USA, 2019; Volume 1. [Google Scholar]
- Singh, S.; Ramakrishna, S. Biomedical Applications of Additive Manufacturing: Present and Future. Curr. Opin. Biomed. Eng. 2017, 2, 105–115. [Google Scholar] [CrossRef]
- Frandsen, C.S.; Nielsen, M.M.; Chaudhuri, A.; Jayaram, J.; Govindan, K. In Search for Classification and Selection of Spare Parts Suitable for Additive Manufacturing: A Literature Review. Int. J. Prod. Res. 2020, 58, 970–996. [Google Scholar] [CrossRef]
- Lee, C.H.; Padzil, F.N.B.M.; Lee, S.H.; Ainun, Z.M.A.; Abdullah, L.C. Potential for Natural Fiber Reinforcement in PLA Polymer Filaments for Fused Deposition Modeling (FDM) Additive Manufacturing: A Review. Polymers 2021, 13, 1407. [Google Scholar] [CrossRef]
- Tseng, T.K.; Chu, H. The Catalytic Incineration of Styrene over an Mn2O3/Fe2O3 Catalyst. J. Air Waste Manag. Assoc. 2002, 52, 1153–1160. [Google Scholar] [CrossRef]
- Aliotta, L.; Gigante, V.; Coltelli, M.B.; Cinelli, P.; Lazzeri, A.; Seggiani, M. Thermo-Mechanical Properties of PLA/Short Flax Fiber Biocomposites. Appl. Sci. 2019, 9, 3797. [Google Scholar] [CrossRef] [Green Version]
- Soleimani, M.; Tabil, L.; Panigrahi, S.; Opoku, A. The Effect of Fiber Pretreatment and Compatibilizer on Mechanical and Physical Properties of Flax Fiber-Polypropylene Composites. J. Polym. Environ. 2008, 16, 74–82. [Google Scholar] [CrossRef]
- Bénard, Q.; Fois, M.; Grisel, M. Roughness and Fibre Reinforcement Effect onto Wettability of Composite Surfaces. Appl. Surf. Sci. 2007, 253, 4753–4758. [Google Scholar] [CrossRef]
- García-Martínez, H.; Ávila-Navarro, E.; Torregrosa-Penalva, G.; Rodríguez-Martínez, A.; Blanco-Angulo, C.; de la Casa-Lillo, M.A. de la Low-Cost Additive Manufacturing Techniques Applied to the Design of Planar Microwave Circuits by Fused Deposition Modeling. Polymers 2020, 12, 1946. [Google Scholar] [CrossRef] [PubMed]
- Oliveira, C.; Rocha, J.; Ribeiro, J.E. Mechanical and Physical Characterization of Parts Manufactured by 3D Printing; Springer: Cham, Switzerland, 2023; pp. 77–88. [Google Scholar]
- Mohammed, L.; Ansari, M.N.M.; Pua, G.; Jawaid, M.; Islam, M.S. A Review on Natural Fiber Reinforced Polymer Composite and Its Applications. Int. J. Polym. Sci. 2015, 2015, 243947. [Google Scholar] [CrossRef] [Green Version]
- John, M.J.; Thomas, S. Biofibres and Biocomposites. Carbohydr. Polym. 2008, 71, 343–364. [Google Scholar] [CrossRef]
- Ribeiro, J.E.; Rocha, J.; Queijo, L.; Polyester, N.C.H.S. The Influence of Manufacturing Factors in the Short-Fiber Non-Woven Chestnut Hedgehog Spine- Reinforced Polyester Composite Performance The Influence of Manufacturing Factors in the Short-Fiber. J. Nat. Fibers 2021, 18, 1307–1319. [Google Scholar] [CrossRef] [Green Version]
- Kumar, R.; Ul Haq, M.I.; Raina, A.; Anand, A. Industrial Applications of Natural Fibre-Reinforced Polymer Composites–Challenges and Opportunities. Int. J. Sustain. Eng. 2019, 12, 212–220. [Google Scholar] [CrossRef]
- Müssig, J.; Haag, K. The Use of Flax Fibres as Reinforcements in Composites; Woodhead Publishing: Cambridge, UK, 2015; ISBN 9781782421276. [Google Scholar]
- Baley, C.; Gomina, M.; Breard, J.; Bourmaud, A.; Davies, P. Variability of Mechanical Properties of Flax Fibres for Composite Reinforcement. A Review. Ind. Crops Prod. 2020, 145, 111984. [Google Scholar] [CrossRef]
- Morvan, C.; Andème-Onzighi, C.; Girault, R.; Himmelsbach, D.S.; Driouich, A.; Akin, D.E. Building Flax Fibres: More than One Brick in the Walls. Plant Physiol. Biochem. 2003, 41, 935–944. [Google Scholar] [CrossRef]
- Baley, C.; Gomina, M.; Breard, J.; Bourmaud, A.; Drapier, S.; Ferreira, M.; Le Duigou, A.; Liotier, P.J.; Ouagne, P.; Soulat, D.; et al. Specific Features of Flax Fibres Used to Manufacture Composite Materials. Int. J. Mater. Form. 2019, 12, 1023–1052. [Google Scholar] [CrossRef] [Green Version]
- Goudenhooft, C.; Alméras, T.; Bourmaud, A.; Baley, C. The Remarkable Slenderness of Flax Plant and Pertinent Factors Affecting Its Mechanical Stability. Biosyst. Eng. 2019, 178, 1–8. [Google Scholar] [CrossRef] [Green Version]
- Bos, H.L.; Müssig, J.; van den Oever, M.J.A. Mechanical Properties of Short-Flax-Fibre Reinforced Compounds. Compos. Part A Appl. Sci. Manuf. 2006, 37, 1591–1604. [Google Scholar] [CrossRef]
- Aida, H.J.; Nadlene, R.; Mastura, M.T.; Yusriah, L.; Sivakumar, D.; Ilyas, R.A. Natural Fibre Filament for Fused Deposition Modelling (FDM): A Review. Int. J. Sustain. Eng. 2021, 14, 1988–2008. [Google Scholar] [CrossRef]
- De Bortoli, L.S.; de Farias, R.; Mezalira, D.Z.; Schabbach, L.M.; Fredel, M.C. Functionalized Carbon Nanotubes for 3D-Printed PLA-Nanocomposites: Effects on Thermal and Mechanical Properties. Mater. Today Commun. 2022, 31, 103402. [Google Scholar] [CrossRef]
- Stoof, D.; Pickering, K.; Zhang, Y. Fused Deposition Modelling of Natural Fibre/Polylactic Acid Composites. J. Compos. Sci. 2017, 1, 8. [Google Scholar] [CrossRef] [Green Version]
- Jamadi, A.H.; Razali, N.; Petrů, M.; Taha, M.M.; Muhammad, N.; Ilyas, R.A. Effect of Chemically Treated Kenaf Fibre on Mechanical and Thermal Properties of PLA Composites Prepared through Fused Deposition Modeling (FDM). Polymers 2021, 13, 3299. [Google Scholar] [CrossRef]
- Obada, D.O.; Kuburi, L.S.; Dauda, M.; Umaru, S.; Dodoo-Arhin, D.; Balogun, M.B.; Iliyasu, I.; Iorpenda, M.J. Effect of Variation in Frequencies on the Viscoelastic Properties of Coir and Coconut Husk Powder Reinforced Polymer Composites. J. King Saud Univ.-Eng. Sci. 2020, 32, 148–157. [Google Scholar] [CrossRef]
- Zhong, W.; Li, F.; Zhang, Z.; Song, L.; Li, Z. Short Fiber Reinforced Composites for Fused Deposition Modeling. Mater. Sci. Eng. A 2001, 301, 125–130. [Google Scholar] [CrossRef]
- Mangat, A.S.; Singh, S.; Gupta, M.; Sharma, R. Experimental Investigations on Natural Fiber Embedded Additive Manufacturing-Based Biodegradable Structures for Biomedical Applications. Rapid Prototyp. J. 2018, 24, 1221–1234. [Google Scholar] [CrossRef]
- Goh, G.D.; Yap, Y.L.; Agarwala, S.; Yeong, W.Y. Recent Progress in Additive Manufacturing of Fiber Reinforced Polymer Composite. Adv. Mater. Technol. 2019, 4, 1800271. [Google Scholar] [CrossRef] [Green Version]
- Liu, Z.T.; Sun, C.; Liu, Z.W.; Lu, J. Adjustable Wettability of Methyl Methacrylate Modified Ramie Fiber. J. Appl. Polym. Sci. 2008, 109, 2888–2894. [Google Scholar] [CrossRef]
- Sinha, E.; Panigrahi, S. Effect of Plasma Treatment on Structure, Wettability of Jute Fiber and Flexural Strength of Its Composite. J. Compos. Mater. 2009, 43, 1791–1802. [Google Scholar] [CrossRef]
- Ahmad, F.; Choi, H.S.; Park, M.K. A Review: Natural Fiber Composites Selection in View of Mechanical, Light Weight, and Economic Properties. Macromol. Mater. Eng. 2015, 300, 10–24. [Google Scholar] [CrossRef]
- Asumani, O.M.L.; Reid, R.G.; Paskaramoorthy, R. The Effects of Alkali-Silane Treatment on the Tensile and Flexural Properties of Short Fibre Non-Woven Kenaf Reinforced Polypropylene Composites. Compos. Part A Appl. Sci. Manuf. 2012, 43, 1431–1440. [Google Scholar] [CrossRef]
- Li, X.; Tabil, L.G.; Panigrahi, S. Chemical Treatments of Natural Fiber for Use in Natural Fiber-Reinforced Composites: A Review. J. Polym. Environ. 2007, 15, 25–33. [Google Scholar] [CrossRef]
- Agrawal, R.; Saxena, N.; Sharma, K.; Thomas, S.; Sreekala, M. Activation Energy and Crystallization Kinetics of Untreated and Treated Oil Palm Fibre Reinforced Phenol Formaldehyde Composites. Mater. Sci. Eng. A 2000, 277, 77–82. [Google Scholar] [CrossRef]
- Motru, S.; Adithyakrishna, V.H.; Bharath, J.; Guruprasad, R. Development and Evaluation of Mechanical Properties of Biodegradable PLA/Flax Fiber Green Composite Laminates. Mater. Today Proc. 2020, 24, 641–649. [Google Scholar] [CrossRef]
- Rout, J.; Tripathy, S.S.; Misra, M.; Mohanty, A.K.; Nayak, S.K. The Influence of Fiber Surface Modification on the Mechanical Properties of Coir-Polyester Composites. Polym. Compos. 2001, 22, 468–476. [Google Scholar] [CrossRef]
- Khosravani, M.R.; Berto, F.; Ayatollahi, M.R.; Reinicke, T. Characterization of 3D-Printed PLA Parts with Different Raster Orientations and Printing Speeds. Sci. Rep. 2022, 12, 1016. [Google Scholar] [CrossRef]
- Materials, P.; Materials, E.I.; Matrix, P.; Materials, C.; Specimens, P. Standard Test Method for Tensile Properties of Plastics 1. Open J. Compos. Mater. 2006, 3, 1–15. [Google Scholar] [CrossRef]
- ISO 14125:1998; Fibre-Reinforced Plastic Composites. British Standards Institution: London, UK, 1998.
- Senesathit, S.; Deng, S.; Zhang, S.; Mohammed, Y.; Al Rubaei, A.; Yuan, X.; Wang, T.; Duan, J. Study and Investigate Effects of Cutting Surface in CNC Milling Process for Aluminum Based on Taguchi Design Method. Int. J. Eng. Res. 2019, 8, 288–295. [Google Scholar] [CrossRef]


| Symbol | Control Factor | Level 1 | Level 2 | Level 3 |
|---|---|---|---|---|
| A | Fiber surface treatment | NaOH treatment | No treatment | |
| B | Nozzle temperature | 190 °C | 200 °C | 220 °C |
| C | Number of strands | 10 | 15 | 20 |
| D | Infill density | 25% | 50% | 100% |
| Test Number | A | B | C | D |
|---|---|---|---|---|
| Fiber Surface Treatment | Temperature | Number of Strands | Infill Density | |
| 1 | 1 | 1 | 1 | 1 |
| 2 | 1 | 1 | 2 | 2 |
| 3 | 1 | 1 | 3 | 3 |
| 4 | 1 | 2 | 1 | 1 |
| 5 | 1 | 2 | 2 | 2 |
| 6 | 1 | 2 | 3 | 3 |
| 7 | 1 | 3 | 1 | 2 |
| 8 | 1 | 3 | 2 | 3 |
| 9 | 1 | 3 | 3 | 1 |
| 10 | 2 | 1 | 1 | 3 |
| 11 | 2 | 1 | 2 | 1 |
| 12 | 2 | 1 | 3 | 2 |
| 13 | 2 | 2 | 1 | 2 |
| 14 | 2 | 2 | 2 | 3 |
| 15 | 2 | 2 | 3 | 1 |
| 16 | 2 | 3 | 1 | 3 |
| 17 | 2 | 3 | 2 | 1 |
| 18 | 2 | 3 | 3 | 2 |
| Tensile Test Piece Dimensions [mm] | Flexural Test Piece Dimensions [mm] | ||
|---|---|---|---|
| D | 30 | F | - |
| G | 10 | h | 4 |
| L | 19 | I | 80 |
| L0 | 63 | L | 64 |
| R | 13 | R1 | 10 |
| t | 4 | R2 | 10 |
| W | 4 | ||
| W0 | 10 | ||
| WC | 4 | ||
| Experiment Number | Average Tensile Strength [MPa] | Standard Deviation [MPa] | Average Flexural Strength [MPa] | Standard Deviation [MPa] |
|---|---|---|---|---|
| 1 | 41.99 | 0.72 | 51.04 | 0.78 |
| 2 | 44.02 | 0.52 | 54.13 | 3.38 |
| 3 | 48.25 | 1.59 | 72.59 | 0.79 |
| 4 | 41.99 | 0.49 | 44.32 | 3.96 |
| 5 | 44.01 | 0.70 | 54.22 | 2.79 |
| 6 | 49.96 | 0.89 | 71.86 | 1.13 |
| 7 | 44.55 | 1.02 | 52.80 | 3.52 |
| 8 | 49.16 | 0.88 | 72.94 | 2.09 |
| 9 | 41.86 | 1.09 | 46.71 | 3.68 |
| 10 | 49.55 | 0.68 | 70.97 | 0.50 |
| 11 | 42.11 | 0.50 | 46.30 | 3.81 |
| 12 | 44.41 | 0.59 | 53.57 | 3.05 |
| 13 | 45.03 | 0.83 | 54.08 | 2.85 |
| 14 | 49.25 | 1.02 | 72.13 | 1.71 |
| 15 | 42.69 | 0.54 | 48.89 | 2.75 |
| 16 | 48.85 | 0.65 | 72.41 | 1.69 |
| 17 | 41.09 | 0.48 | 41.78 | 2.75 |
| 18 | 43.26 | 1.37 | 50.97 | 3.82 |
| 19 * | 43.43 | 1.33 | 53.55 | 4.59 |
| Test Number | A | B | C | D | S/Nts Ratio [db] | S/Nfs Ratio [db] |
|---|---|---|---|---|---|---|
| 1 | 1 | 1 | 1 | 1 | 32.46 | 34.15 |
| 2 | 1 | 1 | 2 | 2 | 32.87 | 34.61 |
| 3 | 1 | 1 | 3 | 3 | 33.66 | 37.22 |
| 4 | 1 | 2 | 1 | 1 | 32.46 | 32.84 |
| 5 | 1 | 2 | 2 | 2 | 32.87 | 34.65 |
| 6 | 1 | 2 | 3 | 3 | 33.97 | 37.13 |
| 7 | 1 | 3 | 1 | 2 | 32.97 | 34.39 |
| 8 | 1 | 3 | 2 | 3 | 33.83 | 37.25 |
| 9 | 1 | 3 | 3 | 1 | 32.43 | 33.30 |
| 10 | 2 | 1 | 1 | 3 | 33.90 | 37.02 |
| 11 | 2 | 1 | 2 | 1 | 32.49 | 33.22 |
| 12 | 2 | 1 | 3 | 2 | 32.95 | 34.54 |
| 13 | 2 | 2 | 1 | 2 | 33.07 | 34.63 |
| 14 | 2 | 2 | 2 | 3 | 33.84 | 37.15 |
| 15 | 2 | 2 | 3 | 1 | 32.61 | 33.74 |
| 16 | 2 | 3 | 1 | 3 | 33.78 | 37.19 |
| 17 | 2 | 3 | 2 | 1 | 32.27 | 32.37 |
| 18 | 2 | 3 | 3 | 2 | 32.71 | 34.07 |
| Symbol | Control Factor | Mean S/N Ratio [db] | ||
|---|---|---|---|---|
| Level 1 | Level 2 | Level 3 | ||
| A | Fiber surface treatment | 33.06 | 33.07 | |
| B | Nozzle temperature | 33.05 | 33.14 | 33.00 |
| C | Number of strands | 33.11 | 33.03 | 33.05 |
| D | Infill density | 32.45 | 32.91 | 33.83 |
| Symbol | Control Factor | Mean S/N Ratio [db] | ||
|---|---|---|---|---|
| Level 1 | Level 2 | Level 3 | ||
| A | Fiber surface treatment | 35.06 | 34.88 | |
| B | Nozzle temperature | 35.13 | 35.02 | 34.76 |
| C | Number of strands | 35.04 | 34.88 | 35.00 |
| D | Infill density | 33.27 | 34.48 | 37.16 |
| Source | DF | Adj SS | Adj MS | F-Value | p-Value | Contribution [%] |
|---|---|---|---|---|---|---|
| A | 1 | 0.00 | 0.00 | 0.00 | 0.96 | 0.00% |
| B | 2 | 0.07 | 0.03 | 2.85 | 0.11 | 1.12% |
| C | 2 | 0.01 | 0.01 | 0.57 | 0.58 | 0.22% |
| D | 2 | 5.80 | 2.90 | 245.99 | 0.00 | 96.69% |
| Error | 10 | 0.12 | 0.01 | 1.97% | ||
| Total | 17 | 6.00 | 100.00% |
| Source | DF | Adj SS | Adj MS | F-Value | p-Value | Contribution [%] |
|---|---|---|---|---|---|---|
| A | 1 | 0.14 | 0.14 | 0.88 | 0.37 | 0.29% |
| B | 2 | 0.43 | 0.21 | 1.31 | 0.31 | 0.85% |
| C | 2 | 0.08 | 0.04 | 0.26 | 0.78 | 0.17% |
| D | 2 | 47.52 | 23.76 | 146.00 | 0.00 | 95.42% |
| Error | 10 | 1.63 | 0.16 | 3.27% | ||
| Total | 17 | 49.80 | 100.00% |
Disclaimer/Publisher’s Note: The statements, opinions and data contained in all publications are solely those of the individual author(s) and contributor(s) and not of MDPI and/or the editor(s). MDPI and/or the editor(s) disclaim responsibility for any injury to people or property resulting from any ideas, methods, instructions or products referred to in the content. |
© 2023 by the authors. Licensee MDPI, Basel, Switzerland. This article is an open access article distributed under the terms and conditions of the Creative Commons Attribution (CC BY) license (https://creativecommons.org/licenses/by/4.0/).
Share and Cite
Paulo, A.; Santos, J.; da Rocha, J.; Lima, R.; Ribeiro, J. Mechanical Properties of PLA Specimens Obtained by Additive Manufacturing Process Reinforced with Flax Fibers. J. Compos. Sci. 2023, 7, 27. https://doi.org/10.3390/jcs7010027
Paulo A, Santos J, da Rocha J, Lima R, Ribeiro J. Mechanical Properties of PLA Specimens Obtained by Additive Manufacturing Process Reinforced with Flax Fibers. Journal of Composites Science. 2023; 7(1):27. https://doi.org/10.3390/jcs7010027
Chicago/Turabian StylePaulo, Ana, Jorge Santos, João da Rocha, Rui Lima, and João Ribeiro. 2023. "Mechanical Properties of PLA Specimens Obtained by Additive Manufacturing Process Reinforced with Flax Fibers" Journal of Composites Science 7, no. 1: 27. https://doi.org/10.3390/jcs7010027