Article

A Study on the Structural Features of Amorphous Nanoparticles of Ni by Molecular Dynamics Simulation

1
Faculty of Basic Science, University of Transport Technology, 54 Trieu Khuc, Thanh Xuan, Hanoi 100000, Vietnam
2
Institute of Physics, University of Zielona Góra, Prof. Szafrana 4a, 65-516 Zielona Góra, Poland
3
Faculty of Physics, Hanoi National University of Education, 136 Xuan Thuy, Cau Giay, Hanoi 100000, Vietnam
4
Department of Science Education, Bartın University, Bartın 74100, Turkey
5
The Directorate of Research, Development and Innovation Management (DMCDI), Technical University of Cluj-Napoca, 15 Constantin Daicoviciu Street, 400020 Cluj-Napoca, Romania
*
Author to whom correspondence should be addressed.
J. Compos. Sci. 2022, 6(9), 278; https://doi.org/10.3390/jcs6090278
Submission received: 14 August 2022 / Revised: 7 September 2022 / Accepted: 16 September 2022 / Published: 19 September 2022
(This article belongs to the Special Issue Characterization and Modelling of Composites, Volume III)

Abstract

:
This study deals with the impact of the heating rate (HR), temperature (T), and the number of atoms (N) on the structural features of amorphous nanoparticles (ANPs) of Ni by molecular dynamics simulation (MDS) with the Pak–Doyama pair interaction potential field (PD). The obtained results showed that the structural features of ANPs of Ni are significantly affected by the studied factors. The correlation between the size (D) and the N was determined to be D~N−1/3. The energy (E) was proportional to N−1, and the Ni-Ni link length was 2.55 Å. The glass transition temperature (Tg) derived from the E-T graph was estimated to be 630 K. An increase in the HR induced a change in the shape of the ANPs of Ni. Furthermore, raising the HR caused an enhancement in the D and a decrement in the density of atoms. The obtained results are expected to contribute to future empirical studies.

1. Introduction

Nanoparticles (NPs) are very small particles ranging in size from 1 nm to 100 nm [1,2,3,4]. They exhibit unique and novel chemical and physical properties compared to their bulk materials [4,5,6,7]. Therefore, researchers have focused on new studies to decrease the size of bulk materials to the nanoscale. For this purpose, many theoretical (mean-field theory, etc.), experimental (electrodeposition, etc.), and simulation (molecular dynamics (MD), etc.) methods have been developed to fabricate NPs and nanomaterials and investigate their characteristic properties in detail [2,8,9,10,11]. In particular, the simulation methods have enabled the detailed analysis of the microstructure of ANPs at the atomistic level [12]. Among the simulation methods, MD is widely used to examine the crystallization process of Ni NPs [13]. In the studies, the nucleation and evolution of defects in Fe NPs [14], the separation of Fe crystal from amorphous FeB NPs [15], the local structure of the liquid and amorphous states of Al materials [16], and the effect of amorphous surface layers on the deformation process and mechanical features of Ni NPs [6] have been studied by means of the MDS method. In recent years, ANPs have received great attention for science and technology because of their exceptional properties [6,12,17]. Among them, Ni ANPs have found important applications in a wide variety of scientific and technological areas and functional devices [4,13,17,18,19,20,21,22,23,24].
Therefore, many studies have been focused on the structure of ANPs of Ni materials [25,26]. A study investigated the size (D) dependence of the Curie phase transition temperature (Tc) in Ni NPs using a theoretical model [27]. It was found that increasing the D of the Ni NPs from 24 to 200 nm leads to a gradual enhancement in the Tc from 593 K to 627 K [27]. Studies showed that Tc of Ni NPs is lower than that of bulk Ni (631 K) [27,28], and a nonmetal–metal transition occurs with the increase in the density of Ni atoms [29], revealing a strong size effect. Ni NPs exhibit a large crystalline capacity and a high melting point, which enables them to be used as glucose-detecting electrodes [30]. In the studies, the shape and size of the NPs have been tuned using heterogeneous catalysts [31,32,33,34]. The studies showed that NPs can be obtained in sizes smaller than 3 nm [35,36] and 2 nm [37]. The melting temperature (Tm) of amorphous Ni material is 1728 K [26]. It was reported that Ni nanowires exhibit a much lower Tm compared to the Tm of bulk Ni [38]. In some studies, the correlation between the D and the number of atoms (N) was found to be D~N−1/3 [39,40]. The studies also showed that D is proportional to N−1/3 [38,41,42,43,44,45,46,47], and the Tm is proportional to N−1/3 and D−1 [38,41,42,45,46,47].
It was found that increasing N from 336 to 8007 caused an enhancement in the Tm of the Ni nanoclusters from 980 to 1380 K [41]. It was shown that the Tm is affected not only by the size of the metal nanocrystals but also by their shape and dimension [48]. The glass transition temperature (Tg) for a bulk material is believed to be less than 1/2 Tm, and thus for bulk Ni material it is expected to be around 600 K [41]. The Tg was determined to be 800 K for glassy Ni with N = 4000 atoms using the MDS method [45]. Studies on the structural features of Ni NPs indicated that the closest interconnection distances of bulk Ni, crystallized Ni NPs, and Ni ANPs are 2.43 Å [49], 2.45 Å [40], and 2.52 Å [50], respectively. Considering the structural properties of Ni NPs summarized above and our recent published works on Fe [37,51], Al [52,53], Ag [54], Cu [55], Ni [17,40], and the mechanical properties of Ni nanomaterials [56], the effects of factors on the structural features of Ni ANPs have continued to be examined using the MDS method [57,58]. Based on the previously obtained results, amorphous Ni nanoparticles [40] have been successfully studied by scientists in correlation with the number of atoms, temperature, annealing time on the structure, crystallization process, and crystallization temperature. In addition, in a new study, scientists also examined new influencing factors (such as the heating rate, number of atoms, and temperature) on the characteristics of the structure of amorphous Ni nanoparticles [17,40,50]. The obtained results show that when increasing the heating rate the nanoparticles are broken at the heating rate of 108 K/s, which leads to an increase in the size (D) with small values. The E also decreases with small values and increases suddenly at a heating rate of 108 K/s. Furthermore, when increasing the number of atoms leads to D increasing, E decreases; when there is an increase in the temperature (T), D and r have constant values, E increases, and the glass temperature (Tg) has a value of Tg = 630 K. The obtained results will be the basis for experimental studies on amorphous Ni nanoparticles in the future, with aims to create useful materials for application in life.

2. Method of Calculation

Initially, to model the Ni NPs, the atoms were randomly seeded into a sphere. Then, it was placed the model in the Pak–Doyama pair interaction potential field (PD) with the free boundary condition [15,50,59], in accordance with Equation (1):
U ( r ) = A ( r + B ) 4 + C ( r + D ) 2 + E
where, U(r) represents the interaction potential, r is the distance between atoms, and A, B, C, D, and E are the constants of Ni NPs. The values applied in the model are given in Table 1.
The D values of the NPs were estimated using Equation (2):
ρ = N V D = 2 3 N 4 π ρ 1 3
where, N is the number of NPs and ρ is the density, with ρ = 7.81 g·cm−3.
First, the ANPs of Ni2048, Ni2916, Ni4000, Ni5324, Ni6912, Ni8788 at T = 300 K with a 106 K/s heating rate (HR) were formed. In addition, the time simulation for each simulation step of MDS was 0.46 fs. Then, the HR was increased from 5 × 10⁵ to 108 K/s with the nanoparticle Ni5324 at temperature (T), T = 300 K, and T was raised from 300 to 1100 K with Ni5324 at a constant HR of 106 K/s.
The structural features were examined by the MDS method with the embedded Pak–Doyama potential, which was combined with the Verlet algorithm and the average coordination number (CN), CN = 4 π ρ 0 r 1 g r r 2 dr .
During the simulation, it was applied the heating process based on the laws by Nosé [60], the equation by Hoover [61], and the defined radial distribution function (RDF) [62,63,64,65].
The first peak height of the RDF is g r = n r 4 π r 2 dr ρ 0 , and r shows the first position of the RDF. The n and ρ0 represent the number of atoms and the atomic density, respectively.
The Tg was determined from the correlation between the E and the T. The centrosymmetric parameter [46,66], the bond angle method [67], the bond order method [68], and the approach method for amorphous materials [69] were used to check the accuracy of the obtained data.

3. Results and Discussions

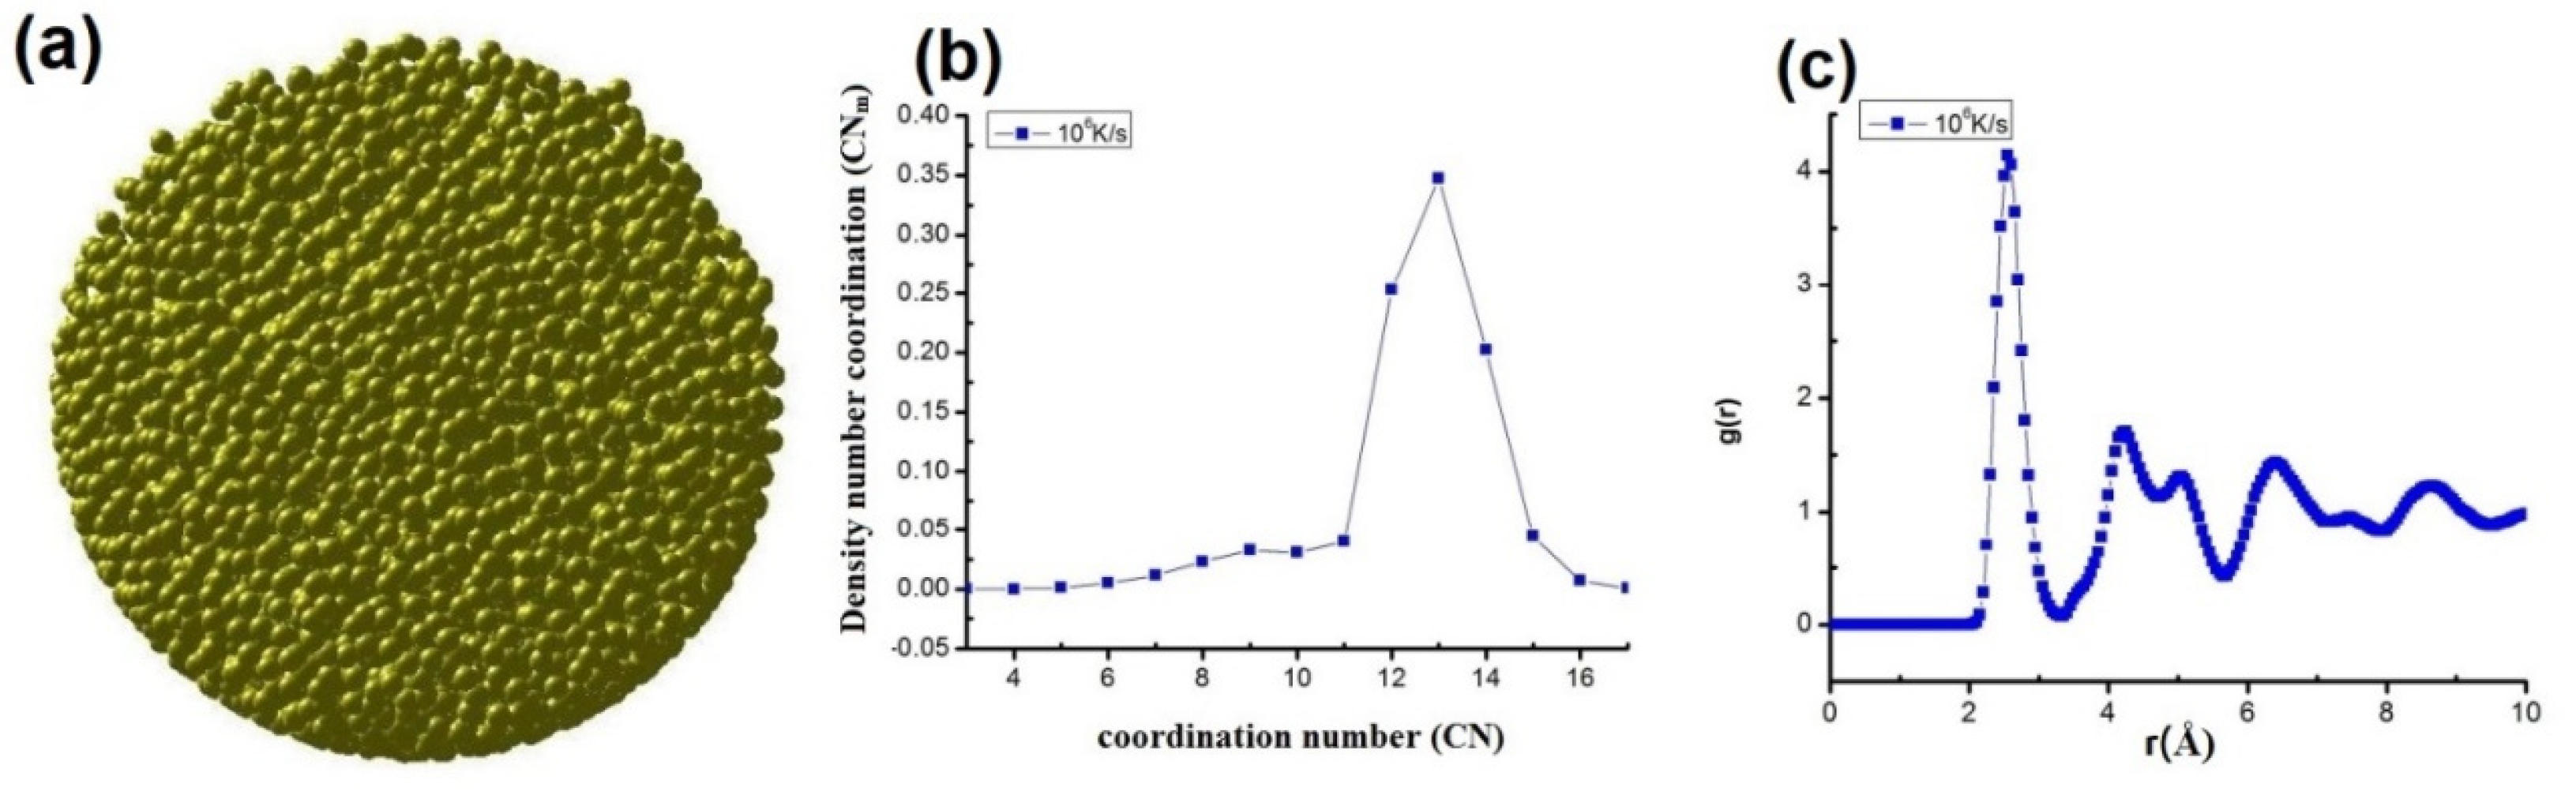
3.1. Structural Characteristic Quantities

To study the specific quantities for the structure of the Ni ANPs, we chose Ni5324 ANPs with a heating rate of 106 K/s at T = 300 K. The obtained results are shown in Figure 1.
The results from Figure 1 show that the shape of the Ni ANPs was spherical, and they were distributed quite uniformly (Figure 1a). The average coordination number (CN) was 13, and the average coordination number density (CNm) was 34.9% (Figure 1b). The link length (r) and the height of the RDF (g(r)) were determined to be 2.55 Å and 3.69 (Figure 1c), respectively. The particle size (D) was 5.023 nm, and the binding energy (E) was −0.684 eV. The obtained r value (2.55 Å) was in full agreement with the r value reported in previous studies (2.52 Å) [50]. Crystalline Ni was reported to have an r value of 2.45 Å [17,40] and 2.43 Å [49], implying that amorphous Ni always has a link length greater than the link length of crystalline Ni. This is a new finding for experimentalists doing research as well as those conducting research on the influencing factors in the following sections.

3.2. Factors Affecting the Structural Characteristic Quantities

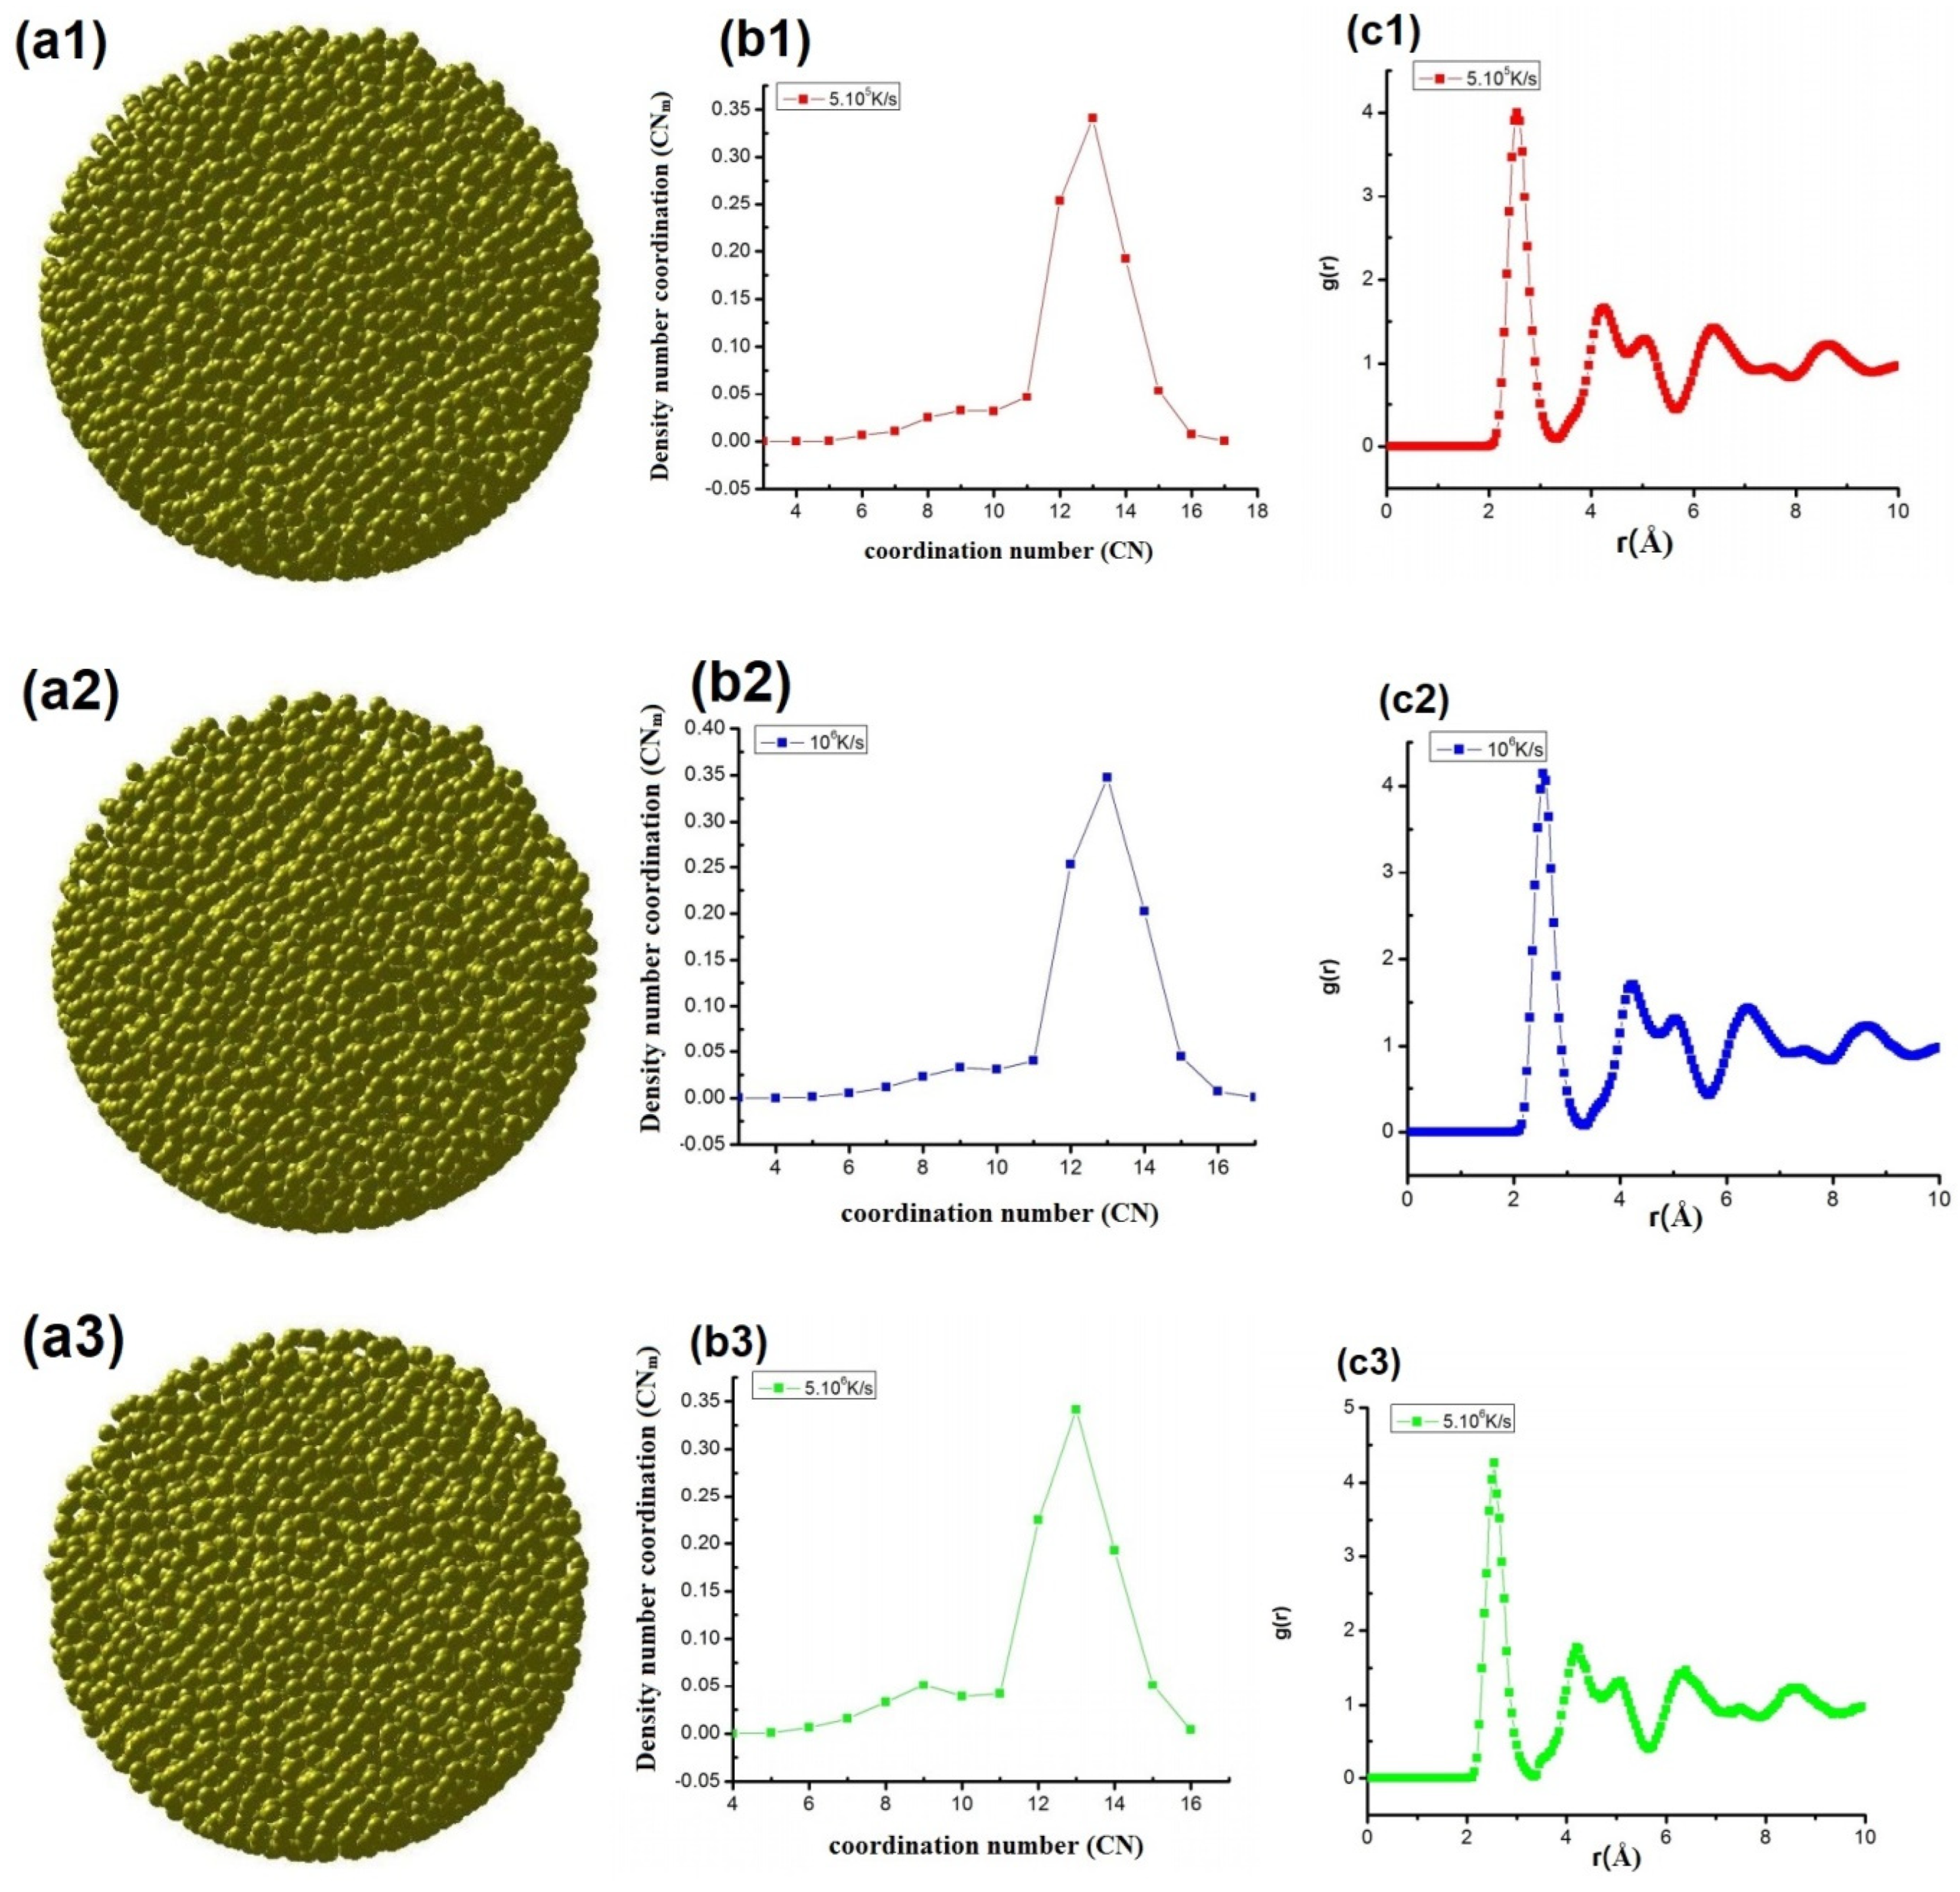
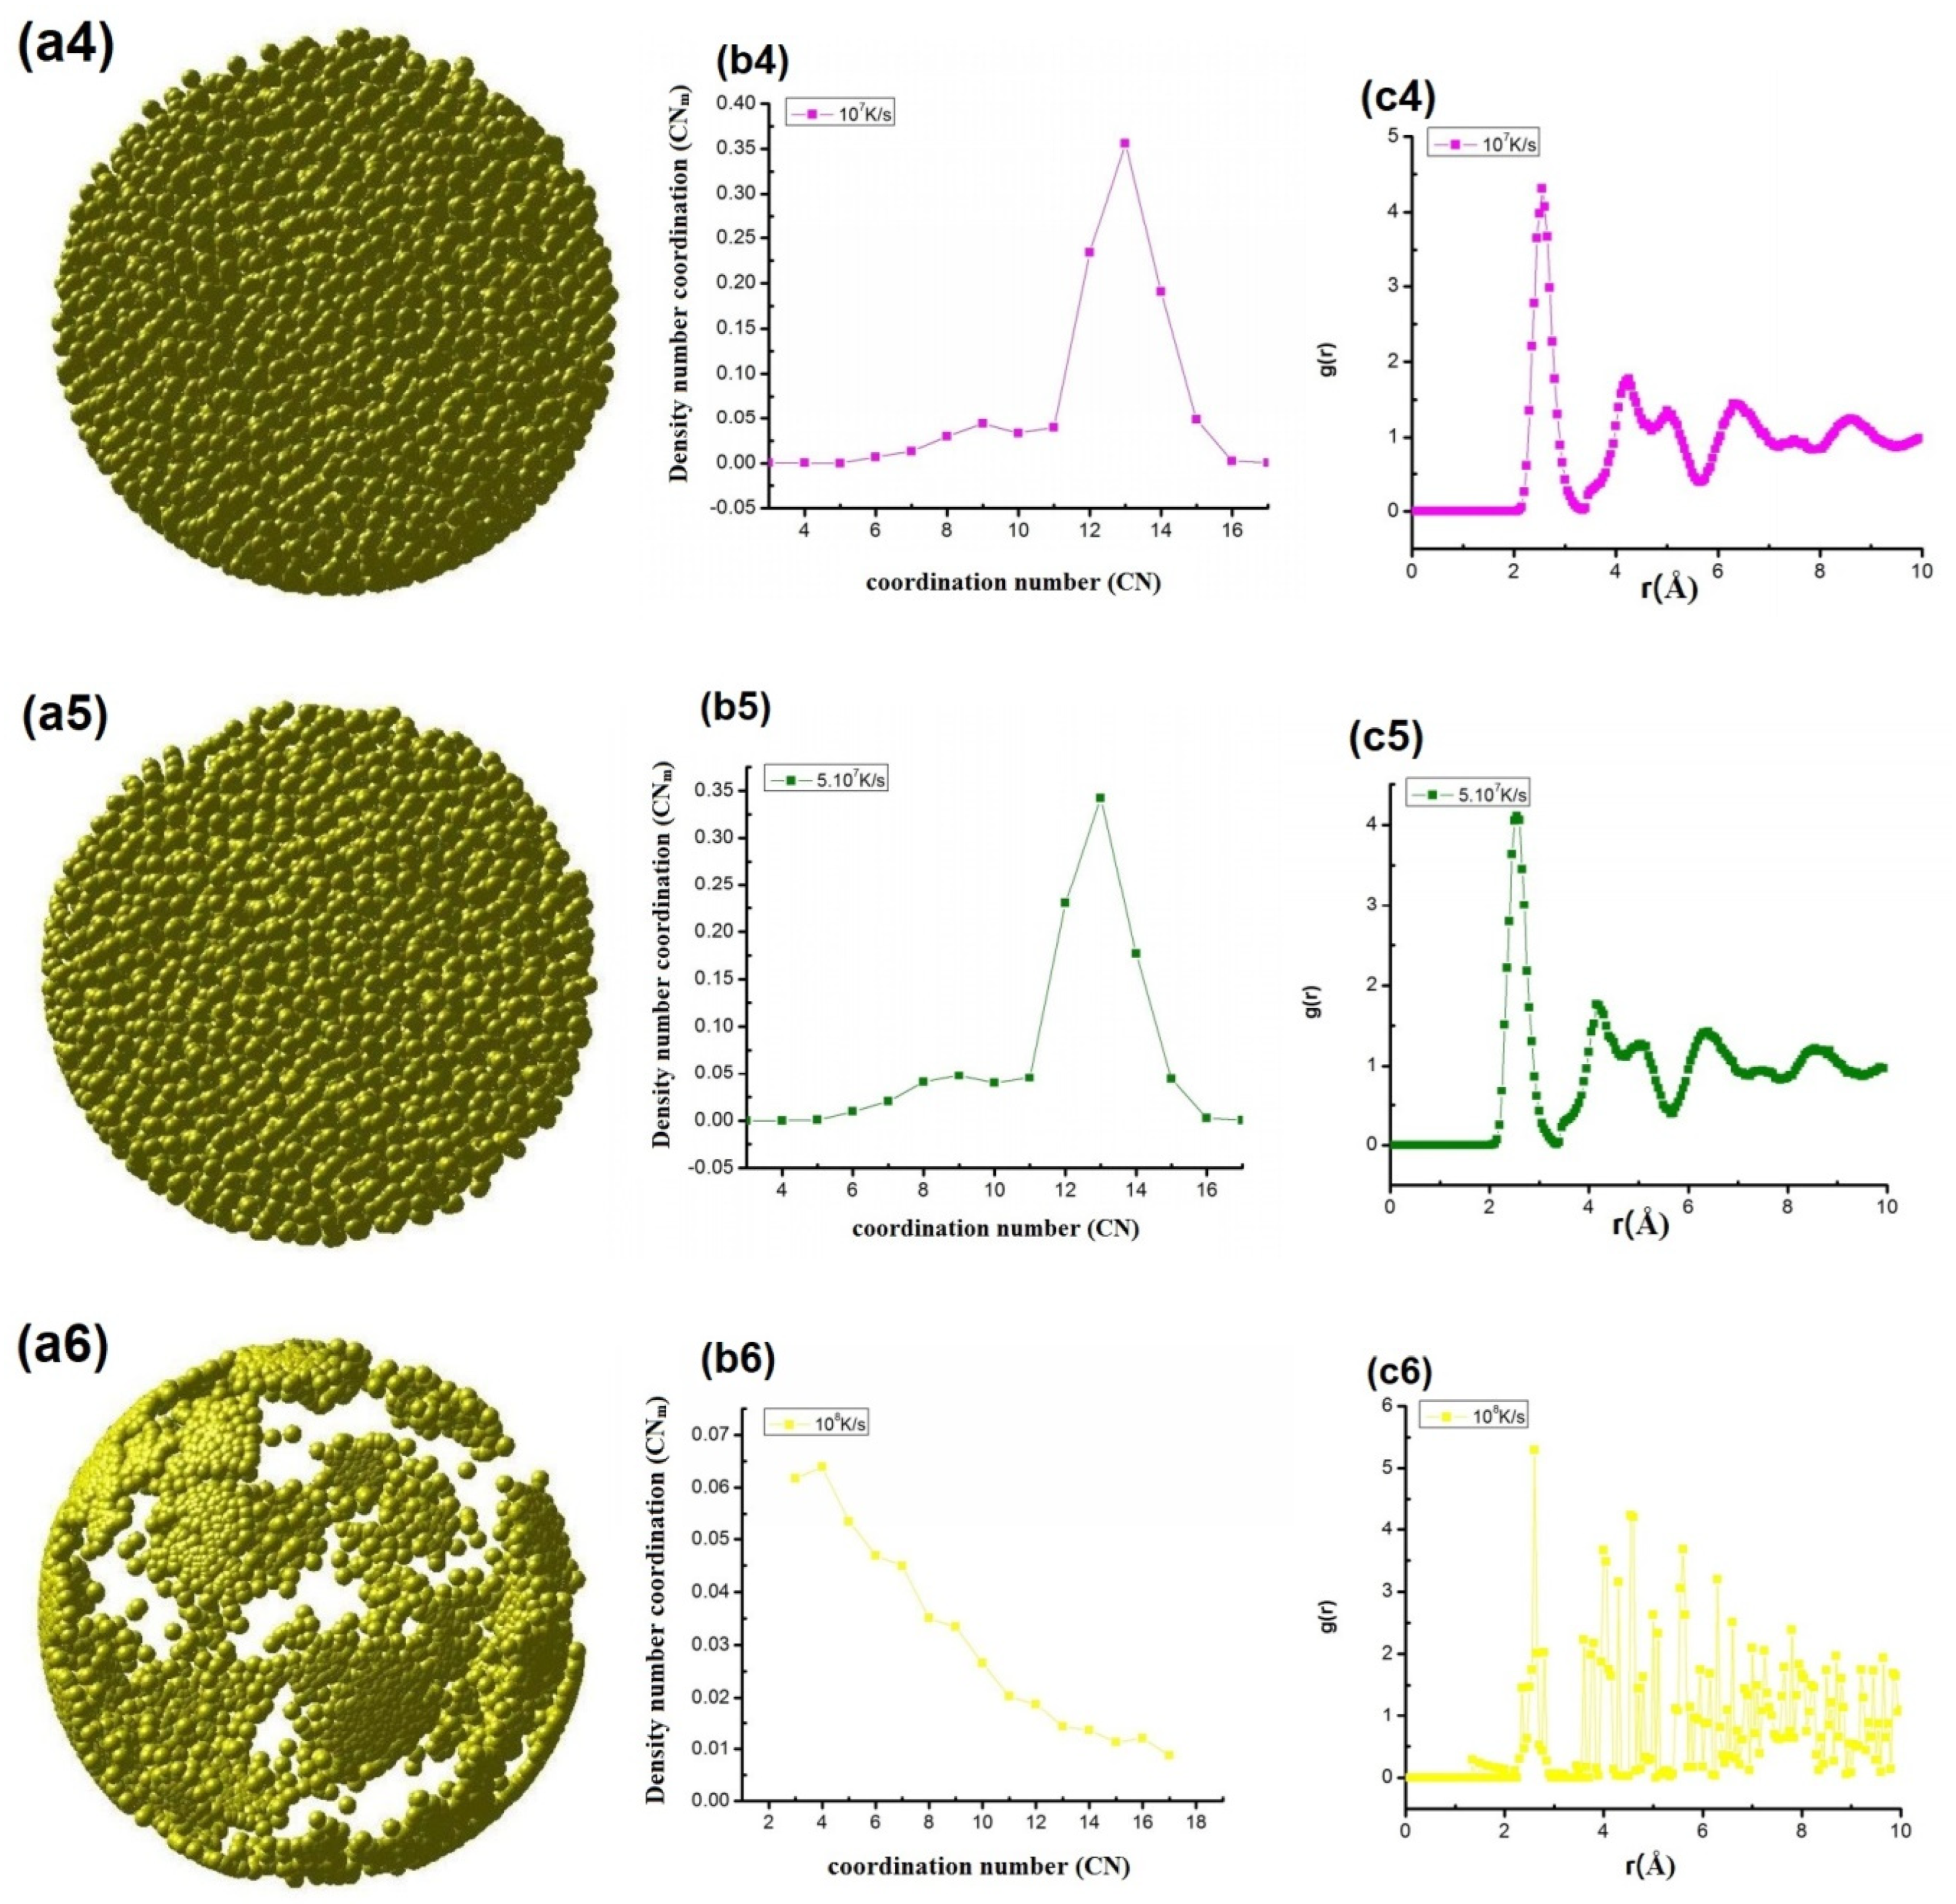
3.2.1. Influence of the Heating Rate
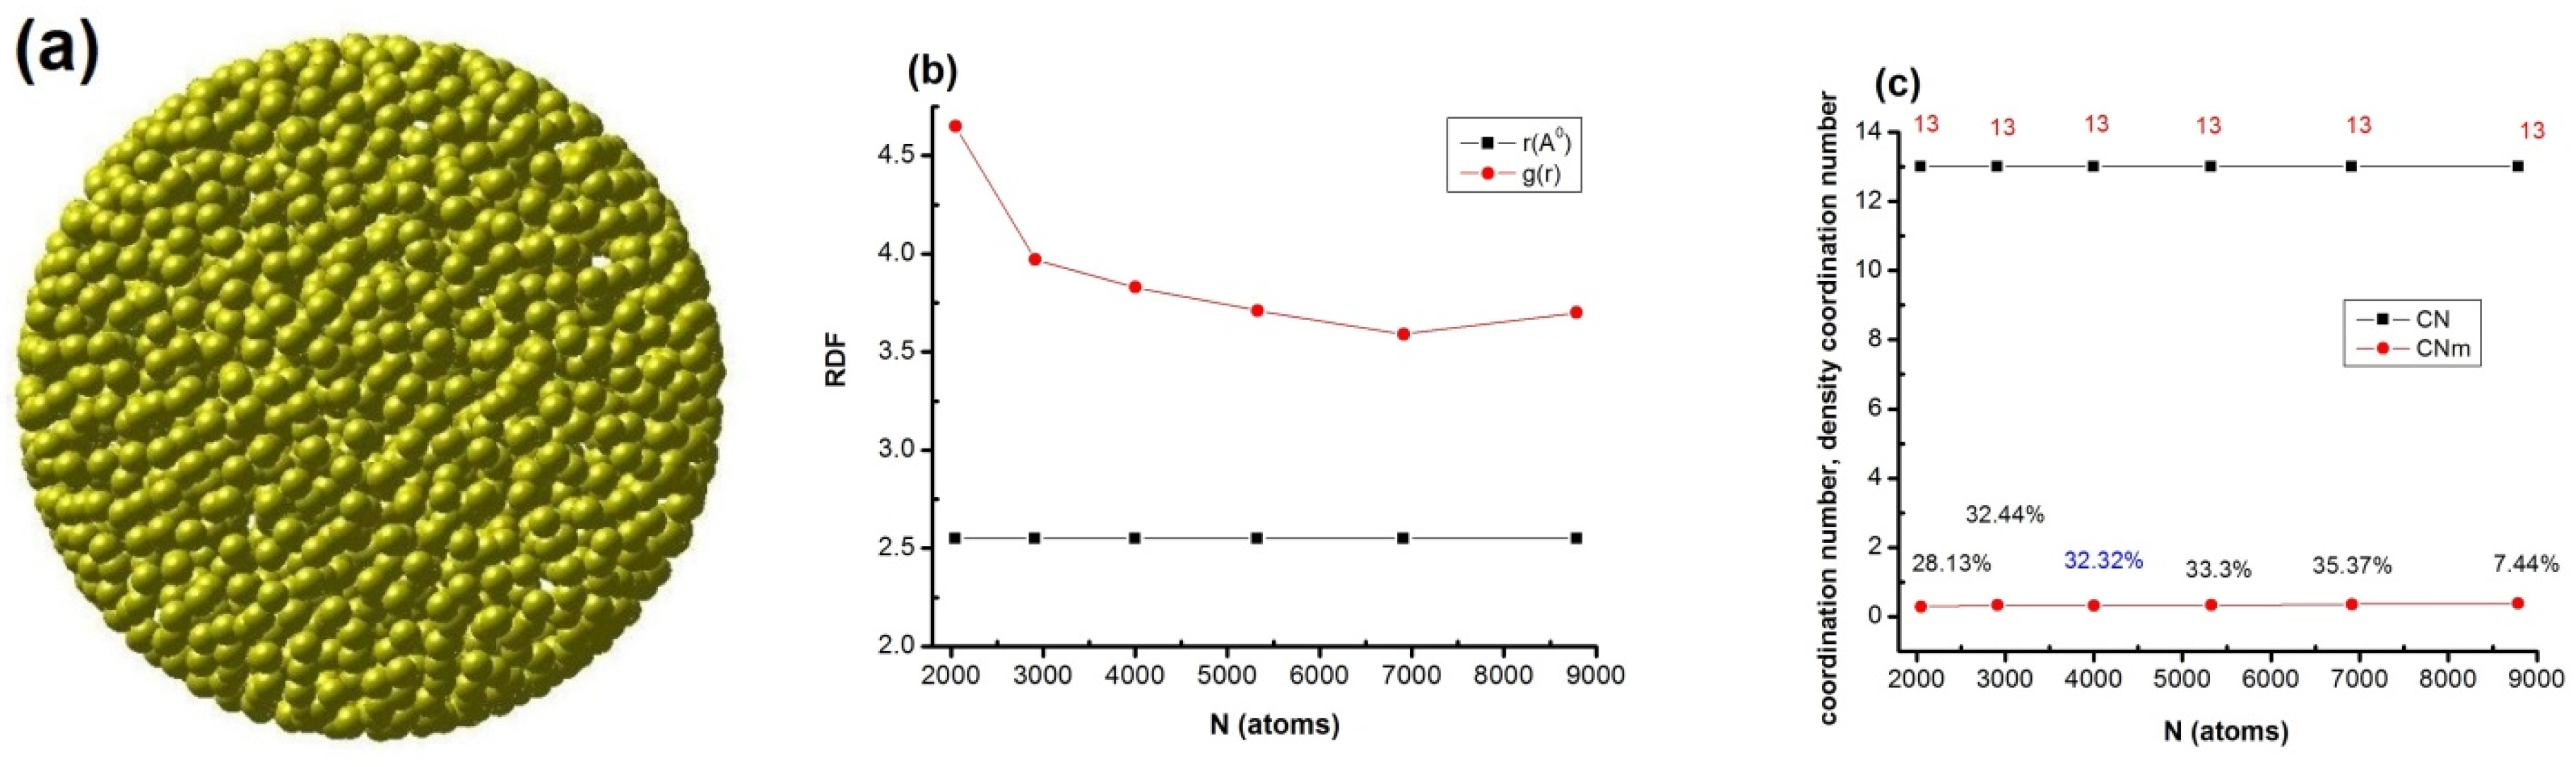
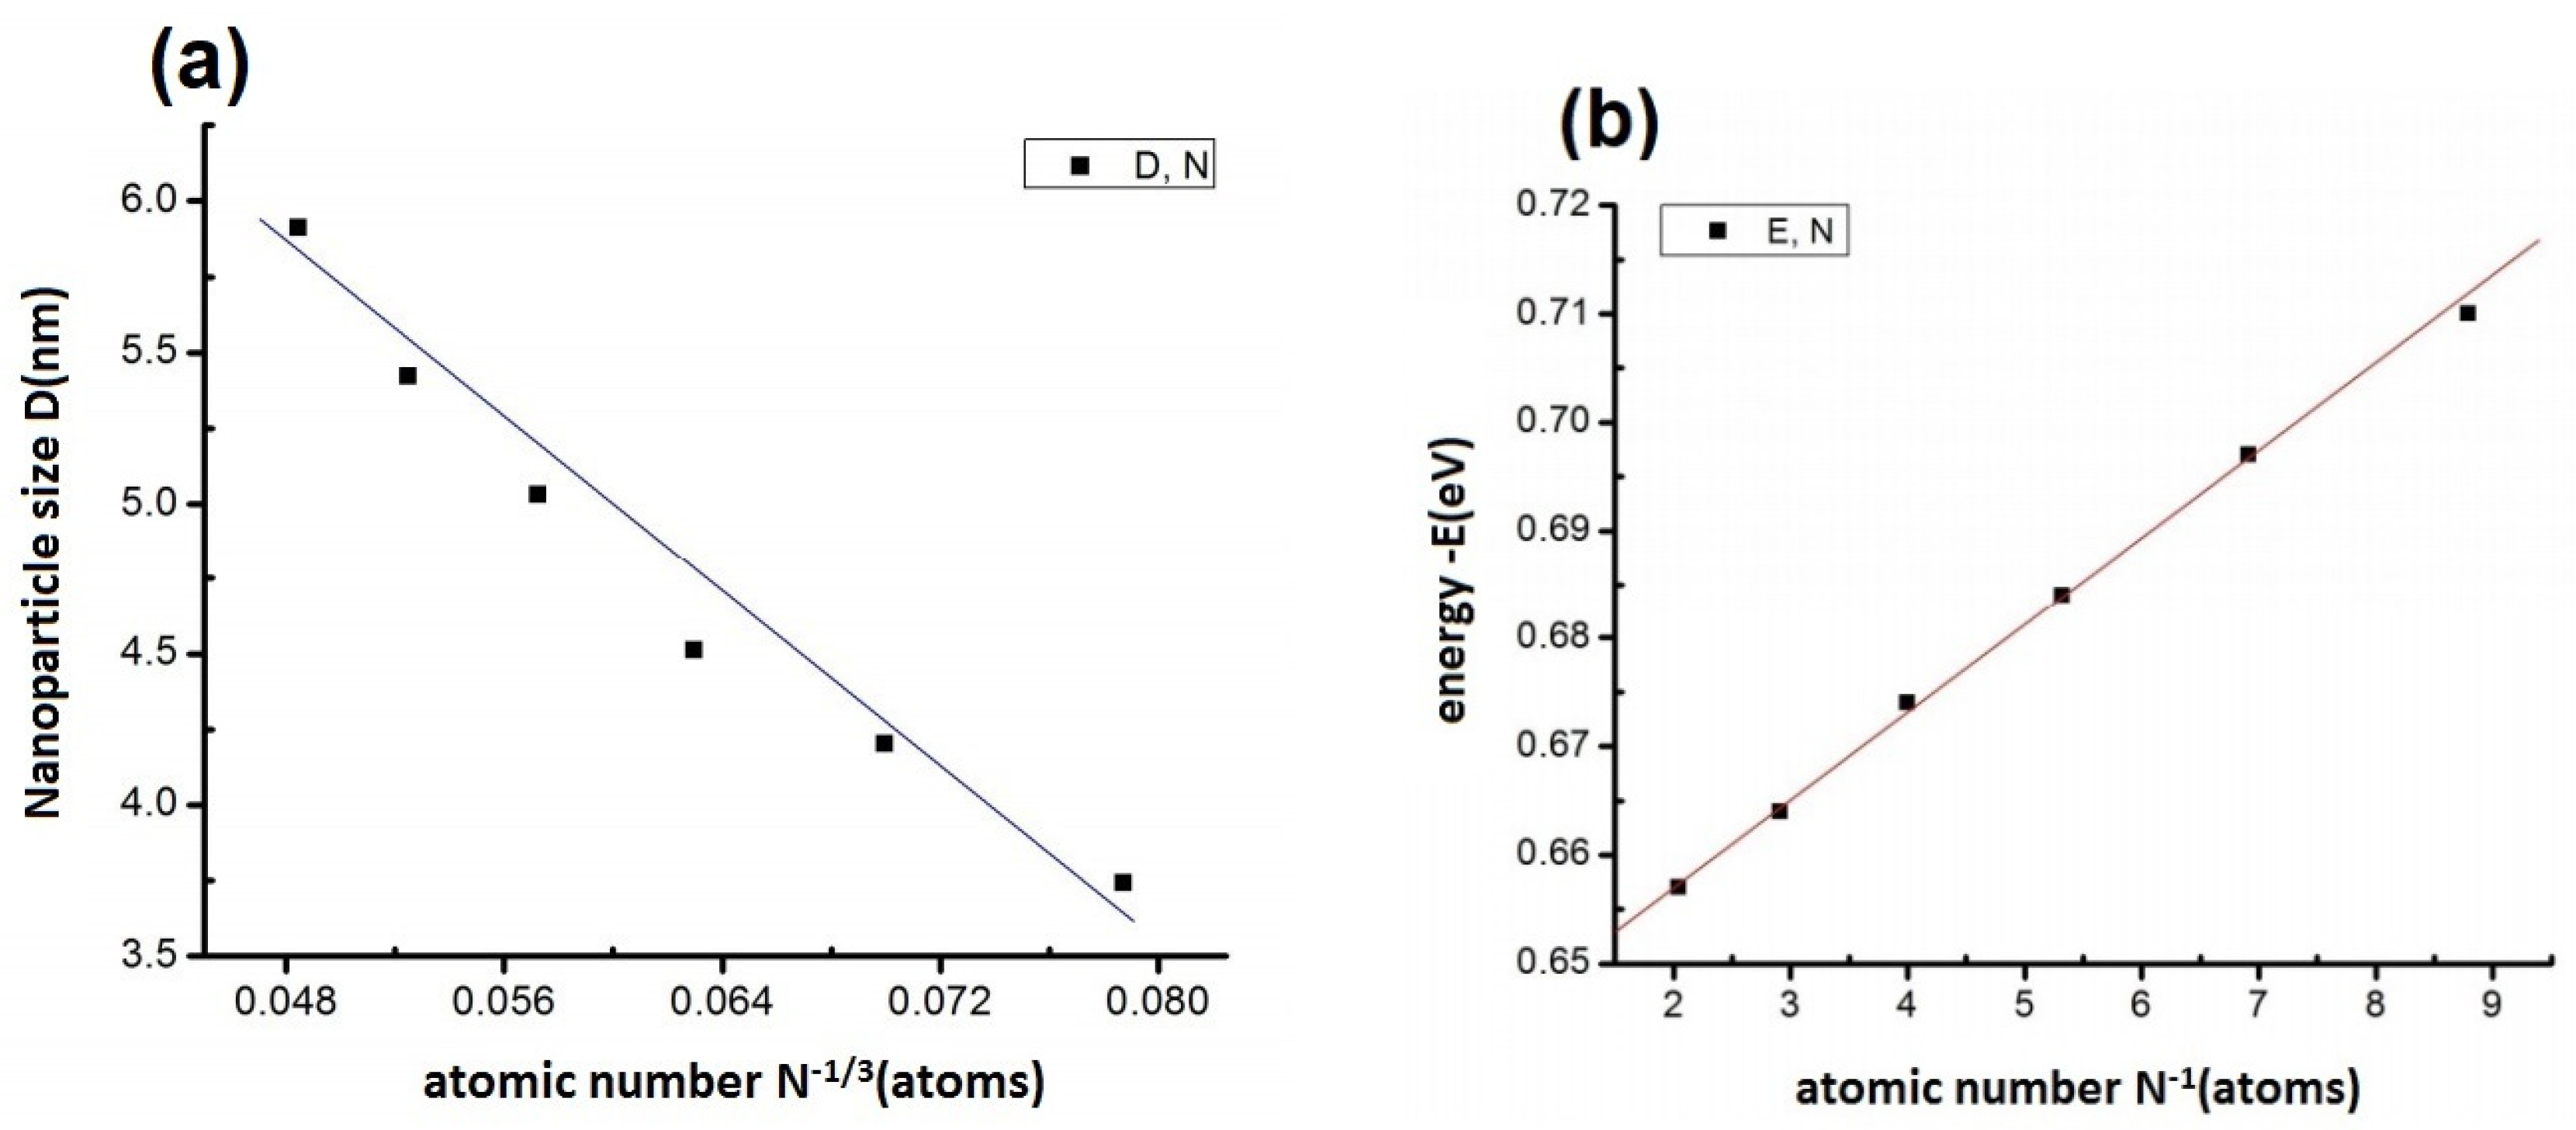
The influence of the HR on the ANPs of Ni5324 is demonstrated in Figure 2, and the obtained results are summarized in Table 2.
The obtained results revealed the shape of the ANPs of Ni5324 at the HR of 5 × 10⁵ K/s to be spherical (Figure 2a1) with D = 5.022 nm and E = −0.695 eV (Table 2). The CN was 13, and the CNm was 33.82% (Figure 2b1). In addition, r was 2.55 Å, and g(r) was 3.69 (Figure 2c1). As clearly seen in Figure 2, raising the HR from 5 × 10⁵ to 108 K/s caused a change in the shape of the ANPs of Ni5324 (Figure 2a1–a6). The CN was 13 and remained constant. However, the CNm changed from 33.82% to 35.6% with the HR (Figure 2b1–b6). The r was r = 2.55 Å. However, the g(r) changed from 3.69 to 5.20 (Figure 2c1–c6). The D value increased from D = 5.022 to 16.04 nm, and the density of the atoms decreased with the increasing HR. When the HR increased from 5 × 10⁵ to 5 × 10⁷ K/s, the value of E increased from E = −0.695 eV to E = −0.615 eV. Finally, at 108 K/s, a sharp increase up to D = 16.04 nm and E = 169.119 eV (more than two orders of magnitude) was recorded (Table 2). The reason is that when the heating rate increased, the transition of the material’s state accelerated (to the heating speed of 108 K/s). The transition of the material’s state does not change in time, leading the structure break (this is also the threshold of the structural phase transition) and causing the atoms to fly out and appear empty in the materials.

3.2.2. Effect of N

The influence of N on the ANPs of Ni2048 is demonstrated in Figure 3.
The obtained results indicated that the shape of the ANPs of Ni2048 was spherical and the atoms were uniformly distributed (Figure 3a). Here, the r was 2.55 Å, g(r) was 4.65; CN was 13, and CNm was 28.13%. An increment in the N from 2048 atoms to 8788 atoms gave rise to a gradual increase in the D from 3.74 to 5.91 nm and a gradual decrease in the E from −0.657 to −0.710 eV. The r was 2.55 Å, which was consistent with the value of the ANPs of Ni obtained by the MDS method (2.52 Å) [50]. The results also revealed that the r value of the ANPs was always higher than that of the bulk material determined by the experimental method (2.43 Å) [49], and it led to a crystallization of Ni material determined by the MDS method (2.45 Å) [40]. This is because the E of the system is smaller in the crystalline or bulk material compared to the amorphous state, such that a decrease in the E of the system causes a decrement in the bonding length. In addition, the g(r) decreased from 4.65 to 3.97, 3.83, 3.71, 3.59, and 3.70 (Figure 3b), and the CNm decreased from 28.13% to 27.44% (Figure 3c) with increasing N values.
This confirms that an increment in the N not only leads to an enhancement in the density of atoms but also the major effect of the D on the structure of the ANPs of Ni. Furthermore, the g(r) reached its maximum point (4.65) when D was 3.74 nm and its minimum point (3.59) when D was 5.42 nm. In addition, as clearly shown in Figure 4, the D increased linearly, while the E decreased linearly with increasing N values.
The correlations between the D and the N and between the E and the N were obtained using the equations of size where D = 9.117 – 69.993·N−1/3 (Figure 4a) and the energy of the Ni nanoparticle is E = 0.748 + 240·N−1 (Figure 4b), respectively, revealing that the size, D, is proportional with N−1/3 and the energy, E, of the Ni nanoparticle is proportional with N−1, respectively, as also reported in former studies [38,39,40,41,42,43,44,45,46,47].
To study the factors affecting the structure of amorphous Ni nanomaterials, we chose Ni5324 amorphous nanomaterials with D = 5.023 nm and E = −0.684 eV for the following steps.

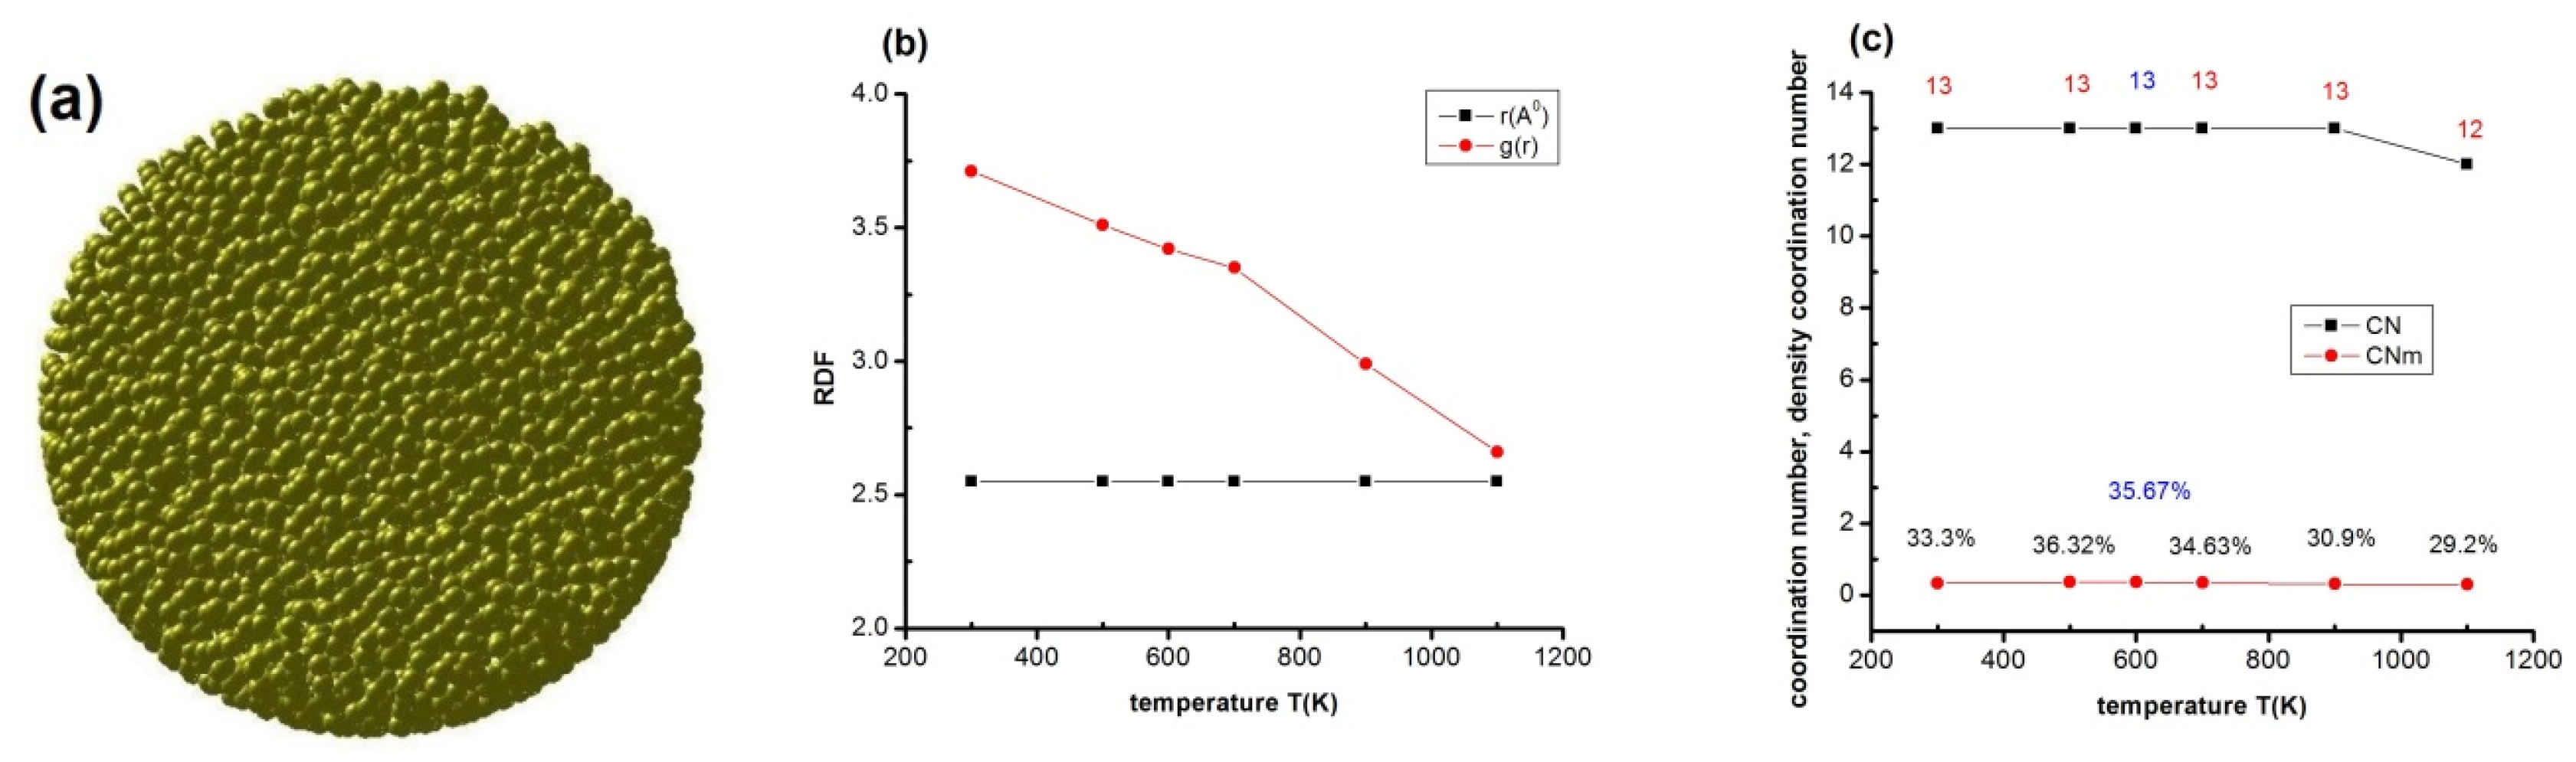
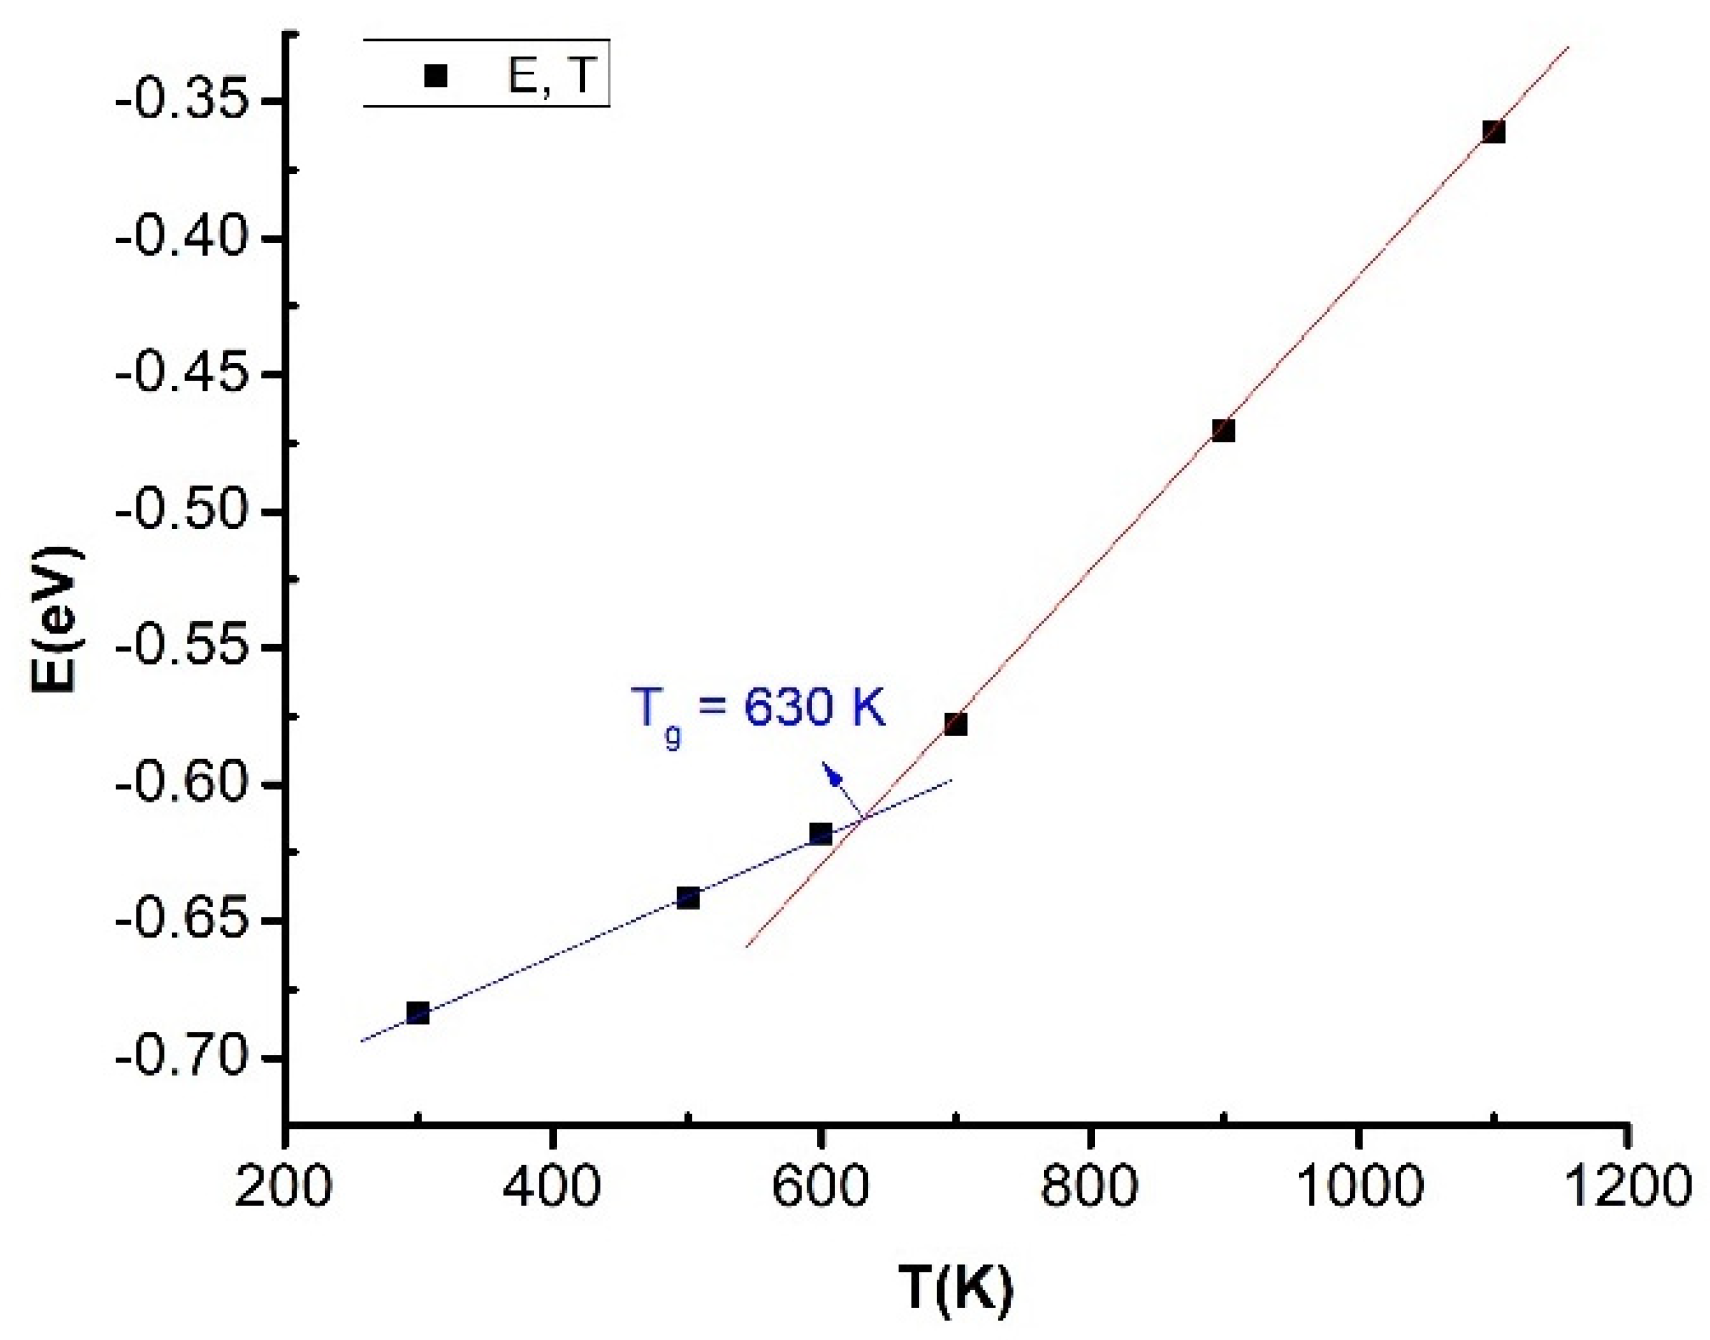
3.2.3. Effect of Temperature

Figure 5 shows the impact of T on the structural features of the ANPs of Ni5324.
The findings showed that the shape of the ANPs of Ni5324 was spherical. D = 5.023 nm and E = −0.684 eV at T = 300 K. The atoms were uniformly distributed (Figure 5a). The r of RDF was 2.55 Å, the g(r) was 3.71, the CN was 13, and the CNm was 33.3% at T = 300 K. D and r had constant values of 5.023 nm and 2.55 Å, respectively. The E value increased gradually from E = −0.684 to E = −0.361 eV, but the g(r) value decreased gradually from 3.71 to 2.66 with the increase in T (Figure 5b). As clearly seen in Figure 5c, the CN was 13 in the range between 300 and 900 K, while it was 12 at 1100 K. The CNm decreased from 33.3% to 29.2% with the increase in T (Figure 5c). This proved that increasing T causes a decrement in the density of atoms.
To determine the Tg value of the ANPs of Ni5324, the dependence of the E on the T was examined (Figure 6).
As distinctly noticed in Figure 6, the E-T graph consists of two regions. It can be seen that, in both regions, there is a linear increase in the E value with increasing T. In the first region, represented by the blue line (300 K < T < 600 K), there is a weak increase in the E value with increasing T. However, in the second region, represented by the red line (T > 700 K), there is a strong increase in the E with increasing T. The red and blue lines intersect each other at T = 630 K, corresponding to E = −0.614 eV. This confirms that the Tg is 630 K, which is consistent with the Tg values reported in previous experimental and simulation studies, where Tg = 631 K [17,27,28]. The results also show that the Tg of the ANPs of Ni (630 K) revealed in this study is smaller than that of Ni NPs in the crystalline state (800 K) [45], indicating that the structure has a significant effect on the Tg of Ni NPs.

4. Conclusions

The effects of factors such as HR, N, and T on Ni ANPs were studied using the MDS method with the Pak–Doyama pair interaction potential field (PD). The investigated factors considerably affected the structural features of the ANPs of Ni. The correlations between D and E and N were determined to be D~N−1/3 and E~N−1. The Tg value of the ANPs of Ni, obtained from the E-T graph, was estimated to be 630 K.
The results are consistent with the Tg values reported in previous experimental and simulation studies, where Tg = 631 K. This Tg value, obtained for the ANPs of Ni (630 K), is lower than that reported for crystalline Ni NPs (800 K), revealing that the structure is one of the key factors for the Tg. The E was proportional to N−1, and the Ni-Ni link length was found to be r = 2.55 Å. This r value, obtained for the ANPs of Ni (2.55 Å), was higher than both r value of experimentally obtained bulk Ni (2.43 Å) and the r value of crystallized Ni material derived using the MDS method (2.45 Å). Concerning the role of the HR on the ANPs of Ni, it was revealed that the increase in the HR from 5 × 10⁵ to 1 × 10⁸ K/s induced not only a change in the shape of the Ni ANPs but also an enhancement in the D and a decrement in the density of atoms. The obtained results are expected to contribute to future empirical studies.

Author Contributions

T.T.Q.: Conceptualization and Writing—original draft. D.N.T.: Conceptualization, Methodology, Conceptualization, Investigation, Validation, Writing—original draft, Writing—review and editing, and Project administration. V.C.L.: Writing—original draft and Formal analysis. U.S.: Writing—original draft and Formal analysis. Ş.Ţ.: Writing—original draft and Writing—review and editing. All authors have read and agreed to the published version of the manuscript.

Funding

This research received no external funding.

Data Availability Statement

The data that support the findings of this study are available from the corresponding author upon reasonable request.

Conflicts of Interest

The authors declare no conflict of interest.

References

  1. Rostovshchikova, T.N.; Shilina, M.I.; Golubina, E.V.; Lokteva, E.S.; Krotova, I.N.; Nikolaev, S.A.; Maslakov, K.I.; Yavsin, D.A. Adsorption and oxidation of carbon monoxide on Au and Ni nanoparticles deposited on Al2O3 by laser electrodispersion. Russ. Chem. Bull. 2015, 64, 812–818. [Google Scholar] [CrossRef]
  2. Chandra, S.; Kumar, A.; Tomar, P.K. Synthesis of Ni nanoparticles and their characterizations. J. Saudi Chem. Soc. 2014, 18, 437–442. [Google Scholar] [CrossRef]
  3. Khan, I.; Saeed, K.; Khan, I. Nanoparticles: Properties, applications and toxicities. Arab. J. Chem. 2019, 12, 908–931. [Google Scholar] [CrossRef]
  4. Ali, A.; Shah, T.; Ullah, R.; Zhou, P.; Guo, M.; Ovais, M.; Tan, Z.; Rui, Y. Review on recent progress in magnetic nanoparticles: Synthesis, characterization, and diverse applications. Front. Chem. 2021, 9, 629054. [Google Scholar] [CrossRef]
  5. Gatin, A.K.; Grishin, M.V.; Gurevich, S.A.; Dokhlikova, N.V.; Kirsankin, A.A.; Kozhevin, V.M.; Lokteva, E.S.; Rostovshchikova, T.N.; Sarvadii, S.Y.; Shub, B.R.; et al. Interaction of amorphous and crystalline nickel nanoparticles with hydrogen. Russ. Chem. Bull. 2015, 64, 2337–2343. [Google Scholar] [CrossRef]
  6. Goryaeva, A.M.; Fusco, C.; Bugnet, M.; Amodeo, J. Influence of an amorphous surface layer on the mechanical properties of metallic nanoparticles under c ompression. Phys. Rev. Mater. 2019, 3, 033606. [Google Scholar] [CrossRef]
  7. Huang, C.; Chen, X.; Xue, Z.; Wang, T. Effect of structure: A new insight into nanoparticle assemblies from inanimate to animate. Sci. Adv. 2020, 6, eaba1321. [Google Scholar] [CrossRef]
  8. Jiang, W.; Guan, H.Y.; Wang, Z.; Guo, A.B. Nanoparticle with a ferrimagnetic interlayer coupling in the presence of single ion anisotropis. Phys. B Condens. Matter 2012, 407, 378–383. [Google Scholar] [CrossRef]
  9. Yüksel, Y.; Aydıner, E.; Polat, H. Thermal and magnetic properties of a ferrimagnetic nanoparticle with spin-3/2 core and spin-1 shell structure. J. Magn. Magn. Mater. 2011, 323, 3168–3175. [Google Scholar] [CrossRef]
  10. Ţălu, Ş.; Bramowicz, M.; Kulesza, S.; Dalouji, V.; Solaymani, S.; Valedbagi, S. Fractal features of carbon–nickel composite thin flms. Microsc. Res. Tech. 2016, 79, 1208–1213. [Google Scholar] [CrossRef]
  11. Ţălu, Ş.; Bramowicz, M.; Kulesza, S.; Dalouji, V.; Ilkhani, M.; Ghaderi, A.; Solaymani, S. Infuence of annealing process on surface micromorphology of carbon–nickel composite thin flms. Opt. Quantum Electron. 2017, 49, 204. [Google Scholar] [CrossRef]
  12. Hoang, V.V.; Ganguli, D. Amorphous nanoparticles—Experiments and computer simulations. Phys. Rep. 2012, 518, 81–140. [Google Scholar] [CrossRef]
  13. Amodeo, J.; Lizoul, K. Mechanical properties and dislocation nucleation in nanocrystals with blunt edges. Mater. Des. 2017, 135, 223–231. [Google Scholar] [CrossRef]
  14. Han, W.Z.; Huang, L.; Ogata, S.; Kimizuka, H.; Yang, Z.C.; Weinberger, C.; Li, Q.J.; Liu, B.Y.; Zhang, X.X.; Li, J.; et al. From “smaller is stronger” to “size-independent strength plateau”: Towards measuring the ideal strength of iron. Adv. Mater. 2015, 27, 3385–3390. [Google Scholar] [CrossRef]
  15. Huu, K.P.; Thuy, T.G.T.; Khac, H.P. The study of separation of crystal Fe and morphology for FeB nanoparticle: Molecular dynamics simulation. AIP Adv. 2017, 7, 045301. [Google Scholar] [CrossRef]
  16. Trady, S.; Hasnaoui, A.; Mazroui, M.; Saadouni, K. Local atomic structures of single-component metallic glasses. Eur. Phys. J. B 2016, 89, 223. [Google Scholar] [CrossRef]
  17. Minh, H.D.T.; Coman, G.; Quang, H.N.; Dung, N.T. Influence of heating rate, temperature, pressure on the structure, and phase transition of amorphous Ni material: A molecular dynamics study. Heliyon 2020, 6, e05548. [Google Scholar] [CrossRef]
  18. Ţălu, Ş.; Bramowicz, M.; Kulesza, S.; Ghaderi, A.; Dalouji, V.; Solaymani, S.; Fathikenari, M.; Ghoranneviss, M. Fractal features and surface micromorphology of diamond nanocrystals. J. Microsc. 2016, 264, 143–152. [Google Scholar] [CrossRef]
  19. Mahdavi, S. Nano-TiO2 modifed with natural and chemical compounds as efcient adsorbents for the removal of Cd+2, Cu+2, and Ni+2 from water. Clean Technol. Environ. Policy 2016, 18, 81–94. [Google Scholar] [CrossRef]
  20. Dalouji, V.; Solaymani, S.; Rezaee, S.; Mehrparvar, D. Nonmetal-metal transition in carbon films embed-ded by Ni nanoparticles: The temperature coefcient of resistivity (TCR), Raman spectra and surface morphology. Optik 2018, 156, 338–345. [Google Scholar] [CrossRef]
  21. Yurino, T.; Ueda, Y.; Shimizu, Y.; Tanaka, S.; Nishiyama, H.; Tsurugi, H.; Sato, K.; Mashima, K. Salt-Free Reduction of Nonprecious Transition—Metal Compounds: Generation of Amorphous Ni Nanoparticles for Catalytic C–C Bond Formation. Angew. Chem. Int. Ed. 2015, 54, 14437–14441. [Google Scholar] [CrossRef] [PubMed]
  22. Ruan, Y.; Wang, C.; Jiang, J. Nanostructured Ni compounds as electrode materials towards high-performance electrochemical capacitors. J. Mater. Chem. A 2016, 4, 14509–14538. [Google Scholar] [CrossRef]
  23. Xu, R.; Xie, T.; Zhao, Y.; Li, Y. Quasi-homogeneous catalytic hydrogenation over monodisperse nickel and cobalt nanoparticles. Nanotechnology 2007, 18, 055602. [Google Scholar] [CrossRef]
  24. Wang, D.P.; Sun, D.B.; Yu, H.Y.; Qiu, Z.G.; Meng, H.M. Preparation of one-dimensional nickel nanowires by self-assembly process. Mater. Chem. Phys. 2009, 113, 227–232. [Google Scholar] [CrossRef]
  25. Trady, S.; Mazroui, M.; Hasnaoui, A.; Saadouni, K. Molecular dynamics study of atomic-level structure in monatomic metallic glass. J. Non-Cryst. Solids 2016, 443, 136–142. [Google Scholar] [CrossRef]
  26. Fedorchenko, A.I. On the glass transition of the one-component metallic melts. J. Cryst. Growth. 2017, 475, 362–367. [Google Scholar] [CrossRef]
  27. He, X.; Shi, H. Size and shape effects on magnetic properties of Amorphous Ni nanoparticles. Particuology 2012, 10, 497–502. [Google Scholar] [CrossRef]
  28. Sun, C.Q.; Zhong, W.H.; Li, S.; Tay, B.K.; Bai, H.L.; Jiang, E.Y. Coordination imperfection suppressed phase stability of ferromagnetic, ferroelectric, and superconductive nanosolids. J. Phys. Chem. B 2004, 108, 1080–1084. [Google Scholar] [CrossRef]
  29. Asareh, N.; Dalouji, V.; Solaymani, S.; Rezaee, S. Relation between carriers hopping rate and structural constants in amorphous carbon nickel flms with diferent nickel nanoparticles distributions. Opt. Quantum Electron. 2019, 51, 373. [Google Scholar] [CrossRef]
  30. Peng, Y.; Chen, Q.; Xie, J.; Lan, W. Communication-Facile Synthesis of Amorphous Nickel Boride Nanoparticles for Highly Sensitive Non-Enzyme Glucose Detection. J. Electrochem. Soc. 2019, 166, B521–B523. [Google Scholar] [CrossRef]
  31. Cargnello, M. Colloidal Nanocrystals as Building Blocks for Well-Defined Heterogeneous Catalysts. Chem. Mater. 2019, 31, 576–596. [Google Scholar] [CrossRef]
  32. Vogt, C.; Groeneveld, E.; Kamsma, G.; Nachtegaal, M.; Lu, L.; Kiely, C.J.; Berben, P.H.; Meirer, F.; Weckhuysen, B.M. Unravelling structure sensitivity in CO2 hydrogenation over nickel. Nat. Catal. 2018, 1, 127–134. [Google Scholar] [CrossRef]
  33. Gao, J.; Liu, Q.; Gu, F.; Liu, B.; Zhong, Z.; Su, F. Recent advances in methanation catalysts for the production of synthetic natural gas. RSC Adv. 2015, 5, 22759–22776. [Google Scholar] [CrossRef]
  34. Zacharaki, E.; Beato, P.; Tiruvalam, R.R.; Andersson, K.J.; Fjellvåg, H.; Sjåstad, A.O. From Colloidal Monodisperse Nickel Nanoparticles to Well-Defined Ni/Al2O3 Model Catalysts. Langmuir 2017, 33, 9836–9843. [Google Scholar] [CrossRef]
  35. Li, Y.; Wen, J.; Ali, A.M.; Duan, M.; Zhu, W.; Zhang, H.; Chen, C.; Li, Y. Size structure–catalytic performance correlation of supported Ni/MCF-17 catalysts for COx-free hydrogen production. Chem. Commun. 2018, 54, 6364–6367. [Google Scholar] [CrossRef]
  36. Laprune, D.; Tuel, A.; Farrusseng, D.; Meunier, F.C. Highly dispersed nickel particles encapsulated in multi-hollow silicalite-1 single crystal nanoboxes: Effects of siliceous deposits and phosphorous species on the catalytic performances. ChemCatChem 2017, 9, 2297–2307. [Google Scholar] [CrossRef]
  37. Goodarzi, F.; Kang, L.; Wang, F.R.; Joensen, F.; Kegnaes, S.; Mielby, J. Methanation of Carbon Dioxide over Zeolite-Encapsulated Nickel Nanoparticles. ChemCatChem 2018, 10, 1566–1570. [Google Scholar] [CrossRef]
  38. Wen, Y.H.; Zhu, Z.Z.; Zhu, R.; Shao, G.F. Size effects on the melting of nickel nanowires: A molecular dynamics study. Phys. E 2004, 25, 47–54. [Google Scholar] [CrossRef]
  39. Kien, P.H.; Lan, M.T.; Dung, N.T.; Hung, P.K. Annealing study of amorphous bulk and nanoparticle iron using molecular dynamics simulation. Int. J. Mod. Phys. B 2014, 28, 1450155. [Google Scholar] [CrossRef]
  40. Nguyen, T.N.; Nguyen, C.C.; Tran, V.H. Molecular dynamics study of microscopic structures, phase transitions and dynamic crystallization in Amorphous Ni nanoparticles. RSC Adv. 2017, 7, 25406–25413. [Google Scholar] [CrossRef] [Green Version]
  41. Qi, Y.; Çağin, T.; Johnson, W.L.; Goddard, W.A., III. Melting and crystallization in Ni nanoclusters: The mesoscale regime. J. Chem. Phys. 2001, 115, 385–394. [Google Scholar] [CrossRef]
  42. Andriotis, A.N.; Fthenakis, Z.G.; Menon, M. Correlated variation of melting and Curie temperatures of nickel clusters. Phys. Rev. B 2007, 75, 073413. [Google Scholar] [CrossRef]
  43. Dung, N.T. Influence of impurity concentration, atomic number, temperature and tempering time on microstructure and phase transformation of Ni1-xFex (x = 0.1, 0.3, 0.5) nanoparticles. Mod. Phys. Lett. B 2018, 32, 1850204. [Google Scholar] [CrossRef]
  44. Tuan, T.Q.; Dung, N.T. Effect of heating rate, impurity concentration of Cu, atomic number, temperatures, time annealing temperature on the structure, crystallization temperature and crystallization process of Ni1−xCux bulk; x = 0.1, 0.3, 0.5, 0.7. Int. J. Mod. Phys. B 2018, 32, 1830009. [Google Scholar] [CrossRef]
  45. Zhang, Y.; Wang, L.; Wang, W. Thermodynamic, dynamic and structural relaxation in supercooled liquid and glassy Ni below the critical temperature. J. Phys. Cond. Matter. 2007, 19, 196106. [Google Scholar] [CrossRef]
  46. Kelchner, C.L.; Plimpton, S.J.; Hamilton, J.C. Dislocation nucleation and defect structure during surface indentation. Phys. Rev. B 1998, 58, 11085–11088. [Google Scholar] [CrossRef]
  47. Tian, C.S.; Qian, D.; Wu, D.; He, R.H.; Wu, Y.Z.; Tang, W.X.; Yin, L.F.; Shi, Y.S.; Dong, G.S.; Jin, X.F.; et al. Body-Centered-Cubic Ni and Its Magnetic Properties. Phys. Rev. Lett. 2005, 94, 137210. [Google Scholar] [CrossRef]
  48. Lu, H.M.; Li, P.Y.; Cao, Z.H.; Meng, X.K. Size, shape, and dimensionality-dependent melting temperatures of nanocrystals. J. Phys. Chem. C 2009, 113, 7598–7602. [Google Scholar] [CrossRef]
  49. Ichikawa, T. Electron diffraction study of the local atomic arrangement in amorphous Iron and Nickel films. Phys. Status Solidi A 1973, 19, 707–716. [Google Scholar] [CrossRef]
  50. Kien, P.H. Study of structural transition of nickel metal under temperature. Ph. Transit. 2016, 90, 732–741. [Google Scholar]
  51. Dung, N.T.; Van, C.L. Effects of number of atoms, shell thickness, and temperature on the structure of Fe nanoparticles amorphous by molecular dynamics method. Adv. Civ. Eng. 2021, 2021, 9976633. [Google Scholar]
  52. Quoc, T.T.; Trong, D.N. Molecular dynamics factors affecting on the structure, phase transition of Al bulk. Phys. B Condens. Matter 2019, 570, 116–121. [Google Scholar] [CrossRef]
  53. Trong, D.N.; Tri, P.N. Understanding the heterogeneous kinetics of Al nanoparticles by simulations method. J. Mol. Struct. 2020, 1218, 128498. [Google Scholar] [CrossRef]
  54. Dung, N.T.; Cuong, N.C.; Van, D.Q.; Tuan, T.Q. Study the effects of factors on the structure and phase transition of bulk Ag by molecular dynamics method. Int. J. Comput. Mater. Sci. Eng. 2020, 09, 2050016. [Google Scholar]
  55. Trong, D.N.; Long, V.C.; Ţălu, Ş. Molecular dynamics simulation of bulk Cu material pseudo-crystallization under various factors. Appl. Sci. 2022, 12, 4437. [Google Scholar] [CrossRef]
  56. Trong, D.N. Z-AXIS deformation method to investigate the influence of system size, structure phase transition on mechanical properties of bulk nickel. Mater. Chem. Phys. 2020, 252, 123275. [Google Scholar] [CrossRef]
  57. Tsuzuki, H.; Branicio, P.S.; Rino, J.P. Structural characterization of deformed crystals by analysis of common atomic neighborhood. Comput. Phys.Commun. 2007, 177, 518–523. [Google Scholar] [CrossRef]
  58. Lu, J.; Szpunar, J.A. Applications of the embedded-atom method to glass formation and crystallization of liquid and glass transition-metal nickel. Philos. Mag. A 1997, 75, 1057–1066. [Google Scholar] [CrossRef]
  59. Yamamoto, R.; Mihara, T.; Taira, K.; Doyama, M. Amorphous structures of iron obtained by quenching of the liquid state. Phys. Lett. A 1979, 70, 41–43. [Google Scholar] [CrossRef]
  60. Nosé, S. A unified formulation of the constant temperature molecular dynamics methods. J. Chem. Phys. 1984, 81, 511–519. [Google Scholar] [CrossRef]
  61. Hoover, W.G. Canonical dynamics: Equilibrium phase-space distributions. Phys. Rev. A 1985, 31, 1695–1697. [Google Scholar] [CrossRef] [PubMed]
  62. Lacks, D.J. First-order amorphous-amorphous transformation in silica. Phys. Rev. Lett. 2000, 84, 4529–4532. [Google Scholar] [CrossRef] [PubMed]
  63. Guitierrez, G.; Johansson, B. Molecular dynamics study of structural properties of amorphous Al2O3. Phys. Rev. B 2002, 65, 104202–104210. [Google Scholar] [CrossRef]
  64. Hoang, V.V. Glass of monatomic Lennard-Jones system at nanoscale. Phys. B Condens. Matter 2010, 405, 1908–1914. [Google Scholar] [CrossRef]
  65. Hoang, V.V.; Odagaki, T.; Engel, M. Cooling rate effects on structure and thermodynamics of amorphous nanoparticles. Appl. Surf. Sci. 2008, 254, 7531–7534. [Google Scholar] [CrossRef]
  66. Li, J. AtomEye: An efficient atomistic configuration viewer. Model. Simul. Mater. Sci. Eng. 2003, 11, 173. [Google Scholar] [CrossRef]
  67. Ackland, G.J.; Jones, A.P. Applications of local crystal structure measures in experiment and simulation. Phys. Rev. B 2006, 73, 054104. [Google Scholar] [CrossRef]
  68. Steinhardt, P.J.; Nelson, D.R.; Ronchetti, M. Bond-Orientational Order in Liquids and Glasses. Phys. Rev. B 1983, 28, 784–805. [Google Scholar] [CrossRef]
  69. Francesco, T.; Arrigo, C. Multi-technique approach to unravel the (dis)order in amorphous materials. ACS Omega 2022, 7, 23255–23264. [Google Scholar]
Figure 1. The shape (a), CNs (b), and RDF (c) of Ni5324 ANPs with heating rate of 106 K/s at T = 300 K.
Jcs 06 00278 g001
Figure 2. The shape (a1a6), CNs (b1b6), and RDF (c1c6) of ANPs of Ni5324 with different HRs.
Jcs 06 00278 g002aJcs 06 00278 g002b
Figure 3. The shape (a), RDF (b), and CN (c) of the ANPs of Ni2048 with respect to the N.
Jcs 06 00278 g003
Figure 4. The correlation between the D and the N (a), and the correlation between the E and the N (b) of amorphous Ni materials with different number of atoms.
Jcs 06 00278 g004
Figure 5. The shape (a), RDF (b), and CN (c) of the ANPs of Ni5324 with respect to T.
Jcs 06 00278 g005
Figure 6. The Tg of the ANPs of Ni5324.
Jcs 06 00278 g006
Table 1. The values of model for the Ni NPs.
ValuesNiValuesNi
A−0.12929D−2.50849
B−1.82709E−0.135705
C1.16473
Table 2. D and E values for ANPs of Ni5324 with different HRs.
HR (K/s)D (nm)E (eV)HR (K/s)D (nm)E (eV)
5 × 1055.022−0.6951075.024−0.659
1065.023−0.6845 × 1075.024−0.615
5 × 1065.023−0.67310816.04169.119
Publisher’s Note: MDPI stays neutral with regard to jurisdictional claims in published maps and institutional affiliations.

