Article

Development of Prediction Models for the Torsion Capacity of Reinforced Concrete Beams Using M5P and Nonlinear Regression Models

1
Department of Civil Engineering, Mazaya University College, Nasiriya City 64001, Iraq
2
Department of Reconstruction and Projects, University of Thi-Qar, Nasiriya City 64001, Iraq
3
Department of Environmental Science, College of Energy and Environmental Science, Alkarkh University of Science, Baghdad 10081, Iraq
4
Department of Civil Engineering and Architecture, University of Beira Interior, 6201-001 Covilhã, Portugal
5
Building and Construction Techniques Engineering Department, Al-Mustaqbal University College, Hillah 51001, Iraq
*
Author to whom correspondence should be addressed.
J. Compos. Sci. 2022, 6(12), 366; https://doi.org/10.3390/jcs6120366
Submission received: 14 September 2022 / Revised: 26 October 2022 / Accepted: 21 November 2022 / Published: 2 December 2022
(This article belongs to the Special Issue Characterization and Modelling of Composites, Volume III)

Abstract

:
Torsional strength is related with one of the most critical failure types for the design and assessment of reinforced concrete (RC) members due to the complexity of the associated stress state and low ductility. Previous studies have shown that reliable methods to predict the torsional strength of RC beams are still needed, namely for over-reinforced and high-strength RC beams. This research aims to offer a novel set of models to predict the torsional strength of RC beams with a wide range of design attributes and geometries by using advanced M5P tree and nonlinear regression models. For this, a broad database with 202 experimental tests is used to generate highly reliable and resilient models. To build the models, three independent variables related with the properties of the RC beams are considered: concrete cross-section area (area enclosed within the outer perimeter of the cross-section), concrete compressive strength, and torsional reinforcement factor (which accounts for the type—longitudinal or transverse—amount, and yielding strength of the torsional reinforcement). In contrast to multiple nonlinear regression approaches, the findings show that the M5P tree approach has the best estimation in terms of both accuracy and safety. Furthermore, M5P model predictions are far more accurate and safer than the most prevalent design equations. Finally, sensitivity and parametric studies are used to confirm the robustness of the presented models.

1. Introduction

In several cases, reinforced concrete (RC) structures incorporate members which need to sustain high torsional loading in their critical cross-sections. These cases include common bridges and building structures, where linear members (beams and columns) might need to suffer high torsional effects due to eccentric loadings. Even if torsional effects are combined with other internal forces, an accurate estimation of the torsional strength is required in the critical zones of the members. This is particularly important in assessment projects.
For practice, structural engineers usually base their calculations on the provisions from standards, namely, for the ultimate limit states. Nowadays, standards for RC structures incorporate design rules for torsion based on semi-empirical equations, which can still fail to accurately estimate the torsional strength of RC beams and even provide unsafe predictions, namely for over-reinforced and high-strength RC members [1,2,3]. As a consequence, in recent years, some structural failures attributed to torsional effects are still reported [4]. Hence, alternative and more accurate models for RC members under torsional loading are still needed.
In the last decades, reliable models which allow us to compute, with accuracy, the strength of RC beams under pure torsion have been proposed. The model, so-called skew-bending, theory was firstly proposed by Hsu in 1968 [5] and further developed [6,7,8]. This model was initially established from the observation of the torsional failure pattern in several experiments with RC rectangular beams with small sizes. However, this model gives rise to less accurate and more complex equations for RC beams with cross-sections with larger aspect ratios, with more complex geometrical cross-sections, and for combined torsion. For these reasons, it has been abandoned by most of the research community. Nevertheless, some few current standards still base their provisions for torsion on the skew-bending theory, such as the Russian Building Code [9].
Nowadays, most of the standards for RC structures (such as the American, Canadian, and European ones [10,11,12,13]) base their provisions for torsion on the space truss analogy, which was firstly proposed by Raush in 1929 [14] and further developed mainly in the second half of last century [15,16,17,18]. This physically more consistent model for RC beams in the cracked stage provides simpler equations to compute the torsional strength for a wide range of geometrical RC cross-sections. However, for practical use, different empirical hypotheses were incorporated in the model for the standards in order to simplify the torsional design. As a consequence, the resulting semi-empirical equations can be somewhat different between standards and, as referred before, they can fail to provide accurate and safe predictions for the torsional strength of RC beams. In the past decades, refined models based on the space truss analogy have been proposed, which allow the strength of RC beams under pure and combined torsion to be predicted with high accuracy [19,20,21,22,23,24]. More advanced analytical models have also been proposed in the literature for RC beams under torsion and combined loadings [25,26]. In addition, nonlinear finite element models have also proved to be very reliable to simulate the behavior of RC beams under torsion until failure [27]. Despite these models having been shown to be very reliable when compared with experimental results, some of them require advanced calculation procedures to be implemented in the computer, sometimes with a lot of programming effort, and others already available in the software can be computationally very demanding. Most of them are not easy for practitioners to use for structural design and assessment.
These drawbacks can be solved by developing accurate Machine Learning (ML)-based models as an alternative to the previously referred ones. Several ML techniques have already taken place in recent years due to innovations in computing and have been applied to successfully predict the strength of RC members, including, but not limited to, punching shear in slabs and shear in beams [28,29,30,31,32]. Among such studies, some of them have already focused on the problem of RC members under torsion [33,34,35,36,37] and also strengthened RC beams with torsional loading [38,39,40]. However, since several ML techniques exist and can be applied to solve problems in the field of structural civil engineering [40], one can state that few studies still exist in the literature for a given problem, such as the one related to RC beams under pure torsion. Hence, more studies are needed to help find the best ML models and strategies for a given problem, in this case, for predicting with accuracy the torsional strength of common RC beams with broad and varying design attributes and geometries. Furthermore, in machine learning model definitions, Artificial Neural Network (ANN) [34,35,37,39,40] and Ensembled Trees [38] are examples of computer-aided machine learning approaches, whereas M5P model tree and multiple non-linear regression (MNLR) are examples of explicit machine learning techniques. The first category is referred to as “black-box approaches”, and this indicates that their paradigms rely on a computer-assisted methodology, while the second category is known as “white-box techniques”, and this implies that they provide clear expressions.
This work’s primary innovation and contribution is the development of two unique explicit correlations which can be used easily to accurately forecast the torsion resistance of RC beams with broad and varying design attributes and geometries. To achieve this, a sample experimental database was used to implement M5P and MLNR models using three input parameters: the cross-section area (the area enclosed within the outer perimeter of the cross-section), the concrete compressive strength, and a reinforcement factor which accounts for the type—longitudinal or transverse—amount, and yielding strength of the torsional reinforcement. The newly proposed models were assessed using statistical and graphical criteria, and their performance was compared to that of earlier design building codes and models. Finally, and in order to assess the degree of contribution of each parameter used to run the models, a sensitivity analysis was also developed.

2. Materials and Methods

2.1. M5P Model Tree Techniques

The model trees approach provides the piecewise linear fit of the class and a structural representation of the data. Although they feature a decision tree in a traditional form, as illustrated in Figure 1, they employ linear functions at the leaves rather than discrete class labels. A model tree is employed to anticipate numerical values. A linear regression model is maintained at each leaf to forecast the class value of instances that will reach the leaf. Model trees provide superior compactness and prediction accuracy over standard regression trees [41]. By using rules and regression equations, they directly define the patterns and correlations that are inherent in the data, whereas other advanced machine learning algorithms, such as ANN (Artificial Neural Network) and SVR (Support Vector Regression), hide them.

2.1.1. The M5 Tree Algorithm

Model trees are effective and precise methods for modeling the relationships and patterns in big datasets, despite being simple [43]. In order to forecast continuous variables, Quinlan [44] created a novel form of tree known as the M5 tree. The regression trees created by CART have values at their leaves, but trees created by M5 can include multivariate linear models. One significant distinction between the M5 regression tree and the CART (Classification and Regression Tree) regression tree is that the M5 tree can include multivariate linear models, whereas the CART tree can have values at its leaves. Predictions by M5 are more adaptable under this circumstance. The three main stages of M5 tree growth are tree building, tree pruning, and tree smoothing, as illustrated in Figure 2. The construction of the M5 tree aims to optimize a parameter known as the standard deviation reduction (SDR). A definition of the SDR is the following one:
S D R = s d T i = 1 n T i T s d T i
where T is the set of cases, T i is the ith subset of cases that result from the tree splitting based on a set of variables (attributes),   s d T is the standard deviation of T , and s d T i is the standard deviation of T i as a measure of error [42].

2.1.2. The M5P Tree Algorithm

The original M5 tree technique was improved by Wang and Witten [45] and was given the name M5P algorithm to handle enumerated attributes and attribute missing values. Each enumerated attribute is converted into a binary variable before the M5P tree algorithm starts building the tree. Traditional decision trees and the nodes’ potential for linear regression functions are combined in M5P. Firstly, a tree is constructed using a decision-tree induction process. Splitting criteria are employed instead of maximizing information gain at each inner node to reduce intra-subset fluctuation in the class values along each branch. If just a small number of instances are left, or the class values of all examples that reach a node differ only slightly, the splitting process in M5P comes to an end. Secondly, each leaf on the tree is pruned back. With a regression plane, an inner node is transformed into a leaf during pruning [46].
Comparing the M5P algorithm to other algorithms shows advantages. It can be applied to missing values in both continuous and categorical data. When a value is absent, M5P uses a technique called “surrogate splitting”, which asks for another attribute to be divided in place of the original location and uses it in return. Class magnitude is employed in the training portion by M5P as a surrogate attribute in the belief that it should be connected to the attribute that is used for splitting. All missing values are replaced by the average values of the respective characteristics from the training example at the conclusion of the splitting phase. Instead of using an unknown attribute value in the testing phase, the average value of that attribute for all training instances that reach the node is utilized. M5P creates models that are reasonably understandable and small [47].

2.2. Multiple Nonlinear Regression Method

Let us assume that y is the dependent variable and that x 1 ,   x 2 , and x n are the n independent variables in the nonlinear relationship. They have a nonlinear relationship that can be represented as follows:
y = a 0 x 1 a 1 x 2 a 2 x n a n
From Equation (2), the following linearized equation can be constructed by using logarithmic transformation:
l o g y = l o g a 0 + a 1 l o g x 1 + a 2 l o g x 2 + + a n l o g x n
Similar to the Multi-Linear Regression (MLR) approach, the least squares method can be used to calculate the coefficients a 0 ,   a 1 ,   , and a n .

2.3. Model Inputs

The mechanical characteristics (e.g., the torsional strength T R ) of composite members such as reinforced concrete beams are influenced by a wide range of variables. These variables include the cross-section area, amount of longitudinal and transverse reinforcement, spacing between bars, concrete compressive strength, steel yielding strength, modulus of elasticity, and more [48,49,50,51]. Therefore, it is necessary to identify the most critical parameters from various independent variables to create an accurate model. In this research, three independent factors comprising the cross-section area ( A c , the area enclosed within the outer perimeter of the cross-section), the concrete compressive strength ( f c ), and a reinforcement factor which accounts for the type—longitudinal or transverse—amount, and yielding strength of the torsional reinforcement A l f y l A t f y t / s were considered as predictive variables based on prior research and current design codes [1,2]. The only output of the model is the torsional capacity of the RC beam, T R . In the reinforcement factor, A l is the total area of longitudinal reinforcement, A t is the area of one rebar of the transverse reinforcement (stirrups), s is the stirrups’ longitudinal spacing, and f y l and f y t are steel yielding stress of the longitudinal and transverse reinforcement, respectively.

2.4. Database Used

A reasonably recent comprehensive dataset by Bernardo et al. [1] from 21 experimental investigations carried out between 1968 and 2020 is utilized to analyze the torsional strength of the RC beams and create a new model and prediction formulae. The utilized dataset is available and described in detail in [1], including all properties of the RC beams. For this reason, it is not incorporated in this study. For various T R values between 8.9 kN.m and 521.3 kN.m, the whole collection consists of 202 recorded experimental data samples. Two independent parts of the dataset are randomly selected: training (162) and testing (40). The training dataset is used to train the M5P algorithm, and the testing dataset is used to evaluate it. Table 1 lists the range of output and variables for testing and training datasets.

3. Model Result

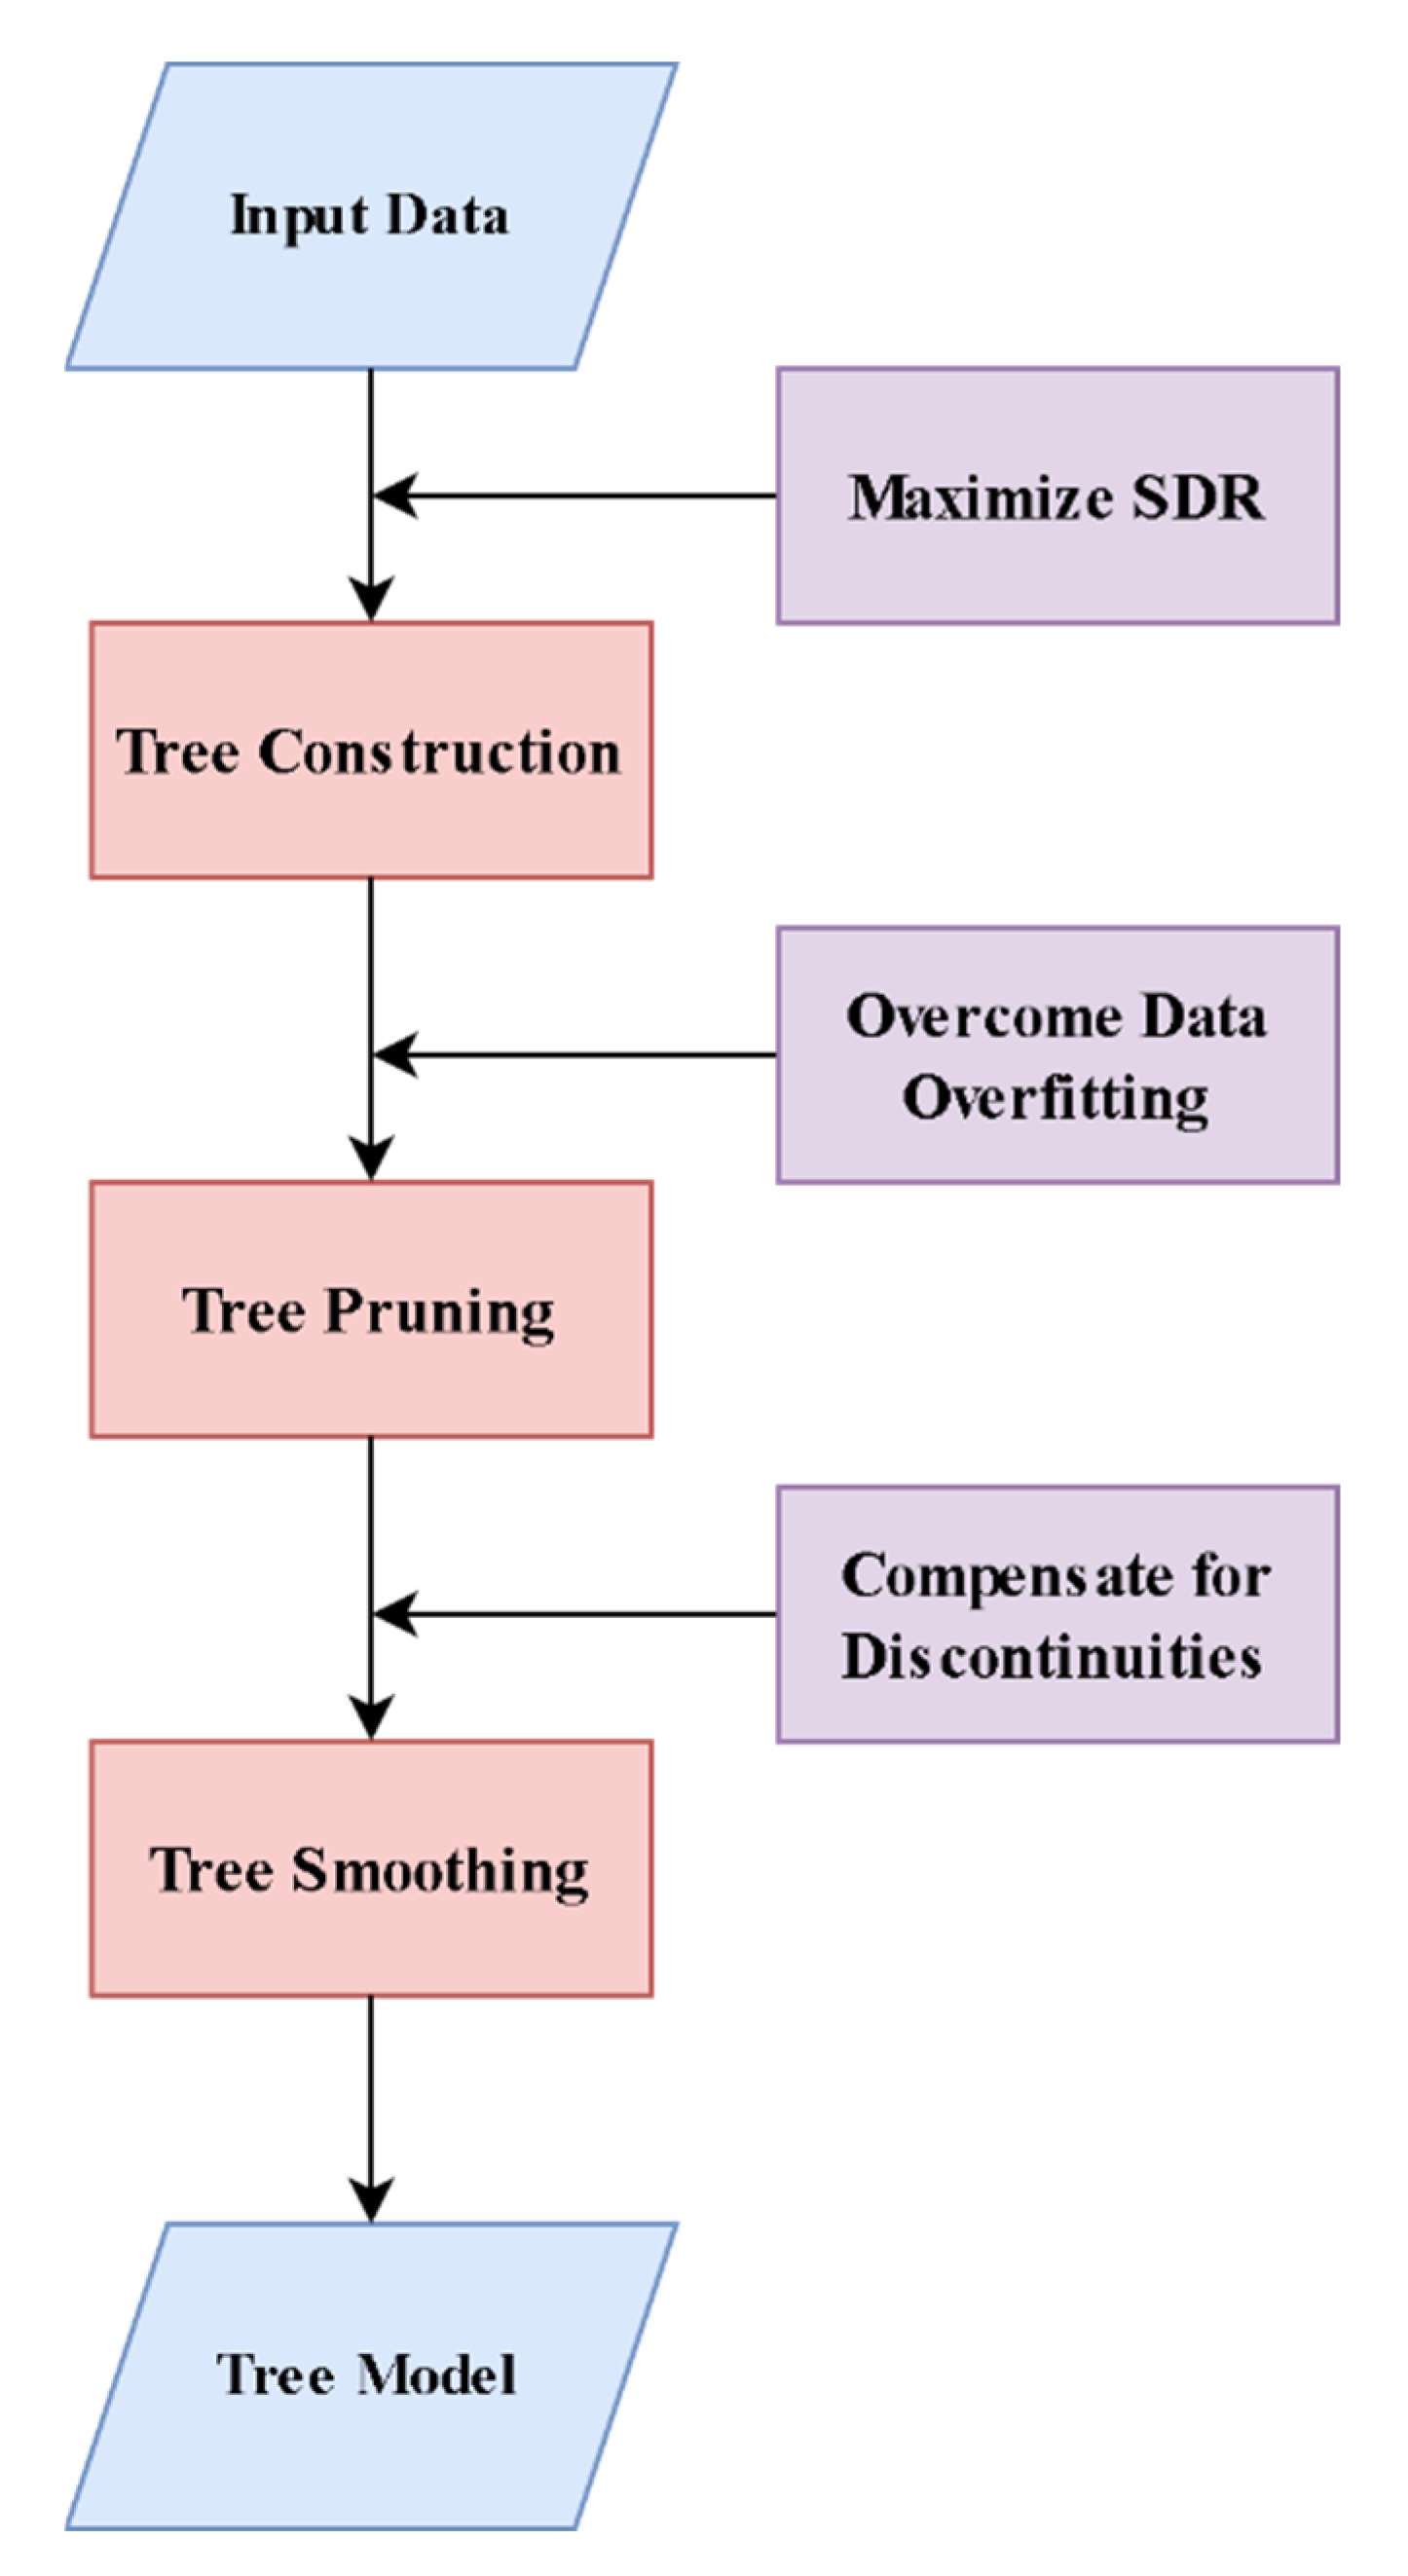
3.1. M5P and MLNR Derived Models

The relationship between the input and output parameters in the current study is not always linear, since the distribution of a wide range of values follows a nonlinear trend, such as a power law. When calculating the torsional capacity, the M5P model can be utilized to produce concise, transparent rules that are simple to implement. However, it could suggest that the input and output parameters are linearly related. Log (inputs) and log (outputs) were used to create a model to bypass this limitation (output). Consequently, and based on the results from studies [1,2], it was hypothesized that T R is a power function that has the following form:
T R = a f c b ( A c ) c ( A l f y l A t f y t s ) d
where the constants ( a , b , c , and d ) have different values under various circumstances and all other terms were previously defined.
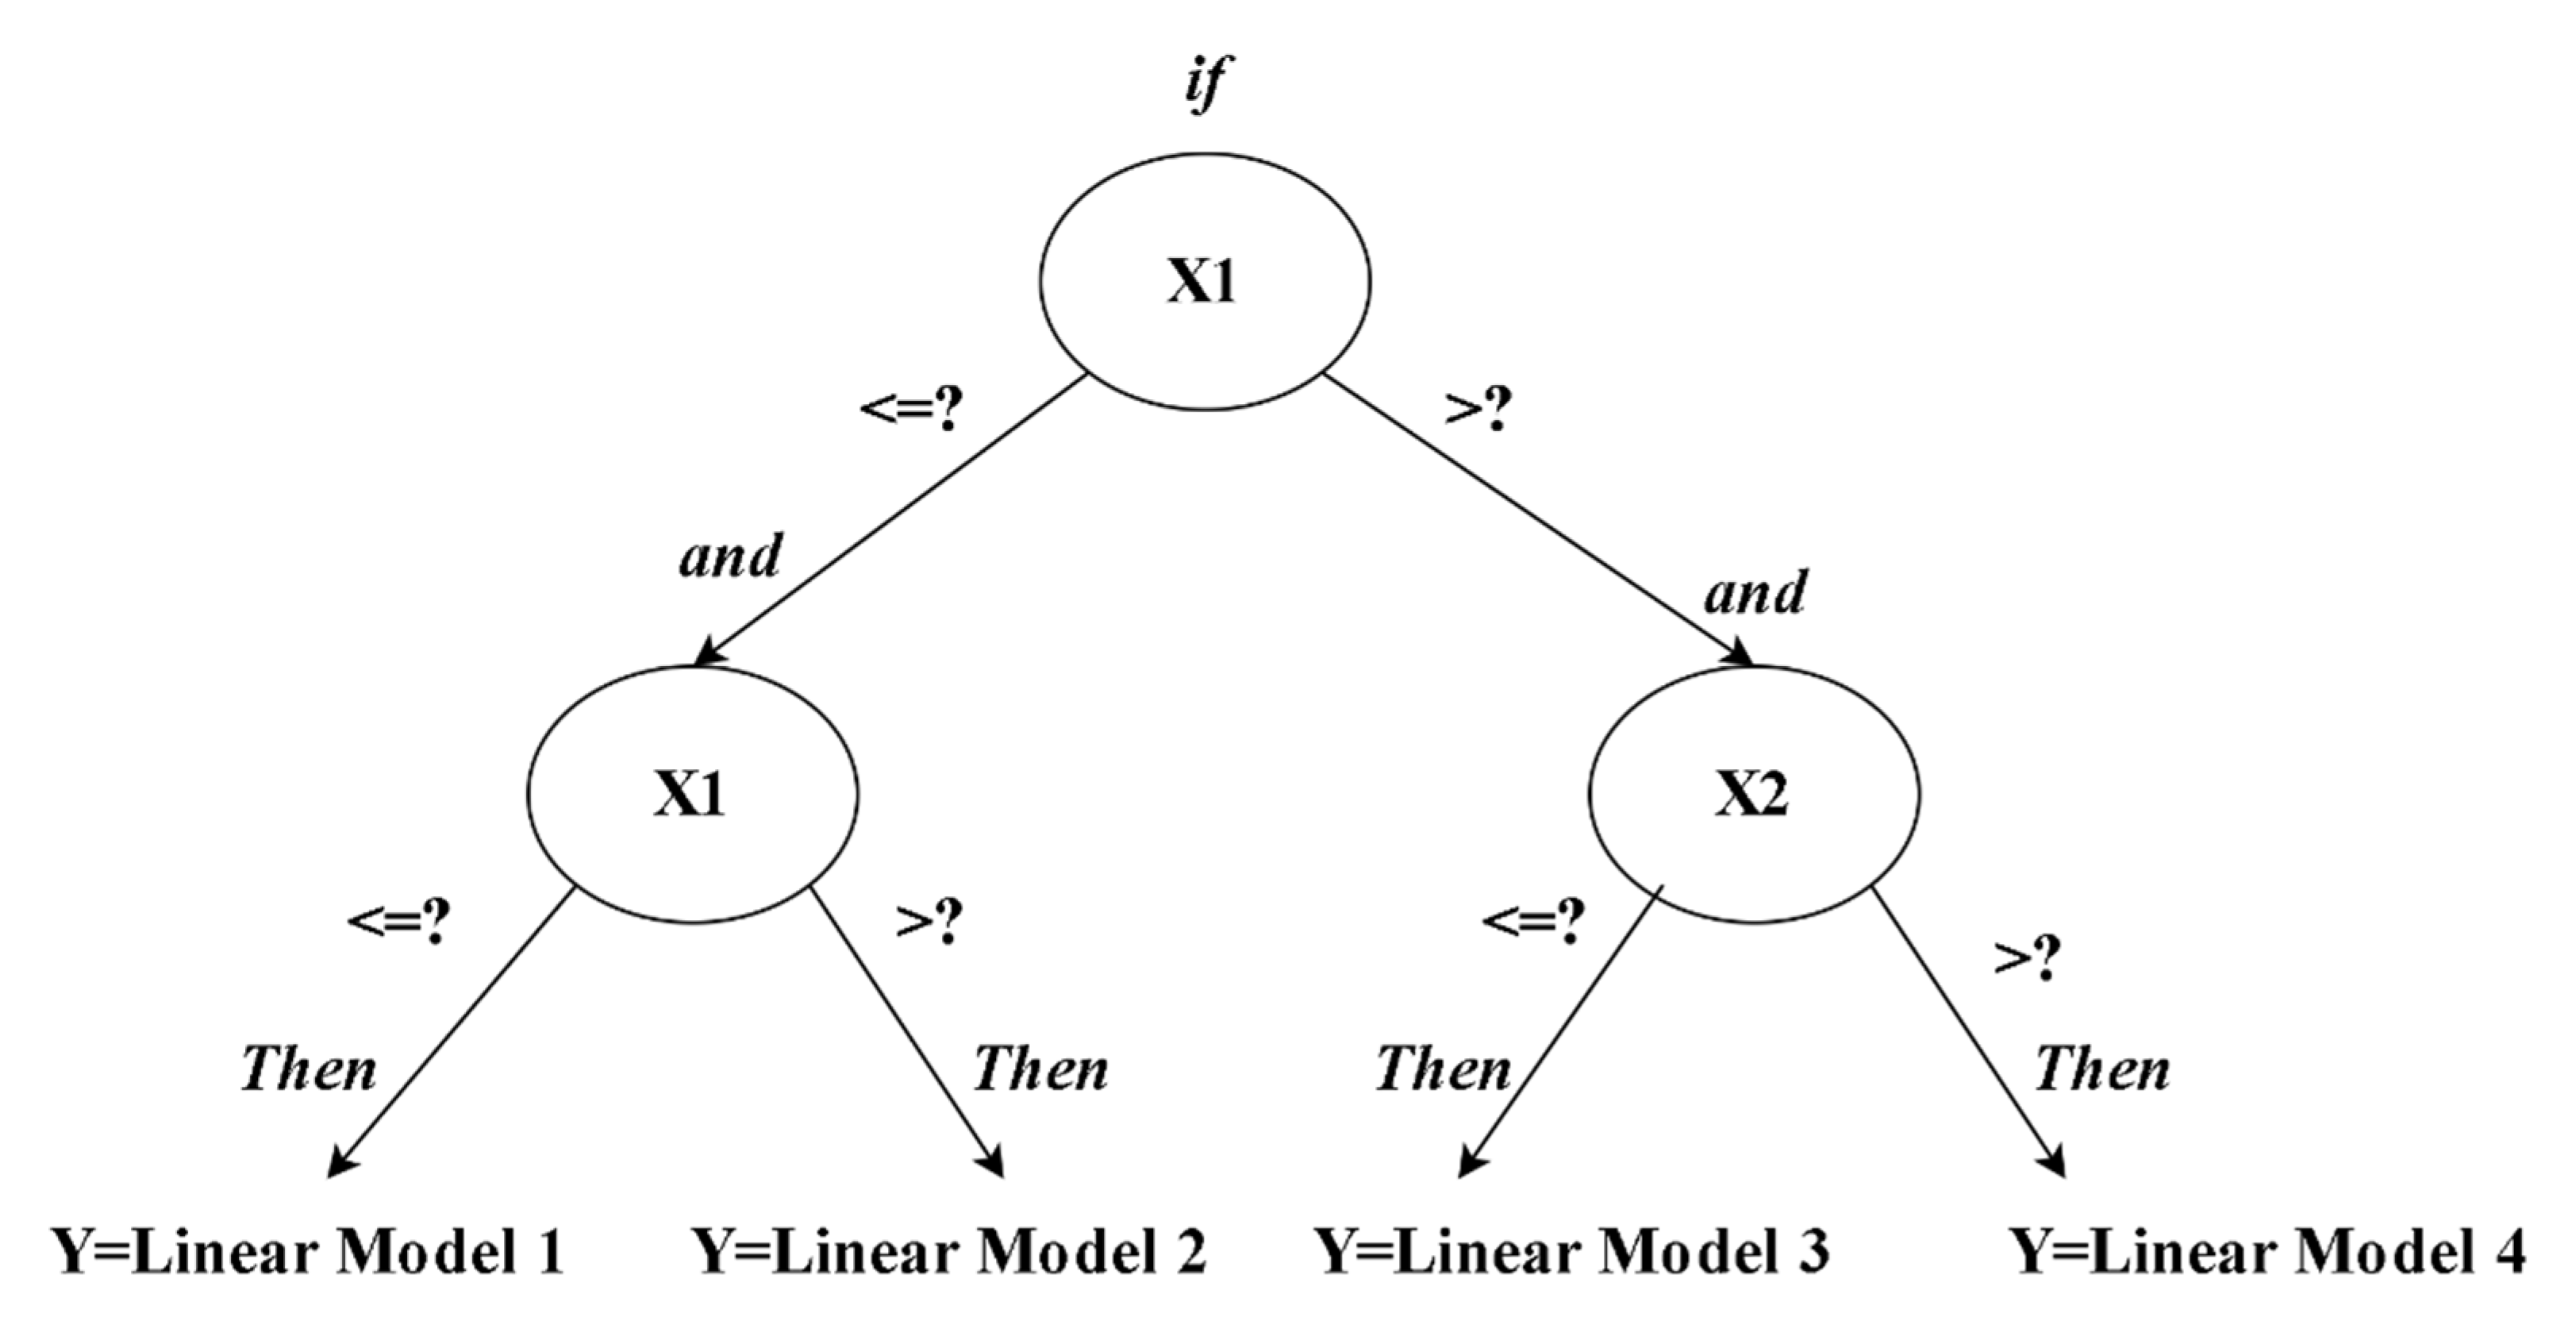
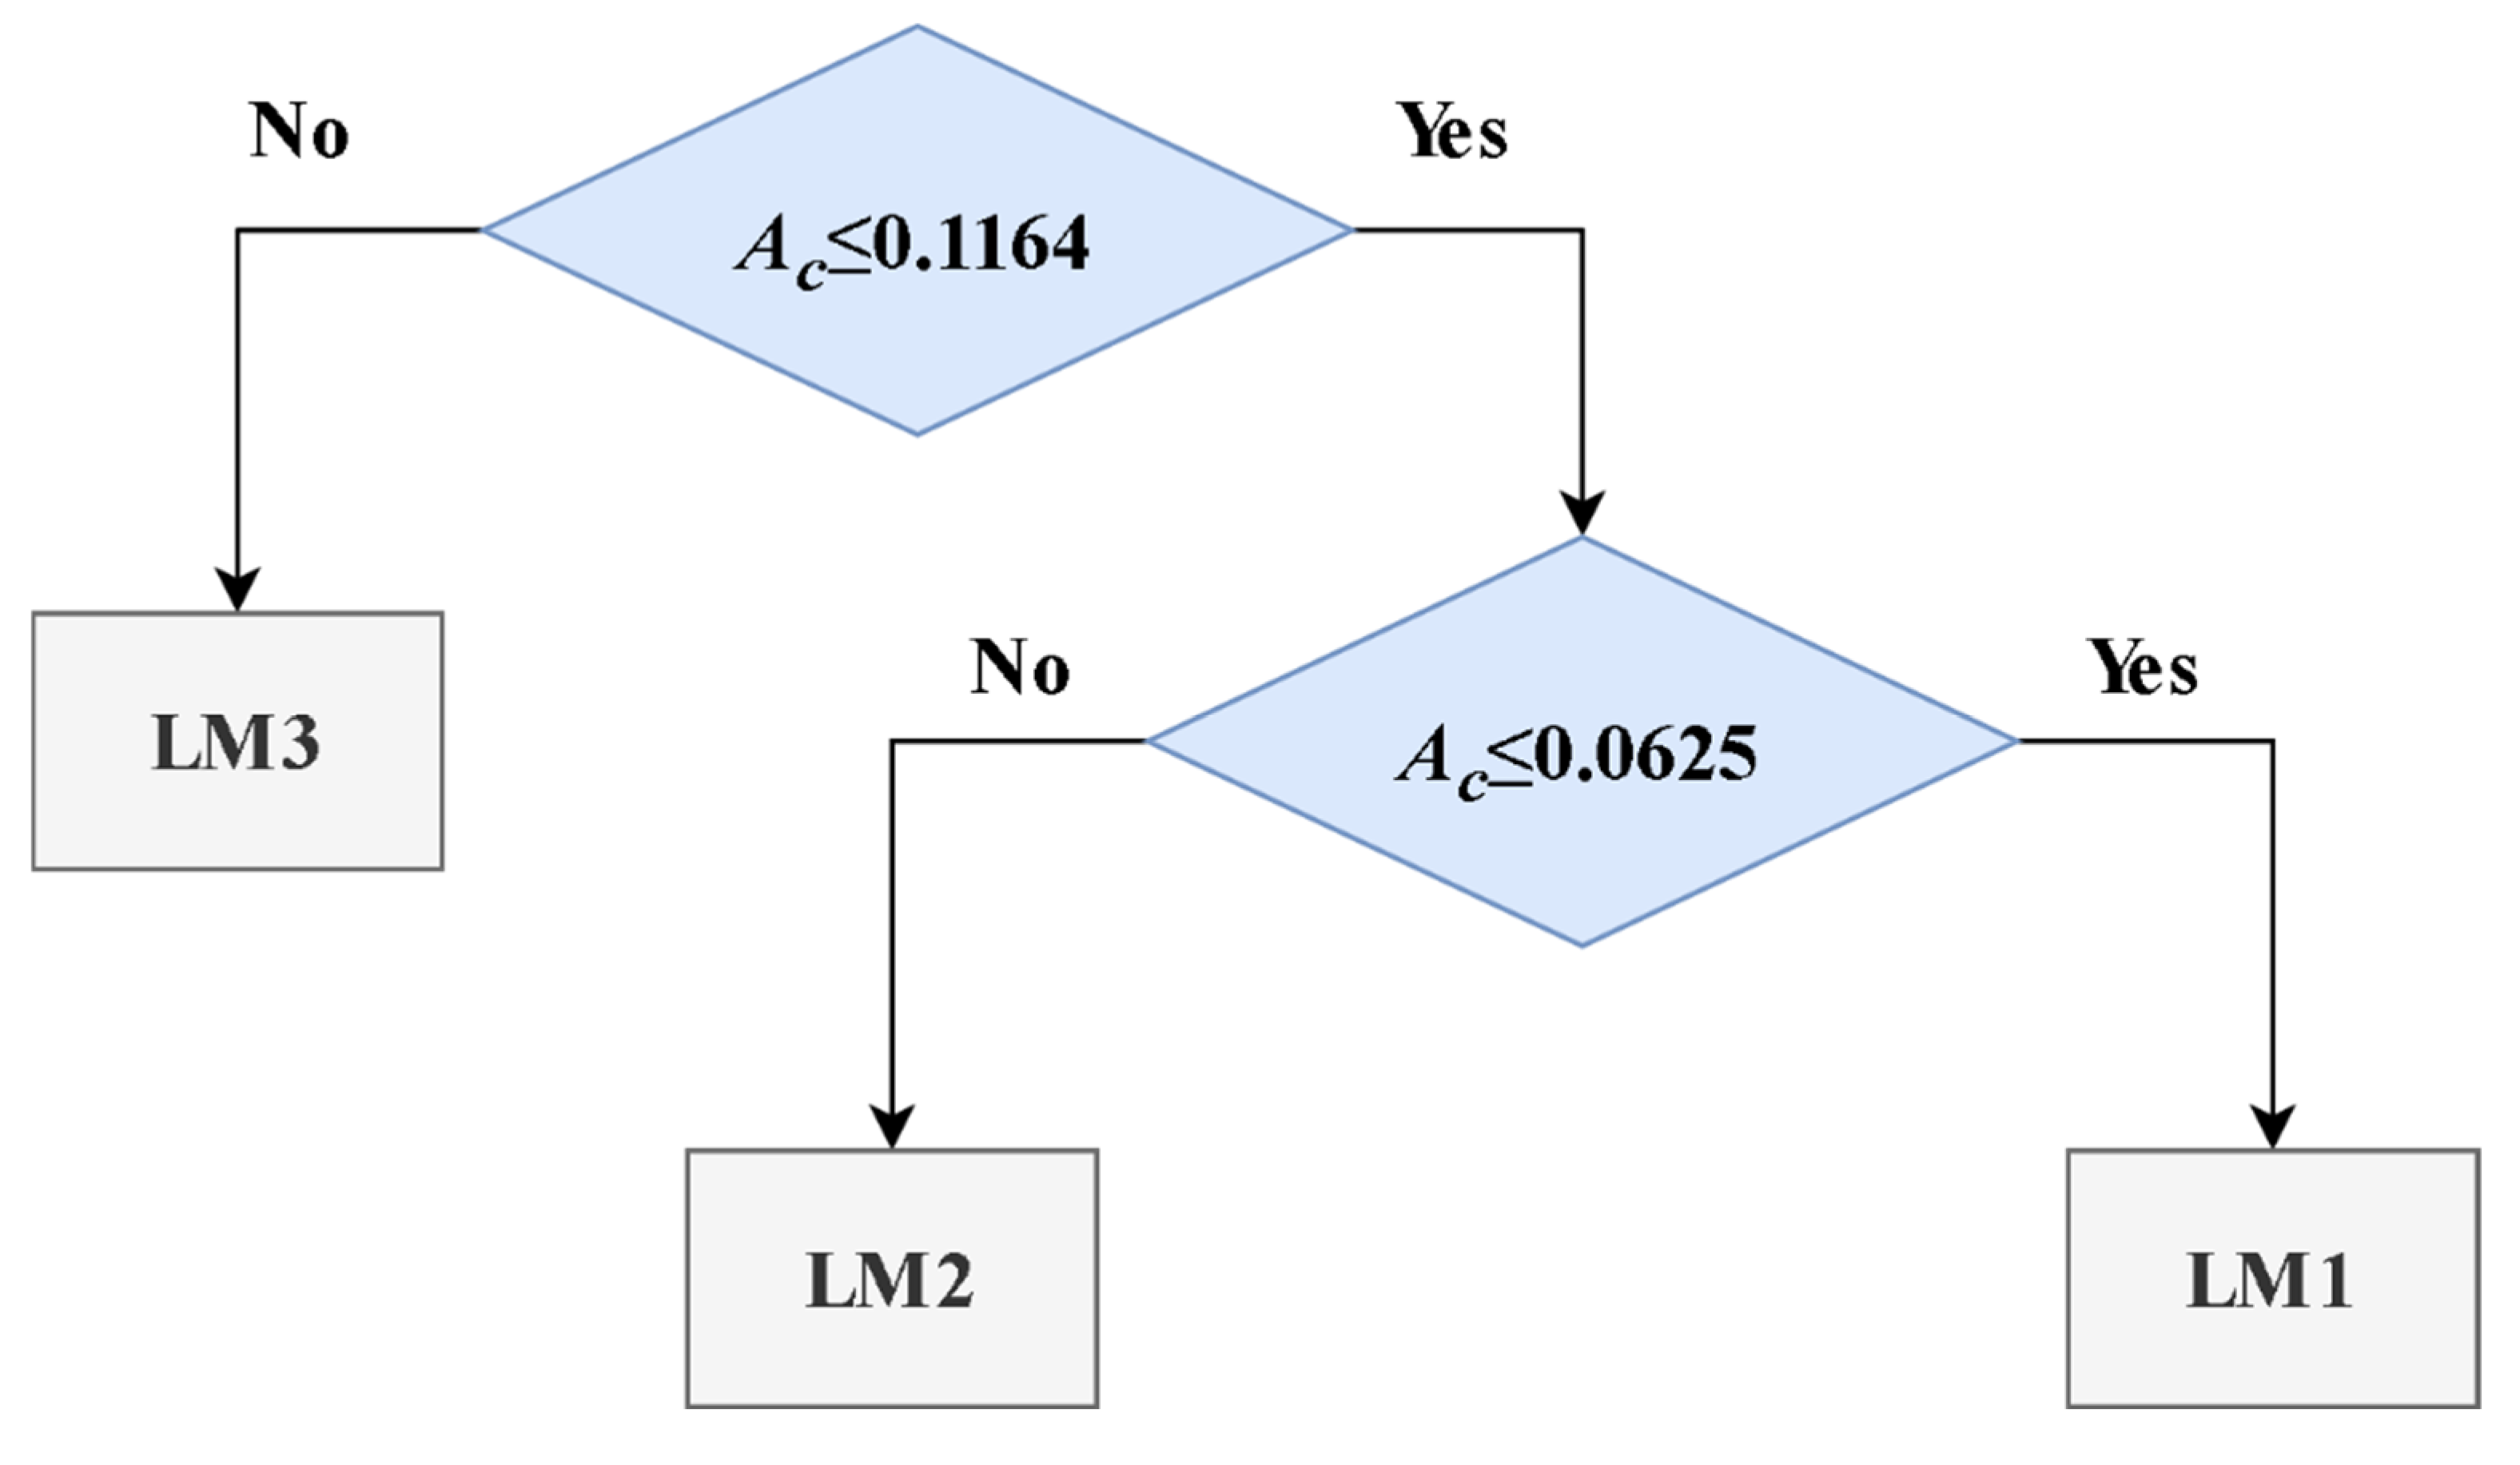
Figure 3 displays the established model tree created using the M5P technique. Table 2 provides the coefficients for Equation (4) predicted from the M5P algorithm.
The following example illustrates the methodology of using M5P to predict the torsional capacity of RC beams. For example, let us consider a reference beam from the testing dataset with the attributes summarized in Table 3.
As can be seen from Table 3 and Figure 3, the beam sample belongs to the M5P LM1 prediction equation, since the value of A c is ≤ 0.1164 and > 0.0625. Therefore, using the coefficients related to LM1, the predicted value for the torsional capacity of the reference beam in Table 3 is 37.29 kN.m, which agrees very well with the experimental torsional capacity (37.48 kNm).
The newly developed equation to predict the torsional resistance of RC beams in this research using an MLNR (Multiple NonLinear Regression) model can be written as follow:
T R = 5.1808   f c 0.1964 ( A c ) 1.1755 ( A l f y l A t f y t s )   0.2459

3.2. Performance Analysis

In the ML modeling process, the number of the entire dataset used to build a new regression model is a critical task. Frank and Todeschini [52] recommended a minimal proportion of three between the full dataset utilized and the number of included variables for constructing a credible model based on data mining approaches. A value of five is considered a more conservative and safe option. As can be seen in this study, the ratio between experimental data points to the predictors is equal to 202/3 = 67.33.
In order to compare the M5P model with MLNR, performance metrics were used. The Root Mean Square Error (RMSE), Coefficient of Determination (R2), and Mean Estimation Error (MAE) were used to evaluate the predictive performance of M5P and MLNR on a regular basis [53,54]. The three equations below are used to calculate these metrics.
R 2 = i = 1 n ( y i o b s y o b s ) 2 i = 1 n y i o b s y i p r e 2 i = 1 n y i o b s y o b s 2   0 , 1
R M S E = i = 1 n y i o b s y i p r e 2 n   0 , +
M A E = i = 1 n y i o b s y i p r e n 0 , +
where n denotes the overall number of data points used to calculate the bias, y i o b s and y i p r e are the observed values for the torsional strength and the predicted torsional strength of the RC beams for the ith observation, respectively, and y o b s is the average of all observed data.
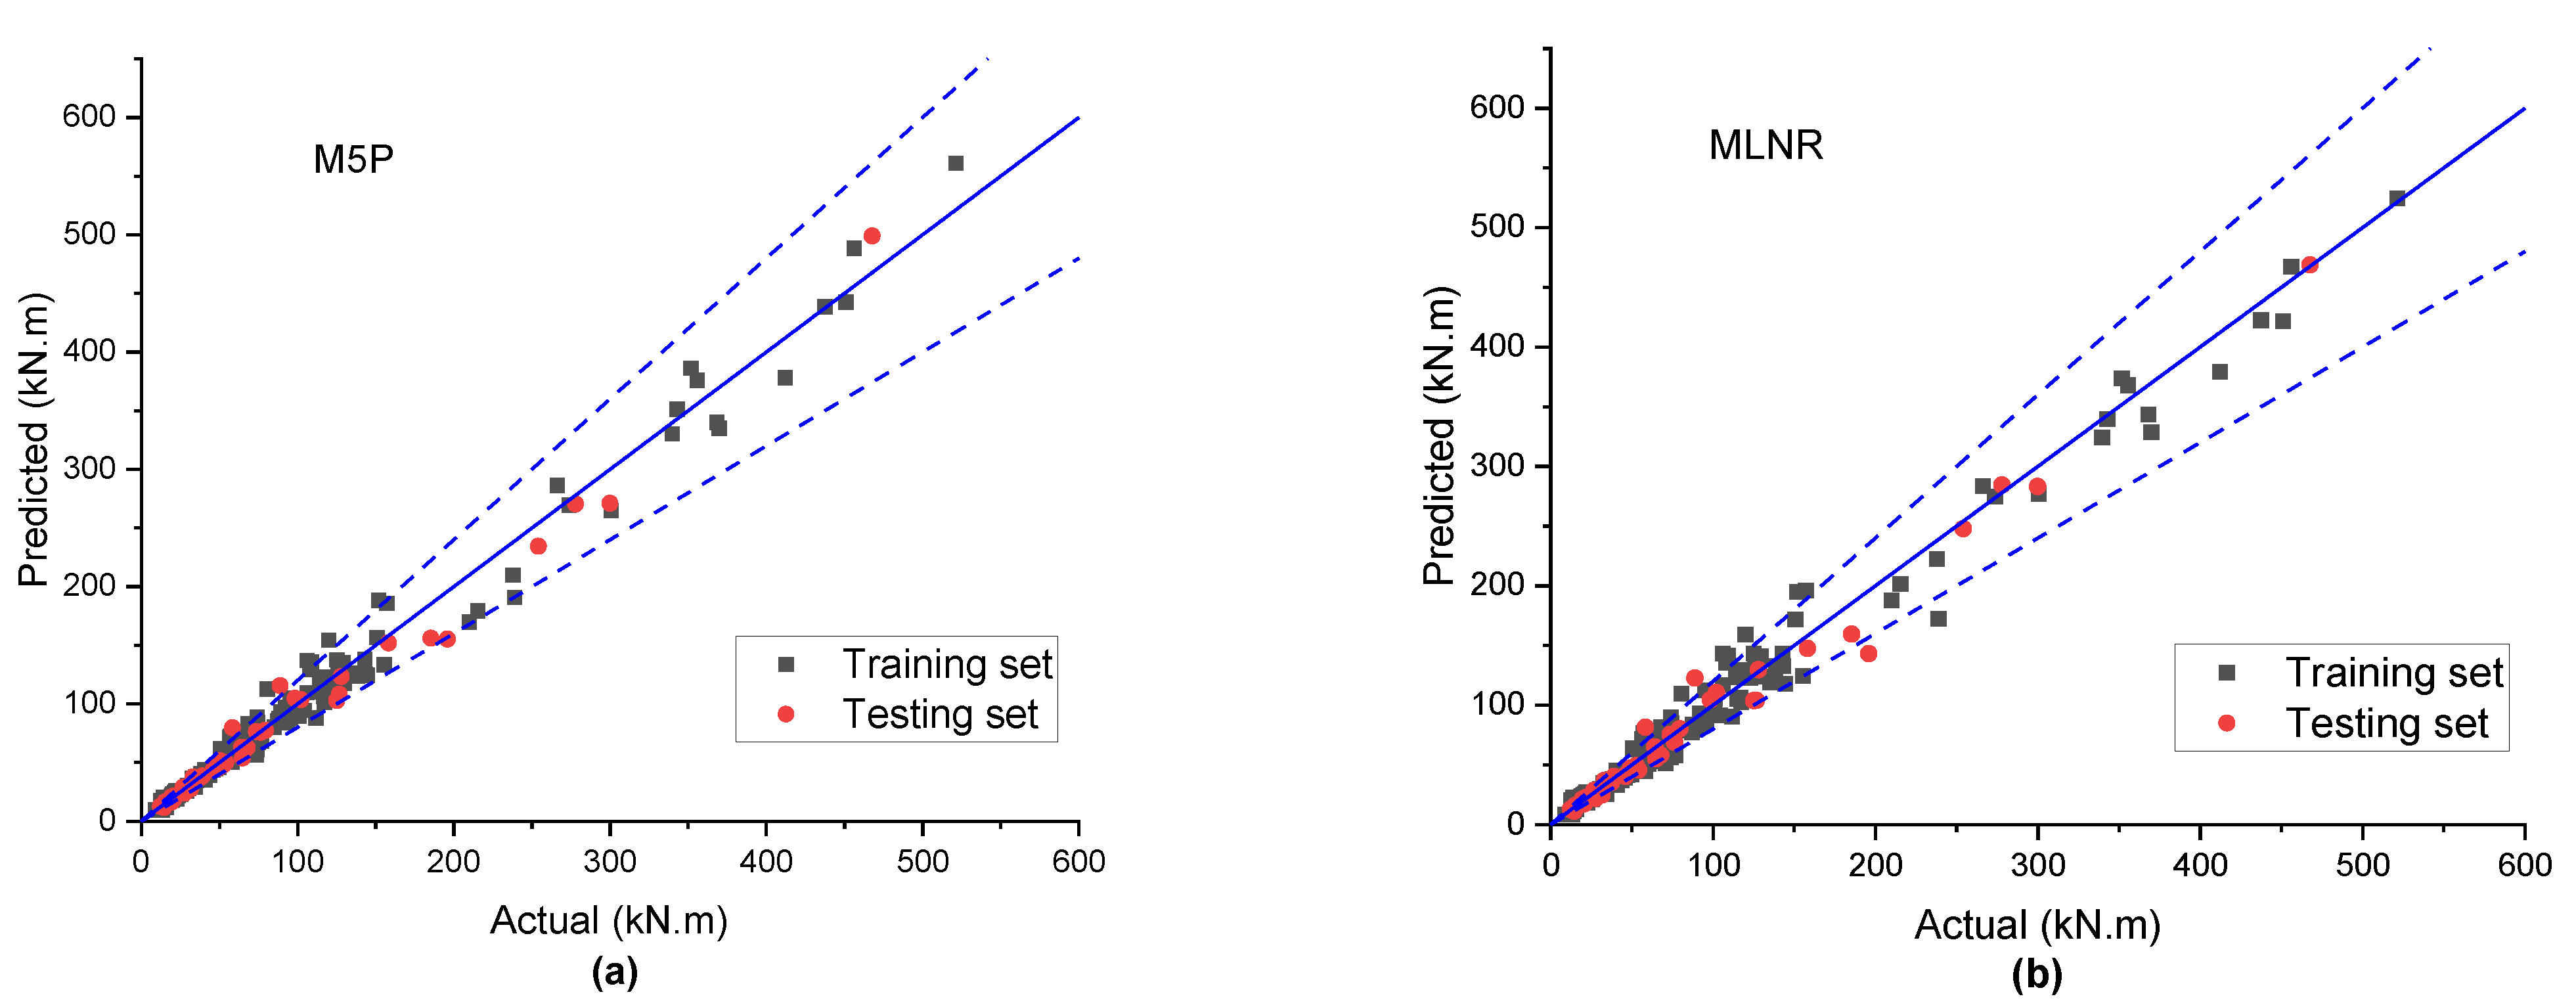
As shown in Figure 4a,b, for both training and testing datasets, the M5P and MNLR models’ results reveal a little scatter around the ideal line between the observed and predicted values of the torsional strength. Model performance measurements are provided in Table 4 for the training and testing datasets to further check the validity of the obtained models.
There is a substantial correlation between the predicted and experimental values when |R| > 0.8, according to Smith [55]. The matching between the observed and predicted values might not be achieved, even if the R value is near 1. In other words, those two variables just vary similarly. It is possible to overcome this constraint by utilizing the coefficient of determination R2. When the model’s R2 value is close to one, and the model’s RMSE and MAE values are close to zero, the model can be trusted to produce precise results [56]. In terms of accuracy, the models’ performance measures in Table 4 indicate that M5P outperformed the MNLR in both the training and testing sets. For example, and for R2, RMSE and MAE values for the training set of the M5P model are 0.983, 13.288, and 8.279, respectively, while the RMSE and MAE values of R2 for the testing set are 0.981, 13.432, and 8.224, respectively. It should be noted that the performance of MNLR is also acceptable.
A comparison of the forecasting accuracy of the M5P and MLNR models from this study, with standards and simplified predicting models for the torsional strength of RC beams using the testing dataset, is performed, and the findings are summarized in Table 5. The standard equations from SNiP18 [9], ACI 318-19 [10], MC10 [12], EC2 [13], CSA14 [11], and the simplified equation developed by Rahal in 2013 [2] are among the available torsional strength models investigated in this study. In order to do so, three statistical error measurements, including R2, RMSE, and MAE, besides model uncertainty average value x ¯ and coefficient of variation COV for the calculated ratios T R , e x p / T R , p r e d , were utilized for the comparison between the previously developed models and the other referred ones. The lowest RMSE and MAE values with the highest R2 are achieved with the M5P model, as shown in Table 5. The mean value of the model uncertainty variable for the M5P is 1.0419, which is close to the optimal value (equal to 1). Moreover, with a COV of 11.6419, the M5P model has the lowest dispersion of all the studied models. The most prominent conservative bias was obtained from the SNiP18 equations, with a mean value of model uncertainty equal to 1.3584, while the broadest dispersion is achieved with the MC10 equation, with the value 44.78%.
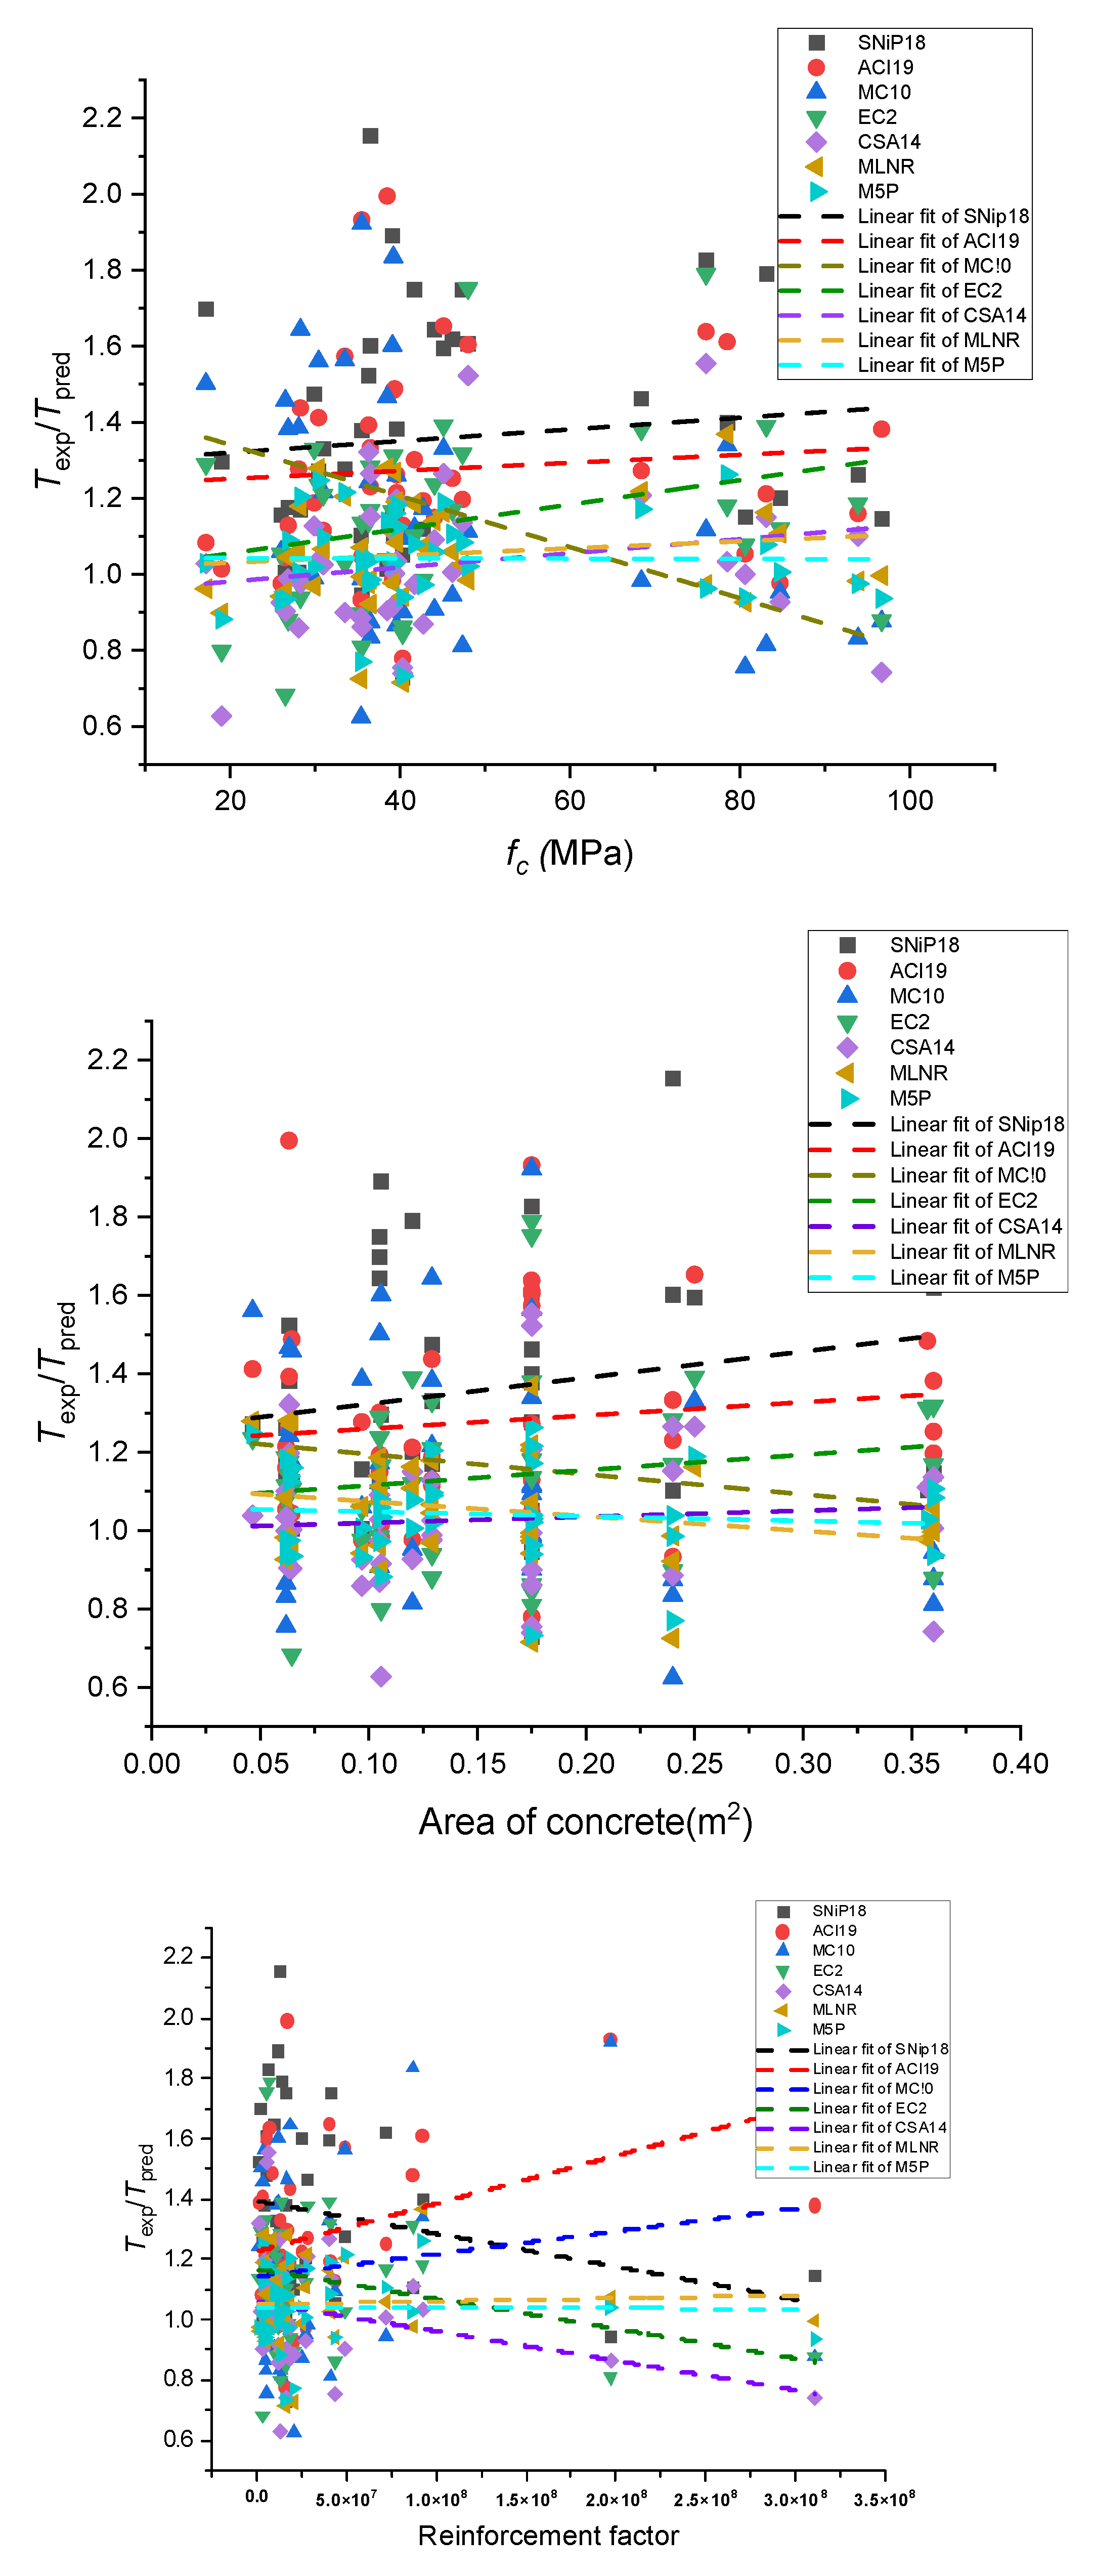
The model uncertainty variable between the predicted and observed torsional strength for all the RC beams in the testing dataset was plotted against the predictors used to build each of the models in this study, as shown in Figure 5. These plots help to acquire a better understanding of the standards’ errors. In this regard, the results of the standards were compared to those of the MLNR and M5P models. An adequate model’s errors should be less sensitive or independent of changes in the input parameters involved in the phenomena. Otherwise, it is possible to conclude that such input parameters are either incorrectly included or should be included in the model [55]. As demonstrated in Figure 5, the errors of some of the design codes are sensitive to changes in the concrete compressive strength ( f c ) or concrete area ( A c ) values.
For example, the MC10 standard tends to overpredict the torsional strength as the value of f c or A c increases, while the ACI 318-19 standard tends to behave in the opposite direction as the value of the same variables increases. Therefore, it is possible to state that those two parameters might not have been correctly included in the standards equations, and more studies should be performed on this. On the other hand, the M5P and MLNR models’ errors are entirely unaffected by these variables. The EC2 standard is less sensitive to the changes in f c or A c values when compared to the other standards.
It can also be noticed that some trends in the behavior of the standards equations exist when it comes to relate the prediction of the torsional strength versus reinforcement factor. For example, the status of the equations for some of the standards changes from overprediction to underprediction as the reinforcement factor increases, while the status of the equations from other standards (namely MC10, EC2, and SNiP18) shows the opposite. Consequently, all input variables were better incorporated into the newly suggested models in this study, and the models’ errors were entirely independent of them.

3.3. Parametric and Sensitivity Analyses

The importance of variables in estimating the torsional strength of RC beams is determined by performing a sensitivity analysis. This analysis is carried out by removing each predictor from the database, one at a time, and training and testing the proposed models using the resulting dataset. The R2, RMSE, and MAE performance measures from the testing and training database were used to analyze the relevance of each variable on the torsional strength of the RC beams. The results are summarized in Table 6. This table depicts all of the input factors that are thought to influence the torsional strength of the RC beams. As can be noticed from Table 6, the area of concrete, A c , is the most sensitive variable impacting the torsional strength of the RC beams when compared to the other input variables. It should also be noticed that leaving out the concrete compressive strength, f c , has little impact on the obtained models’ performance.

4. Conclusions

In this study, two novel models for the reliable prediction of the torsional resistance of RC beams were generated utilizing M5P and MLNR. A representative experimental database based on inputs such as area of concrete, concrete compressive strength, and reinforcement factor was gathered from the published literature in order to construct the relationships.
The following findings are derived from this study:
  • Both the M5P and MLNR models had excellent predictive power.
  • With a total RMSE value of 14.663, the M5P model exceeds the MLNR model.
  • The torsional resistance of the RC beam can be quickly and reasonably estimated using the suggested M5P model.
  • The generated M5P correlation was evaluated against the equations of design building codes and other current models. All of these models could not match the developed M5P’s precision.
  • The M5P and MLNR models indicated that the area of concrete had the greatest influence on the prediction of torsional resistance.
With only 202 experimental tests, the dataset used to develop the prediction models was relatively small. This represents a limitation of the presented work. The accuracy and dependability of the M5P model can be improved by utilizing a larger dataset. Due to challenges with data collecting, other signs or factors could have gone overlooked. The type and quality of data used greatly influence how well supervised machine learning systems perform. In the future, the authors want to determine if adding a new prediction model or changing the size of the training dataset can increase or decrease the suggested model’s accuracy.

Author Contributions

S.N.H.: conceptualization, modeling, and write up; A.H.N.: writing, validation, and supervision; H.I.: review, writing—original draft, and funding; L.F.A.B.: writing—review and writing; M.M.T.: data acquisition and review; Z.A.-K.: data acquisition and review. All authors have read and agreed to the published version of the manuscript.

Funding

This research received no external funding.

Institutional Review Board Statement

Not applicable.

Informed Consent Statement

Not applicable.

Data Availability Statement

Not applicable.

Conflicts of Interest

The authors declare no conflict of interest.

References

  1. Bernardo, L.F.A.; Teixeira, M.M.; De Domenico, D.; Gama, J.M.R. Improved Equations for the Torsional Strength of Reinforced Concrete Beams for Codes of Practice Based on the Space Truss Analogy. Materials 2022, 15, 3827. [Google Scholar] [CrossRef]
  2. Rahal, K.N. Torsional strength of normal and high strength reinforced concrete beams. Eng. Struct. 2013, 56, 2206–2216. [Google Scholar] [CrossRef]
  3. Teixeira, M.M.; Bernardo, L.F.A. Torsional strength of reinforced concrete beams—Evaluation of some codes of practice. Concrete structures: New trends for eco-efficiency and performance. In Proceedings of the fib Symposium 2021 Held Online, Lisbon, Portugal, 14–16 June 2021; Fédération Internationale du Béton (fib). pp. 2035–2046. [Google Scholar]
  4. Whittle, R. Failures in Concrete Structures—Case Studies in Reinforced and Prestressed Concrete; FL 33487-2742; CRC Press: Boca Raton, FL, USA; Taylor & Francis Group: Abingdon, UK, 2013; 140p. [Google Scholar]
  5. Hsu, T.T.C. Torsion of structural concrete—Behavior of reinforced concrete rectangular members. Spec. Publ. 1968, 18, 261–306. [Google Scholar]
  6. McMullen, A.E.; Warwaruk, J. Concrete beams in bending, torsion and shear. J. Struct. Div. 1970, 96, 885–903. [Google Scholar] [CrossRef]
  7. McMullen, A.E.; Rangan, B.V. Pure Torsion in Rectangular Sections—A Re-examination. ACI J. Proc. 1978, 75, 511–519. [Google Scholar]
  8. Elfgren, L.; Karlsson, I.; Losberg, A. Torsion-bending-shear interaction for concrete beams. J. Struct. Div. 1974, 100, 1657–1676. [Google Scholar] [CrossRef]
  9. SNiP 52-01-2018; Concrete and Reinforced Concrete Structures. Principal Rules. Ministry of Regional Development of the Russian Federation: Moscow, Russia, 2018.
  10. ACI Committe 318; Building Code Requirements for Structural Concrete (ACI 318-19) and Commentary (ACI 318R-19). American Concrete Institute: Detroit, MI, USA, 2019.
  11. CSA Committee A23.3-14; Design of Concrete Structures (CAN/CSA-A23.3-14). Canadian Standards Association: Toronto, ON, Canada, 2014.
  12. CEB-FIP Model Code 2010; Comité Euro-International du Béton, Secretariat Permanent. Case Postale 88, CH-1015 Lausanne: Lausanne, Switzerland, 2013.
  13. EN 1992-1-1; Eurocode 2: Design of Concrete Structures—Part 1-1: General Rules and Rules for Buidings. European Committee for Standardization: Brussels, Belgium, 2005; 225p.
  14. Rausch, E. Berechnung des Eisenbetons gegen Verdrehung (Design of Reinforcerd Concrete in Torsion). Ph.D. Thesis, Technische Hochschule, Berlin, Germany, 1929; 53p. (In German Technische Hochschule). [Google Scholar]
  15. Cowan, H.J. Elastic Theory for Torsional Strength of Rectangular Reinforced Concrete Beams. Mag. Concr. Res. 1950, 2, 3–8. [Google Scholar] [CrossRef]
  16. Lampert, P.; Thurlimann, B. Torsionsversuche an Stahlbetonbalken (Torsion Tests of Reinforced Concrete Beams); Bericht, Nr. 6506-2, Institut fur Baustatik, ETH, Zurich: Zürich, Switzerland, 1969; 101p. (In German) [Google Scholar]
  17. Mitchell, D.; Collins, M.P. Diagonal Compression Field Theory—A Rational Model for Structural Concrete in Pure Torsion. ACI Struct. J. 1974, 71, 396–408. [Google Scholar]
  18. Leonhardt, F.; Schelling, G. Torsionsversuche an Stahl Betonbalken; Bulletin No. 239; Deutscher Ausschuss fur Stahlbeton: Berlin, Germany, 1974; 122p. (In German) [Google Scholar]
  19. Jeng, C.-H.; Hsu, T.T.C. A Softened Membrane Model for Torsion in Reinforced Concrete Members. Eng. Struct. 2009, 31, 1944–1954. [Google Scholar] [CrossRef]
  20. Bernardo, L.F.A.; Andrade, J.M.A. A Unified Softened Truss Model for RC and PC Concrete Beams under Torsion. J. Build. Eng. 2020, 32, 101467. [Google Scholar] [CrossRef]
  21. Bhatti, M.A.; Almughrabi, A. Refined model to estimate torsional strength of reinforced concrete beams. J. Am. Concr. Inst. 1996, 93, 614–622. [Google Scholar]
  22. Wang, W.; Hsu, T.T.C. Limit analysis of reinforced concrete beams subjected to pure torsion. J. Struct. Eng. 1997, 123, 86–94. [Google Scholar] [CrossRef]
  23. Silva, J.R.B.; Horowitz, B.; Bernardo, L.F.A. Efficient procedure to analyze RC beam sections using the softened truss model. ACI Struct. J. 2017, 114, 765–774. [Google Scholar] [CrossRef] [Green Version]
  24. Greene, G.G.; Belarbi, A. Model for RC members under torsion, bending, and shear. I: Theory. J. Eng. Mech. 2009, 135, 961–969. [Google Scholar]
  25. Alnauimi, A.S.; Bhatt, P. Direct design of hollow reinforced concrete beams. Part I: Design procedure. Struct. Concr. 2004, 5, 139–146. [Google Scholar] [CrossRef]
  26. Bairan Garcia, J.M.; Mari Bernat, A.R. Shear-bending-torsion interaction in structural concrete members: A nonlinear coupled sectional approach. Arch. Comput. Methods Eng. 2007, 14, 249–278. [Google Scholar] [CrossRef]
  27. Bernardo, L.; Taborda, C. Softened Truss Model for Reinforced Concrete Beams under Torsion Combined with Axial Force. Appl. Mech. 2020, 1, 79–96. [Google Scholar] [CrossRef] [Green Version]
  28. Salem, N.M.; Deifalla, A. Evaluation of the Strength of Slab–Column Connections with FRPs Using Machine Learning Algorithms. Polymers 2022, 14, 1517. [Google Scholar] [CrossRef]
  29. Ebid, A.; Deifalla, A. Using Artificial Intelligence Techniques to Predict Punching Shear Capacity of Lightweight Concrete Slabs. Materials 2022, 15, 2732. [Google Scholar] [CrossRef]
  30. Ebid, A.; Deifalla, A. Prediction of Shear Strength of FRP Reinforced Beams with and Without Stirrups Using (GP) Technique. Ain Shams Eng. J. 2021, 12, 2493–2510. [Google Scholar] [CrossRef]
  31. Shatnawi, A.; Alkassar, H.M.; Al-Abdaly, N.M.; Al-Hamdany, E.A.; Bernardo, L.F.A.; Imran, H. Shear Strength Prediction of Slender Steel Fiber Reinforced Concrete Beams Using a Gradient Boosting Regression Tree Method. Buildings 2022, 12, 550. [Google Scholar] [CrossRef]
  32. Amani, J.; Moeini, R. Prediction of shear strength of reinforced concrete beams using adaptive neuro-fuzzy inference system and artificial neural network. Sci. Iran. A 2012, 19, 242–248. [Google Scholar] [CrossRef] [Green Version]
  33. Ilkhani, M.H.; Moradi, E.; Lavasani, M. Calculation of torsion capacity of the reinforced concrete beams using artificial neural network. J. Soft Comput. Civil Eng. 2017, 1, 8–18. [Google Scholar]
  34. Huang, H.C. Using a hybrid neural network to predict the torsional strength of reinforced concrete beams. Adv. Mater. Res. 2012, 538, 2749–2753. [Google Scholar] [CrossRef]
  35. Lyu, Z.; Yu, Y.; Samali, B.; Rashidi, M.; Mohammadi, M.; Nguyen, T.N.; Nguyen, A. Back-Propagation Neural Network Optimized by K-Fold Cross-Validation for Prediction of Torsional Strength of Reinforced Concrete Beam. Materials 2022, 15, 1477. [Google Scholar] [CrossRef]
  36. Cevik, A.; Arslan, M.H.; Köroglu, M.A. Genetic-programming-based modeling of RC beam torsional strength. KSCE J. Civ. Eng. 2010, 14, 371–384. [Google Scholar] [CrossRef]
  37. Arslan, M.H. Predicting of torsional strength of RC beams by using different artificial neural network algorithms and building codes. Adv. Eng. Softw. 2010, 41, 946–955. [Google Scholar] [CrossRef]
  38. Deifalla, A.; Salem, N.M. A Machine Learning Model for Torsion Strength of Externally Bonded FRP- Reinforced Concrete Beams. Polymers 2022, 14, 1824. [Google Scholar] [CrossRef]
  39. Naderpour, H.; Fakharian, P. Predicting the torsional strength of reinforced concrete beams strengthenedwith FRP sheets in terms of artificial neural networks. J. Struct. Constr. Eng. 2018, 5, 20–35. [Google Scholar]
  40. Amini Pishro, A.; Zhang, Z.; Amini Pishro, M.; Liu, W.; Zhang, L.; Yang, Q. Structural Performance of EB-FRP-Strengthened RC T-Beams Subjected to Combined Torsion and Shear Using ANN. Materials 2022, 15, 4852. [Google Scholar] [CrossRef]
  41. Deshpande, N.; Londhe, S.; Kulkarni, S. Modeling compressive strength of recycled aggregate concrete by Artificial Neural Network, Model Tree and Non-linear Regression. Int. J. Sustain. Built Environ. 2014, 3, 187–198. [Google Scholar] [CrossRef] [Green Version]
  42. Zhan, C.; Gan, A.; Hadi, M. Prediction of lane clearance time of freeway incidents using the M5P tree algorithm. IEEE Trans. Intell. Transp. Syst. 2011, 12, 1549–1557. [Google Scholar] [CrossRef]
  43. Nikoo, M.R.; Karimi, A.; Kerachian, R.; Poorsepahy-Samian, H.; Daneshmand, F. Rules for optimal operation of reservoir-river-groundwater systems considering water quality targets: Application of M5P model. Water Resour. Manag. 2013, 27, 2771–2784. [Google Scholar] [CrossRef]
  44. Quinlan, J.R. Learning with continuous classes. In Proceedings of the 5th Australian Joint Conference on Artificial Intelligence, Hobart, Tasmania, Australia, 16–18 November 1992; World Scientific: Singapore, 1992; Volume 92, pp. 343–348. [Google Scholar]
  45. Wang, Y.; Witten, I.H. Induction of Model Trees for Predicting Continuous Classes; Department of Computer Science, The University of Waikato: Hamilton, New Zealand, 1996; 13p. [Google Scholar]
  46. Deepa, C.; SathiyaKumari, K.; Sudha, V.P. Prediction of the compressive strength of high performance concrete mix using tree based modeling. Int. J. Comp. Appl. 2010, 6, 18–24. [Google Scholar] [CrossRef]
  47. Sabbaghi, S.; Maleki, R.; Shariaty-Niassar, M.; Zerafat, M.; Nematollahi, M. Modeling of chloride ion separation by nanofiltration using machine learning techniques. Int. J. Nanosci. Nanotechnol. 2012, 8, 185–190. [Google Scholar]
  48. Koutchoukali, N.-E.; Belarbi, A. Torsion of high-strength reinforced concrete beams and minimum reinforcement requirement. Struct. J. 2001, 98, 462–469. [Google Scholar]
  49. Chiu, H.-J.; Fang, I.-K.; Young, W.-T.; Shiau, J.-K. Behavior of reinforced concrete beams with minimum torsional reinforcement. Eng. Struct. 2007, 29, 2193–2205. [Google Scholar] [CrossRef]
  50. Lee, J.-Y.; Kim, S.-W. Torsional strength of RC beams considering tension stiffening effect. J. Struct. Eng. 2010, 136, 1367–1378. [Google Scholar] [CrossRef]
  51. Ju, H.; Han, S.-J.; Zhang, D.; Kim, J.; Wu, W.; Kim, K.S. Estimation of minimum torsional reinforcement of reinforced concrete and steel fiber-reinforced concrete members. Adv. Mater. Sci. Eng. 2019, 2019, 4595363. [Google Scholar] [CrossRef]
  52. Frank, I.E.; Todeschini, R. The Data Analysis Handbook; Elsevier: Amsterdam, The Netherlands, 1994. [Google Scholar]
  53. Asteris, P.G.; Tsaris, A.K.; Cavaleri, L.; Repapis, C.C.; Papalou, A.; Di Trapani, F.; Karypidis, D.F. Prediction of the fundamental period of infilled RC frame structures using artificial neural networks. Comput. Intell. Neurosci. 2016, 2016, 12. [Google Scholar] [CrossRef] [Green Version]
  54. Grun, B.; Leisch, F. FlexMix Version 2: Finite Mixtures with Concomitant Variables and Varying and Constant Parameters. 2008. Available online: https://www.jstatsoft.org/article/view/v028i04 (accessed on 13 September 2022).
  55. Smith, G.N. Probability and Statistics in Civil Engineering; Nichols Publishing Company: London, UK, 1986; 244p. [Google Scholar]
  56. Naser, A.H.; Badr, A.H.; Henedy, S.N.; Ostrowski, K.A.; Imran, H. Application of Multivariate Adaptive Regression Splines (MARS) approach in prediction of compressive strength of eco-friendly concrete. Case Stud. Construct. Mater. 2022, 17, e01262. [Google Scholar] [CrossRef]
Figure 1. The M5 model tree (adapted from [42]).
Jcs 06 00366 g001
Figure 2. M5 tree flowchart.
Jcs 06 00366 g002
Figure 3. M5P algorithm-based tree developed to estimate the torsional resistance of RC beams.
Jcs 06 00366 g003
Figure 4. Comparison of the performance of (a) M5P and (b) MLNR models for the training and testing datasets.
Jcs 06 00366 g004
Figure 5. Relationship between the variables and the ratio of experimental to predicted torsional strength.
Jcs 06 00366 g005
Table 1. The input and output parameter ranges for the training and testing sets.
StatisticsSubsetMinMaxMeanSTD
A c (m2)Training0.040.370.150.10
Testing0.050.360.150.09
f c (MPa)Training13.1109.847.123.50
Testing17.196.845.120.61
A l f y l A t f y t / s Training1.19 × 106531.30 × 10637.27 × 10661.15 × 106
Testing1.13 × 106310.78 × 10632.35 × 10657.34 × 106
T R (kN.m)Training8.99521.3392.48101.01
Testing12.30467.2690.7995.04
Table 2. Coefficients for Equation (4) predicted from the model tree.
Linear ModelCoefficient
a b c d
LM14.53110.31080.77390.1491
LM21.82520.27651.11610.2883
LM31.98520.28661.07740.272
Table 3. Reference beam attributes from the testing dataset.
TR(exp) (kN.m) f c   (MPA) A c   (m2) A l f y l A t f y t s  
37.4828.070.09812090616
Table 4. M5P and MLNR model performance in predicting the torsional strength for training and test datasets.
StatisticsMAERMSERR2
TrainingM5P8.27913.2880.9910.983
MNLR9.43513.9080.9890.979
TestingM5P8.22413.4320.9900.981
MNLR9.22414.4380.9800.960
TotalM5P9.52114.6630.9900.981
MNLR10.24015.0490.9800.960
Table 5. Accuracy of other models for predicting the torsional strength with M5P and MLNR.
MAERMSER2 x ¯ COV %
SNiP18 [9]23.168035.01180.93321.358430.6947
ACI 318-19 [10]22.311336.83490.96191.277726.3644
MC10 [12]19.987632.70770.89751.218344.7848
EC2 [13]16.467224.81020.93851.135923.0495
CSA14 [11]14.052429.55980.93991.027919.2282
Rahal [2]11.104017.01980.97051.074712.1034
MLNR (this study)9.224014.43800.9601.054413.9623
M5P (this study)8.330013.43210.98071.041911.6419
Table 6. Effect of input variables on the performance of the suggested ML models.
ModelsInput Variable Training SetTesting Set
MAERMSER2MAERMSER2
M5P A c ,   f c ,   A l f y l A t f y t / s 8.27913.2880.9839.22414.4380.980
f c ,   A l f y l A t f y t / s 36.91660.5540.78029.81653.6990.834
A c ,   A l f y l A t f y t / s 11.00415.6880.98012.05416.6990.970
A c ,   f c 20.36238.6270.86320.34734.2400.917
MLNR A c ,   f c ,   A l f y l A t f y t / s 9.43513.9080.9799.22414.4380.980
f c ,     A l f y l A t f y t / s 46.40672.7100.60951.44278.2150.638
A c ,   A l f y l A t f y t / s 11.00417.1450.97310.48516.0850.972
A c ,   f c 20.36238.6270.86320.34734.2400.917
Publisher’s Note: MDPI stays neutral with regard to jurisdictional claims in published maps and institutional affiliations.

