1. Introduction
Modern vehicle design is unthinkable without the use of crash simulation, especially when designing parts with intricate geometries or using materials with difficult material properties. Access to precise material data is a prerequisite for high-quality simulations. Parameters are frequently determined by tests on new material samples, particularly in the case of plastics. Since not only new cars drive on roads, the installed components are frequently in use for a number of years and are subjected to mechanical stresses. Although it might appear unimportant for steel structures, preceding stresses—regardless of whether they caused minor impact or fatigue damage—can have an impact on the material behaviour of fibre-reinforced polymers [
1]. A model to take into consideration fatigue damage from service loads on short-fibre reinforced thermoplastic (SFRT) components following crash failure is presented in this work.
Before running the real structural simulation, a closer look into the manufacturing process is required to assure sufficient results. This is necessary because the injection moulding process has a considerable impact on the orientation and distribution of the reinforcing fibres [
2]. SFRT components are widely utilized in automotive engineering and medical aid devices [
3]. Here, they are used particularly for the serial manufacture of passenger automobiles, because of their suitability for large-scale production and affordable fabrication via injection moulding. The process offers a high degree of precision and process reliability in component manufacture and is therefore ideally suited for the production of SFRT. However, it must be noted that the flow conditions within the mould of the injection moulding determine the fibre orientation. Anisotropy, non-linearity, and strain rate dependence are characteristics of the material behaviour of thermoplastics with short fibre reinforcement. The elongation at break usually decreases, while strength increases with rising strain rate. As part of the structural simulation, precise modelling of the component stiffness is made possible by knowledge of the fibre distribution [
2].
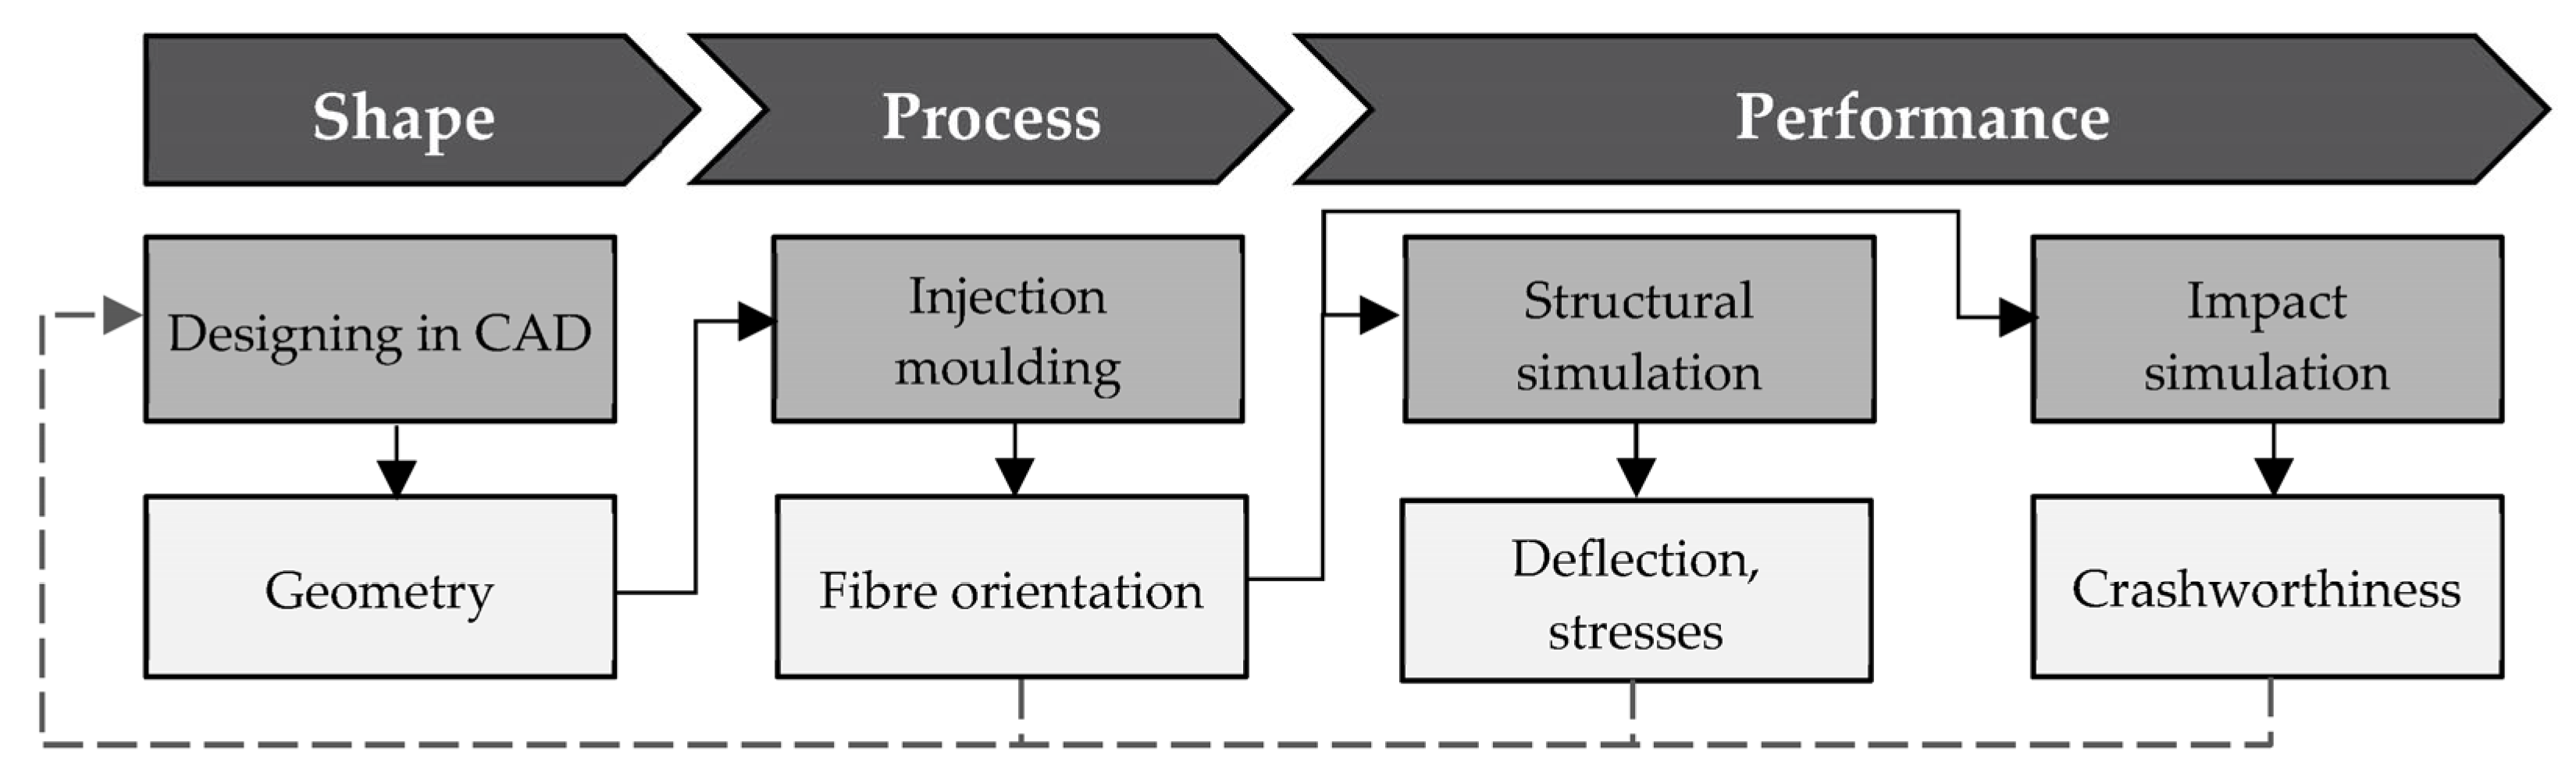
Figure 1 provides a schematic illustration of the component design process chain for SFRT. This makes lifetime analysis [
4] and the evaluation of component behaviour under crash load [
5] possible, in addition to stress and deformation states under static load.
Although there are evident correlations between the evaluation of crash behaviour and component behaviour under cyclic loading, these were performed largely independently up until now [
6]. To comprehend the effects of cyclic loading on a material, Günzel [
7] offers an experimental-analytical technique, and Bauer [
8] offers a computational approach. Bisagni and Walters conducted research into the fatigue strength of graphite-epoxy composites following preceding, smaller, less severe stone strikes in [
1]. For the opposite topic, namely the analysis of the crash behaviour after a previous cyclic load and the associated weakening of the material, no new research approach has yet been developed. Instead, the required material parameters are determined with new, undamaged test specimens for later use in the crash simulation. In order to avoid adverse effects of material degradation, the design of relevant components has so far been particularly conservative. However, the associated over dimensioning clearly contradicts the concept of lightweight design. In order to allow efficient component dimensioning in line with the stresses, the mechanical stress history should therefore be considered with regard to material failure. The next chapter will highlight the experimental investigations and modelling required for this.
2. Modelling of Crashworthiness after Fatigue Damage
The fatigue behaviour of SFRT implies that there is a need for action to address the effects of mechanical ageing within numerical simulation, particularly in the simulation of crash situations. The material parameters used for the simulation, which are based on the analysis of new samples, cannot reflect the described effects of material degradation over the service life. The parameters of stiffness and strength measured on the new specimens can, however, sometimes deviate significantly from those that can still be reached after recurring cyclic loading. With the characteristic values described, it is therefore not possible to accurately assess the product safety of components made of SFRT over the entire life cycle. For this reason, over dimensioning is used, which is in stark contrast to the idea of lightweight construction.
As a result, a concept to address this desire is offered below.
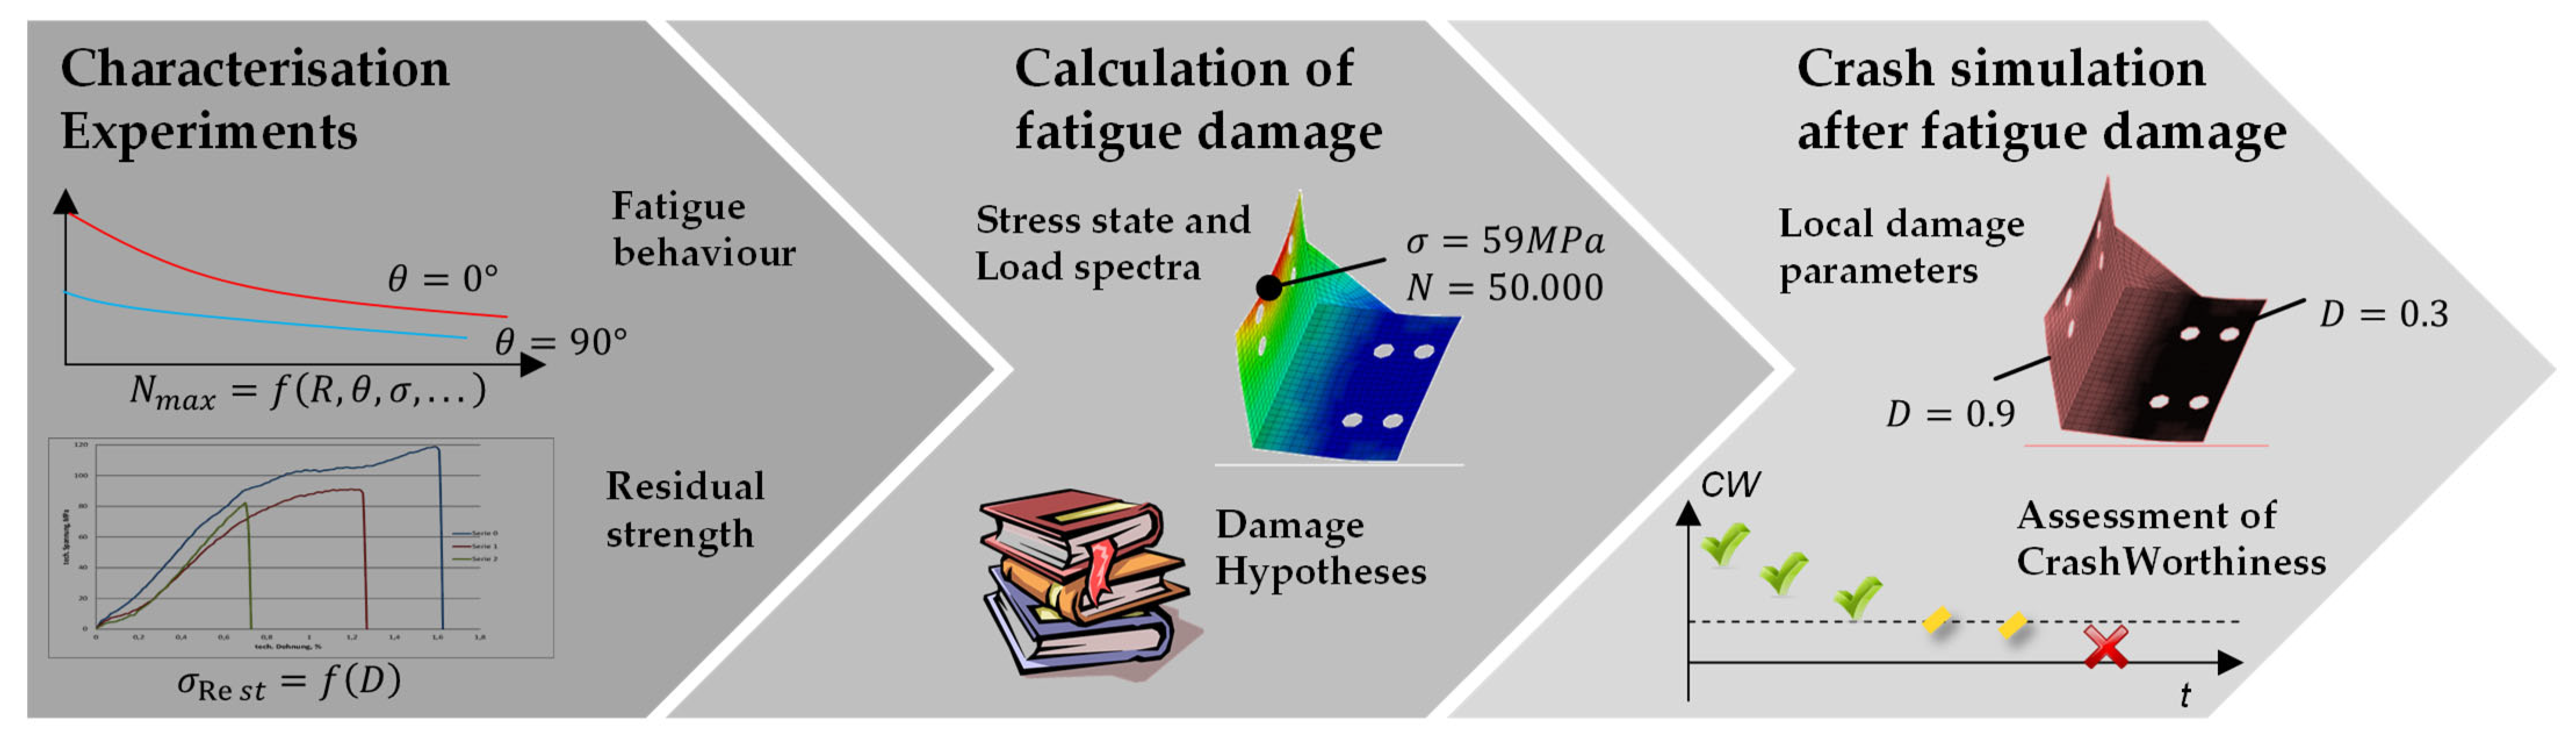
Figure 2 shows the main steps of the modelling approach. This starts with the experimental characterisation. In this step, static, cyclic and high-speed experiments have to be carried out, which provide information about the anisotropic stiffness and strength characteristics of the material under static and load application as well as high strain rates. Furthermore, the cyclic experiments provide the required characteristics with regard to the direction-dependent fatigue strength as well as the damage progression over the service life. In the next step, the damage distribution in the component under consideration is calculated on the basis of the stresses resulting from the service loads. Information about the stress state in the component is often already available in product development from simulations to ensure the product properties in use. Based on this, and using the experimental results, the damage distribution in the component is calculated. Here, the knowledge of which material parameters can be transferred to the following crash simulation is used. In addition, the predicted local damage is taken into account.
2.1. Characterisation of Material Behaviour and Degradation
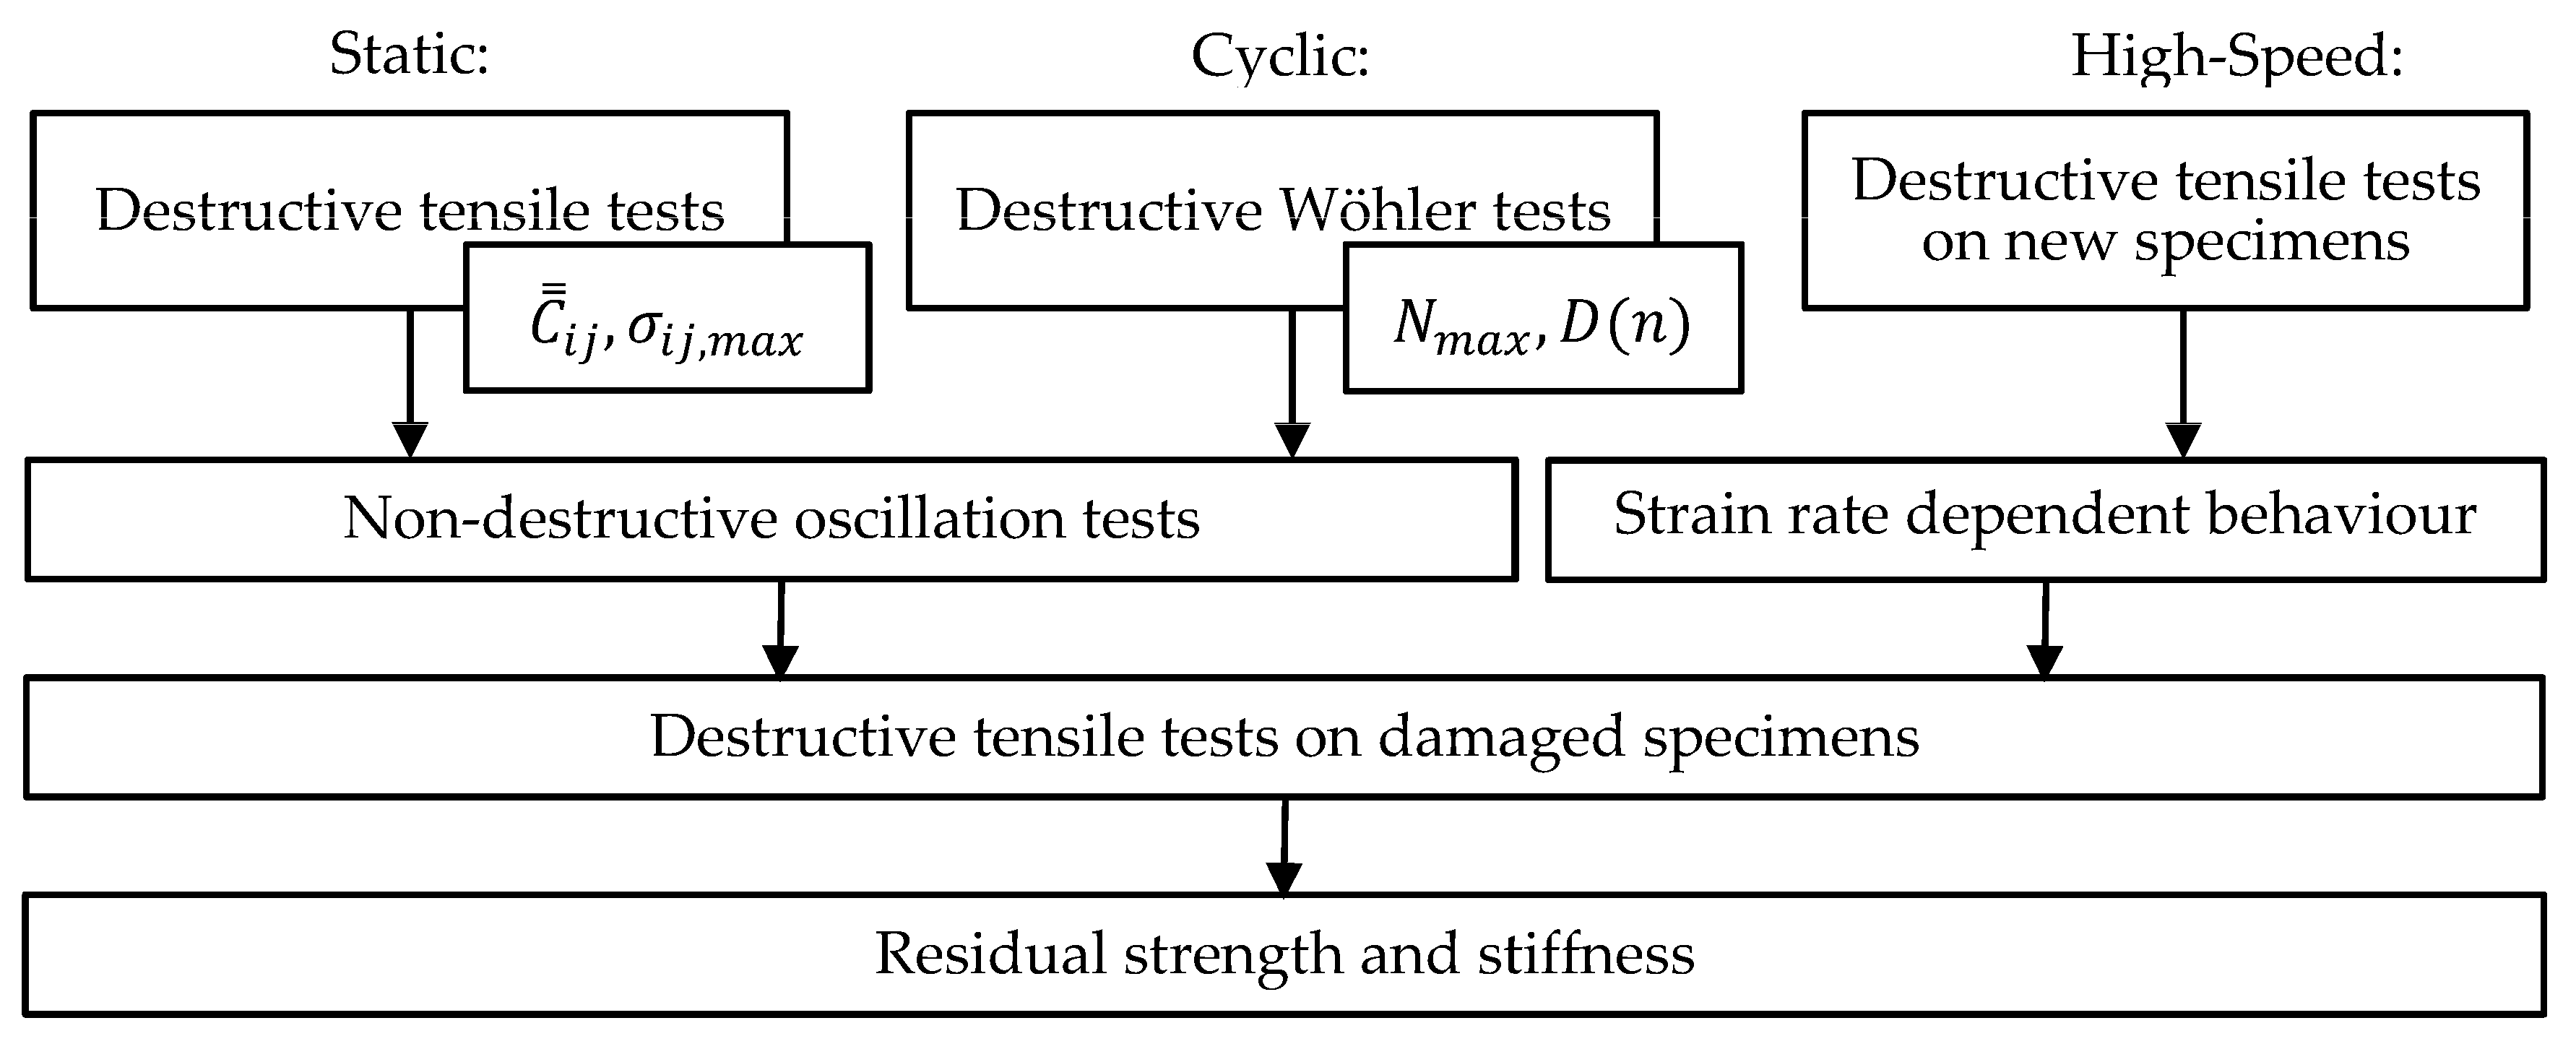
The experiments required for material characterisation can be divided into static, cyclic and high-speed tests, as shown in
Figure 3. The destructive tensile tests to be carried out first on new samples provide information about the direction-dependent stiffness and strength of the SFRT. They are thus an essential basis for the subsequent cyclic and impact-dynamic experiments. The destructive tensile tests on virgin specimens run at elevated load speed provide a description of the strain-rate-dependent material behaviour. The material description of the unused material is extended in such a way that the anisotropy and strain rate dependence of plasticity and failure are considered.
The novelty of the presented approach lies especially in the integration of cyclic tests into the characterisation. Destructive cyclic tests can be used to determine the direction-dependent vibration resistance of the material as well as the damage growth in the material. Based on the knowledge gained in this way, specimens with deliberately induced pre-damage are generated from non-destructive cyclic tests. These are then examined in highly dynamic tests for their residual stiffness and residual strength. In this way, the material model for the crash simulation can be extended to consider previous fatigue damage.
2.2. Determination of Fatigue Damage
The distribution of damage in the component depends on the prevailing stress state and the number of load cycles. To determine the predominant stress state in the component, the service load case is simulated as a single, static load. The material behaviour of the SFRT must be taken into account at least by considering the anisotropy in the elastic range. Stress beyond the elastic range or under increased strain rates is not to be expected when considering the service load. The solution of the model in the static case can generally be found numerically using implicit solving methods. The simulation provides the stress state for each finite element in the material coordinate system.
With the additional information about the number of load cycles, the damage can be calculated for each element. This calculation is performed outside the simulation environment and requires knowledge of the maximum number of cycles the material can withstand under the existing stress condition. The expected damage is calculated as follows:
where
n is the number of load cycles with which the given load case occurs, and
A and
B are material parameters determined by analysing the damage progress in the cyclic characterisation. The maximum tolerable number of oscillations,
, for the given stress condition is initially unknown and must be determined from destructive Wöhler tests, then calculated as:
Here,
,
and
are the fibre-parallel and perpendicular stresses present in the element and the shear stress present. The material parameters
,
and
denote the fatigue strength limit values, i.e., the axis intercepts of the respective S-N curve with the stress axis [
9]. The parameter
b, which is also material-dependent, corresponds to the slope of the S-N curve. In this way, the damage
D caused by the
n-times load with the service load can be calculated for each element of the simulation. At the same time, this calculation step can also be used to estimate the service life that can be achieved.
2.3. Determination of Residual Strength
The Tsai–Hill criterion is a failure criterion that is extensively used in the failure modelling of SFRT materials. It is an interactive failure criterion that combines the stress tensor components into a functional that indicates failure when a threshold level is achieved [
10]. The Tsai–Hill theory extends the concept of the classical von-Mises yield-surface towards orthotropic materials, also describing an elliptically shaped failure body within stress space. Stress states within the failure body are tolerable; stress states that lie outside of it will lead to failure. Although interactive criteria do not provide information on failure modes, they are widely utilized to determine the failure of composite materials in finite element simulations due to their ease of implementation [
10]. Other related criteria include Tsai–Wu and Puck, the latter of which is usually employed for laminated composites.
The Tsai–Hill criterion is derived from Hill’s yield criterion [
11] and can be simplified for transversely isotropic materials to:
The values of the failure parameters
,
and
will be determined experimentally on injection-moulded coupons. The testing directions here are perpendicular to the flow direction, while the strength of the material is evaluated under tensile and compressive loading. The fibre parallel strength is denoted by
, the transverse strength by
, and the shear strength by
[
10].
Paepegem and Degrieck [
12] provide a linked modelling technique for the fatigue behaviour of continuous fibre reinforced composites and its impact on residual strength. The static Tsai–Wu failure criterion was updated and utilized to correlate strength and stiffness and so indicate residual strength loss. The fatigue effect was expressed by incorporating the damage parameter
D into the calculation for the corresponding residual strengths. Based on Shokrieh and Lessard’s [
13,
14] observations of studies on unidirectional graphite/epoxy specimens, which show that the slopes of the residual stiffness and residual strength curves are similar in shape, the following relationship is introduced:
The residual tensile strength is denoted as , while the tensile stress is denoted as XT. A value less than one is recommended for the power p since a value greater than one implies that the strength degrades quicker than the stiffness. Uniaxial fatigue bending studies on plain woven glass/epoxy specimens verified this concept. The model is based on how their stiffness diminishes in general, and delamination mechanisms are ignored in this one-dimensional model. Due to its generality, the model could be transferred to the situation of uniaxial tensile load cases on fibre reinforced thermoplastics.
3. Materials and Experimental Studies
This study examined PBT GF30, a short-fibre reinforced polybutylene terephthalate with 30% glass fibre content. Several experimental investigations were used to identify the material parameters: To guarantee repeatability with regard to real loads and to produce the desired damage, coupons were subjected to cyclic loading with various amplitudes and durations. After this first damage, high-speed tensile tests were carried out to ascertain the samples’ remaining strength, and the outcomes were compared to those of the undamaged samples. The subsequent finite element simulation, which was then validated by experimental findings, was built on the parameters of the determined material. The following steps must be taken in order to determine the crash-relevant residual strengths, as suggested in [
15,
16,
17,
18]:
Static and high-speed tensile tests on virgin specimens to ascertain the elastic moduli and strengths of the virgin material with various fibre orientations;
Destructive cyclic tests to identify the damage progression and orientation angle-dependent S-N curves that represent fatigue behaviour;
Non-destructive cyclic tests for individual specimen pre-damage;
Highly dynamic tensile tests on pre-damaged specimens for comparison with the undamaged specimens and for validation of the models used to predict the residual strength.
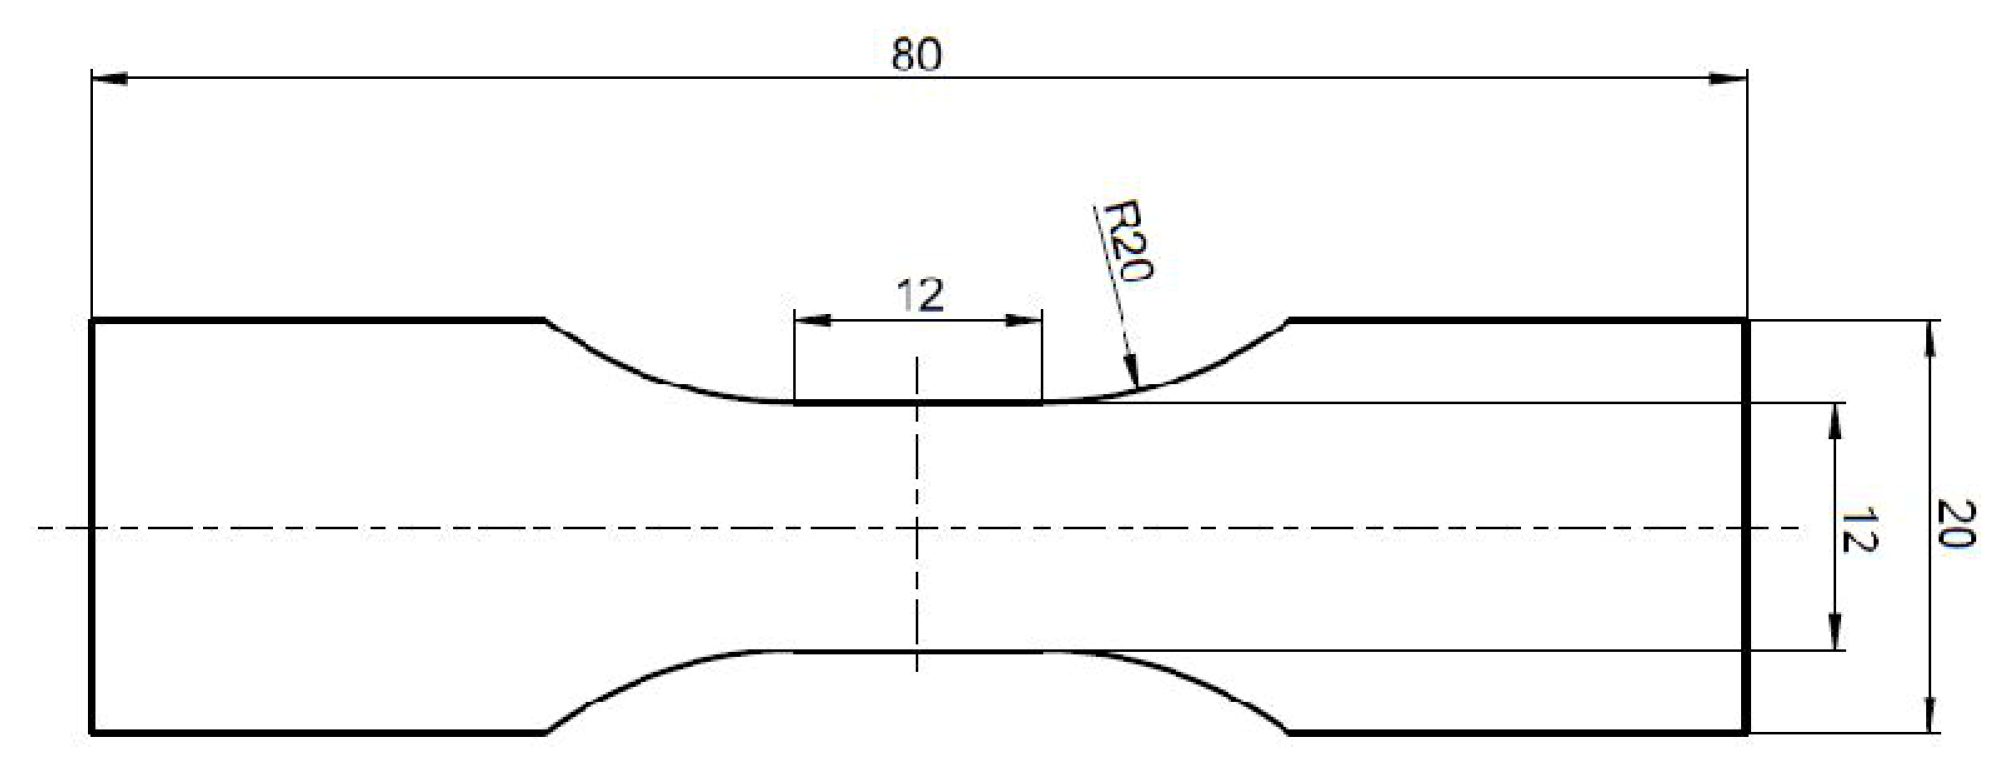
The studies given here were conducted with Becker tension rods (
Figure 4), which feature a 12 mm long parallel area that is relatively small compared to longer tensile specimen and enables high strain rates at moderate loading speeds.
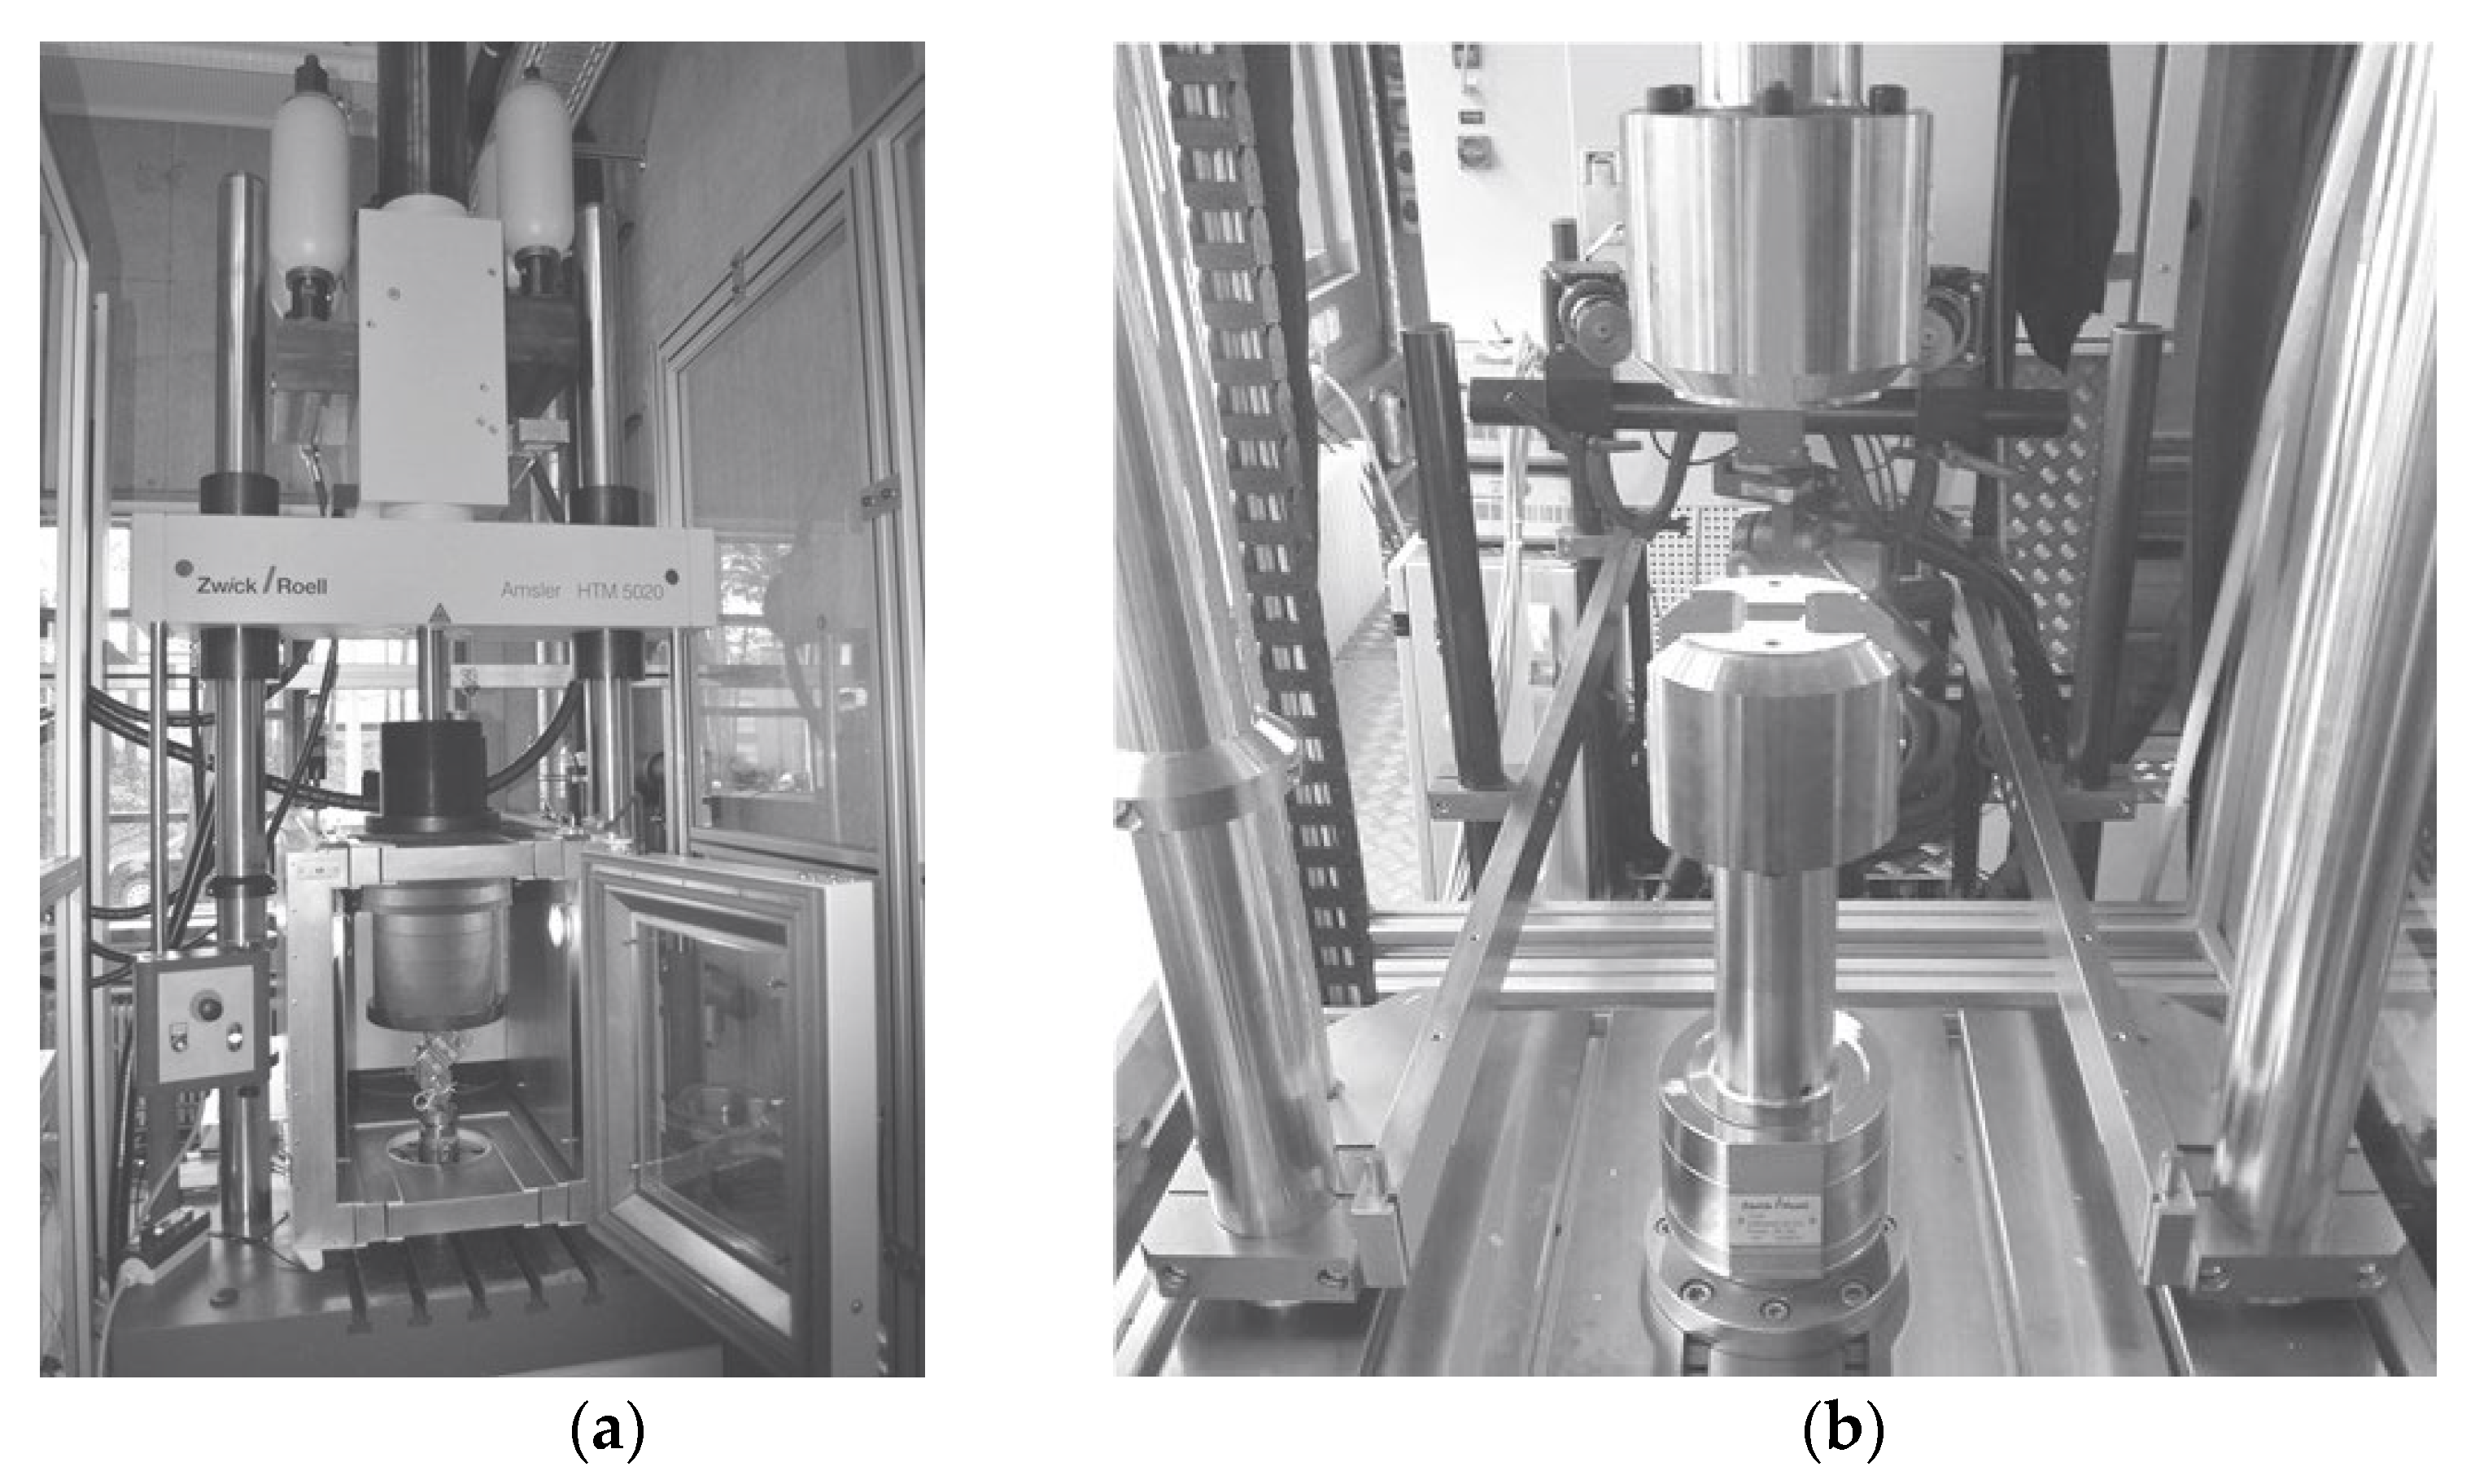
3.1. High-Speed Tensile Testing
High loading speeds were employed to establish crash-relevant material parameters on a Zwick HTM 5020 high-speed servo-hydraulic testing machine (see
Figure 5a). Tensile testing is permitted with stresses up to 50 kN and speeds ranging from 1 mm/s to 20 m/s. For the chosen specimen geometry, all tests were run at nominal speeds of 2 m/s, resulting in nominal strain rates of 166.7 s
−1. By means of digital image correlation, the actual strain rates were calculated. The force was measured with a piezoelectric force transducer capable of handling loads up to 10 kN. The high-speed test used both virgin specimens and specimens that had already been damaged in earlier non-destructive cyclic tests.
3.2. Cyclic Testing
A servo-hydraulic pulser Zwick HCT 25 was used to study the behaviour of materials under oscillating loads (see
Figure 5b). At frequencies up to 30 Hz, it can achieve axial tensile and compressive stresses of up to 25 kN. All experiments were conducted at a temperature of 23 °C. The testing device’s piezoelectric load cells were used to measure the forces. Inductive displacement sensors are able to measure piston movement, specimen deformation is tracked by means of digital image correlation. For the present characterisation, Bernasconi et al.’s recommendations [
9,
19] were followed, resulting in a pulsing tensile stress condition with a stress ratio
R of 0.1 between the minimum and maximum stress. The test frequency was capped at 4 Hz to prevent a significant temperature increase on the specimen from internal friction. A quick loss of strength and undesirable thermal failure are caused by temperature increases of greater than 10 °C. As a result, an infrared thermometer was used to measure and record the surface temperature of the test specimen. All tests were load-controlled, so even after a change in the material’s stiffness, the mean stress and stress amplitude remained constant. Static strength characteristics were used to calculate the initial load horizons for characterizing the S-N curves. For destructive fatigue tests, specimen separation served as the failure criterion; for non-destructive, pre-damage tests, the tests were terminated once the desired number of cycles had been completed.
In order to ensure efficient test performance, the location of the selected test points is crucial. Test results that lie in the middle of the fatigue strength curve contribute less to the accuracy of the slope estimation of the S-N curve than those that lie closer to the transition areas [
20]. According to Masendorf et al., it depends on how many specimens are necessary for reliable statements and how these available specimens are distributed to the loading horizons [
20].
3.3. Digital Image Correlation
Data analysis in the field of material characterization frequently uses the digital image correlation (DIC) approach to evaluate coupon deformation. One or more cameras record the specimen while it is subjected to loads. As opposed to techniques such as contacting extensometers or attached strain gauges, non-contact measurement has no influence on the test results. Through the application of a stochastically dispersed greyscale pattern to the coupon’s surface, the deformation of the coupon was computed. An example is shown in
Figure 6.
3.3.1. DIC in High-Velocity Testing
In the case of the high-velocity tensile tests, the aim was to completely record a single tensile test that lasts only a few milliseconds. For this purpose, the high-speed camera system GOM ARAMIS 3D HHS was used, as shown in
Figure 6. The Photron Fastcam SA5 cameras used in the system achieve recording rates of 93,000 Hz at a shutter speed of 1/99,000 s for the relevant image section. Due to the short exposure time, a correspondingly strong object illumination was necessary. This was only activated shortly before the start of the recording in order to avoid heating the sample.
As soon as the cameras were switched to standby, they continuously recorded images into a ring buffer, which was overwritten each time. After the trigger signal was received, the images were retained. At trigger time, a so-called TTL signal (transistor-transistor logic) was sent from the testing machine to the cameras. This happened a few milliseconds before the calculated time of the force closure in the lead section of the test setup. For the evaluation of the tests as stress–strain diagrams, the measured force values were also recorded image-synchronously.
3.3.2. DIC in Cyclic Testing
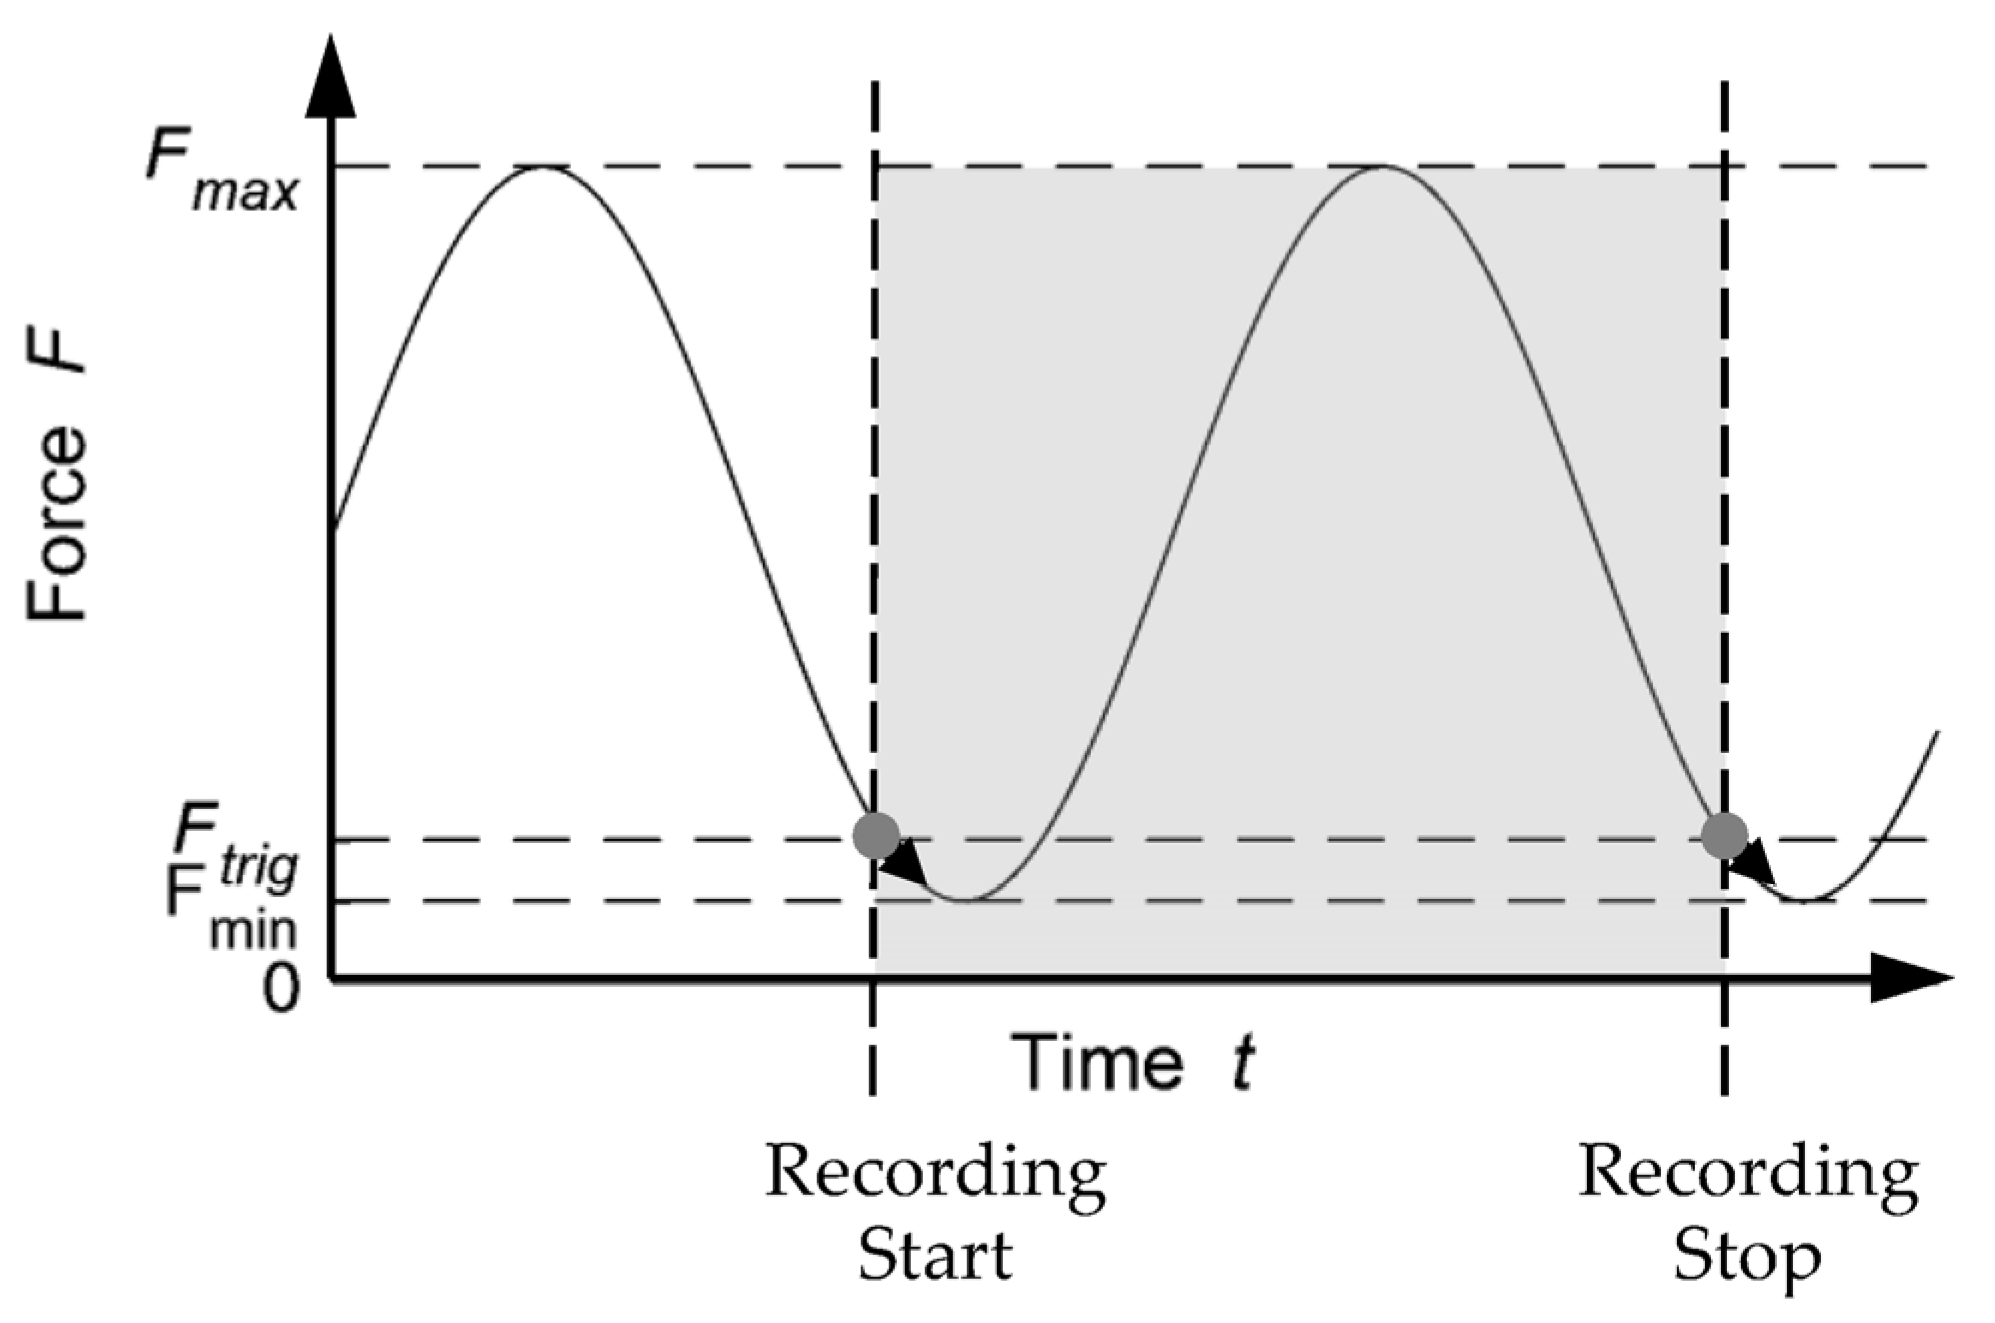
The objective of the optical strain measurement in the cyclic experiment was to analyse the loss of stiffness within the specimen over the duration of the test. The commercial system GOM ARAMIS 3D 4M was used for this purpose. Due to the long duration of the experiments, it was not possible to record the deformation of the sample permanently. The resulting data volumes would clearly exceed a manageable level. Instead, a complete loading and unloading of the specimen must be recorded at certain intervals, depending on the expected total running time. By linking the camera system with the force measurement of the test stand, it was possible to trigger the recording on the basis of the measured force.
Figure 7 illustrates a part of the measuring procedure. A trigger force
was defined, which should be just above the lower force
. When this trigger force was crossed in a falling manner, i.e., with a negative gradient, a continuous recording began with a recording rate of 120 Hz. The recording continued until the trigger force was crossed again with a negative gradient. This was followed by a pause of
n seconds until the next recording could start.
A complete loading and unloading of the specimen could thus be captured without having to record every cycle. Excessive data were avoided by appropriately defining the pause time between measurements based on the projected total duration of the experiment. On this basis, the modulus of elasticity of the
n-th cycle was determined according to DIN ISO 527-1 [
21] as the increase of the stress–strain curve. This was set in relation to the initial value, i.e., the modulus of elasticity of the first oscillation, in order to obtain the relative drop in stiffness.
4. Results of Experimental Studies and Simulations
In the following section, the results of the residual crashworthiness and the simulation based on it are presented. An analytical model was first calibrated from the determined failure values, which was then implemented in the simulation.
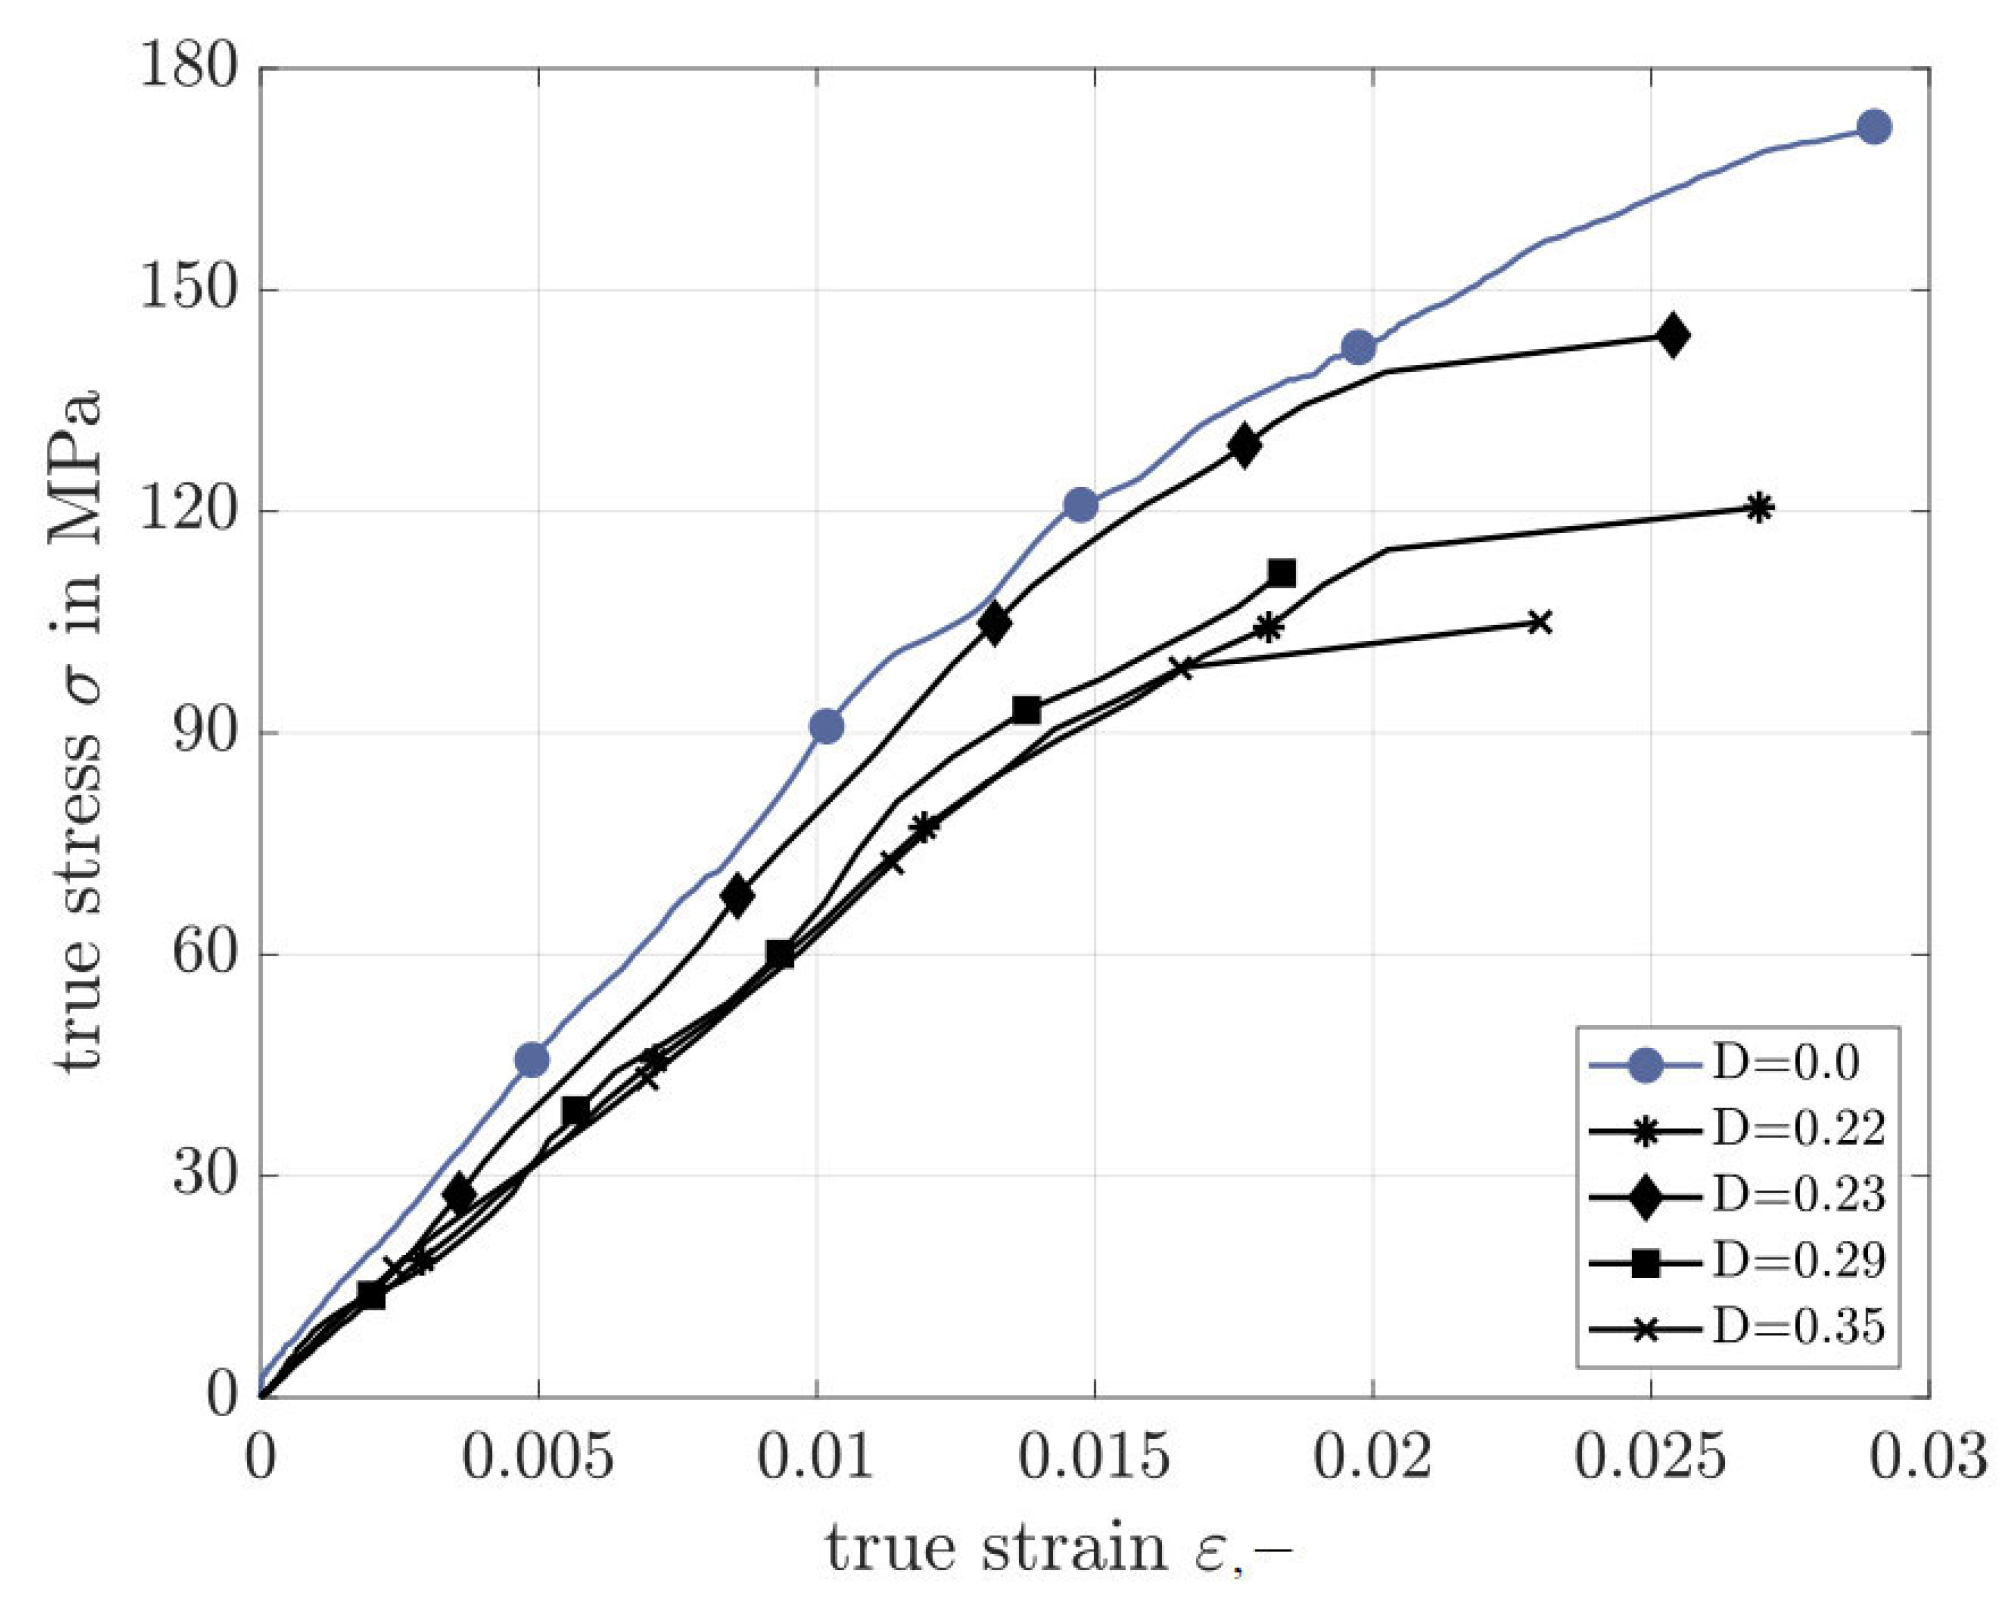
4.1. Residual Crashworthiness
Figure 8 shows a comparison of the stress–strain curves of the undamaged specimens with the various damaged specimens for the 0° orientation. There is a clear decrease in the tolerable stresses for the damaged specimens. The values of the maximum stresses of the curves shown here range from 144 MPa to 105 MPa for different pre-damaged specimens. In contrast, undamaged specimens reach an average failure stress of 173 MPa with a standard deviation of 2.2 MPa.
The available results are subject to significant scatter. For example, the strength of a specimen with pre-damage
D = 0.46 of 121 MPa is still just above that of a less pre-damaged specimen (
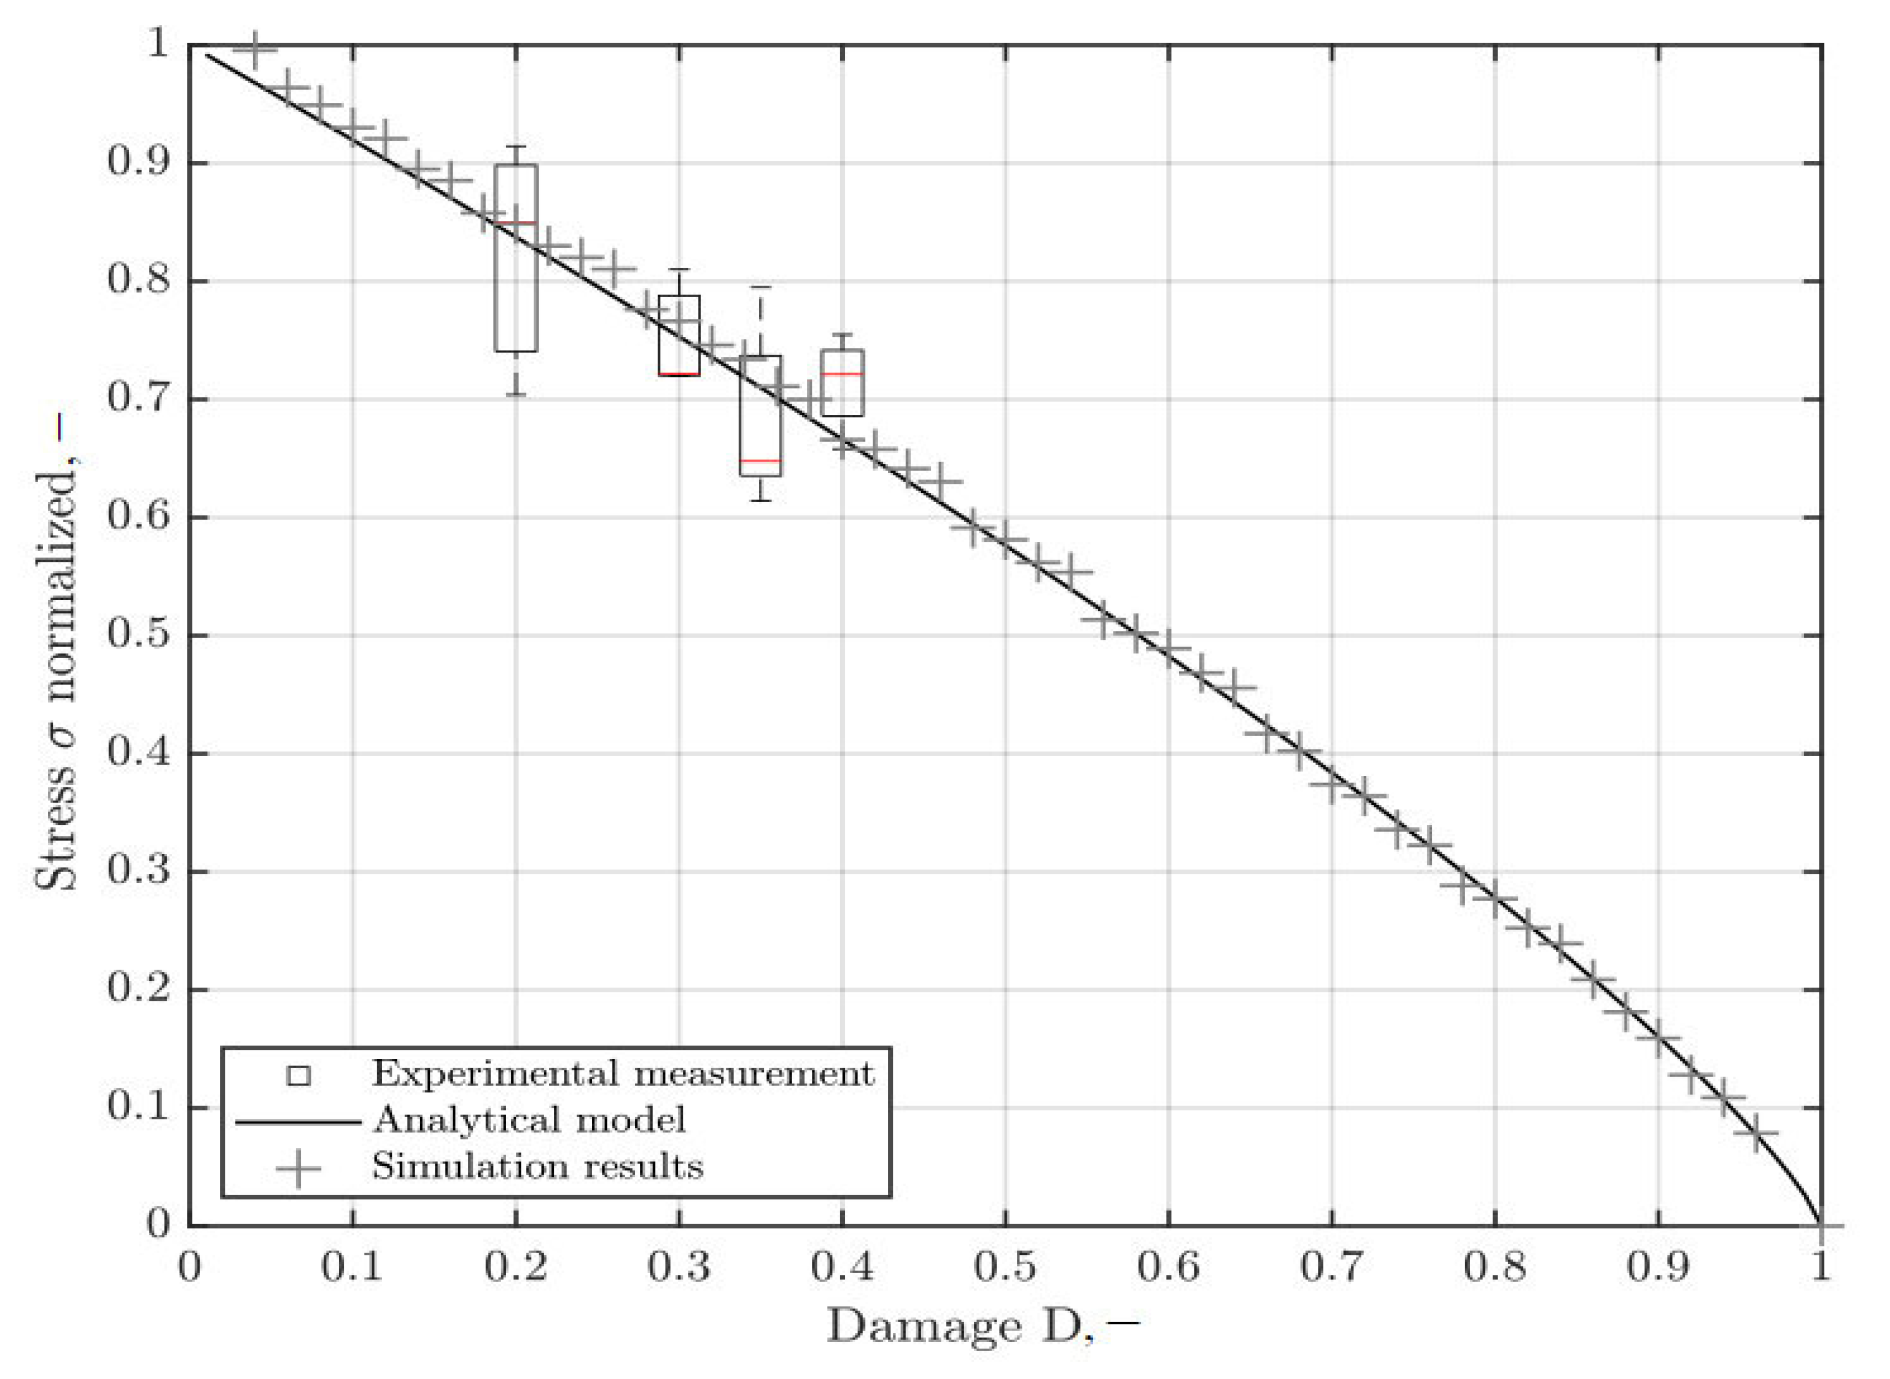
D = 0.30) of 120 MPa. Nevertheless, a correlation between increasing pre-damage and decreasing residual strength can be demonstrated, which is shown in
Figure 9. The maximum stress normalised to the initial value is plotted against the damage; the scattering variables are considered in the representation by boxplots. Also shown is the analytical relationship between residual strength and damage described in Equation (4), whose parameter
p is calibrated against the experimental results. It extends Equation (3) presented in
Section 2.3 by taking damage into account. With a determined value of
p = 0.80, the model provides a coefficient of determination
R2 = 0.88 and at the same time confirms van Paepegem’s estimate that this exponent should be below 1 [
12].
The model shows good agreement with the experimental results up to a damage range of at most D = 0.5. After exceeding a damage value of 0.5, the damage increases rapidly until the material fails. Therefore, no specimens from this damage range can be used for calibration. However, this range of critical damage growth above D = 0.5 should be avoided by design measures anyway. Component failure due to fatigue damage can then no longer be ruled out. Accordingly, the validity range of the analytical model is determined up to a degree of damage of 0.5 and can be estimated as sufficient under the mentioned aspects.
4.2. Implementation to Simulation
To be able to simulate the indicated effects, a model of the tensile tests is employed, as it is also used to calibrate the underlying material model; the model parameters have to be discussed. This is the mid-surface model of the Becker tensile member discretized with fully integrated shell elements (ELFORM 16, [
22]). The edge lengths in the parallel area are 2 mm and thus correspond to the meshing with which the undamaged material model was also calibrated. This method eliminates the effects of mesh dependence, which would otherwise falsify the comparison of simulations of damaged and undamaged samples, as well as the comparison of simulation and experiment [
23,
24]. The specimen is secured by a rigid beam spider in the moving upper area and by securing all nodes in the lower jaw area. The force or displacement over time is applied to the spider’s central node, as it occurred in the trials. Using constant values for the nominal take-off speed, which is not possible in the experiment, might result in falsifying effects.
Based on the experiments, the simulation’s assessment parameters are the force reaction of the lower restraint as well as the averaged stress and strain of the elements in the parallel area of the tension rod.
The failure model described in Equation (5) was tested using the tension rod simulation model: after applying the service load, the resulting stress state was established, from which the damage could be estimated. The explicit modelling of the overload was performed using the later altered material parameters, particularly the failure. In
Figure 9, the simulation implementation of the weakened material data is compared to the analytical model. It compares the normalised failure stresses of the two models. A very good agreement may be noticed with a coefficient of determination
R2 = 0.98 of the simulative vs the analytical data. Thus, the transfer of material properties might be called functional.
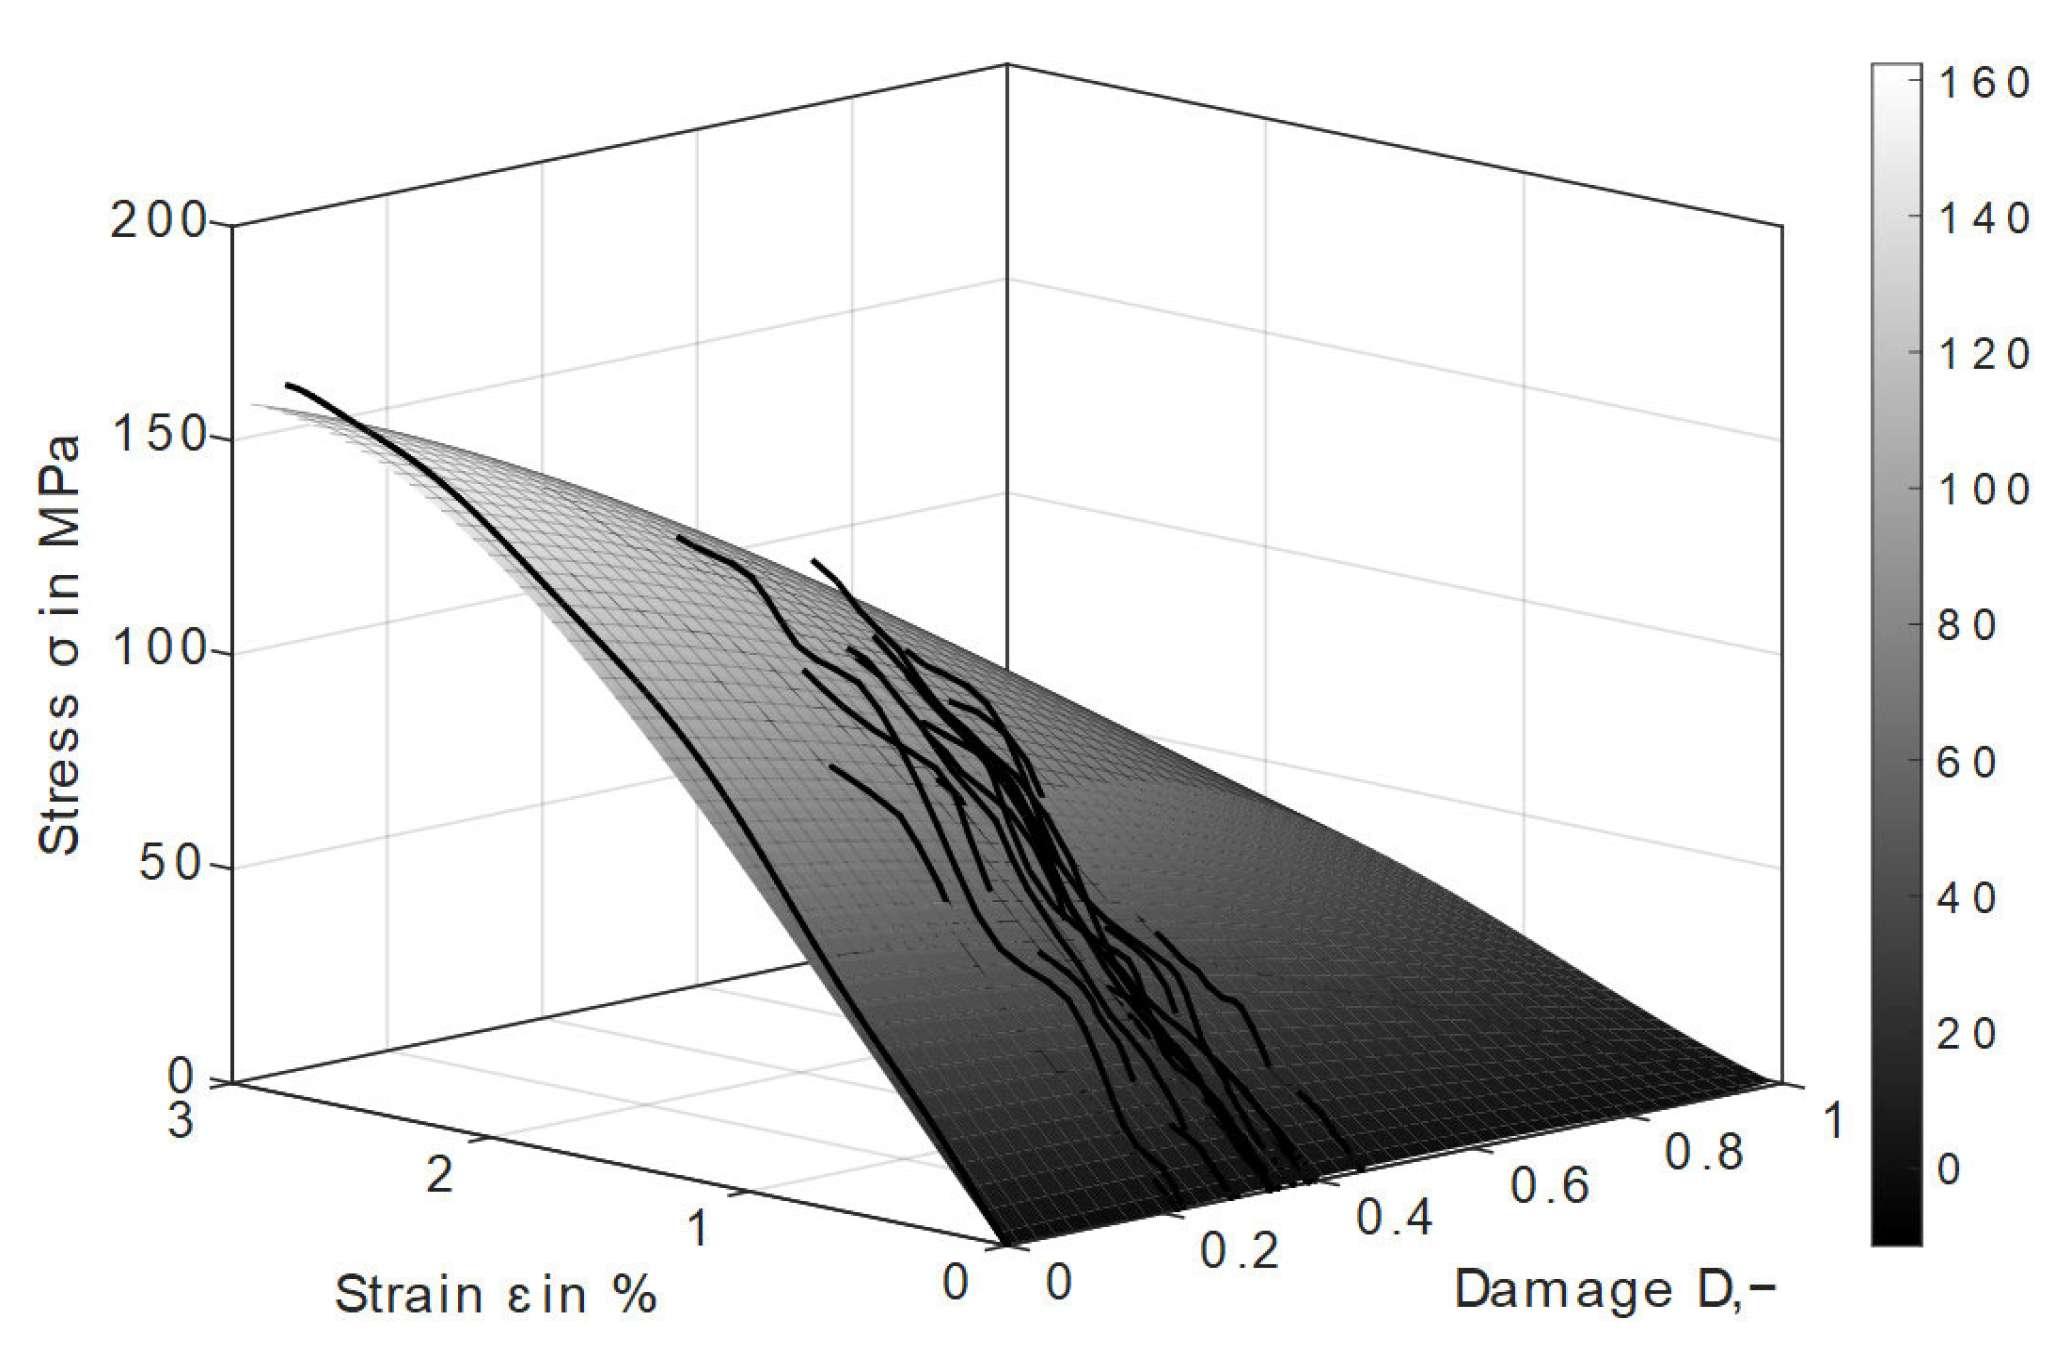
Aside from comparing the scalar failure stresses, the overall curve shapes are also of importance.
Figure 10 depicts the recorded stress–strain curves of specimens with varying degrees of damage (black curves) prior to the simulative prediction, which is depicted as a response surface. The surface was created by performing a finely sampled parametric study of the damage in
D = 0.01 stages, and it provides a continuous link between the injected damage and stress–strain curves. The plot illustrates that, as the damage progresses, not only the maximum stress but also the slope of the curves decreases. The simulation method description quality can be considered very acceptable, with a coefficient of determination
R2 = 0.983 for the plane of the tensile specimens.
The suitability of the failure model with consideration of the pre-damage can thus be proven for single-stage, uniaxial load cases. The implementation of the failure model in the numerical simulation by transferring the failure characteristics via the interface * INITIAL_STRESS_SHELL can be considered successful.
5. Summary and Conclusions
The failure of SFRT is frequently modelled using criteria such as the Tsai–Hill failure criterion. However, previous recurrent stresses from operational load situations and the resulting fatigue damage were not considered in the failure parameters used. This work proposes an extension of the Tsai–Hill failure model based on preliminary models for evaluating the residual strength of continuous fibre-reinforced laminates under static stress. The suggested model takes fatigue damage into account for SFRT subjected to impact stress.
After that, the pre-damaged specimens were subjected to high-speed tensile testing and compared with the new material. Relative residual strength losses of 10% to 40% were discovered for samples with damage between 0.2 and 0.45. The acquired experimental data allowed the analytical model to be calibrated with a coefficient of determination of 0.88. Based on the findings, it is reasonable to conclude that the generated models allow for the consideration of the crash behaviour of components made of SFRT not only in the new state, but also over the full-service life. Even for high-mileage vehicles, fatigue damage must be considered to determine actual crashworthiness.
Nonetheless, more research in the indicated field is required. The model described, which has so far only been evaluated for tension rods exposed to uniaxial loading, will be extended in the future to other, more complex geometries and loading situations.
Author Contributions
Conceptualization, C.W. and S.W.; methodology, C.W.; validation, C.W.; formal analysis, C.W.; investigation, C.W.; resources, C.W.; data curation, C.W.; writing—original draft preparation, C.W. and P.S.; writing—review and editing, P.S. and S.W.; visualization, C.W. and P.S.; supervision, S.W.; project administration, S.W.; funding acquisition, S.W. All authors have read and agreed to the published version of the manuscript.
Funding
The testing equipment used in this research was funded by the German Research Foundation under grant numbers INST 90/750-1 FUGG and INST 90/1024-1 FUGG. The authors furthermore acknowledge financial support by Deutsche Forschungsgemeinschaft and Friedrich-Alexander-Universität Erlangen-Nürnberg within the funding programme “Open Access Publication Funding”.
Acknowledgments
The authors thankfully acknowledge the company 4a engineering, especially Peter Reithofer, for providing the sample material. The authors would also like to thank Jessica Giolda and Marcel Sauer for their valuable work during their theses.
Conflicts of Interest
The authors declare no conflict of interest.
References
- Bisagni, C.; Walters, C. Influence of impacts on static and low-cycle fatigue characteristics of composite specimens. Int. J. Crashworthiness 2013, 18, 139–151. [Google Scholar] [CrossRef]
- Steck, P.; Scherb, D.; Miehling, J.; Völkl, H.; Wartzack, S. Synthesis of passive lightweight orthoses considering humanmachine interaction. In DS 119: Proceedings of the 33rd Symposium Design for X (DFX2022), Hamburg, Germany, 22–23 September 2022; The Design Society: Glasgow, UK, 2022; p. 10. [Google Scholar]
- Klein, D.; Witzgall, C.; Wartzack, S. A novel approach for the evaluation of composite suitability of lightweight structures at early design stages. In Proceedings of the International Design Conference, DESIGN, Dubrovnik, Croatia, 19–22 May 2014; pp. 1093–1104. [Google Scholar]
- Hartwich, T.S.; Völkl, H.; Franz, M.; Witzgall, C.; Krause, D.; Wartzack, S. On the necessity of a construction-methodological approach for the time-proof design of endless fiber-reinforced plastic components. In DS 98: Proceedings of the 30th Symposium Design for X, DFX 2019, Jesteburg, Germany, 18–19 September 2019; The Design Society: Glasgow, UK, 2019; pp. 109–122. [Google Scholar]
- Becker, F.; Kolling, S.; Schöpfer, J. Material Data Determination and Crash Simulation of Fiber Reinforced Plastic Components. In Proceedings of the 8th European LS-DYNA Conference, Strasbourg, France, 23–24 May 2011. Hallquist (Ed.). [Google Scholar]
- Witzgall, C.; Wartzack, S. An investigation of mechanically aged short-fiber reinforced thermoplastics under highly dynamic loads. In Proceedings of the DFX 2016 27th Symposium Design for X, Jesteburg, Germany, 5–6 October 2016; pp. 135–146. [Google Scholar]
- Günzel, S. Analyse der Schädigungsprozesse in Einem Kurzglasfaserverstärkten Polyamid unter Mechanischer Belastung Mittels Röntgenrefraktometrie, Bruchmechanik und Fraktografie. Ph.D. Dissertation, Bundesanstalt für Materialforschung und-Prüfung (BAM), Berlin, Germany, 2015. [Google Scholar]
- Bauer, C. Charakterisierung und Numerische Beschreibung des Nichtlinearen Werkstoff- und Lebensdauerverhaltens Eines Kurzglasfaserverstärkten Polymerwerkstoffes unter Berücksichtigung der im μCT Gemessenen Lokalen Faserorientierung; Technische Universität Kaiserslautern: Kaiserslautern, Germany, 2018. [Google Scholar]
- Bernasconi, A.; Davoli, P.; Basile, A.; Filippi, A. Effect of fibre orientation on the fatigue behaviour of a short glass fibre reinforced polyamide-6. Int. J. Fatigue 2007, 29, 199–208. [Google Scholar] [CrossRef]
- Nutini, M.; Vitali, M. Interactive failure criteria for glass fibre reinforced polypropylene: Validation on an industrial part. Int. J. Crashworthiness 2017, 24, 24–38. [Google Scholar] [CrossRef]
- Hill, R. The Mathematical Theory of Plasticity; Clarendon Press: Oxford, UK, 1998; ISBN 0198503679. [Google Scholar]
- van Paepegem, W. A new coupled approach of residual stiffness and strength for fatigue of fibre-reinforced composites. Int. J. Fatigue 2002, 24, 747–762. [Google Scholar] [CrossRef]
- Shokrieh, M.M.; Lessard, L.B. Progressive Fatigue Damage Modeling of Composite Materials, Part I: Modeling. J. Compos. Mater. 2000, 34, 1056–1080. [Google Scholar] [CrossRef]
- Shokrieh, M.M.; Lessard, L.B. Progressive Fatigue Damage Modeling of Composite Materials, Part II: Material Characterization and Model Verification. J. Compos. Mater. 2000, 34, 1081–1116. [Google Scholar] [CrossRef]
- Witzgall, C.; Wartzack, S. Validation of an approach for the simulation of short fiber reinforced thermoplastics in early design phases. In Proceedings of the 26th Symposium Design for X, Herrsching, Germany, 7–8 October 2015; pp. 63–74. [Google Scholar]
- Witzgall, C.; Wartzack, S. Experimental and simulative assessment of crashworthiness of mechanically aged short-fibre reinforced thermoplastics. In Proceedings of the International Conference on Engineering Design, ICED, Vancouver, BC, Canada, 21–25 August 2017; pp. 279–287. [Google Scholar]
- Witzgall, C.; Huber, M.; Wartzack, S. Consideration of cyclic material degradation in the crash simulation of short-fibre-reinforced thermoplastics. Konstruktion 2020, 2020, 78–82. [Google Scholar] [CrossRef]
- Witzgall, C.; Giolda, J.; Wartzack, S. A novel approach to incorporating previous fatigue damage into a failure model for short-fibre reinforced plastics. Int. J. Impact Eng. 2022, 18, 104155. [Google Scholar] [CrossRef]
- Bernasconi, A.; Kulin, R.M. Effect of frequency upon fatigue strength of a short glass fiber reinforced polyamide 6: A superposition method based on cyclic creep parameters. Polym. Compos. 2009, 30, 154–161. [Google Scholar] [CrossRef]
- Masendorf, R.; Müller, C. Execution and evaluation of cyclic tests at constant load amplitudes—DIN 50100:2016. Mater. Test. 2018, 60, 961–968. [Google Scholar] [CrossRef]
- ISO 527-1:2012-06; Kunststoffe—Bestimmung der Zugeigenschaften—Teil 1. Allgemeine Grundsätze; Beuth: Berlin, Germany, 2012.
- Haufe, A.; Schweizerhof, K.; Du Bois, P. Properties & Limits: Review of Shell Element Formulations. In Proceedings of the LS-DYNA Developer Forum, Filderstadt, Germany, 24–25 September 2013. Hallquist (Ed.). [Google Scholar]
- Friedlein, J.; Mergheim, J.; Steinmann, P. Anisotropic plasticity-damage material model for sheet metal—Regularised single surface formulation. Pamm 2021, 21, e202100068. [Google Scholar] [CrossRef]
- Baltic, S.; Magnien, J.; Gänser, H.-P.; Antretter, T.; Hammer, R. Coupled damage variable based on fracture locus: Modelling and calibration. Int. J. Plast. 2020, 126, 102623. [Google Scholar] [CrossRef]
| Disclaimer/Publisher’s Note: The statements, opinions and data contained in all publications are solely those of the individual author(s) and contributor(s) and not of MDPI and/or the editor(s). MDPI and/or the editor(s) disclaim responsibility for any injury to people or property resulting from any ideas, methods, instructions or products referred to in the content. |
© 2023 by the authors. Licensee MDPI, Basel, Switzerland. This article is an open access article distributed under the terms and conditions of the Creative Commons Attribution (CC BY) license (https://creativecommons.org/licenses/by/4.0/).


