
Application of Rh/TiO2 Nanotube Array in Photocatalytic Hydrogen Production from Formic Acid Solution
 , , , and
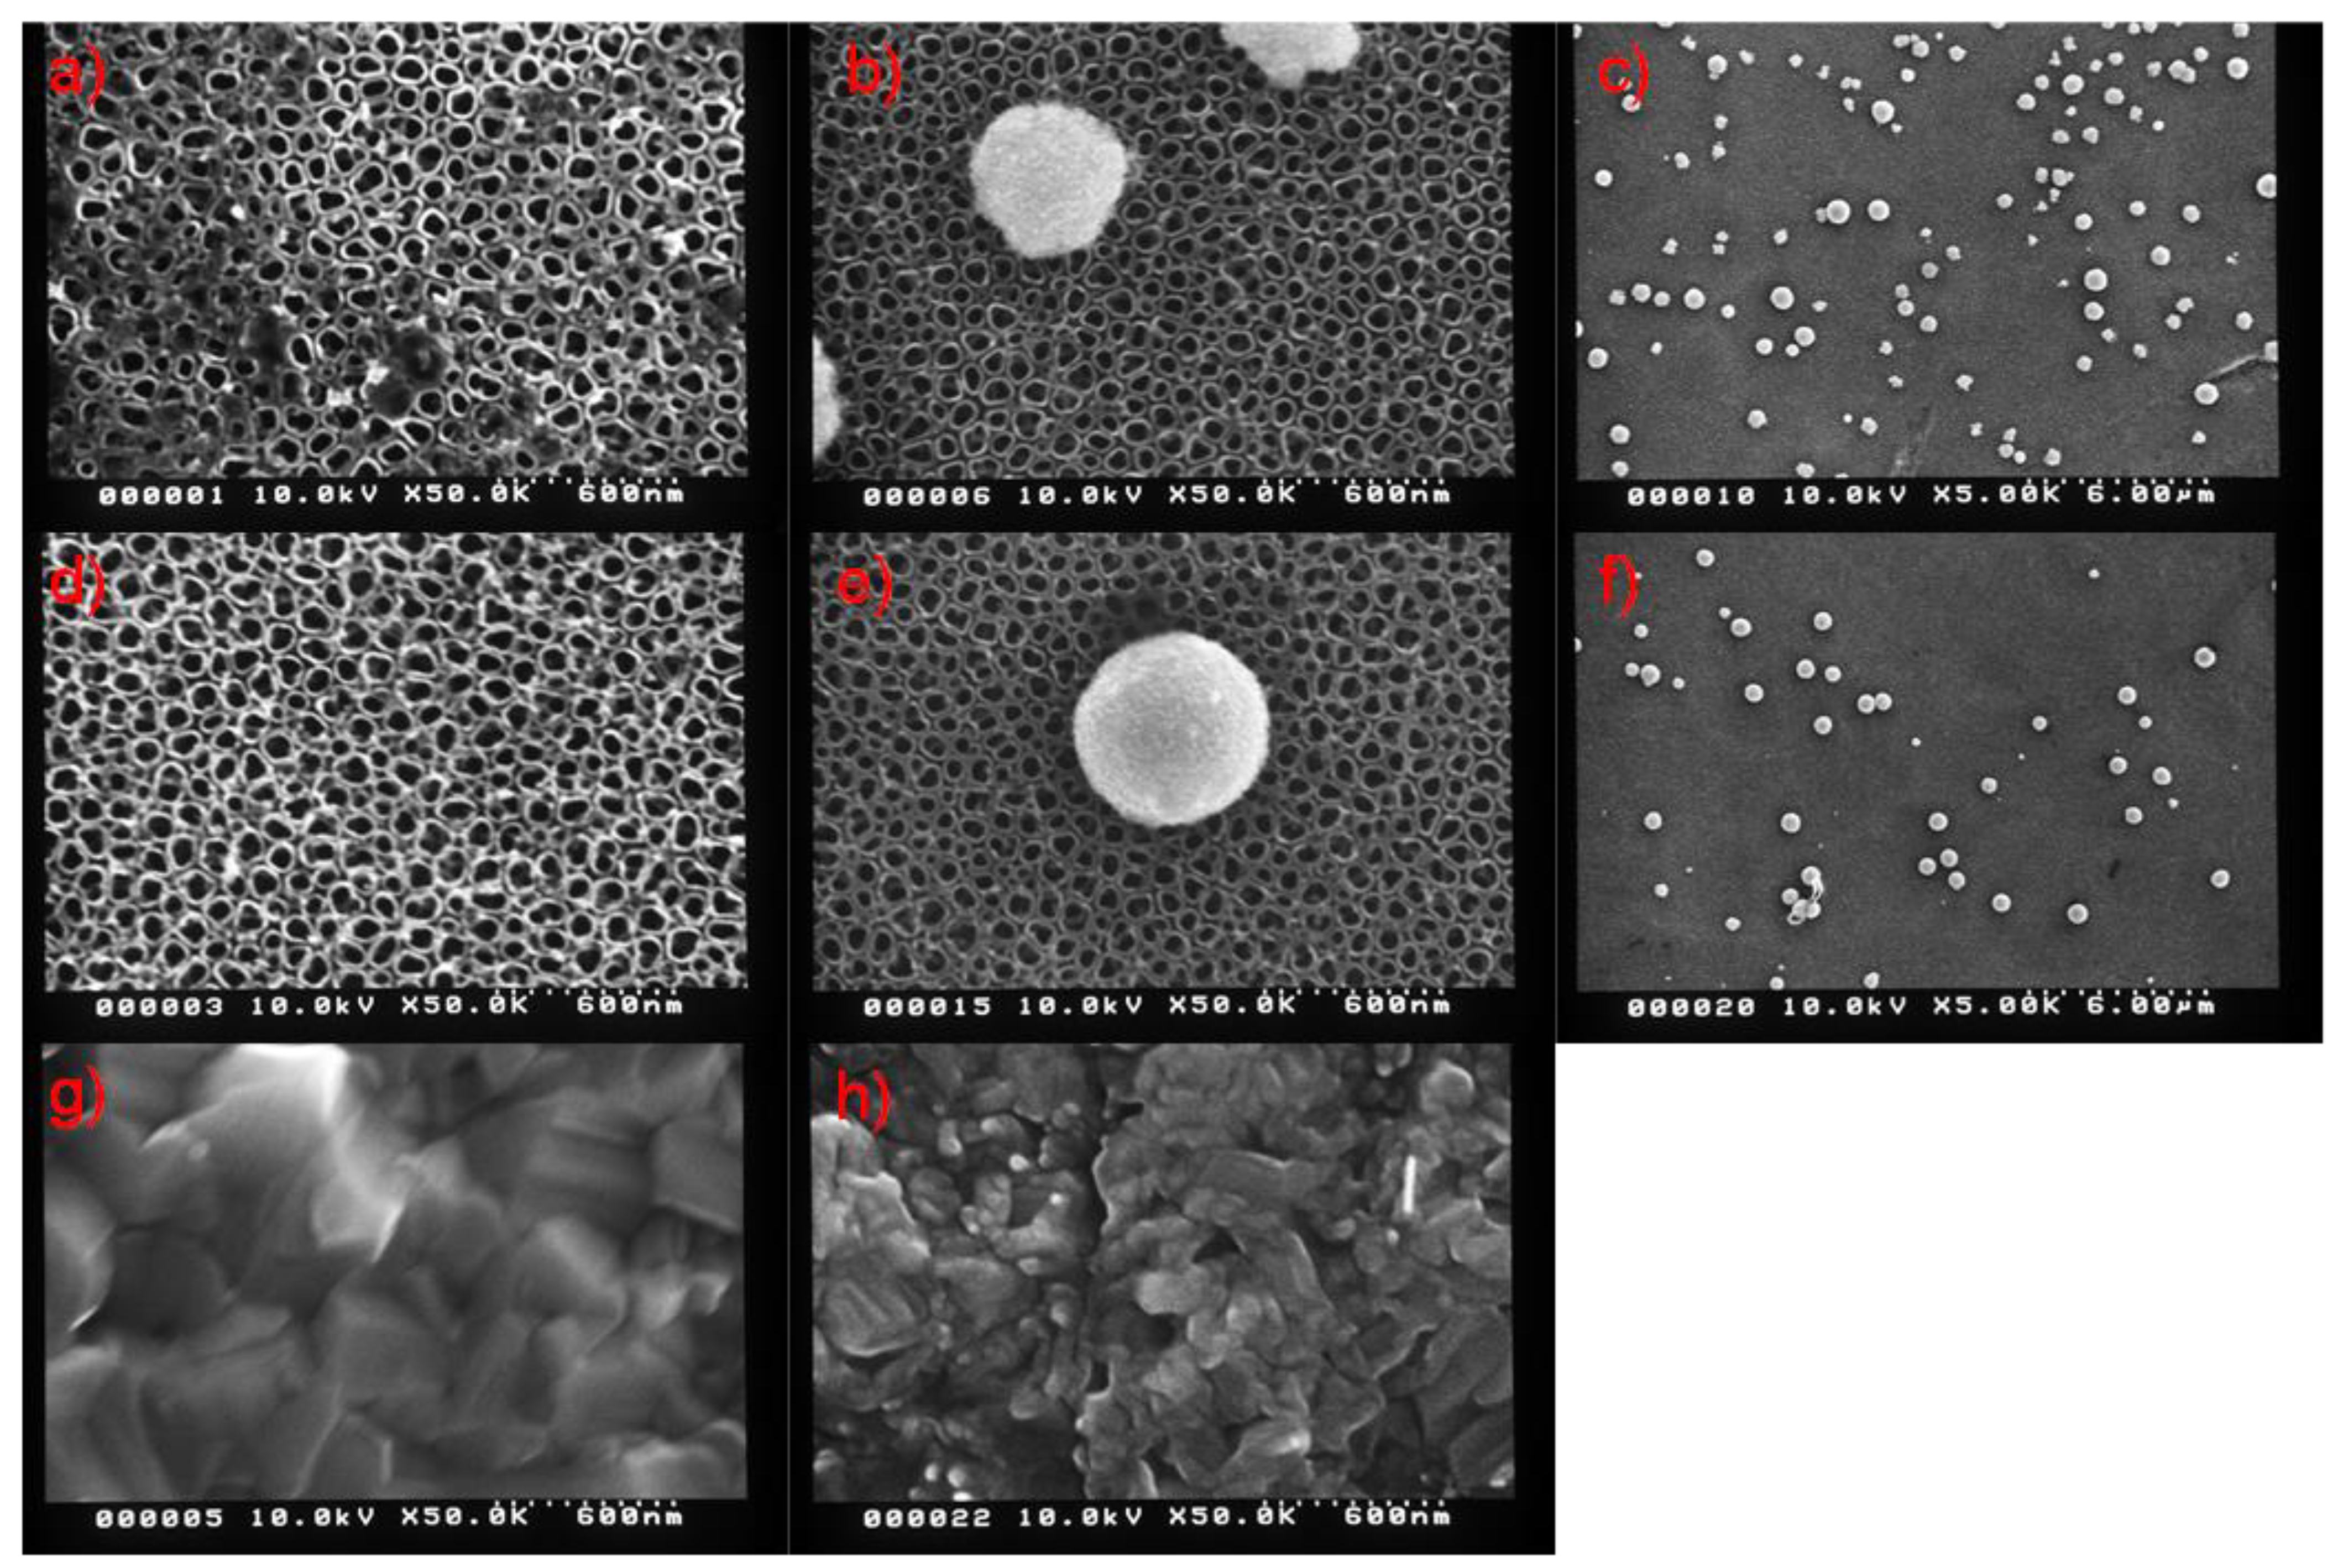
Abstract
:1. Introduction
2. Materials and Methods
2.1. Fabrication of TiO2 Nanotubes (TNTs)
2.2. Photocatalytic Hydrogen Production
2.3. Characterization of TNTs
3. Results and Discussion
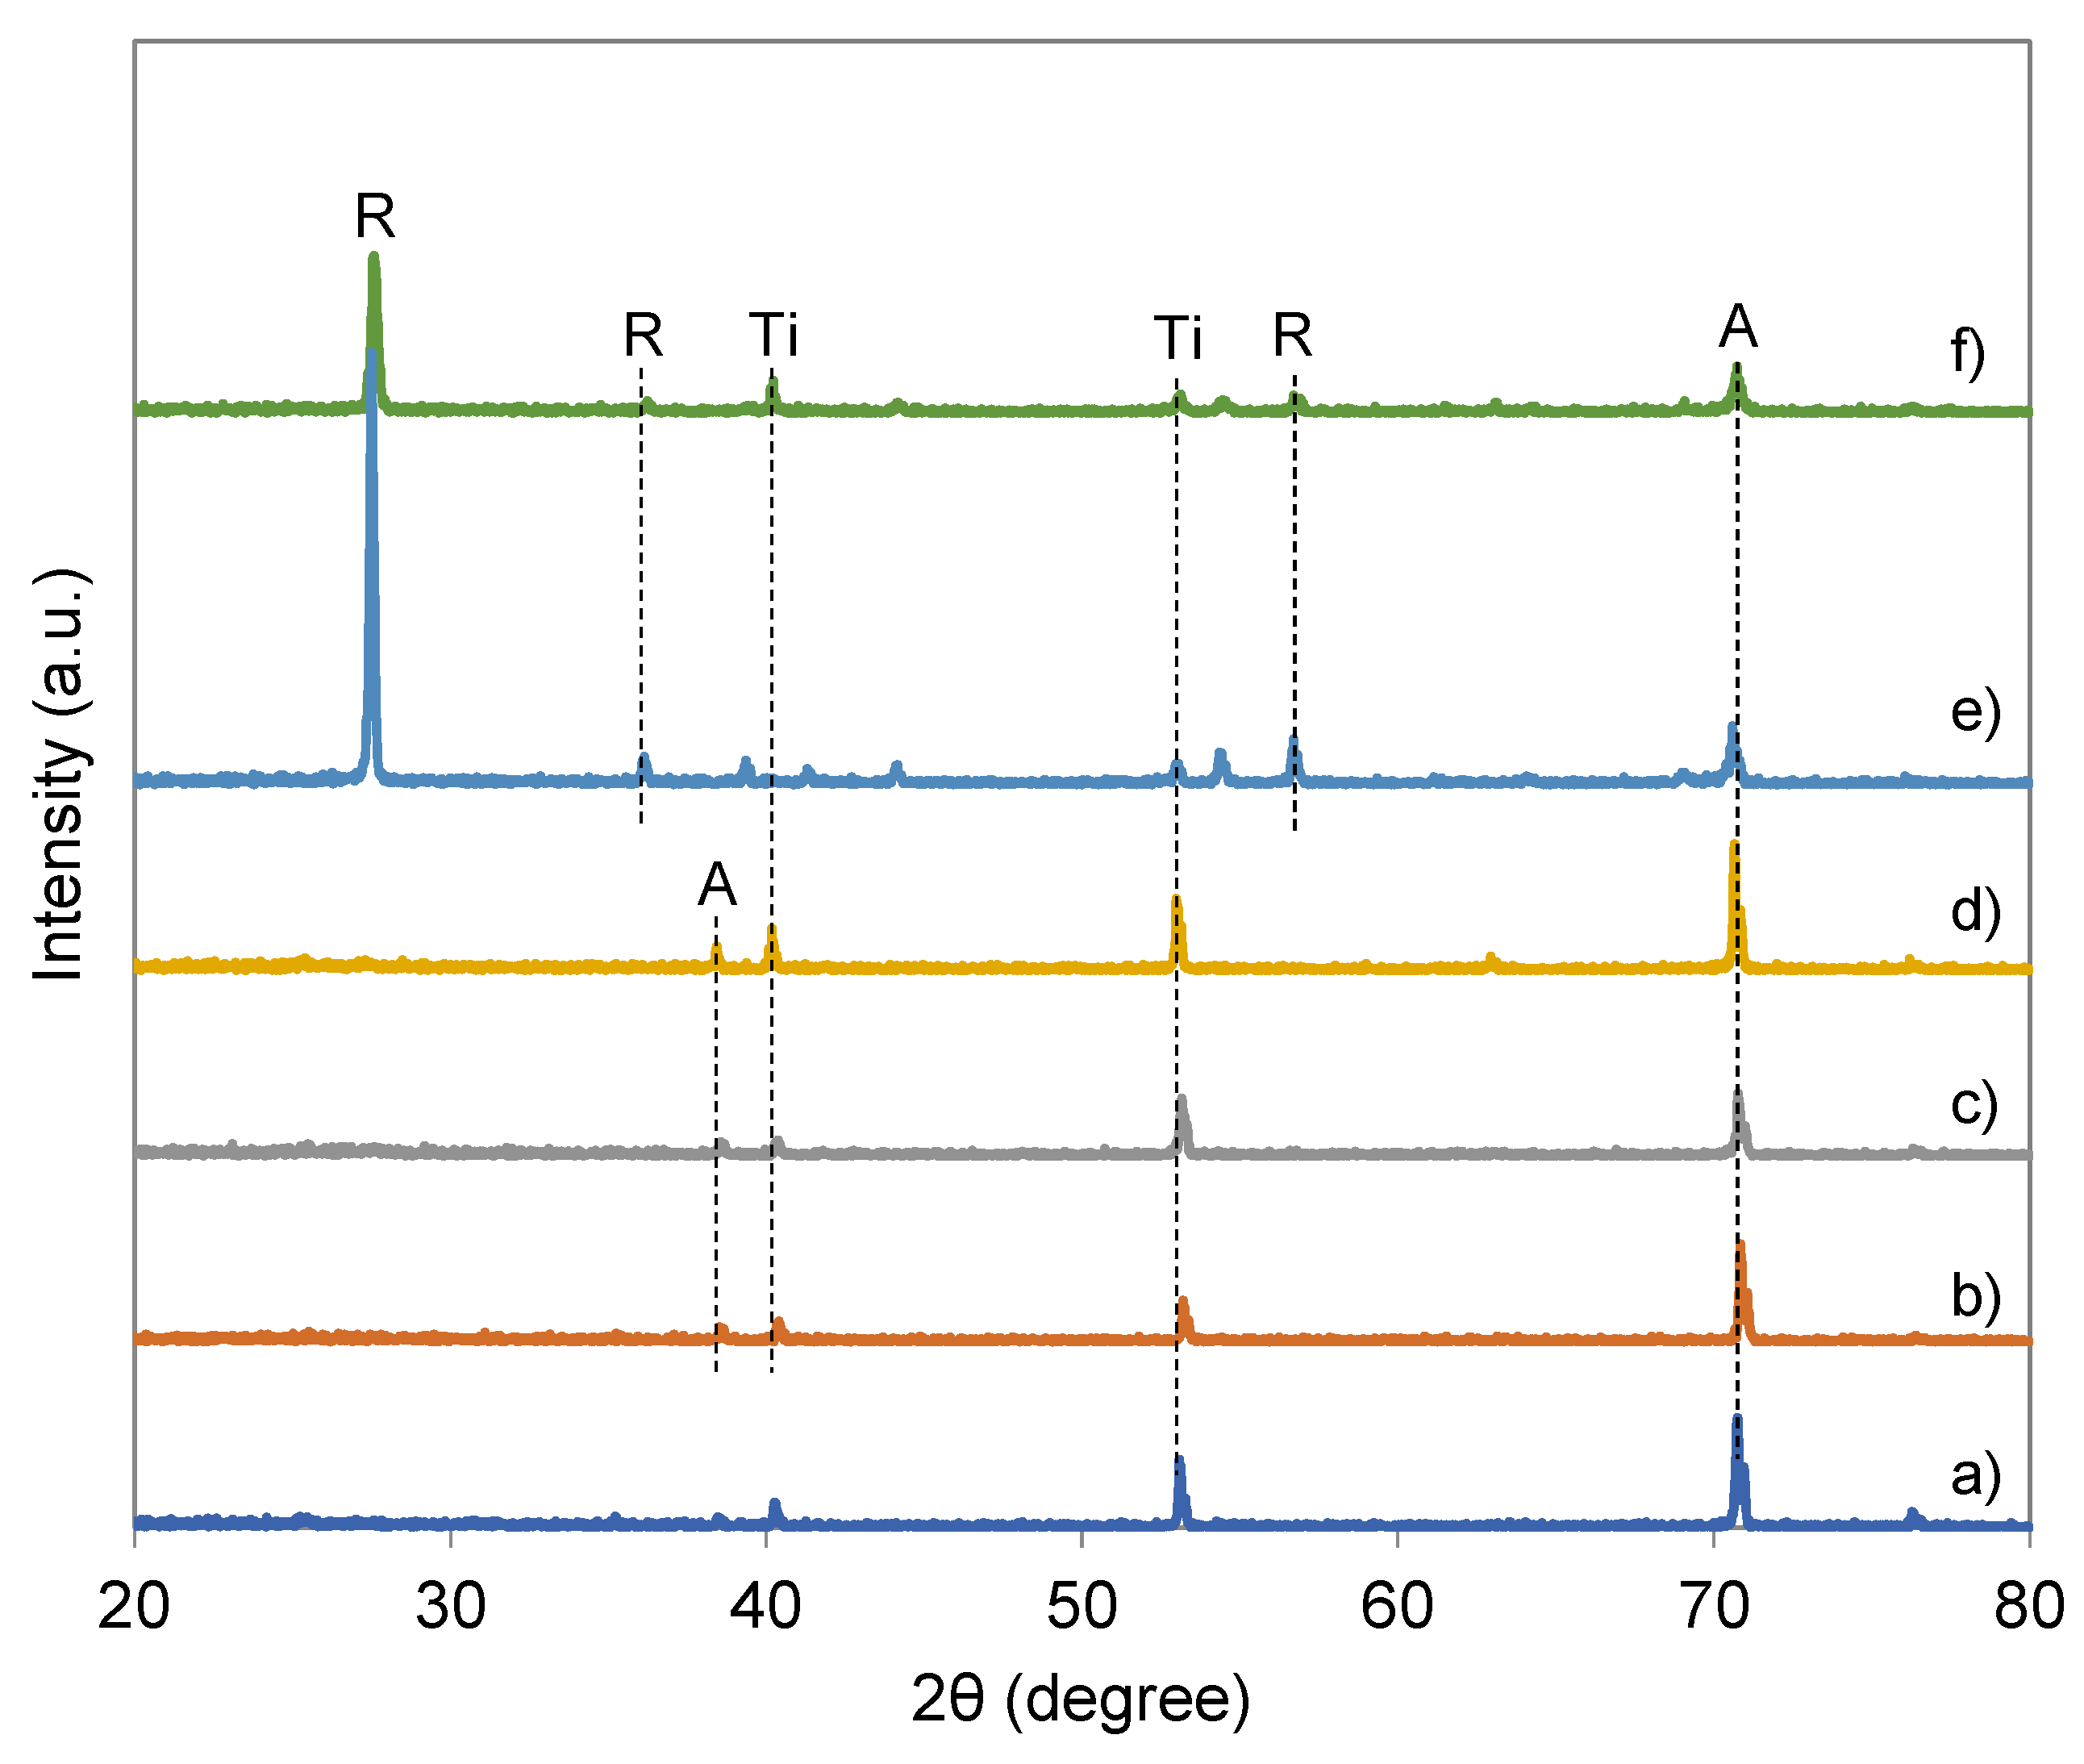
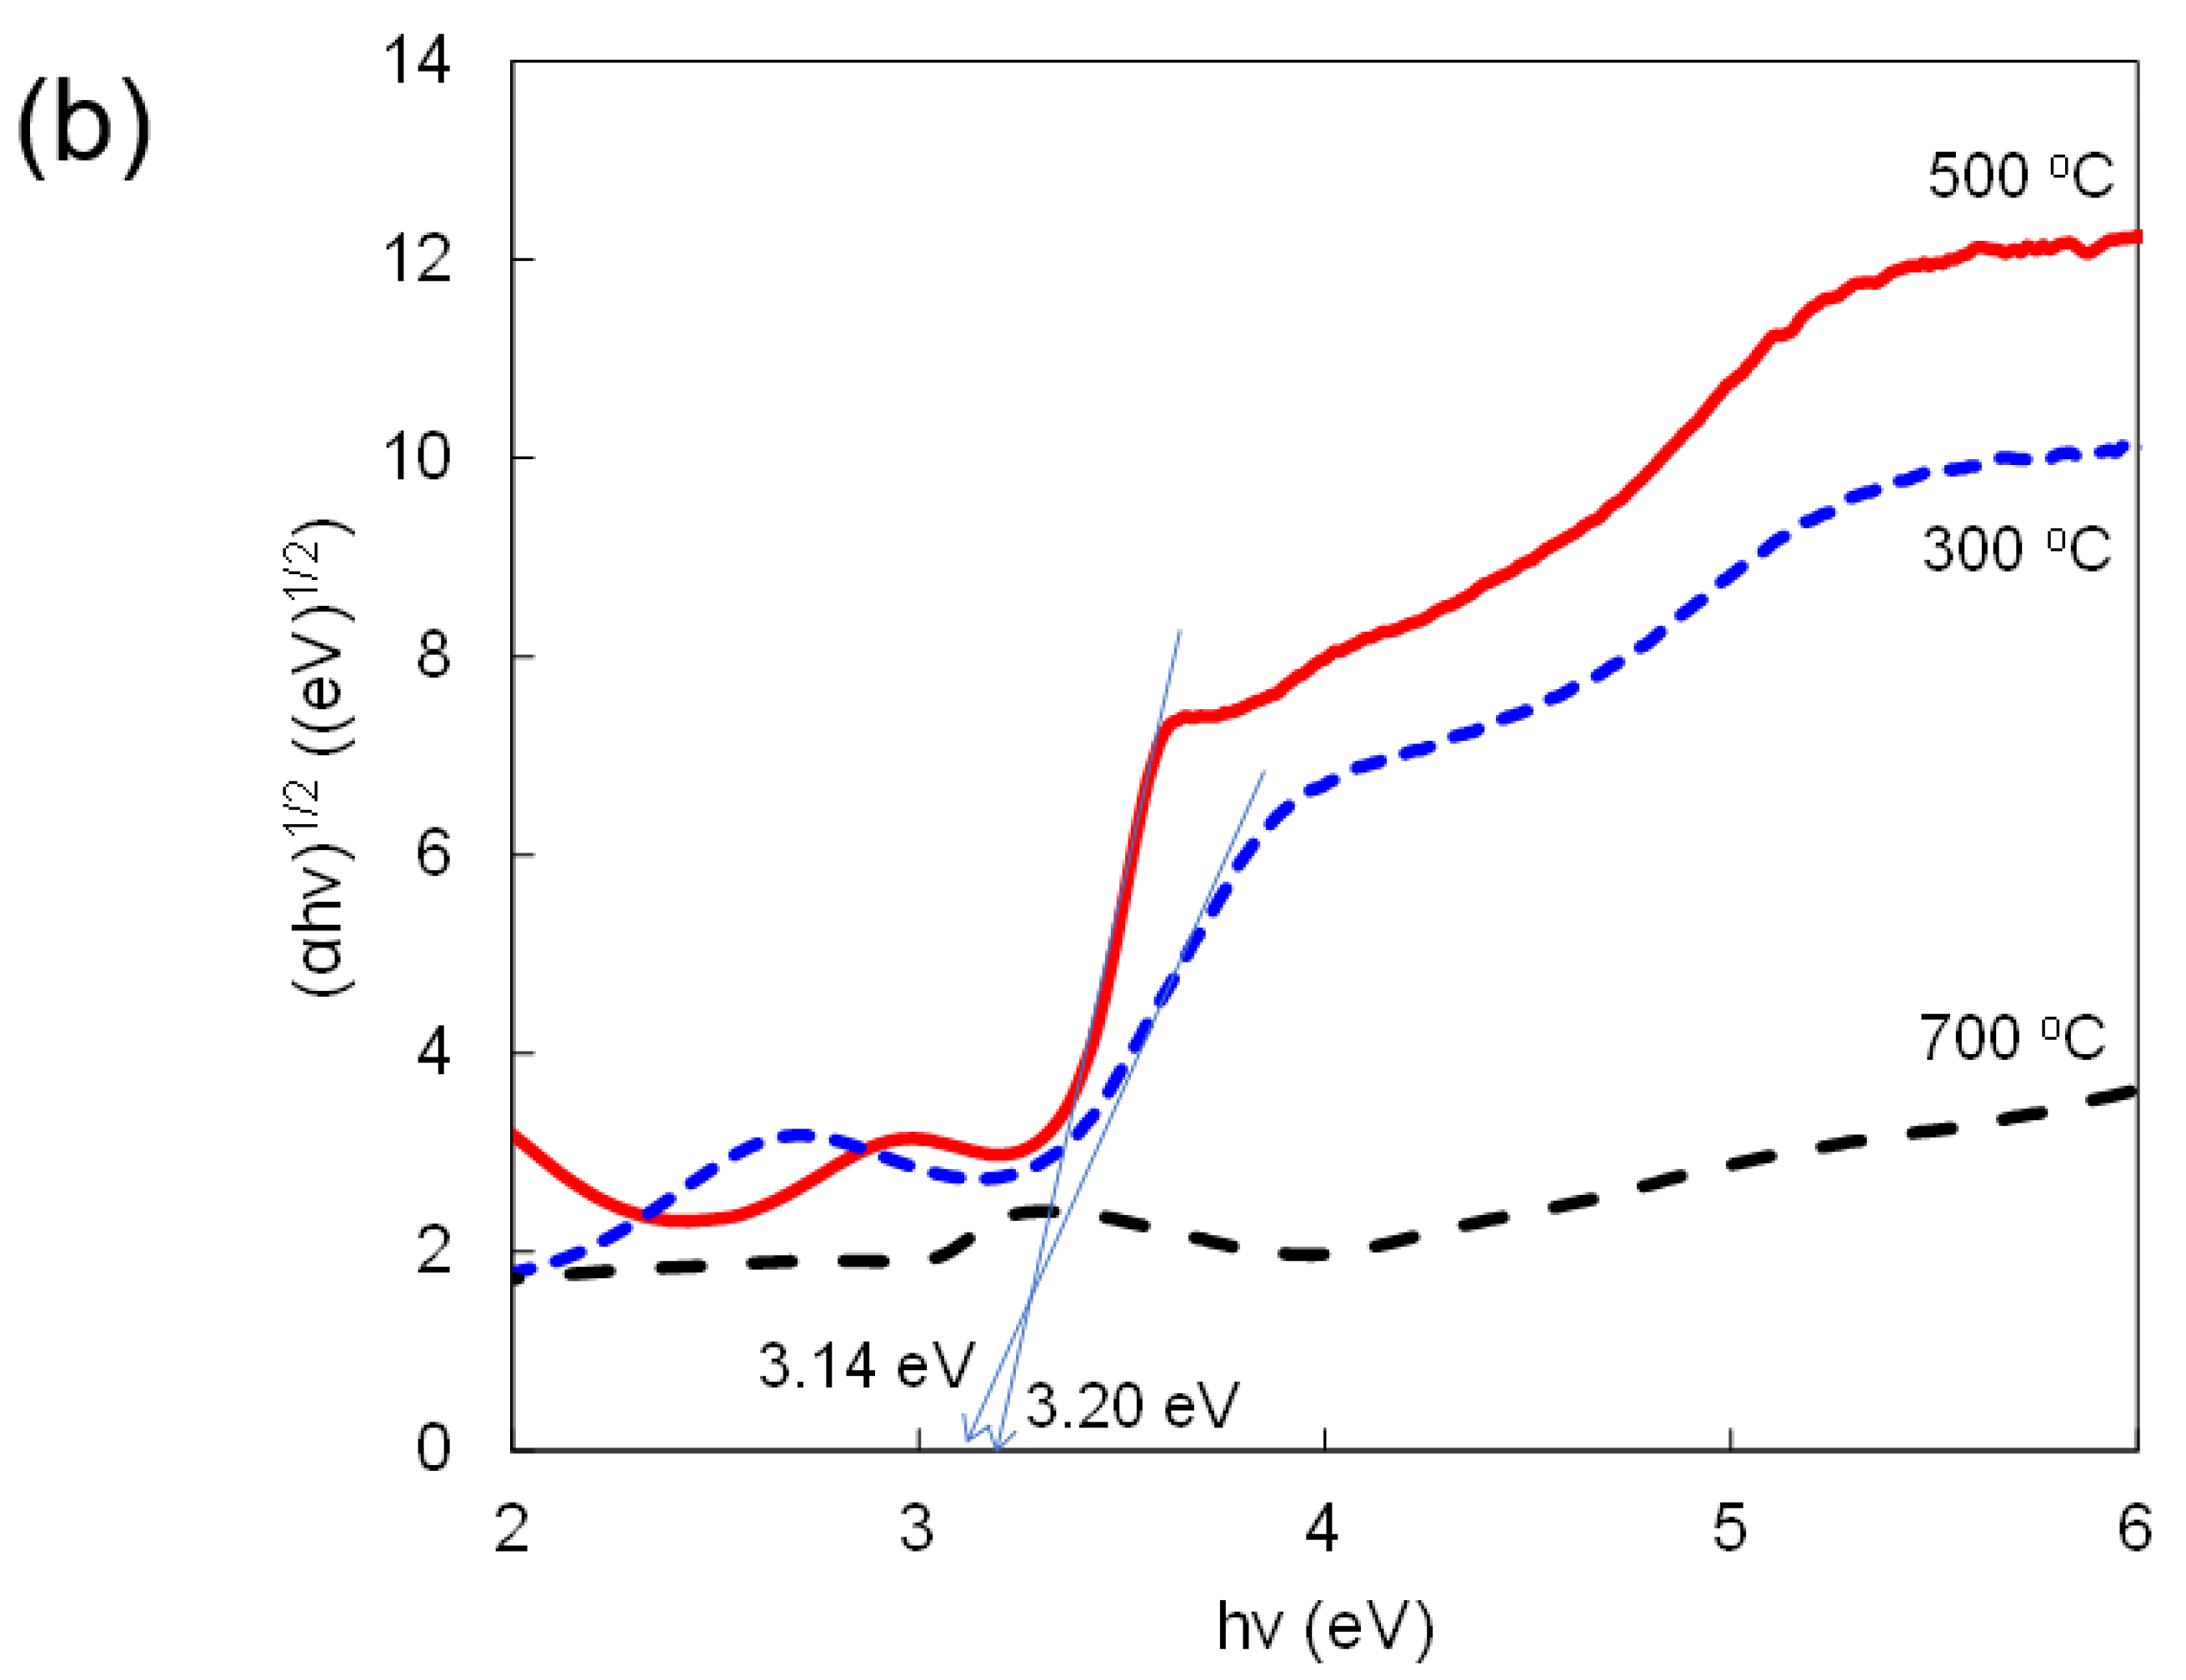
3.1. Characterization of TNTs
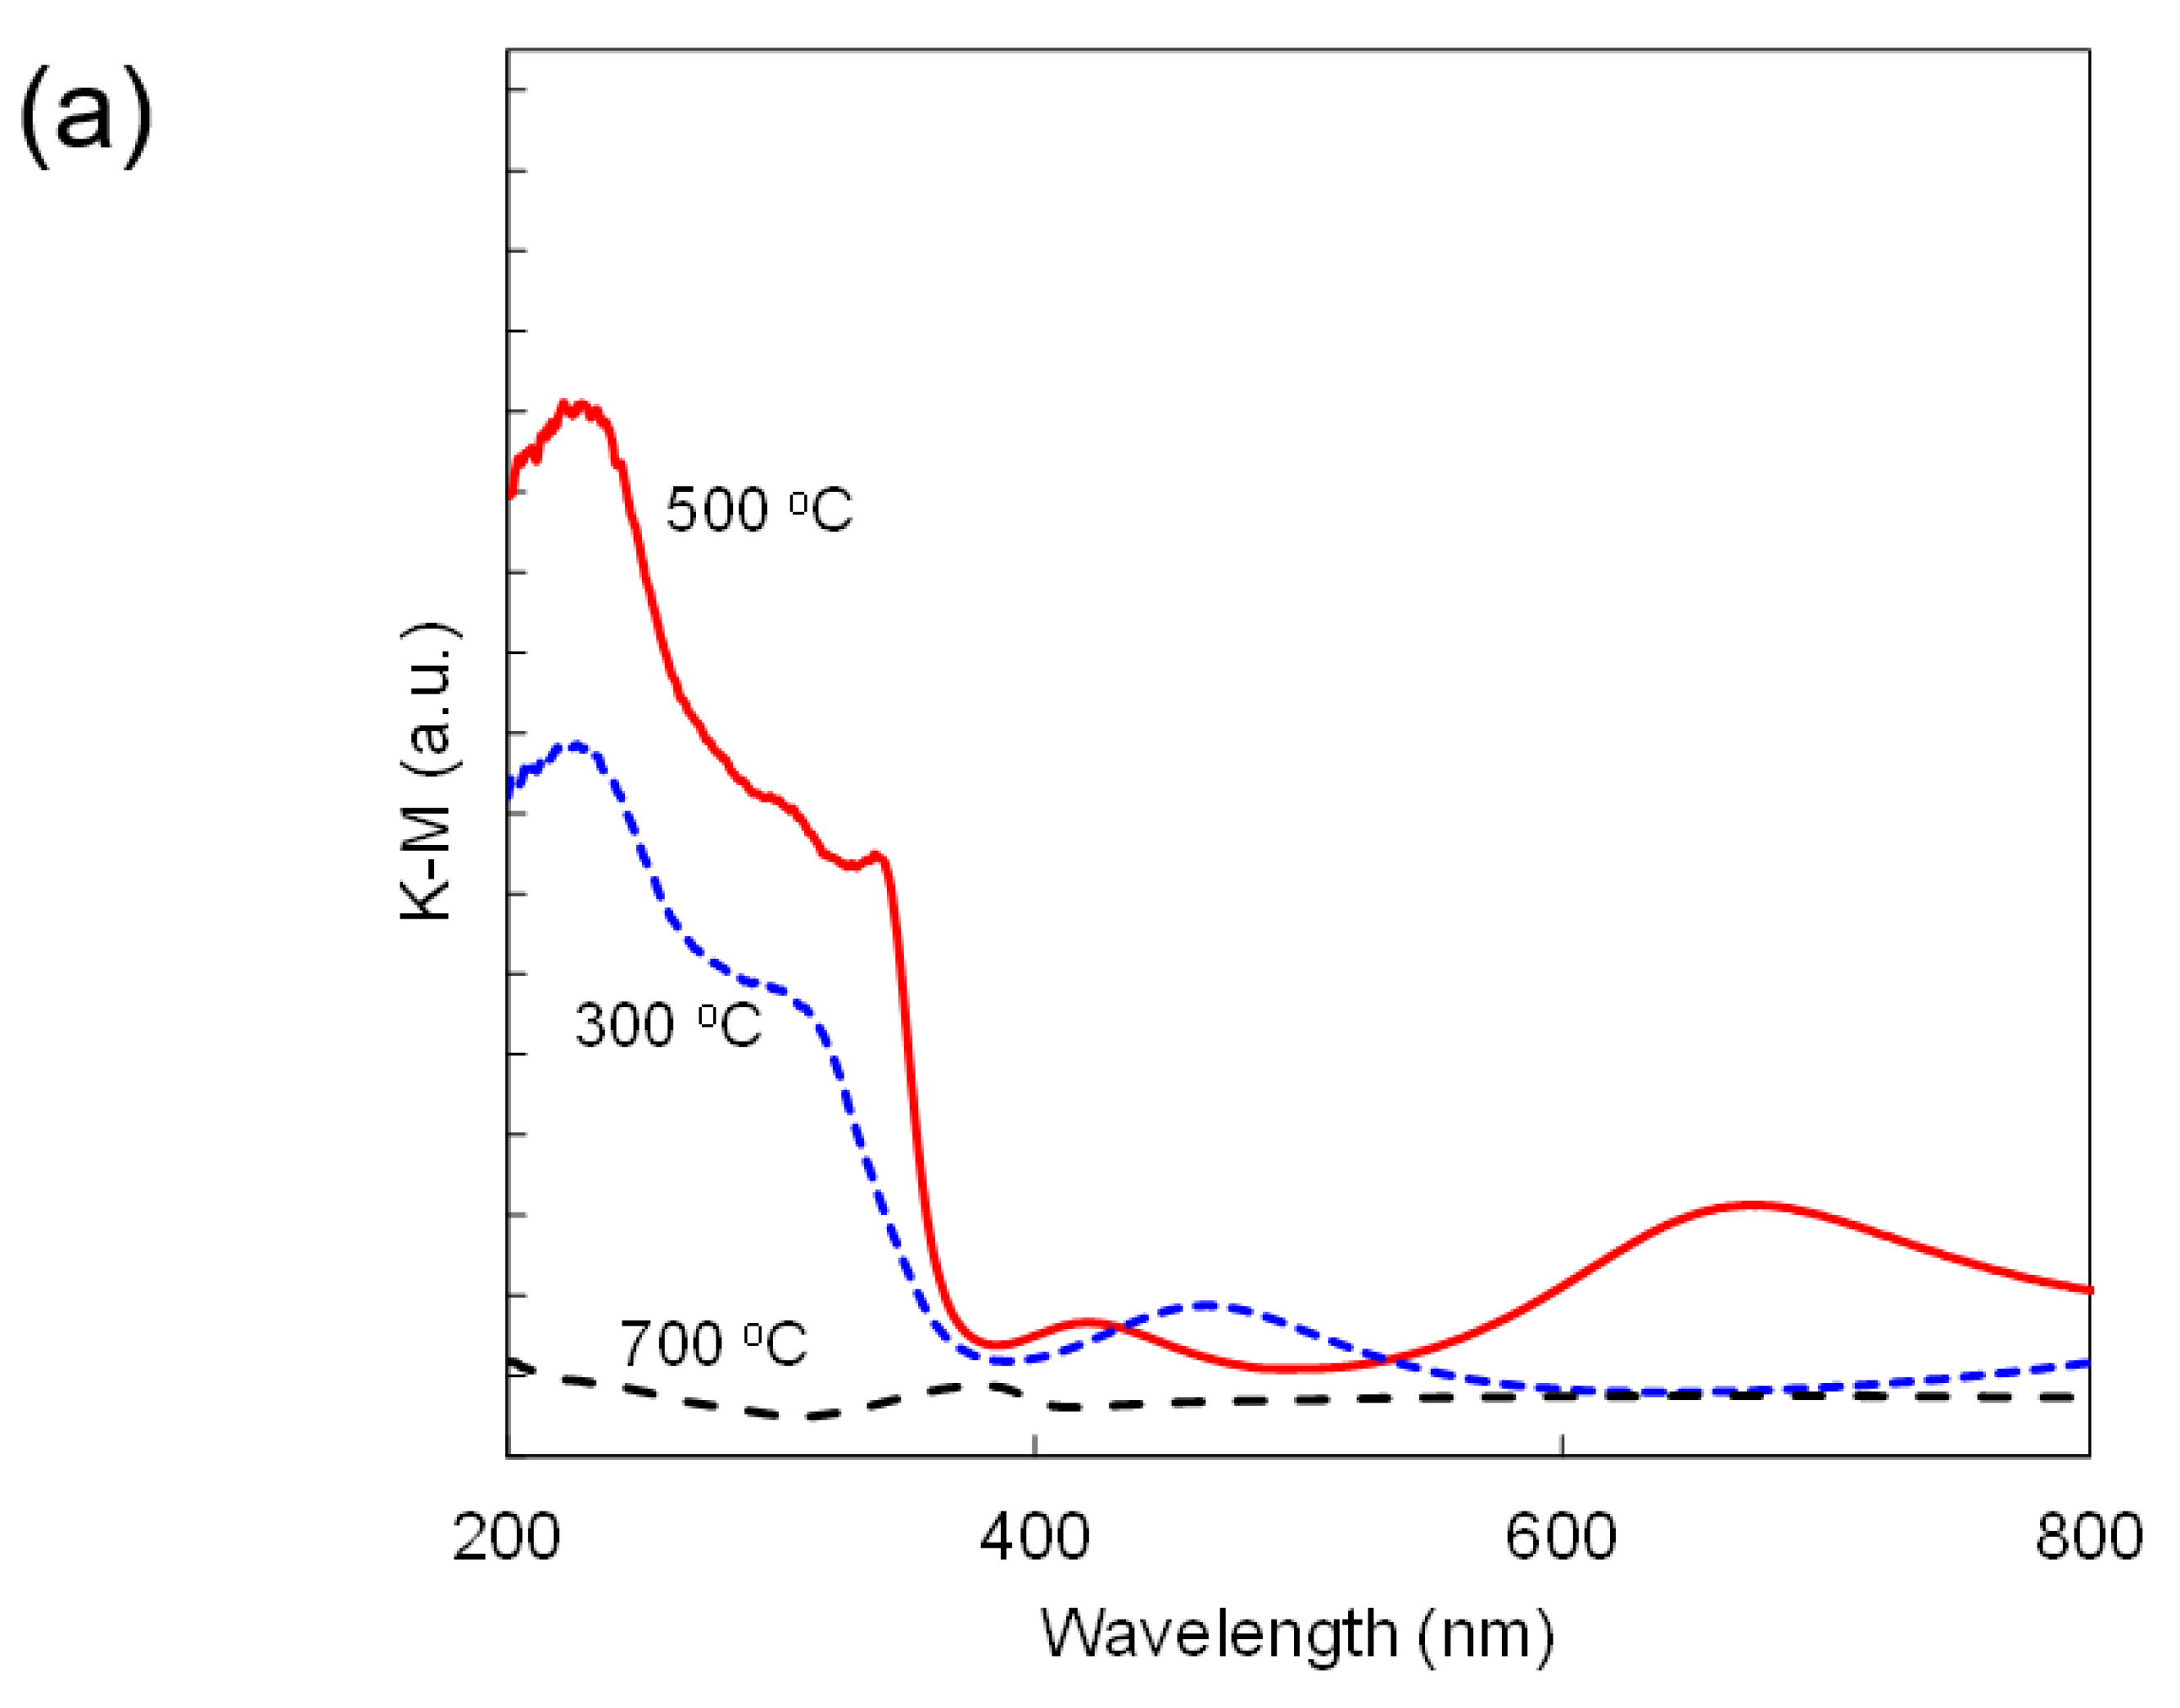
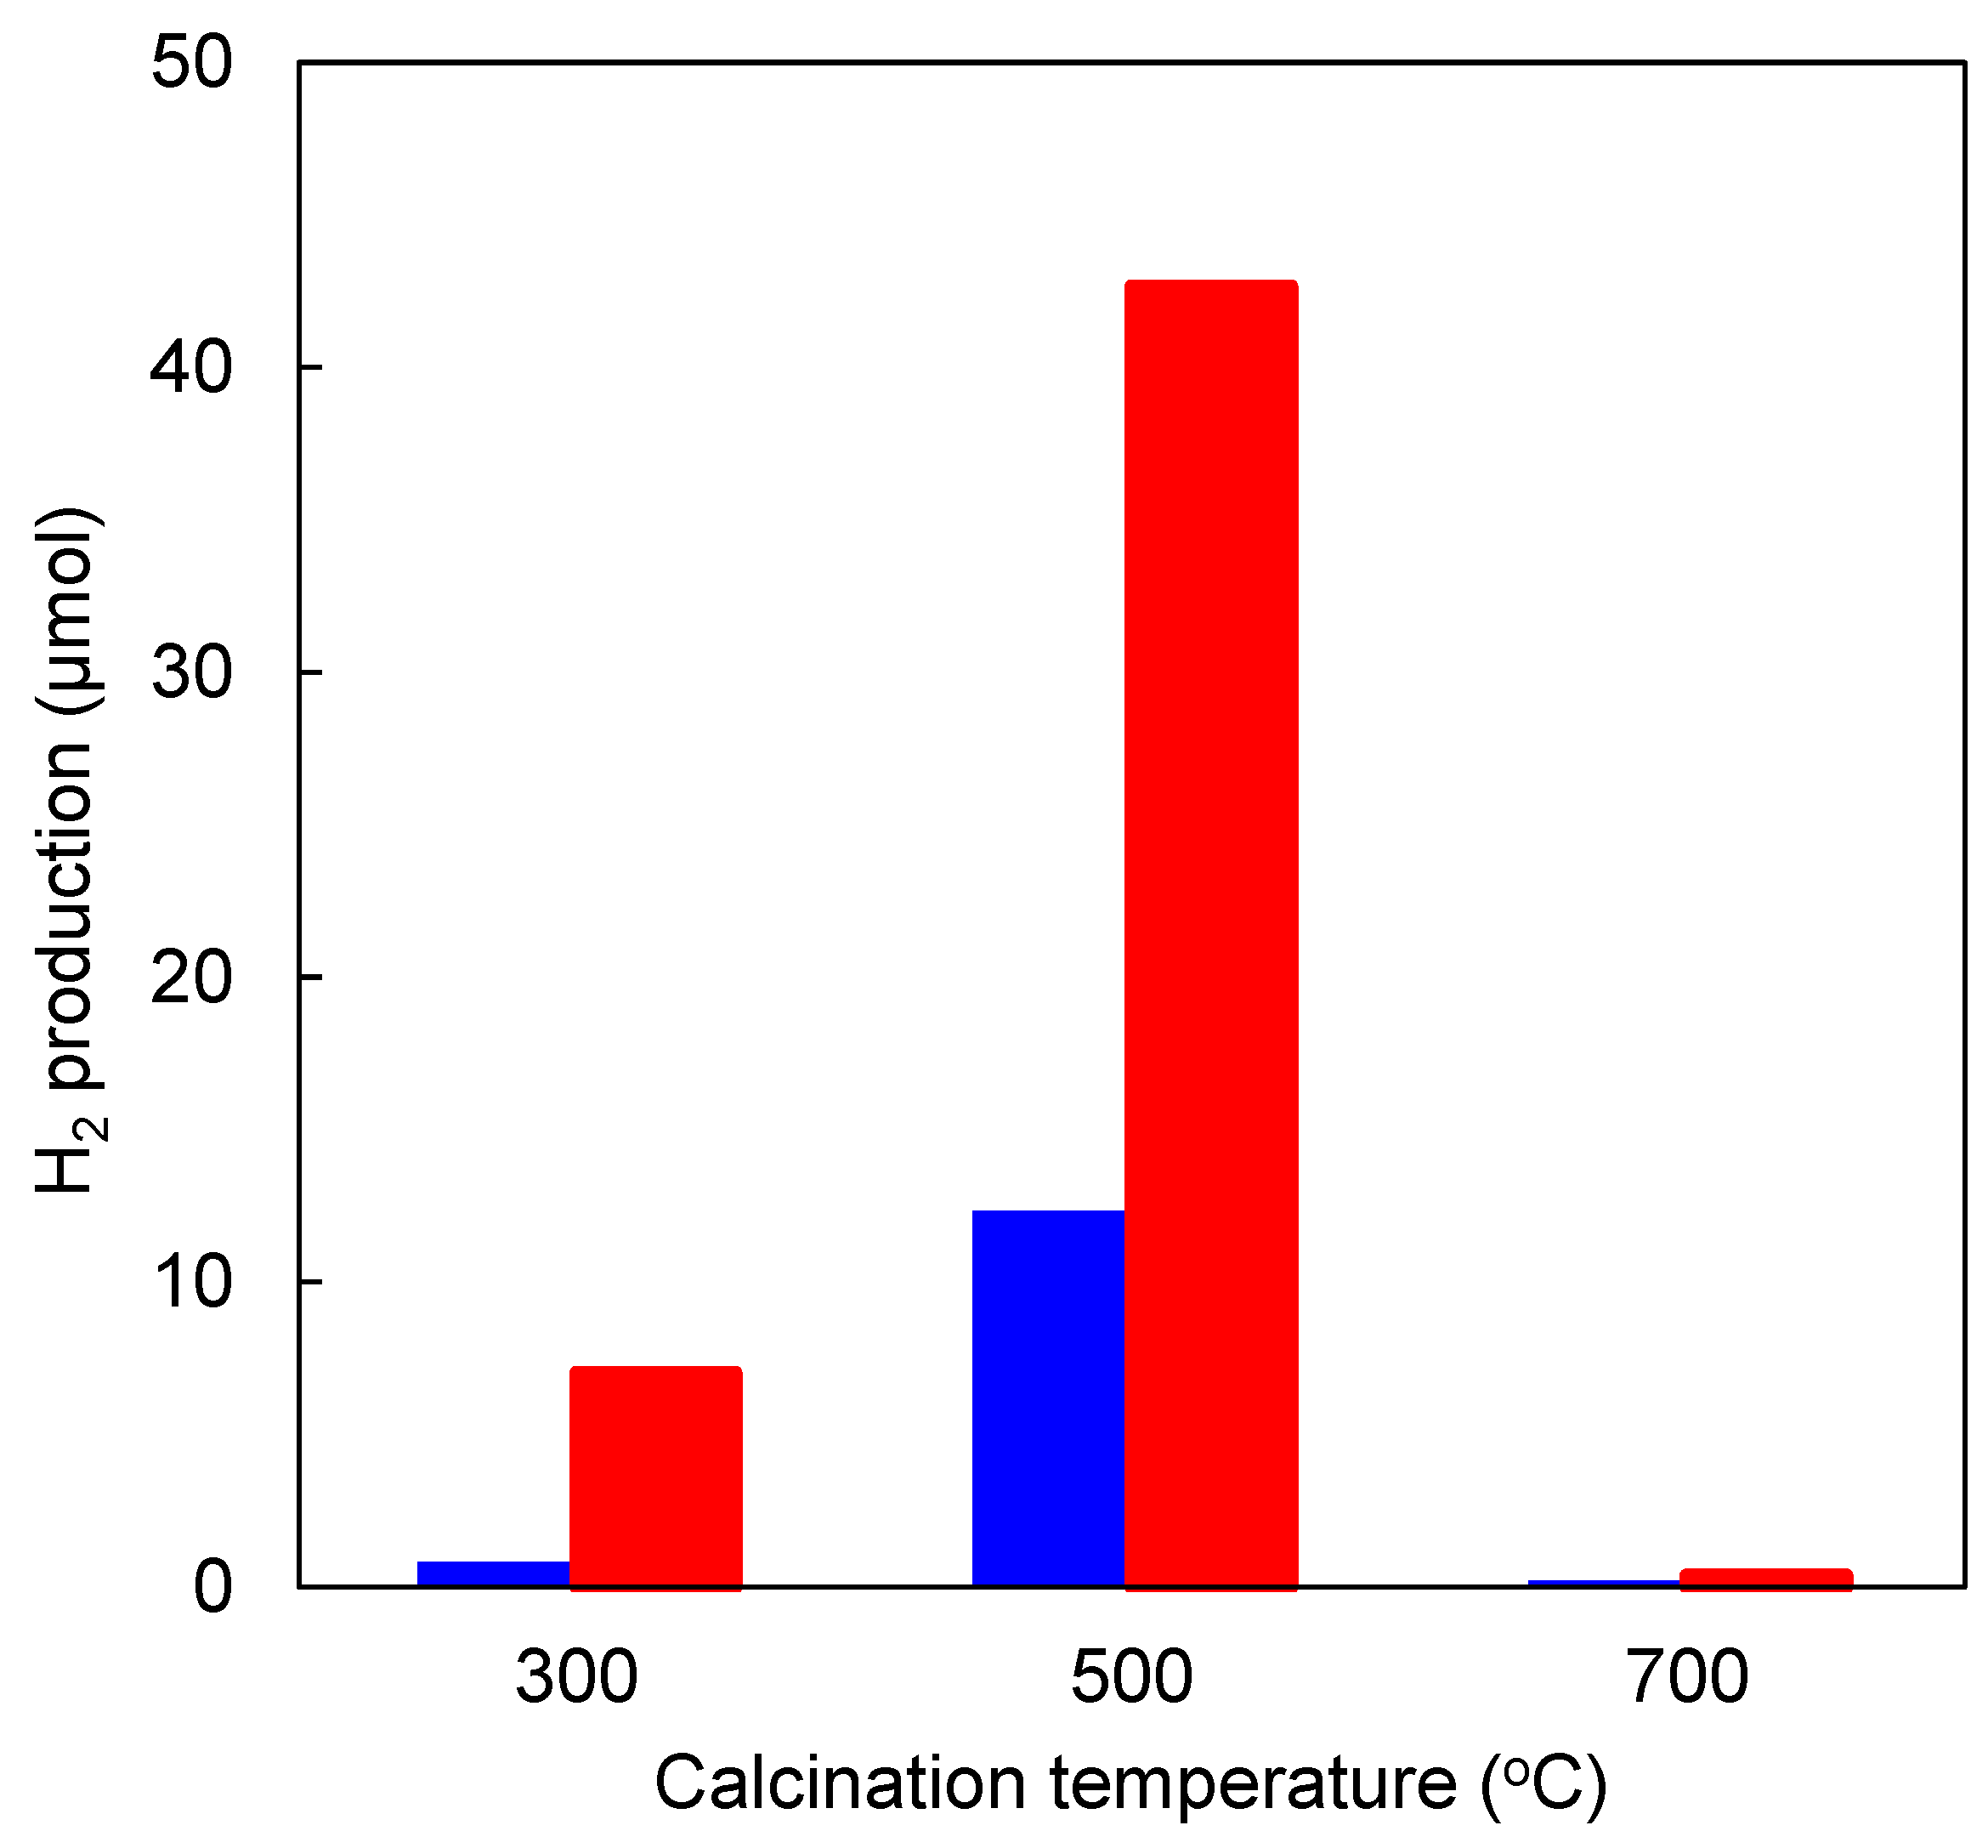
3.2. Effect of Calcination Temperature
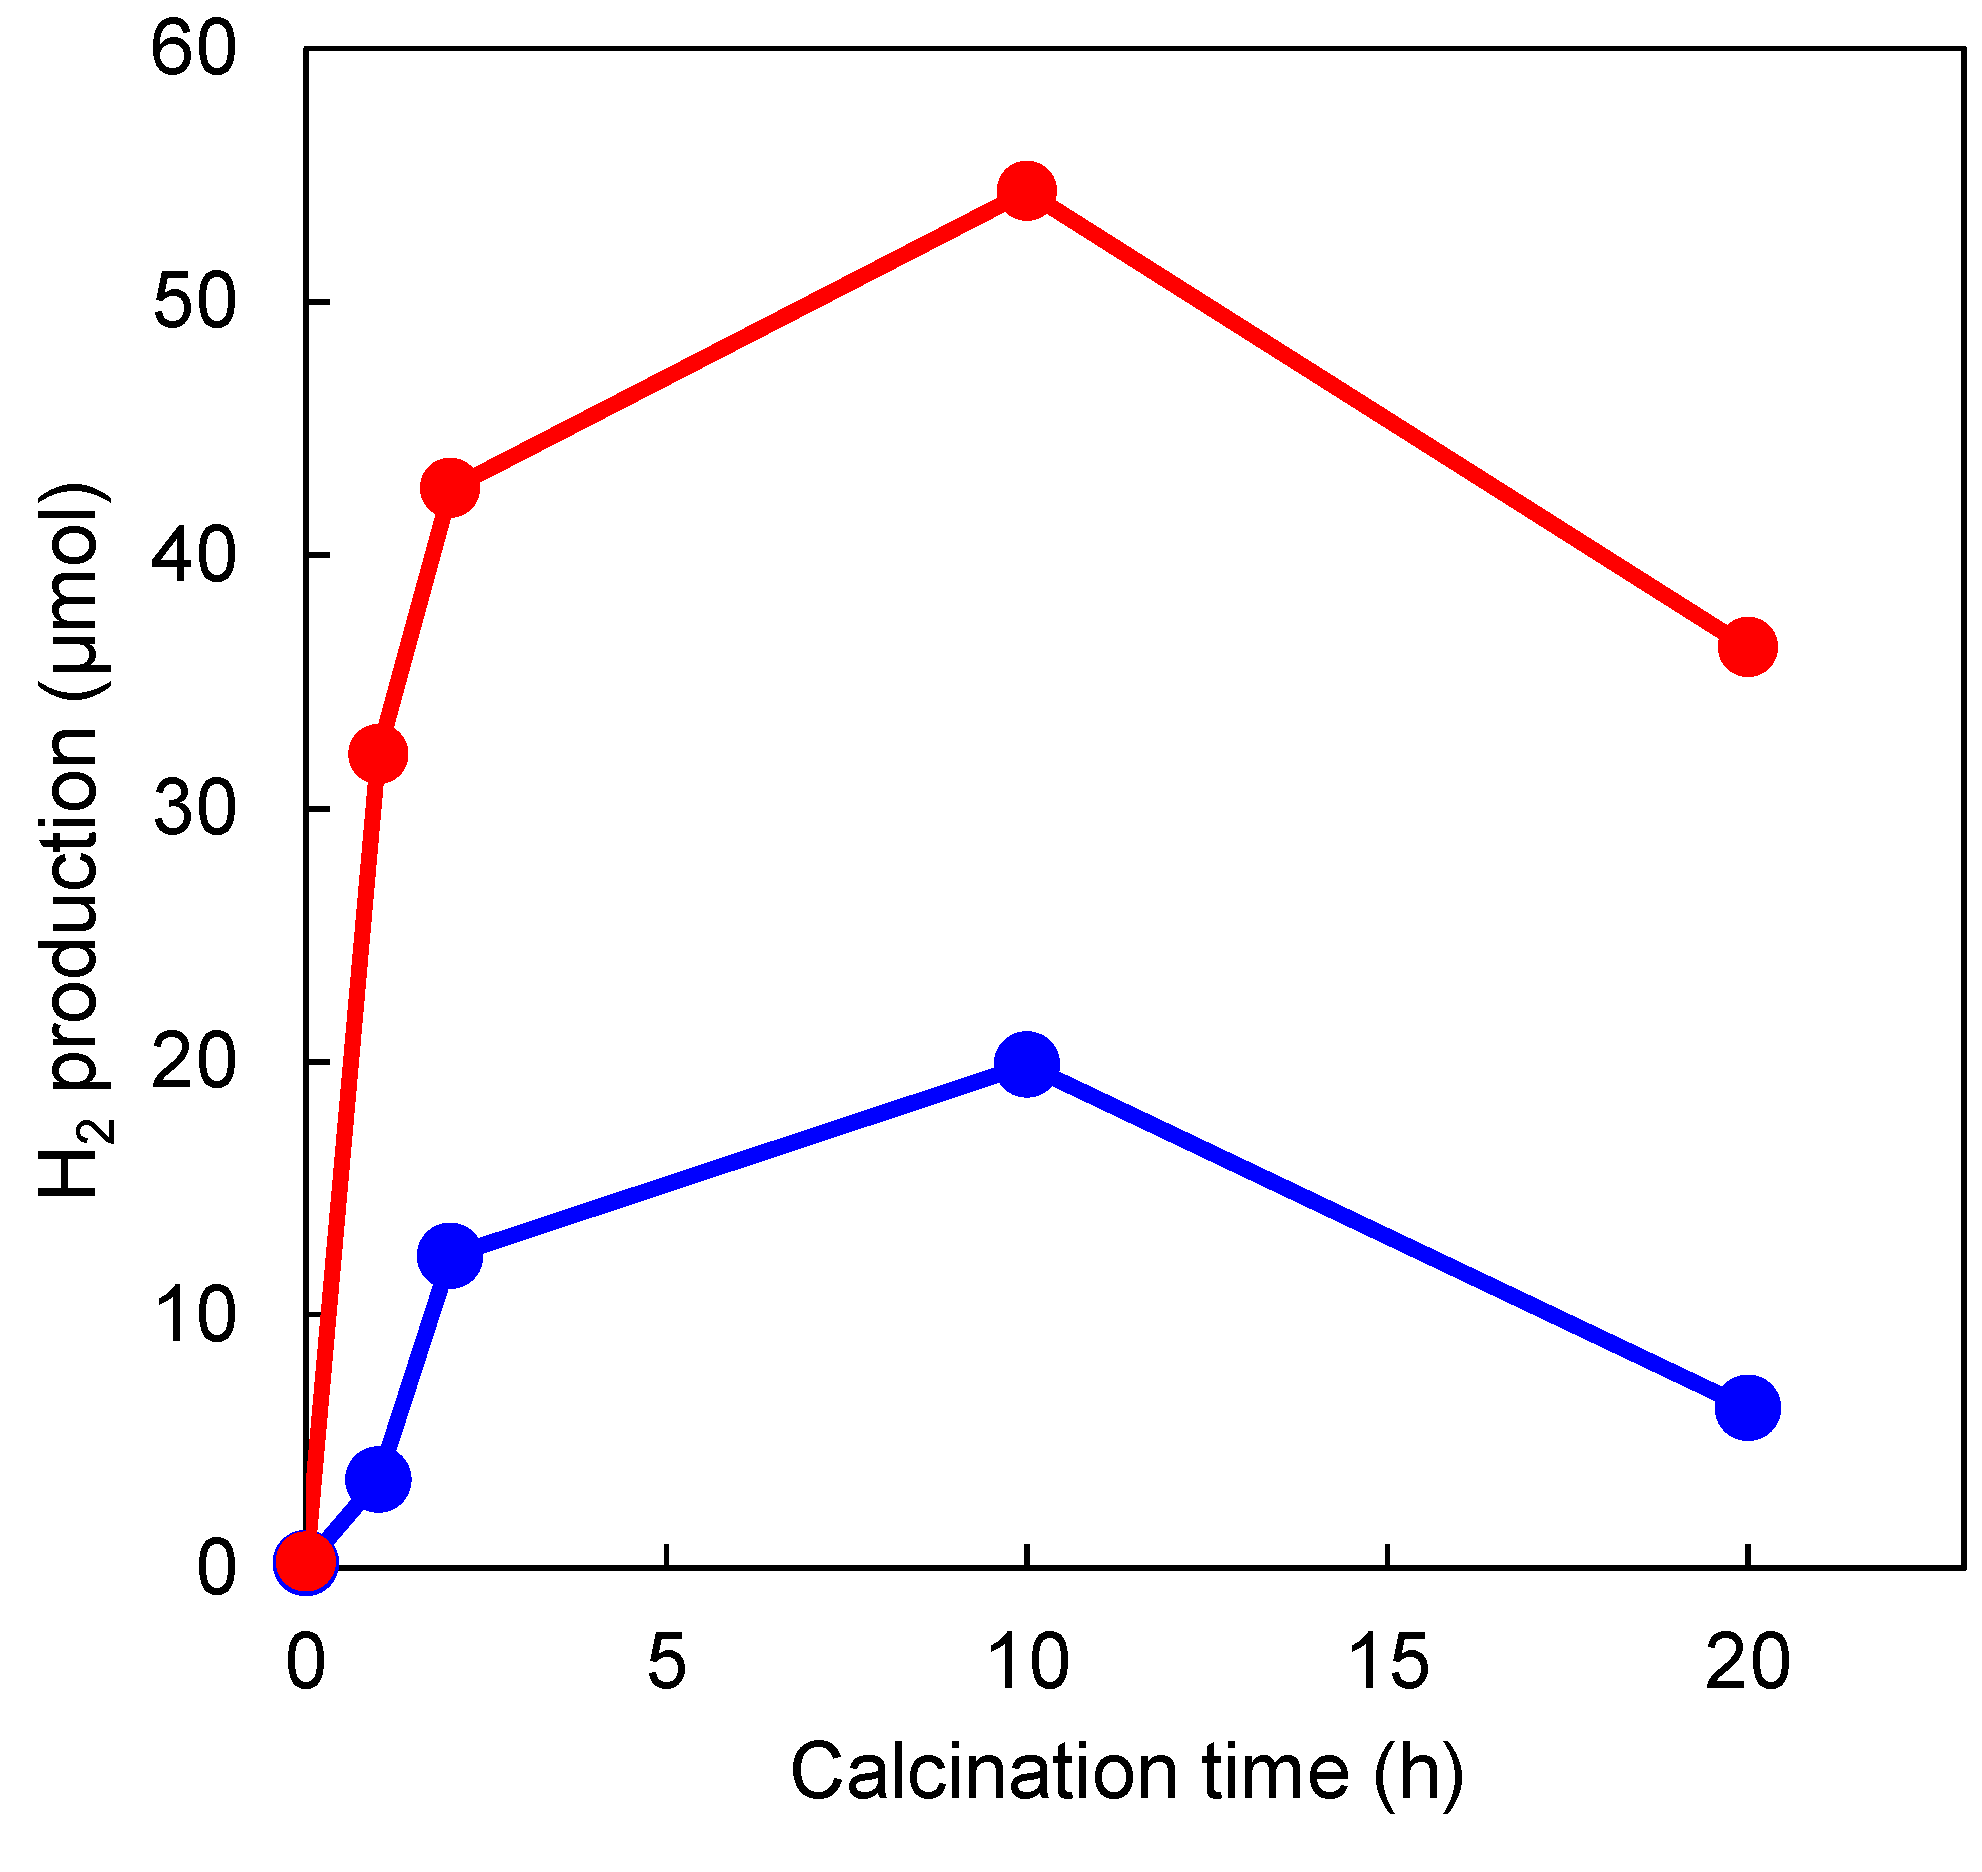
3.3. Effect of Calcination Time
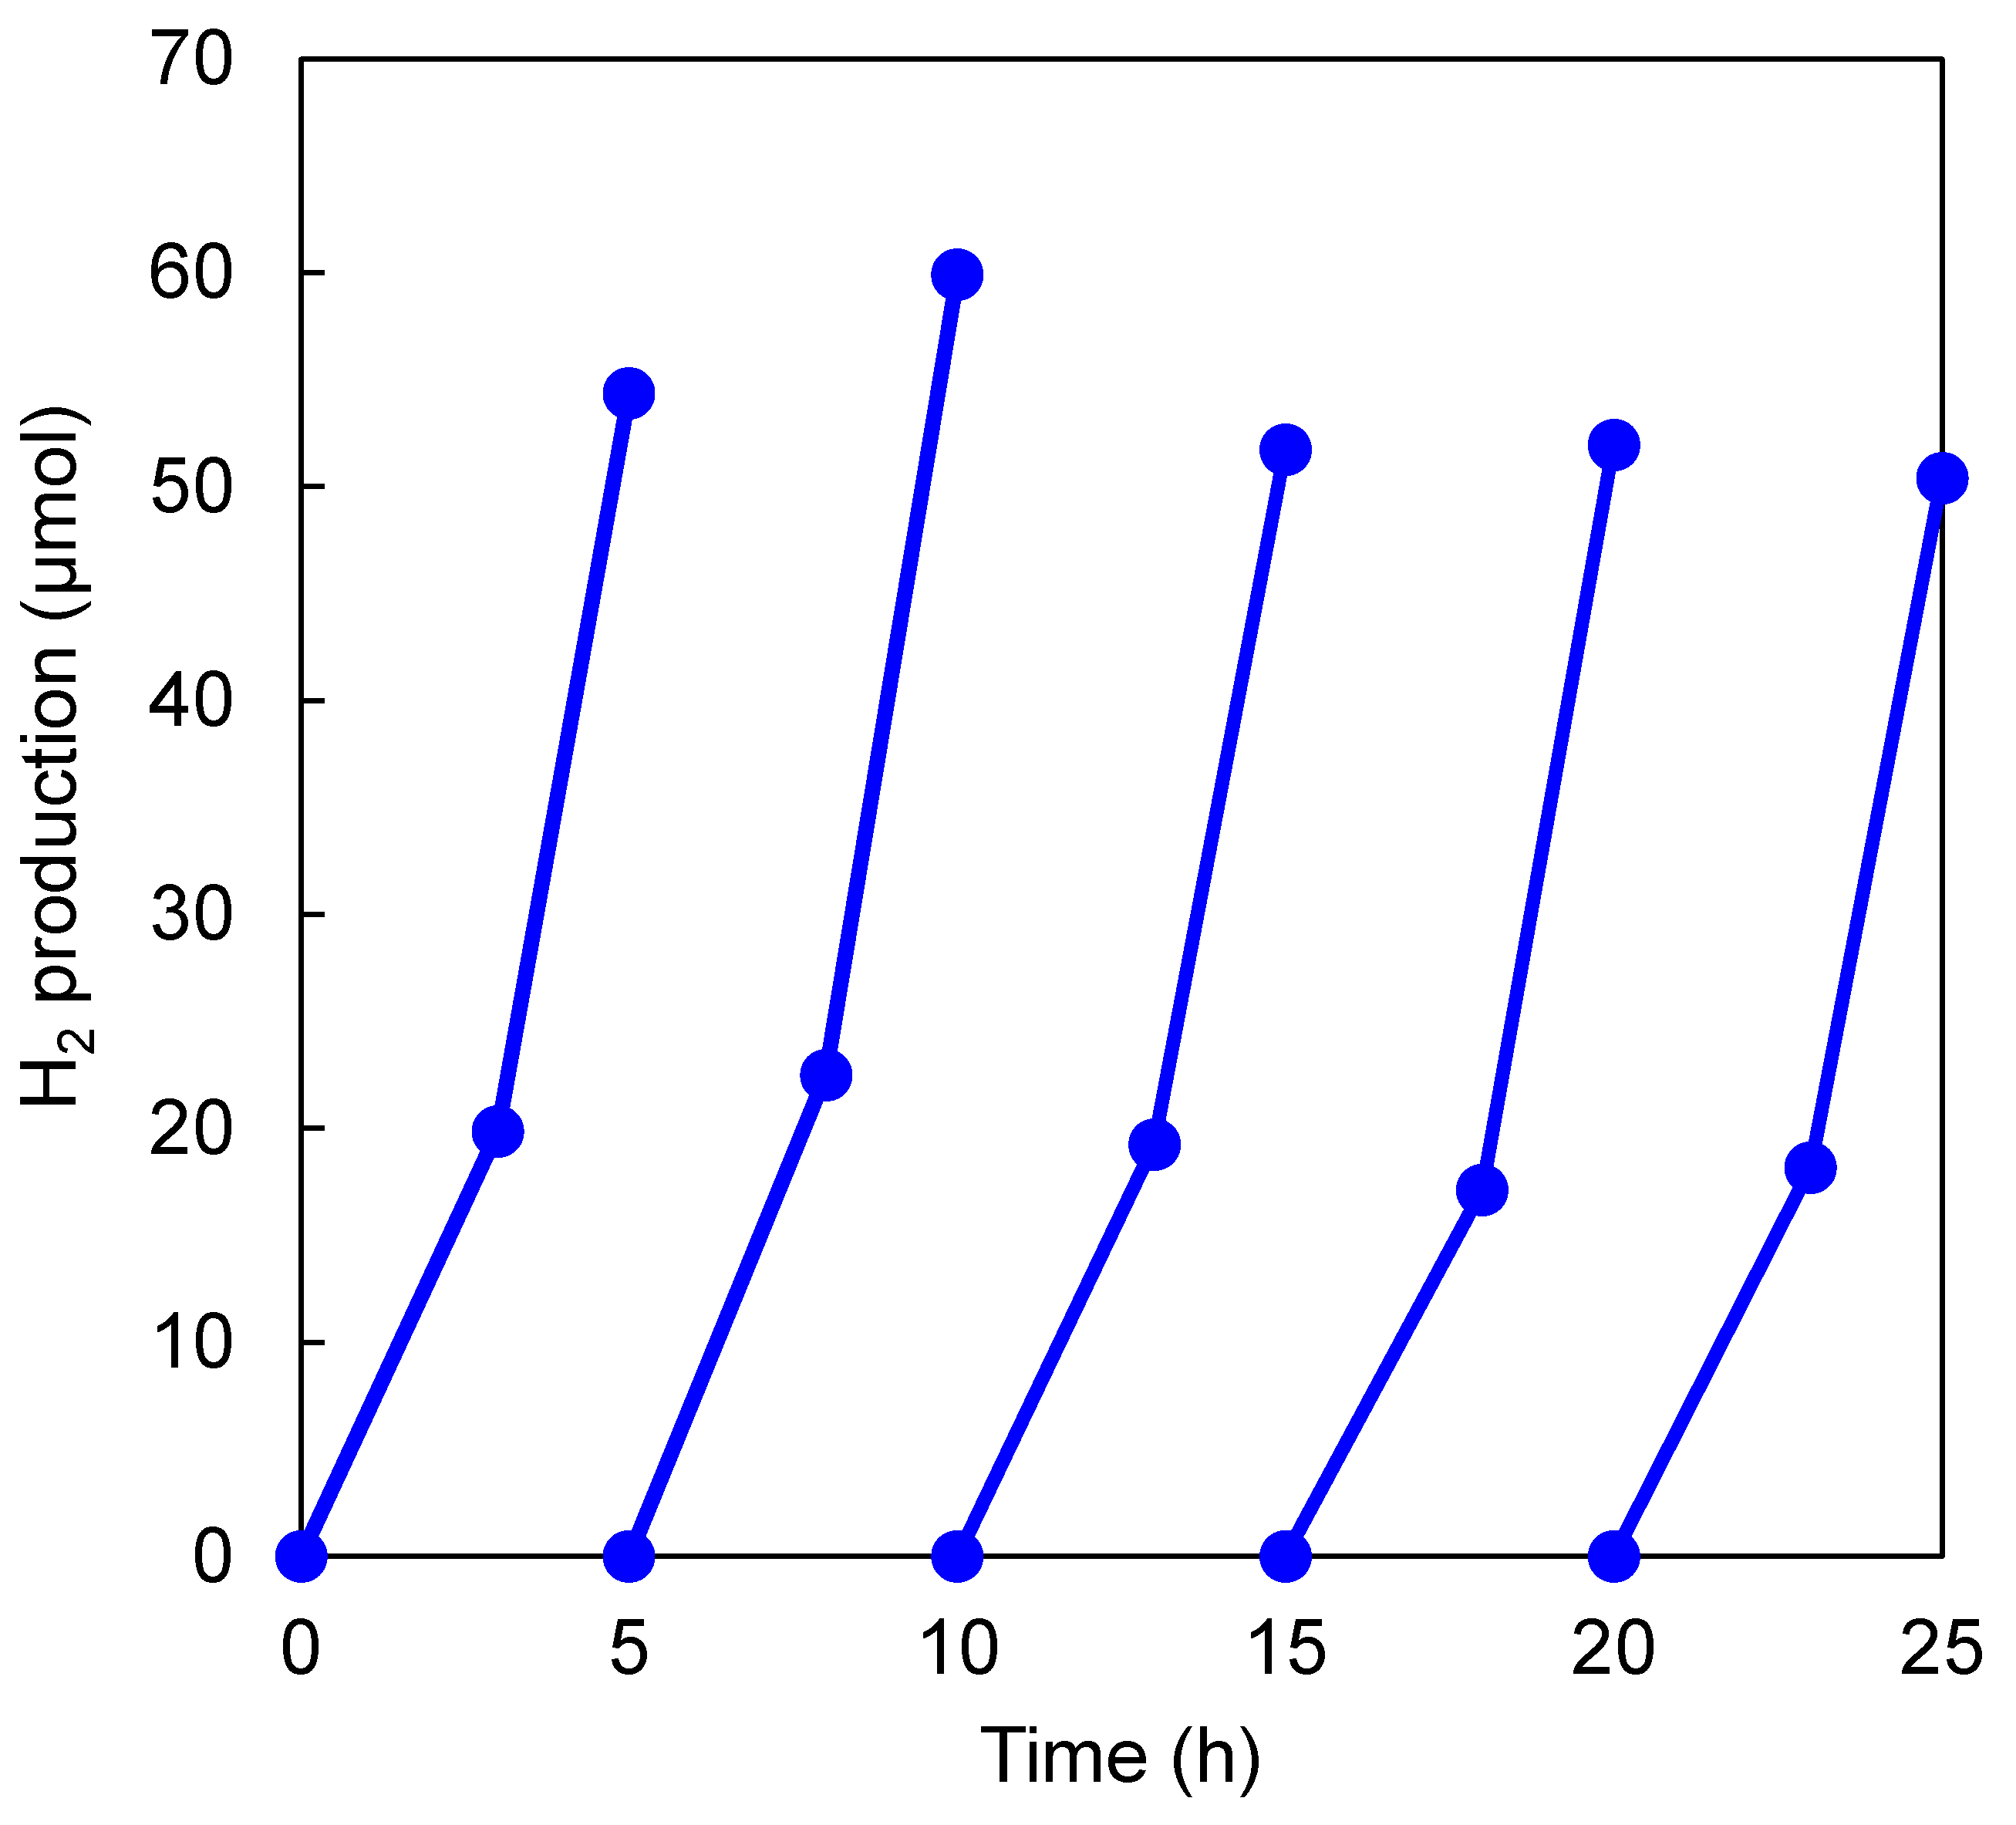
3.4. Reusability of TNT Photocatalysts
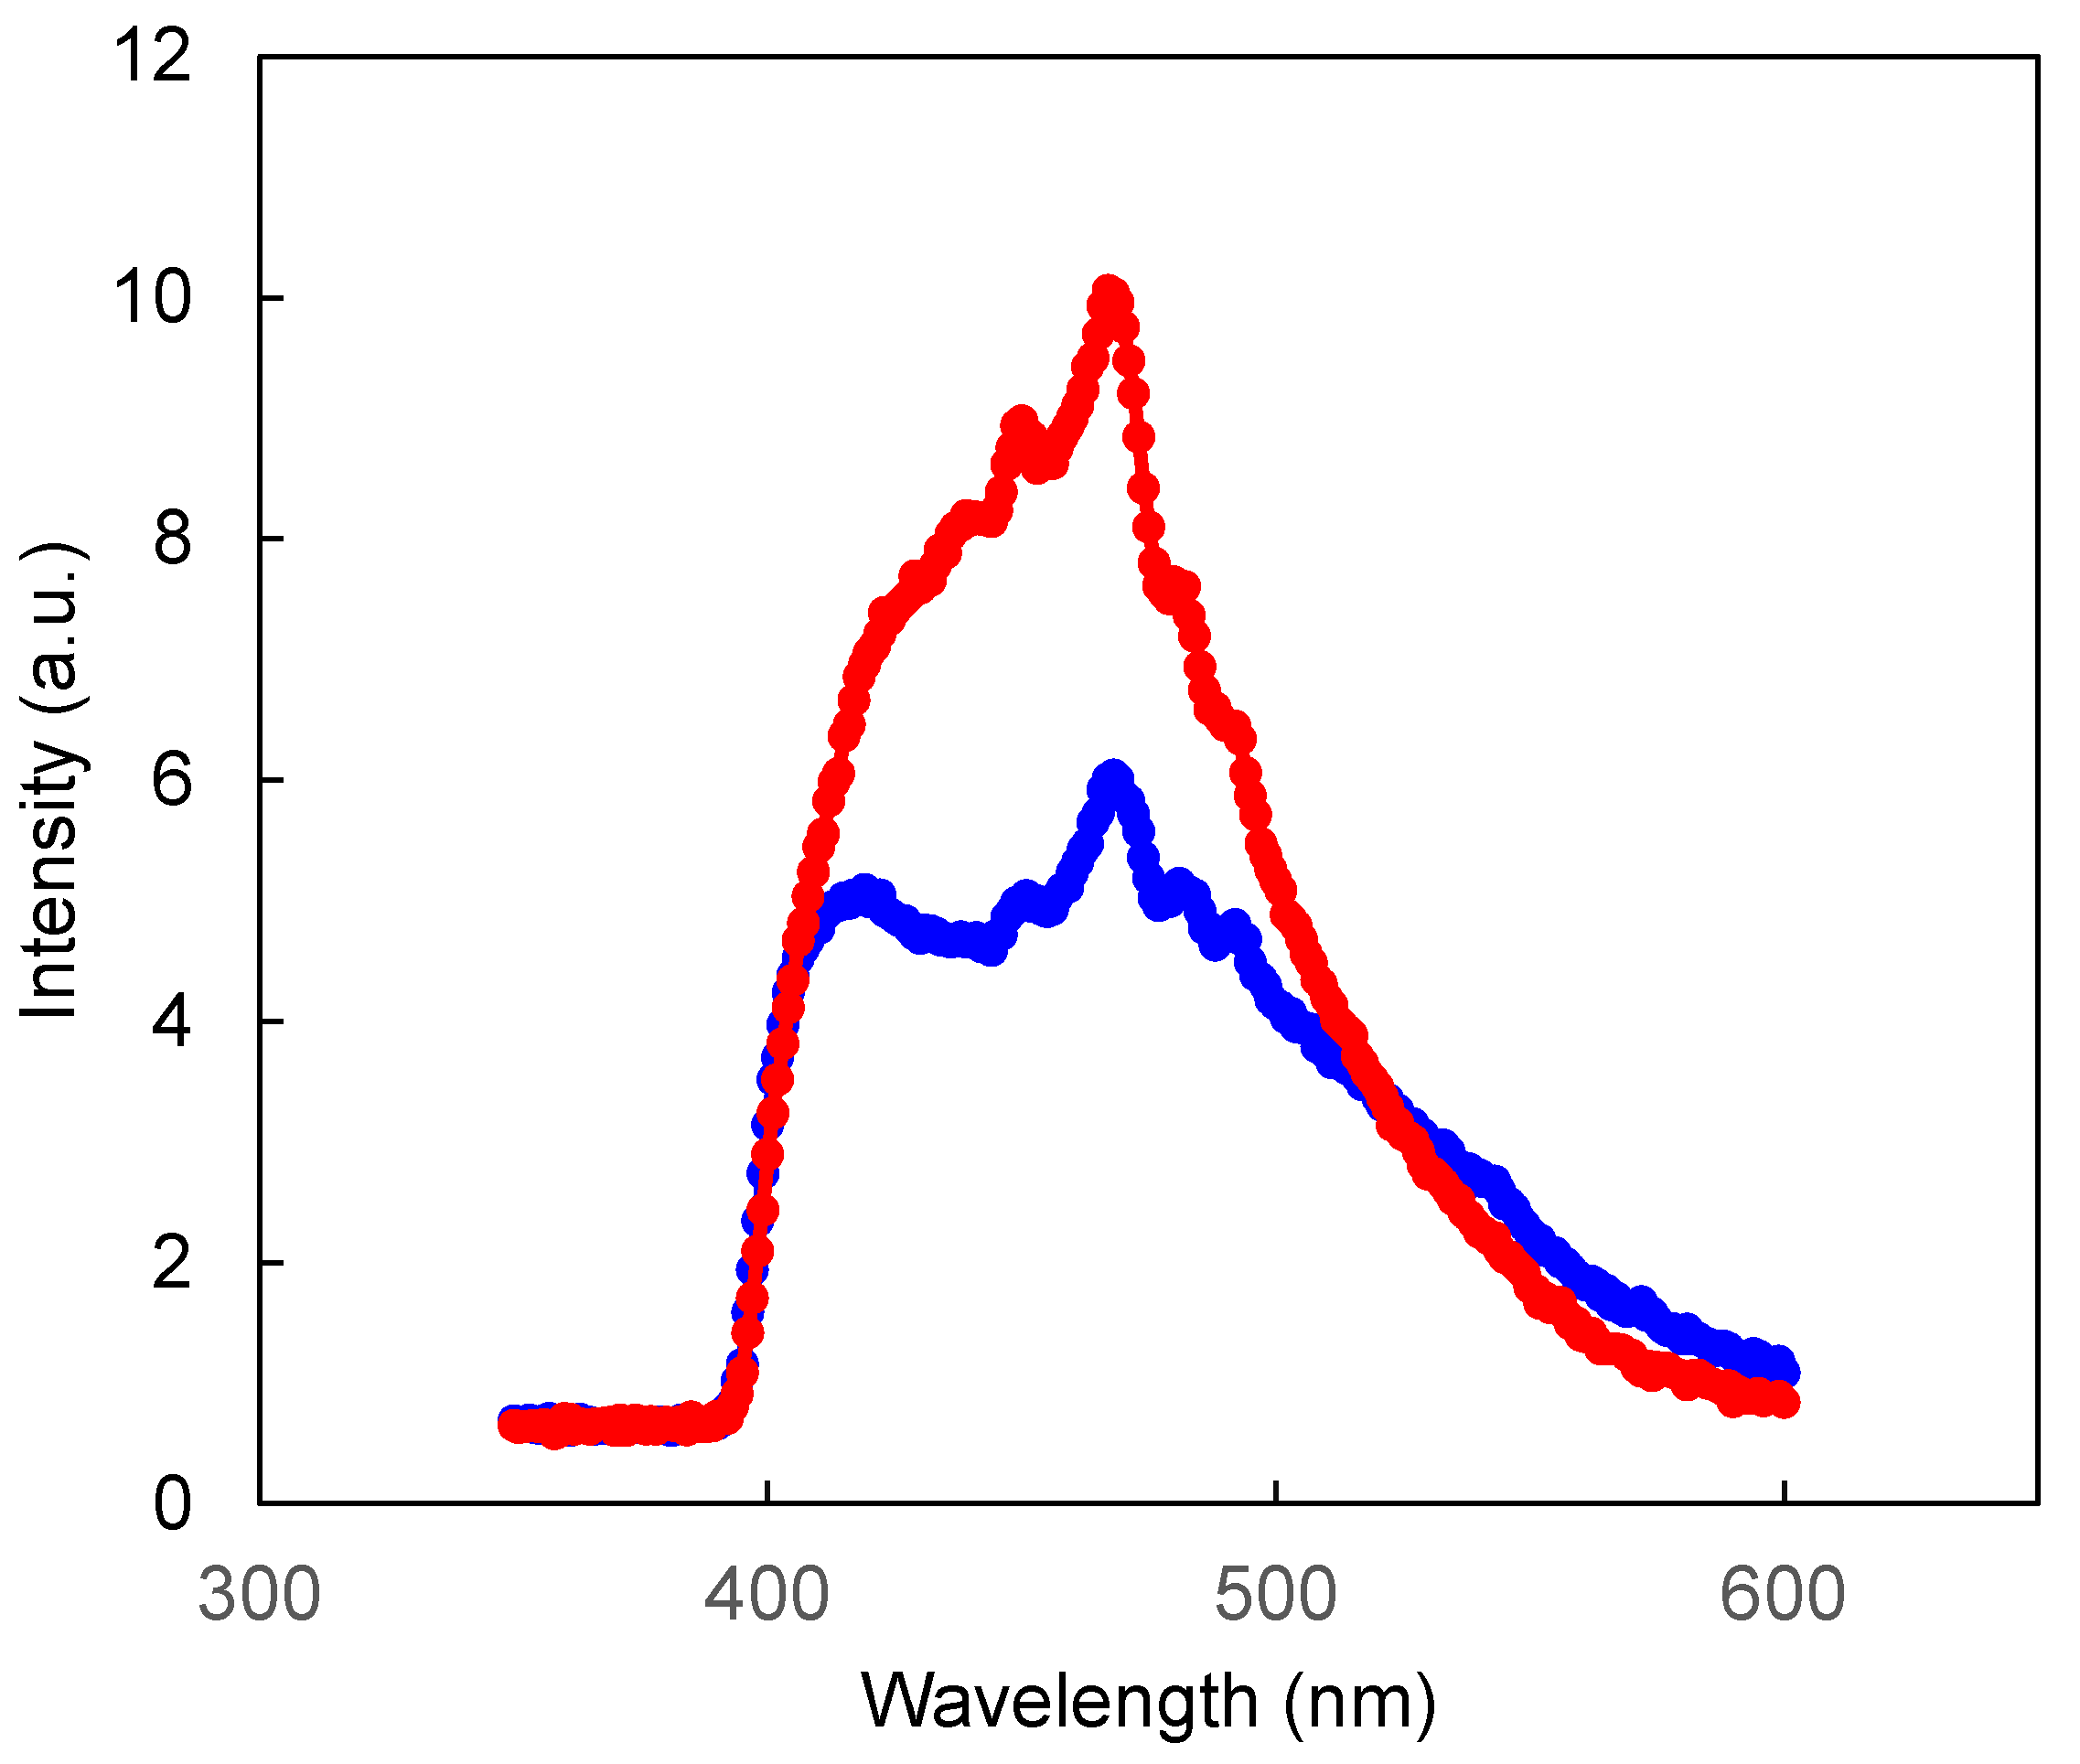
3.5. Mechanism of Hydrogen Production
4. Conclusions
Supplementary Materials
Author Contributions
Funding
Institutional Review Board Statement
Informed Consent Statement
Data Availability Statement
Acknowledgments
Conflicts of Interest
References
- Ge, M.; Li, Q.; Cao, C.; Huang, J.; Li, S.; Zhang, S.; Chen, Z.; Zhang, K.; Al-Deyab, S.S.; Lai, Y. One-dimensional TiO2 nanotube photocatalysts for solar water splitting. Adv. Sci. 2017, 4, 1600152. [Google Scholar] [CrossRef] [PubMed]
- Tahir, M.; Tasleem, S.; Tahir, B. Recent development in band engineering of binary semiconductor materials for solar driven photocatalytic hydrogen production. Int. J. Hydrogen Energy 2020, 45, 15985–16038. [Google Scholar] [CrossRef]
- Trang, T.N.Q.; Nam, N.D.; Tu, L.T.N.; Quoc, H.P.; Van Man, T.; Ho, V.T.T.; Thu, V.T.H. In situ spatial charge separation of an Ir@TiO2 multiphase photosystem toward highly efficient photocatalytic performance of hydrogen production. J. Phys. Chem. C 2020, 124, 16961–16974. [Google Scholar] [CrossRef]
- Wang, X.; Zhang, S.; Peng, B.; Wang, H.; Yu, H.; Peng, F. Enhancing the photocatalytic efficiency of TiO2 nanotube arrays for H2 production by using non-noble metal cobalt as co-catalyst. Mater. Lett. 2016, 165, 37–40. [Google Scholar] [CrossRef]
- Denisov, N.; Yoo, J.E.; Schmuki, P. Effect of different hole scavengers on the photoelectrochemical properties and photocatalytic hydrogen evolution performance of pristine and Pt-decorated TiO2 nanotubes. Electrochim. Acta 2019, 319, 61–71. [Google Scholar] [CrossRef]
- Do, H.H.; Nguyen, D.L.T.; Nguyen, X.C.; Le, T.H.; Nguyen, T.P.; Trinh, Q.T.; Ahn, S.H.; Vo, D.V.N.; Kim, S.Y.; Le, Q.V. Recent progress in TiO2-based photocatalysts for hydrogen evolution reaction: A review. Arab. J. Chem. 2020, 13, 3653–3671. [Google Scholar] [CrossRef]
- Corredor, J.; Rivero, M.J.; Rangel, C.M.; Gloaguen, F.; Ortiz, I. Comprehensive review and future perspectives on the photocatalytic hydrogen production. J. Chem. Technol. Biotechnol. 2019, 94, 3049–3063. [Google Scholar] [CrossRef] [Green Version]
- Feil, A.F.; Migowski, P.; Scheffer, F.R.; Pierozan, M.D.; Corsetti, R.R.; Rodrigues, M.; Pezzi, R.P.; Machado, G.; Amaral, L.; Teixeira, S.R.; et al. Growth of TiO2 nanotube arrays with simultaneous Au nanoparticles impregnation: Photocatalysts for hydrogen production. J. Braz. Chem. Soc. 2010, 21, 1359–1365. [Google Scholar] [CrossRef] [Green Version]
- Fiorenza, R.; Sciré, S.; D’Urso, L.; Compagnini, G.; Bellardita, M.; Palmisano, L. Efficient H2 production by photocatalytic water splitting under UV or solar light over variously modified TiO2-based catalysts. Int. J. Hydrogen Energy 2019, 44, 14796–14807. [Google Scholar] [CrossRef]
- Ou, W.; Pan, J.; Liu, Y.; Li, S.; Li, H.; Zhao, W.; Wang, J.; Song, C.; Zheng, Y.; Li, C. Two-dimensional ultrathin MoS2-modified black Ti3+–TiO2 nanotubes for enhanced photocatalytic water splitting hydrogen production. J. Energy Chem. 2020, 43, 188–194. [Google Scholar] [CrossRef]
- Anpo, M.; Shima, T.; Kodama, S.; Kubokawa, Y. Photocatalytic hydrogenation of CH3CCH with H2O on small-particle TiO2: Size quantization effects and reaction intermediates. J. Phys. Chem. 1987, 91, 4305–4310. [Google Scholar] [CrossRef]
- Clarizia, L.; Spasiano, D.; Di Somma, I.; Marotta, R.; Andreozzi, R.; Dionysiou, D.D. Copper modified-TiO2 catalysts for hydrogen generation through photoreforming of organics. A short review. Int. J. Hydrogen Energy 2014, 39, 16812–16831. [Google Scholar] [CrossRef]
- Thompson, T.L.; Yates, J.T. Surface science studies of the photoactivation of TiO2—New photochemical processes. Chem. Rev. 2006, 106, 4428–4453. [Google Scholar] [CrossRef] [PubMed]
- Gomathisankar, P.; Kawamura, T.; Katsumata, H.; Suzuki, T.; Kaneco, S. Photocatalytic hydrogen production from aqueous methanol solution using titanium dioxide with the aid of simultaneous metal deposition. Energy Sources Part A Recover. Util. Environ. Eff. 2016, 38, 110–116. [Google Scholar] [CrossRef]
- Kumaravel, V.; Mathew, S.; Bartlett, J.; Pillai, S.C. Photocatalytic hydrogen production using metal doped TiO2: A review of recent advances. Appl. Catal. B Environ. 2019, 244, 1021–1064. [Google Scholar] [CrossRef]
- Liu, S.X.; Qu, Z.P.; Han, X.W.; Sun, C.L. A mechanism for enhanced photocatalytic activity of silver-loaded titanium dioxide. Catal. Today 2004, 95–95, 877–884. [Google Scholar] [CrossRef]
- Sakthivel, S.; Shankar, M.V.; Palanichamy, M.; Arabindoo, B.; Bahnemann, D.W.; Murugesan, V. Enhancement of photocatalytic activity by metal deposition: Characterization and photonic efficiency of Pt, Au and Pd deposited on TiO2 catalyst. Water Res. 2004, 38, 3001–3008. [Google Scholar] [CrossRef]
- Gupta, B.; Melvin, A.A.; Matthews, T.; Dash, S.; Tyagi, A.K. TiO2 modification by gold (Au) for photocatalytic hydrogen (H2) production. Renew. Sustain. Energy Rev. 2016, 58, 1366–1375. [Google Scholar] [CrossRef]
- Gomathisankar, P.; Yamamoto, D.; Katsumata, H.; Suzuki, T.; Kaneco, S. Photocatalytic hydrogen production with aid of simultaneous metal deposition using titanium dioxide from aqueous glucose solution. Int. J. Hydrogen Energy 2013, 38, 5517–5524. [Google Scholar] [CrossRef]
- Divyasri, Y.V.; Reddy, N.L.; Lee, K.; Sakar, M.; Rao, V.N.; Venkatramu, V.; Shankar, M.V.; Reddy, N.C.G. Optimization of N doping in TiO2 nanotubes for the enhanced solar light mediated photocatalytic H2 production and dye degradation. Environ. Pollut. 2021, 269, 116170. [Google Scholar] [CrossRef]
- Gong, J.; Pu, W.; Yang, C.; Zhang, J. Novel one-step preparation of tungsten loaded TiO2 nanotube arrays with enhanced photoelectrocatalytic activity for pollutant degradation and hydrogen production. Catal. Commun. 2013, 36, 89–93. [Google Scholar] [CrossRef]
- Huang, Q.; Gao, T.; Niu, F.; Chen, D.; Chen, Z.; Qin, L.; Sun, X.; Huang, Y.; Shu, K. Preparation and enhanced visible-light driven photocatalytic properties of Au-loaded TiO2 nanotube arrays. Superlattices Microstruct. 2014, 75, 890–900. [Google Scholar] [CrossRef]
- Zhang, S.; Wang, H.; Yeung, M.; Fang, Y.; Yu, H.; Peng, F. Cu(OH)2-modified TiO2 nanotube arrays for efficient photocatalytic hydrogen production. Int. J. Hydrogen Energy 2013, 38, 7241–7245. [Google Scholar] [CrossRef]
- Zhao, W.; Wang, X.; Sang, H.; Wang, K. Synthesis of Bi-doped TiO2 nanotubes and enhanced photocatalytic activity for hydrogen evolution from glycerol solution. Chin. J. Chem. 2013, 31, 415–420. [Google Scholar] [CrossRef]
- Chen, Q.; Zhou, W.; Du, G.; Peng, L.M. Trititanate nanotubes made via a single alkali treatment. Adv. Mater. 2002, 14, 1208–1211. [Google Scholar] [CrossRef]
- Kasuga, T.; Hiramatsu, M.; Hoson, A.; Sekino, T.; Niihara, K. Formation of titanium oxide nanotube. Langmuir 1998, 14, 3160–3163. [Google Scholar] [CrossRef]
- Lee, J.H.; Leu, I.C.; Hsu, M.C.; Chung, Y.W.; Hon, M.H. Fabrication of aligned TiO2 one-dimensional nanostructured arrays using a one-step templating solution approach. J. Phys. Chem. B 2005, 109, 13056–13059. [Google Scholar] [CrossRef]
- Macak, J.M.; Tsuchiya, H.; Ghicov, A.; Yasuda, K.; Hahn, R.; Bauer, S.; Schmuki, P. TiO2 nanotubes: Self-organized electrochemical formation, properties and applications. Curr. Opin. Solid State Mater. Sci. 2007, 11, 3–18. [Google Scholar] [CrossRef]
- Gong, D.; Grimes, C.A.; Varghese, O.K.; Hu, W.; Singh, R.S.; Chen, Z.; Dickey, E.C. Titanium oxide nanotube arrays prepared by anodic oxidation. J. Mater. Res. 2001, 16, 3331–3334. [Google Scholar] [CrossRef] [Green Version]
- Zhou, D.; Chen, Z.; Gao, T.; Niu, F.; Qin, L.; Huang, Y. Hydrogen generation from water splitting on TiO2 nanotube-array-based photocatalysts. Energy Technol. 2015, 3, 888–895. [Google Scholar] [CrossRef]
- Yang, S.; Ohtani, B. Substitutionally rhodium(IV)-doped titania showing photocatalytic activity toward organics oxidation under visible-light irradiation. Catal. Today 2021, 380, 25–31. [Google Scholar] [CrossRef]
- Suhag, M.H.; Tateishi, I.; Furukawa, M.; Katsumata, H.; Khatun, A.; Kaneco, S. Photocatalytic hydrogen production from formic acid solution with titanium dioxide with the aid of simultaneous Rh deposition. ChemEngineering 2022, 6, 43. [Google Scholar] [CrossRef]
- Yamamoto, T.; Katsumata, H.; Suzuki, T.; Kaneco, S. Photoelectrochemical reduction of CO2 in methanol with TiO2 photoanode and metal cathode. ECS Trans. 2017, 75, 31–37. [Google Scholar] [CrossRef]
- Slamet; Tristantini, D.; Valentina; Ibadurrohman, M. Photocatalytic hydrogen production from glycerol-water mixture over Pt-N-TiO2 nanotube photocatalyst. Int. J. Energy Res. 2013, 37, 1372–1381. [Google Scholar] [CrossRef]
- Zhao, C.; Luo, H.; Chen, F.; Zhang, P.; Yi, L.; You, K. A novel composite of TiO2 nanotubes with remarkably high efficiency for hydrogen production in solar-driven water splitting. Energy Environ. Sci. 2014, 7, 1700–1707. [Google Scholar] [CrossRef]
- Wang, Q.; An, N.; Bai, Y.; Hang, H.; Li, J.; Lu, X.; Liu, Y.; Wang, F.; Li, Z.; Lei, Z. High photocatalytic hydrogen production from methanol aqueous solution using the photocatalysts CuS/TiO2. Int. J. Hydrogen Energy 2013, 38, 10739–10745. [Google Scholar] [CrossRef]
- Chen, W.T.; Chan, A.; Sun-Waterhouse, D.; Moriga, T.; Idriss, H.; Waterhouse, G.I.N. Ni/TiO2: A promising low-cost photocatalytic system for solar H2 production from ethanol-water mixtures. J. Catal. 2015, 326, 43–53. [Google Scholar] [CrossRef]
- Wei, P.; Liu, J.; Li, Z. Effect of Pt loading and calcination temperature on the photocatalytic hydrogen production activity of TiO2 microspheres. Ceram. Int. 2013, 39, 5387–5391. [Google Scholar] [CrossRef]
- Indira, K.; Mudali, U.K.; Nishimura, T.; Rajendran, N. A review on TiO2 nanotubes: Influence of anodization parameters, formation mechanism, properties, corrosion behavior, and biomedical applications. J. Bio- Tribo-Corros. 2015, 1, 28. [Google Scholar] [CrossRef] [Green Version]
- Ribeiro, B.; Offoiach, R.; Rahimi, E.; Salatin, E.; Lekka, M.; Fedrizzi, L. On growth and morphology of TiO2 nanotubes on Ti6Al4V by anodic oxidation in ethylene glycol electrolyte: Influence of microstructure and anodization parameters. Materials 2021, 14, 2540. [Google Scholar] [CrossRef]
- Shi, H. Formation mechanism of anodic TiO2 nanotubes. Adv. Eng. Res. 2017, 123, 785–788. [Google Scholar]


Publisher’s Note: MDPI stays neutral with regard to jurisdictional claims in published maps and institutional affiliations. |
© 2022 by the authors. Licensee MDPI, Basel, Switzerland. This article is an open access article distributed under the terms and conditions of the Creative Commons Attribution (CC BY) license (https://creativecommons.org/licenses/by/4.0/).
Share and Cite
Suhag, M.H.; Tateishi, I.; Furukawa, M.; Katsumata, H.; Khatun, A.; Kaneco, S. Application of Rh/TiO2 Nanotube Array in Photocatalytic Hydrogen Production from Formic Acid Solution. J. Compos. Sci. 2022, 6, 327. https://doi.org/10.3390/jcs6110327
Suhag MH, Tateishi I, Furukawa M, Katsumata H, Khatun A, Kaneco S. Application of Rh/TiO2 Nanotube Array in Photocatalytic Hydrogen Production from Formic Acid Solution. Journal of Composites Science. 2022; 6(11):327. https://doi.org/10.3390/jcs6110327
Chicago/Turabian StyleSuhag, Mahmudul Hassan, Ikki Tateishi, Mai Furukawa, Hideyuki Katsumata, Aklima Khatun, and Satoshi Kaneco. 2022. "Application of Rh/TiO2 Nanotube Array in Photocatalytic Hydrogen Production from Formic Acid Solution" Journal of Composites Science 6, no. 11: 327. https://doi.org/10.3390/jcs6110327