Article

The Impact of Zinc Oxide Micro-Powder Filler on the Physical and Mechanical Response of High-Density Polyethylene Composites in Material Extrusion 3D Printing

by
Nectarios Vidakis
1,
Markos Petousis
1,*,
Athena Maniadi
2,
Vassilis Papadakis
3 and
Amalia Moutsopoulou
1
1
Mechanical Engineering Department, Hellenic Mediterranean University, Estavromenos, 71410 Heraklion, Greece
2
Department of Materials Science and Technology, University of Crete, 70013 Heraklion, Greece
3
Institute of Molecular Biology and Biotechnology, Foundation for Research and Technology—Hellas, P.O. Box 1527, 71110 Heraklion, Greece
*
Author to whom correspondence should be addressed.
J. Compos. Sci. 2022, 6(10), 315; https://doi.org/10.3390/jcs6100315
Submission received: 10 September 2022 / Revised: 27 September 2022 / Accepted: 11 October 2022 / Published: 14 October 2022
(This article belongs to the Special Issue 3D Printing Composites)

Abstract

:
The scope of this work was to develop novel polymer composites via melt extrusion and 3D printing, incorporating High-Density Polyethylene filled with zinc oxide particles in various wt. percentages. For each case scenario, a filament of approximately 1.75 mm in diameter was fabricated. Samples for tensile and flexural testing were fabricated with 3D printing. They were then evaluated for their mechanical response according to ASTM standards. According to the documented testing data, the filler increases the mechanical strength of pure HDPE at specific filler concentrations. The highest values reported were a 54.6% increase in the flexural strength with HDPE/ZnO 0.5 wt.% and a 53.8% increase in the tensile strength with 10 wt.% ZnO loading in the composite. Scanning Electron Microscopy (SEM), Raman, and thermal characterization techniques were used. The experimental findings were evaluated in other research areas where they were applicable.

1. Introduction

In the past decade, a lot of research has been applied to Additive Manufacturing (AM) and more, especially in the material extrusion (MEX) 3D printing process. MEX 3D printing is a cost-efficient method of the AM family [1]. It enables the industry the manufacturing of cost-efficient polymeric, and not only, products in a short time. Parts manufactured with this process are lightweight and, in parallel, durable [1,2,3,4]. 3D printing nowadays benefits the aerospace industry [4], the biomedical research sector [5,6], and many more industries, such as automotive, by aiding fast prototyping and testing of new products and parts while reducing the time of the research and development stages [4].
Materials for MEX 3D printing is also a research sector that is constantly gaining momentum [7]. The main reason behind this demand is the need for advanced materials with higher specifications regarding mechanical, electrical, and physical properties. Currently, research on 3D printing materials focuses mostly on Acrylonitrile-Butadiene-Styrene (ABS) and Polylactic Acid, as these materials are the most used in 3D printing [8,9]. Moreover, other thermoplastics (Polypropylene (PP) [10], Polyamides [11], Polyethylene (PE) [12], and others) are now effectively used in 3D printing as well. Many studies were conducted to investigate how the mechanical properties of these materials are affected by the 3D printing parameters applied [12,13,14,15,16,17,18,19].
The above advancements have led to increasing research interest in composite and nanocomposite development for 3D printing applications, with the promise of more robust or application-tailored materials. Studies have shown that the introduction of micro or even nanofillers into polymeric matrices can increase the mechanical properties of the unfilled matrix up to a certain percentage [20,21,22,23,24,25,26,27,28,29,30,31].
High-Density Polyethylene (HDPE) of the Polyethylene (PE) polymeric family is a polymeric material amongst others that is not yet fully utilized in 3D printing [8]. HDPE is a widely used thermoplastic substance. It is a polymer that is present in many common home objects and is used to manufacture a wide range of items and parts. Because of its properties, the polyethylene category of polymers includes some of the most widely used polymers today. Some of the most commonly used thermoplastics in the industry are Polypropylene (PP), HDPE, and Low-Density Polyethylene (LDPE). They are applied in fields, such as cases, hoses, children’s toys, and handbags (LDPE), gas lines (HDPE) [32], packaging, house appliances and membranes [32,33], and automotive parts and electrical components (PP) [34]. Due to its high level of recycling and affordability, HDPE can be characterized as a cost-effective, eco-friendly thermoplastic [35,36]. Therefore, as expected, it has been used and investigated for AM applications in 3D printing and elsewhere. The most recent advance for HDPE is researching the mechanical, electrical, and physical properties of the material when fillers are introduced in the unfilled matrix. Literature reports results with HDPE as the matrix material in composites having various fillers, such as carbon nanotubes [36,37], carbon [38], glass micro balloons [39,40,41], fly ash cenospheres [42,43,44], calcium carbonate [45] and graphite nanofibers [46]. Furthermore, the literature indicates that when HDPE is utilized in 3D printing as a matrix material, the incorporation of nanofillers at concentrations lower than 5% weight percent [47,48] can improve its mechanical response.
The literature reports results of the HDPE polymer doped with zinc oxide (ZnO) [49], titanium dioxide (TiO2) [50,51,52], tin oxide (SnO2) [48,49,50,51,52,53], PbO [54], silica [53,55], and alumina [56]. Apart from one work, in which research was conducted on MEX 3D-printed samples [51], the aforementioned research was performed on bulk materials samples made by injection molding or material removal processes. There has not been much research on HDPE composites for rapid tooling applications, and there is not much specific information on the mechanical properties of 3D-printed specimens either [57].
Concerning HDPE with easy-to-find fillers such as zinc oxide (ZnO), research is focusing on the thermomechanical properties of the composite [58], the improvement of the interaction between the filler and the matrix [59], the application of the composite in UV shielding [60], and for antibacterial application [61]. Still, literature reporting results on the effect of the ZnO filler on the performance of 3D-printed HDPE/ZnO composites is limited. The current work seeks to create and investigate innovative and more resilient HDPE composites manufactured by melt extrusion, which are composed of an HDPE matrix with ZnO microparticle weight-to-weight proportions. Another objective of the research was to create composites with improved mechanical characteristics using common materials used in industrial applications.
In this work, melt extrusion was used to create novel and more durable composite filaments. With a 10-weight percent filler loading, HDPE’s tensile strength is reported to have increased by 53.8%, and with a 2.5 by weight percentage filler concentration, its flexural strength has increased by 400%. The addition of ZnO microparticles increased the tensile strength and flexural strength of 3D-printed specimens. The morphology of the materials was further examined using SEM and Raman spectroscopy, and their thermal characteristics were assessed using Thermogravimetric analysis (TGA) and Differential Scanning Calorimetry (DSC). Another objective of this study is to increase the printability of HDPE composites using locally available 3D printers and extruders. The aforementioned industries can immediately profit from the aforesaid results by replacing their present materials with more mechanically improved polymer composites.

2. Materials and Methods

2.1. Materials

The Kritilen High-Density Polyethylene powder polymer matrix was employed in this work (melt Mass-Flow Rate (MFR), 190 °C/2.16kg, 7.5 g/10 min, density 0.960 g/cm3, Vicat Softening Temperature 127 °C). Regarding the filler introduced in this work, Sigma Aldrich Zinc Oxide (ZnO micro, 96479) was selected and procured, which has typical particles that are less than 5 microns in size and an assay of >99% as the micro filler. No other additives or plasticizers were utilized for the preparation of the composites in the work.

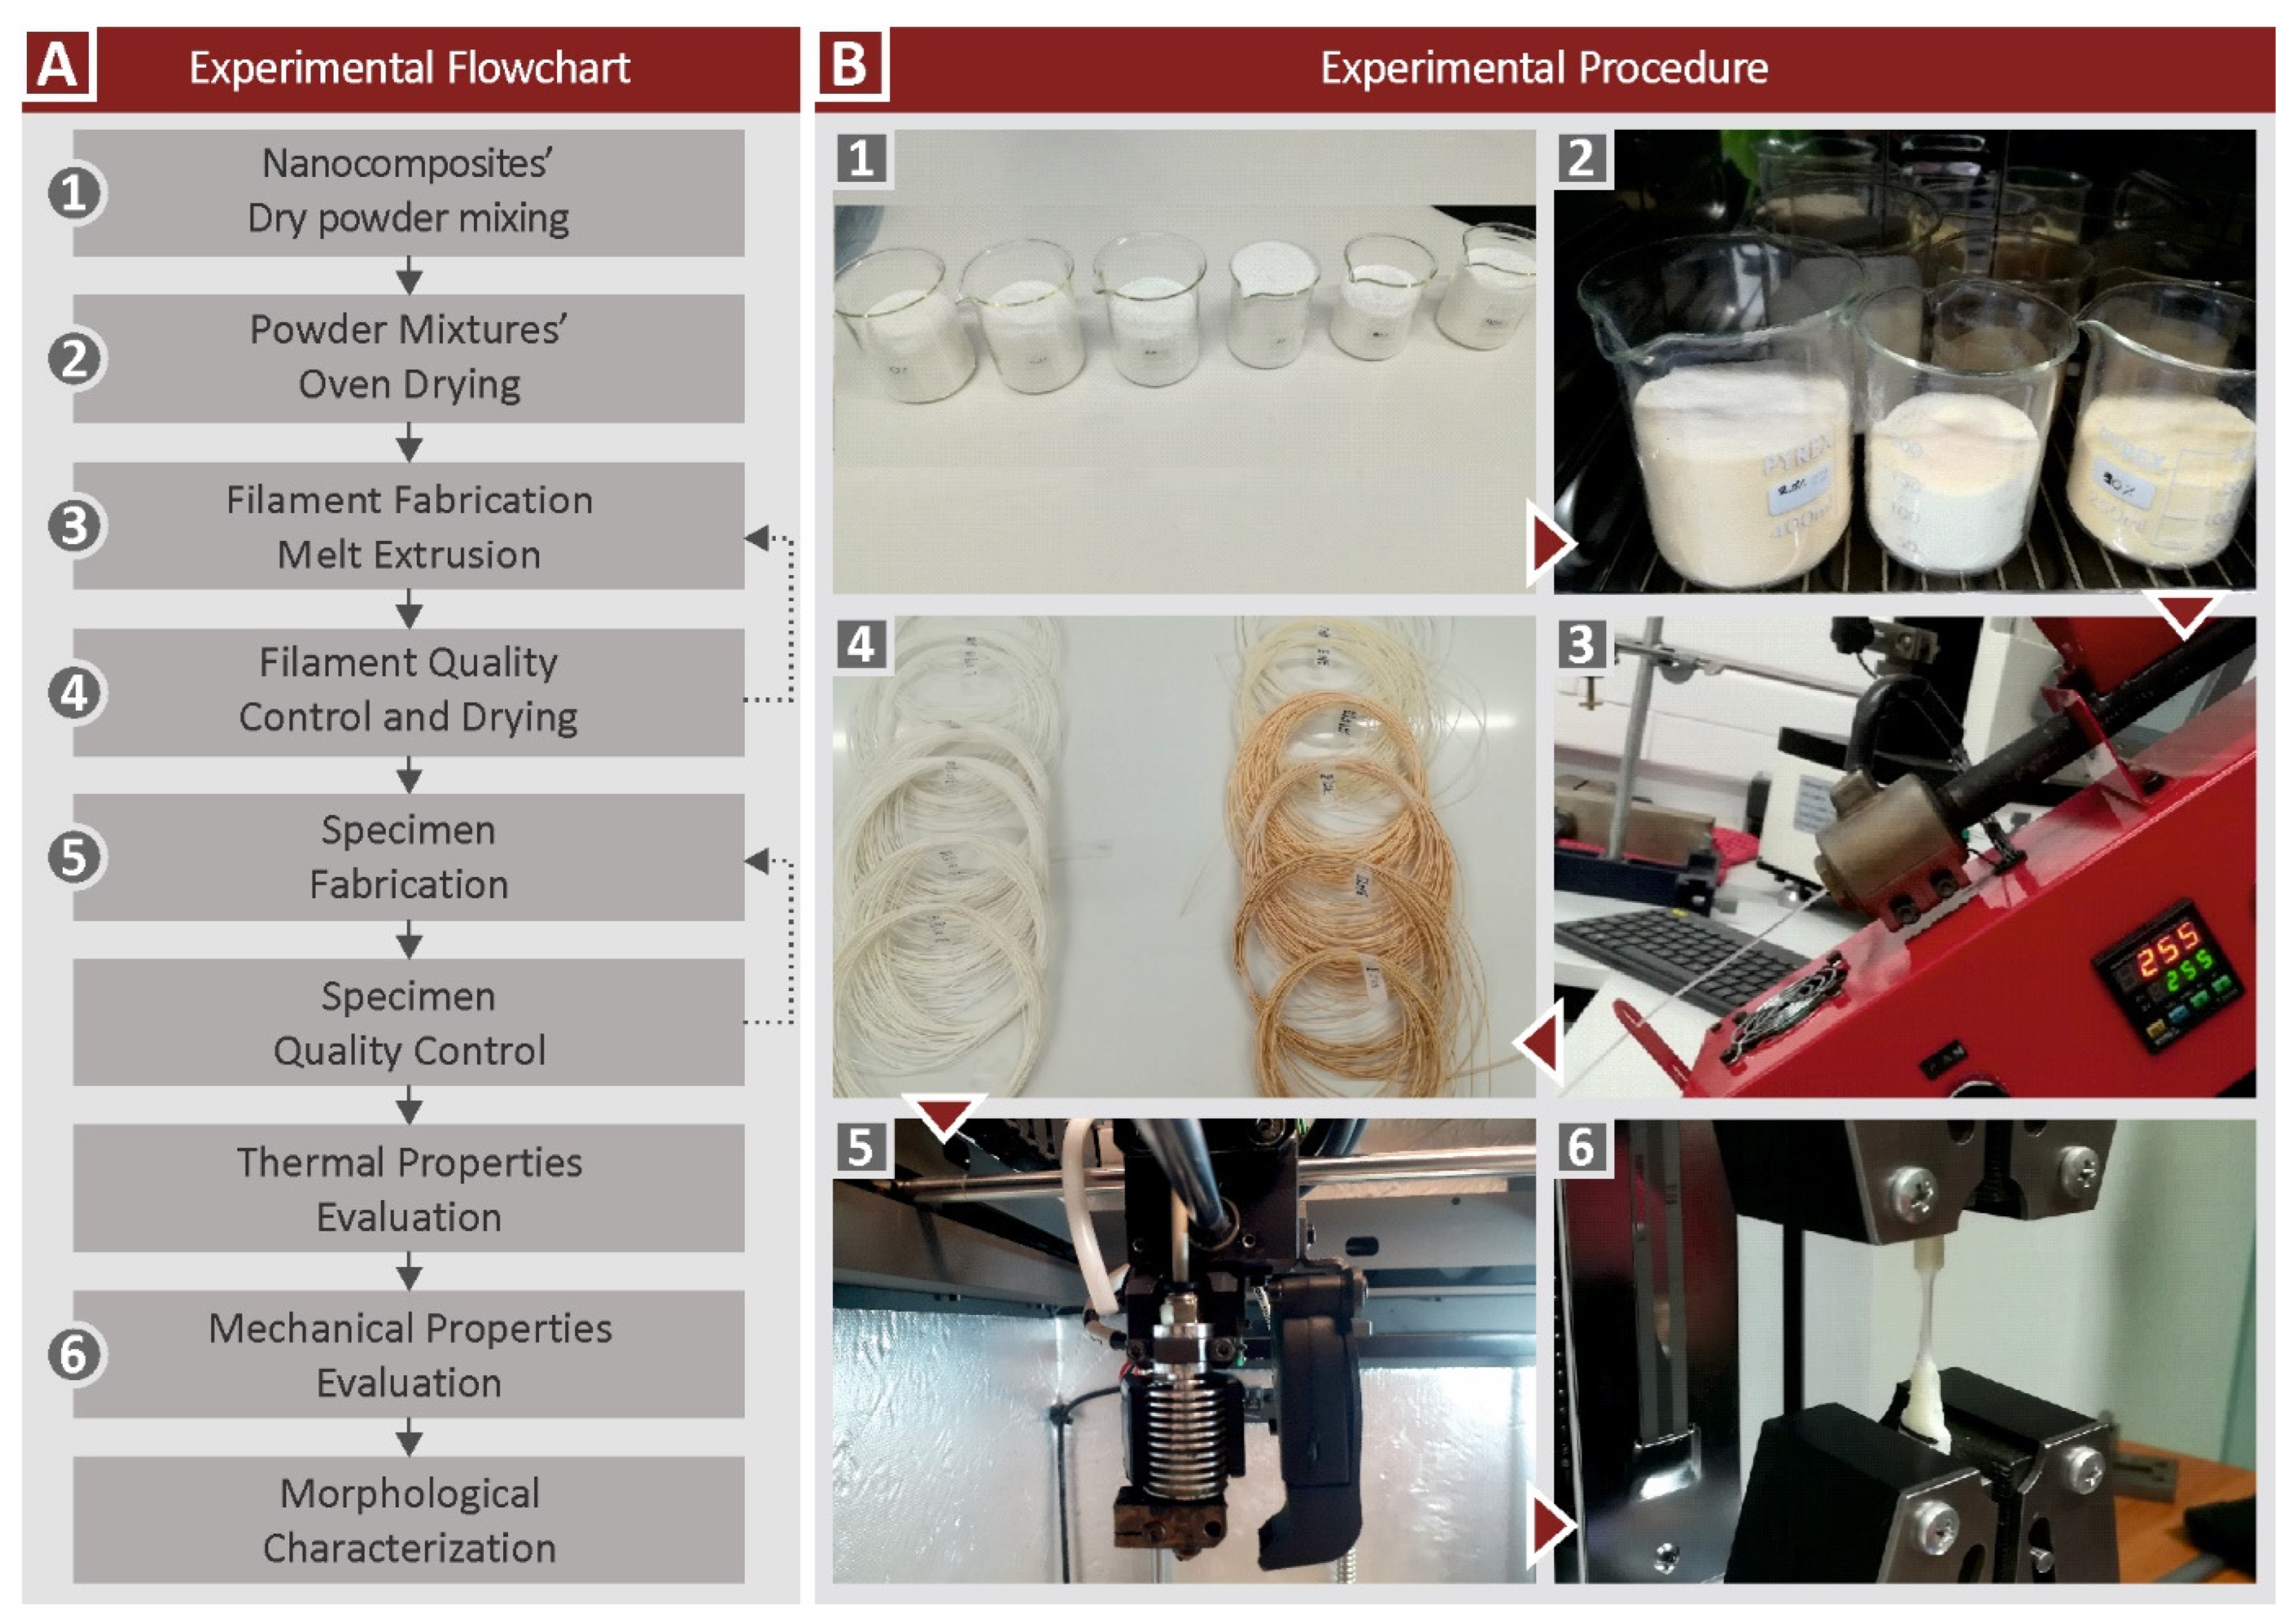
2.2. Microcomposites Fabrication

Figure 1 presents the overall work steps followed to complete the research work. Section A of Figure 1 presents the defined workflow steps while the B section of Figure 1 depicts the experimental procedures, i.e., (1) the mechanical mixing, (2) the oven drying, (3) material filament extrusion, (4) filament evaluation, (5) specimen fabrication, and (6) mechanical properties investigation. As a first step, the filler concentrations were selected for this study. These percentages were derived by studying the available literature, considering results reported from the labs’ previous projects and, of course, the materials’ capacity for filler loading. The ZnO additive weight-to-weight concentrations were 0 wt.%, 0.5 wt.%, 2.5 wt.%, 5 wt.%, 10 wt.%, and 20 wt.%.
The fillers were scaled and mechanically mixed with the matrix. The materials were mixed with the help of a laboratory mechanical stirrer of 1 kW for at least 20 min while in some cases, magnetic stirrers were used. The powder mixtures were then oven-dried at 70 °C for 48 h before extrusion.
Material filament fabrication was performed on a Noztek Pro (Shoreham-by-Sea, UK) desktop extruder with a single screw, preheated at 200 °C. The preheating sequence was used to remove any residual humidity left in the machine prior to extruding the filament that could cause material defects. Experiment results show that the extrusion operating temperature is about 255 °C. The TGA investigation confirmed that this temperature does not induce material deterioration. This working temperature is calculated empirically by attempting to estimate the HDPE’s melting/softening point while maintaining the necessary working pressure and flow to extrude the proper diameter filament.
Working with a material such as HDPE entails many processability issues and difficulties because of the high viscosity of the material and the low heating dissipation factor, which leads the material to stick with ease to every surface it touches. An extruder fan was used and run at full speed to get over the aforementioned challenges and contribute to achieving as accurate diameter, for the produced filament, as possible. To cool the injected filament down in a regulated manner, additional cooling was required, which was achieved by setting 20 cm apart from the nozzle of the extruder two additional fans, operating at full speed as well.
The process of extruding the composite filament had difficulties at filler concentrations above 10 wt.% due to nozzle clogging, reduced material flow, and visible material agglomerates. The filament strands, prior to 3D printing, were meticulously examined for faults, bubbles, diameter consistency, and agglomerates. This procedure was performed to ensure the smooth 3D printing of the test specimens and to serve as the 2nd stage for material quality control.

2.3. Specimens’ Fabrication

To ensure that no moisture was present in the produced filaments, they were further dried in a laboratory-scale oven at 70 °C for at least 24 h before being used for the 3D printing samples. Such moisture could produce bubbles during the extrusion of the material in the 3D printing process, and therefore defective parts would be built. An Intamsys Funmat HT (Shanghai, China) 3D printer operating with the material extrusion (MEX) 3D printing process was then used for the fabrication of the samples. No 3D printing aids were used. The heat-bed of the 3D printer was preheated at 100 °C. The deposition temperature was set and maintained at 250 °C. The 3D printing temperature was also determined experimentally before the fabrication of the samples for this work.
The 3D printing settings remained consistent for all the specimens fabricated in this work. The FFF parameters were experimentally identified before the fabrication of the specimens for this work and can be found in Table 1 below.
Tensile experiments required the fabrication of seven specimens, five of which were mechanically tested and randomly selected. The ASTM D638-14 standard was followed in the fabrication of each specimen. A type V specimen was selected for this work. More than five specimens were manufactured to discard possible specimens with defects and select the best five for tensile testing. For the flexural tests (3-point bending, with a 52 mm span), the ASTM D790-02 standard was followed. Therefore, seven specimens were 3D printed, five of which were selected randomly to be tested.

2.4. Characterization of the 3D-Printed Samples in the Mechanical Tests Conducted

An IMADA MX2 (Northbrook, IL, USA) apparatus with a corresponding setup for each case was used to carry out the mechanical characterization in both the tensile and the flexural cases. Following the requirements of the ASTM standards, the machine’s chuck speed was maintained at 10 mm/min.
The micro-hardness Vickers experiments were performed in accordance with the ASTM E384-17 standard, with the following parameters: Surfaces were polished before the measurements. The applied force on the surface of the samples was 0.1 kg (0.981 N). The indentation time was 10 s, and the tip used was for Vickers measurements, featuring a diamond pyramid with an apex angle of 136 degrees. For the Vickers measurements, the area of the imprint is calculated automatically by the device by measuring the diagonals of the imprint after the diamond pyramid is retracted. Measurements were carried out employing an Innova Test 400-Vickers (Innovatest Europe BV, Maastricht, The Netherlands) Vickers microhardness measurement device.

2.5. Thermal Properties Investigations on the Prepared Composites

A Thermogravimetric Analysis (TGA) was performed to determine the temperature at which the materials start to degrade. This information was used to specify the ideal extrusion and 3D printing temperatures. A Perkin Elmer apparatus, model Diamond TG/TDA (Waltham, MA, USA), was employed for the TGA measurements, which were taken following a heating cycle of 32 °C to 550 °C and a 10 °C/min heating step. All the different samples were examined. Nitrogen was the purging gas in the measurements.
The influence of filler content on the melting point (Tm) of the composites was determined with Differential Scanning Calorimetry (DSC), which also revealed the degree of crystallinity changes in the samples. DSC was performed on a Perkin Elmer device, model Diamond DSC (Waltham, MA, USA), applying the following pattern: 50 °C to 300 °C, 10 °C/min heating step, and then down to 50 °C. Nitrogen was utilized as the purging gas for the cooling down.

2.6. Investigation of the Morphological and Structural Characteristics of the Prepared Composites

A JEOL model JSM 6362LV (Jeol Ltd., Tokyo, Japan) was employed to acquire the Scanning Electron Microscope (SEM) images from the samples. Images were taken in high-vacuum mode at 20 kV acceleration voltage. To ascertain the fracture mechanism and layer fusion quality, the specimens were inspected. On non-sputtered specimens, an Energy Dispersive X-Ray Analysis (EDX) was carried out to confirm the composition of the composites.
Raman measurements were performed using a modified LabRAM HR Raman spectrometer (HORIBA Scientific, Kyoto, Japan). Raman excitation was achieved using a solid-state laser module with a center wavelength of 532 nm. The highest laser power used was 90 mW. The employed optical microscope was integrated into a 50× microscope objective. The numerical aperture was set to 0.5 and the working distance for the observation was 10.6 mm (LMPlanFL N, Olympus, Tokyo, Japan), which provides the excitation light and collects the Raman signal. Using a neutral filter with 50% transmission resulted in a sample output of 20 mW. The laser spot size was approximately 1.7 μm laterally and about 2 μm axially. There are two optical windows per point when the Raman spectral range is set at 400 to 3100 cm−1. Each measurement took 3 s to acquire, and 5 measurements at each site were taken.

3. Results & Discussion

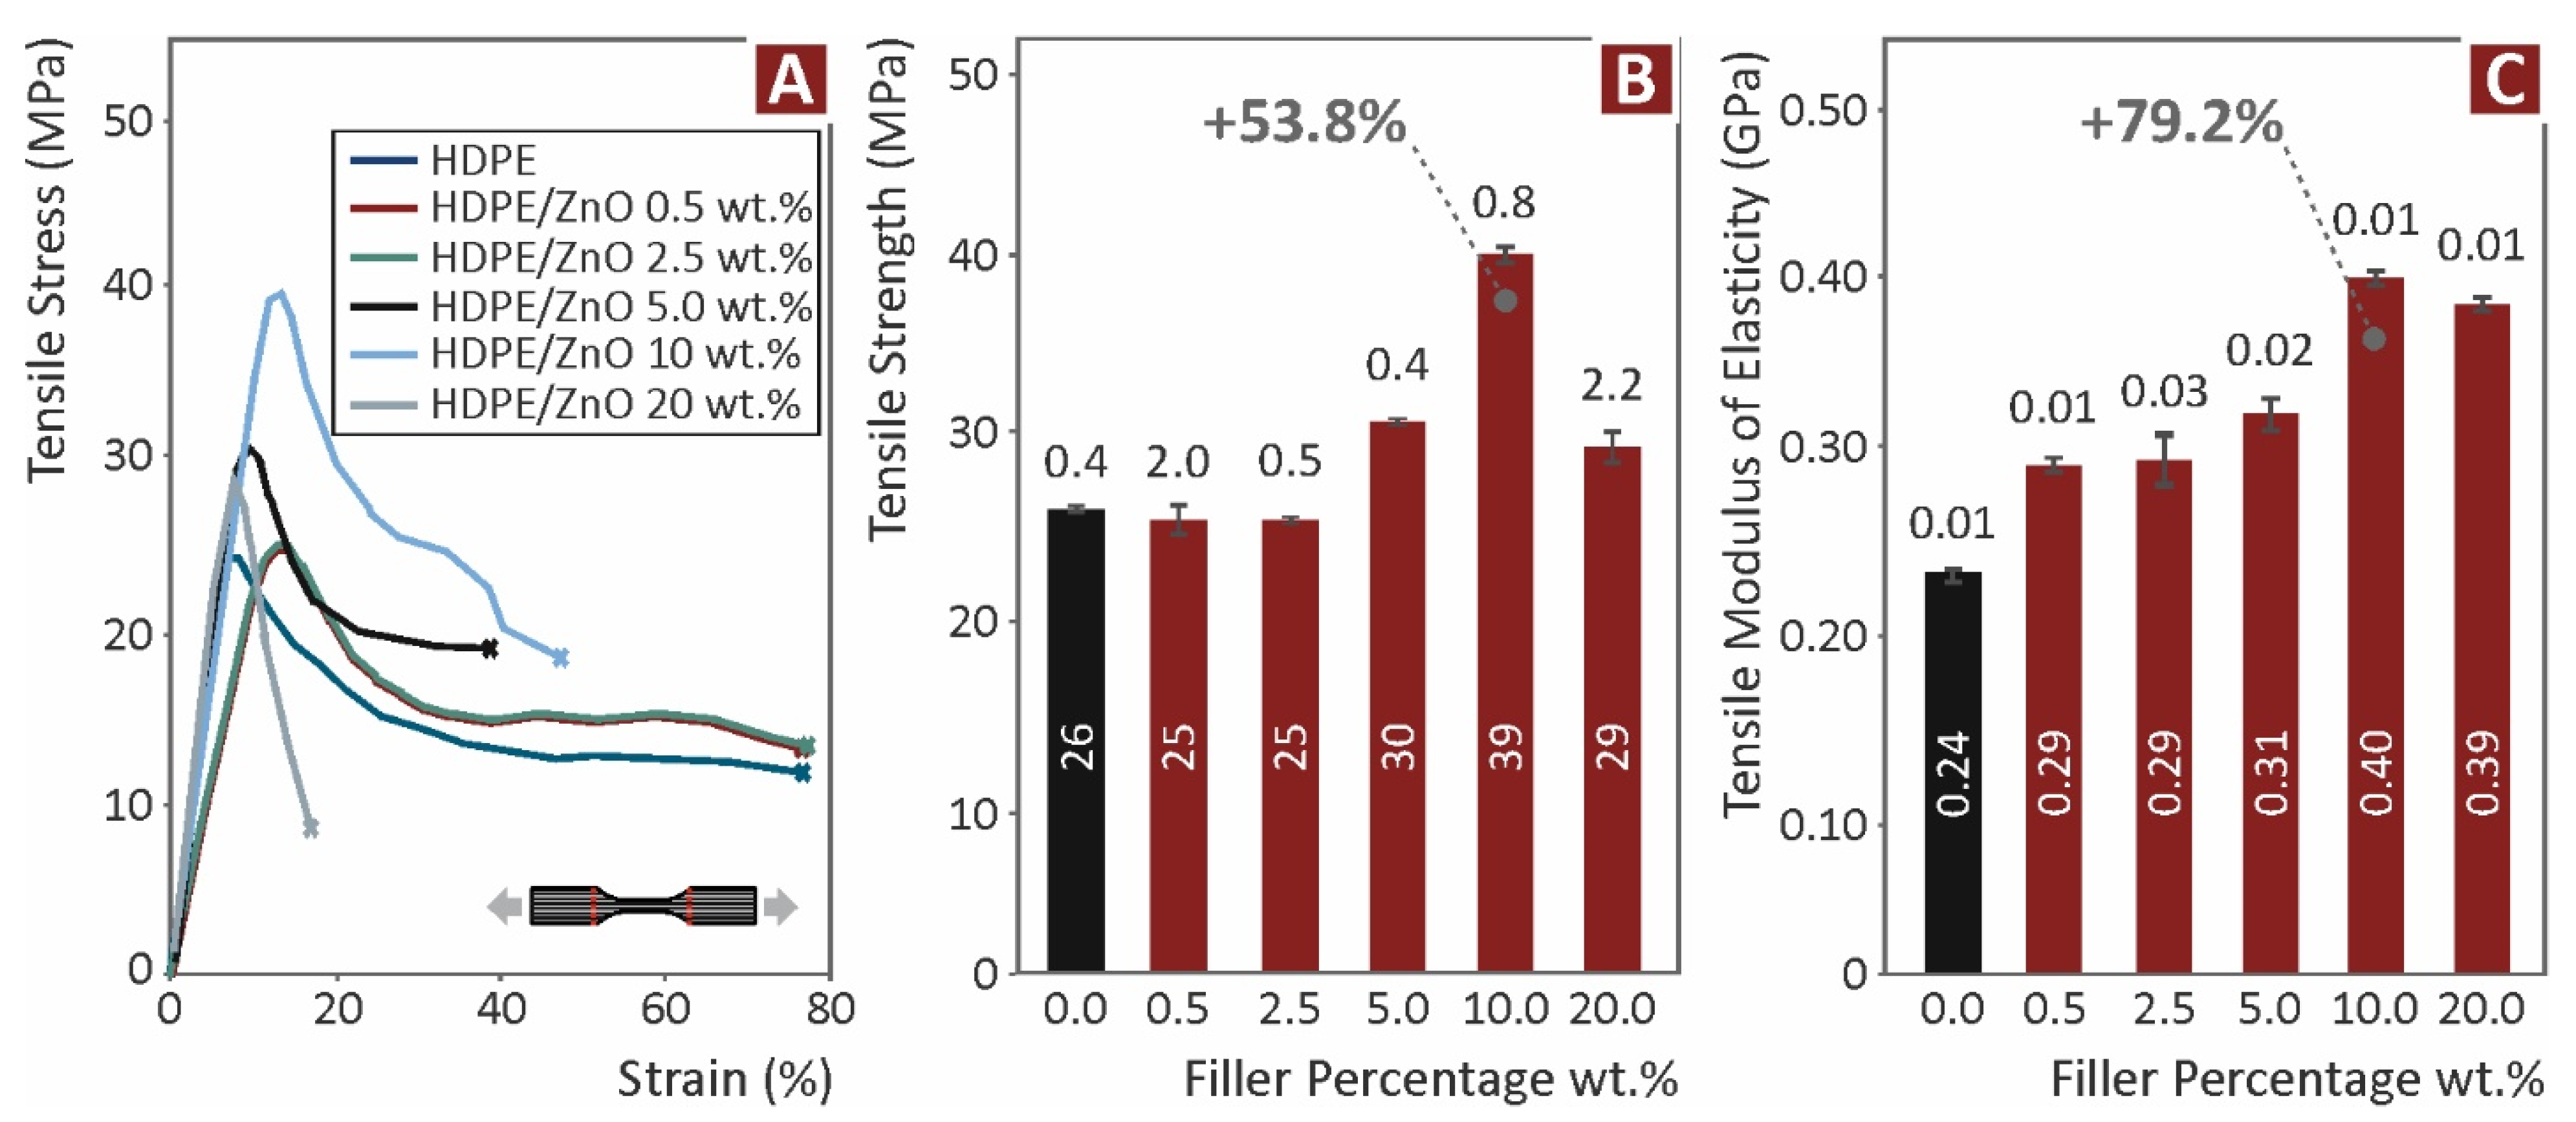
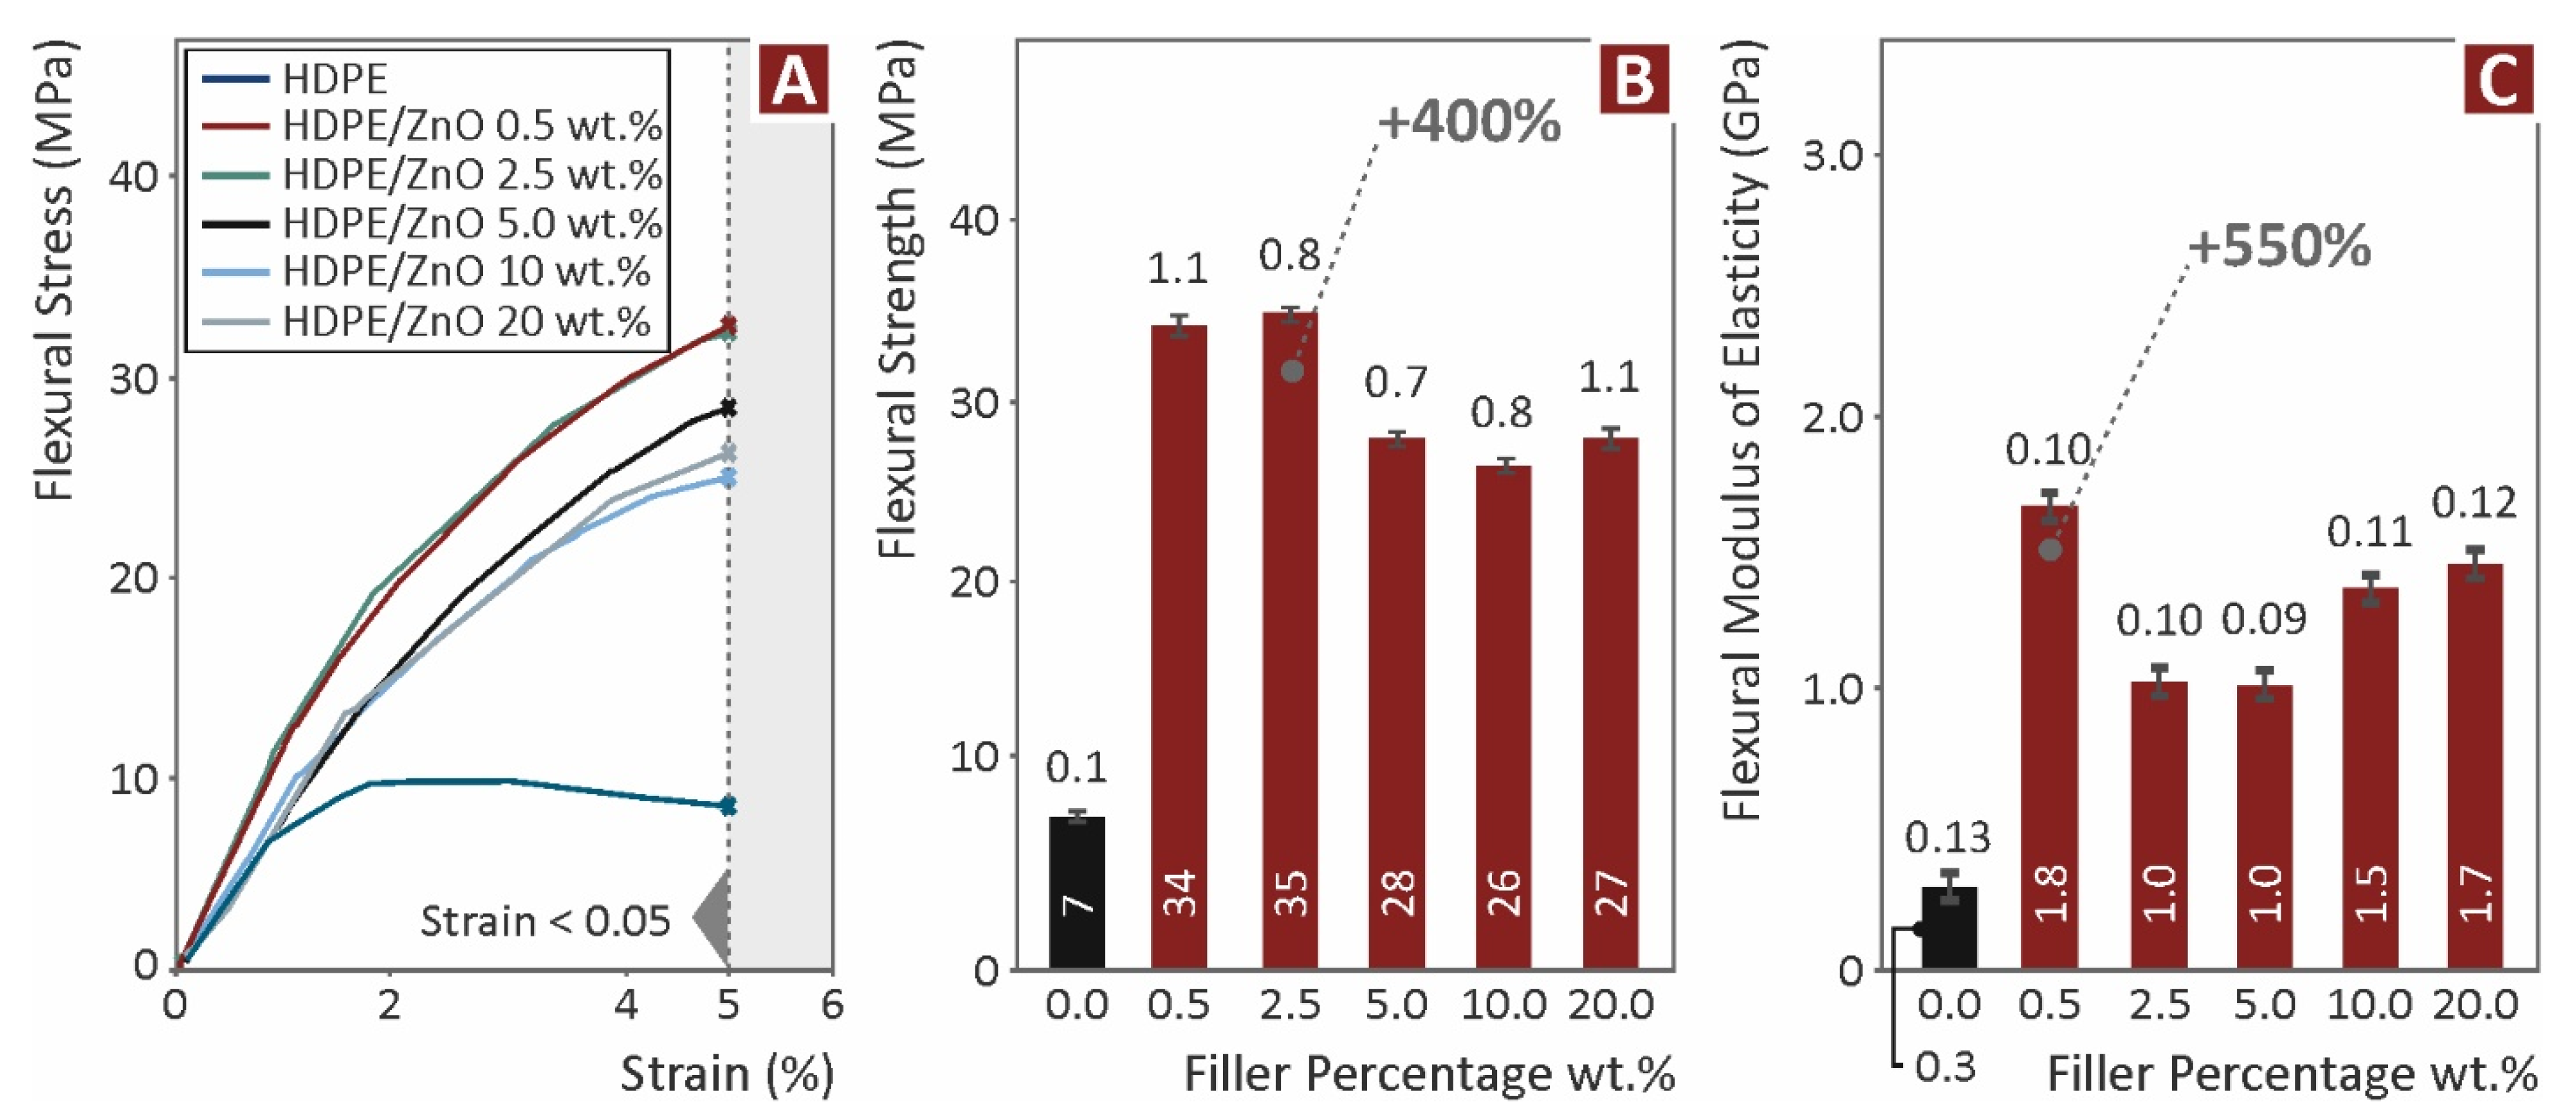
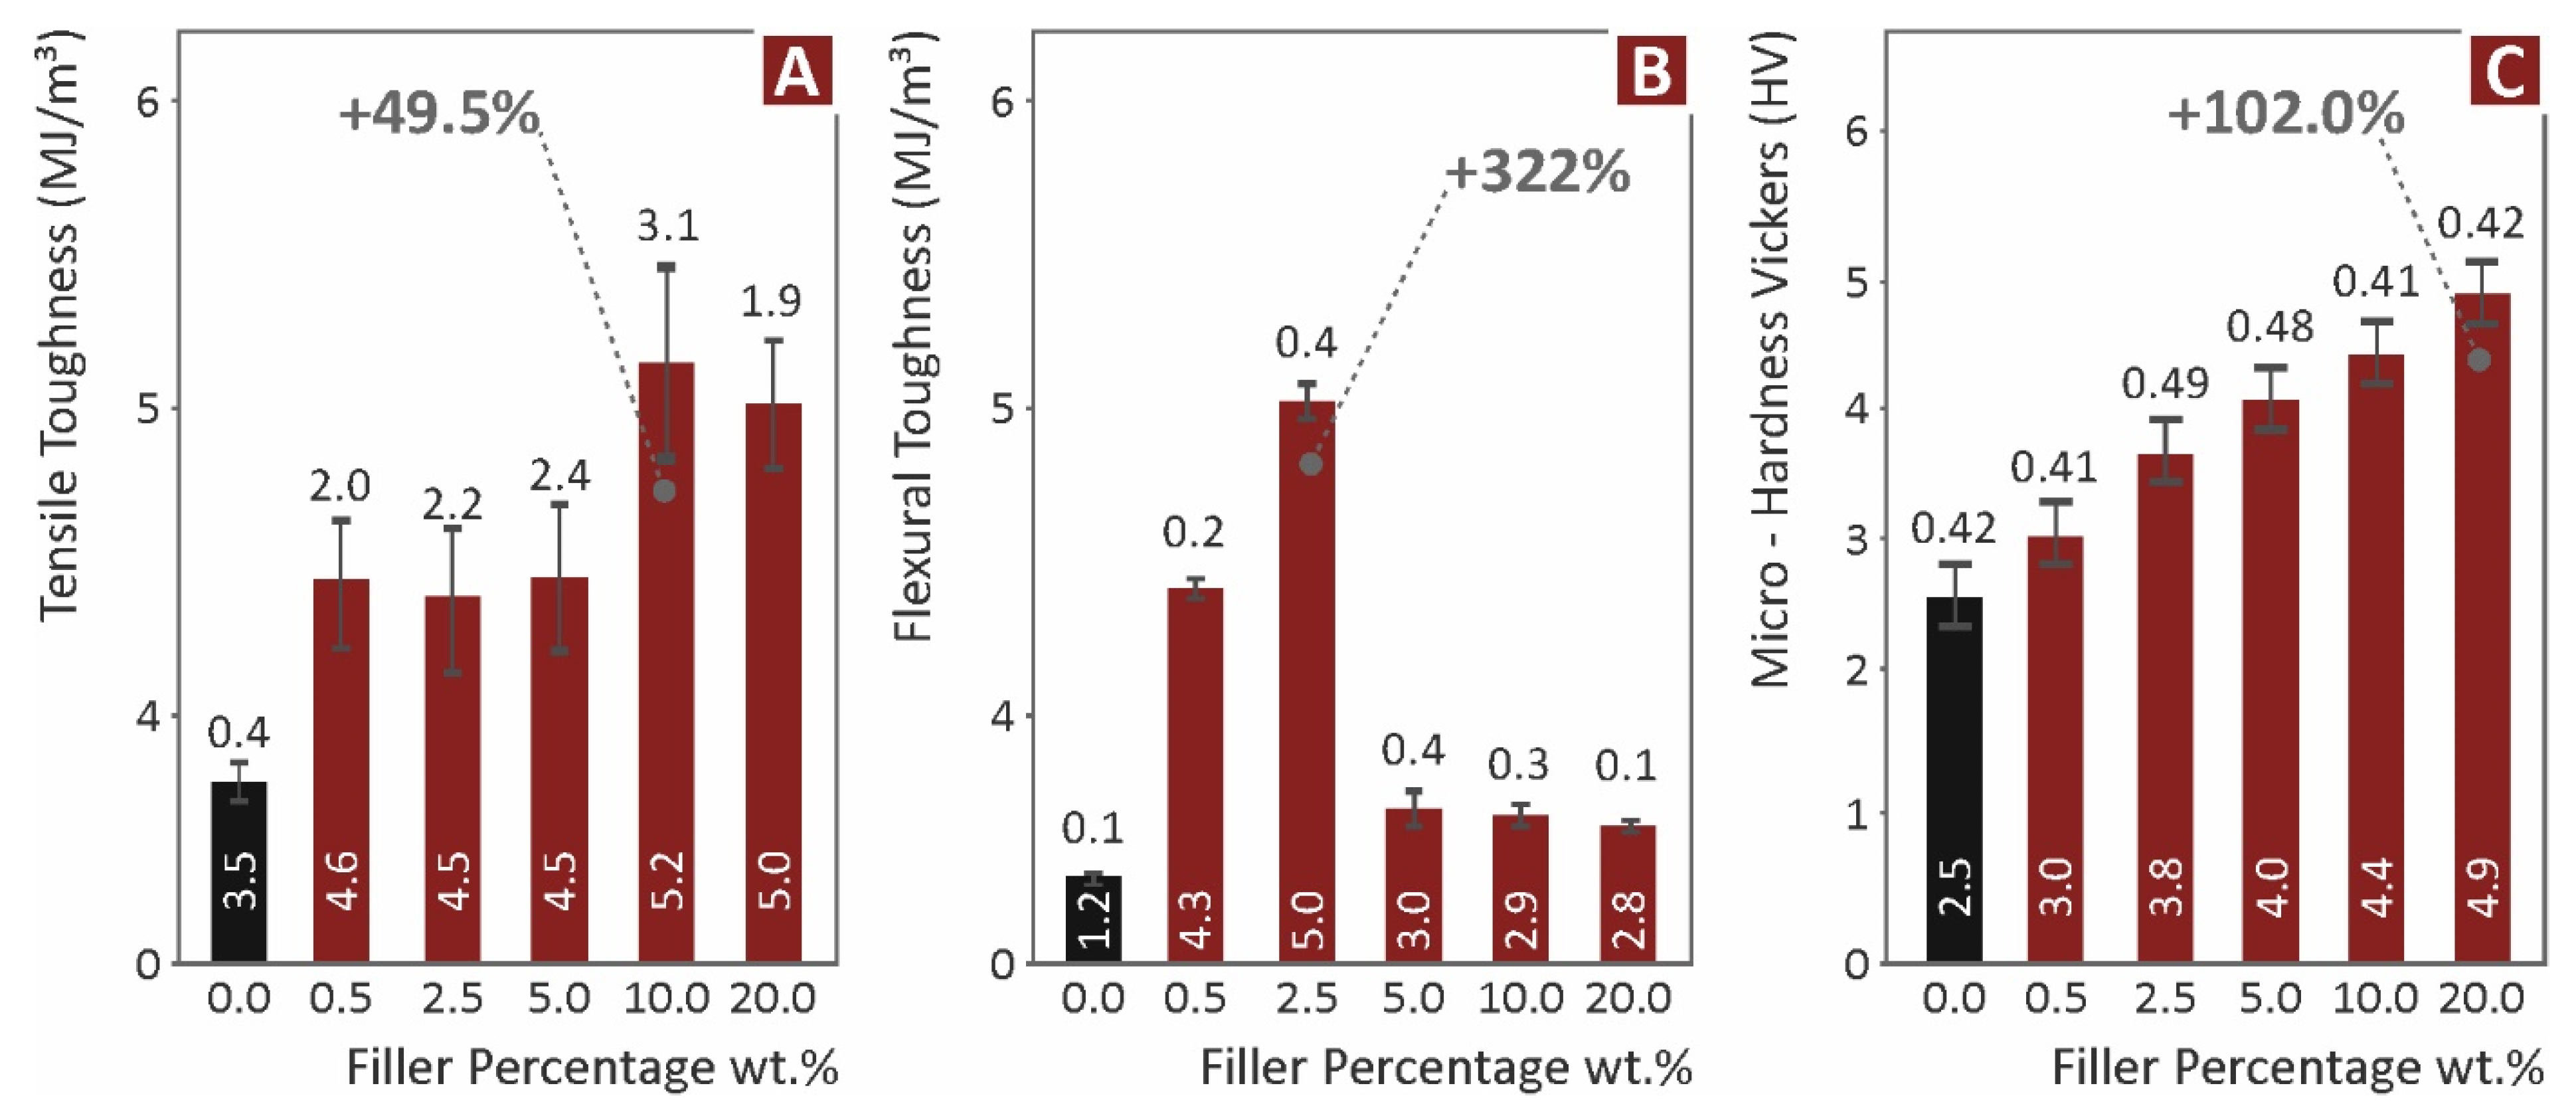
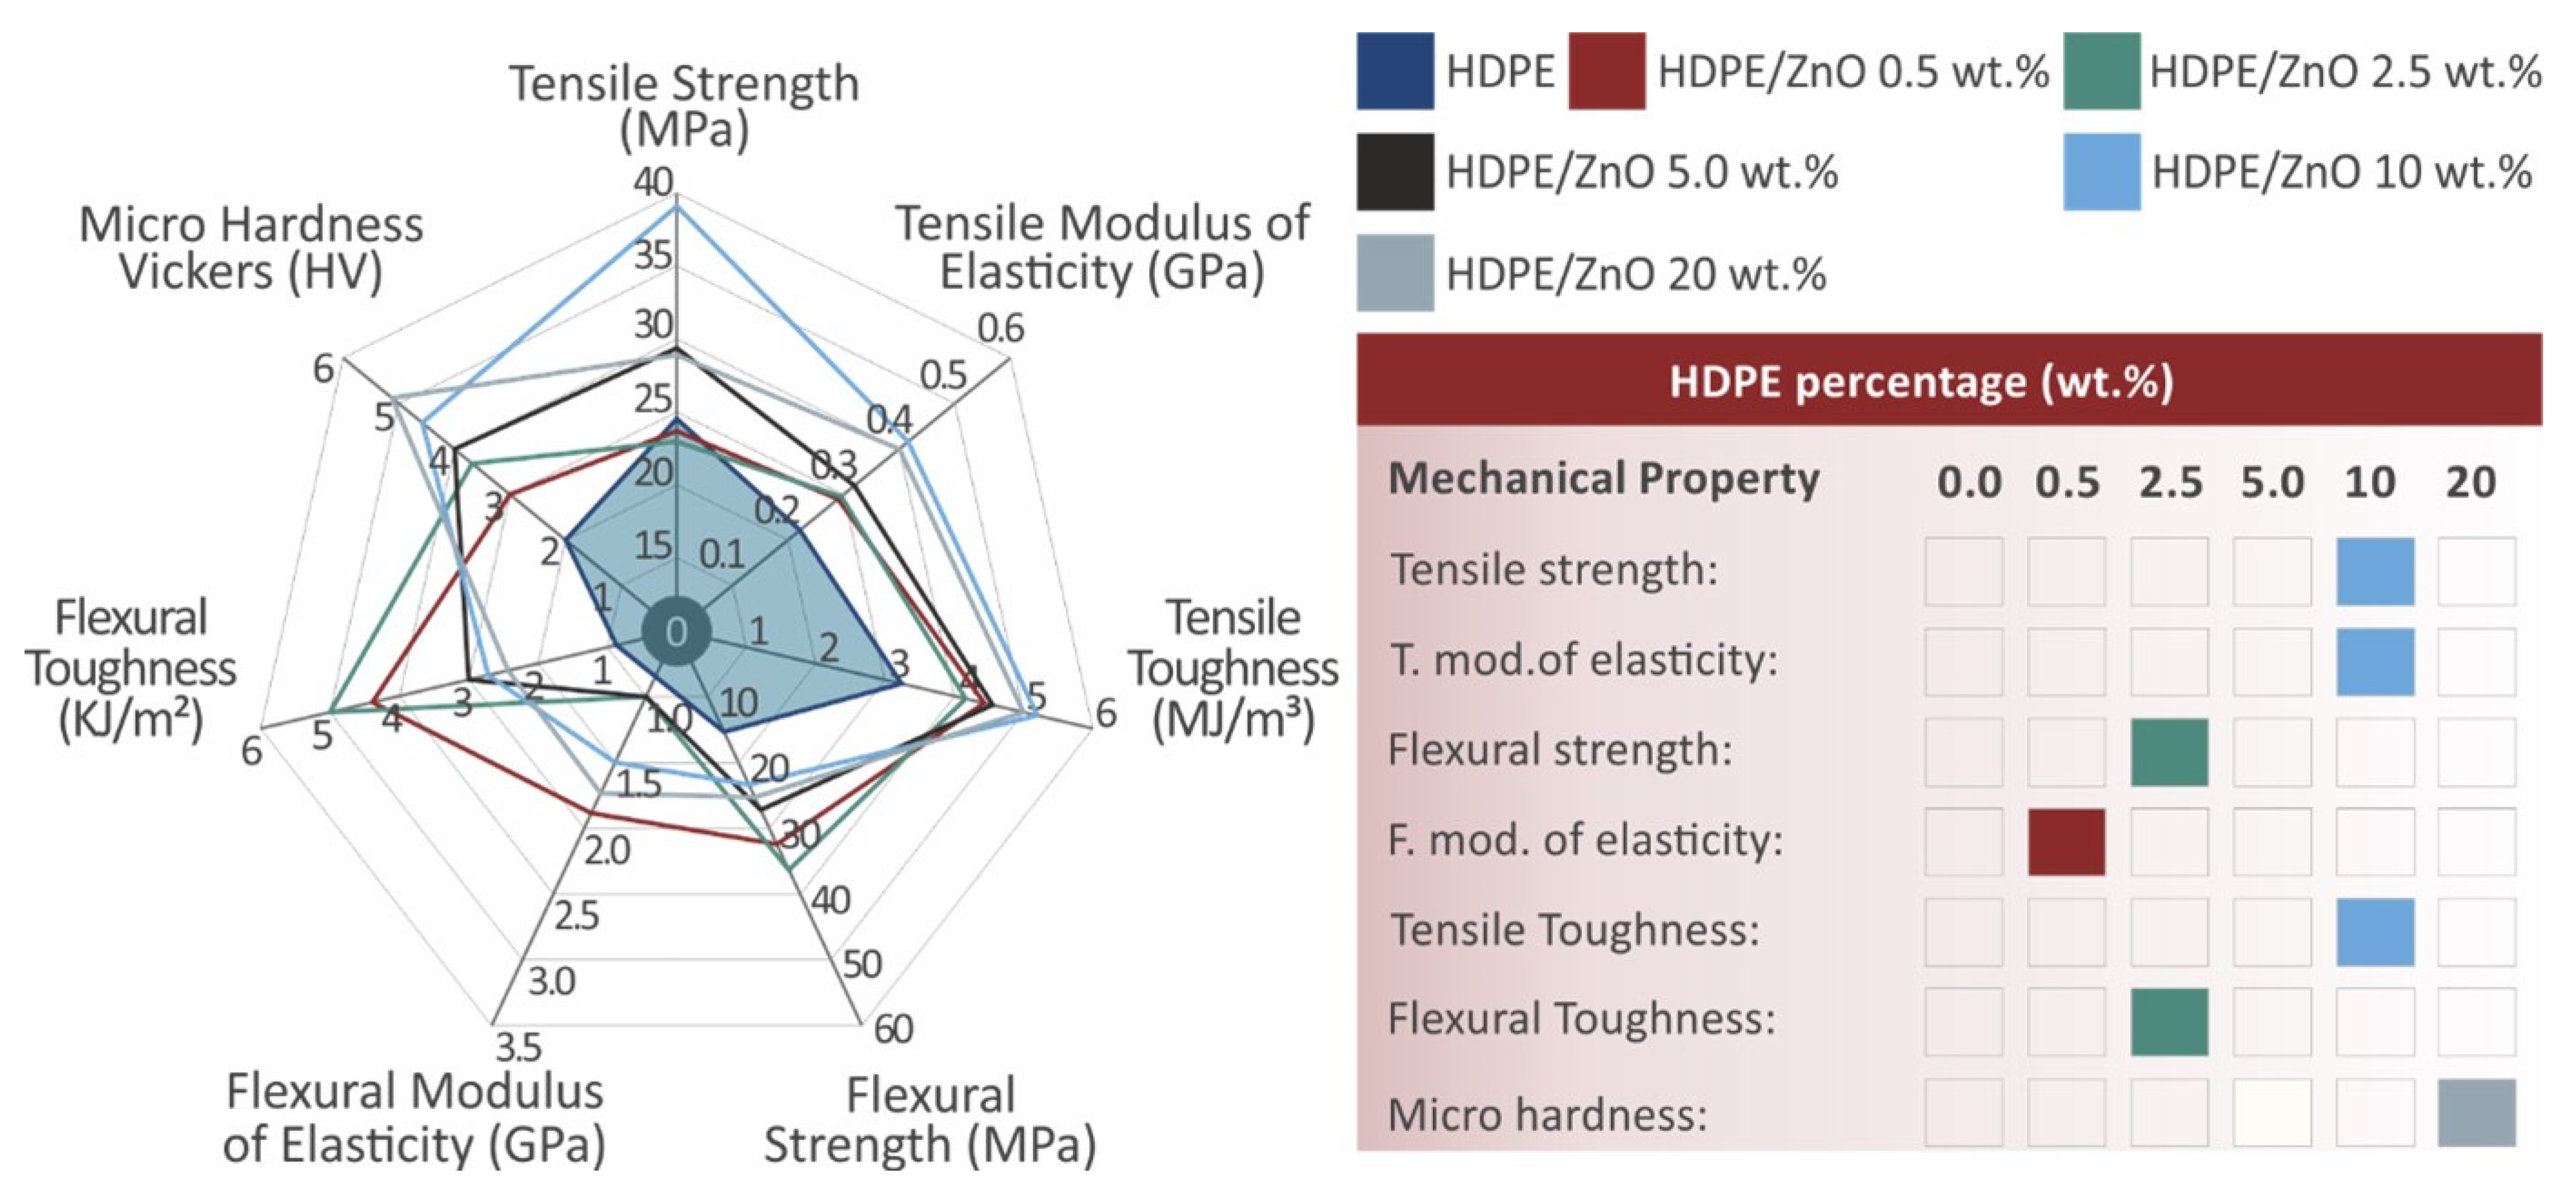
3.1. Mechanical Characterization of the 3D-Printed Samples

In Figure 2 and Figure 3, stress vs strain graphs of a tensile (Figure 2A) and a flexural (Figure 3A) test of a randomly selected specimen are depicted. All the graphs with bars in Figure 2, Figure 3 and Figure 4 are average values; therefore, the deviation bars are also presented in the graphs. Moreover, the mathematical average has been calculated from the experimental results acquired during the testing of the specimens.
As is presented in Figure 2, the tensile strength has increased by a maximum of 53.8% in 10.0 wt.% ZnO additive loading when correlated to the corresponding results for the unfilled HDPE thermoplastic. The tensile modulus of elasticity was also increased by 79.2% with a 10.0 wt.% ZnO addition. In terms of tensile modulus, there is a visible trend in all the investigated cases that the tensile modulus increases with filler content until the filler concentration reaches 20%. There is no literature on 3D-printed HDPE composites that correlates with these mechanical property results. Only HDPE with TiO2 filler has been studied, but mainly with injection-molded samples [50,52]. Moreover, no discoveries on mechanical properties are included in these study papers. In the only work that studies HDPE with TiO2 filler for MEX 3D printing [51], a similar trend in the results is reported, although the enhancement in the current study with the addition of ZnO is higher.
As it is presented in Figure 3, there is an increase in the flexural strength of a maximum of 400% in the composite with 2.5 wt.% ZnO loading when correlating the results to the pure HDPE thermoplastic. Moreover, the modulus of elasticity was increased by 550% with a 0.5 wt.% ZnO addition. In all the cases examined, there is a clearly discernible trend where the flexural modulus of elasticity slightly falls along with the filler percentage until the filler concentration reaches 20%. There is no research available yet in the literature on HDPE 3D-printed composites to support these experimental results regarding the mechanical response of the composites. Only HDPE with TiO2 as a filler has been studied, but mainly on samples prepared with injection-molding processes [50,52]. Moreover, in these studies, no mechanical performance findings are reported. Correlating the flexural test results with the only work that studies HDPE with TiO2 filler for MEX 3D printing [51], a similar trend in the results is reported, although again the enhancement in the current study with the addition of ZnO is higher. Figure 4 below depicts the comparison of all materials studied in this work for (a) tensile toughness, (b) flexural toughness, and (c) microhardness Vickers results.
From the results presented in Figure 4 above, it is evident that the tensile toughness reaches a peak increase of 49.5% at 10 wt.% filler loading when compared to unfilled HDPE material. About a 322% increase is noted at 2.5 wt.% while examining flexural toughness results. The micro-hardness Vickers results show a trend that the hardness increases along with the filler loading, reaching a maximum peak of 102% increase with the introduction of 20 wt.% filler concentration when compared to unfilled HDPE 3D-printed specimens. Similar findings for HDPE with micro-additives and micro-hardness Vickers measurements have been reported in the literature [62].

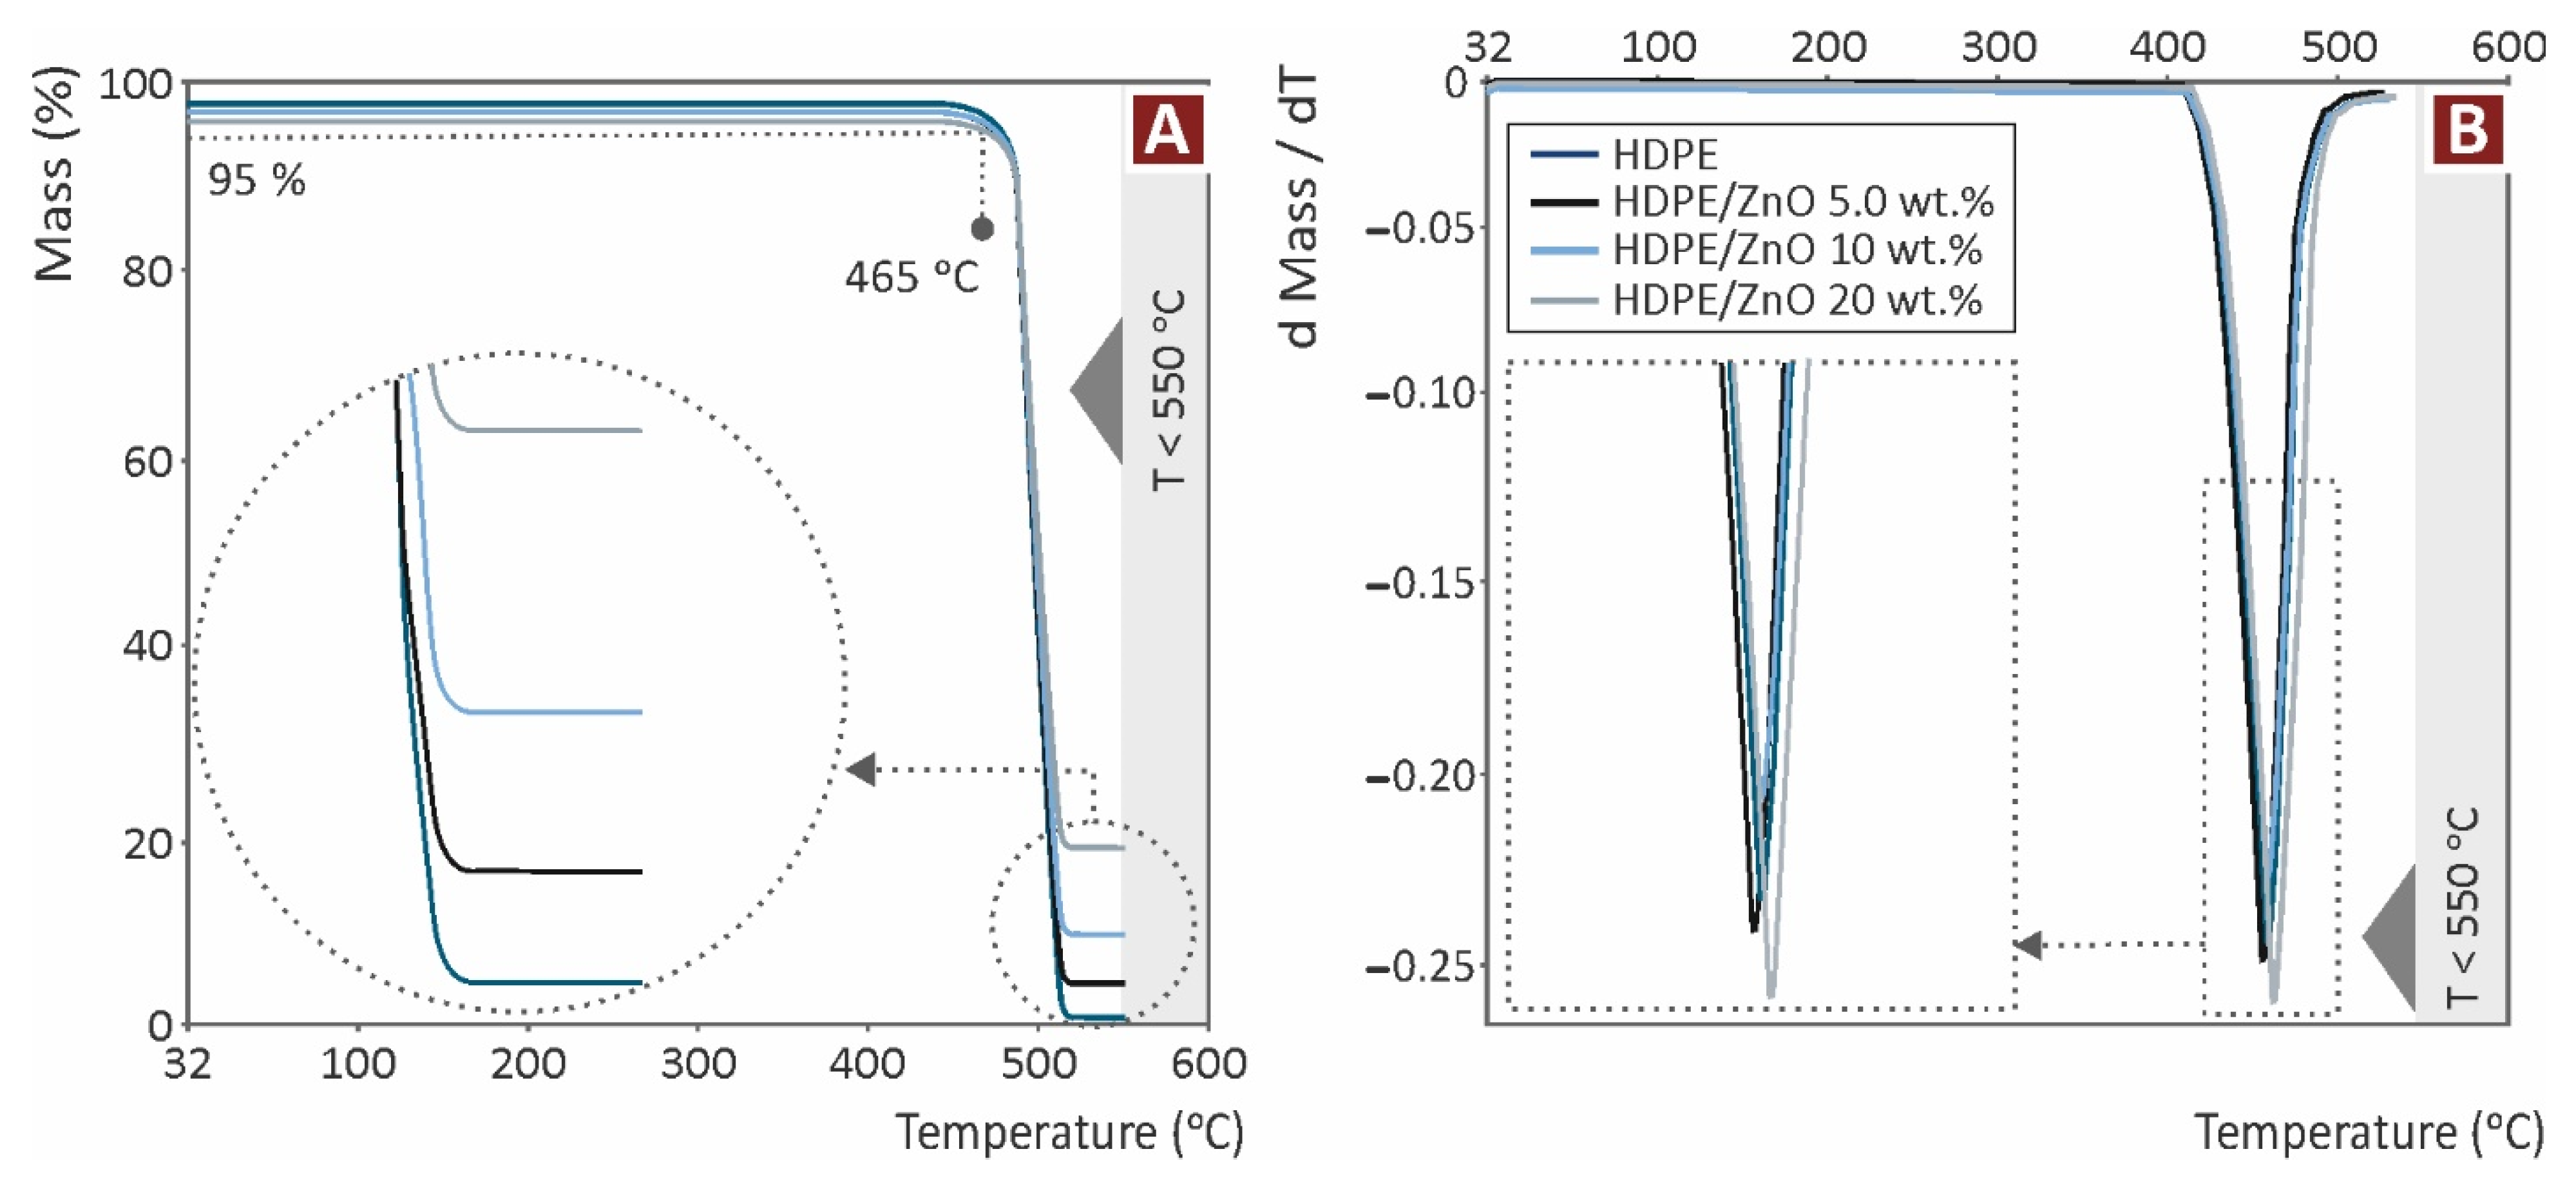
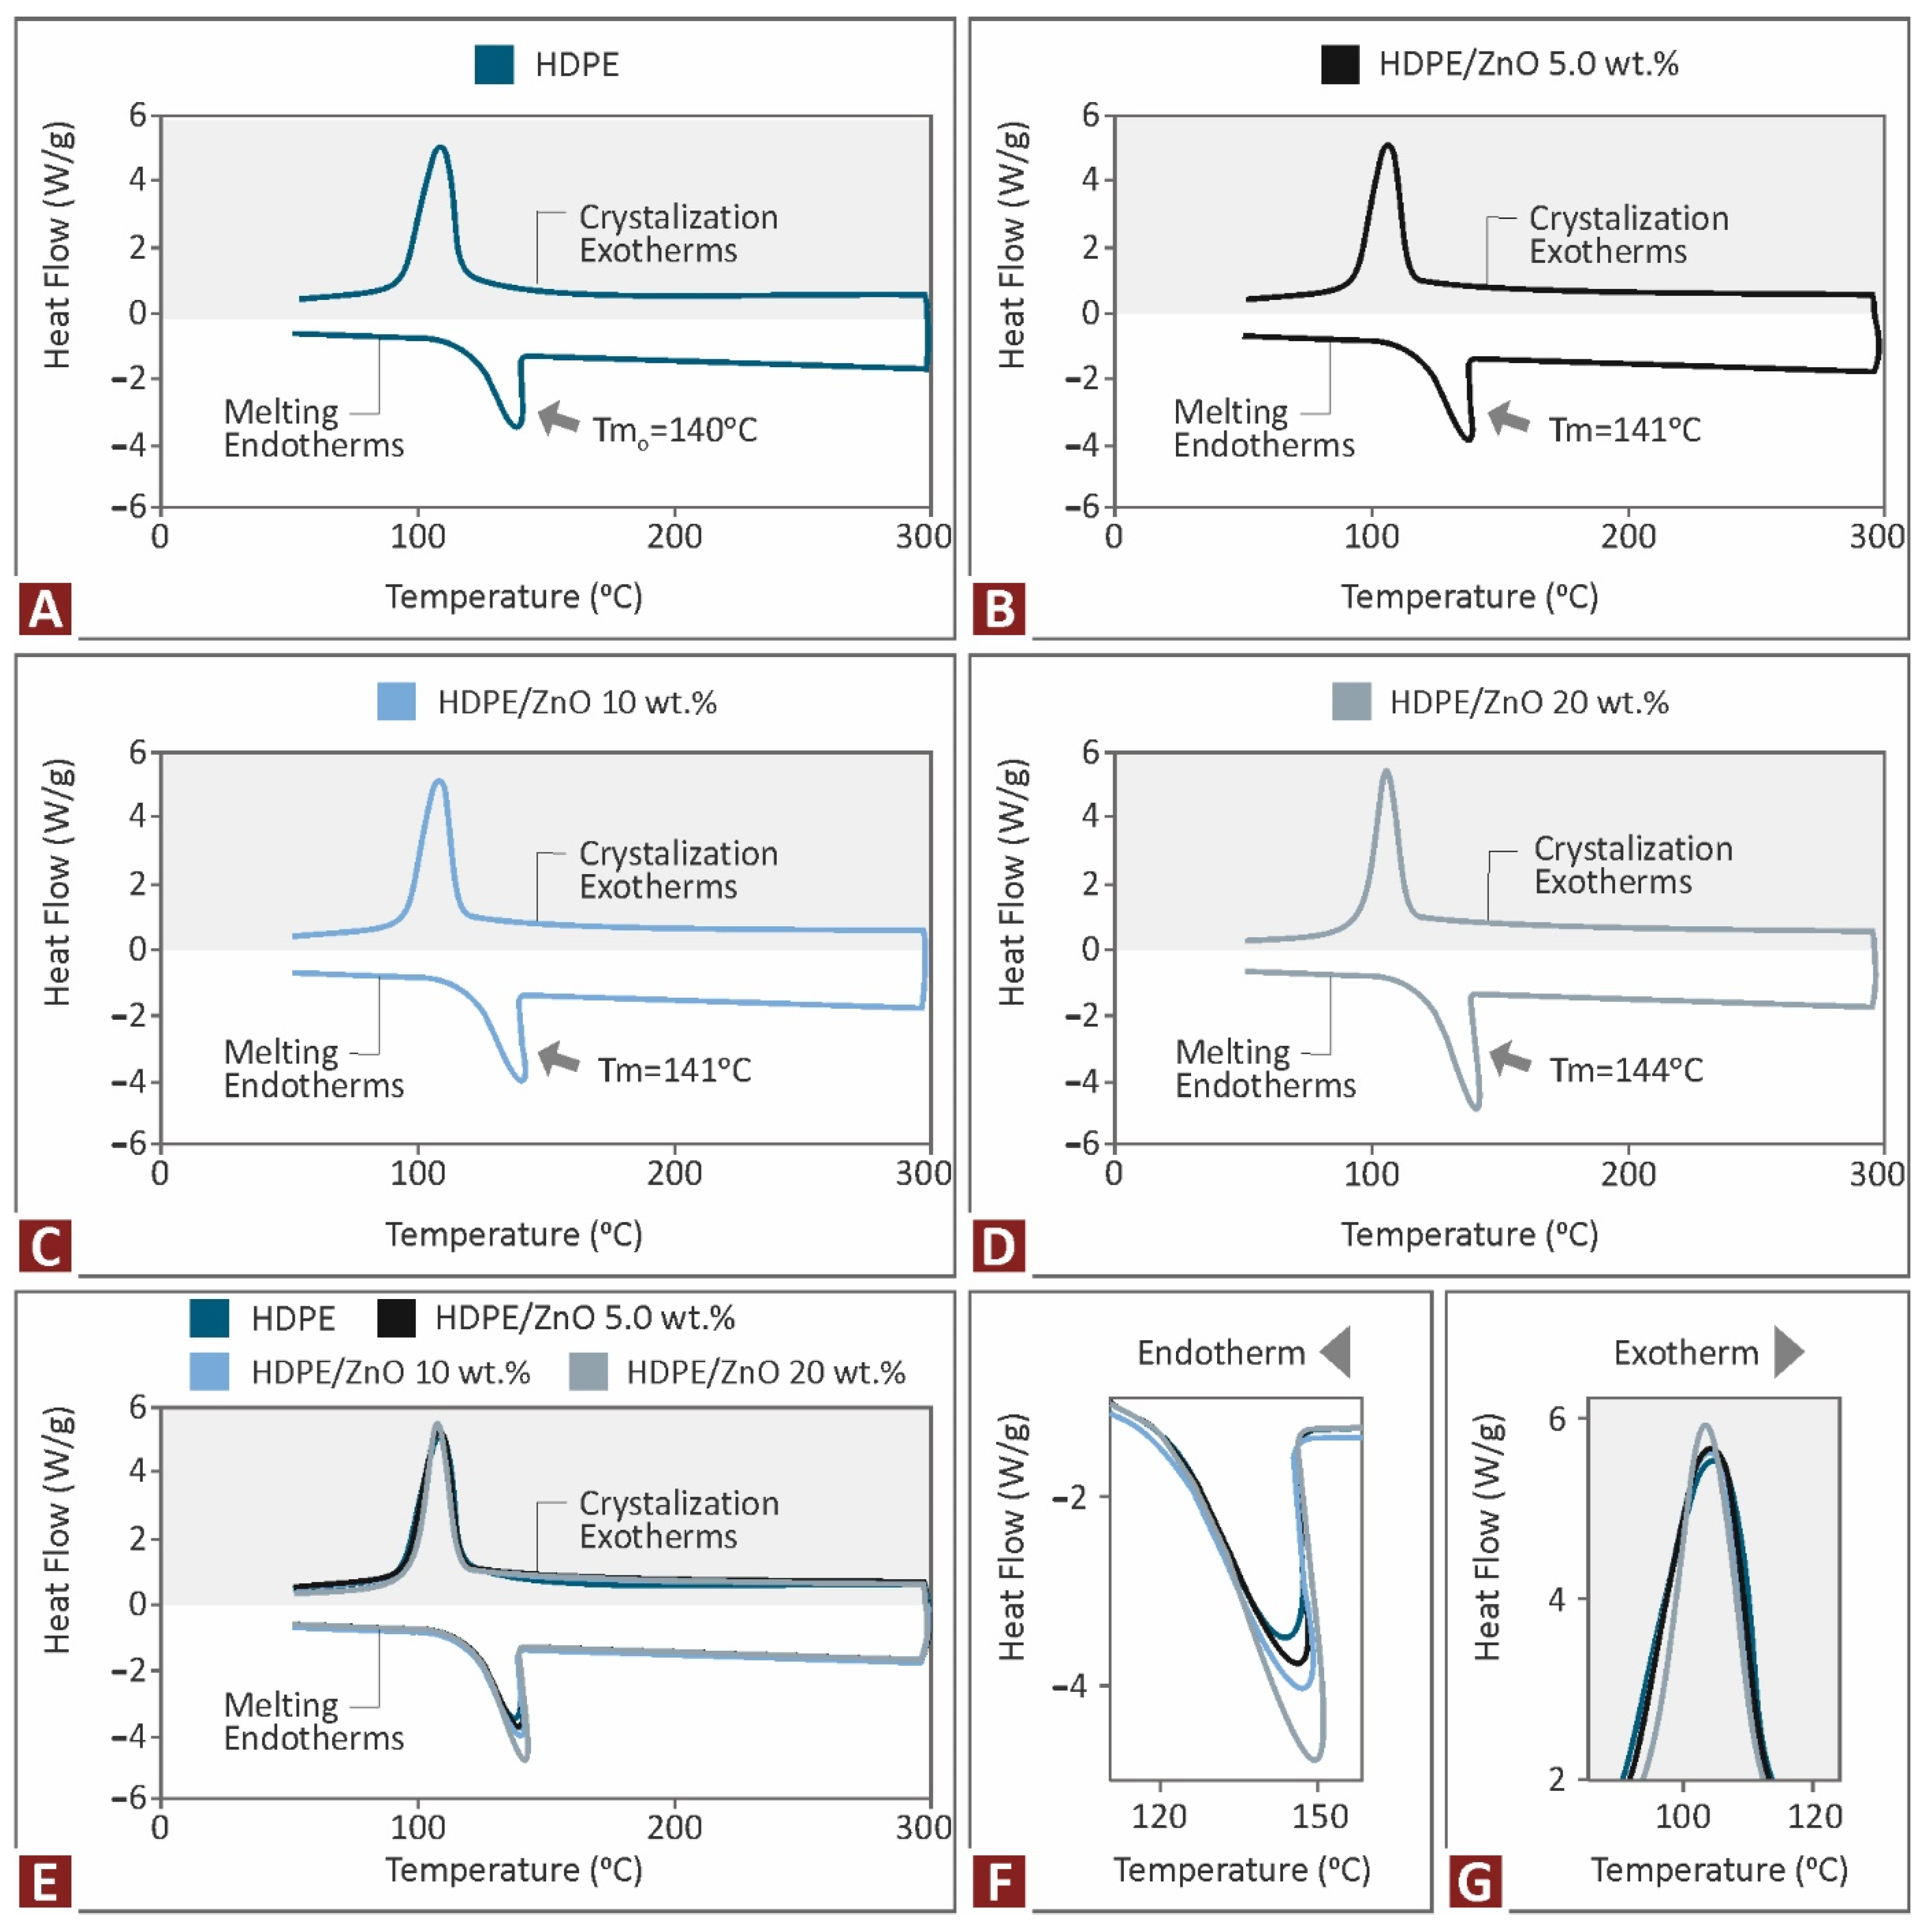
3.2. Thermal Properties Investigation

The complete TGA data for the pure HDPE is shown in Figure 5 below and the HDPE/ZnO composites with 0, 5, 10, and 20 wt.% developed in the work. Additionally, Figure 5B presents the corresponding weight loss rate graph.
The mass loss curves of the materials are comparable until they begin to degrade fast, as seen in Figure 5A. This shows that adding ZnO fillers to the HDPE matrix material did not influence the HDPE thermoplastic’s thermal stability. The residual material should agree with the pertinent weight percent of the additive employed in each case for the creation of the micro-composites (Figure 5A). The residual percentage of the ZnO additive is consistently lower than the applied proportion in all cases evaluated.
For instance, the remaining proportion in the case of HDPE/ZnO is 20 wt.% composite, as it was determined during the TGA to be 18.03 wt.%. Such small discrepancies can be ascribed to the precision of the apparatus, differences from the 3D printing process, or losses from the first extrusion of the filament. The maximum weight loss rate shifts slightly to higher temperatures with the increase in the ZnO additive concentration. The maximum weight loss rate is reported for the highest ZnO loading composite of 20 wt.% (Figure 5B).
According to the DSC study presented in Figure 6, the melting point (Tm) was marginally affected (raised) with the addition of the ZnO additives compared to the unfilled HDPE thermoplastic. This shift, though, is considered insignificant to produce any valid conclusions other than that the introduction of the ZnO particles in the composites did not affect the chain mobility significantly when compared to the unfilled HDPE material. In all instances of ZnO, this increase is noticeable with an increase in filler wt.%.

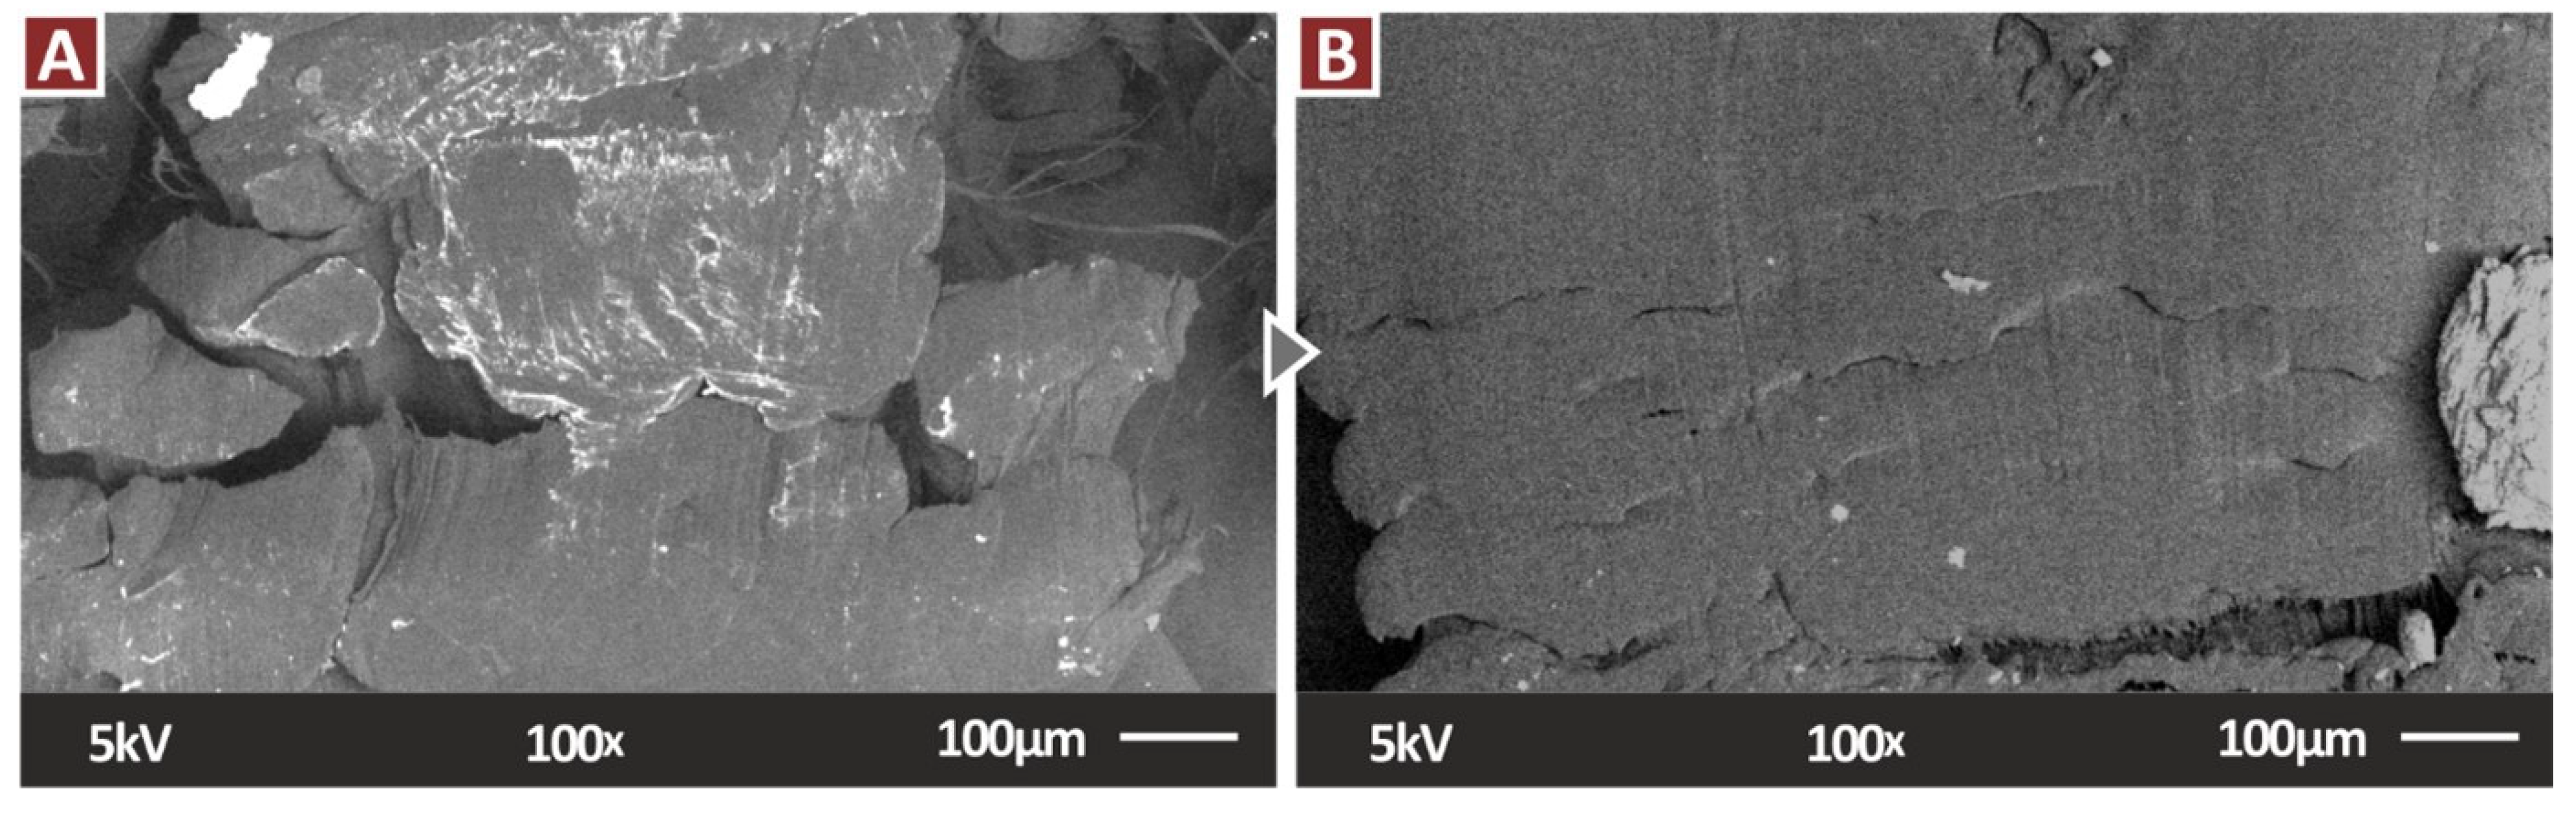
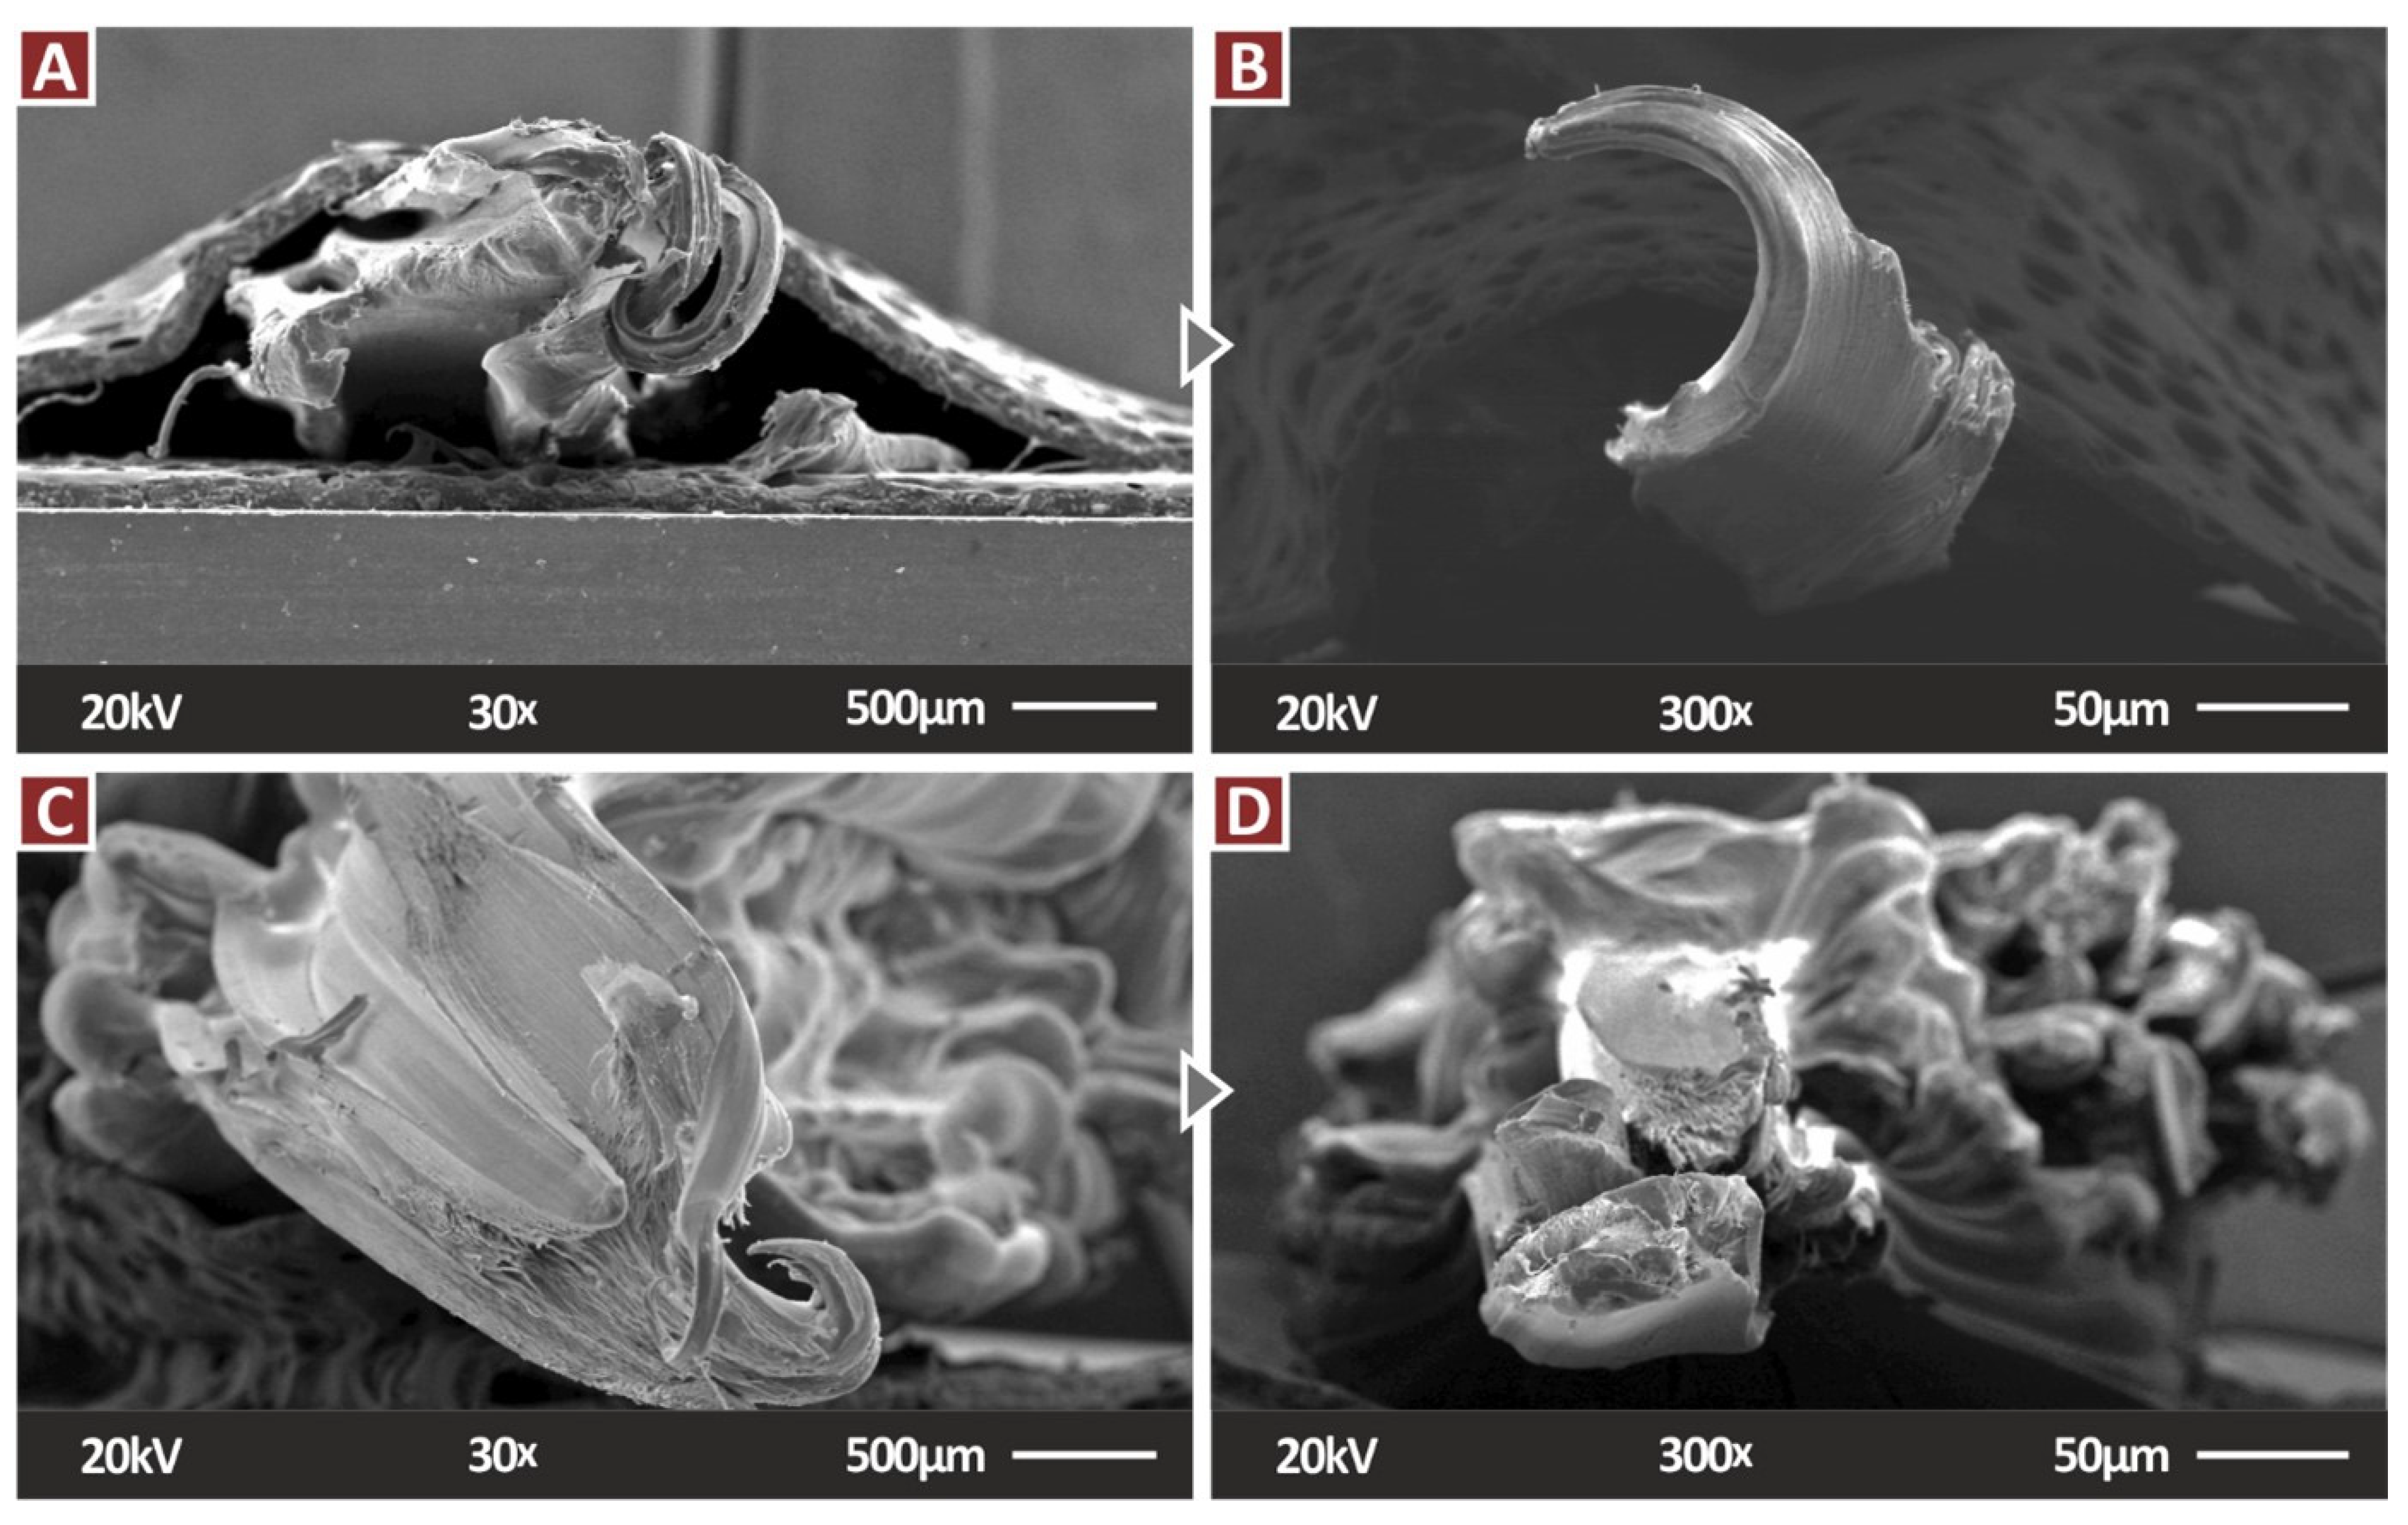
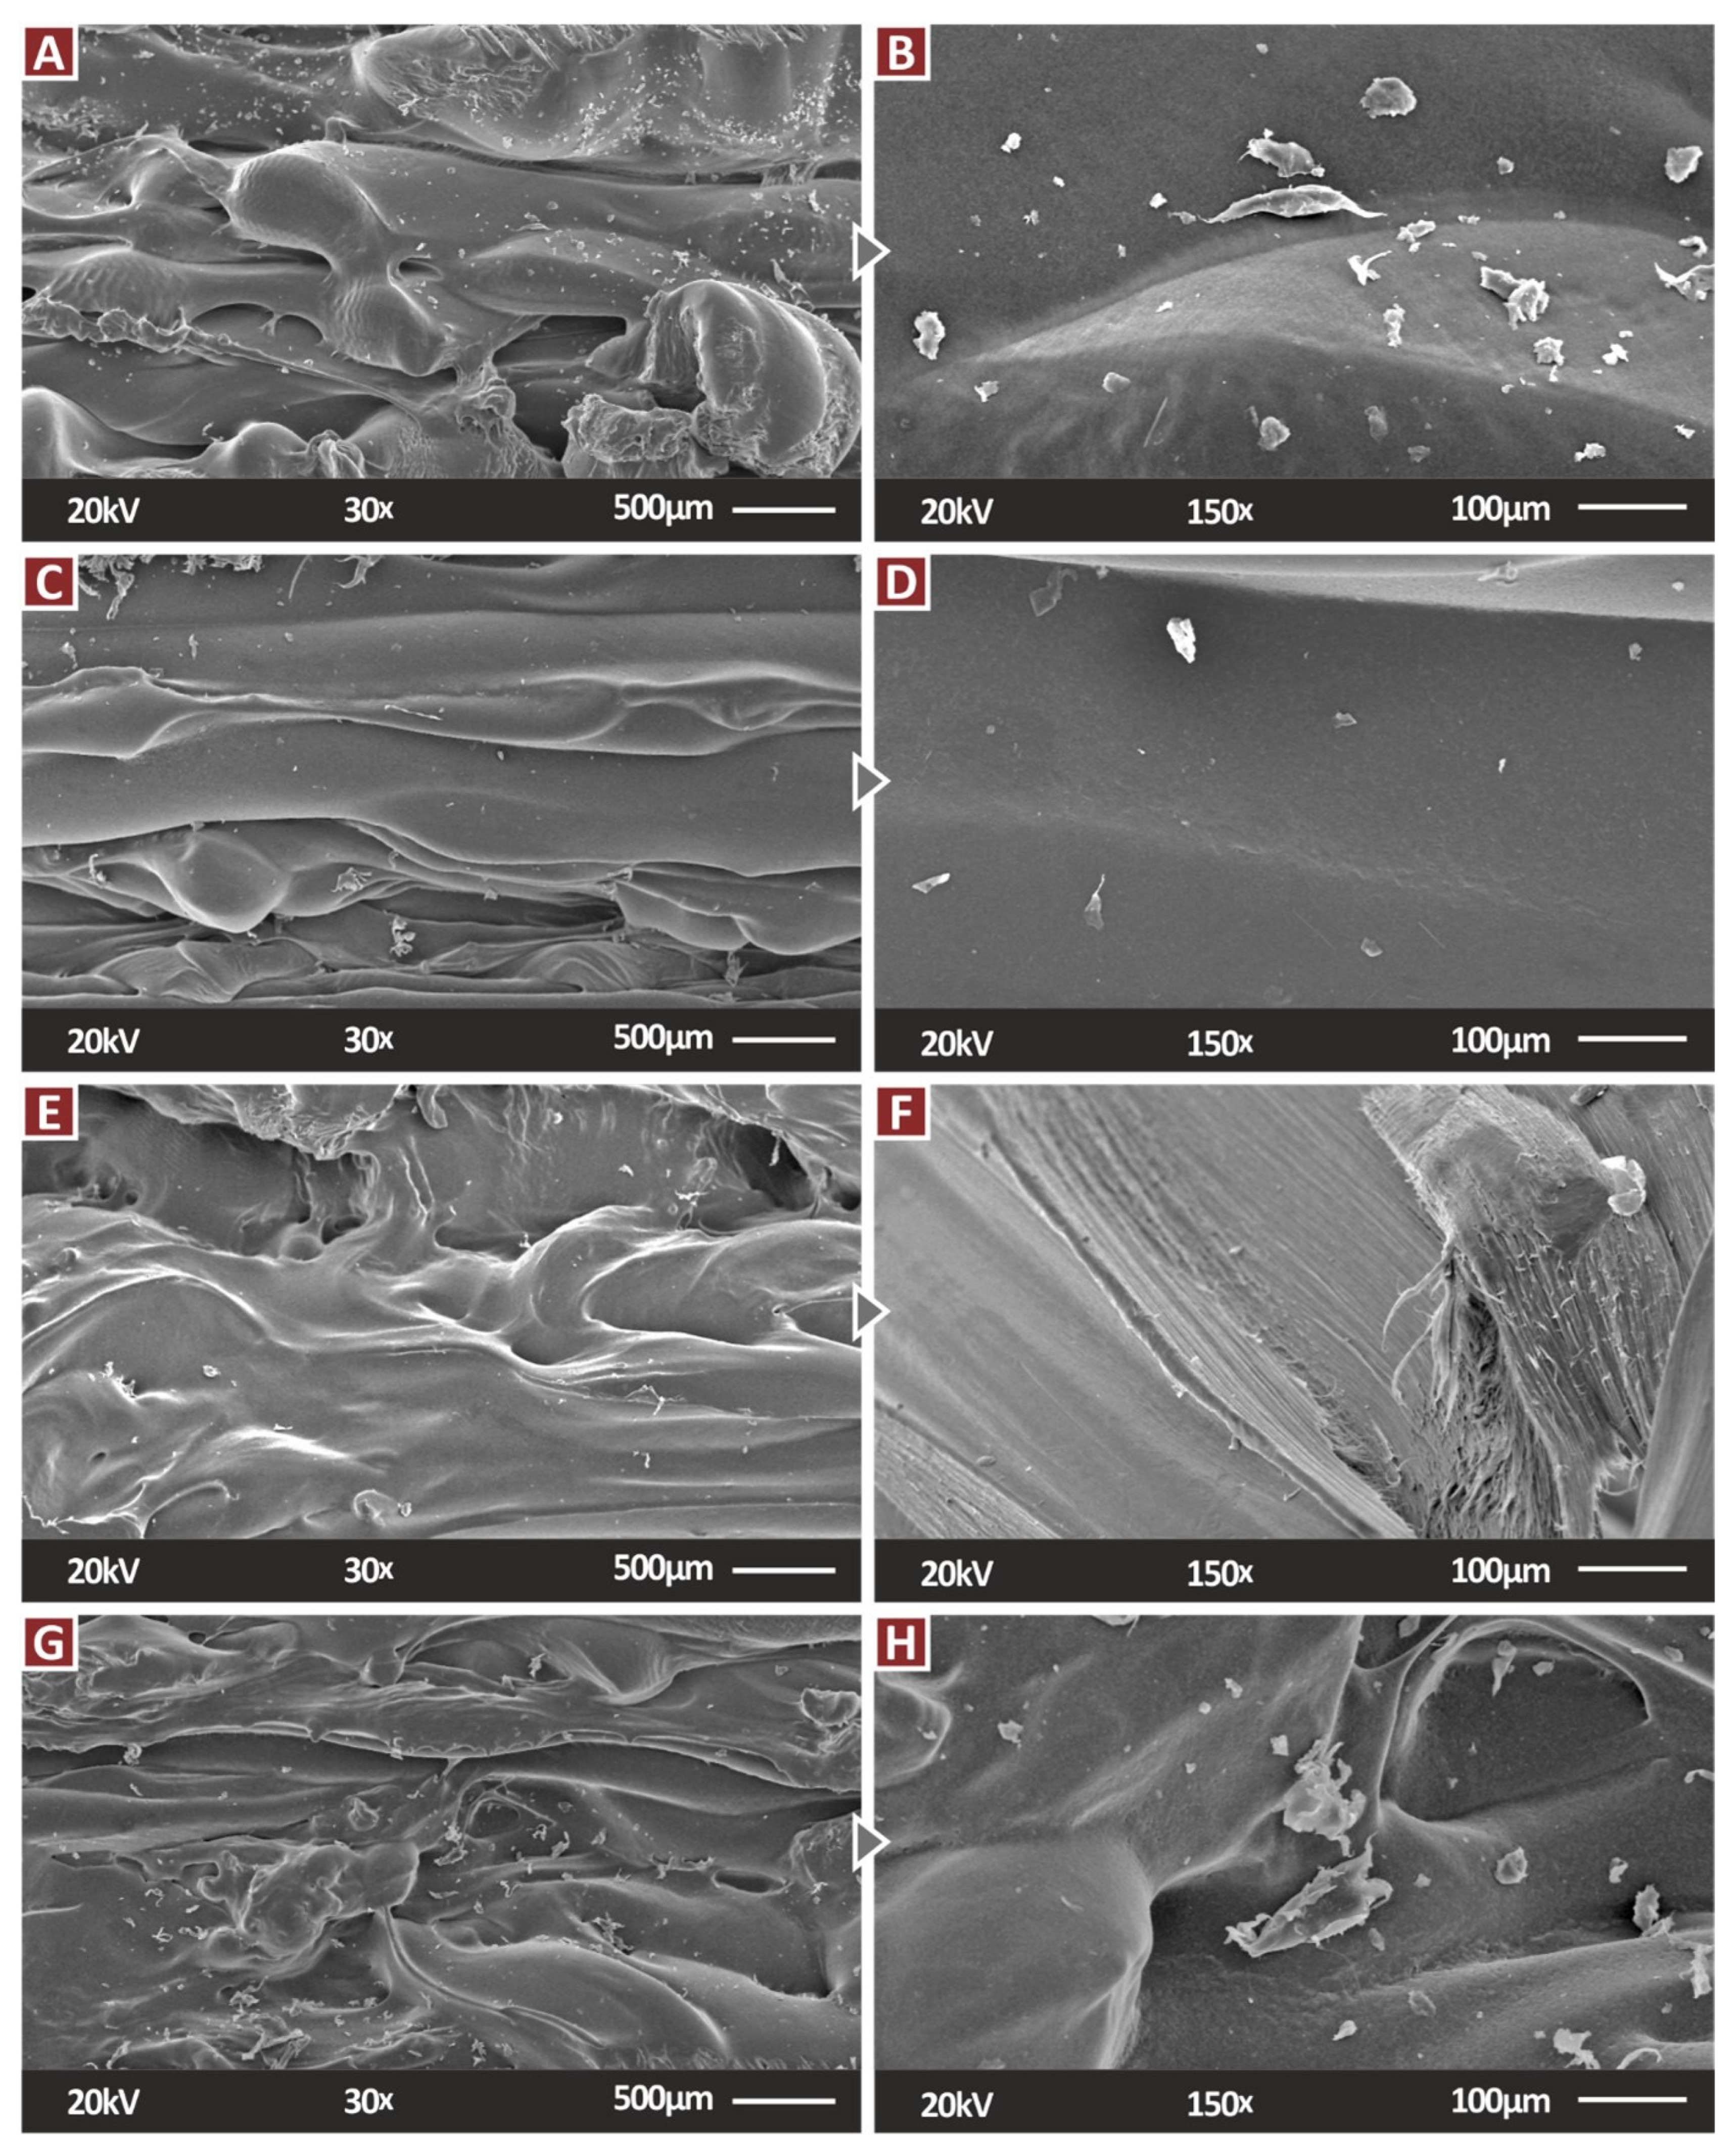
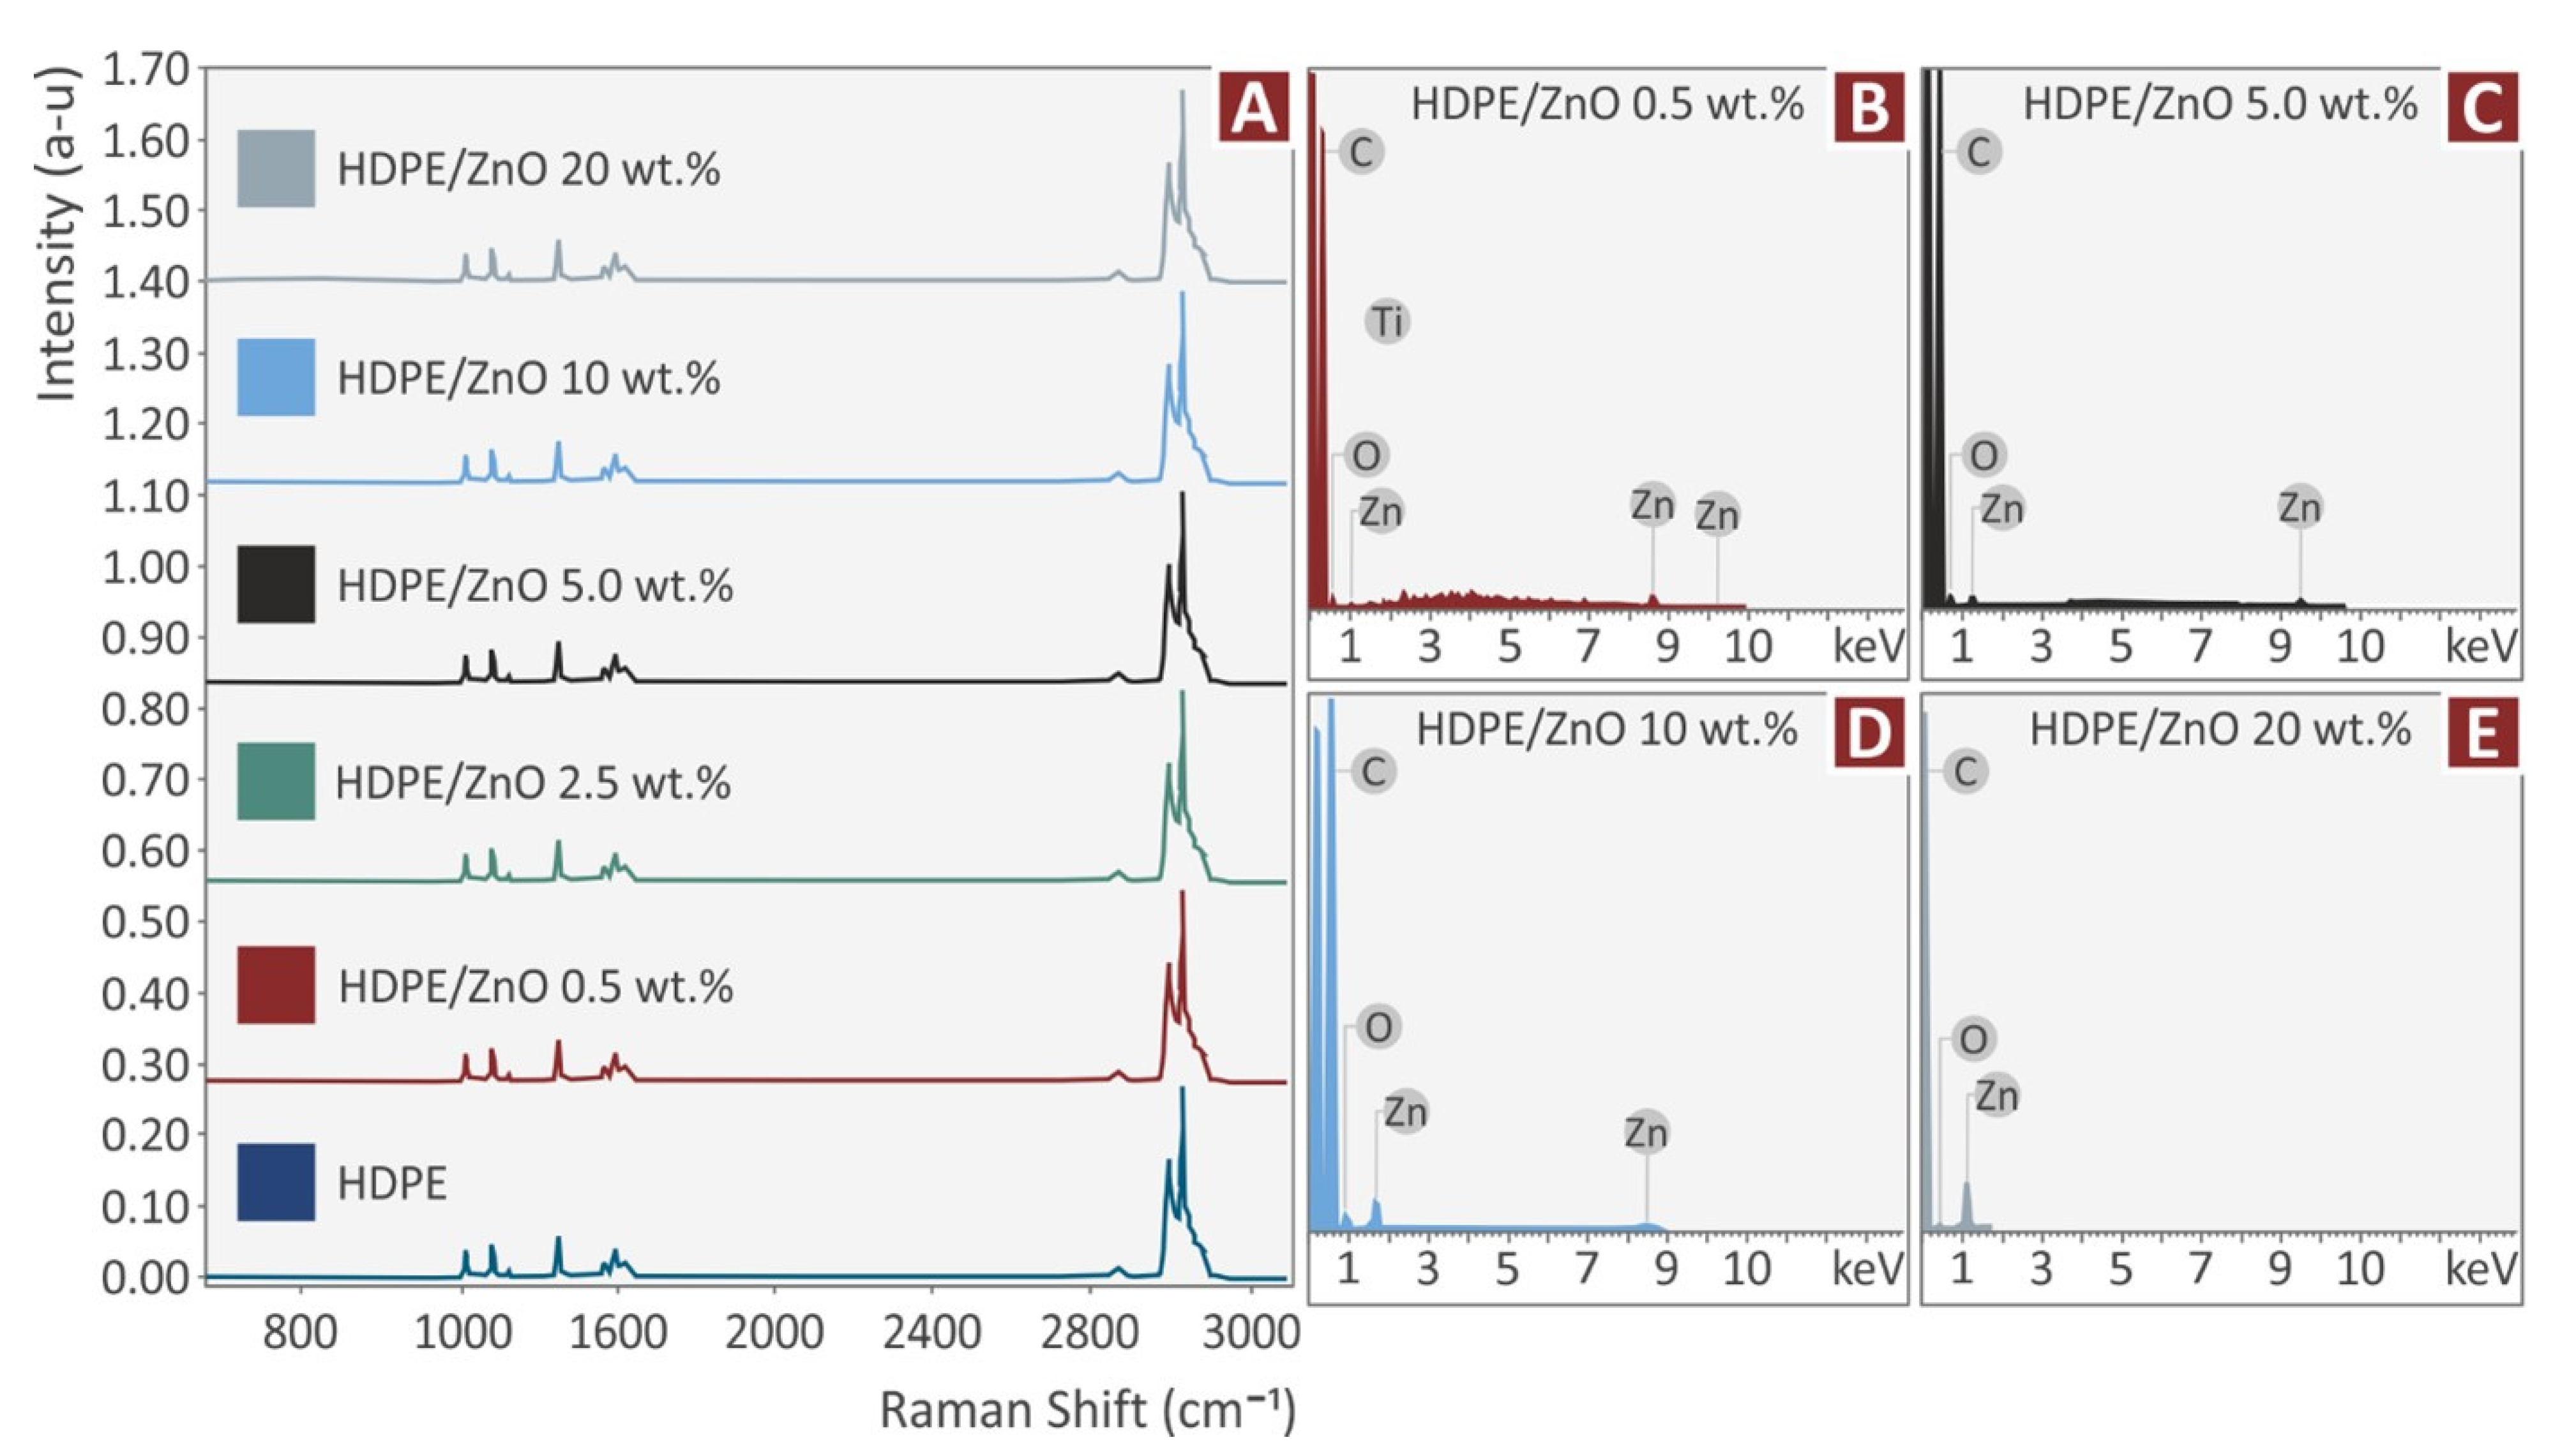
3.3. Morphological and Structural Characteristics of the Prepared Composites

Figure 7 presents different captures taken with an SEM of a tensile test sample made with unfilled HDPE. Figure 7A depicts the fracture area, while Figure 7B presents the side surface of the sample. In the fracture area image, it is shown that the sample’s 3D-printed structure collapsed with the failure of the specimen, with the development of voids due to the failure of the bonding of the strands. The fracture area does not show high deformation regions, although, overall, the sample was highly deformed before failure, which is a characteristic of the HDPE material. On the side surface, the layers can be identified, although they do not have a uniform linear shape, again due to the nature and behavior of the material in 3D printing.
Figure 8 presents high-resolution SEM images of the fracture area of randomly selected tensile test specimens, one from each filler loading studied herein, i.e., HDPE/ZnO 0.5 wt.% in Figure 8A, HDPE/ZnO 2.5 wt.% in Figure 8B, HDPE/ZnO 5.0 wt.% in Figure 8C, and HDPE/ZnO 10.0 wt.% in Figure 8D. Note that in Figure 8B, the magnification of 300× is a detailed view of Figure 8A, to examine the specimens’ fracture area more closely. Same with Figure 8C,D. It should also be noted that due to heavy structural deformation present in the samples, SEM images of the 20 wt.% ZnO composites were not possible to be acquired in a quality suitable to be presented in the figures, so they were not included as they would be confusing to interpret. As can be observed, the samples were highly deformed before their failure, and a clear ductile behavior is shown. The fracture areas have collapsed, with high deformations and significant changes in their shape and reductions in their dimensions.
Figure 9 presents high-resolution SEM side surface images of randomly selected 3D-printed tensile test specimens. One specimen was chosen and is presented from each different material studied herein. The side surface is depicted in two magnifications in each specimen, i.e., 30× and 150×. HDPE/ZnO 0.5 wt.% in Figure 9A,B; HDPE/ZnO 2.5 wt.% in Figure 9C,D; HDPE/ZnO 5.0 wt.% in Figure 9E,F; and HDPE/ZnO 10.0 wt.% in Figure 9G,H.
As the filler concentration increases, the fracture mechanism of the samples, as it is observed in the SEM images, becomes less ductile. The neck, due to the deformation of the 3D printing strands, is gradually reduced until it disappears, according to the interpretation of the aforementioned SEM images from Figure 7 and Figure 8. This is because the filler reduces chain mobility by occupying empty spaces within the polymer chain. Tensile and flexural strength measurements support the claims made above since chain mobility in the polymers is correlated to the mechanical behavior of the polymers [63]. This statement is consistent with the DSC results that reported a slight shift in Tm.
Regarding layer fusion, the SEM images in the right column of Figure 7 and Figure 9 show slight variations in layer fusion in the 3D-printed samples. Notably, for the 0.5 wt.% and 2.5 wt.% samples, a more uniform layer fusion appears with no visible defects, as shown in the corresponding images for the 5 and 10 wt.% composites. In these images, the layers are clearly visible along with their boundaries. The specimens’ general printability was more challenging when the ZnO concentration was higher than 10 wt.%. The nozzle of the 3D printer during the 3D printing process of the samples tended to clog, and as a result, the filament was burned. According to the SEM examination, the increase in filler concentration did not affect shrinkage, layer deposition, or fusion. Thermal investigation of the composites revealed that the Tg temperature was not affected. This is an indication that no substantial change in the polymer’s chain mobility occurred.
The main Raman peaks, which can be seen in Figure 10, come from HDPE Pure. Stretching of the C–O–C was discovered at 1064, 1131, and 1297 cm−1. At 1418 and 1441 cm−1, CH3 deformation and CH2 deformation, respectively, were discovered. Finally, CH2 symmetric stretching and C–H antisymmetric stretching were found at 2850 cm−1 and 2883 cm−1, respectively. In comparison to HDPE pure, none of the samples that contained ZnO showed any differences. Table 2 presents the Raman peaks identified in the measurements.

4. Conclusions

The results of the current study’s overall mechanical tests (Figure 11) showed that adding ZnO particles at certain filler concentrations might greatly increase the HDPE polymer matrix’s overall mechanical strength. For the first time in the literature, HDPE composites containing ZnO filler were fabricated in various concentrations by means of extrusion melting, and 3D-printed specimens were built and examined regarding their mechanical, thermal, and morphological properties. More precisely, HDPE with 10 wt.% filler loading increased tensile strength by 53.8%, while HDPE with 2.5 wt.% filler increased flexural strength by 400%. The addition of the ZnO particles in the HDPE thermoplastic improved the mechanical performance of the 3D-printed specimens in the tensile and flexural tests.
The aforementioned results diverge from prior literature findings and point to a novel 3D printing capability. The HDPE thermoplastic can be utilized for composites as an inventive development, featuring superior mechanical properties compared to the unfilled HDPE polymer.
The overall result and key points of the current research are summarized as follows:
  • Extrusion melting was used to create an HDPE-composite filament with improved mechanical properties.
  • The 10% wt. ZnO composite depicted an enhancement in the tensile strength of 53.8%, which is documented.
  • The flexural strength was enhanced by 400% in the 2.5 wt.% ZnO composite, when compared to the unfilled HDPE polymer.
  • The inclusion of the ZnO microparticles had no impact on the materials’ overall thermal characteristics.
  • After 10% filler loading, the printability of the specimens became challenging.
The aim of the work was proven through the methodology, the experimental findings, and the analysis of the results, i.e., ZnO can improve the mechanical response of the HDPE thermoplastic in MEX 3D printing. Such results can expand the fields of applications of the MEX process by using the HDPE polymer, which is, as mentioned, a popular material in various industrial fields and applications. The procedure can be further improved for industrial applications in upcoming developments. Future research can test various additive doses, identify the HDPE matrix’s ZnO filler’s percolation threshold, and improve the procedure for commercial application.

Author Contributions

Conceptualization, N.V. and M.P.; methodology, A.M. (Athena Maniadi); software, A.M. (Athena Maniadi) and V.P.; validation, N.V., M.P. and A.M. (Athena Maniadi); formal analysis, A.M. (Athena Maniadi), A.M. (Amalia Moutsopoulou), and V.P.; investigation, A.M. (Athena Maniadi); resources, N.V.; data curation, A.M. (Athena Maniadi); writing—original draft preparation, A.M. (Athena Maniadi); writing—review and editing, M.P.; visualization, A.M. (Amalia Moutsopoulou); supervision, N.V.; project administration, N.V.; funding acquisition, M.P. All authors have read and agreed to the published version of the manuscript.

Funding

This research received no external funding.

Institutional Review Board Statement

Not applicable.

Informed Consent Statement

Not applicable.

Data Availability Statement

The data presented in this study are available upon request from the corresponding author.

Acknowledgments

Authors would like to thank the Institute of Electronic Structure and Laser of the Foundation for Research and Technology-Hellas (IESL-FORTH) and in particular Aleka Manousaki for taking the SEM images presented in this work, and the Photonic Phononic and Meta-Materials Laboratory for sharing the Raman Instrumentation.

Conflicts of Interest

The authors declare no conflict of interest.

References

  1. Nadagouda, M.N.; Ginn, M.; Rastogi, V. A review of 3D printing techniques for environmental applications. Curr. Opin. Chem. Eng. 2020, 28, 173–178. [Google Scholar] [CrossRef]
  2. Wu, H.; Fahy, W.; Kim, S.; Kim, H.; Zhao, N.; Pilato, L.; Kafi, A.; Bateman, S.; Koo, J. Recent developments in polymers/polymer nanocomposites for additive manufacturing. Prog. Mater. Sci. 2020, 111, 100638. [Google Scholar] [CrossRef]
  3. Ivanova, O.; Williams, C.; A Campbell, T. Additive manufacturing (AM) and nanotechnology: Promises and challenges. Rapid Prototyp. J. 2013, 19, 353–364. [Google Scholar] [CrossRef] [Green Version]
  4. Coykendall, J.; Cotteleer, M.; Holdowsky, L.; Mahto, M. 3D Opportunity in Aerospace and Defense; Deloitte Univ. Press: New York, NY, USA, 2014; pp. 1–28. [Google Scholar]
  5. Stansbury, J.W.; Idacavage, M.J. 3D Printing with Polymers: Challenges among Expanding Options and Opportunities. Dent. Mater. 2016, 32, 54–64. [Google Scholar] [CrossRef] [PubMed]
  6. Tack, P.; Victor, J.; Gemmel, P.; Annemans, L. 3D-printing techniques in a medical setting: A systematic literature review. Biomed. Eng. Online 2016, 15, 1–21. [Google Scholar] [CrossRef] [Green Version]
  7. Lee, J.-Y.; An, J.; Chua, C.K. Fundamentals and applications of 3D printing for novel materials. Appl. Mater. Today 2017, 7, 120–133. [Google Scholar] [CrossRef]
  8. Vidakis, N.; Petousis, M.; Maniadi, A.; Koudoumas, E.; Vairis, A.; Kechagias, J. Sustainable additive manufacturing: Mechanical response of acrylonitrile-butadiene-styrene over multiple reprocessing processes. Sustainability 2020, 12, 3568. [Google Scholar] [CrossRef]
  9. Rodrõ, Â.F.; Thomas, J.P.; Renaud, J.E. Mechanical behavior of acrylonitrile butadiene styrene (ABS) fused deposition materials. Experimental investigation. Rapid Prototyp. J. 2001, 7, 148–158. [Google Scholar]
  10. Vidakis, N.; Petousis, M.; Tzounis, L.; Maniadi, A.; Velidakis, E.; Mountakis, N.; Papageorgiou, D.; Liebscher, M.; Mechtcherine, V. Sustainable Additive Manufacturing: Mechanical Response of Polypropylene over Multiple Recycling Processes. Sustainability 2020, 13, 159. [Google Scholar] [CrossRef]
  11. Zhang, X.; Fan, W.; Liu, T. Fused deposition modeling 3D printing of polyamide-based composites and its applications. Compos. Commun. 2020, 21, 100413. [Google Scholar] [CrossRef]
  12. Vidakis, N.; Petousis, M.; Maniadi, A. Sustainable Additive Manufacturing: Mechanical Response of High-Density Polyethylene over Multiple Reprocessing Processes. Reprocessing 2021, 6, 4. [Google Scholar] [CrossRef]
  13. Wu, W.; Geng, P.; Li, G.; Zhao, D.; Zhang, H.; Zhao, J. Influence of Layer Thickness and Raster Angle on the Mechanical Properties of 3D-Printed PEEK and a Comparative Mechanical Study between PEEK and ABS. Materials 2015, 8, 5834–5846. [Google Scholar] [CrossRef] [PubMed] [Green Version]
  14. Mazzanti, V.; Malagutti, L.; Mollica, F. FDM 3D Printing of Polymers Containing Natural Fillers: A Review of their Mechanical Properties. Polymers 2019, 11, 1094. [Google Scholar] [CrossRef] [PubMed] [Green Version]
  15. Wickramasinghe, S.; Do, T.; Tran, P. FDM-Based 3D Printing of Polymer and Associated Composite: A Review on Mechanical Properties, Defects and Treatments. Polymers 2020, 12, 1529. [Google Scholar] [CrossRef]
  16. Vidakis, N.; Petousis, M.; Vairis, A.; Savvakis, K.; Maniadi, A. A parametric determination of bending and Charpy’s impact strength of ABS and ABS-plus fused deposition modeling specimens. Prog. Addit. Manuf. 2019, 4, 323–330. [Google Scholar] [CrossRef]
  17. Sood, A.K.; Ohdar, R.K.; Mahapatra, S.S. Experimental investigation and empirical modelling of FDM process for compressive strength improvement. J. Adv. Res. 2012, 3, 81–90. [Google Scholar] [CrossRef] [Green Version]
  18. Vairis, A.; Petousis, M.; Vidakis, N.; Savvakis, K. On the Strain Rate Sensitivity of Abs and Abs Plus Fused Deposition Modeling Parts. J. Mater. Eng. Perform. 2016, 25, 3558–3565. [Google Scholar] [CrossRef]
  19. Galantucci, L.; Lavecchia, F.; Percoco, G. Study of compression properties of topologically optimized FDM made structured parts. CIRP Ann. Manuf. Technol. 2008, 57, 243–246. [Google Scholar] [CrossRef]
  20. Vidakis, N.; Petousis, M.; Maniadi, A.; Koudoumas, E.; Liebscher, M.; Tzounis, L. Mechanical Properties of 3D-Printed Acrylonitrile–Butadiene–Styrene TiO2 and ATO Nanocomposites. Polymers 2020, 12, 1589. [Google Scholar] [CrossRef] [PubMed]
  21. Mangal, U.; Seo, J.-Y.; Yu, J.; Kwon, J.-S.; Choi, S.-H. Incorporating Aminated Nanodiamonds to Improve the Mechanical Properties of 3D-Printed Resin-Based Biomedical Appliances. Nanomaterials 2020, 10, 827. [Google Scholar] [CrossRef] [PubMed]
  22. Vidakis, N.; Petousis, M.; Kourinou, M.; Velidakis, E.; Mountakis, N.; Fischer-Griffiths, P.E.; Grammatikos, S.; Tzounis, L. Additive manufacturing of multifunctional polylactic acid (PLA)—Multiwalled carbon nanotubes (MWCNTs) nanocomposites. Nanocomposites 2021, 7, 184–199. [Google Scholar] [CrossRef]
  23. Elder, B.; Neupane, R.; Tokita, E.; Ghosh, U.; Hales, S.; Kong, Y.L. Nanomaterial Patterning in 3D Printing. Adv. Mater. 2020, 32, e1907142. [Google Scholar] [CrossRef] [PubMed]
  24. Vidakis, N.; Petousis, M.; Maniadi, A.; Koudoumas, E.; Kenanakis, G.; Romanitan, C.; Tutunaru, O.; Suchea, M.; Kechagias, J. The mechanical and physical properties of 3D-Printed materials composed of ABS-ZnO nanocomposites and ABS-ZnO micro composites. Micromachines 2020, 11, 615. [Google Scholar] [CrossRef]
  25. Frone, A.N.; Batalu, D.; Chiulan, I.; Oprea, M.; Gabor, A.R.; Nicolae, C.-A.; Raditoiu, V.; Trusca, R.; Panaitescu, D.M. Morpho-Structural, Thermal and Mechanical Properties of PLA/PHB/Cellulose Biodegradable Nanocomposites Obtained by Compression Molding, Extrusion, and 3D Printing. Nanomaterials 2020, 10, 51. [Google Scholar] [CrossRef] [Green Version]
  26. Vidakis, N.; Maniadi, A.; Petousis, M.; Vamvakaki, M.; Kenanakis, G.; Koudoumas, E. Mechanical and Electrical Properties Investigation of 3D-Printed Acrylonitrile–Butadiene–Styrene Graphene and Carbon Nanocomposites. J. Mater. Eng. Perform. 2020, 29, 1909–1918. [Google Scholar] [CrossRef]
  27. Gaidar, S.; Samusenkov, V.; Strigin, S.; Martínez-García, R. Application of polyfunctional nanomaterials for 3D printing. Polym. Compos. 2022, 43, 3116–3123. [Google Scholar] [CrossRef]
  28. Vidakis, N.; Petousis, M.; Velidakis, E.; Mountakis, N.; Tzounis, L.; Liebscher, M.; Grammatikos, S. Enhanced Mechanical, Thermal and Antimicrobial Properties of Additively Manufactured Polylactic Acid with Optimized Nano Silica Content. Nanomaterials 2021, 11, 1012. [Google Scholar] [CrossRef]
  29. Mubarak, S.; Dhamodharan, D.; Divakaran, N.; Kale, M.B.; Senthil, T.; Wu, L.; Wang, J. Enhanced Mechanical and Thermal Properties of Stereolithography 3D Printed Structures by the Effects of Incorporated Controllably Annealed Anatase TiO2 Nanoparticles. Nanomaterials 2020, 10, 79. [Google Scholar] [CrossRef] [Green Version]
  30. Wang, X.; Jiang, M.; Zhou, Z.W.; Gou, J.H.; Hui, D. 3D printing of polymer matrix composites: A review and prospective. Compos. Part B Eng. 2017, 110, 442–458. [Google Scholar] [CrossRef]
  31. Vidakis, N.; Petousis, M.; Savvakis, K.; Maniadi, A.; Koudoumas, E. A comprehensive investigation of the mechanical behavior and the dielectrics of pure polylactic acid (PLA) and PLA with graphene (GnP) in fused deposition modeling (FDM). Int. J. Plast. Technol. 2019, 23, 195–206. [Google Scholar] [CrossRef]
  32. Alzerreca, M.; Paris, M.; Boyron, O.; Orditz, D.; Louarn, G.; Correc, O. Mechanical properties and molecular structures of virgin and recycled HDPE polymers used in gravity sewer systems. Polym. Test. 2015, 46, 1–8. [Google Scholar] [CrossRef]
  33. Coulier, L.; Orbons, H.G.M.; Rijk, R. Analytical protocol to study the food safety of (multiple-)reprocessed high-density polyethylene (HDPE) and polypropylene (PP) crates: Influence of reprocessing on the migration and formation of degradation products. Polym. Degrad. Stab. 2007, 92, 2016–2025. [Google Scholar] [CrossRef]
  34. Simões, C.L.; Costa Pinto, L.M.; Bernardo, C.A. Environmental and economic assessment of a road safety product made with pure and reprocessed HDPE: A comparative study. J. Environ. Manage. 2013, 114, 209–215. [Google Scholar] [CrossRef] [PubMed]
  35. Achilias, D.S.; Roupakias, C.; Megalokonomos, P.; Lappas, A.A.; Antonakou, V. Chemical reprocessing of plastic wastes made from polyethylene (LDPE and HDPE) and polypropylene (PP). J. Hazard. Mater. 2007, 149, 536–542. [Google Scholar] [CrossRef]
  36. De Vries, C. Volkswagen Autoeuropa: Maximizing Production Efficiency with 3D Printed Tools, Jigs, and Fixtures; Ultimaker: Utrecht, The Netherlands, 2017; Available online: www.ultimaker.com (accessed on 9 September 2022).
  37. Xiao, K.; Zhang, L.; Zarudi, I. Mechanical and rheological properties of carbon nanotube-reinforced polyethylene composites. Compos. Sci. Technol. 2007, 67, 177–182. [Google Scholar] [CrossRef]
  38. Fouad, H.; Elleithy, R.; Al-Zahrani, S.M.; Ali, M.A.-H. Characterization and processing of high density polyethylene/carbon nano-composites. Mater. Des. 2011, 32, 1974–1980. [Google Scholar] [CrossRef]
  39. Jayavardhan, M.L.; Bharath, K.; Doddamani, M.; Singh, A.K.; Zeltmann, S.E.; Gupta, N. Development of glass microballoon/HDPE syntactic foams by compression molding. Compos. Part B Eng. 2017, 130, 119–131. [Google Scholar] [CrossRef]
  40. Jayavardhan, M.L.; Doddamani, M. Quasi-static compressive response of compression molded glass microballoon/HDPE syntactic foam. Compos. Part B Eng. 2018, 149, 165–177. [Google Scholar] [CrossRef]
  41. Doddamani, M. Influence of microballoon wall thickness on dynamic mechanical analysis of closed cell foams. Mater. Res. Express 2020, 6, 125348. [Google Scholar] [CrossRef]
  42. Kumar, B.B.; Doddamani, M.; Zeltmann, S.E.; Gupta, N.; Ramesh, M.; Ramakrishna, S. Processing of cenosphere/HDPE syntactic foams using an industrial scale polymer injection molding machine. Mater. Des. 2016, 92, 414–423. [Google Scholar] [CrossRef] [Green Version]
  43. Bharath, K.; Doddamani, M.; Zeltmann, S.E.; Gupta, N.; Gurupadu, S.; Sailaja, R.R.N. Effect of particle surface treatment and blending method on flexural properties of injection-molded cenosphere/HDPE syntactic foams. J. Mater. Sci. 2016, 51, 3793–3805. [Google Scholar] [CrossRef]
  44. Kumar, B.R.B.; Zeltmann, S.E.; Doddamani, M.; Gupta, N.; Uzma; Gurupadu, S.; Sailaja, R.R.N. Effect of cenosphere surface treatment and blending method on the tensile properties of thermoplastic matrix syntactic foams. J. Appl. Polym. Sci. 2016, 133, 43881. [Google Scholar] [CrossRef]
  45. Yuan, Q.; Yang, Y.; Chen, J.; Ramuni, V.; Misra, R.; Bertrand, K. The effect of crystallization pressure on macromolecular structure, phase evolution, and fracture resistance of nano-calcium carbonate-reinforced high density polyethylene. Mater. Sci. Eng. A 2010, 527, 6699–6713. [Google Scholar] [CrossRef]
  46. Di, W.; Zhang, G.; Xu, J.; Peng, Y.; Wang, X.; Xie, Z. Positive-temperature-coefficient/negative-temperature-coefficient effect of low-density polyethylene filled with a mixture of carbon black and carbon fiber. J. Polym. Sci. Part B Polym. Phys. 2003, 41, 3094–3101. [Google Scholar] [CrossRef]
  47. Azeez, A.; Rhee, K.Y.; Park, S.-J.; Hui, D. Epoxy clay nanocomposites—Processing, properties and applications: A review. Compos. Part B Eng. 2013, 45, 308–320. [Google Scholar] [CrossRef]
  48. Beesetty, P.; Kale, A.; Patil, B.; Doddamani, M. Mechanical behavior of additively manufactured nanoclay/HDPE nanocomposites. Compos. Struct. 2020, 247, 112442. [Google Scholar] [CrossRef]
  49. Benabid, F.; Kharchi, N.; Zouai, F.; Mourad, A.-H.I.; Benachour, D. Impact of co-mixing technique and surface modification of ZnO nanoparticles using stearic acid on their dispersion into HDPE to produce HDPE/ZnO nanocomposites. Polym. Polym. Compos. 2019, 27, 389–399. [Google Scholar] [CrossRef]
  50. Akhil, P.S.; Golla, B.R.; James, A.R. Characterization of high κ HDPE-TiO2 composites: A first report. Mater. Lett. 2019, 241, 128–131. [Google Scholar] [CrossRef]
  51. Vidakis, N.; Petousis, M.; Maniadi, A.; Papadakis, V. MEX 3D Printed HDPE/TiO2 Nanocomposites Physical and Mechanical Properties Investigation. J. Compos. Sci. 2022, 6, 209. [Google Scholar] [CrossRef]
  52. Shirkavand, M.J.; Azizi, H.; Ghasemi, I.; Karabi, M. Effect of Molecular Structure Parameters on Crystallinity and Environmental Stress Cracking Resistance of High-Density Polyethylene/TiO2 Nanocomposites. Adv. Polym. Technol. 2016, 37, 770–777. [Google Scholar] [CrossRef]
  53. Anu, M.; Pillai, S.S. Structure, thermal, optical and dielectric properties of SnO2 nanoparticles-filled HDPE polymer. Solid State Commun. 2022, 341, 114577. [Google Scholar] [CrossRef]
  54. Mahmoud, M.E.; El-Khatib, A.M.; Badawi, M.S.; Rashad, A.R.; El-Sharkawy, R.M.; Thabet, A.A. Fabrication, characterization and gamma rays shielding properties of nano and micro lead oxide-dispersed-high density polyethylene composites. Radiat. Phys. Chem. 2018, 145, 160–173. [Google Scholar] [CrossRef]
  55. Wang, H.; Yang, D.; Xiong, W.; Liu, W.; Qiu, X. One-pot preparation of hydrophobic lignin/SiO2 nanoparticles and its reinforcing effect on HDPE. Int. J. Biol. Macromol. 2021, 180, 523–532. [Google Scholar] [CrossRef]
  56. Mahmoud, M.E.; Khalifa, M.A.; El-Sharkawy, R.M.; Youssef, M.R. Effects of Al2O3 and BaO nano-additives on mechanical characteristics of high-density polyethylene. Mater. Chem. Phys. 2021, 262, 124251. [Google Scholar] [CrossRef]
  57. Bedi, P.; Singh, R.; Ahuja, I.P.S. Investigations for tool life of 3D printed HDPE and LDPE composite based rapid tooling for thermoplastics machining applications. Eng. Res. Express 2019, 1, 015003. [Google Scholar] [CrossRef] [Green Version]
  58. Alsayed, Z.; Awad, R.; Badawi, M.S. Thermo-mechanical properties of high density polyethylene with zinc oxide as a filler. Iran. Polym. J. 2020, 29, 309–320. [Google Scholar] [CrossRef]
  59. Vahidi, G.; Bajwa, D.S.; Shojaeiarani, J.; Stark, N.M. Experimental investigation into the direct feeding of coupling agent, cellulose nanocrystals, and nano zinc oxide in high-density polyethylene. Compos. Part C Open Access 2022, 8, 100287. [Google Scholar] [CrossRef]
  60. Mwafy, E.A.; Abd-Elmgeed, A.A.; Abou-Kandil, A.; Elsabbagh, I.A.; Elfass, M.M.; Gaafar, M. High UV-shielding Performance of Zinc Oxide/High-Density Polyethylene Nanocomposites. Spectrosc. Lett. 2014, 48, 646–652. [Google Scholar] [CrossRef]
  61. Yao, Y.-L.; De Guzman, M.R.; Duan, H.; Gao, C.; Lin, X.; Wen, Y.-H.; Du, J.; Lin, L.; Chen, J.-C.; Wu, C.-S.; et al. Infusing High-density Polyethylene with Graphene-Zinc Oxide to Produce Antibacterial Nanocomposites with Improved Properties. Chin. J. Polym. Sci. 2020, 38, 898–907. [Google Scholar] [CrossRef]
  62. Bednarik, M.; Manas, D.; Ovsik, M.; Manas, M.; Stanek, M.; Sanda, S.; Kratky, P. Effect of Beta Irradiation on the Strength of Bonded Joints of HDPE. Key Eng. Mater. 2013, 586, 79–82. [Google Scholar] [CrossRef]
  63. Crosby, A.J.; Lee, J.Y. Polymer nanocomposites: The “nano” effect on mechanical properties. Polym. Rev. 2007, 47, 217–229. [Google Scholar] [CrossRef]
  64. Stuart, B.H. Temperature studies of polycarbonate using Fourier transform Raman spectroscopy. Polym. Bull. 1996, 36, 341–346. [Google Scholar] [CrossRef]
  65. Resta, V.; Quarta, G.; Lomascolo, M.; Maruccio, L.; Calcagnile, L. Raman and Photoluminescence spectroscopy of polycarbonate matrices irradiated with different energy 28Si+ ions. Vacuum 2015, 116, 82–89. [Google Scholar] [CrossRef]
  66. Zimmerer, C.; Matulaitiene, I.; Niaura, G.; Reuter, U.; Janke, A.; Boldt, R.; Sablinskas, V.; Steiner, G. Nondestructive characterization of the polycarbonate—Octadecylamine interface by surface enhanced Raman spectroscopy. Polym. Test. 2018, 73, 152–158. [Google Scholar] [CrossRef]
  67. Makarem, M.; Lee, C.M.; Kafle, K.; Huang, S.; Chae, I.; Yang, H.; Kubicki, J.D.; Kim, S.H. Probing cellulose structures with vibrational spectroscopy. Cellulose 2019, 26, 35–79. [Google Scholar] [CrossRef]
  68. Liu, X.B.; Zou, Y.; Li, W.T.; Cao, G.P.; Chen, W.J. Kinetics of thermo-oxidative and thermal degradation of poy(D,L-lactide) (PDLLA) at processing temperature. Polym. Degrad. Stab. 2006, 91, 12, 3259–3265. [Google Scholar] [CrossRef]
Figure 1. The overall followed workflow in this work.
Jcs 06 00315 g001
Figure 2. (A) Tensile stress compared to strain curves experimentally determined for the unfilled HDPE and the HDPE/ZnO composites, (B) Comparative average tensile strength graph (average value is depicted inside the bars) and deviation (value is depicted on top of the bars), and (C) Average experimentally calculated tensile mod. of elasticity values and their deviation for the materials of this work.
Jcs 06 00315 g002
Figure 3. (A) Flexural stress compared to strain curves experimentally determined for the unfilled HDPE and the HDPE/ZnO composites, (B) Comparative average flexural strength graph (average value is depicted inside the bars) and deviation (value is depicted on top of the bars), and (C) Average experimentally calculated flexural mod. of elasticity values and their deviation for the materials of this work.
Jcs 06 00315 g003
Figure 4. (A) Average calculated tensile toughness and deviation of unfilled HDPE thermoplastic and HDPE with ZnO composites, (B) Average calculated flexural toughness and deviation of unfilled HDPE thermoplastic and HDPE with ZnO composites and (C) average Vickers micro-hardness including st. dev. results for unfilled HDPE thermoplastic and HDPE with ZnO composites.
Jcs 06 00315 g004
Figure 5. (A) TGA graphs of unfilled HDPE thermoplastic and HDPE with ZnO composites; and (B) Weight loss rate graphs compared to temperature for unfilled HDPE thermoplastic and HDPE with ZnO composites.
Jcs 06 00315 g005
Figure 6. DSC results for unfilled HDPE thermoplastic and HDPE with ZnO composites at (A) 0 wt.%, (B) 5 wt.%, (C) 10 wt.%, (D) 20 wt.%; (E) DSC comparative graphs for unfilled HDPE thermoplastic and HDPE with ZnO composites; and (F,G) zoom areas of the melting endotherm peaks (F) and crystallization exotherm peaks (G).
Jcs 06 00315 g006
Figure 7. Images taken on unfilled HDPE 3D-printed tensile test samples with SEM (A) fracture region and (B) side area.
Jcs 06 00315 g007
Figure 8. SEM images of the fracture area of 3D-printed HDPE/ZnO specimens at (A) 0.5 wt.%; (B) 2.5 wt.%; (C) 5 wt.%; and (D) 10 wt.%. Keep in mind that randomly selected tensile specimens from each material are depicted.
Jcs 06 00315 g008
Figure 9. 3D-printed tensile test samples (randomly selected) SEM images of their side surfaces for the composites prepared herein: (A) 0.5 wt.% at 30× magnification, (B) 0.5 wt.% at 150× magnification, (C) 2.5 wt.% at 30× magnification, (D) 2.5 wt.% at 150× magnification, (E) 5 wt.% at 30× magnification, (F) 5 wt.% at 150× magnification, (G) 10 wt.% at 30× magnification, and (H) 10 wt.% at 150× magnification.
Jcs 06 00315 g009
Figure 10. (A) Raman spectra for unfilled HDPE thermoplastic and HDPE with ZnO composites and EDS results for ZnO loadings in the composites of (B) 0.5 wt.%, (C) 5 wt.%, (D) 10 wt.%, and (E) 20 wt.%.
Jcs 06 00315 g010
Figure 11. Overall mechanical properties.
Jcs 06 00315 g011
Table 1. Settings used for the manufacture of the specimens with the 3D printing process in this study.
Parameter:Value
3D Printing Speed:50–100 mm/s
3D Printing Orientation:XZ plane
Raster Angle:45 degrees
Infill type:Rectilinear
Infill percentage:100% Solid
The number of wall lines:2
Heat bed Temperature:100 °C (No printing aids used)
Printing Temperature:250 °C
Printing/Layer Resolution:0.2 mm
Table 2. Major Raman peaks identified and their related assignments.
Wavenumber (cm−1)Raman Peak Assignment
1064C-O-C stretching [64]
1131C-O-C stretching [65]
1297C-O-C stretching [64]
1418CH3 deformation [64]
1441CH2 deformation [64,66]
2850CH2 symmetric stretching [67]
2884C-H antisymmetric stretching [68]
Publisher’s Note: MDPI stays neutral with regard to jurisdictional claims in published maps and institutional affiliations.

