Article

Optimizing Topology in Satellite–UAV Collaborative IoT: A Graph Partitioning Simulated Annealing Approach

1
School of Information and Software Engineering, University of Electronic Science and Technology of China, Chengdu 610054, China
2
Glasgow College, University of Electronic Science and Technology of China, Chengdu 611731, China
3
School of Mathematical Sciences, University of Electronic Science and Technology of China, Chengdu 611731, China
*
Author to whom correspondence should be addressed.
These authors contributed equally to this work.
Drones 2024, 8(2), 44; https://doi.org/10.3390/drones8020044
Submission received: 8 December 2023 / Revised: 25 January 2024 / Accepted: 27 January 2024 / Published: 1 February 2024
(This article belongs to the Special Issue UAV-Assisted Internet of Things)

Abstract

:
Currently, space-based information networks, represented by satellite Internet, are rapidly developing. UAVs can serve as airborne mobile terminals, representing a novel node in satellite IoT, offering more accurate and robust data streaming for connecting global satellite–UAV collaborative IoT systems. It is characterized by high-speed dynamics, with node distances and visibility constantly changing over time. Therefore, there is a need for faster and higher-quality topology optimization research. A reliable, secure, and adaptable network topology optimization algorithm has been proposed to handle various complex scenarios. Additionally, considering the dynamic and time-varying nature of these types of networks, the concept of time slices has been introduced to accelerate the iterative efficiency of problem-solving. Experimental results demonstrate that the proposed algorithm is expected to exhibit better convergence and performance in subsequent iterations compared with traditional solutions. Besides being a solution for topology optimization, the proposed algorithm offers a new way of thinking, enabling the handling of larger satellite–UAV collaborative IoT systems.

1. Introduction

Near-Earth satellite–UAV collaborative networks are a ubiquitous IoT system that integrates synchronous satellites or medium- to low-orbit satellites and includes stratospheric balloons and manned or unmanned drones [1]. It not only effectively enhances network critical performance but also breaks geographical limitations, achieving seamless, global three-dimensional coverage and supporting users’ access anytime, anywhere, bridging the digital divide between different regions. The UAV serves as an airborne mobile terminal, representing a novel node in satellite-based IoT. With the advantages of low cost, wide coverage, flexibility, and high line-of-sight [2], UAVs are widely used to assist in IoT data collection and provide a more accurate and robust data stream [3] for connecting global satellite–UAV collaborative IoT systems. For example, employing UAVs to patrol a designated area allows for clearer observations of crop growth [4] and natural disasters [5] than satellite remote sensing. Drone-assisted autonomous navigation [6], camera shooting [7], and outdoor positioning technology [8] can help with Building Information Modeling (BIM) for construction [9]. The satellite–UAV collaborative IoT systems scenario is shown in Figure 1.
Moreover, the emergence of new business and application scenarios (such as digital twins [10] and industrial Internet of Things [11]) and their increasingly stringent key performance indicators necessitate the deep integration of communication, information, big data, AI, and control technologies within the ubiquitous communication systems. This integration further supports a cloud-native, flexible, streamlined, intelligent, secure, and open network, providing distributed, cross-domain, flexible, and agile expansion capabilities.
This IoT system of near-Earth satellite–UAV collaboration differs fundamentally from ground-based IoT systems. Firstly, each satellite and drone is in constant high-speed motion relative to the earth and ground infrastructure. Secondly, the internode distances and visibility change over time. Lastly, the onboard computing load capabilities of the nodes are limited, especially for older satellites and mini-drones, which may have insufficient processing power. These characteristics present unique challenges for space-based IoT. Furthermore, the nodes of satellite–UAV collaborative IoT systems are exposed to the harsh space environment of deep vacuum and suffer from extreme weather, radiation, intense vibrations, and extreme temperature ranges. These factors result in much higher uncertainties in network communication compared with traditional ground-based IoT networks.
The characteristics of low energy consumption and relatively long flight time of drones, as well as their ability to effectively expand coverage, are receiving increasing attention. Consequently, more and more researchers are engaging in exploratory studies [1,11,12] related to near-Earth satellite–UAV collaborative IoT system initiatives. This work aims to design a reliable, secure, and controllable network topology optimization algorithm that can adapt to various complex scenarios, enabling the rapid and efficient establishment of highly resilient networks while fulfilling communication tasks. Compared with the traditional methods that focus too much on solution efficiency, the innovation of the proposed method is that instead of choosing the two aspects of neighborhood solution generation and estimation function computation as the entry point of optimization, a new optimization path is provided. Starting from the initial solution generation, the partition is first divided and optimized; then, the partition is merged and iterated, greatly reducing the number of iterations for the subsequent simulated annealing process and thus reducing the code’s running time. Doing so provides a good initial solution for the simulated annealing. Also, it ensures the convergence speed of the solution in the subsequent iterations, leading to better results for the algorithm.
The rest of this paper is organized as follows: Section 2 briefly introduces some background and our motivations. Section 3 elaborates on our proposed method. Section 4 presents the experiments and results. Section 5 reviews the related works. Section 6 concludes the paper.

2. Related Work

The existing research on the topology optimization of satellite–UAV-integrated networks mainly focuses on two categories. One category improves the topology structure of networks through optimization using distributed minimum spanning tree algorithms. The other category involves heuristic randomized search algorithms, such as the algorithm proposed in this work. Heuristic randomized search methods aim to randomly explore the solution space in search of the global optimal solution for the objective function.
There are also numerous other precise or approximate algorithms within this research category. Yan et al. [13] proposed a simulated annealing algorithm that considers multiple time slices as states under multiple constraints. Additionally, greedy algorithms [14], other simulated annealing algorithms [15], scheduling algorithms [16], load balancing algorithms [17], and immune algorithms [18] based on single time slices were proposed one after another.
In simulated annealing-based solving algorithms, there are multiple options for generating neighborhood solutions, including the spanning tree random selection method, the random link switching method [13], and the mixed maximum flow.
It is also worth mentioning that on the basis of the time slice model of satellite networks, there are usually little changes in the visibility matrix between adjacent time slices. There is an adaptive method [19] for the simulated annealing algorithm, which utilizes the solution in the last time slice to reduce redundant computing and iterations.
Most of the existing research is less concerned with the initial solution of the optimization algorithm and excessively focused on the efficiency of the iterations. Sometimes, a smartly constructed initial solution will largely determine the number and efficiency of the following iterations. The algorithm proposed is not only an excellent initial solution generation method but also a recursive partition method. At the same time, this algorithm also retains and integrates some optimizations from the above-related research and further optimizes the indexes on this foundation.

3. Concepts and Models

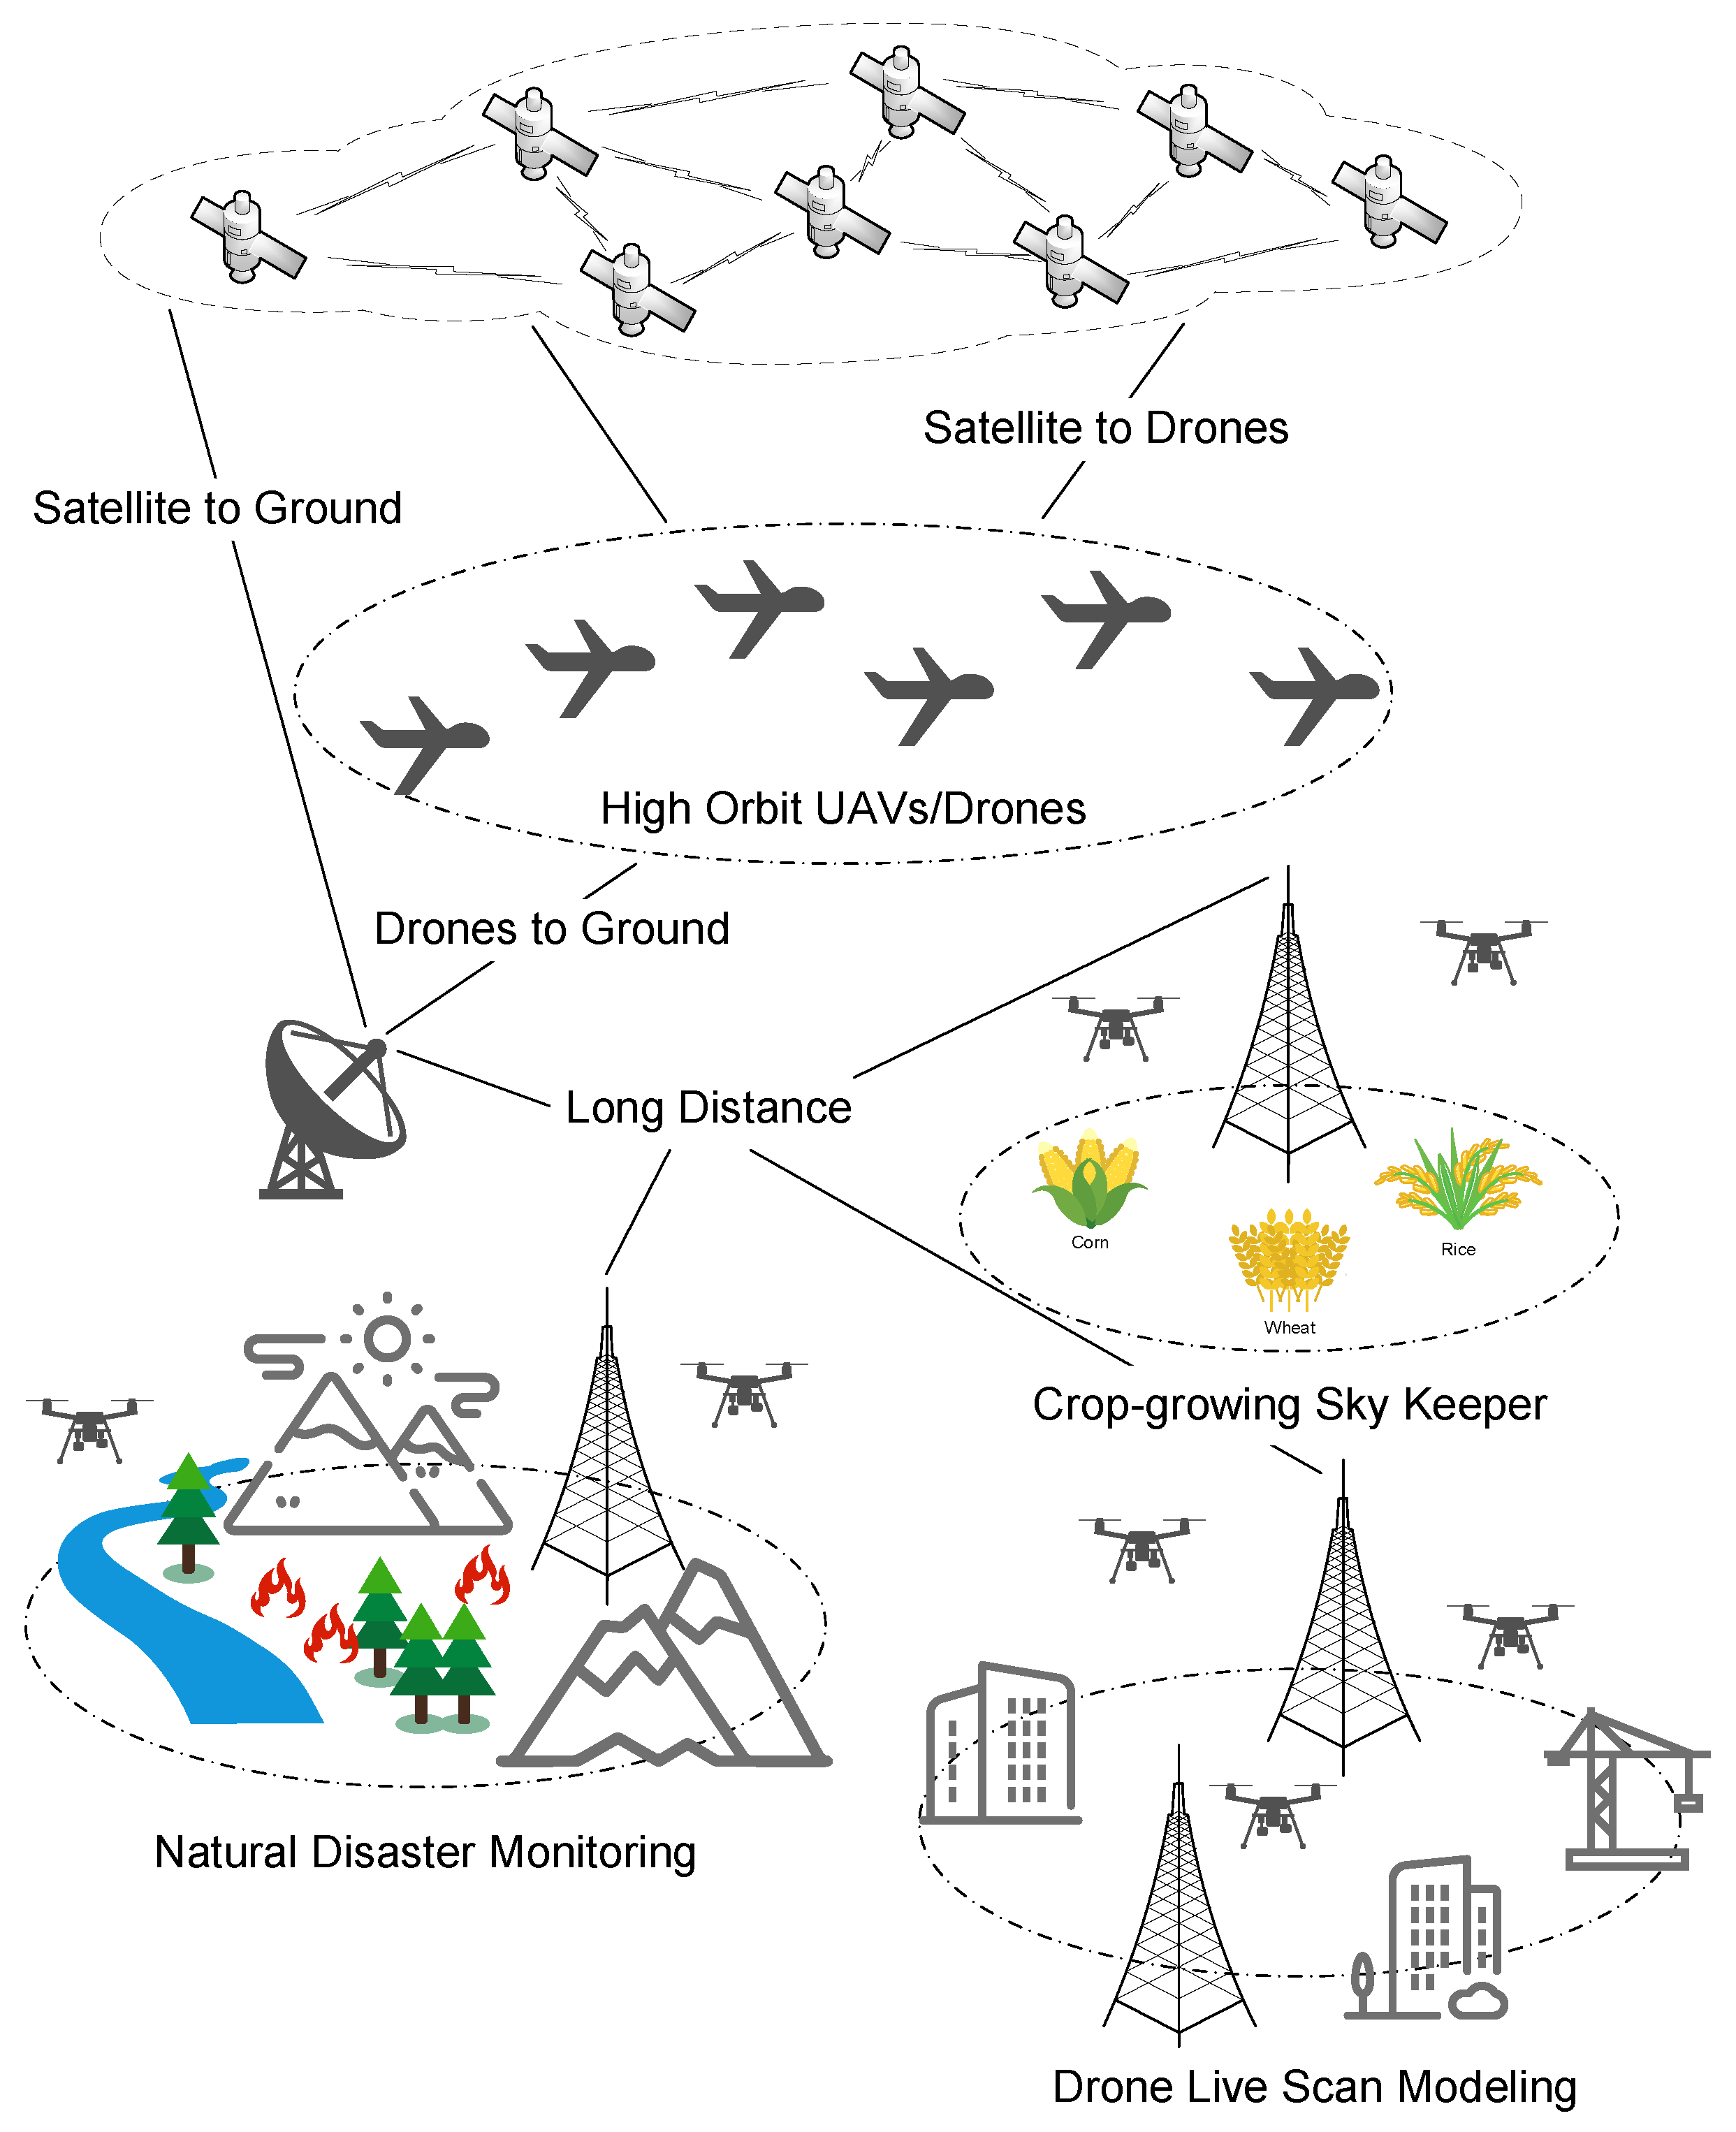
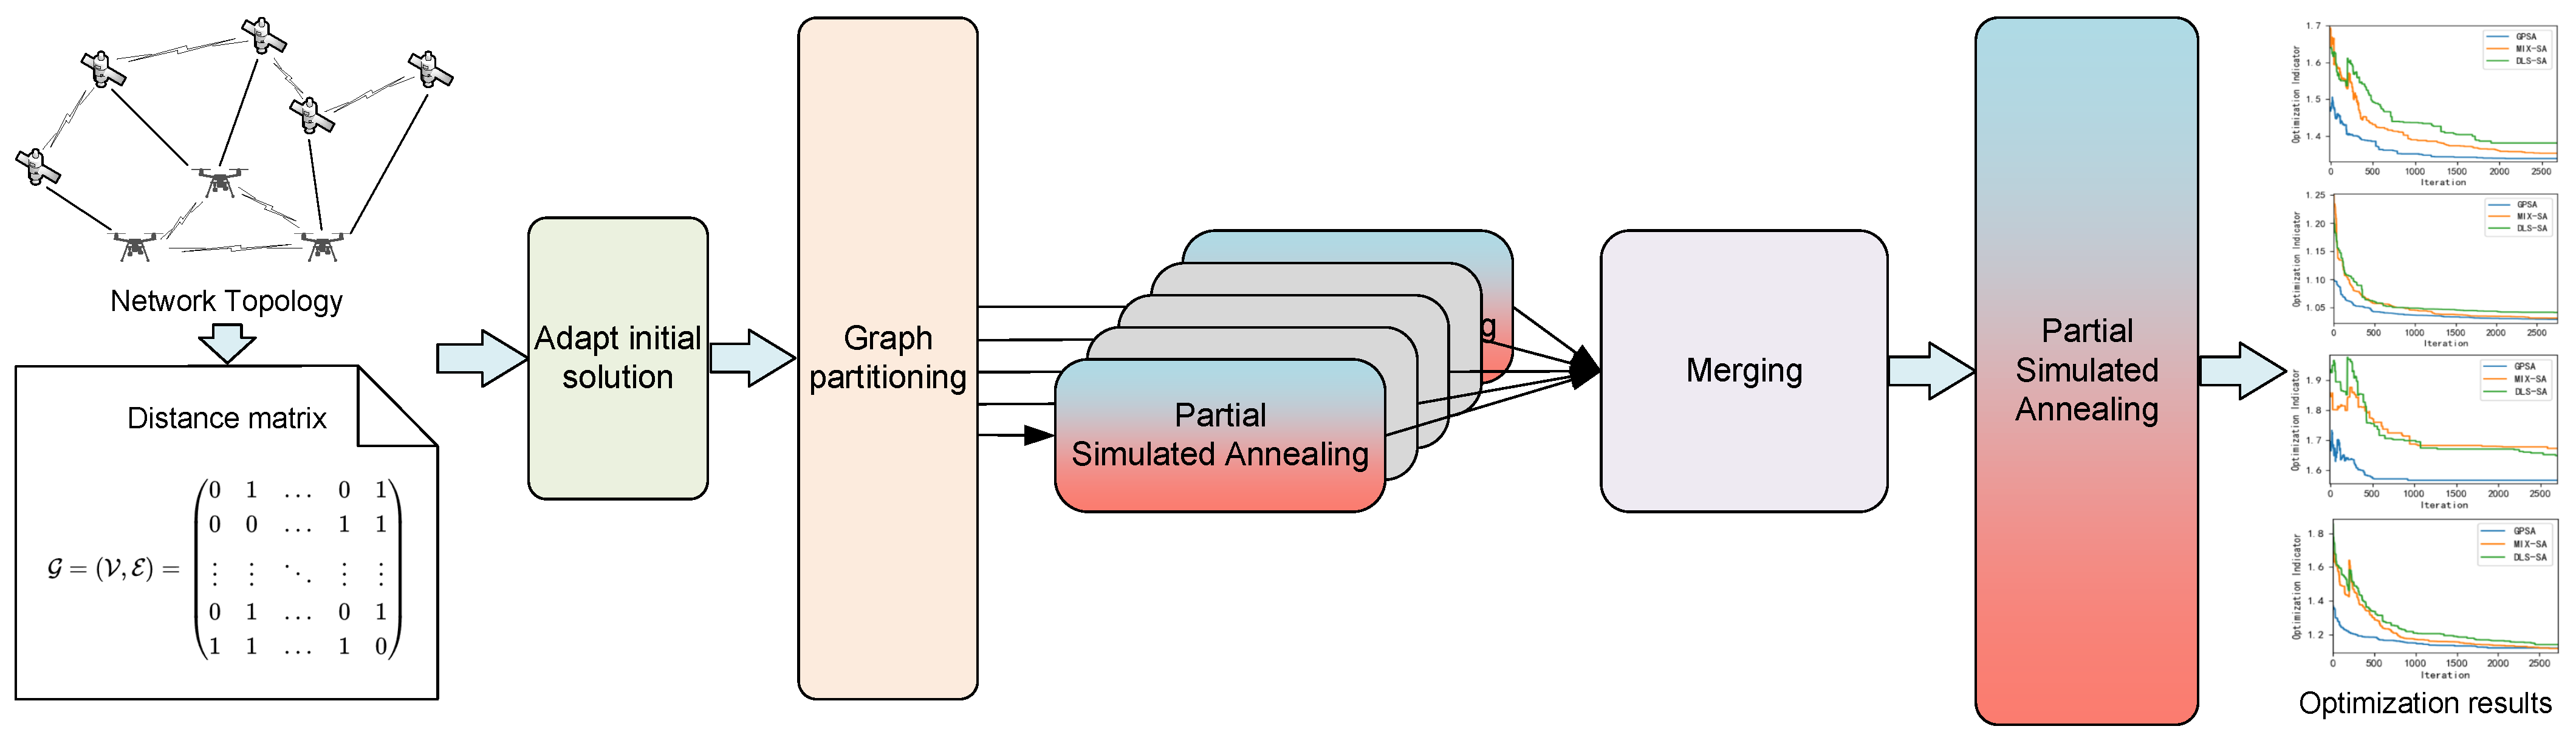
In this section, we introduce the research hypotheses for the discussed issues, the required prior knowledge and key concepts from related fields, and the achievements of previous research.

3.1. Network Modeling

Network modeling plays a pivotal role in the research, design, and operation of networks. Scientific network modeling can assist us in gaining a profound understanding of network structures and relationships, accurately unveiling the intrinsic patterns and characteristics of networks. The relationship between networks and graph theory is inseparable. Graph theory offers a concise and powerful method for representing various complex relationships within networks, whether they are computer networks [20], satellite networks [21], transportation networks [22], social networks [23], or networks from other domains. In networks, nodes can correspond to vertices in graph theory, while links can correspond to edges.
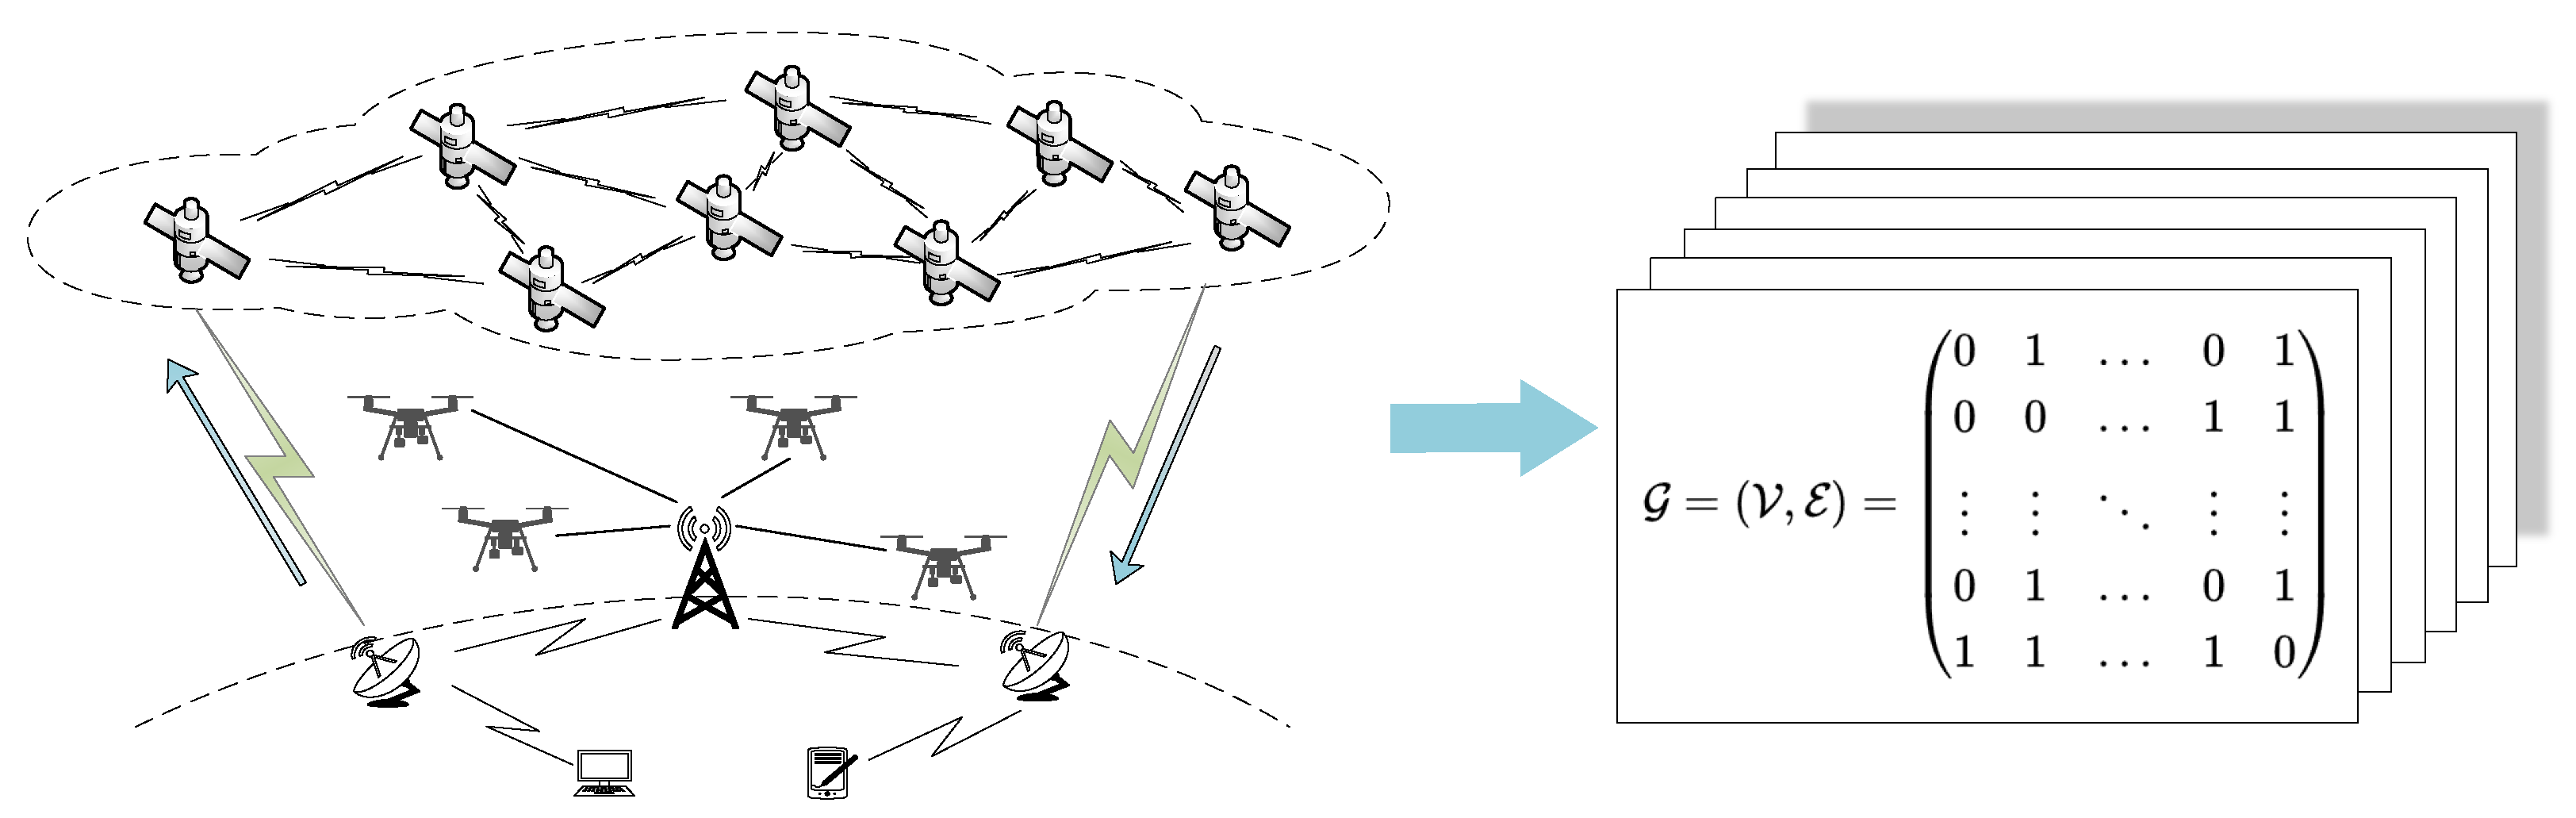
If the time-varying satellite–UAV-integrated networks can be abstracted as a graph, we can leverage the rich tools and methods of graph theory to analyze and understand the network’s structure, characteristics, and behavior.
The topological relations of the satellite–UAV-integrated networks can be represented by the geometric representation G = V , E in graph theory. Where G denotes the topological model, and V denotes the set of nodes in the topological model with size N . E denotes the set of edges in the topological model with size M . The unique G can be determined by combining V and E . G records the information of all nodes and all edges, which is unique and irreducible. The process of abstracting a time-varying dynamic satellite network into a graph structure is shown in Figure 2.
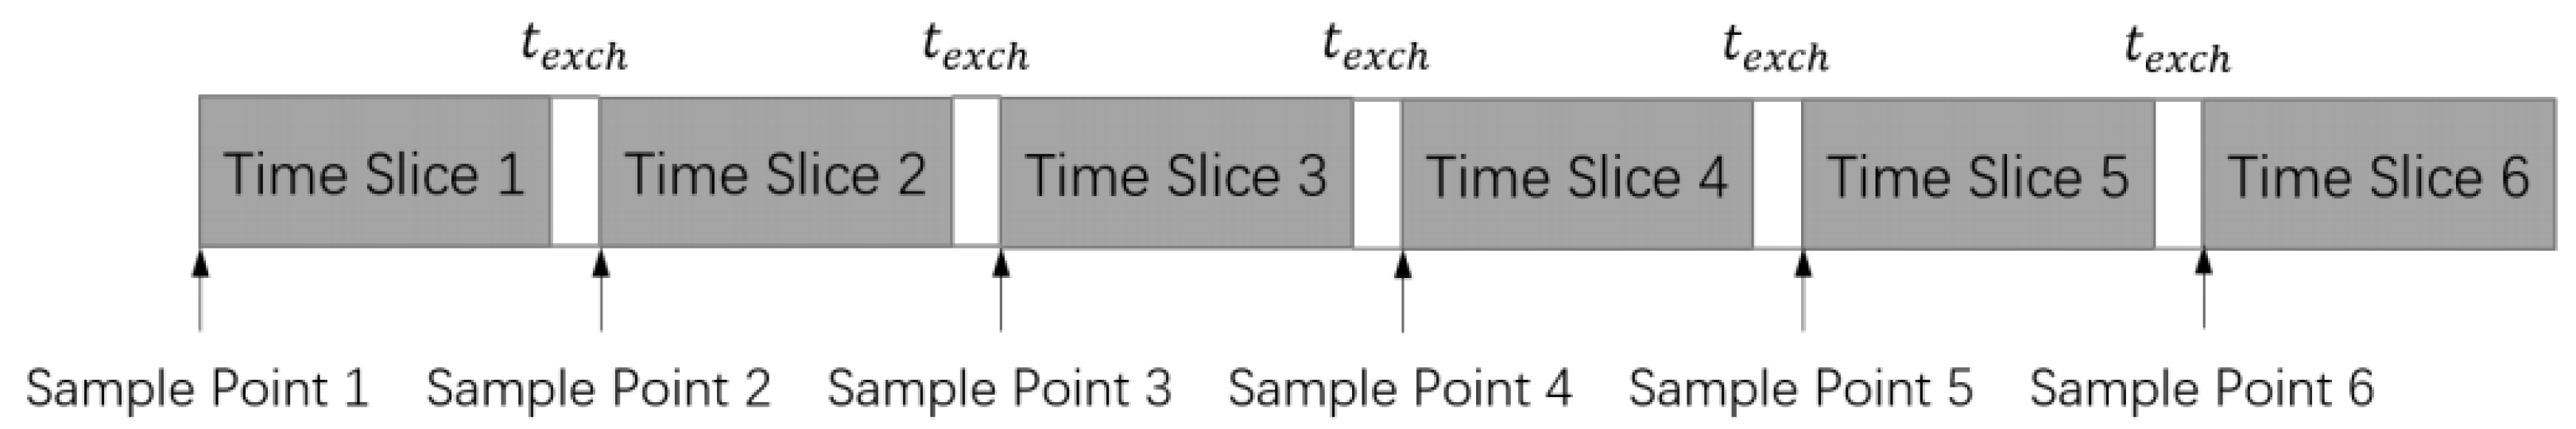
The delay in satellite–UAV-integrated networks mainly comes from four sources: uplink delay, downlink delay, transmission delay between satellites, and internal calculations and processing delays. Now, suppose there is a satellite–UAV-integrated network with N satellites and drones. A routing path P is made up by an order of M nodes v 1 , v 2 , , v M 1 , v M , and the internal processing delay of node v i is I n i . Then, the total delay for routing path P in the time slice s is
d e l a y s , v 1 , v M = i = 1 M I n i + i = 1 M 1 d i s t a n c e s , v i , v i + 1 + T u p + + T d o w n
For simplicity, the distance between node pairs replaces the transmission delay between nodes. d i s t a n c e s , v i , v i + 1 is the transmission delay between node v i and v i + 1 in time slice s, assuming that the internal delay I n i of all satellites in the network is almost the same and is T i n . Further, considering that the delay is the same for uplink T u p and downlink T d o w n for routing path P with the same start and end points, the equation can be simplified as follows:
d e l a y s , v 1 , v M = M T i n + i = 1 M 1 d i s t a n c e s , v i , v i + 1
For old satellites, their computing power is usually low, resulting in the internal delay being far greater than the transmission delay of the signal. This means I n i d i s t a n c e ( v i , v j ) , so the model can be simplified as
d e l a y s , v 1 , v M M T i n
The delay only depends on the number of nodes on the routing path P . For this condition, an unweighted constellation model with an N × N edge matrix V i , j can be set for further calculation. In a time slice, V i , j = 1 if node v i and v j are mutually visible, and V i , j = if invisible.
The weight constellations model is suitable for more advanced satellites and drones, which have higher computational power, resulting in a significant reduction in single satellite computation and processing latency. The final effect presented can be approximated as I n i d i s t a n c e ( v i , v j ) , so the model can be simplified as
d e l a y s , v 1 , v M i = 1 M 1 d i s t a n c e s , v i , v i + 1
The delay only depends on the total length of the path. For this condition, a weighted graph with an N × N edge matrix V i , j can be set for further calculation. In a time slice, V i , j is the latency or distance between v i and v j if they are mutually visible, and V i , j = if invisible.

3.2. Time Slice Modeling

The concept of time slicing originated from the scheduling process of each process by the kernel in a time-sharing operating system [24]. In the scheduling process of the operating system, the kernel allocates some time slices to each process. Within one time slice, the kernel only runs one process. Due to the typically short length of time slices, users do not perceive the switching process of time slices. In the user’s view, all processes operate together. In this way, a time-sharing operating system can achieve concurrent computing.
In a near-Earth satellite–UAV collaborative IoT system, all nodes continuously operate at high speeds within their respective orbits or tracks, and the distances and relative positions between nodes constantly change. A common approach is to divide the entire operational cycle of a dynamic network into multiple time slots and perform separate calculations within each time slot [25]. Each time slot corresponds to a period of time with a specific network topology, and the topology structure during that period is referred to as a topology snapshot. This abstraction allows us to transform the dynamic satellite–UAV-integrated networks into a static, discrete form of a graph. This work uses the equal time interval slicing method to divide time slices and topology sampling on an interval basis [26]. Equal time interval division is shown in Figure 3.

3.3. Simulated Annealing

A simulated annealing (SA) algorithm is a heuristic algorithm used to solve various complex optimization problems [27]. It takes inspiration from the cooling process in metal forging. The algorithm starts from an initial solution and generates new candidate solutions by making small random changes to the current solution. It introduces the concept of temperature T, which controls the probability of accepting new candidate solutions. The probability of accepting a new neighborhood solution is shown as follows:
P = 1 , F t + 1 < F t e F t F t + 1 k T F t + 1 F t
where F t is the objective function of the current solution and F t + 1 is that of the new neighborhood solution. T is the current temperature and k is an arbitrarily set constant.
A simulated annealing algorithm has a wide range of applications and is capable of handling complex optimization problems with large search spaces and nonlinear objective functions. It has been successfully applied to various real-world problems, including the traveling salesman problem [28], vehicle routing problem [29], scheduling problem [30], and parameter optimization in machine learning [31].

3.4. Graph Partitioning

Graph partitioning (GP) provides a method for the recursive or parallel processing of graph-structured data, reducing the size of the data while ensuring that the partitioning has minimal impact. This has great significance for many distributed systems. In recent years, with the development of networks and IoT systems, graph partitioning has been playing a role in many fields [32].
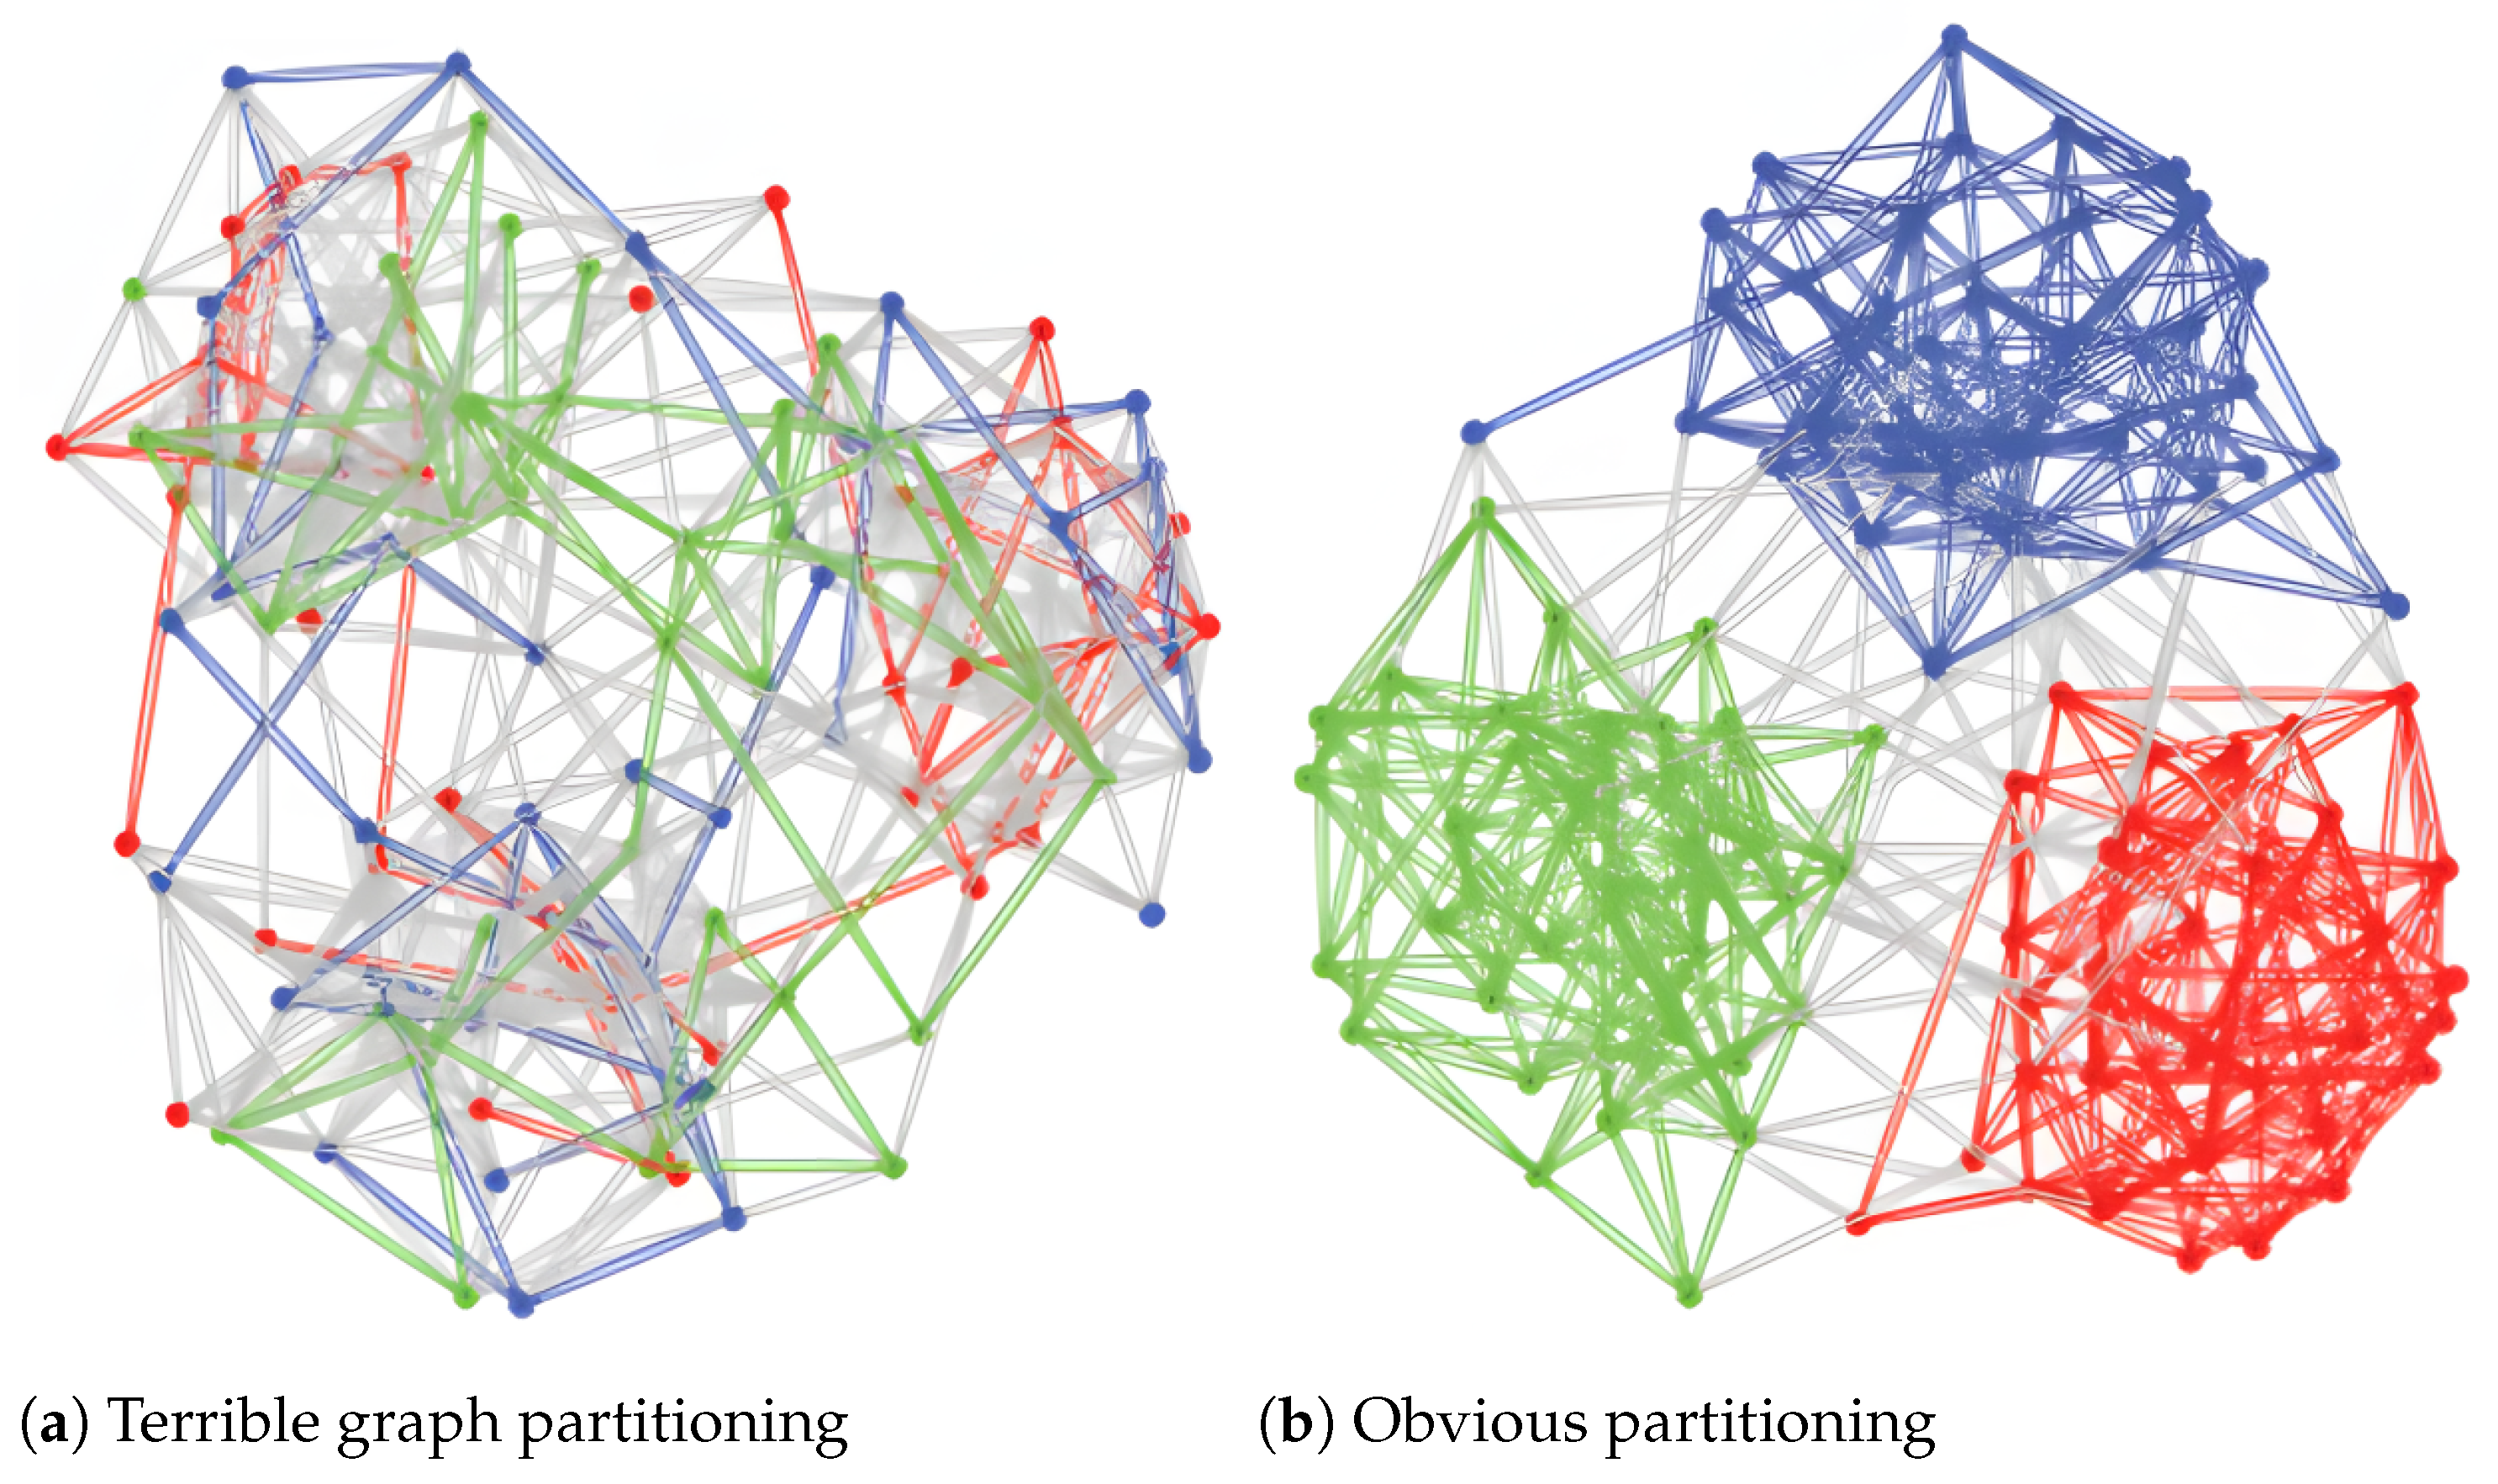
The goal of graph partitioning is divided into edge-cut and vertex-cut, which means that the vertexes or edges in a graph are divided into several balanced sets so that the edges or points between different sets are minimized. The graph partitioning mentioned in this thesis refers specifically to edge-cut, in which all vertices in a graph are divided into k disjoint subsets. An illustration of edge-cut graph partitioning is shown in Figure 4. The different colors of a node indicate which partition it belongs to. Gray edges indicate edges in different partitions and colored edges indicate edges in the same partition. Since nodes are randomly assigned to different partitions, there are many interpartition edges. When no graph partitioning is performed, Figure 4a shows a very terrible partition. After graph partitioning, Figure 4b shows that nodes are assigned to highly clustered partitions.
We now describe the model in mathematical language. Suppose there is an input undirected graph with N vertexes represented by an N × N adjacency matrix A composed of 0 and 1 to indicate connectivity and a given constant K indicating the number of segmentations to find a color vector C of length N , which meets the following requirements:
C i 1 , K , i 1 , N
max i = 1 N C i = x min i = 1 N C i = y t o l e r a n c e , x , y 1 , K
where tolerance is the maximum acceptable difference between two different sets. Under the conditions above,
m i n i = 1 N j = 1 i A i , j C i C j
Graph partitioning is a classic NP-complete problem, so it is usually difficult to find the optimal solution in a finite time. The current graph partitioning methods mainly include spectral methods, geometric methods, and heuristic methods. Considering the research problem in this thesis, that is, the number of nodes in satellite–UAV-integrated networks is far fewer than that in large-scale networks, it is a good heuristic solution to use the simulated annealing described above.

4. Methodology

Considering satellite–UAV-integrated network visibility, payload computing capacity, maximum link count per satellite, and the total number of communication links, an objective function is formulated to minimize end-to-end delay in satellite networking. To optimize the satellite–UAV collaborative IoT systems topology, we introduce the Graph Partitioning Simulated Annealing (GPSA) algorithm, which combines the graph partitioning and simulated annealing algorithms.
Furthermore, considering the dynamism and temporal nature of this network, the concept of time slices is introduced, enhancing the efficiency of iterative problem-solving.

4.1. Optimization Objectives and Constraints

The core focus of this work lies in constructing and optimizing the topology structure of satellite–UAV-integrated networks to minimize the average end-to-end communication delay for nodes such as satellites and drones while ensuring a high level of network resilience. Assuming a consistent transmission rate of electromagnetic waves in a vacuum, the internode distances can be considered as the end-to-end delay.
To describe the problem abstractly, in time slice s i , an adjacency matrix A ( s i ) is given to represent the graph with N nodes, and a subgraph should be found to minimize the objective function under some restrictions. Suppose the selected visible matrix to be C ( s i ) in time slice s i , ensuring that
min τ s i = 2 N N 1 i = 1 N 1 j = 1 i 1 D e l a c y C s i , v i , v j
An algorithm should be designed to find a subgraph C with distance sum τ ( s i ) as small as possible in the time slice s i , and the running time should be as short as possible. In addition to the dynamic nature of networks, there are other limitations that contribute to the complexity of satellite–UAV-integrated network optimization:
  • For invisible node pairs, it is required that they cannot have links.
  • Due to the limitation of the number of transmitters and receivers on satellites, the number of satellites that can be linked simultaneously with other satellites/drones is limited.
  • Considering the load balancing of the overall network, the total number of links cannot exceed a given value.
  • The internode communication is assumed to be bidirectional by default. For a link from v i to v j , there must be a corresponding edge from v j to v i .
The aforementioned constraints can be formalized as follows:
C i , j = c o m p a r e A i , j , , A i , j < , A i , j =
D e g r e e C v i = i = 1 N C v , i < M a x d e g r e e , v i [ 1 , N ]
E d g e s u m C = i = 1 N j = 1 i C v , i < M a x e d g e
C i , j = C j , i , i , j 1 , N

4.2. Simulated Annealing Optimization Based on Graph Partitioning

It is not easy to handle such a huge central network for satellite–UAV collaborative IoT systems. It is necessary to segment this huge network rationally and reduce the data flow between different parts after segmentation. It is based on this consideration that a novel optimization algorithm proposed is introduced by integrating the GP algorithm with the SA algorithm for satellite–UAV collaborative IoT system topology optimization. GPSA is inspired by the generation method of network maxflow neighborhood [33]. This method is based on the fact that the edges on the minimum cut have a strong influence on the connectivity and invulnerability of the graph. This can be useful in reducing overall computational and hardware complexity. First, graph partitioning can decompose large-scale networks into multiple smaller subnetworks, thus allowing these parts to be computed in parallel on different processing units. It is very useful in distributed computing to reduce computation complexity and increase algorithm-solving efficiency. Second, the load of each subpart is relatively uniform after segmentation, avoiding bottlenecks in the overall performance of the network due to the overloading of certain nodes. Third, the communication overhead between nodes is an important consideration in satellite Internet. By rationally dividing the network, the communication requirements between nodes are reduced so that the sum of link communication costs (bandwidth, etc.) for each part is minimized, thus improving overall performance.
For a given satellite–UAV-integrated network, GPSA uses the idea of divide and conquer to perform graph partitioning, processes them sequentially, and then merges the results, giving priority to cutting edges. Figure 5 is a flow diagram of the GPSA algorithm.
The GPSA algorithm first divides the input graph into partitions by the visual matrix and selects some edges in the set of cut edges to preserve in advance. In this thesis, the number of partitions divided by the graph is 4. For each partition, allocate the maximum number of edges in proportion to the number of interior points in the partition. Then, the visibility matrix and distance matrix of each partition are processed, and the initial solution is inherited from the former time slice and adapted according to the self-adapt method. Afterward, apply a partial SA on each partition given a larger exit threshold. It is worth mentioning that this step can be performed in parallel. When the procedures of all partitions are completed, the solution matrices of the subgraph are mapped back to the solution matrix of the full graph, which are merged with the cut edges selected in advance into a complete initial solution, and then the SA algorithm is applied again on this whole graph initial solution.
The existing works mostly focus on the efficiency (number of iterations) of the iterative process and overlook the situation of the initial solution. However, the structure of the initial solution largely determines the subsequent iterative process. It is an effective way to continuously divide and process the network into smaller and smaller partitions for near-Earth satellite–UAV collaborative IoT systems that may emerge in the future and then merge them step by step into the solution of the entire network.

4.3. Complexity Analysis

Time complexity analysis is a crucial tool for estimating how the efficiency (time) of an algorithm changes as the size of the problem scales. It aids us in gaining a deeper understanding and evaluating the performance of algorithms in practical applications.

4.3.1. Complexity Analysis of the Simulated Annealing Part

The specific running time of a simulated annealing algorithm basically depends on the number of iteration steps. But different solving methods may differ in the convergence speed of the solution. In this work, the convergence speed of the solution can be used to shorten the steps of simulated annealing iterations. Specifically, the visible matrix C is chosen to calculate the average delay between pairs of points as the theoretical optimal solution τ m i n , followed by selecting a numerical value as the exit threshold ρ . The exit threshold ρ is a controllable parameter that balances the quality of the solution and the number of iterations. The simulated annealing process terminates when the convergence rate τ C of the current solution satisfies Equation (14). This approach can effectively reduce the number of iterations.
τ C = ρ × τ m i n
The number of iteration steps of the simulated annealing algorithm only depends on the initial temperature T, the decay rate of each temperature Δ T , and the final exit temperature ε . If K is the total number of iteration steps, then there is
K S A = log Δ T ε log Δ T T
Therefore, the number of iteration steps is a controllable variable. The objective function of the solution is defined as the average delay of the topological network, in other words, the shortest path between all point pairs. The famous Floyd algorithm is designed to solve this problem within O N 3 . The final complexity of the simulated annealing algorithm in this work is O K S A N 3 .

4.3.2. Complexity Analysis of the Graph Partitioning Part

In each iteration, there are mainly two parts: generating new neighborhood solutions and calculating the objective function of the solution. For generating neighborhood solutions, it only needs to randomly select vertexes with different colors, which can be performed in O 1 time. For the other part, to compare the objective function of the solution, the number of adjacent vertexes with the same color should be calculated, which needs O N time to enumerate each adjacent edge. So, the total complexity is O N for a single iteration. It is much faster than the SA algorithm for topology optimization.
Due to the low complexity of a single iteration, the complexity of the GP algorithm changes after several iterations. Consider the time complexity of swapping all vertices u and v in one iteration to be O N 2 . The comparison of objective functions can also be completed within O N 2 time through preprocessing. Noticing that the entropy only decreases without increasing in each iteration and the entropy does not twice exceed the total number of edges, that is, O N 2 (the actual number is far less than this value), so the total complexity does not exceed O N 4 . The final complexity of the graph partitioning algorithm is O K S A N 2 + N 4 .

4.3.3. Total Complexity Analysis

If the original graph is divided into M partitions, then for each partition, the complexity of simulated annealing is O K m u l t i S A N M 3 . Without considering the optimization of parallel operations, the total time complexity is O K m u l t i S A N 3 M 2 . To sum up, without omission, the time complexity of GPSA is
O K S A N 3 + K m u l t i S A N 3 M 2 + K G P N 2 + N 4
The total number of iterations K S A for the main simulated annealing algorithm is greater than the number of iterations K m u l t i S A for partial simulated annealing. The K S A N 3 term is also much larger than the K G P N 2 + N 4 term. Overall, GPSA, like regular simulated annealing, still has the complexity bottleneck of O N 3 . In actual simulations, it also meets theoretical expectations, as shown in the next section.

5. Implementation and Evaluation

The algorithm programs are implemented in C++, with the compiler standard being GNU g++ 14. In order to evaluate the performance of our model, all experiments are run on Intel(R) Core(TM) i5-9300H CPU with 2.40 GHz. The maximum training time for an experiment is limited to 24 h.

5.1. Datasets

The data used for the experiments in this section are generated using the Satellite Tool Kit (STK). STK is a software that can support satellite orbit generation, analysis, and calculation.
  • Iridium. The Iridium constellation, consisting of 66 satellites, is composed of six circular orbits that pass over Earth’s poles. Each orbit plane contains 11 evenly distributed satellites, allowing for global coverage in this configuration.
  • Globalstar. The Globalstar constellation consists of 48 satellites distributed among 8 circular orbits with an inclination of 52 ° . Each orbit plane contains 6 satellites, and none of the Globalstar orbits pass over the poles. Due to the smaller number of satellites in the Globalstar constellation, the satellites are positioned at an altitude approximately twice that of the Iridium constellation to achieve global coverage.
  • 108-Star-Drone. Additionally, in this section, a mega constellation in near-Earth orbit is generated using STK, comprising 96 satellites and 12 drones in formation. The 96 satellites are distributed across 6 orbital planes, with each plane containing 16 satellites, all at an orbit altitude of 550 km. The formation of 12 drones hovers uniformly near the ground.
The main parameters of the three datasets are provided in Table 1.

5.2. Benchmark Methods

  • MIX-SA [34]. Typically, the larger the connectivity of a network, the more stable and invulnerable it is. The size of the minimum cut represents the number of disjoint paths between two nodes in the network. The more disjoint paths there are, the stronger the network’s ability to maintain communication, even if a link fails. Simulated annealing algorithms based on maximum flow minimum cut exchange ensure that the connectivity of the solution is not reduced during each search for a neighboring solution.
  • DLS-SA [13]. Dual-link random switching, as a heuristic local search strategy, is commonly used in combination with simulated annealing algorithms to solve combinatorial optimization problems. Its main idea is to randomly select two paths or links and exchange a portion of them to generate a new solution. This strategy helps to escape from local optima and increases the exploration capability of the search space.

5.3. Parameters and Indicators

The proposed method is influenced by random initial values, and even with multiple experiments conducted on the same dataset, there may be slight deviations in the results. To mitigate these biases and obtain more accurate results, all experimental outcomes are averaged from three repetitions conducted under the same dataset, parameters, and environment. The parameters involved in the experiments are shown in Table 2.
In the practical implementation, we set M a x e d g e = 1.8 N and M a x D e g r e e = 4 . Time slices are divided every 60 s for sampling, and the total number of time slices is set to 100. ρ is set to different values based on data to control the expected optimization rate of the program. Consider the optimization ratio Φ = τ L τ m i n as the optimized scale relative to the theoretical lower bound. τ L denotes the average delay sum of each time slice, τ m i n refers to the average delay sum without restrictions. Consider K to denote the total number of iterations in simulated annealing and T r u n to denote the running time.

5.4. Performance Evaluation

Optimization—Iteration Curve. In order to analyze the superiority of the initial solution of GPSA and subsequent iterations compared with the other two algorithms, a single time slice was taken to plot the optimization indicator Φ curve with respect to the number of iterations t, as shown in the following Figure 6.
From the graph, it can be seen that the initial solution of GPSA is far superior to the other two algorithms, equivalent to approximately 300 iterations of MIX-SA and more iterations of DLS-SA to obtain the solution. At the same time, the initial solution of GPSA is not inferior in convergence speed to the other two algorithms, indicating that the initial solution obtained through GPSA has better guidance for convergence to a more optimal solution.
Efficiency Comparison. In order to compare the actual efficiency of the algorithm operation, the results of testing each algorithm under different data are shown in Table 3, Table 4, Table 5 and Table 6. It can be seen that GPSA has a huge impact on optimizing runtime. In the borderless weight model, the optimization rate of GPSA exceeds 92 % , and the number of iterations also decreases to less than 10 % . This verifies that GPSA outperforms other algorithms in terms of performance.

6. Conclusions

In recent years, space IoT systems represented by satellite–UAV collaborative networks have been developing rapidly. These networks are highly dynamic, with changing distances and visibility among satellites over time. To optimize their topology more efficiently and reliably, a secure algorithm combining graph partitioning and simulated annealing has been proposed. The innovation of this work is that a new optimization path is provided. Instead of opting for neighborhood solution generation and estimation function computation to optimize the problem solution, the number of subsequent iterations is reduced, and the algorithm’s efficiency is improved by constructing a smart initial solution. Introducing time slices to account for the network’s dynamic nature speeds up problem-solving. This algorithm offers improved convergence and performance compared with traditional methods. In addition to serving as a solution for topology optimization, the proposed algorithm introduces a new way of thinking, enabling the handling of larger satellite–UAV collaborative IoT systems.

Author Contributions

Conceptualization, M.Z. and L.L.; methodology, M.Z. and L.L.; software, M.Z. and L.L.; validation, P.Y., Z.T. and Y.F.; formal analysis, P.Y.; investigation, Z.T. and Y.F.; resources, S.Z.; data curation, P.Y.; writing—original draft preparation, M.Z. and L.L.; writing—review and editing, M.Z.; visualization, L.L.; supervision, S.Z.; project administration, P.Y.; funding acquisition, S.Z. and P.Y. All authors have read and agreed to the published version of the manuscript.

Funding

This research was funded by 1. National Natural Science Foundation of China, grant number 62272089. 2. General Program of Science Funding Projects of Sichuan Province, grant number 2022YFG0207. 3. Open project of Intelligent Terminal Key Laboratory of Sichuan Province, grant number SCITLAB-20006. 4. Science and Technology Department of Sichuan Province, grant number 2023YFG0155. 5. Ministry of Industry and Information Technology of the People’s Republic of China, grant number TC2108048.

Data Availability Statement

Data are contained within the article.

Acknowledgments

Thanks to all the authors in the references, it is because of the excellent scientific research you have provided that we have been able to constantly access the most cutting-edge hitting information and learn a great deal of wealth of knowledge and have been able to successfully complete this paper. In addition, the authors are grateful to the editor and anonymous reviewers for their suggestions for improving the quality of the paper.

Conflicts of Interest

The authors declare no conflicts of interest. The funders had no role in the design of the study; in the collection, analyses, or interpretation of data; in the writing of the manuscript; or in the decision to publish the results.

References

  1. Zhuo, M.; Liu, L.; Zhou, S.; Tian, Z. Survey on security issues of routing and anomaly detection for space information networks. Sci. Rep. 2021, 11, 22261. [Google Scholar] [CrossRef] [PubMed]
  2. Chen, X.; Sheng, M.; Li, B.; Zhao, N. Survey on unmanned aerial vehicle communications for 6G. J. Electron. Inf. Technol. 2022, 44, 781–789. [Google Scholar]
  3. Wu, Y.; Feng, S.; Dong, C. Energy Constrained Data Collection in Multi-UAV-Assisted IoT. In Proceedings of the 2023 IEEE 97th Vehicular Technology Conference (VTC2023-Spring), Florence, Italy, 20–23 June 2023. [Google Scholar]
  4. Su, J.; Zhu, X.; Li, S.; Chen, W.H. AI meets UAVs: A survey on AI empowered UAV perception systems for precision agriculture. Neurocomputing 2022, 518, 242–270. [Google Scholar] [CrossRef]
  5. Reiss, M.; Mendes, T.; Pereira, F.; de Andrade, M.R.M.; Mendes, R.M.; Simões, S.J.C.; de Lara, R.; de Souza, S.F. Evaluation of an unmanned aerial vehicle (UAV) for measuring and monitoring natural disaster risk areas. ISPRS Arch. 2022, 43, 1077–1083. [Google Scholar] [CrossRef]
  6. Arafat, M.; Alam, M.; Moh, S. Vision-based navigation techniques for unmanned aerial vehicles: Review and challenges. Drones 2023, 7, 89. [Google Scholar] [CrossRef]
  7. Wu, Y.; Feng, S.; Dong, C.; Wang, W. Shooting utility maximization in UAV-assisted wireless camera sensor networks. Sensors 2022, 22, 3685. [Google Scholar] [CrossRef]
  8. Yang, S.; Feng, S.; Yu, H.; Zhang, S.; Cao, C.; Lin, W. UAV Assisted Outdoor Visible Light Positioning with Intelligent Ambient Light Noise Elimination. In Proceedings of the International Conference on Internet of Things, Communication and Intelligent Technology, Xuzhou, China, 22–24 September 2023. [Google Scholar]
  9. Tan, Y.; Li, G.; Cai, R.; Ma, J.; Wang, M. Mapping and modelling defect data from UAV captured images to BIM for building external wall inspection. Autom. Constr. 2022, 139, 104284. [Google Scholar] [CrossRef]
  10. Tao, F.; Qi, Q. Make more digital twins. Nature 2019, 573, 490–491. [Google Scholar] [CrossRef]
  11. Tian, Z.; Zhuo, M.; Liu, L.; Chen, J.; Zhou, S. Anomaly detection using spatial and temporal information in multivariate time series. Sci. Rep. 2023, 1, 4400. [Google Scholar] [CrossRef]
  12. Zhuo, M.; Huang, W.; Liu, L.; Zhou, S.; Tian, Z. A High-Utility Differentially Private Mechanism for Space Information Networks. Remote Sens. 2022, 14, 5844. [Google Scholar] [CrossRef]
  13. Yan, H.; Zhang, Q.; Sun, Y. Link assignment problem of navigation satellite networks with limited number of inter-satellite links. Acta Aeronaut. Astronaut. Sin. 2015, 36, 2329–2339. [Google Scholar]
  14. Shi, L.Y.; Xiang, W.; Tang, X.M. A link assignment algorithm applicable to crosslink ranging and data exchange for satellite navigation system. J. Astronaut. 2011, 32, 1971–1977. [Google Scholar]
  15. Dong, M.; Lin, B.; Liu, Y.; Zhou, L. Topology dynamic optimization for inter-satellite laser links of navigation satellite based on multi-objective simulated annealing method. Chin. J. Lasers 2018, 45, 0706004. [Google Scholar] [CrossRef]
  16. Song, W.; Yang, D. Research on GNSS Satellite-ground Service Information Transmission Scheduling Method Based on Inter-satellite Link. Acta Armamentarii 2019, 40, 1627. [Google Scholar]
  17. Zhou, Y.; Xie, Z.; Liu, P.; Liu, H. Inter-satellite load balancing routing algorithm for LEO satellite constellation based on regional-traffic-detour. J. UCA 2021, 38, 687. [Google Scholar]
  18. Dong, F.H.; Lv, J.; Gong, X.W.; Li, C. Optimization design of structure invulnerability in space information network. J. Commun. 2014, 35, 50–58. [Google Scholar]
  19. Han, Z.; Xu, C.; Zhao, G.; Wang, S.; Cheng, K.; Yu, S. Time-Varying Topology Model for Dynamic Routing in LEO Satellite Constellation Networks. IEEE Trans. Veh. Technol. 2022, 72, 3440–3454. [Google Scholar] [CrossRef]
  20. Wu, L.; Cui, P.; Pei, J.; Zhao, L.; Guo, X. Graph neural networks: Foundation, frontiers and applications. In Proceedings of the 28th ACM SIGKDD Conference on Knowledge Discovery and Data Mining, Washington, DC, USA, 14–18 August 2022. [Google Scholar]
  21. Jiang, W. Graph-based deep learning for communication networks: A survey. Comput. Commun. 2022, 185, 40–54. [Google Scholar] [CrossRef]
  22. Li, H.; Yang, S.; Song, Y.; Luo, Y.; Li, J.; Zhou, T. Spatial dynamic graph convolutional network for traffic flow forecasting. Appl. Intell. 2023, 53, 14986–14998. [Google Scholar] [CrossRef]
  23. Veličković, P. Everything is connected: Graph neural networks. Curr. Opin. Struct. Biol. 2023, 79, 102538. [Google Scholar] [CrossRef] [PubMed]
  24. Schatzoff, M.; Tsao, R.; Wing, R. An experimental comparison of time sharing and batch processing. Commun. ACM 1967, 10, 261–265. [Google Scholar] [CrossRef]
  25. Huang, J.; Su, Y.; Liu, W.; Wang, F. Optimization design of inter-satellite link (ISL) assignment parameters in GNSS based on genetic algorithm. Adv. Space Res. 2017, 60, 2574–2580. [Google Scholar] [CrossRef]
  26. Li, J.; Li, H.; Liu, J.; Lai, Z.; Wu, Q.; Wang, X. A Timeslot Division Strategy for Availability in Integrated Satellite and Terrestrial Network. In Proceedings of the 2021 IEEE Wireless Communications and Networking Conference (WCNC), Nanjing, China, 29 March–1 April 2021. [Google Scholar]
  27. Kirkpatrick, S.; Gelatt, C.D., Jr.; Vecchi, M.P. Optimization by simulated annealing. Science 1983, 220, 671–680. [Google Scholar] [CrossRef] [PubMed]
  28. Zhou, Y.; Xu, W.; Zhou, M.; Fu, Z. Bi-Trajectory Hybrid Search to Solve Bottleneck-Minimized Colored Traveling Salesman Problems. IEEE Trans. Autom. Sci. Eng. 2023, 21, 895–905. [Google Scholar] [CrossRef]
  29. Vincent, F.Y.; Susanto, H.; Jodiawan, P.; Ho, T.W.; Lin, S.W.; Huang, Y.T. A simulated annealing algorithm for the vehicle routing problem with parcel lockers. IEEE Access 2022, 10, 20764–20782. [Google Scholar]
  30. Zhuo, M.; Yang, P.; Chen, J.; Liu, L.; Liu, C. Adaptive Optimization of Dynamic Heterogeneous Network Topologies: A Simulated Annealing Methodology. In Proceedings of the Artificial Intelligence and Security: 8th International Conference, Qinghai, China, 15–20 July 2022. [Google Scholar]
  31. Kassaymeh, S.; Al-Laham, M.; Al-Betar, M.A.; Alweshah, M.; Abdullah, S.; Makhadmeh, S.N. Backpropagation Neural Network optimization and software defect estimation modelling using a hybrid Salp Swarm optimizer-based Simulated Annealing Algorithm. Knowl.-Based Syst. 2022, 244, 108511. [Google Scholar] [CrossRef]
  32. Rahimian, F.; Payberah, A.H.; Girdzijauskas, S.; Jelasity, M.; Haridi, S. A distributed algorithm for large-scale graph partitioning. ACM Trans. Auton. Adapt. Syst. 2015, 10, 1–24. [Google Scholar] [CrossRef]
  33. Lee, D.S.; Rieger, H. Maximum flow and topological structure of complex networks. Europhys. Lett. 2005, 73, 471. [Google Scholar] [CrossRef]
  34. Cormen, T.H.; Leiserson, C.E.; Rivest, R.L.; Stein, C. Introduction to Algorithms; MIT Press: Cambridge, MA, USA, 2022. [Google Scholar]
Figure 1. The satellite–UAV collaborative IoT systems scenario. Schematic diagram of the integration of satellites and drones in the Internet of Things. Compared with satellite remote sensing, drones can more accurately observe crop growth and natural disasters and model the construction of buildings (BIM).
Drones 08 00044 g001
Figure 2. The time-varying dynamic satellite–UAV-integrated network is abstracted into a graph structure. In a more abstract view, the network forms a graph with undirected edges, in which the distances between node pairs in graph theory are equal to the transmission delays between satellites.
Drones 08 00044 g002
Figure 3. Equal interval time slice model. The equal-time interval slice partitioning method divides time into equal periods and captures network snapshots at the beginning of each period.
Drones 08 00044 g003
Figure 4. An illustration of edge-cut. The color of a vertex represents which partition it belongs to. The gray links are interpartition edges and colored links are edges inside a partition: (a) shows a poor partitioning while (b) is good, as the vertexes are assigned into highly connected groups.
Drones 08 00044 g004
Figure 5. A flow diagram of simulated annealing optimization based on graph partitioning.
Drones 08 00044 g005
Figure 6. Curve of optimization indicator. (a) Φ t curve of unweighted iridium. (b) Φ t curve of weighted iridium. (c) Φ t curve of unweighted Globalstar. (d) Φ t curve of weighted Globalstar.
Drones 08 00044 g006
Table 1. The main parameters of the three constellation datasets.
Orbital ParametersIridiumGlobalstar108-Star-Drone
Orbital altitude (km)1414780550
Orbital inclination 52 ° 86.3 ° 60 °
Number of orbital866
Number of satellites in a single orbit61116
Polar constellationNonpolarPolarNonpolar
Table 2. List of Parameters.
ParametersRangeDescription
N 48/66/108The number of satellites.
W 1/0The edges are weighted or unweighted.
S [ 1 , 100 ] Number of time slices to be processed.
M a x e d g e [ N 1 , N ( N 1 ) 2 ] Restriction of sum of links.
M a x d e g r e e [ 3 , 5 ] Restriction of degree for each satellite.
ρ Depends on the distribution of the dataExit threshold for simulated annealing.
Table 3. Efficiency Comparison with unweighted Iridium ρ = 1.5 (Sum in 100 Time Slices).
AlgorithmGPSAMIX-SADLS-SA
Iterations Count K S A 10511,11934,044
Runtime T r u n 0.5247.57012.474
Optimization Indicator Φ 1.45451.49471.4924
Table 4. Efficiency Comparison with weighted Iridium ρ = 1.03 (Sum in 100 Time Slices).
AlgorithmGPSAMIX-SADLS-SA
Iterations Count K S A 5998695317,605
Runtime T r u n 2.4362.5624.164
Optimization Indicator Φ 1.02821.02991.0298
Table 5. Efficiency Comparison with unweighted Globalstar ρ = 1.7 (Sum in 100 Time Slices).
AlgorithmGPSAMIX-SADLS-SA
Iterations Count K S A 249882,95244,369
Runtime T r u n 0.5087.0346.925
Optimization Indicator Φ 1.68971.69951.6963
Table 6. Efficiency Comparison with weighted Globalstar ρ = 1.16 (Sum in 100 Time Slices).
AlgorithmGPSAMIX-SADLS-SA
Iterations Count K S A 51,37073,645199,869
Runtime T r u n 4.99711.67319.164
Optimization Indicator Φ 1.13841.14581.1616
Disclaimer/Publisher’s Note: The statements, opinions and data contained in all publications are solely those of the individual author(s) and contributor(s) and not of MDPI and/or the editor(s). MDPI and/or the editor(s) disclaim responsibility for any injury to people or property resulting from any ideas, methods, instructions or products referred to in the content.

