1. Introduction
The underwater realm presents unique challenges that can impede the practical progress of mechatronics engineering. For example, these challenges encompass communication difficulties with the surface, the unavailability of GPS data, diminished sensor effectiveness and durability due to increasing pressures and restricted light at depth, a frequent lack of comprehensive knowledge about uncharted operational zones, and difficulties induced by unpredictable currents. In this demanding environment with scant information, adaptive capability stands out as a pivotal feature in underwater mechatronics engineering. It bolsters the decision-making autonomy of autonomous agents, enabling them to adjust their actions based on real-time, in situ information.
In this context, underwater agents must adeptly gather pertinent data about their surroundings or target, maximizing their utility to realize mission objectives. Unlike terrestrial robotics where targets are usually visible or tangible, in underwater scenarios the precise location of the target, whether it is a thermocline, hydrothermal vent, dispersing oil plume, or migrating phytoplankton, may remain uncertain owing to lack of precise positioning information, both in terms of present location and its location over time. Consequently, underwater agents are typically equipped with an array of sensors and computational systems capable of processing and analyzing incoming data in real time or close to real time, ensuring they can swiftly derive information and act upon their sensory inputs. These adaptive responses not only enhance mission reliability but also significantly elevate the likelihood of successful outcomes.
Some AUV-based adaptive methodologies and strategies have been developed for diverse underwater scenarios and tested by several researchers for various underwater targets. For thermocline tracking, Zhang et al. [
1] have developed an autonomous algorithm focusing on detecting and tracking thermoclines by monitoring the maximum vertical temperature gradient. Cruz and Matos [
2] introduced a reactive behavior approach for AUVs to adapt their depth in real time to remain near the thermocline, improving sampling efficiency. Moving to oil plume delineation, Jakuba et al. [
3] reported on the use of AUVs to investigate subsea hydrocarbon plumes and emphasized the coordination of AUVs with conventional instruments. Kukulya et al. [
4] addressed the need for reliable detection of environmental hazards in the Arctic using AUVs equipped with commercial off-the-shelf sensors for under-ice oil detection. Their study highlighted the importance of near real-time data transfer and first responder training. Shifting to chemical plume tracing, Camilli et al. [
5] explored integrating analytical sensors on AUVs to improve data assimilation and adaptive operation, using a seabed submersible for methane source identification. Farrell et al. [
6] focused on olfactory-based AUVs for chemical plume tracing, demonstrating success in tracing chemical plumes in turbulent oceanic flows. Li et al. [
7] presented a behavior-based adaptive mission planner for AUVs to trace chemical plumes accurately, using various sensors and behaviors inspired by moths’ pheromone tracking. More recently, ref. [
8] focused on understanding the long-term variability of natural hydrocarbon seeps, employing a multimethod approach combining in situ camera observations and acoustic and satellite sensing to connect hydrocarbon seep characteristics, while [
9] proposed an adaptive sampling strategy using multiple autonomous underwater vehicles (AUVs) and a Gaussian process model. Their proposed heterogeneous strategy cooperative sampling method allowed them to reduce error in the estimate of chlorophyll concentration by 15.6% with limited communication. In terms of target tracking purpose, ref. [
10] presented a subsumption architecture implemented as behaviors in a finite-state machine and showcased successful detecting and tracking of an Arctic (ice) front in the Trondheimsfjord. Another tracking example comes from work conducted by [
11], who proposed a novel detection and tracking method for thermoclines. Utilizing the sense, plan, and act control method and online evaluation, a successful coverage observation of a dynamic water column with multiple thermoclines was demonstrated through field tests in the South China Sea. The work described in [
12] combined underwater robotic sampling with ocean models proposing a stochastic spatial–temporal proxy model of mine tailings discharge in the sea. Their model was built based on a Gaussian process and enabled the selection of informative sampling sites. Their strategy successfully adapted the robot’s path based on in situ data, optimizing the mapping of tailings distributions. An adaptive sampling strategy [
13] for AUVs was developed to explore and map ocean gradients, using a hexagonal grid path. The hexagonal grid discretized the survey area and prioritized the strongest gradients within the AUV’s spatiotemporal envelope. Their method, validated in a river front, embraced intelligent sensing and enhanced resource efficiency. Additional illustrative examples prior to 2019 can be identified in the literature review [
14], specifically related to adaptive sampling techniques, as well as the detection and tracking of underwater targets, employed in AUVs. These studies collectively contribute to AUV-based adaptive strategies for tracking thermoclines, delineating oil plumes, and tracing chemical plumes in diverse underwater environments, offering valuable insights for autonomous underwater exploration and research.
In this project, the anticipated target from natural seepage was a mixed-phase oil plume comprising discrete oil droplets and methane gas bubbles suspended in the water column. The primary objective of this research is to validate our autonomously developed system, designed to adaptively respond to its surrounding environment through real-time measurements. Additionally, we aim to modify the mission task by enhancing decision autonomy. The underlying assumption, substantiated by empirical evidence, is that in the absence of sufficient knowledge about the target—specifically, petroleum hydrocarbon—and its whereabouts, we can effectively delineate the oil plume. This, in turn, enables us to determine the most logical location for water sampling. To enhance detection accuracy, the vehicle was fitted with a scanning sonar (Ping360) and fluorometers (UviLux: polyaromatic hydrocarbons (PAH) unit and Chromophoric Dissolved Organic Matter (CDOM) unit), positioned atop the vehicle. Each sensor was designated to detect a distinct characteristic of the oil plume. The team developed an adaptive sampling method encompassing three sequential modules. Utilizing real-time sensor data, the AUV selects and executes these modules adaptively. The system underwent successful validation during a 2023 North Atlantic mission near the natural hydrocarbon seeps adjacent to Scott Inlet, Baffin Bay, Canada. Six missions were planned and executed, resulting in the retrieval of four water samples from varied depths of 0 m, 20 m, and 200 m.
2. Methodology
2.1. Equipment
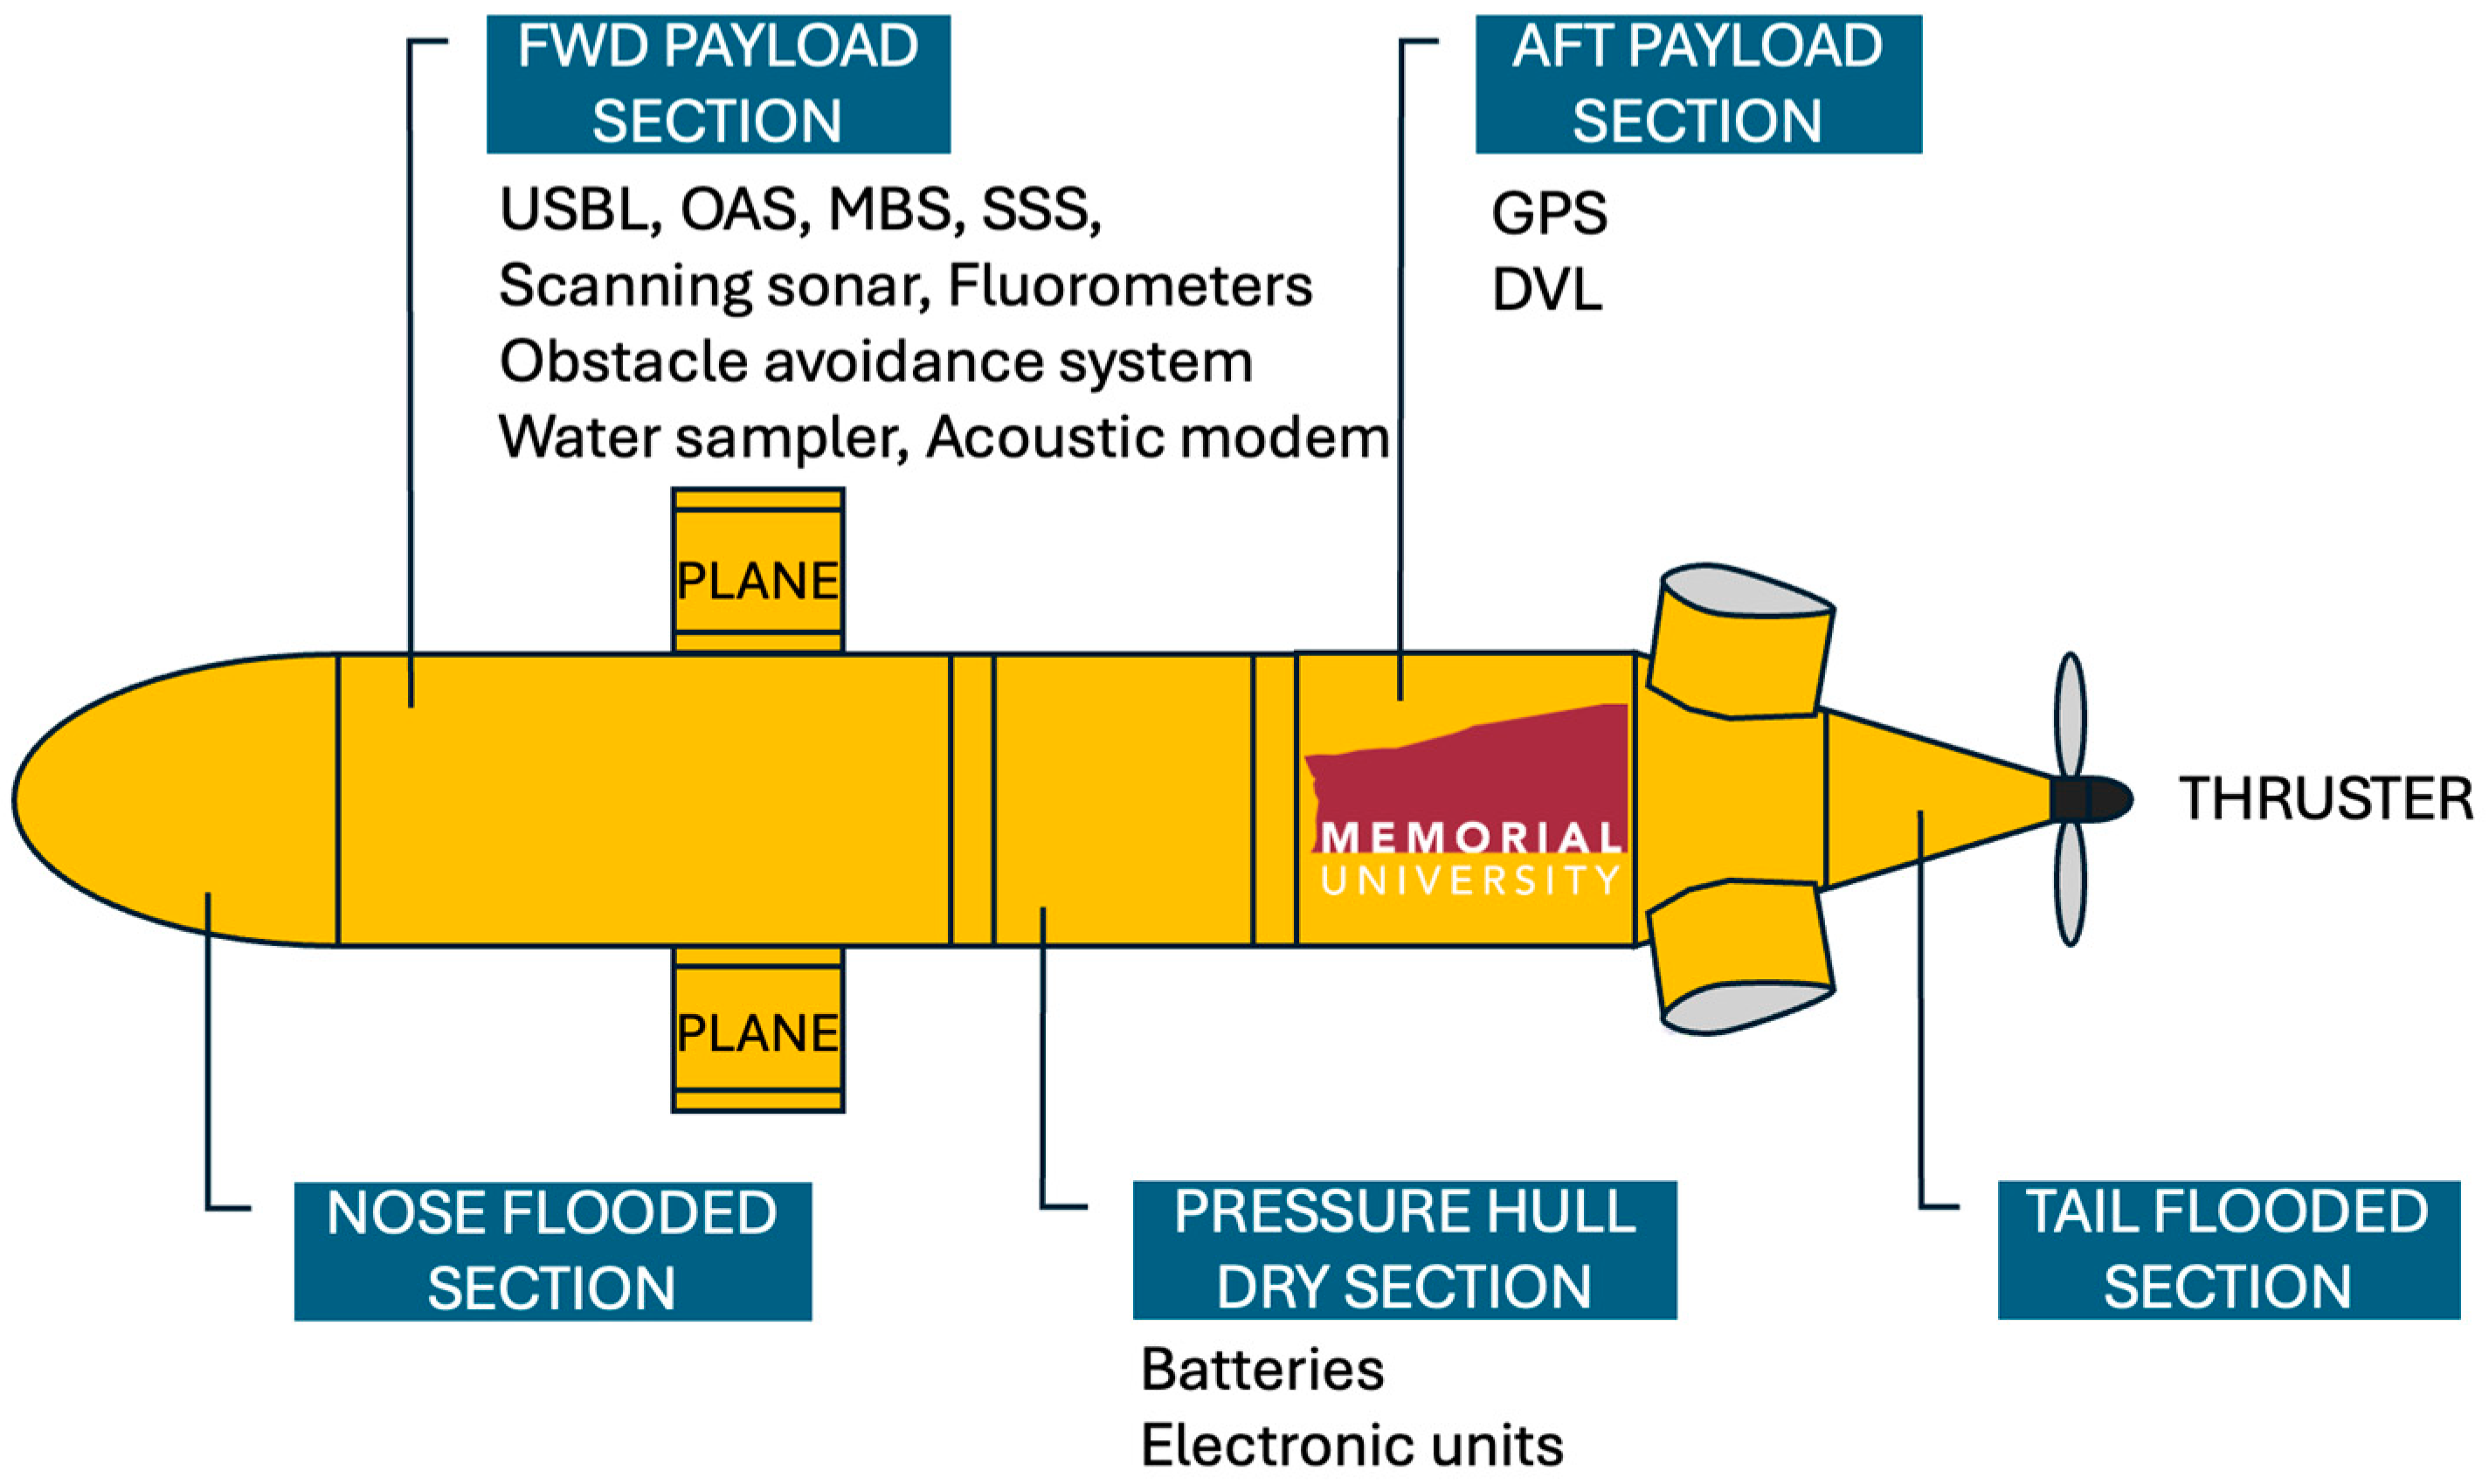
Memorial University’s Explorer AUV is a modular autonomous underwater vehicle, designed and manufactured by International Submarine Engineering, with a torpedo shaped main body, nose cone and tapered tail (See
Figure 1). The pressure hull is made of a specific aluminum alloy to enable the depth pressure rating to be achieved and it protects the components that need waterproofing such as the batteries and electronic units. The free-flooding sections (forward and aft of the pressure hull) are made of glass reinforced plastic and contain the actuators (planes and thruster), navigation sensors (depth, doppler velocity log and obstacle avoidance sonar), communication and location devices (acoustic modem, GPS, USBL) and payload sensors (scanning, multibeam, and side scan sonars).
While the AUV was in operation, the vehicle could communicate with the surface control computer (SCC) through several means: radio telemetry (when on the surface), underwater acoustic telemetry (when underwater) and an ethernet link (when on the deck).
Table 1 shows the specification of the AUV.
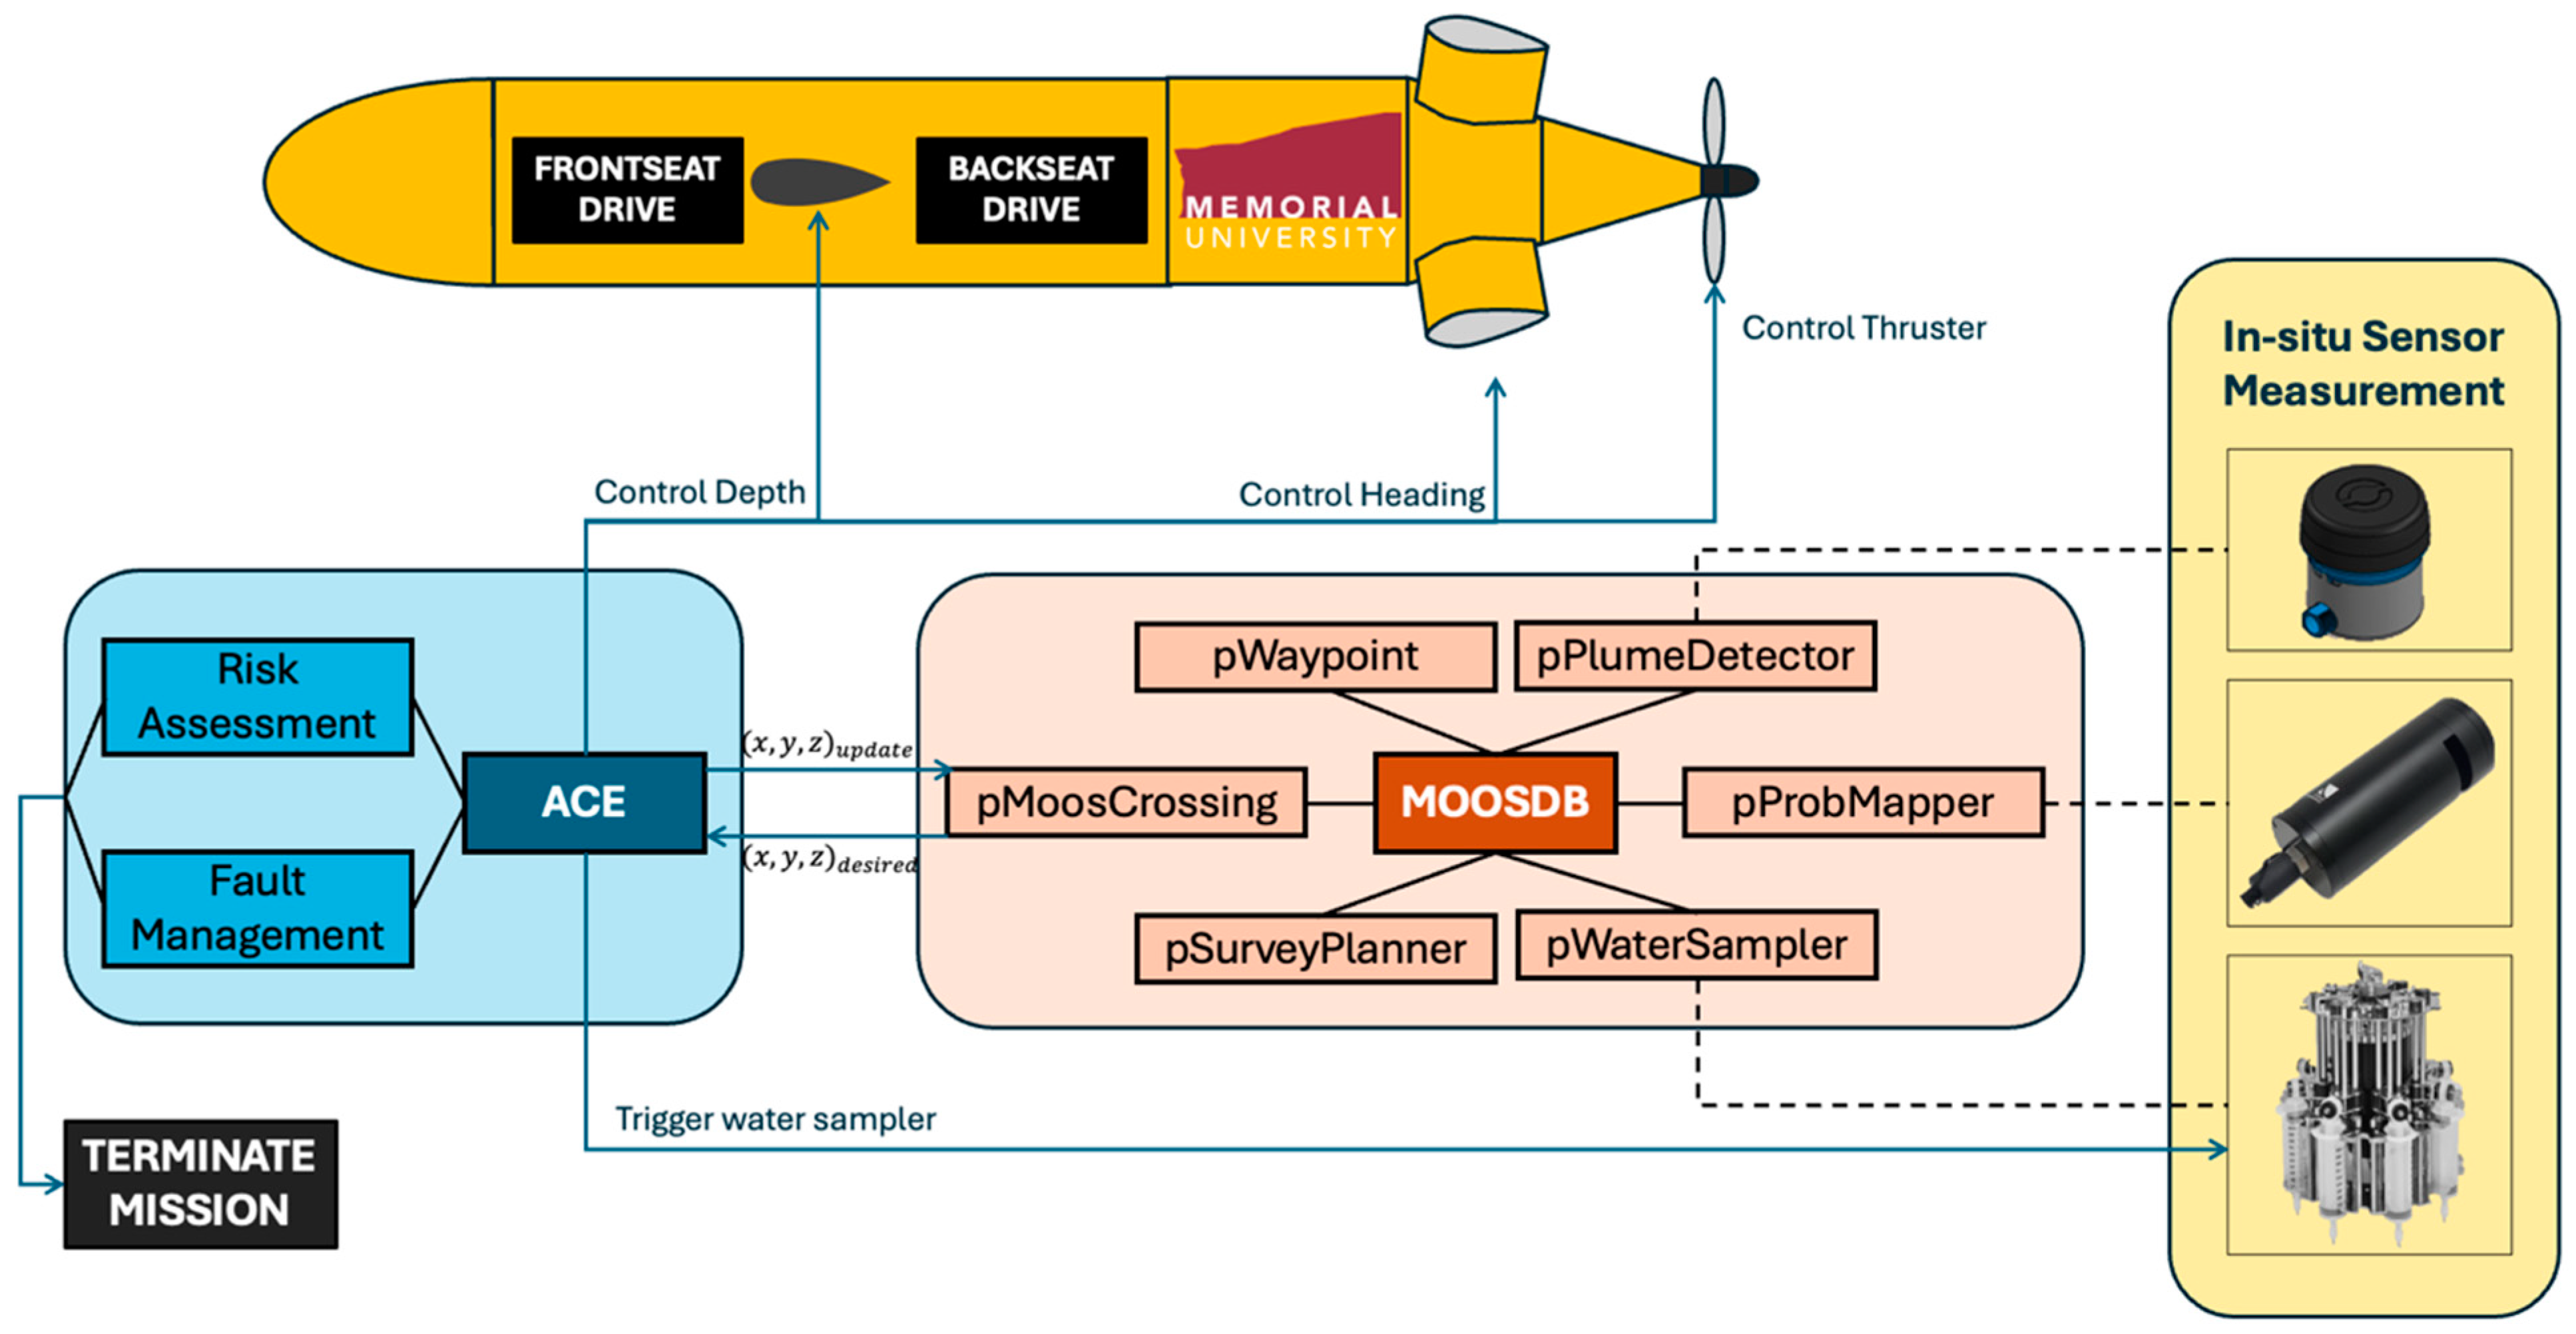
The Memorial AUV incorporates two key computer components in its operation, known as the Frontseat Drive and the Backseat Drive, both playing crucial roles in guiding and maneuvering the vehicle throughout the mission. The Backseat Drive autonomously makes decisions regarding the next target location based on real-time sensor measurements and generates corresponding commands. Meanwhile, the Frontseat Drive assumes the responsibility of evaluating these commands, primarily with safety considerations in mind, and then takes control of the actual vehicle motion, including adjustments to heading and depth. This division of responsibilities between command generation (Backseat Drive) and control execution (Frontseat Drive) in AUV operations offers several advantages. It enables the accommodation of varying real-time requirements by decoupling specific system components, allowing for flexibility in software implementation, facilitating the addition and modification of submodules at each level due to an independent data processing mechanism, and ensuring operational safety by enabling double checking of commands generated by the Backseat Drive and the ability to activate or deactivate override modes in accordance with safety regulations set by the Frontseat Drive.
We implemented the Missions Oriented Operating Suite (MOOS-IvP), an open-source system designed to function as a Backseat Drive system. This system was executed from a payload computer (PCC–the Backseat Drive), which received updates about the vehicle’s motion, including position, heading, and speed, from the main vehicle computer (VCC), the Frontseat Drive. Subsequently, the PCC generated the desired vehicle parameters, such as heading, depth, and speed, and relayed them back to the VCC. This closed-loop system ensures that every autonomous decision is made based on the most recent measurements acquired from the payload sensors. The AUV control architecture, as described, is visually represented in
Figure 2.
The vehicle was equipped with an array of detection and collection instruments, including a scanning sonar (Ping360 of BlueRobotics), two fluorometer units–CDOM and PAH (UviLux of Chelsea Technologies), and a water sampling unit (multi water sampler of KC-Denmark). The Ping360 operates at a frequency of 750 Hz and has a maximum range of 50 m. In our previous published research we conducted tests comparing various sonar frequencies to assess their performance in detecting oil droplets [
15]. Our findings indicated that higher frequency sonars exhibited superior detection capabilities for the smaller oil droplets. However, the decision on sonar frequency involves a trade-off that considers factors such as affordability, depth rating, updating speed, compatibility with the AUV’s operating system, and physical constraints like weight and size.
In preparation for field trials, we conducted simulation and tank tests to assess the acoustic features of different sized bubbles and the detection capacity of different sonars. This work extended our previous research, where we extensively examined three different sonars, each with a distinct frequency, against oil droplets and gas bubbles in a wave tank, along with micro air bubbles (100 to 500 microns) in a local lake [
15]. Additionally, we conducted further tests using the Ping360 sonar against micro air bubbles (<100 microns) in an open ocean setting [
16], and in a towing tank against micro air bubbles (100 to 250 microns) [
17]. These tests assessed the detection capability and performance of the selected sonar in capturing micro air bubbles, closely resembling the acoustic features of oil droplets.
The size range of methane bubbles and oil droplets from natural oil seepage varies across different seep locations and over time. However, a study conducted at one of the hydrocarbon seeps [
8] has provided insights into the observed sizes. According to the findings, the average bubble/droplet diameter was observed to be 9.0 ± 1.4 mm.
The fluorometers are designed to measure fluorescence concentration, with a detection limit of 600 ppb. The multi water sampler was composed of eight syringes, each of which could be filled by external water pumped through a hose system. An actuator, controlled by the PCC computer, mechanically operated the syringe plungers. Our payload sensors integrated with the vehicle are shown in
Figure 3.
2.2. Three-Module Sequence
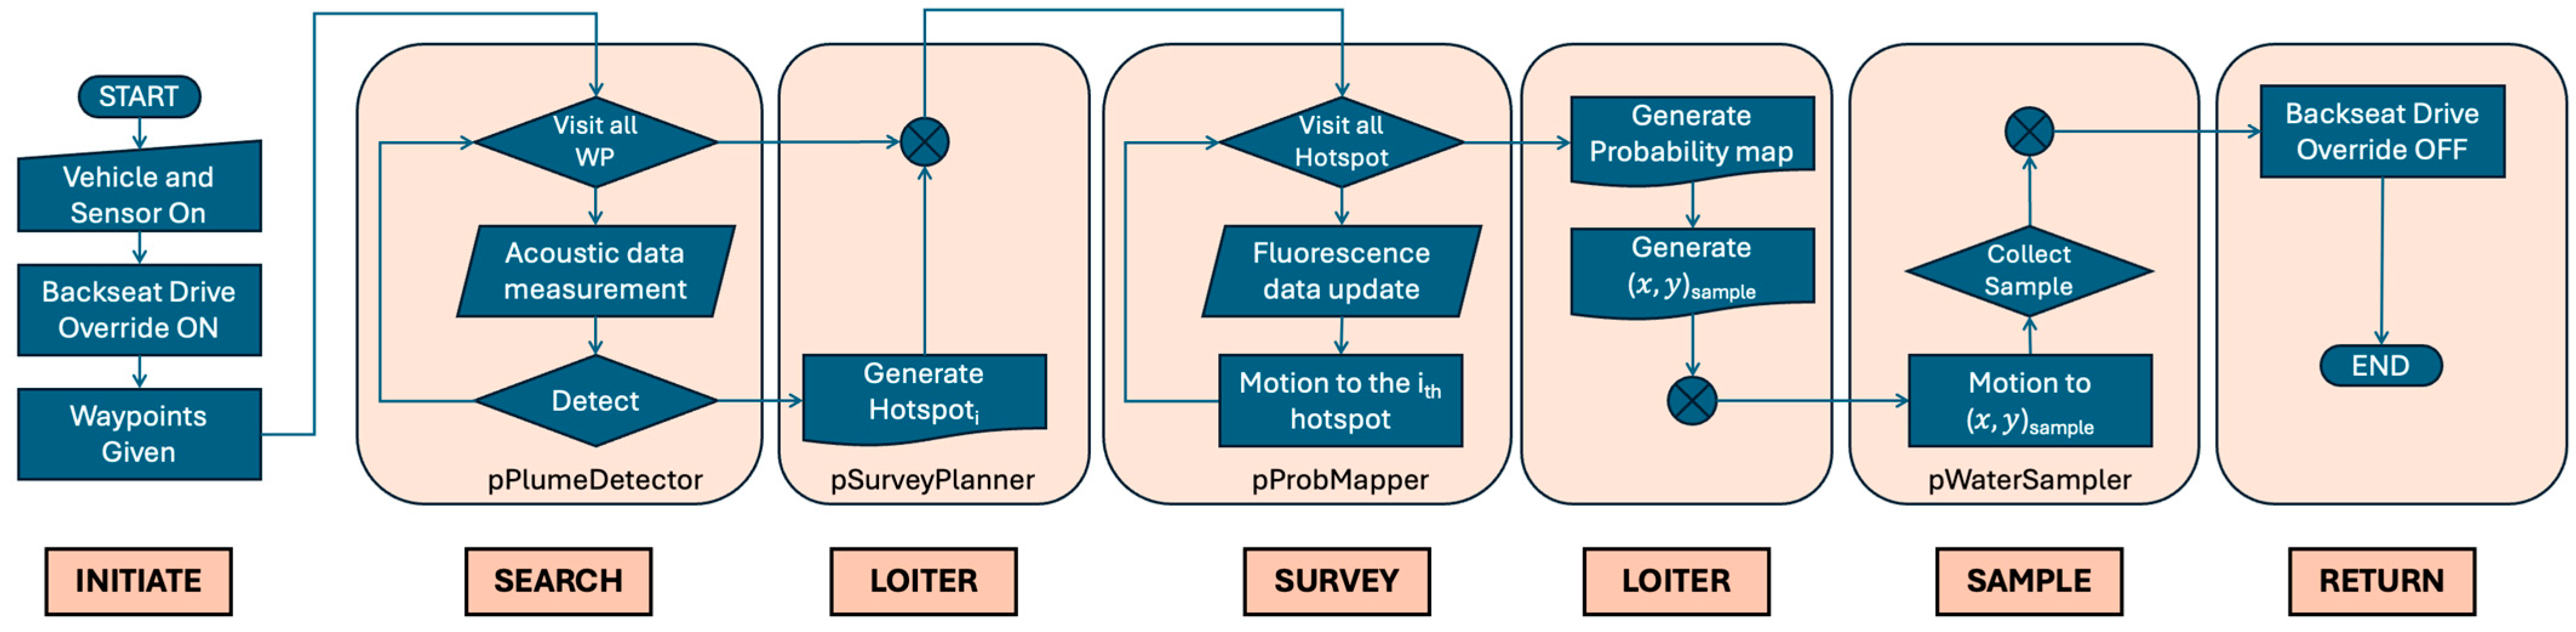
Within the Backseat Drive mission plan, we incorporated three distinct modules: Search, Survey, and Sample. These modules can function independently as standalone missions, but their flexibility enables their sequential combination to align with specific mission objectives. In this mission, we designed these modules to operate synergistically, with the completion of one mission task by a module triggering the activation of another, facilitated by the real-time collection and analysis of data.
The Search module initiates the mission by employing the sonar system to scan a wide region on either side of the AUV’s path, following designated waypoints. In the mission described in this paper, its primary goal was to pinpoint the presence of a vertical hydrocarbon stream. Analysis of the collected acoustic data was intended to enable the identification of regions with high hydrocarbon potential, and the relevant information would then be transferred to the subsequent module. The Survey module, triggered by data from the Search module, was designed to guide the AUV back to these pinpointed zones. During this phase, the UviLux fluorometer continuously measured the fluorescence concentration, confirming the presence of hydrocarbons along the route. Once the hydrocarbon presence is validated, the Sample module becomes active. It deploys a multi water sampler, capable of obtaining seawater samples (8 × 100 mL) from each location authenticated by the Survey module. Our method relies on three modular blocks of algorithms, each designed for compatibility. While these modules are presented sequentially in our study, it is important to recognize their capacity to function independently. We opted for a sequential structure, deeming it the most effective approach for an AUV operating in real time without prior data.
In addition to these three modules, the MOOS mission framework incorporated two additional modes: Loiter and Return. These modes provide further flexibility in the mission. The resulting mission architecture is illustrated in
Figure 4, which shows the designed Backseat Drive (MOOS) architecture with its various modes, including SEARCH, SURVEY, SAMPLE, LOITER, and RETURN (See
Figure 4). This multimode approach was intended to adapt the AUV system to address a range of mission objectives.
2.3. MOOS Applications
The MOOS framework also incorporated four applications developed by our team for this work. They were designed to complement and support the various modules: pPlumeDetector, pSurveyPlanner, pProbMapper, and pWaterSampler.
The pPlumeDetector application plays a critical role while the Search module is active. It continuously analyzes each scanned image collected by the Ping360 sonar, actively searching for acoustic signal peaks. The plume is recognized as a dense group of points within the sonar data, following a sequence of five steps:
Range-Gating: This initial step involves zeroing out data within the range of the sonar head, which typically contains significant noise.
Segmentation: The dataset is partitioned into background data and positive detections. A sample is considered a detection if its intensity exceeds 25% of the sonar’s full-scale range.
Image Creation: In this step, the sonar data is downsampled while preparing for the computationally expensive clustering process.
Clustering: The clustering process identifies high-density groups of detection pixels in the image, categorizing them as clusters while discarding outliers as noise. The density-based spatial clustering of applications with noise (DBSCAN) algorithm [
18] was utilized for this purpose.
Geo-Referencing: The final step transforms the cluster center positions from image (pixel) coordinates to local (eastings, northings) coordinates.
At the conclusion of the Search module, the pSurveyPlanner application comes into play by generating a new set of waypoints to guide the AUV to its next task.
Another critical application in our approach is
pProbMapper which utilizes kernel density estimation (KDE) for forecasting the probability density distribution of underwater fluorescence. KDE, as described by Fotheringham, et al. [
19], is a technique that estimates the weighted density of an event across a gridded surface by applying a spatial filter. This method is particularly effective in detecting concentrated hotspots based on point data, making it ideal for our spatial exploration analysis and visualization of chemical distributions. Moreover, KDE facilitates the visualization of regions with higher concentrations of underwater hydrocarbons [
20], aligning perfectly with our objective in these missions of understanding the distribution of fluorescence in Baffin Bay.
The general form of the two-dimensional kernel density estimator, expressed in Equation (1) following the work of Xie and Yan [
21], serves as the foundation for our methodology. This function is employed to estimate the distribution of PAH by incorporating real-time PAH sampling data as input weights. The resulting outputs are mapped surfaces that convey the probability density of the PAH distribution across the mission region. In Equation (1),
where
represents the density estimation at location
with a group of points
,
is the bandwidth of the KDE,
is the number of observations, and
is the distance between each point
and the location
. The Gaussian kernel function, as shown in Equation (2),
following [
22], is employed in this study for its effectiveness in estimating the KDE. This robust approach ensures that our
pProbMapper effectively generates coordinates for water sampling based on fluorescence data collected during the survey module.
In conjunction with
pWaterSampler, our system validates the fluorescence values at the sampling location, ensuring they remain sufficiently high to trigger the sampler. The survey pattern, configured in the shape of a lawnmower, is complemented by the utilization of a large bowtie search pattern and a small bowtie sampling pattern. This combination enhances our capability to thoroughly study and sample underwater environments, such as those in our missions in Baffin Bay (See
Figure 5).
To fortify our adaptive system’s capabilities, we implemented a Backup Opinion Strategy (BOS) as a contingency plan to address potential limitations during the Search module, particularly when the Ping360 sonar was active yet unable to detect any sign of a hydrocarbon plume. The ideal mechanism would involve the Search, Survey, and Sample sequential operation. However, in the event the Search module does not produce results for transmission to the Survey module, potentially due to a lack of plume detection, the system transitions to the BOS. This alternative approach involves subscribing to the next best opinion from the fluorometer data, ensuring that data collection remains ongoing throughout all active modules and missions. Rather than terminating the mission and surfacing, losing the opportunity to further survey and sample, the Survey module takes in the second opinion based on the continuous fluorometer data. This BOS serves as a pragmatic solution to maximize the mission’s efficiency while the vehicle is at depth. By integrating real-time data from the fluorometer, the adaptive system maintains adaptability and resilience, ensuring that valuable information is continuously gathered and utilized, even in scenarios where traditional detection methods may face challenges. This strategic approach underscores the system’s versatility and its commitment to optimizing hydrocarbon or other marine pollutants exploration and sampling efforts in dynamic underwater environments.
3. Simulation
This section describes the simulation results of two key applications: pPlumeDetector and pProbMapper. Also described is the successful validation of the pPlumeDetector through real-world trials conducted in Holyrood Bay, NL, Canada, using a micro air bubble plume; used as an environmentally friendly proxy for an oil plume. Subsequently, the section progresses to describe the pProbMapper application, providing a view of its simulation results and highlighting how it serves as a tool in preparing for field trials.
3.1. pPlumeDetector
The
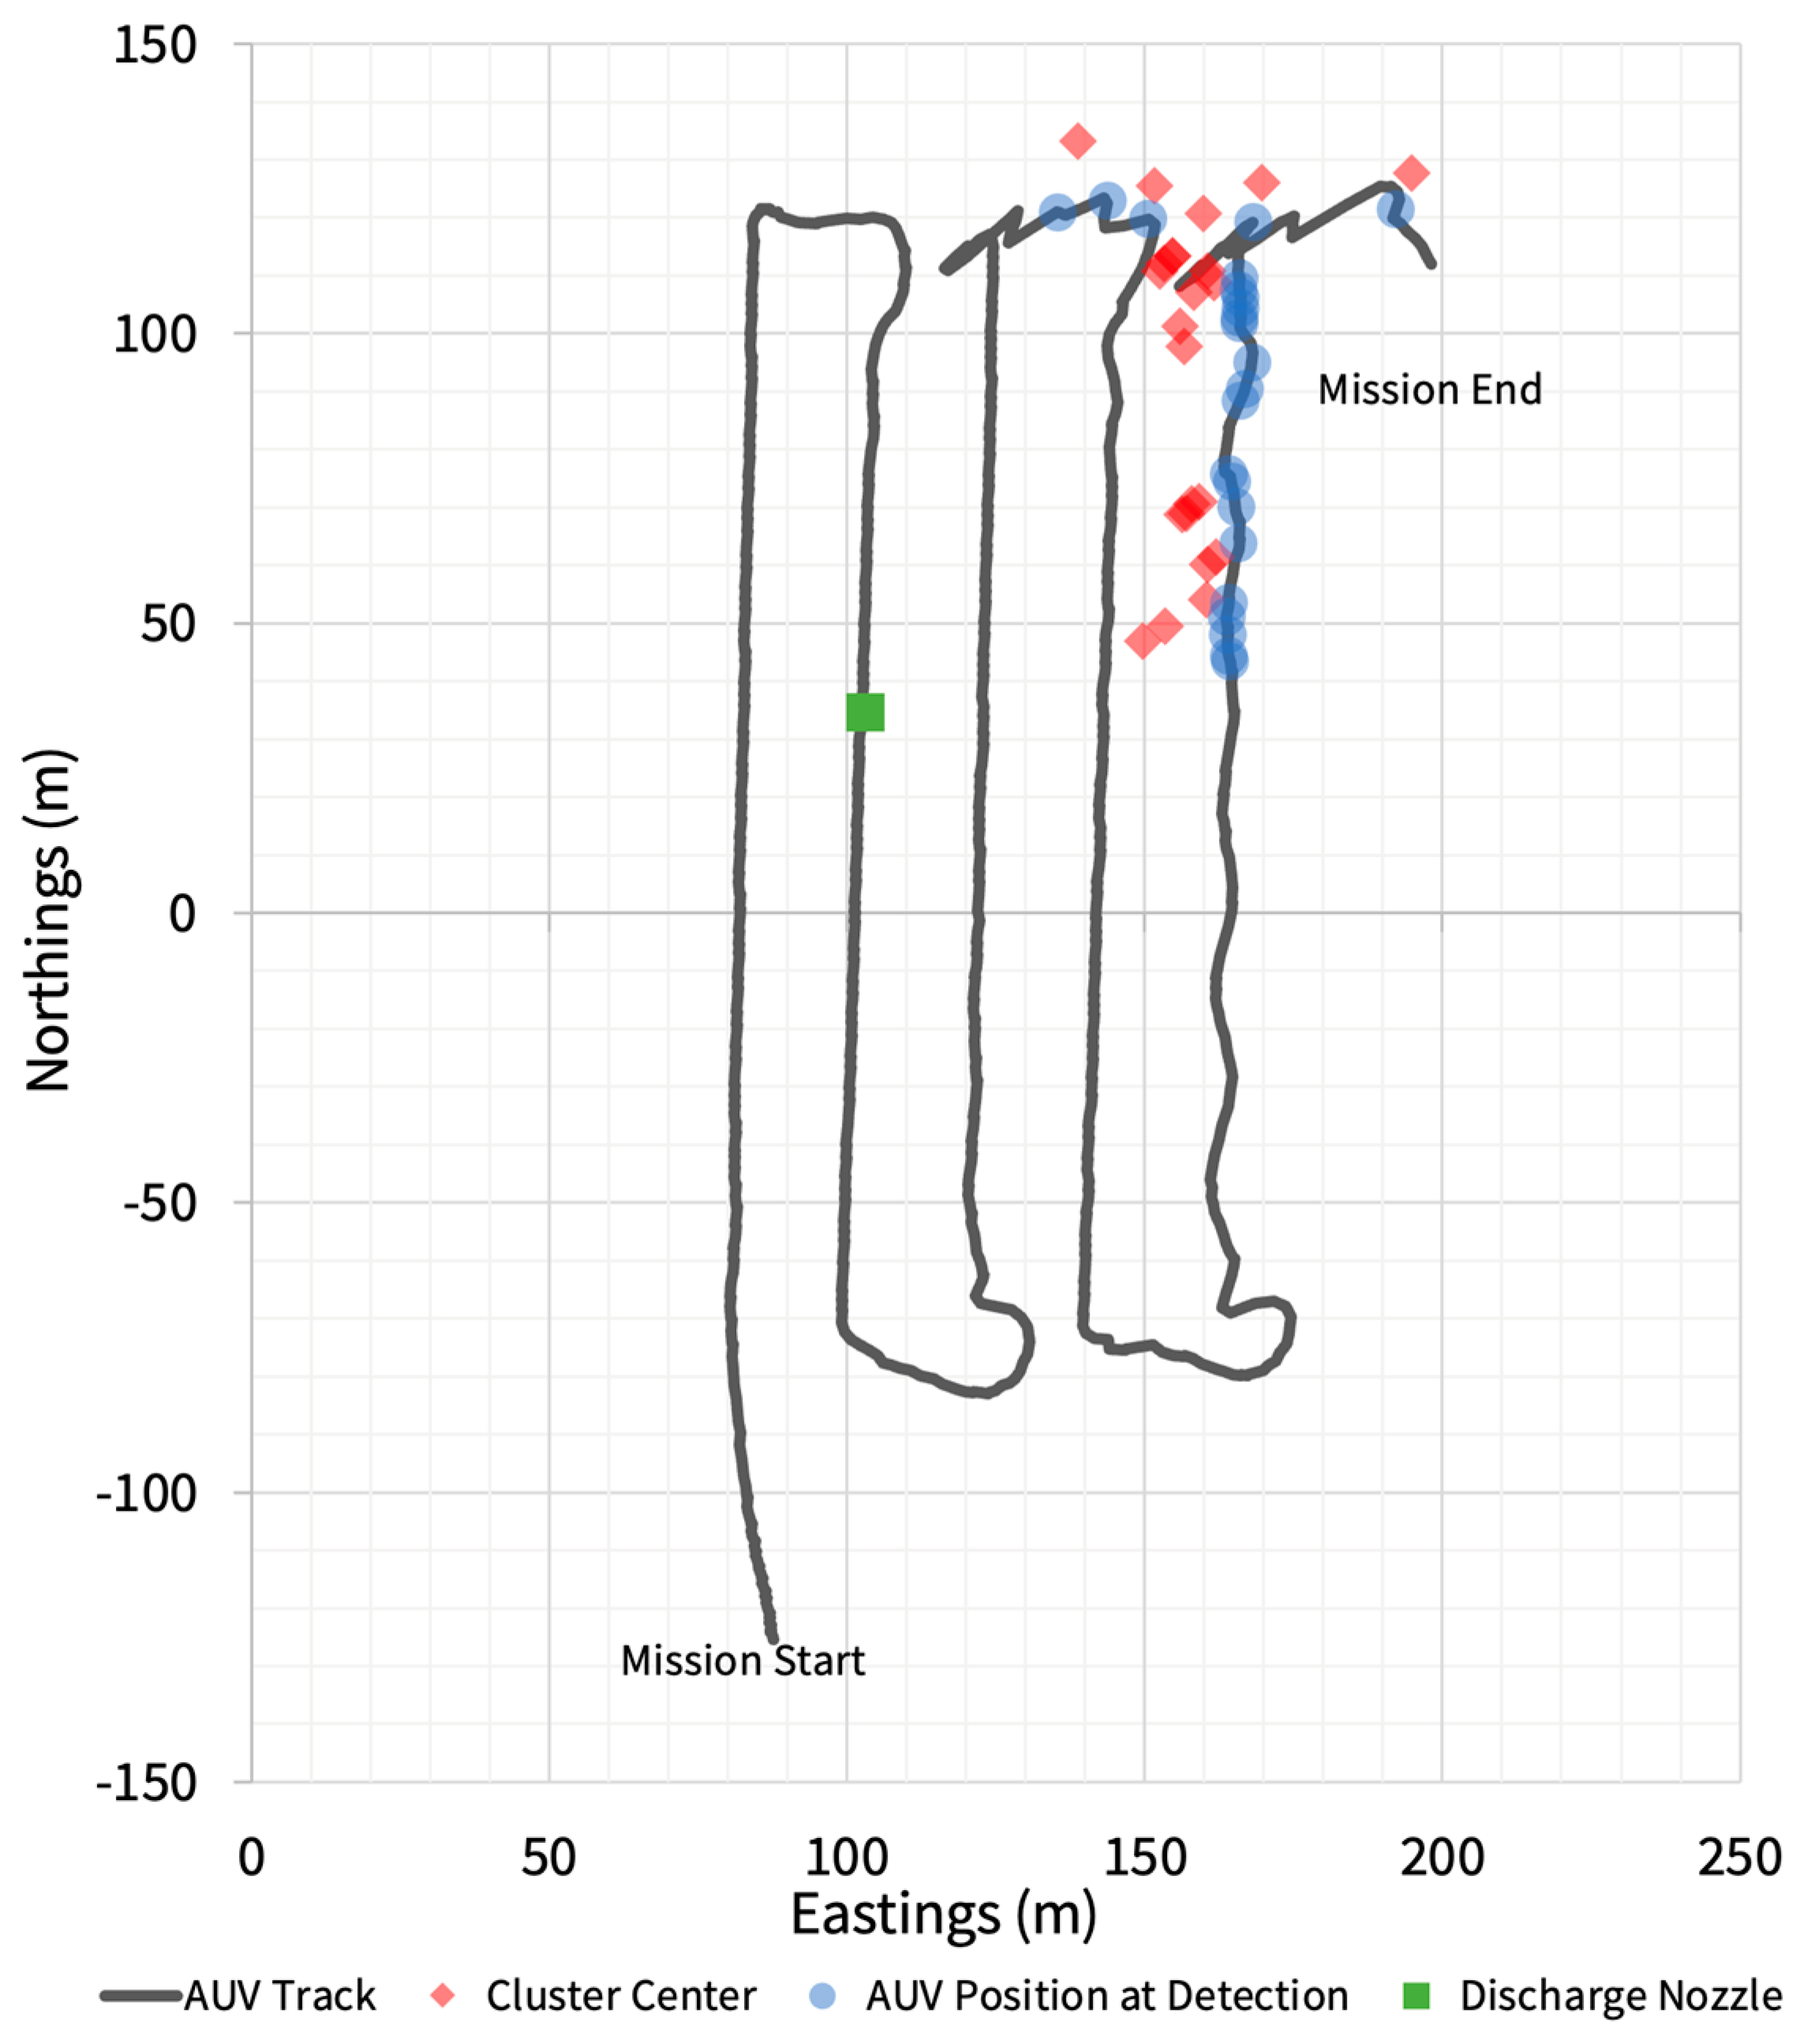
pPlumeDetector was validated using trials data collected at Holyrood Bay, NL, Canada. The trials were designed to collect acoustic data of a micro air bubble plume, which was used as an acoustically similar, environmentally friendly proxy for an oil plume. The plume was created by a bubble generator [
16], and the Explorer AUV executed a lawnmower mission around the generator’s submerged discharge nozzle. The Ping360 scanning sonar mounted on the Explorer AUV continuously scanned a 120
0 sector on the port side of the vehicle during the mission. Logs containing the sonar data and the AUV’s pose were replayed to generate the proposed plume detection algorithm’s output.
The
pPlumeDetector successfully identified high-density features in several scans of the sonar data during the playback test. A visualization of the algorithm’s processing steps for a single sector scan is provided in
Figure 6a–c, showing the high-resolution input, range-gated sonar data, and segmented sonar data, respectively. These images are created for illustration purposes only and are not generated by the algorithm. The downsampled image in
Figure 6d, however, is created by the algorithm. DBSCAN identified four high-density clusters in this image, and the pixels belonging to each cluster are labelled with a unique colour in
Figure 6e. Each grey circle in
Figure 6f indicates the computed center and radius of the encompassed cluster.
A summary of the algorithm’s output is provided in
Figure 7, where sequentially detected cluster centres, found by using this approach, are plotted alongside the AUV’s track line during the mission.
3.2. pProbMapper
The pProbMapper was also validated using trials data collected at Holyrood Bay, NL, Canada. Within the study area, PAH data were collected using the onboard UviLux sensor on the Explorer AUV, which served as the basis for the KDE analysis. The UviLux outputs the PAH reading in quinine sulphate units (QSUs) at each update interval. The PAH dataset comprises both the PAH readings and their corresponding spatial coordinates, along with the Explorer’s navigational paths, making it well-suited for assessing the spatial distributions of PAH probability densities. The grid size of the KDE in this study was defined as 200 × 200. This unitless figure refers to the resolution of data points in KDE analysis. The choice of this grid size was based on the requirements of the KDE analysis to effectively represent the spatial distribution of data points.
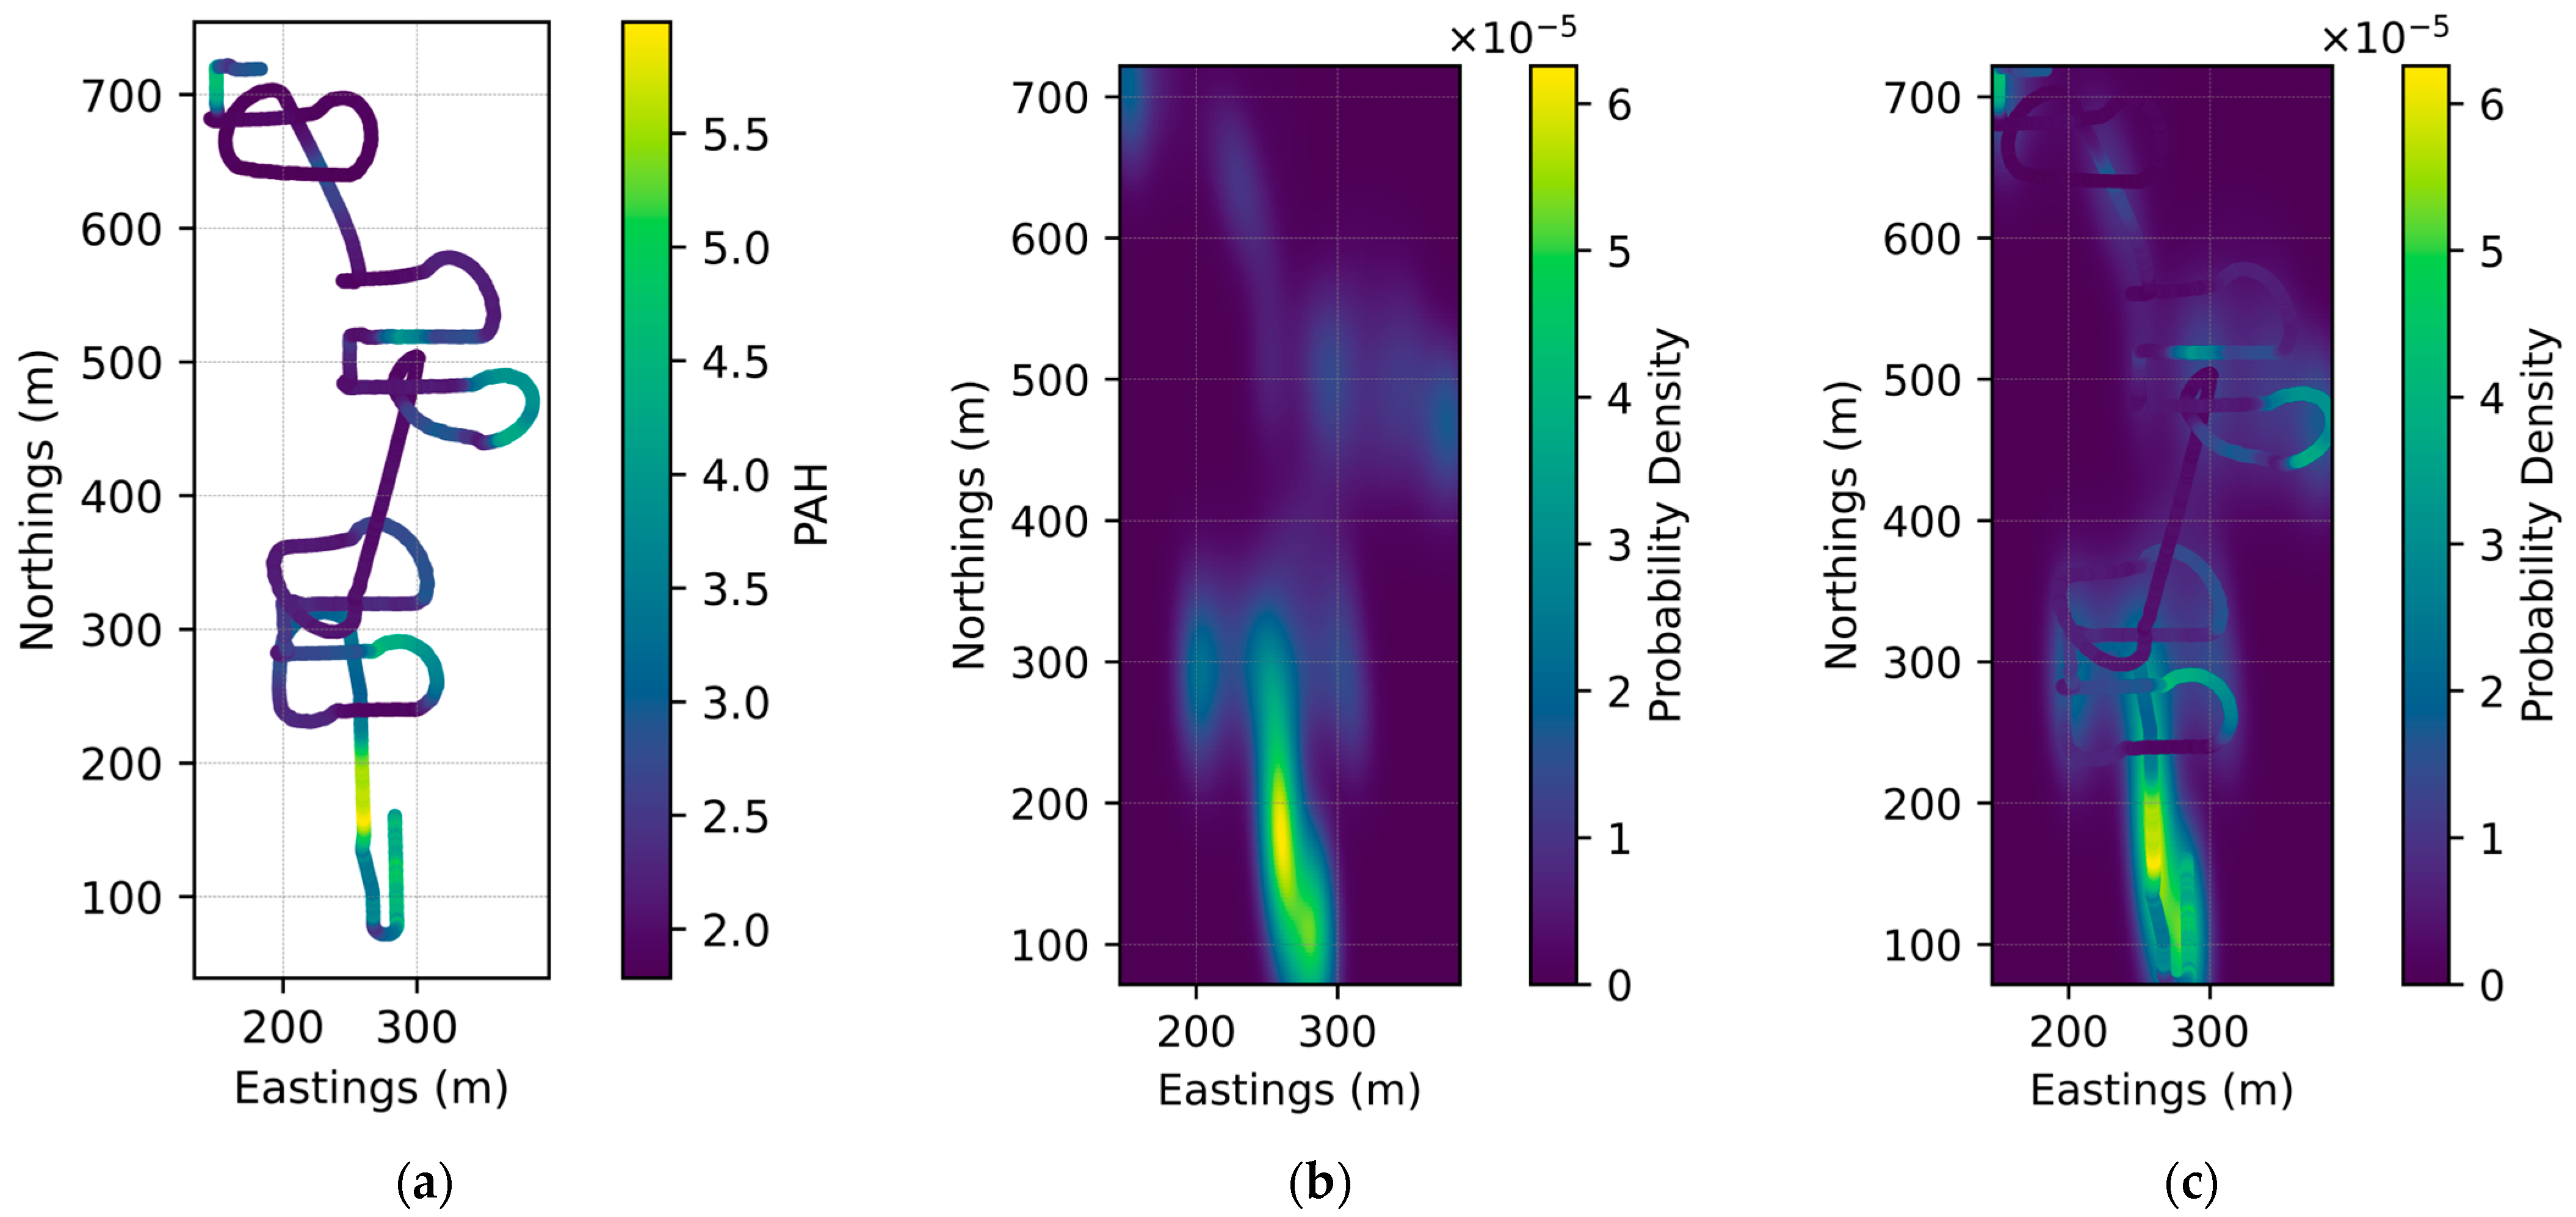
Figure 8 presents the results of the first playback test.
Figure 8a illustrates the real-time PAH measurement along the vehicle’s path waypoints, depicted in a scatter plot format. The colour gradient represents the range of PAH readings, with bright yellow indicating the highest PAH level and dark blue the lowest. In this track, the peak PAH reading was sampled at the location of (260 m, 161 m).
Figure 8b shows the predicted probability density map using the KDE, while
Figure 8c represents a composite map where
Figure 8b serves as the foundational background layer and
Figure 8a is superimposed as the upper layer.
Figure 8b,c reveal that the gradient colour scale delineates the estimated probability density from low density in dark blue to high density in bright yellow. The results indicated that the predicted density varied markedly, especially near waypoints with high PAH readings where the predicted density was also higher. Conversely, around the waypoints with lower PAH readings, the predicted densities were notably reduced. The highest predicted probability density was pinpointed at the location of (260 m, 166 m), which is 5 m from the real-world highest PAH reading at (260 m, 161 m). This proximity highlights the KDE’s efficacy, as the predicted hotspot closely aligns with the actual areas exhibiting high fluorescence, validating the model’s accuracy in PAH hotspot prediction.
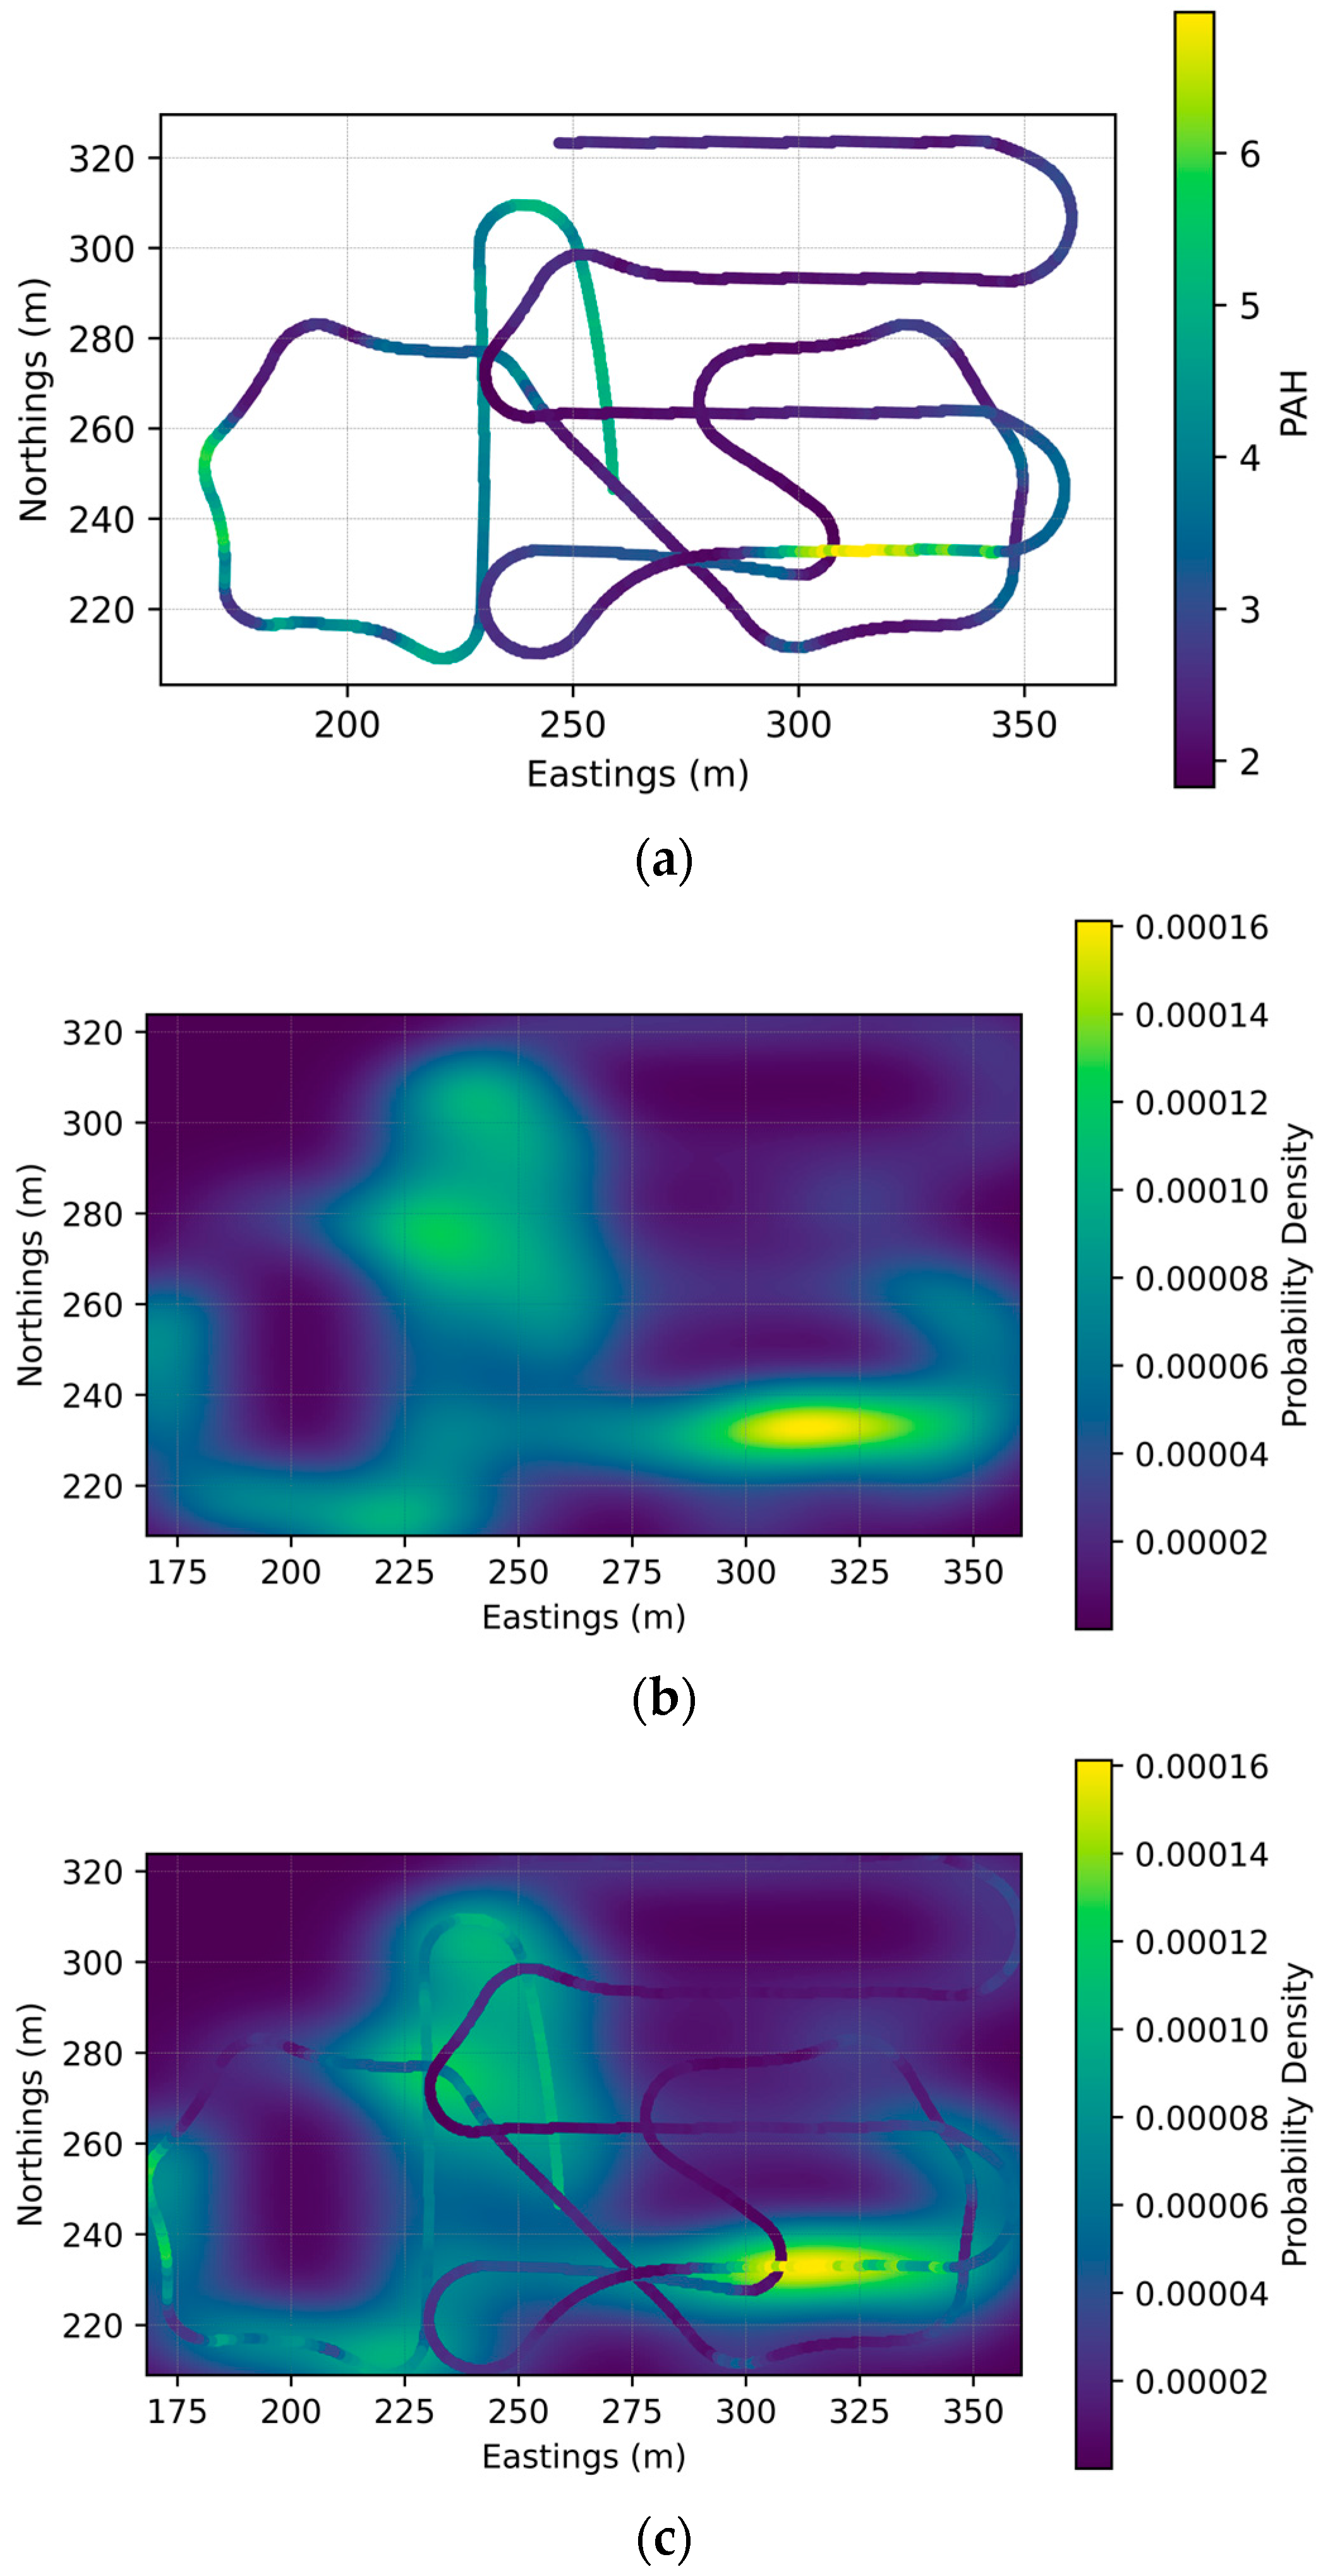
The results of the second playback test are shown in
Figure 9, which is similar to
Figure 8. Within
Figure 9a, the peak PAH reading was observed at the coordinates (310 m, 232 m), whereas the predicted highest probability in
Figure 9b was located at (314 m, 232 m). The distance bias between the two coordinates is 4 m. Additionally, the composite visualization in
Figure 9c also exhibited a high correlation between regions of intense fluorescence and the estimated hotspot locations.
The playback test results illustrate that the KDE effectively transforms a dot pattern into a continuous surface, providing an enhanced representation of potential fluorescence distributions. This facilitates the detection of potential hotspots with higher levels of PAH. The simulation demonstrates that the predicted hotspots using the KDE are significantly consistent with the actual regions with high PAH measurement.
4. Field Trial
4.1. Experimental Set-Up
We executed experiments at two chosen locations within the region of the natural oil and gas seep site near Scott Inlet in Baffin Bay [
23]. These site selections were made with the aim of providing a comprehensive representation of environmental conditions and potential impact zones (See
Figure 10). The main offshore site, positioned approximately 20 nautical miles offshore in the region of known seeps [
24,
25], presented an open ocean setting, offering unique challenges and environmental conditions. In contrast, one of these locales, namely the Qurlurnilikuluk fjord, offered a relatively sheltered water environment. We used this site to retest our AUV operations when inclement weather prevented operation at the offshore site. The GPS coordinates marking the boundaries of these two regions can be found in
Table 2.
Our research foundation is rooted in a systematic review of past investigations, commencing with Loncarevic and Falconer’s 1976 reports on natural petroleum seepage [
26,
27]. Subsequent studies, including the analysis of petroleum residues and the geological terrain by Levy [
28,
29,
30], MacLean [
31], MacLean [
32], and the review authored by MacLean, et al. [
33], have significantly contributed to our understanding of this unique environment. The exploration, which culminated in the 1985 Pisces IV submersible expedition [
25], provided crucial confirmation of the existence of natural oil seeps, and unveiled the presence of potential petroleum source rocks within the region. In a contemporary context, the year 2018 witnessed the pioneering work of [
23], who undertook an exhaustive interdisciplinary examination of microbiology and benthic ecology in the Scott Inlet region. Their research unraveled the intricate interplay between hydrocarbon seepage, the benthic biota, and microbial communities in this unique ecosystem, thereby revealing the indispensable role of seep communities in the complex dynamics of Arctic methane cycling. Rooted in the rich legacy of this region, our primary objective was to substantially enhance and validate the capabilities of our autonomous system. The focus of our mission was directed towards advancing the efficiency and precision of tools utilized for detecting marine hydrocarbons in this dynamic and unique ecosystem.
4.2. Support Vessel and LARS System
We utilized the 32 m long research vessel from the Greenland Institute of Natural Resources, (R/V) Sanna, as our dedicated support vessel (See
Figure 11). The R/V Sanna is named after the Inuit mythological figure Sassuma Arnaa, or Zedna, who is known as the Mother of the Ocean. Equipped with two wet laboratories, one dry laboratory, a chemical laboratory, a cold laboratory, and an −80 °C freezer, the ship provided the versatility required for our mission tasks. The stern deck featured essential equipment such as the A-frame winches, crane, and a capstan, which played a pivotal role in efficiently moving the vehicle from/to the wet laboratory to the deck, facilitating the AUV’s launch and recovery processes. In particular, the wet laboratory served as a dedicated space for AUV repair, especially when the pressure hull needed to be opened for maintenance, a task that it was possible to complete even under adverse weather conditions. Meanwhile, the second wet laboratory was utilized by our team for various purposes, housing essential equipment and tools for mission preparation, predive checks, and other necessary tasks. This multifaceted setup of the R/V Sanna provided us with the capability and flexibility essential for the success of our research, ensuring continued AUV operations even in challenging conditions. The launch and recovery system (LARS) utilized for this mission was developed and built by Memorial’s Technical Services, following a design from the University of Southern Mississippi and the University of Tasmania, as referenced in [
34]. It was installed on the deck of the R/V Sanna, significantly enhancing the effectiveness of our AUV deployment and retrieval operations.
The launching and recovery procedure of the AUV involved a systematic sequence of steps to ensure the safe and effective deployment and retrieval of the vehicle. To initiate the launching process, the ship’s A-Frame was connected to the LARS ramp through a cable and a crossbeam (See
Figure 11). This connection formed a secure link that would facilitate the controlled movement of the AUV. The A-frame and associated winch were used to lift the frame slightly. A windlass winch and chain system attached to the LARS was used to extend the upper moving frame of the LARS over the aft of the vessel, while periodically adjusting the position of the A-frame and the height of the LARS. This positioning was critical in preparing the AUV for deployment and ensuring a smooth transition from the ship to the water. For the final stage of the launching process, the ship’s A-frame winch was employed to lower the A-frame and, subsequently, the LARS winch was utilized to carefully lower the AUV into the water. During this descent, a pin on the LARS winch wire was strategically released, allowing for a controlled and swift release of the AUV. This synchronized operation ensured a smooth transition of the AUV from the ship to the water, harnessing the force generated by the controlled descent for an efficient and timely deployment. The AUV, propelled by its short descent down the LARS, swiftly transitioned to a floating position in the water, fully prepared to commence its mission.
On return and upon reaching the surface, the operator remotely triggers the pop-up buoy of the AUV. Subsequently, the nose rope connected to the pop-up buoy is hooked and drawn toward the ship. After the vehicle is positioned behind the ship and aligned with the LARS, the recovery process unfolds in a reversed sequence. This includes the systematic retrieval of the AUV, ensuring a controlled return to the ship. These procedures were essential to the success of the AUV missions and the safety measures involved in each launch and recovery operation.
4.3. Mission Design
In the planning phase preceding the field trials, the mission plan was structured to serve dual purposes: ‘Stand-alone module tests’ and ‘Adaptive missions’, each contributing to the overarching goal of assessing the robustness and adaptability of the system (see
Table 3).
The ‘Stand-alone module tests’ were formulated to subject each individual module—Search, Survey, and Sample—to rigorous evaluation. Distinct mission patterns, including lawnmower, bowtie, and zigzag, were incorporated into these tests to ensure a thorough examination of the isolated functionality and operational conditions of each module. These tests assessed the independent performance of the modules, crucial for identifying potential strengths and weaknesses. Simultaneously, the ‘adaptive missions’ were conceived to assess the interaction and data transfer capabilities between the modules. These missions were divided into two categories: dual module tests and a full comprehensive mission involving all three modules. The adaptive missions aimed for real-world scenarios, testing the system’s ability to transition between modules while ensuring the coherent transfer of data.
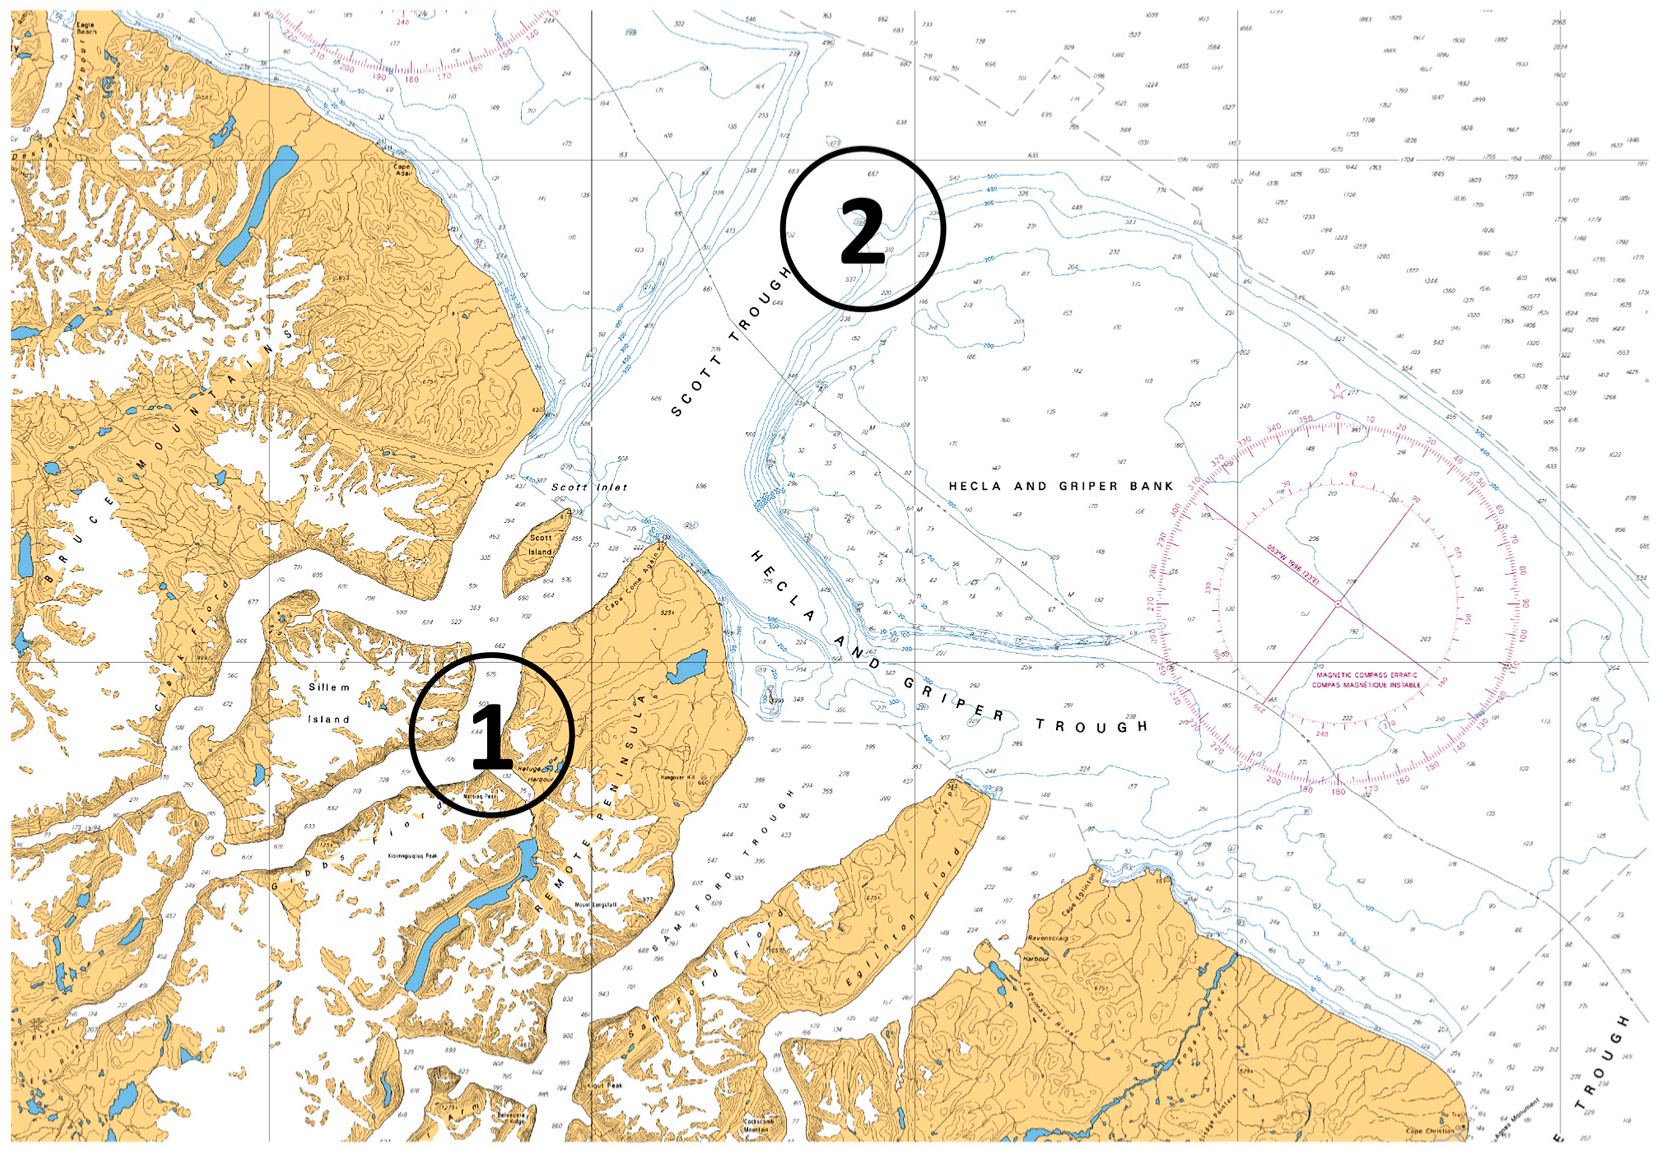
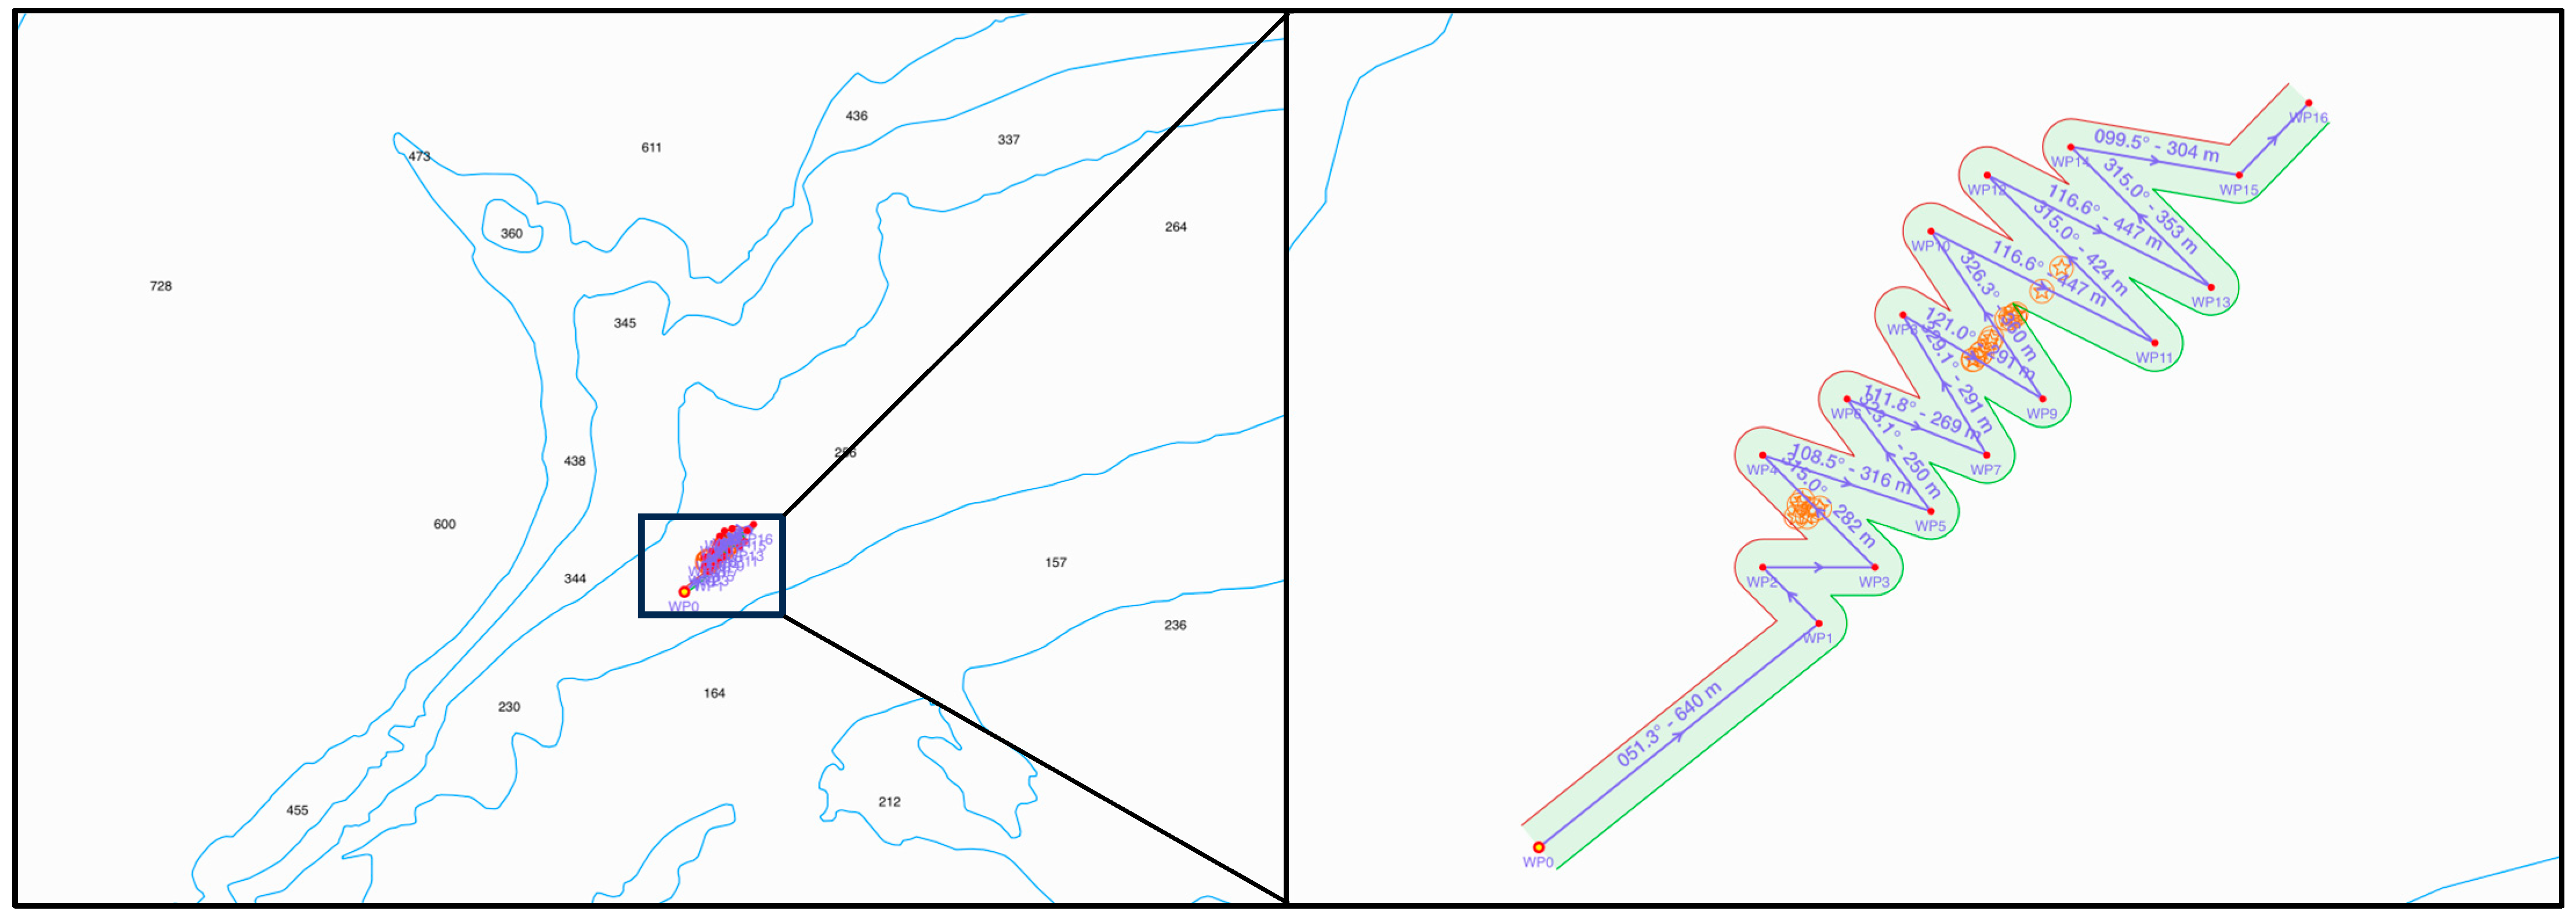
Within the comprehensive mission, a site selection strategy was employed to optimize the potential for hydrocarbon plume detection (See
Figure 12). By strategically targeting the most probable locations for plume observation, the mission maximized its chances of capturing relevant data. In
Figure 12, observed oil seep locations from previously reported remotely operated vehicle (ROV) missions [
23] are depicted with concentration level indicators. Notably, the zigzag path chosen for the mission was strategically aligned with the line of oil seeps. This deliberate route selection was intended to enhance the system’s efficacy in capturing hydrocarbon plumes by ensuring thorough coverage of potential seep locations.
While the AUV has a maximum depth rating of 3000 m, as indicated in
Table 1, we intentionally constrained the operating depth to a maximum of 200 m for the missions detailed in this study. This decision aligns with the targeted depth range of the region where oil seepage was anticipated, which ranged from 200 to 250 m. The imposition of this depth constraint during the missions was driven by safety considerations. In unforeseen events, such as water leaks, which might propel the vehicle beyond the defined ‘safe’ virtual box (
x,
y, and
z maximum constraints), the mission was programmed to terminate. This ensured the protection and intact retrieval of the vehicle.
5. Results
5.1. Overall Mission Description
After preliminary shakedown tests were conducted, we executed a series of six systematically planned missions, each designed to verify specific facets of the Backseat Drive AUV system (
Table 3).
Figure 13 and
Figure 14 outline the discrete assessments conducted in the Search, Survey, and Sample modules, emphasizing their autonomous functionalities. The adaptive Mission 4 verified the integration of the Survey and Sample modules. The second adaptive mission (Mission 5) served as a methodical rehearsal for the offshore mission, concentrating on the primary Search module, while Mission 6 encapsulated the entirety of the adaptive mission. Diamond markers delineate target waypoints, while yellow triangles denote sampling locations, and a red circle designates the mission’s starting point. The water depth profile for each mission is shown beneath its corresponding plot on the mission track.
Module Test 1 took place in Qurlurnilikuluk Fjord, chosen for its minimal current and absence of wave activity. This was important as an early winter storm meant that the ship had to remain at this location for several days. In this mission, the AUV was set to descend to a depth of 20 m to execute a bowtie manoeuvre and assess the Sample module’s software block and sampling hardware unit. The sampler syringes successfully collected a water sample at the designated location (marked by a yellow triangle), adhering to the prescribed bowtie path at 20 m depth. Subsequently, the vehicle was set to descend further to a depth of 40 m before returning. This test validated the feasibility and performance of the Sample module design and sample unit.
Module Test 2 focused on the Survey module, employing a lawnmower path with four vertical legs spanning 1.16 km, each separated by a uniform distance of 150 m. This test primarily evaluated the Survey module’s performance, specifically checking the functionality of pProbMapper at 20 m depth. The Survey module effectively generated new sampling points for the subsequent module based on fluorescent concentration data collected by the UviLux PAH sensor. Although the fluorescent concentration level in Qurlurnilikuluk Fjord was relatively low, with minimal variation between the background and the calculated most probable peak area in the path, the module demonstrated sensitivity in analyzing data even at these low-concentration survey areas. Additionally, the Survey module successfully initiated the next Sample module as intended.
In Module Test 3, the performance of the Search module, driven by the Backseat Drive computer, was tested at a location in Qurlurnilikuluk Fjord, where a higher likelihood of detecting hydrocarbons was expected, allowing for additional testing before offshore missions. The Search module, where the vehicle adhered to specified waypoints and executed a bowtie pattern search at each point, performed successfully. The pPlumeDetector continuously analyzed the Ping360 sonar data during the mission. However, the subsequent Survey module was not triggered at the mission’s conclusion as no targets over the threshold level were identified in the sonar data. The log file revealed that the pSurveyPlanner did not generate a new series of waypoints because all collected data fell below this set threshold. Consequently, it became evident that this module could prematurely terminate the entire mission when launching a combined adaptive mission. To address this, we implemented a Backup Opinion Strategy to ensure the Survey module could be triggered, even in areas with low bubble or oil droplet plumes that could not be identified by the sonar.
Mission 4, executed in Qurlurnilikuluk Fjord, was an adaptive mission incorporating combined Survey and Sample modules at a depth of 20 m. The mission entailed two primary objectives: firstly, to visit five predetermined waypoints and subsequently to determine the most probable location for the plume; and secondly, to trigger the Sample module to navigate the vehicle to the designated location and collect a water sample. The onboard analysis indicated that the calculated plume location was in close proximity to the fourth waypoint (marked by a green circle). The AUV adaptively returned to this location and the Sample module was triggered, leading to the collection of a water sample. The Loiter mode was executed between the Survey and Sample modules, a transition not readily discernible on the vehicle trajectory plot due to the relatively short processing time. Detailed analysis of the adaptive performance by pProbMapper in this module is presented in the next section.
Vehicle performance and a weather window enabled transitioning to the offshore region of Baffin Bay, where oil and methane seeps were known to exist and where two missions were carried out successfully. The vehicle was first deployed to a depth of 50 m, visiting the 15 designated waypoints as shown in
Figure 12. Although initially planned as an adaptive mission with combined Search and Survey modules, only the Search module was active, and the bowtie search pattern failed to activate due to an error. Real-time USBL data on the surface computer consistently reported the AUV’s position differently from the planned trajectory throughout the mission, indicating a robust SW-tending current at a depth of 50 m. Upon resurfacing, the vehicle was near the fifth waypoint instead of the intended fifteenth.
Owing to time and ship logistics, with only one remaining opportunity for a comprehensive mission, a cautious measure for water sampling, Forced Sampling (FS), was implemented. This strategy ensured that the water sampler would be triggered if the mission terminated for any reason. So, for the final mission, which aimed to include all modules, the number of waypoints was reduced to four, the target depth was set to 200 m, and the vehicle successfully visited all four waypoints, executing a bowtie pattern search at each waypoint. Upon completion of the Search module, the pPlumeDetector, in analyzing the sonar data, generated no new waypoints due to an unexpectedly low level of acoustic data as no streams of methane or oil were sensed in the water column. As a result, the Backup Opinion Strategy was implemented, pinpointing a relative high spot of PAH near the third waypoint during the Loiter mode. Subsequently, the Survey module directed the AUV to return to the third waypoint (marked by a green circle). Unfortunately, a ground fault (indicating a water leak) led to the premature termination of the mission as soon as the Sample module became active. The Forced Sample mechanism activated, allowing a water sample to be collected as the AUV executed an override return to surface manoeuvre.
5.2. Adaptive Control Evaluation
During the adaptive Mission 4, the highest PAH concentration was identified at coordinates (498 m, 279 m) in
Figure 15a, while the predicted highest probability in
Figure 15b was situated at (498 m, 281 m), indicating a minimal spatial discrepancy of 2 m. The PAH density maps in
Figure 15b,c do not delineate distinct hotspots of extremely high density, presenting a rather homogeneous field in the region of this test. This occurrence is because of the inherently narrow range of PAH values within the dataset, resulting in a KDE representation with limited contrast. During this mission, the recorded range of PAH measurements spanned from only 1.42 QSU to 4.27 QSU. Regardless, the highest spot was identified and the AUV was adaptively directed back to this spot to take a water sample.
The incorporation of PAH observations as weights in the KDE introduces the potential for the density estimation to be influenced by the PAH readings, with the predicted density of each data point expected to be proportional to its PAH value. Consequently, the identification of potential hotspots can be obscured if the spectrum of PAH values is constrained. Although the adaptive sampling mission was successfully executed here, further investigation and refinement of the methodology would be necessary to address these limitations and enhance the capability of the pProbMapper for the aim of a test to specifically detect and characterize hydrocarbon hotspots in varying environmental conditions.
In Mission 6, a bowtie pattern was employed during the Search phase. The outcomes of this exploration are illustrated in
Figure 16, revealing a hotspot correlated with higher fluorescence within the mission region. The maximum PAH concentration, as indicated in
Figure 16a, occurred at coordinates (316 m, 192 m). In close proximity,
Figure 16b identified the predicted highest probability at (316 m, 191 m), demonstrating a negligible spatial deviation of only 1 m. This analysis using the KDE function in
pProbMapper predicts the high-probability areas associated with elevated PAH concentrations. The position identified and shown in
Figure 16b was identified in the adaptive mission as the subsequent waypoint for a target water sample. This integration of predictive modeling and actionable decision-making highlights the efficacy of the comprehensive mission strategy, providing valuable insights for real-time adaptive navigation and sampling in the dynamic underwater environment.
Building upon the outcomes of the field trials, the pProbMapper can effectively pinpoint hotspots characterized by high fluorescence, showcasing a clustered distribution within the surveyed areas. The resulting density map displayed a continuous representation of the fluorescence distribution, closely aligning with the real regions exhibiting elevated fluorescence values. The experimental findings verified the accurate predictive capabilities of the pProbMapper, demonstrating high consistency with actual high-fluorescence zones. This method proves invaluable for the Backseat Drive computer to adaptively select optimal vehicle waypoints where water samples or another action can be taken, significantly enhancing the overall efficiency of the missions.
6. Discussion
The missions indicate the effectiveness of a modular system for adaptive control of an AUV to address specific challenges associated with hot spots identified in data from subsurface sensor readings. The adaptive sampling strategy, coupled with the modular structure featuring individually operable task components, played a pivotal role in achieving precise identification of subsurface data hot spots, with the planned target in these tests being hydrocarbon delineation. This accuracy in pinpointing the highest parameter of interest and determining optimal sampling locations is crucial for real-world applications, especially in dynamic deep ocean environments.
The demonstrated sequential module triggering system represents a step forward in adaptability, offering a level of flexibility that is essential for addressing various configurations and scenarios in underwater exploration. The modular architecture enables the integration of diverse payload sensors, enhancing the system’s versatility for different mission objectives and applications. For instance, the incorporation of optical sensors could allow for detailed visual inspections, while particle analyzers could provide insights into the composition of underwater particulate matter. Including a methane sniffer or underwater mass spectrometer would enhance the system’s capability to detect specific hydrocarbon compounds in addition to the PAH sensor used here, and multibeam sonars would enhance the simultaneous target recognition capability of the scanning sonar used here, and also enable target recognition from mapping capabilities for a more comprehensive understanding of the underwater environment. Additionally, transitioning from a single beam scanning sonar to a more advanced multibeam sonar configuration is recommended, as this transition holds the potential to increase the likelihood of detection, while concurrently minimizing the risk of nondetection in dynamic underwater environments.
The efficacy of the
pProbMapper module in predicting and characterizing hydrocarbon hotspots hinges on precise parameter settings. The bandwidth of the KDE emerges as a crucial parameter, determining the searching radius and control of the smoothness of the KDE surface [
35]. A larger bandwidth yields a smoother distribution, but it may sacrifice detailed information on the density of surfaces. Conversely, a narrower bandwidth accentuates finer variations, but potentially obscures clustering characteristics [
36]. The adjustable nature of bandwidth selection, tailored to the concentrations of observations in a specific area [
37], is paramount. A limited range in the sensor observations can potentially lead to an under-representation in identifying hotspots. In our study, a smaller bandwidth is preferred to create a more localized density estimation, thereby providing a finer resolution of the density map in locating a position for a water sample to be taken. As the observed PAH value range in this study was relatively narrow, a smaller bandwidth was applied to capture the localized variation more effectively. The weight of the KDE constitutes another pivotal parameter. Utilizing raw PAH data directly reflects the intensity of each measurement point for density estimation, potentially leading to an overemphasis on areas with high readings. On the other hand, employing baseline-adjusted values as weights—that is by subtracting the minimum PAH value from each reading—normalizes the dataset. In cases where the range of PAH values is narrow, subtracting the minimum value accentuates relative differences between observations. This approach proved useful for highlighting hotspots compared to their surroundings and enhanced the accuracy of density estimation. Careful consideration of these parameters enhances the robustness of
pProbMapper and contributes to its capability in predicting and characterizing hydrocarbon hotspots.
Notwithstanding the challenges encountered here in the Search phase with pPlumeDetector, where it was not able to generate meaningful coordinates for the Survey module owing to the limited presence of oil or methane bubbles identified in the water column, the field trials substantiated the operational feasibility and adaptive capability of the method. The limitations observed, stemming from potential oversights in scanning procedures, such as potentially missing an extremely narrow vertical hydrocarbon plume, the potentially intermittent nature of methane seeps, or encountering unexpectedly pristine surveyed regions, highlight the importance of using multiple sensors to navigate and effectively target items of interest. This adaptive capability forms a foundational aspect of the system’s robustness in dynamic underwater environments.
The field trials also brought to light an unexpected frequency of hardware breakdowns and replacements, surpassing initial projections, even when accounting for the 17-year age of Memorial’s AUV. Environmental challenges, largely beyond our immediate control—ranging from low temperatures to adverse weather conditions, the prevalence of icebergs, and freshwater run-off from snow and glaciers—as well as potential vibration during the extended shipping journey of the AUV, contributed significantly to hardware issues resulting in newly-encountered ground fault issues from small leaks at connectors and O-ring failures. Recognizing and comprehensively understanding these challenges is paramount for future missions, prompting the need for enhanced preparedness, increased redundancy of equipment, and a thorough consideration of external factors that may impact mission durations. To bolster future mission success, meticulous consideration of environmental challenges becomes imperative. Strategic measures, including increased duplication of critical parts and an acknowledgment of the potential curtailment of mission duration due to external factors such as adverse weather or staff-related issues, should be integrated into mission planning.
7. Conclusions
In conclusion, the journey from methodological development to simulation and, as reported here, to field trials has indicated the successful performance and adaptability of an AUV Backseat Drive adaptive control and sampling system, especially in the challenging underwater environment of Baffin Bay. The framework established through these tests describes an autonomous smart underwater system as a foundational technology for future applications in the identification and delineation of marine pollutants or other items of interest in the water column. Its adaptability, demonstrated through the implementation of a sequential module triggering architecture in our specific case, sets the stage for continued refinement and application across diverse underwater scenarios. The flexibility of the modular approach underscored the system’s capacity to accommodate various mission requirements, utilizing different sensors and allowing for versatile deployment in different underwater environments and with different mission goals and research objectives. Each mission served as a crucial building block, testing various mission types and scenarios, contributing to the iterative refinement and validation of our adaptive system. The ability to target and identify marine pollutants in particular, such as macro or microplastics, highlights the potential of the approach in environmental monitoring and conservation efforts.
Overall, we have concluded that our research showcased the successful performance and adaptability of the developed system. The demonstrated ability to target pollutants, coupled with insights gained from trials, positions this system as a valuable asset for environmental monitoring and conservation. In confronting challenges, the trials highlighted the imperative need for enhanced preparedness and increased redundancy in future missions. These insights are pivotal for the advancement of autonomous underwater exploration methodologies, guaranteeing the reliability and success of forthcoming missions in complex underwater ecosystems.
Author Contributions
Conceptualization, J.H. and N.B.; methodology, J.H.; software, J.H., G.M., G.N. and X.C.; validation, J.H., N.B., G.M., C.B., G.N. and X.C.; formal analysis, J.H., G.N. and X.C.; investigation, J.H.; resources, N.B., G.M. and C.B.; data curation, J.H. and X.C.; writing—original draft preparation, J.H., X.C. and G.N.; writing—review and editing, J.H. and N.B.; visualization, J.H., X.C. and G.N.; supervision, N.B.; project administration, N.B.; funding acquisition, N.B. All authors have read and agreed to the published version of the manuscript.
Funding
This work was funded by the Natural Sciences and Engineering Research Council (NSERC) Alliance program: ALLRP 561516-20 Characterization and delineation of oil-in-water at the Scott Inlet seeps through robotic autonomous underwater vehicle technology, in partnership with Fugro Canada, International Submarine Engineering, and Memorial University. Further financial support came from the NSERC Discovery Grant programme to the second author: RGPIN-2021-02506 Advancing Autonomous Underwater Vehicle Capability for Assessment of Marine Pollution. We express our sincere gratitude to Helle Siegstad and her team at the Greenland Institute of Natural Resources and KTN Consult for their support and collaboration. Additionally, we extend our appreciation to the dedicated crew of the R/V Sanna for their contributions during the execution of our research.
Data Availability Statement
Due to the sensitive nature of the information collected and in alignment with the confidentiality agreements with the Nunavut Research Institute and Nunavut Impact Review Board, we are unable to disclose the collected data to the public, hence the datasets presented in this article are not readily available.
Conflicts of Interest
The authors declare no conflict of interest.
References
- Zhang, Y.; Bellingham, J.G.; Godin, M.A.; Ryan, J.P. Using an autonomous underwater vehicle to track the thermocline based on peak-gradient detection. IEEE J. Ocean. Eng. 2012, 37, 544–553. [Google Scholar] [CrossRef]
- Cruz, N.A.; Matos, A.C. Reactive AUV motion for thermocline tracking. In Proceedings of the OCEANS’10 IEEE SYDNEY, Sydney, Australia, 24–27 May 2010; pp. 1–6. [Google Scholar]
- Jakuba, M.V.; Kinsey, J.C.; Yoerger, D.R.; Camilli, R.; Murphy, C.A.; Steinberg, D.; Bender, A. Exploration of the gulf of mexico oil spill with the sentry autonomous underwater vehicle. In Proceedings of the International Conference on Intelligent Robots and Systems (IROS) Workshop on Robotics for Environmental Monitoring (WREM), San Francisco, CA, USA, 30 September 2011; pp. 25–30. [Google Scholar]
- Kukulya, A.; Bellingham, J.; Kaeli, J.; Reddy, C.; Godin, M.; Conmy, R. Development of a propeller driven long range autonomous underwater vehicle (LRAUV) for under-ice mapping of oil spills and environmental hazards: An Arctic Domain Center of Awareness project (ADAC). In Proceedings of the 2016 IEEE/OES Autonomous Underwater Vehicles (AUV), Tokyo, Japan, 6–9 November 2016; pp. 95–100. [Google Scholar]
- Camilli, R.; Reddy, C.M.; Yoerger, D.R.; Van Mooy, B.A.; Jakuba, M.V.; Kinsey, J.C.; McIntyre, C.P.; Sylva, S.P.; Maloney, J.V. Tracking hydrocarbon plume transport and biodegradation at Deepwater Horizon. Science 2010, 330, 201–204. [Google Scholar] [CrossRef]
- Farrell, J.A.; Pang, S.; Li, W. Chemical plume tracing via an autonomous underwater vehicle. IEEE J. Ocean. Eng. 2005, 30, 428–442. [Google Scholar] [CrossRef]
- Li, W.; Farrell, J.A.; Pang, S.; Arrieta, R.M. Moth-inspired chemical plume tracing on an autonomous underwater vehicle. IEEE Trans. Robot. 2006, 22, 292–307. [Google Scholar] [CrossRef]
- Razaz, M.; Di Iorio, D.; Wang, B.; Daneshgar Asl, S.; Thurnherr, A.M. Variability of a natural hydrocarbon seep and its connection to the ocean surface. Sci. Rep. 2020, 10, 12654. [Google Scholar] [CrossRef] [PubMed]
- Zhang, J.; Liu, M.; Zhang, S.; Zheng, R.; Dong, S. Multi-AUV adaptive path planning and cooperative sampling for ocean scalar field estimation. IEEE Trans. Instrum. Meas. 2022, 71, 9505514. [Google Scholar] [CrossRef]
- Fossum, T.O.; Norgren, P.; Fer, I.; Nilsen, F.; Koenig, Z.C.; Ludvigsen, M. Adaptive sampling of surface fronts in the Arctic using an autonomous underwater vehicle. IEEE J. Ocean. Eng. 2021, 46, 1155–1164. [Google Scholar] [CrossRef]
- Feng, H.; Yu, J.; Huang, Y.; Qiao, J.; Wang, Z.; Xie, Z.; Liu, K. Adaptive coverage sampling of thermocline with an autonomous underwater vehicle. Ocean. Eng. 2021, 233, 109151. [Google Scholar] [CrossRef]
- Berget, G.E.; Eidsvik, J.; Alver, M.O.; Johansen, T.A. Dynamic stochastic modeling for adaptive sampling of environmental variables using an AUV. Auton. Robot. 2023, 47, 483–502. [Google Scholar] [CrossRef]
- Mo-Bjørkelund, T.; Fossum, T.O.; Norgren, P.; Ludvigsen, M. Hexagonal grid graph as a basis for adaptive sampling of ocean Gradients using AUVs. In Proceedings of the Global Oceans 2020: Singapore–US Gulf Coast, Biloxi, MS, USA, 5–30 October 2020; pp. 1–5. [Google Scholar]
- Hwang, J.; Bose, N.; Fan, S. AUV adaptive sampling methods: A review. Appl. Sci. 2019, 9, 3145. [Google Scholar] [CrossRef]
- Hwang, J.; Bose, N.; Robinson, B.; Thanyamanta, W. Sonar Based Delineation of Oil Plume Proxies Using an AUV. Int. J. Mech. Eng. Robot. Res. 2022, 11, 207–214. [Google Scholar] [CrossRef]
- Hwang, J.; Bose, N.; Millar, G.; Bulger, C.; Nazareth, G. Bubble Plume Tracking Using a Backseat Driver on an Autonomous Underwater Vehicle. Drones 2023, 7, 635. [Google Scholar] [CrossRef]
- Wang, Y.; Thanyamanta, W.; Bulger, C.; Bose, N.; Hwang, J. Microbubbles as proxies for oil spill delineation in field tests. J. Mar. Sci. Eng. 2021, 9, 126. [Google Scholar] [CrossRef]
- Ester, M.; Kriegel, H.-P.; Sander, J.; Xu, X. A density-based algorithm for discovering clusters in large spatial databases with noise. In Proceedings of the Second International Conference on Knowledge Discovery and Data Mining, Portland, OR, USA, 2–4 August 1996; pp. 226–231. [Google Scholar]
- Fotheringham, A.S.; Brunsdon, C.; Charlton, M. Quantitative Geography: Perspectives on Spatial Data Analysis; Sage: Thousand Oaks, CA, USA, 2000. [Google Scholar]
- Serra-Sogas, N.; O’Hara, P.D.; Canessa, R.; Keller, P.; Pelot, R. Visualization of spatial patterns and temporal trends for aerial surveillance of illegal oil discharges in western Canadian marine waters. Mar. Pollut. Bull. 2008, 56, 825–833. [Google Scholar] [CrossRef]
- Xie, Z.; Yan, J. Kernel density estimation of traffic accidents in a network space. Comput. Environ. Urban Syst. 2008, 32, 396–406. [Google Scholar] [CrossRef]
- Sanvicente-Añorve, L.; Salgado-Ugarte, I.H.; Castillo-Rivera, M.; Browman, H.; Skiftesvik, A. The use of kernel density estimators to analyze length-frequency distributions of fish larvae. In The Big Fish Bang, Proceedings of the 26th Annual Larval Fish Conference, Bergen, Norway, 1 January 2003; Institute of Marine Research: Bergen, Norway, 2003; pp. 419–430. [Google Scholar]
- Cramm, M.A.; de Moura Neves, B.; Manning, C.C.; Oldenburg, T.B.; Archambault, P.; Chakraborty, A.; Cyr-Parent, A.; Edinger, E.N.; Jaggi, A.; Mort, A. Characterization of marine microbial communities around an Arctic seabed hydrocarbon seep at Scott Inlet, Baffin Bay. Sci. Total Environ. 2021, 762, 143961. [Google Scholar] [CrossRef]
- Oakey, G.N.; Moir, P.N.; Brent, T.; Dickie, K.; Jauer, C.; Bennett, R.; Williams, G.; MacLean, B.; Budkewitsch, P.; Haggart, J. The Scott Inlet–Buchan Gulf oil seeps: Actively venting petroleum systems on the northern Baffin margin offshore Nunavut, Canada. In Proceedings of the Canadian Society of Petroleum Geologists, Annual Convention, Calgary, AB, Canada, 14–18 May 2012. [Google Scholar]
- Grant, A.; Levy, E.; Lee, K.; Moffat, J. Pisces IV research submersible finds oil on Baffin Shelf. In Current Research, Part A, Geological Survey of Canada, Paper; Natural Resources Canada: Baffin Island, NU, Canada, 1986; pp. 65–69. [Google Scholar]
- Loncarevic, B.; Falconer, R. An oil slick occurrence off Baffin Island. In Report of Activities, Part A, Geological Survey of Canada, Paper; Natural Resources Canada: Baffin Island, NU, Canada, 1977; pp. 523–524. [Google Scholar]
- Levy, E. Scott Inlet slick: An Arctic oil seep. Spill Technol. Newsl. 1977, 2, 21–27. [Google Scholar]
- Levy, E. Visual and Chemical Evidence for a Natural Seep at Scott Inlet, Baffin Island, District of Franklin; Geological Survey of Canada, Paper no. 78-1B; Geological Survey of Canada: Baffin Island, NU, Canada, 1978; pp. 21–26.
- Levy, E. Concentration of Petroleum Residues in the Water and Sediment of Baffin Bay Eastern Canadian Arctic—1977; Bedford Institute of Oceanography Report Series; BI: Dartmouth, NS, Canada, 1979. [Google Scholar]
- Levy, E. Further Chemical Evidence for Natural Seepage on the Baffin Island Shelf; Natural Resources Canada: Baffin Island, NU, Canada, 1979.
- MacLean, B. Marine Geological-Geophysical Investigations in 1977 of the Scott Inlet and Cape Dyer. Frobisher Bay Areas of the Baffin Island Continental Shelf; Geological Survey of Canada, Paper no. 78-1B; Geological Survey of Canada: Baffin Island, NU, Canada, 1978; pp. 13–20.
- MacLean, B. Geological/Geophysical Studies in Baffin Bay and Scott Inlet-Buchan Gulf and Cape Dyer-Cumberland Sound Areas of the Baffin Island Shelf; Natural Resources Canada: Baffin Island, NU, Canada, 1979.
- MacLean, B.; Falconer, R.; Levy, E. Geological, geophysical and chemical evidence for natural seepage of petroleum off the northeast coast of Baffin Island. Bull. Can. Pet. Geol. 1981, 29, 75–95. [Google Scholar]
- King, P.; Ziürcher, K.; Bowden-Floyd, I. A risk-averse approach to mission planning: Nupiri muka at the Thwaites Glacier. In Proceedings of the 2020 IEEE/OES Autonomous Underwater Vehicles Symposium (AUV), Virtual, 30 September–2 October 2020; pp. 1–5. [Google Scholar]
- Kuter, S.; Usul, N.; Kuter, N. Bandwidth determination for kernel density analysis of wildfire events at forest sub-district scale. Ecol. Model. 2011, 222, 3033–3040. [Google Scholar] [CrossRef]
- Amatulli, G.; Peréz-Cabello, F.; de la Riva, J. Mapping lightning/human-caused wildfires occurrence under ignition point location uncertainty. Ecol. Model. 2007, 200, 321–333. [Google Scholar] [CrossRef]
- Worton, B.J. Kernel methods for estimating the utilization distribution in home-range studies. Ecology 1989, 70, 164–168. [Google Scholar] [CrossRef]
Figure 1.
Hull structure of Memorial University’s Explorer autonomous underwater vehicle.
Figure 1.
Hull structure of Memorial University’s Explorer autonomous underwater vehicle.
Figure 2.
AUV control architecture: Backseat Drive and Frontseat Drive systems.
Figure 2.
AUV control architecture: Backseat Drive and Frontseat Drive systems.
Figure 3.
Payload sensors integrated with the vehicle. (a) Ping360, UviLux (PAH), UviLux (CDOM); (b) multi water sampler.
Figure 3.
Payload sensors integrated with the vehicle. (a) Ping360, UviLux (PAH), UviLux (CDOM); (b) multi water sampler.
Figure 4.
Developed core Backseat Drive MOOS architecture.
Figure 4.
Developed core Backseat Drive MOOS architecture.
Figure 5.
Developed modules and corresponding MOOS applications. Input and output data flow through the sensors and applications are presented.
Figure 5.
Developed modules and corresponding MOOS applications. Input and output data flow through the sensors and applications are presented.
Figure 6.
Visualization of the pPlumeDetector processing steps for a single sector scan. (a) Input; (b) range-gated; (c) segmented; (d) imaged; (e) labelled clusters; and (f) cluster centers and radii.
Figure 6.
Visualization of the pPlumeDetector processing steps for a single sector scan. (a) Input; (b) range-gated; (c) segmented; (d) imaged; (e) labelled clusters; and (f) cluster centers and radii.
Figure 7.
AUV track line during the lawnmower mission, along with the cluster centers and location of the AUV at the time of the cluster detections.
Figure 7.
AUV track line during the lawnmower mission, along with the cluster centers and location of the AUV at the time of the cluster detections.
Figure 8.
Results of the first playback test, including (a) real-time PAH reading along waypoints, (b) predicted probability density map, and (c) the composite map.
Figure 8.
Results of the first playback test, including (a) real-time PAH reading along waypoints, (b) predicted probability density map, and (c) the composite map.
Figure 9.
Results of the second playback test, including (a) real-time PAH reading along waypoints, (b) predicted probability density map, and (c) the composite map.
Figure 9.
Results of the second playback test, including (a) real-time PAH reading along waypoints, (b) predicted probability density map, and (c) the composite map.
Figure 10.
The two selected locations in the experimental site marked in a black circle.
Figure 10.
The two selected locations in the experimental site marked in a black circle.
Figure 11.
Research vessel R/V Sanna and the LARS system installed on the deck (top). The launch and recovery system (LARS) process is depicted showing the procedures involved in deploying and retrieving the vehicle during missions (bottom).
Figure 11.
Research vessel R/V Sanna and the LARS system installed on the deck (top). The launch and recovery system (LARS) process is depicted showing the procedures involved in deploying and retrieving the vehicle during missions (bottom).
Figure 12.
AUV path during the comprehensive mission planned in Region 2, with yellow star circles indicating estimated seep locations derived from the ROV data.
Figure 12.
AUV path during the comprehensive mission planned in Region 2, with yellow star circles indicating estimated seep locations derived from the ROV data.
Figure 13.
Search, Survey and Sample module test results.
Figure 13.
Search, Survey and Sample module test results.
Figure 14.
Adaptive and Comprehensive mission test results.
Figure 14.
Adaptive and Comprehensive mission test results.
Figure 15.
Results of the Adaptive Mission 1 (#4), including (a) real-time PAH reading along waypoints, (b) predicted probability density map, and (c) the composite map.
Figure 15.
Results of the Adaptive Mission 1 (#4), including (a) real-time PAH reading along waypoints, (b) predicted probability density map, and (c) the composite map.
Figure 16.
Results of the Full Comprehensive Mission (#6), including (a) real-time PAH reading along waypoints, (b) predicted probability density map, and (c) the composite map.
Figure 16.
Results of the Full Comprehensive Mission (#6), including (a) real-time PAH reading along waypoints, (b) predicted probability density map, and (c) the composite map.
Table 1.
Specification of the MUN Explorer AUV.
Table 1.
Specification of the MUN Explorer AUV.
| Characteristics | Specifications |
|---|
| Length | 5.3 m |
| Hull Diameter | 0.69 m |
| Dry Weight | 830 kg |
| Energy | 18 kWh |
| Maximum Depth | 3000 m with 10% safety factor |
| Typical Cruising Speed | 1.5 m/s |
| Speed Range | 1 m/s to 2 m/s |
| Power Source and Capacity | 17.6 kWh secondary lithium battery bank |
| Computer | cPCI modules for vehicle and payload control |
| Hydroplanes | 4 NACA 0026 stern planes |
| 2 NACA 0026 fore planes |
| Navigation | iXsea PHINS III Inertial Navigation System |
| D-GPS | Trimble MB-Two GNSS |
| Velocity Sensor | RDI Workhorse 300 kHz DVL |
| Depth Sensor | Paroscientific Digiquartz series 8000 |
| Altitude Sensor | Kongsberg Maritime 1107 Digital Altimeter |
| Positioning System | Sonardyne Ranger 2 USBL system |
| Acoustic Telemetry | Teledyne Benthos ATM-886 modem and UDB-9000 deck box |
| Radio Telemetry | Ubiquiti Bullet |
| Satellite Beacon | Xeos Apollo |
| Integrated Sensors and Payload | R2Sonic 2024 Multibeam Echosounder System |
| Edgetech 2200 M Side Scan Sonar System/Sub-bottom Profiler |
| Seabird Fastcat 49 CTD |
| Valeport MiniSVS |
Table 2.
The GPS coordinates of the two regions selected for the field experiments.
Table 2.
The GPS coordinates of the two regions selected for the field experiments.
| Region | Latitude | Longitude | Depth |
|---|
| Region 1 | 70.911988 | −71.382196 | 20 m |
| 70.911988 | −71.343833 |
| 70.928124 | −71.343833 |
| 70.928124 | −71.382196 |
| Region 2 | 71.373661 | −70.085272 | 20 m, 50 m, and 200 m |
| 71.373665 | −70.037331 |
| 71.388893 | −70.037603 |
| 71.388891 | −70.085272 |
Table 3.
Summary of Backseat Drive AUV missions.
Table 3.
Summary of Backseat Drive AUV missions.
| No. | Mission | Activated Module | Pattern | Sample | Depth | Site |
|---|
| 1 | Module test | Sample | Bowtie | Yes | 20 m | Qurlurnilikuluk |
| 2 | Module test | Survey | Lawnmower | No | 20 m | Qurlurnilikuluk |
| 3 | Module test | Search | Angle/Bowtie | No | 20 m | Qurlurnilikuluk |
| 4 | Adaptive | Survey–Sample | W-shape | Yes | 20 m | Qurlurnilikuluk |
| 5 | Adaptive | Search–Survey | Zigzag | No | 50 m | Baffin Bay |
| 6 | Comprehensive | Search–Survey–Sample | Zigzag/Bowtie | Yes | 200 m | Baffin Bay |
| Disclaimer/Publisher’s Note: The statements, opinions and data contained in all publications are solely those of the individual author(s) and contributor(s) and not of MDPI and/or the editor(s). MDPI and/or the editor(s) disclaim responsibility for any injury to people or property resulting from any ideas, methods, instructions or products referred to in the content. |
© 2024 by the authors. Licensee MDPI, Basel, Switzerland. This article is an open access article distributed under the terms and conditions of the Creative Commons Attribution (CC BY) license (https://creativecommons.org/licenses/by/4.0/).


