Article

Typical Fault Detection on Drone Images of Transmission Lines Based on Lightweight Structure and Feature-Balanced Network

1
Department of Electronic and Electrical Engineering, Wuhan Textile University, Wuhan 430200, China
2
State Key Laboratory of New Textile Materials and Advanced Processing Technologies, Wuhan Textile University, Wuhan 430200, China
3
School of Electrical and Automation, Wuhan University, Wuhan 430072, China
*
Author to whom correspondence should be addressed.
Drones 2023, 7(10), 638; https://doi.org/10.3390/drones7100638
Submission received: 5 September 2023 / Revised: 13 October 2023 / Accepted: 14 October 2023 / Published: 17 October 2023

Abstract

:
In the context of difficulty in detection problems and the limited computing resources of various fault scales in aerial images of transmission line UAV inspections, this paper proposes a TD-YOLO algorithm (YOLO for transmission detection). Firstly, the Ghost module is used to lighten the model’s feature extraction network and prediction network, significantly reducing the number of parameters and the computational effort of the model. Secondly, the spatial and channel attention mechanism scSE (concurrent spatial and channel squeeze and channel excitation) is embedded into the feature fusion network, with PA-Net (path aggregation network) to construct a feature-balanced network, using channel weights and spatial weights as guides to achieving the balancing of multi-level and multi-scale features in the network, significantly improving the detection capability under the coexistence of multiple targets of different categories. Thirdly, a loss function, NWD (normalized Wasserstein distance), is introduced to enhance the detection of small targets, and the fusion ratio of NWD and CIoU is optimized to further compensate for the loss of accuracy caused by the lightweightedness of the model. Finally, a typical fault dataset of transmission lines is built using UAV inspection images for training and testing. The experimental results show that the TD-YOLO algorithm proposed in this article compresses 74.79% of the number of parameters and 66.92% of the calculation amount compared to YOLOv7-Tiny and increases the mAP (mean average precision) by 0.71%. The TD-YOLO was deployed into Jetson Xavier NX to simulate the UAV inspection process and was run at 23.5 FPS with good results. This study offers a reference for power line inspection and provides a possible way to deploy edge computing devices on unmanned aerial vehicles.

1. Introduction

1.1. Research Background

Due to the complex and diverse environments in which transmission lines are erected, they are exposed to the wind, sun, rain, snow, and ice all year round, which can easily cause different degrees of failure and damage to power equipment [1,2]. In recent years, UAV inspection has been an important mode of inspection of transmission lines at home and abroad. This inspection mode can effectively overcome the disadvantages of manual inspection, such as “expensive, slow, difficult, and dangerous”, and has the advantages of safety, high efficiency, flexible control, fewer restricted conditions, and low cost. However, UAV inspections are bound to generate a large number of inspection images [3,4]. For the inspection of electrical equipment in a large number of UAV aerial images, the method of manually checking the fault results is mainly used, which consumes a lot of labor costs and is likely to cause missed inspections or false inspections. Therefore, it is of great significance to carry out research on artificial intelligence-based inspection methods under the background of UAV inspection big data. At present, target detection based on deep learning is an important research direction in the field of computer vision. While the drone is inspecting the transmission line, the deep learning algorithm carried out by the drone is used to detect faults in the aerial images, which saves time. The human work conducted after the drone inspection also ensures the accuracy of the inspection [5,6].

1.2. Methods Based on Deep Learning and Its Limitations

Typical fault detection algorithms for transmission lines in UAV inspection, based on deep learning, are divided into two categories [7]: one is the two-stage detection algorithm, and representative algorithms include R-CNN [8], Fast R-CNN [9], Faster R-CNN [10], and Cascade R-CNN [11]. Compared with the traditional algorithm, the two-stage detection algorithm has significantly improved accuracy. However, because the detection process needs to be completed in two steps, the speed could be faster, and the application range could be narrower. The other is a one-stage detection algorithm, which directly predicts the category and location of the target through the target detection network. Representative algorithms include SSD (single-shot multibox detector) [12] and the YOLO series (You Only Look Once) [13,14,15,16,17,18,19]. The SSD algorithm has contributed to the idea of a one-stage detection algorithm. Still, because it does not have an FPN (feature pyramid network), the accuracy is not enough. At present, the most researched one-stage algorithm is mainly the YOLO series.
However, the current typical fault detection of transmission lines based on deep learning still has three limitations. The first limitation is the lack of detection accuracy due to aerial scale shifts during drone inspections, resulting in seriously missed inspections. To address this problem, literature [20] proposed three improved strategies based on Faster R-CNN for transmission line multi-target detection, including the adaptive image pre-processing algorithm, area-based non-maximum suppression algorithm, and cut detection scheme, to achieve accurate localization and recognition of multiple targets in complex backgrounds. Literature [21] introduced a Gaussian function to improve the non-maximum value suppression method and reduce the missed detection of partially occluded fault targets. Literature [22] introduced YOLOv5 to detect 12 types of fault samples in transmission lines and adopted CBAM (convolutional block attention module) and bi-FPN (bi-directional feature pyramid network) improvement strategies to integrate target multi-scale features effectively. This method can accurately detect multi-scale fault targets in transmission lines in complex environments. Based on YOLOv5, literature [23] proposed a transmission line small-target fault detection network that integrates prior knowledge and an attention model. Compared with the literature [21], a more advanced target detection model is used to enhance the precise detection of small targets. The parameters of the improved models in the above literature are large, which is inconvenient for deployment and application on UAVs.
The second limitation is the large number of parameters derived while improving the model’s accuracy, making it difficult to deploy on UAVs. In response to this problem, the literature [24] proposed a lightweight model embedded in the double attention mechanism combined with MobelieNetV2 to detect multiple foreign objects on the transmission line. This method has high accuracy and detection speed, and its lightweight model idea lays the groundwork for model deployment. Literature [25] replaced the backbone network of YOLOv4 with a lightweight network, MobileNetV3, which is used to detect insulators and their damage in transmission lines. Literature [26] selects the pruned YOLOv4-Tiny model and combines the attention mechanism to realize the insulator research and defect detection under the hardware end. The lightweight improvement strategies for the model in the above literature are mainly divided into replacing the lightweight backbone, using lightweight convolution, and model pruning. However, the selected basic algorithm is relatively backward, with room for improvement.
The third limitation is that the single detection object leads to low inspection efficiency. Literature [27] improved Faster R-CNN (FPN). It proposed Pin-FPN, which uses various data-enhancement methods to detect pin defect faults in transmission lines and can achieve the accurate detection of small targets. Literature [28] improved YOLOv5 to detect bird nests in transmission lines and improved the detection effect of bird nests in complex backgrounds through the attention mechanism. Literature [29] combines the feature pyramid structure based on R-CNN to position insulators in complex backgrounds accurately. Literature [30] improves YOLOv5 to detect insulators and their damage in transmission lines and uses a lightweight network to reduce the model’s size and increase the speed. Literature [31] adds CAT-BiFPN and ACmix attention mechanisms based on YOLOv7 to detect various defects of insulation, and the detection effect is better for targets of different scales. Judging from the current research results, the detection objects are only faults of insulators, bird’s nests [32], and fittings, and there are few kinds of research on multiple types of fault inspections. The efficiency is low if applied to actual transmission line UAV inspections. Therefore, there is an urgent need for a typical fault detection algorithm for transmission lines with the advantages of convenient deployment, fast inference speed, high precision, and high inspection efficiency.

1.3. This Work

Based on the above problem analyses, this paper proposes a TD-YOLO algorithm (a lightweight object detection network that can detect multi-scale faults in real-time). The network adopts a structure combining the context lightweight structure and the feature-balanced network, which effectively solves the problems that different faults are difficult to detect simultaneously, occupy too many computing resources, and the detection speed is too slow in the detection process. Specifically, the innovations and contributions of this paper are as follows:
(1) To solve the problem that the calculation resources of the algorithm carried by the UAV are limited and the fault cannot be accurately detected, this paper proposes a new context lightweight structure (C2fGhost) from the perspective of the model lightweight, which will be calculated. While the volume is compressed by 43%, the mAP is increased by 0.14%. In addition, we combine the advantages of the Ghost module, SPPCSPC structure, and convolution, and propose two lightweight structures, GhostSPPCSPC and GhostConv. Compared with the original model, the calculation amount of the improved model is reduced by 69%, and the number of parameters is reduced by 75.7%.
(2) To solve the problem that it is difficult to detect different fault scales during the UAV inspection process, a feature-balanced network is proposed. Based on the attention mechanism and PA-Net, the network can better integrate deep information and shallow information and effectively improve the problem that it is difficult to detect targets of different scales at the same time.
(3) To solve the problem that it is difficult to detect small targets in aerial images, NWD was initially used to replace the positioning loss function in the model, and it was found that the calculation amount of the model increased suddenly, and the training time was greatly increased. Then, a loss function was proposed for the fusion of NWD and CIoU in proportion, and the best fusion ratio (70%NWD + 30%CIoU) was found. While reducing the number of parameters and training time, the accuracy is higher than that of all NWD loss functions. By using the missed detection rate to measure the detection effect of small targets, the test results show that the missed detection rate of the defects decreased by 6.76%, and the missed detection rate of anti-vibration hammer corrosion decreased by 14.61%.
(4) Deploy the algorithm in this paper to the embedded device Jeston Xavier NX to simulate the UAV inspection process and put forward the deployment condition limit index. The accuracy of the algorithm in the embedded device reached 93.5%, and the detection speed reached (23.5 ± 2.2) FPS. Meet the accuracy and real-time performance of drone inspections.

2. Materials and Methods
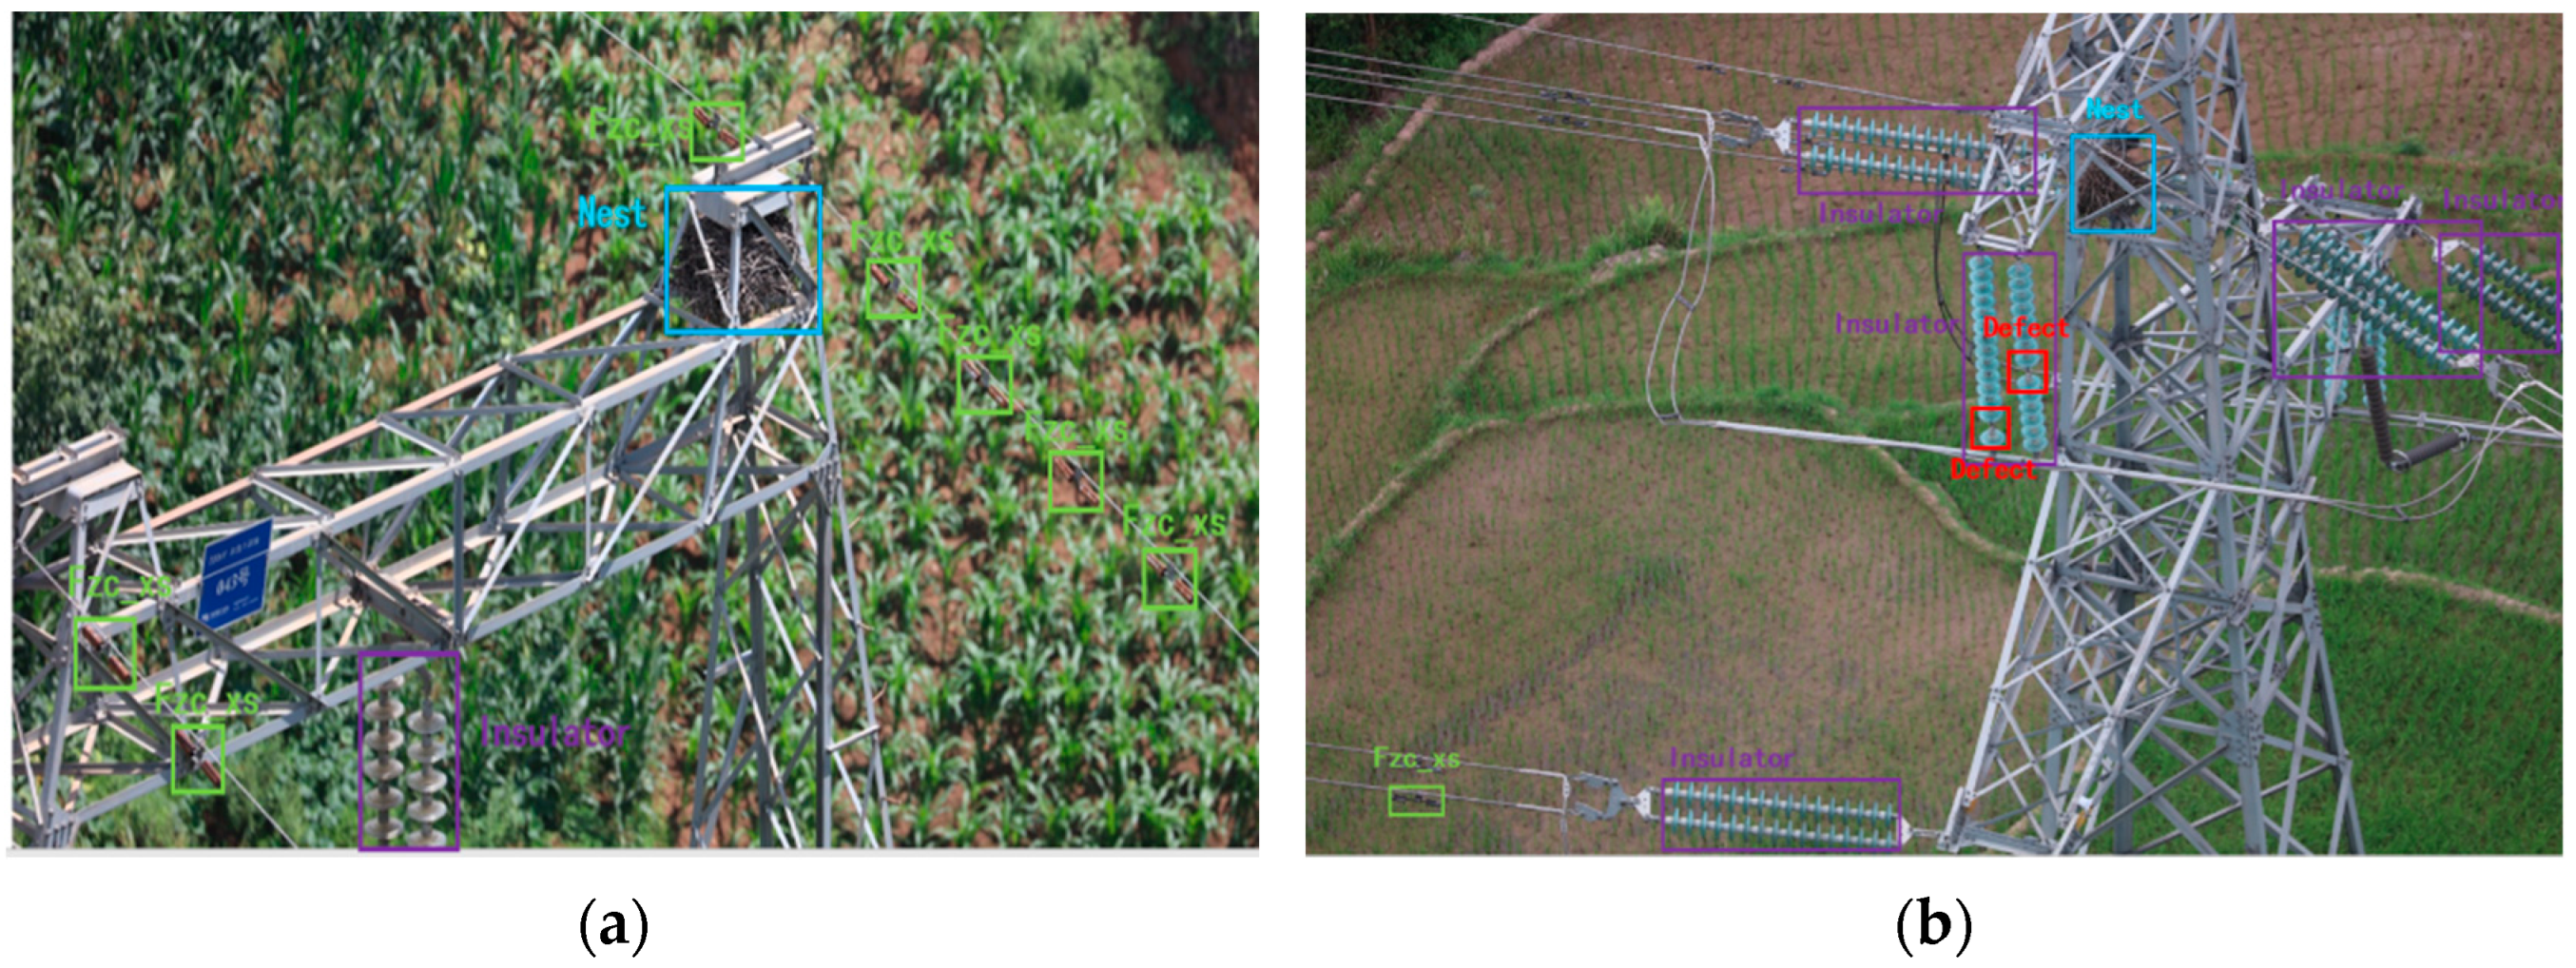
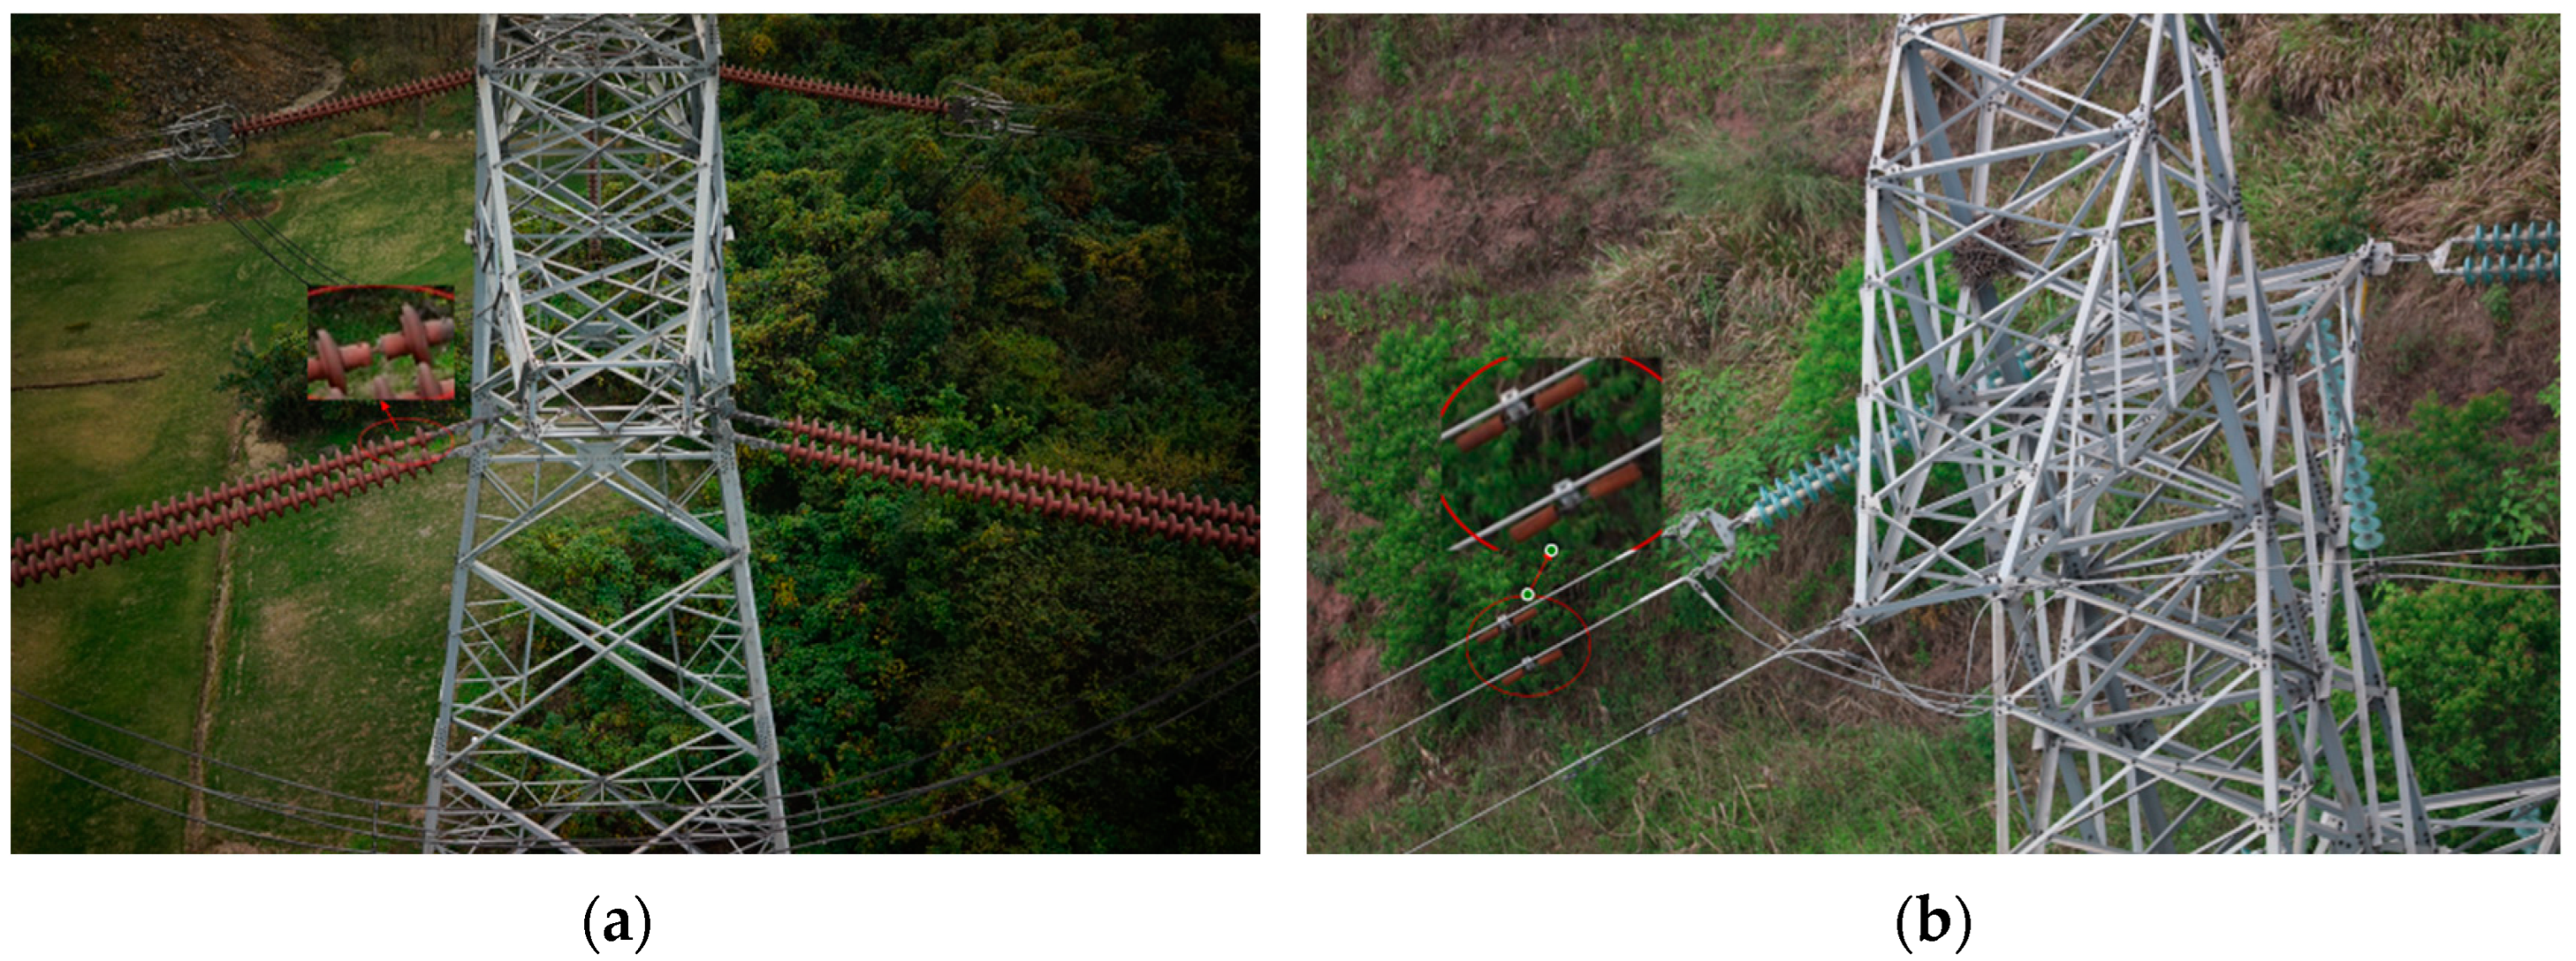
2.1. Datasets

The dataset used in this paper is provided by the State Grid Corporation of China. The dataset records fault images of transmission lines taken by M300-RTK. There are 3824 pictures in total. Each picture contains one or more targets. The target labels include four types of typical faults of transmission lines: Corrosion of insulators, insulator defects, bird’s nests, and anti-vibration hammers, corresponding to ‘Insulator’, ‘Defect’, ‘Nest’, and ‘Fzc_xs’ in the first row of Table 1. At the same time, the number of labels corresponding to each category is shown in the second row of Table 1. LabelImg software is used to label the image, and the dataset is divided by a ratio of 8:1:1 (training set: validation set: test set). The number of categories in each group is higher than that of the standard VOC2017 dataset in the production of the VOC format dataset; therefore, this dataset has the same training ability as the standard dataset in the sample size. Some faults are shown in Figure 1.

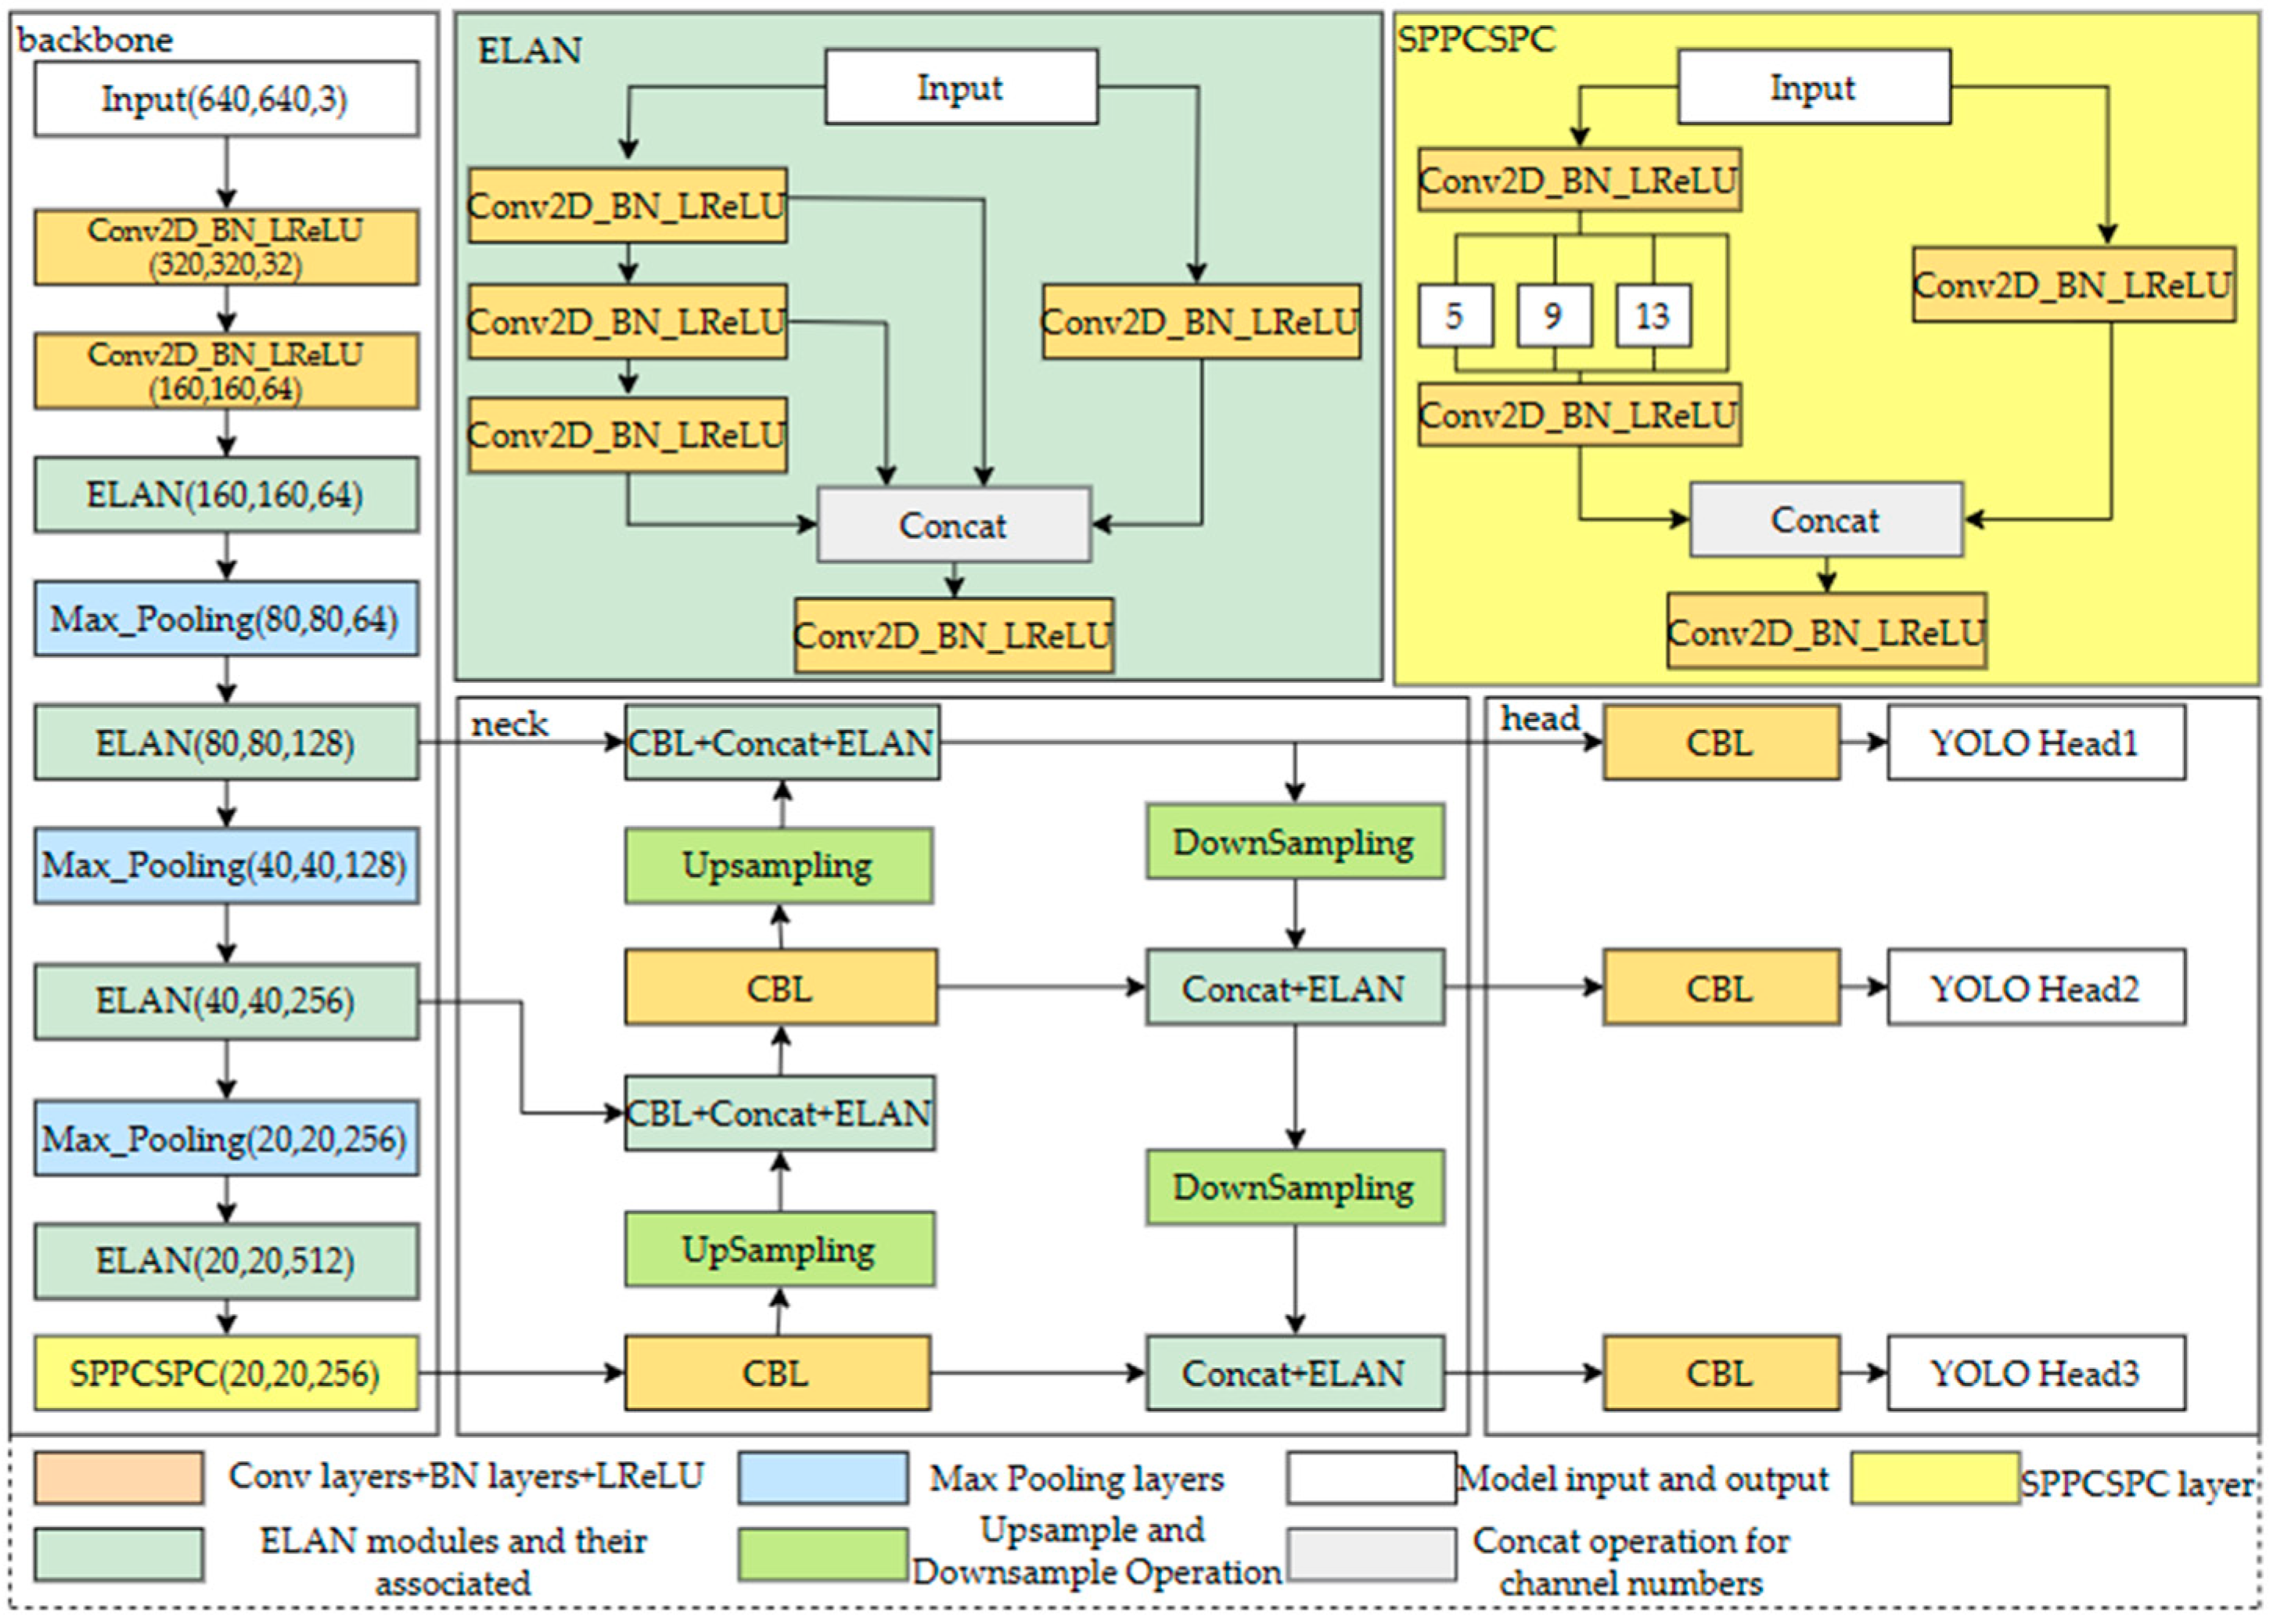
2.2. Overview of YOLOv7 Methods

The YOLOv7 algorithm is a new YOLO series algorithm proposed after the YOLOv4 and YOLOv5 algorithms. The detection speed and accuracy of YOLOv7, in the range of 5FPS to 160FPS, are ahead of the current mainstream target detection algorithms. YOLOv7-Tiny is a lightweight version of YOLOv7. The overall structure is shown in Figure 2. The model structure consists of three parts: feature extraction network (backbone), feature fusion network (neck), and prediction network (head).
For the feature extraction network, YOLOv7-Tiny adopts the ELAN (efficient layer aggregation networks) structure, which is an efficient layer aggregation network. ELAN is mainly composed of VOV-Net and CSP-Net. Its function is to avoid using too many transition layers and reduce those that are unnecessary. The necessary parameters shorten the feature extraction path and increase the extraction efficiency.
The feature fusion network still uses the PA-Net structure in YOLOv5. The top-down and bottom-up paths can extract multi-scale features from feature maps at different levels, capturing rich semantic and spatial information.
The prediction network consists of three convolution modules that output target classification information, localization information, and confidential information, and three prediction heads with different detection scales (80 × 80, 40 × 40, 20 × 20). Through three pieces of information, the model’s loss function can make better predictions on the classification and location of the target. The model loss calculation formula is as follows:
L c l s = t = 0 S × S j = 0 B I i j o b j c c l a s s e s p i c log p i c + t = 0 S × S j = 0 B I i j o b j c c l a s s e s 1 p i c log 1 p i c
Equation (1) is the classification loss function of the model, denoted as Lcls. Where S × S is the image input size 640 × 640, i represents the i-th square of the feature map, j represents the j-th prediction box predicted by the square, cclasses represents the correct category, pi (c) and pi (c) represent the predicted confidence score and the actual confidence score, respectively.
S I o U = A B A B v = 4 π 2 arctan w g t h g t arctan w h 2 α = v 1 S I o U + v L b o x = 1 S I o U + ρ 2 A , B c 2 + α v  
Equation (2) is the locus loss function of the target box, also known as the regression loss, notated as Lbox, which is mainly used as the CIoU loss function [33]. In Figure 3, box A is the real box, box B is the prediction box, and SIoU is the intersection ratio between the real box and the prediction box; box M is the smallest external rectangle containing box A and box B. Where ρ2(A, B) is the Euclidean distance between the centroids of the real box and the predicted box, i.e., the length of d in the diagram; c in Equation (2) is the diagonal length of the smallest outer matrix M that encloses box AB; wgt and hgt are the width and height of box A of the real box, and w and h are the width and height of box B of the predicted box. Compared with the traditional IoU, the CIoU introduces a penalty term v, which can better handle targets with different aspect ratios; it can measure the distance between the predicted box and the real box more accurately and improve the accuracy of target detection for the situation that boxes of different sizes have different overlap when the IoU values are the same, i.e., the problem of scale sensitivity.
L c o n f = i = 0 S × S j = 0 B I i j o b j C i log C i + 1 C i log 1 C i   - i = 0 S × S j = 0 B I i j n o b j C i log C i + 1 C i log 1 C i
Equation (3) is the confidence loss function of the target, denoted as Lconf. Among them, obj and nobj represent the presence or absence of the target in the grid, and Ci and Ci′ represent the categories of the real box and the predicted box. Then, the total loss function of YOLOv7-Tiny is composed of the addition of the three according to a certain ratio, such as Equation (4).
L t o t a l = 0.5 × L c l s + 0.05 × L b o x + L c o n f
Finally, during prediction, a large number of redundant prediction frames are eliminated after non-maximum value suppression and other processing operations, and finally, the prediction category with the highest confidence score is output, and the coordinate information of the target is returned by positioning the target.

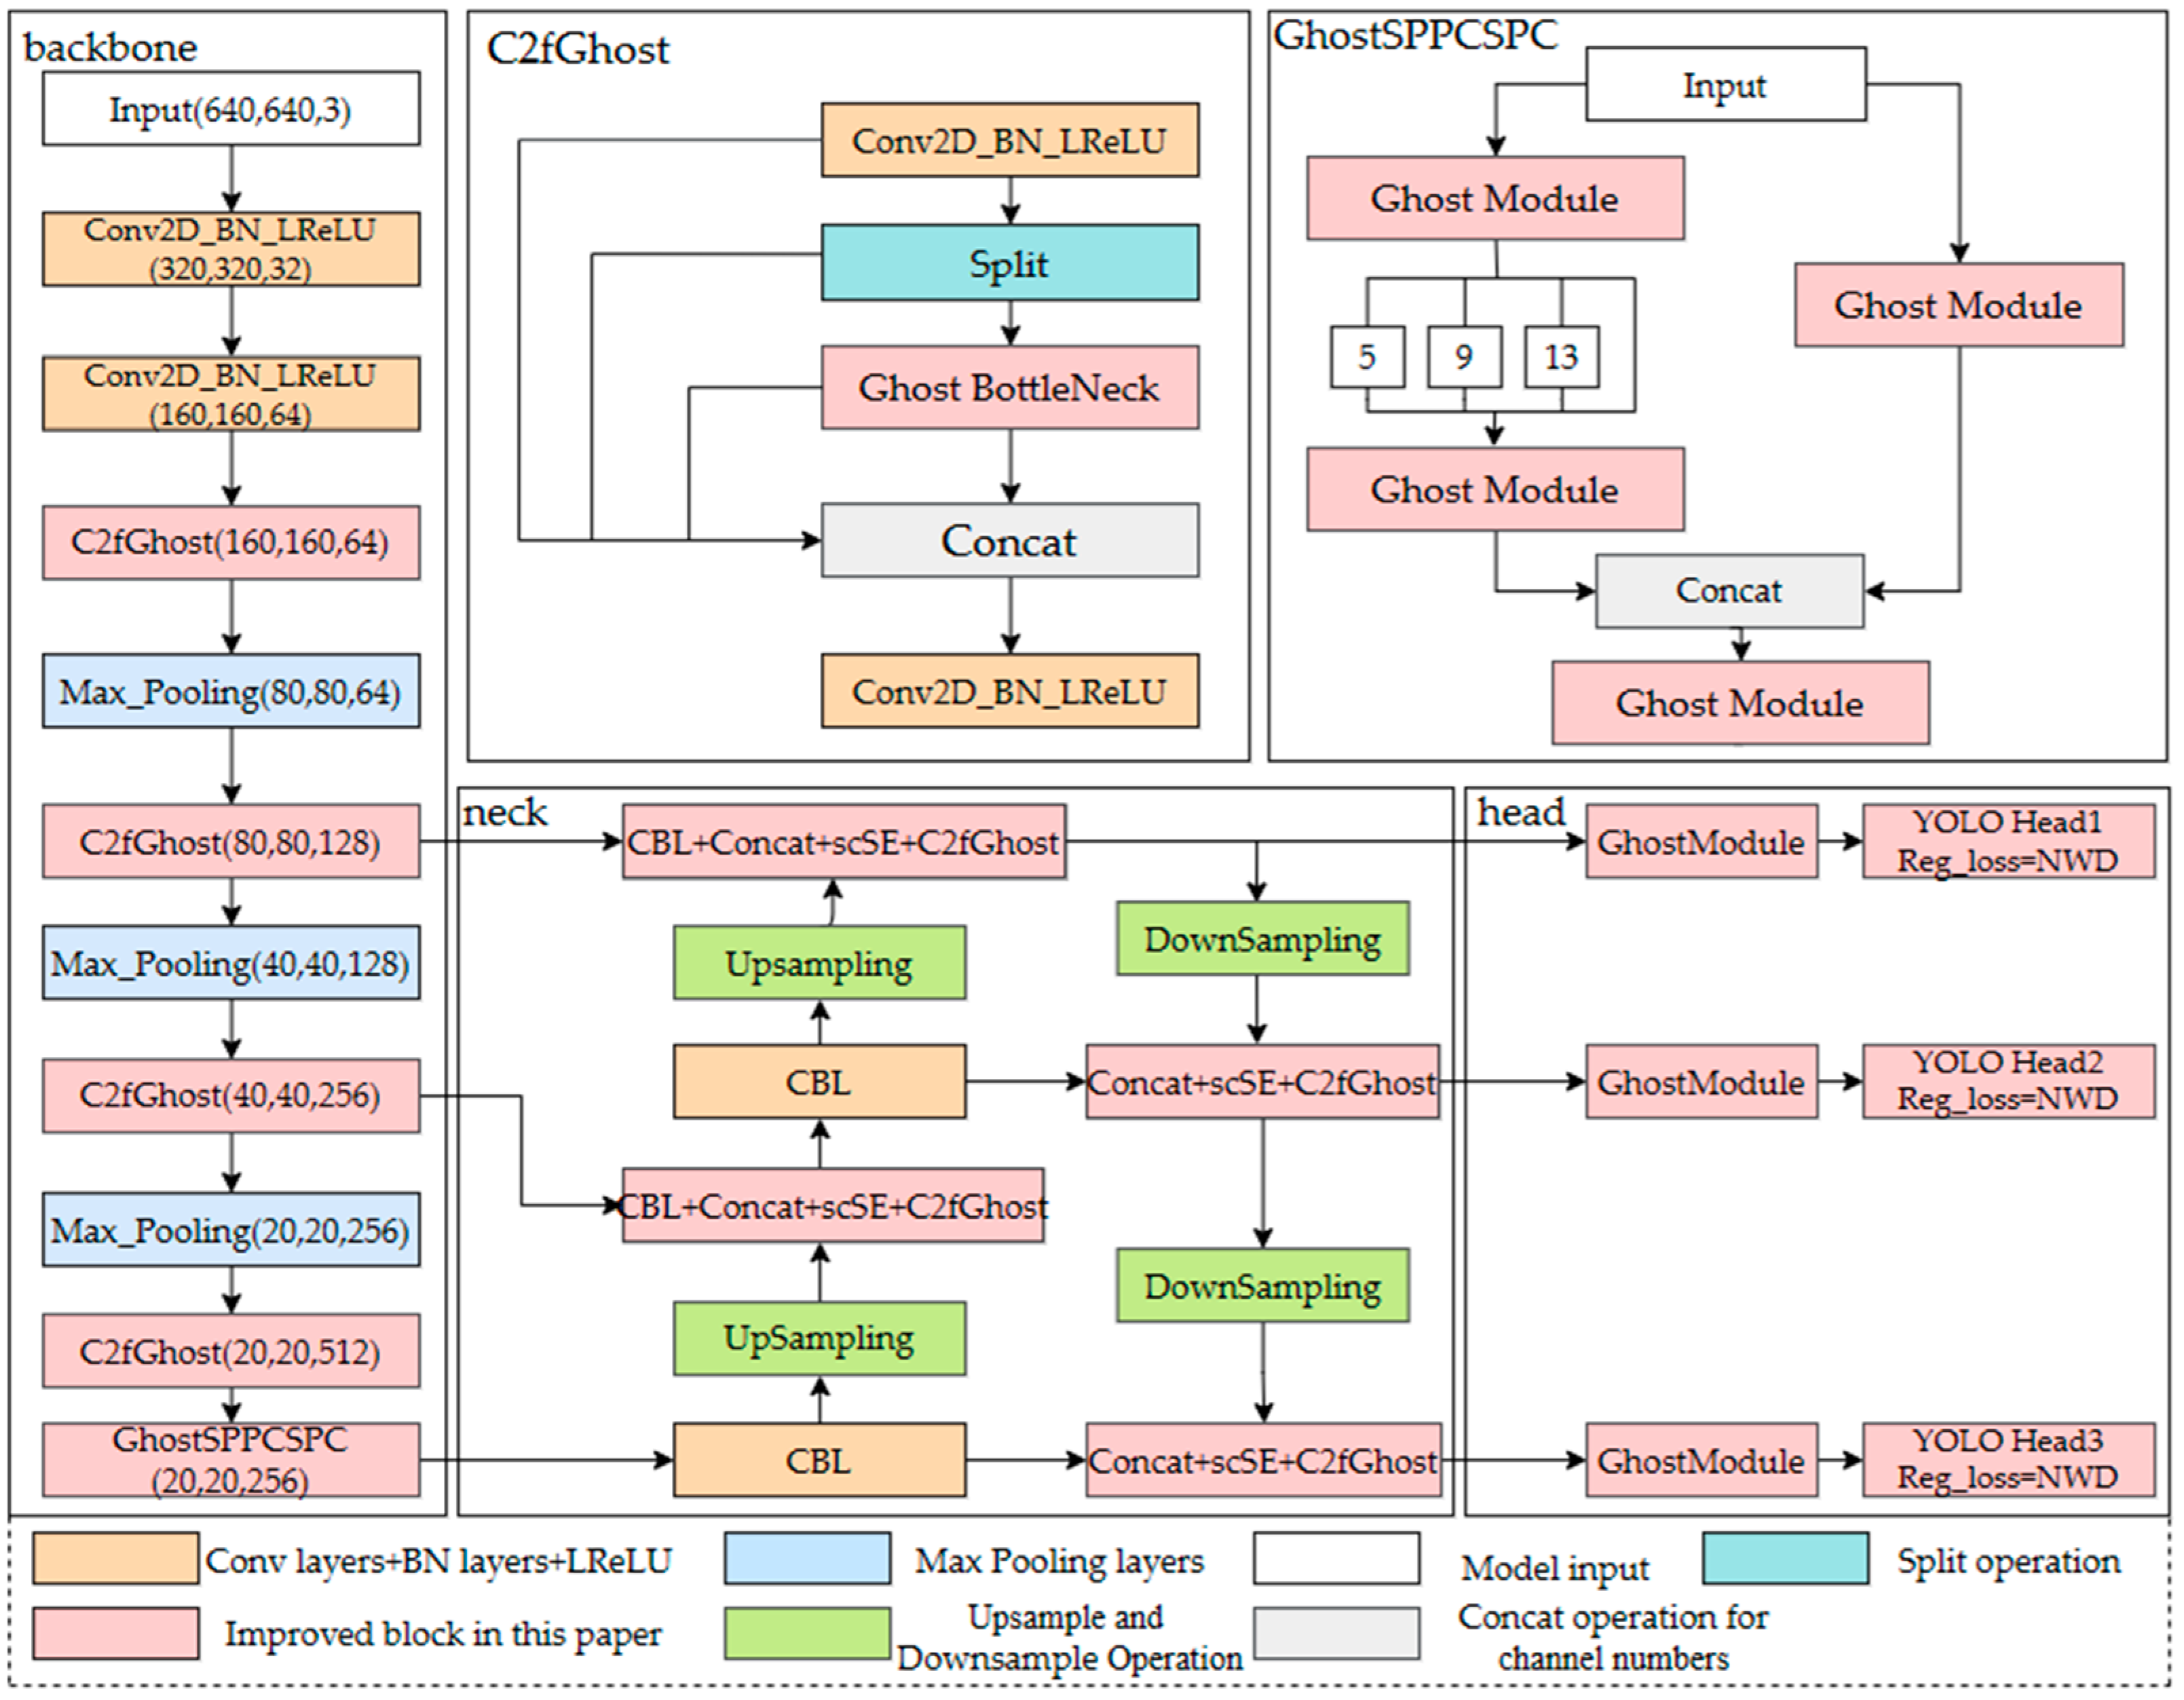
2.3. The Overall Architecture of TD-YOLO

During the test, it was found that YOLOv7-Tiny runs at a slow speed on the embedded device. The detection of complex and variable-scale faults and tiny target faults in the transmission line inspection process has missed detection and false detection, and the accuracy is low. Therefore, this paper proposes a TD-YOLO algorithm. The structure is shown in Figure 4.

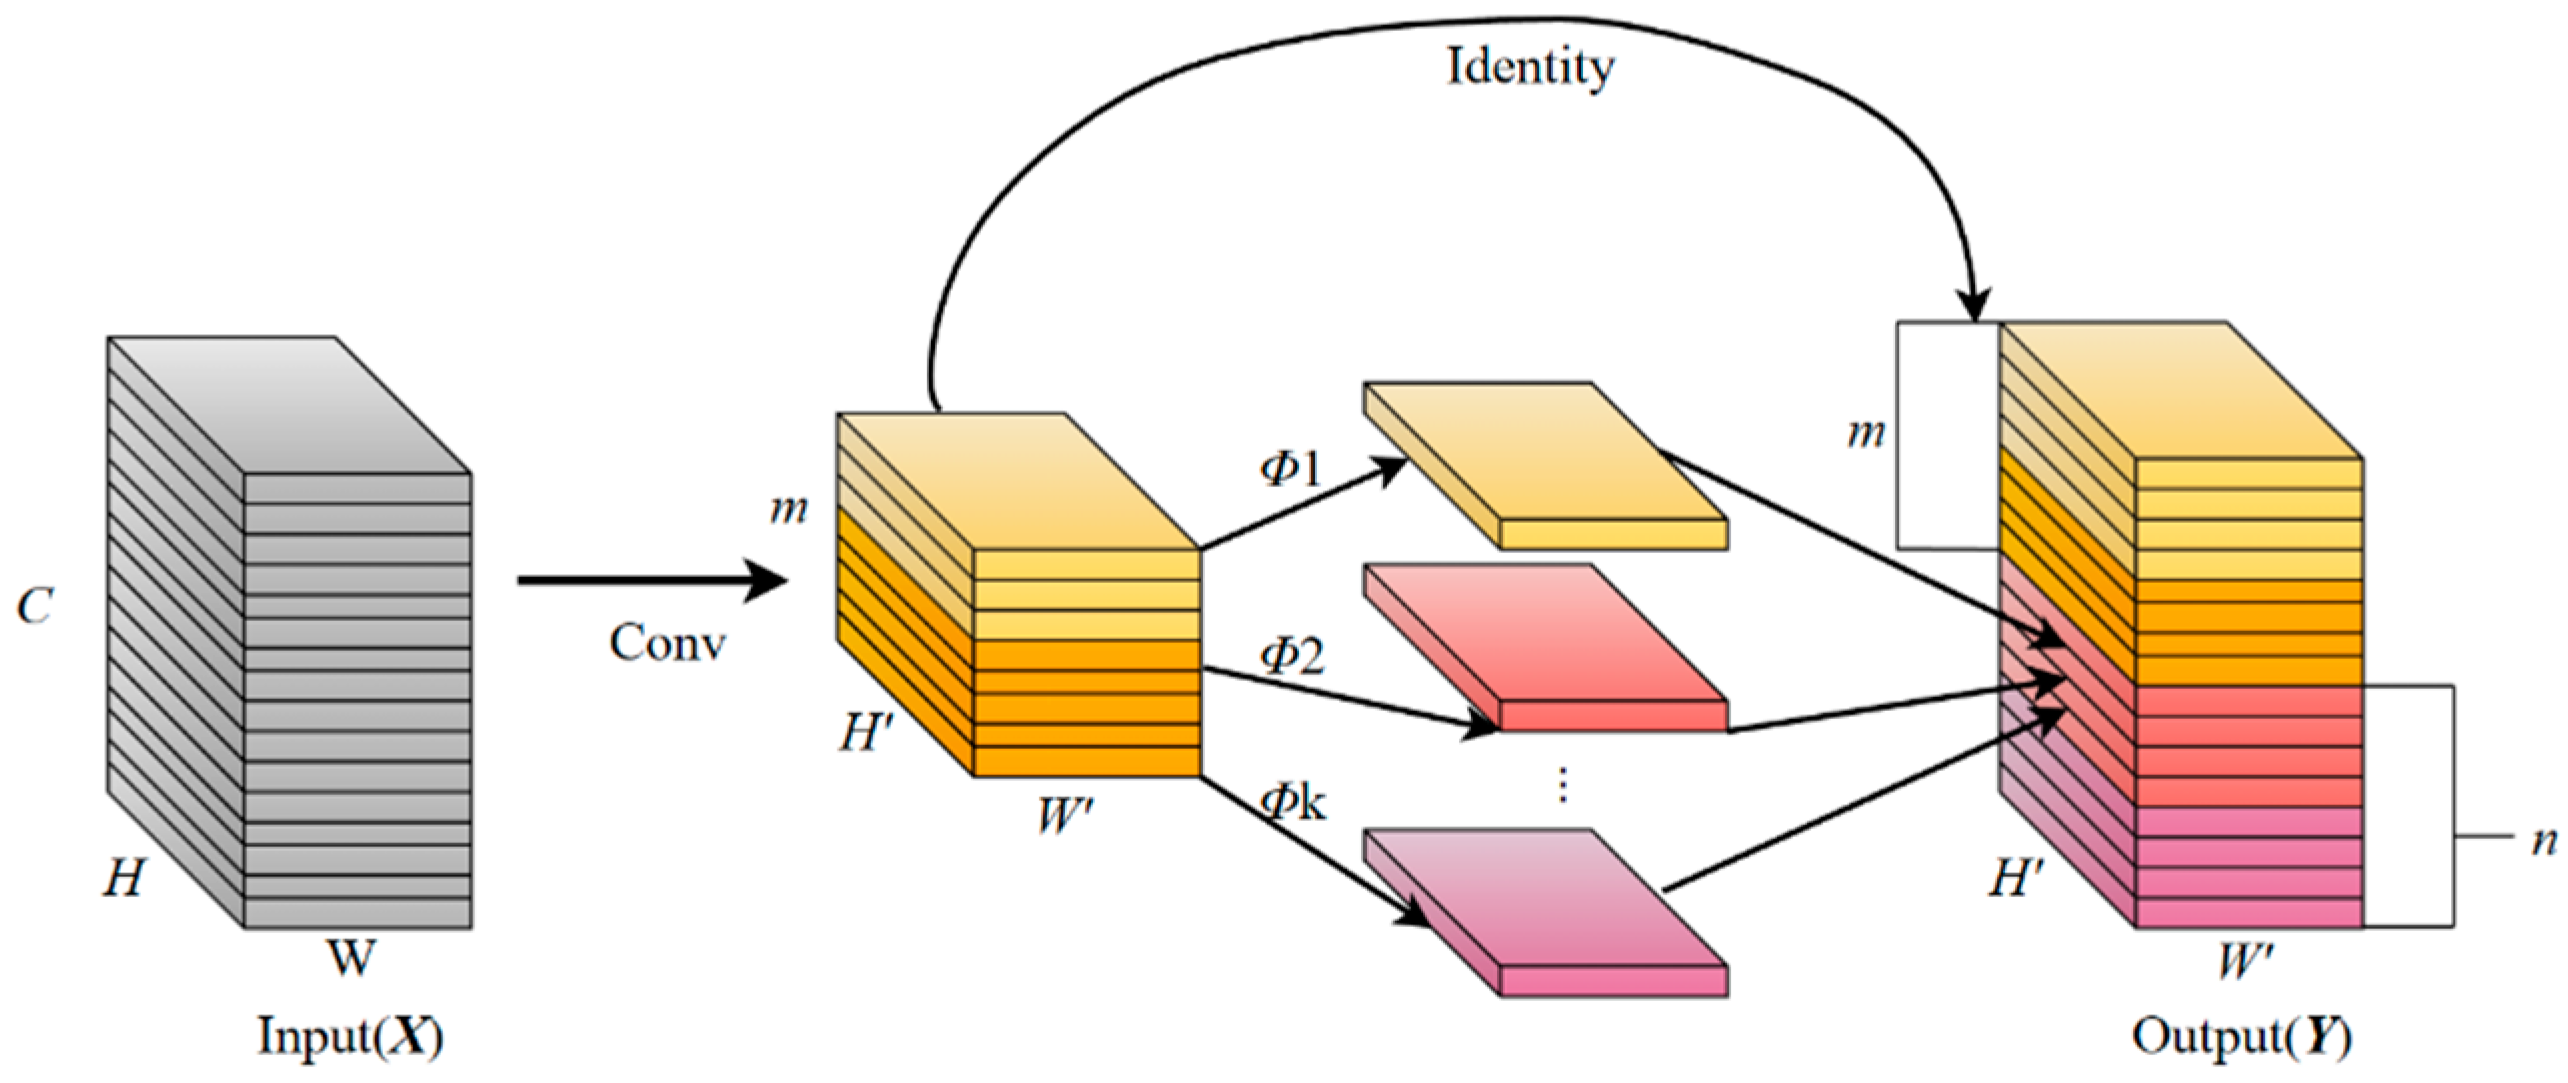
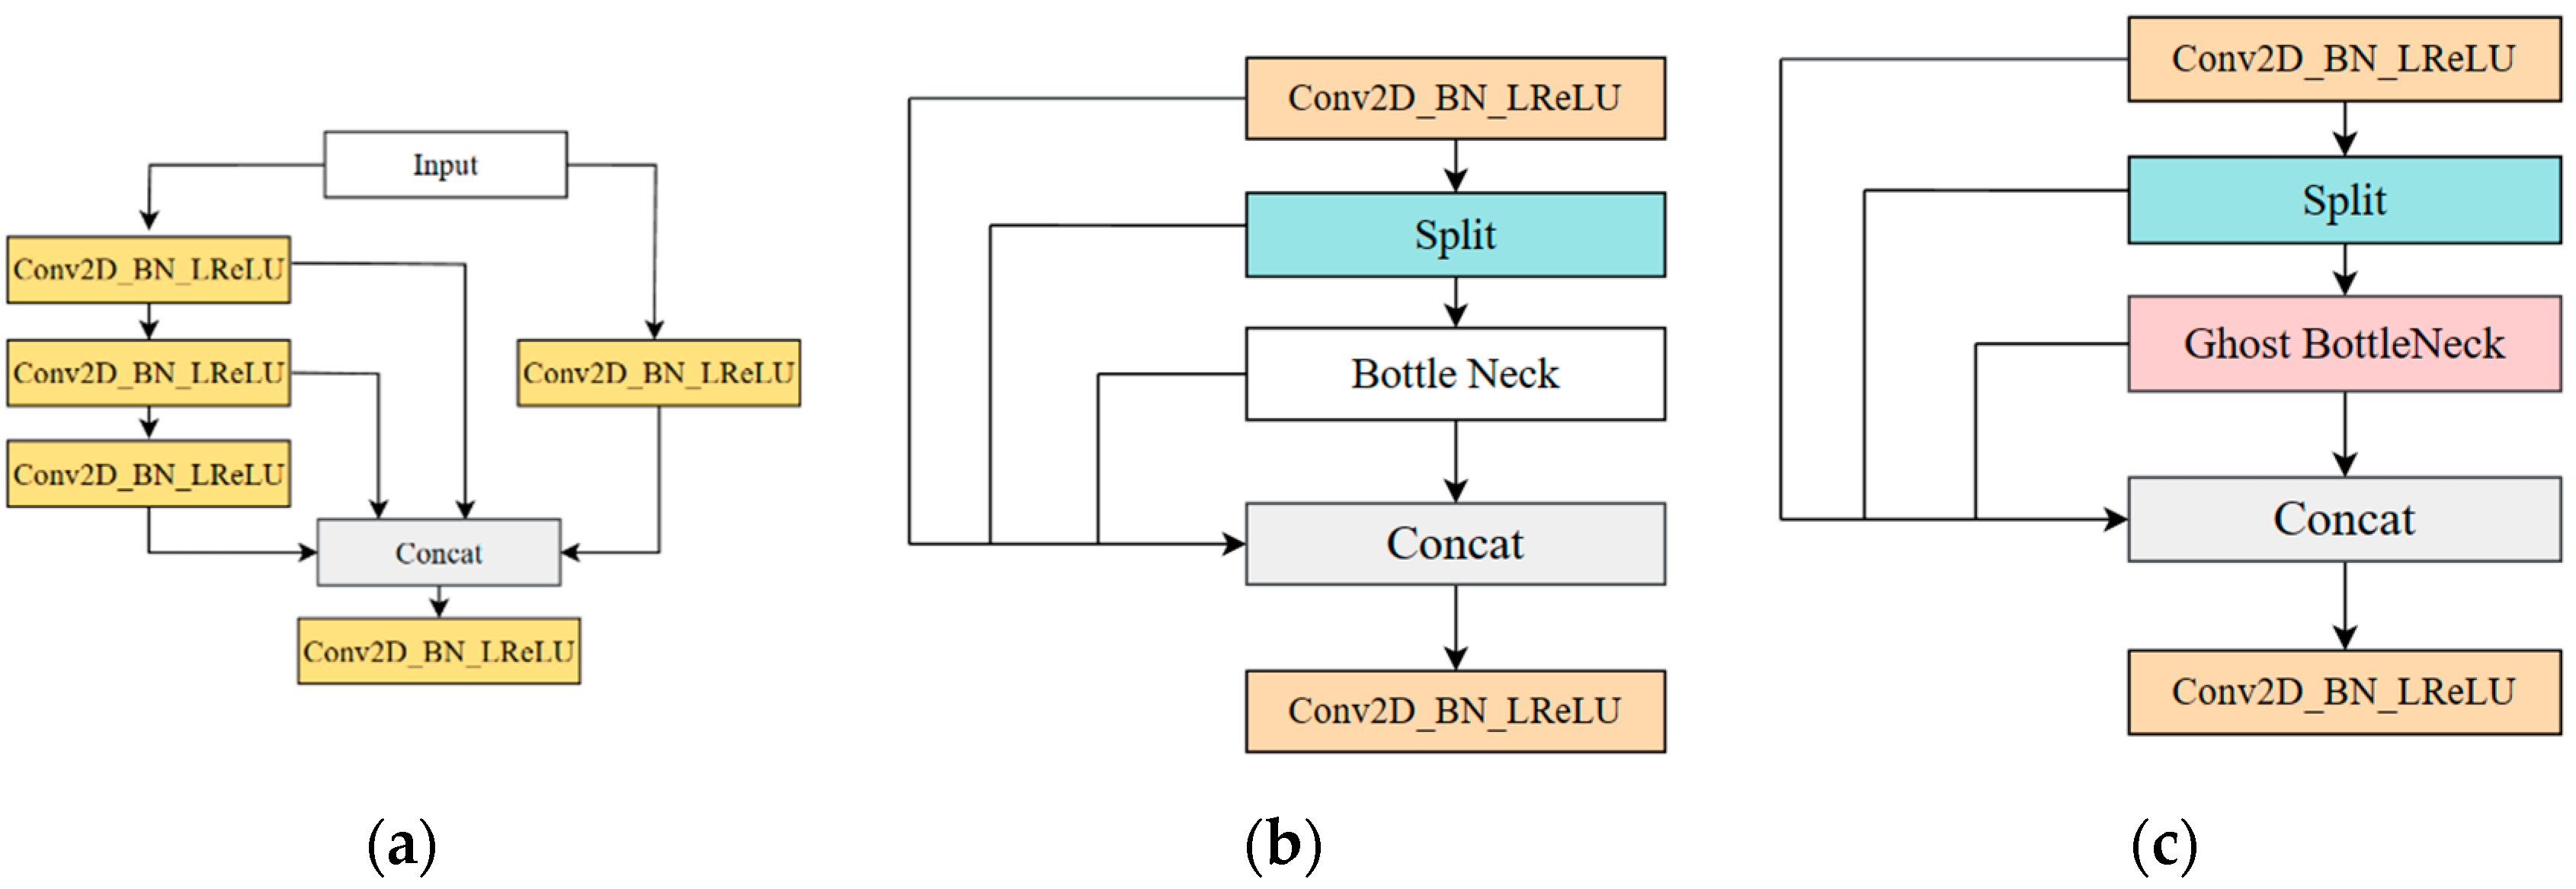
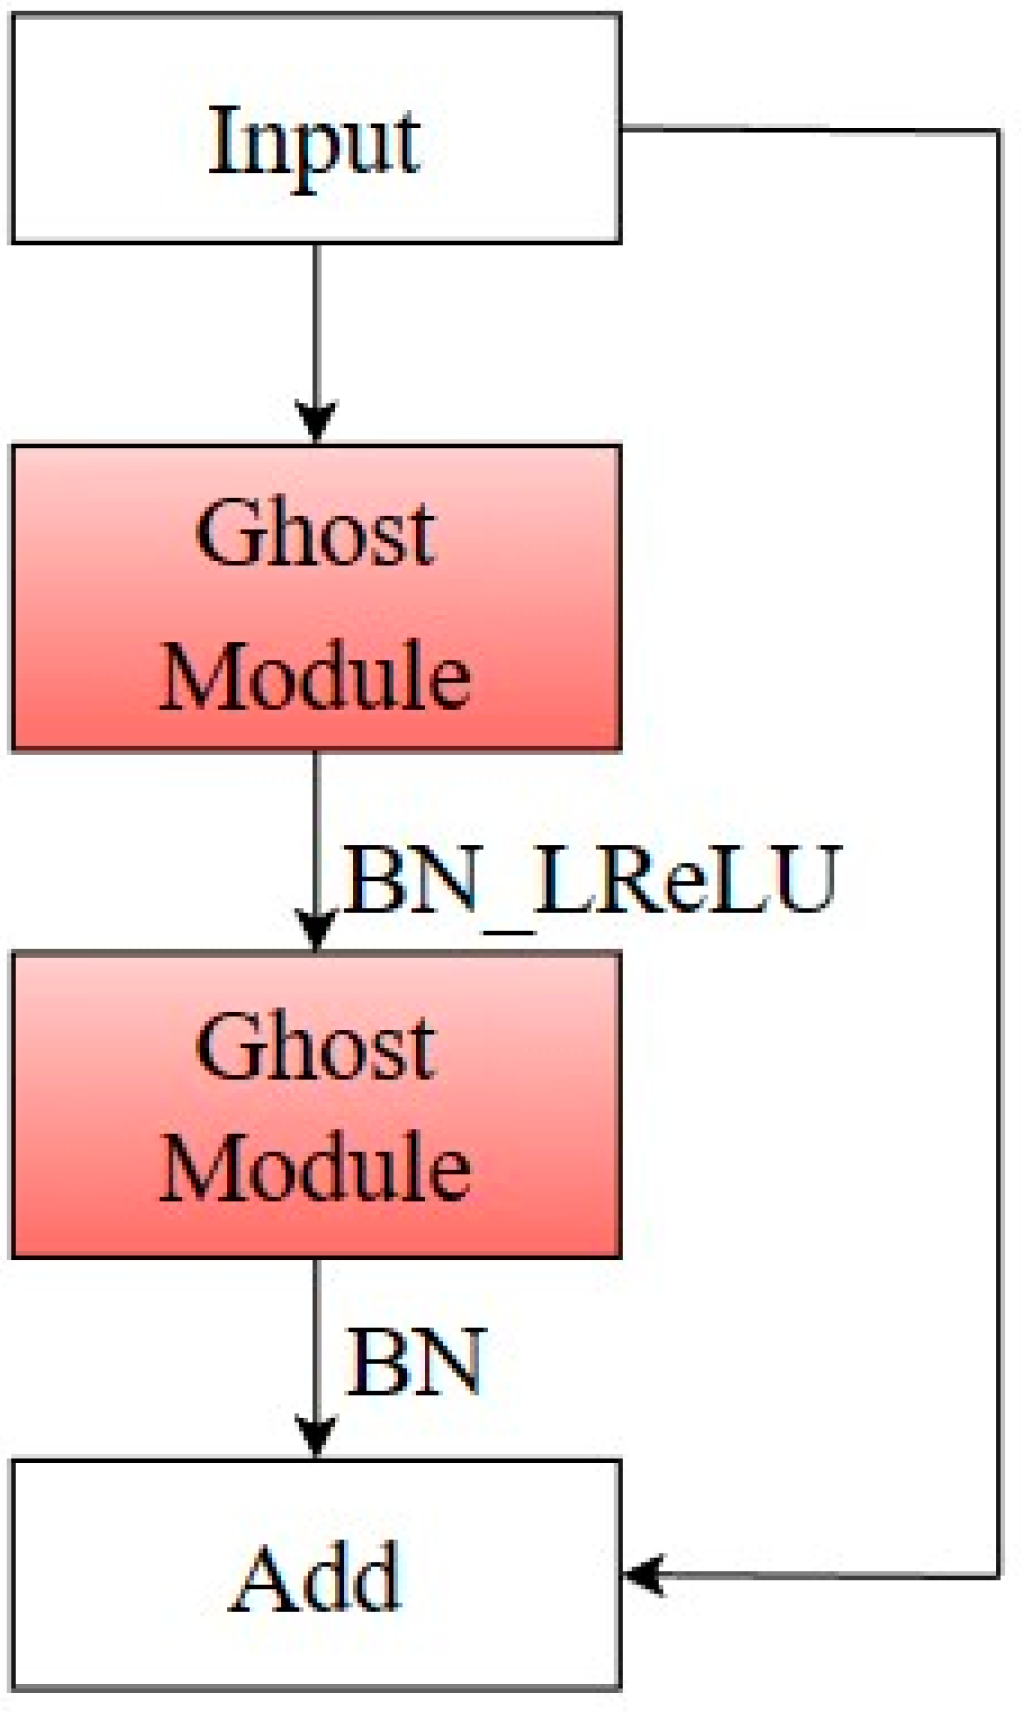
2.3.1. Various Improvements of Model Lightweight Based on the Ghost Module

Due to the limited computational resources required for UAV-carried embedded devices, the deployment of a model with many parameters to the UAV for detection is slow. It cannot meet the real-time detection requirements of this paper. Therefore, the approach of this paper is to consider the characteristics of each part of the YOLOv7 model, combined with the Ghost lightweight module (the Ghost structure is shown in Figure 5), and design a light optimization strategy that is best suited to fit with each part of the network. Based on the above analysis, this paper proposes the C2fGhost structure in the feature extraction network, the GhostSPPCSPC structure in the feature fusion network, and the Ghost (head) part combined with the Ghost module in the prediction part.
Compared with the unnecessary, redundant feature maps generated in the normal convolution process, the Ghost module uses simple and easy-to-operate linear operations to enhance features and increase channels’ mining information from original features with a small computational cost, which is a lightweight and efficient convolution module. The principle of the Ghost module is shown in Equation (5) [34]:
Y = X × f , X R C × H × W , Y R C × H × m y i j = ϕ i j y i ,   i = 1 , ,   m , j = 1 , , s
As can be seen from Equation (5), the Ghost module operates by first generating m original feature maps using fewer convolution kernels in the common convolution way (*) and later generating the remaining n feature maps by performing a simple linear transformation Φ on the already developed, mn.
Firstly, to address the problem of information redundancy caused by the multi-layer intersection of ELAN modules, this paper designs a C2fGhost structure based on the idea of residuals combined with a lightweight module. The original C2f structure (shown in Figure 6b) continues the advantages of the ELAN structure of multi-gradient triage while adding the residual branch of BottleNeck to enable the model to learn a richer feature representation. Based on the Ghost module for C2f, this paper is further improved by replacing BottleNeck with Ghost BottleNeck (shown in Figure 7).
The C2fGhost structure connects features at different levels to achieve multi-scale perception and strengthen the model’s ability to detect targets with medium-scale changes in transmission lines. At the same time, through the residual branch of Ghost BottleNeck, the model can learn richer feature representations and still, the advantages of low complexity and a small amount of calculation of the Ghost module are retained. Then, while retaining the original structure of SPP, the ghost replacement is performed on some convolutions to achieve the purpose of lightweighting the model, which is denoted as GhostSPPCSPC. Finally, the convolution module that is in front of the three different scale detection heads in the head part is replaced by the Ghost module, and the model is further simplified, which is recorded as GhostConv(Head), and the calculation amount and model parameters are significantly reduced.

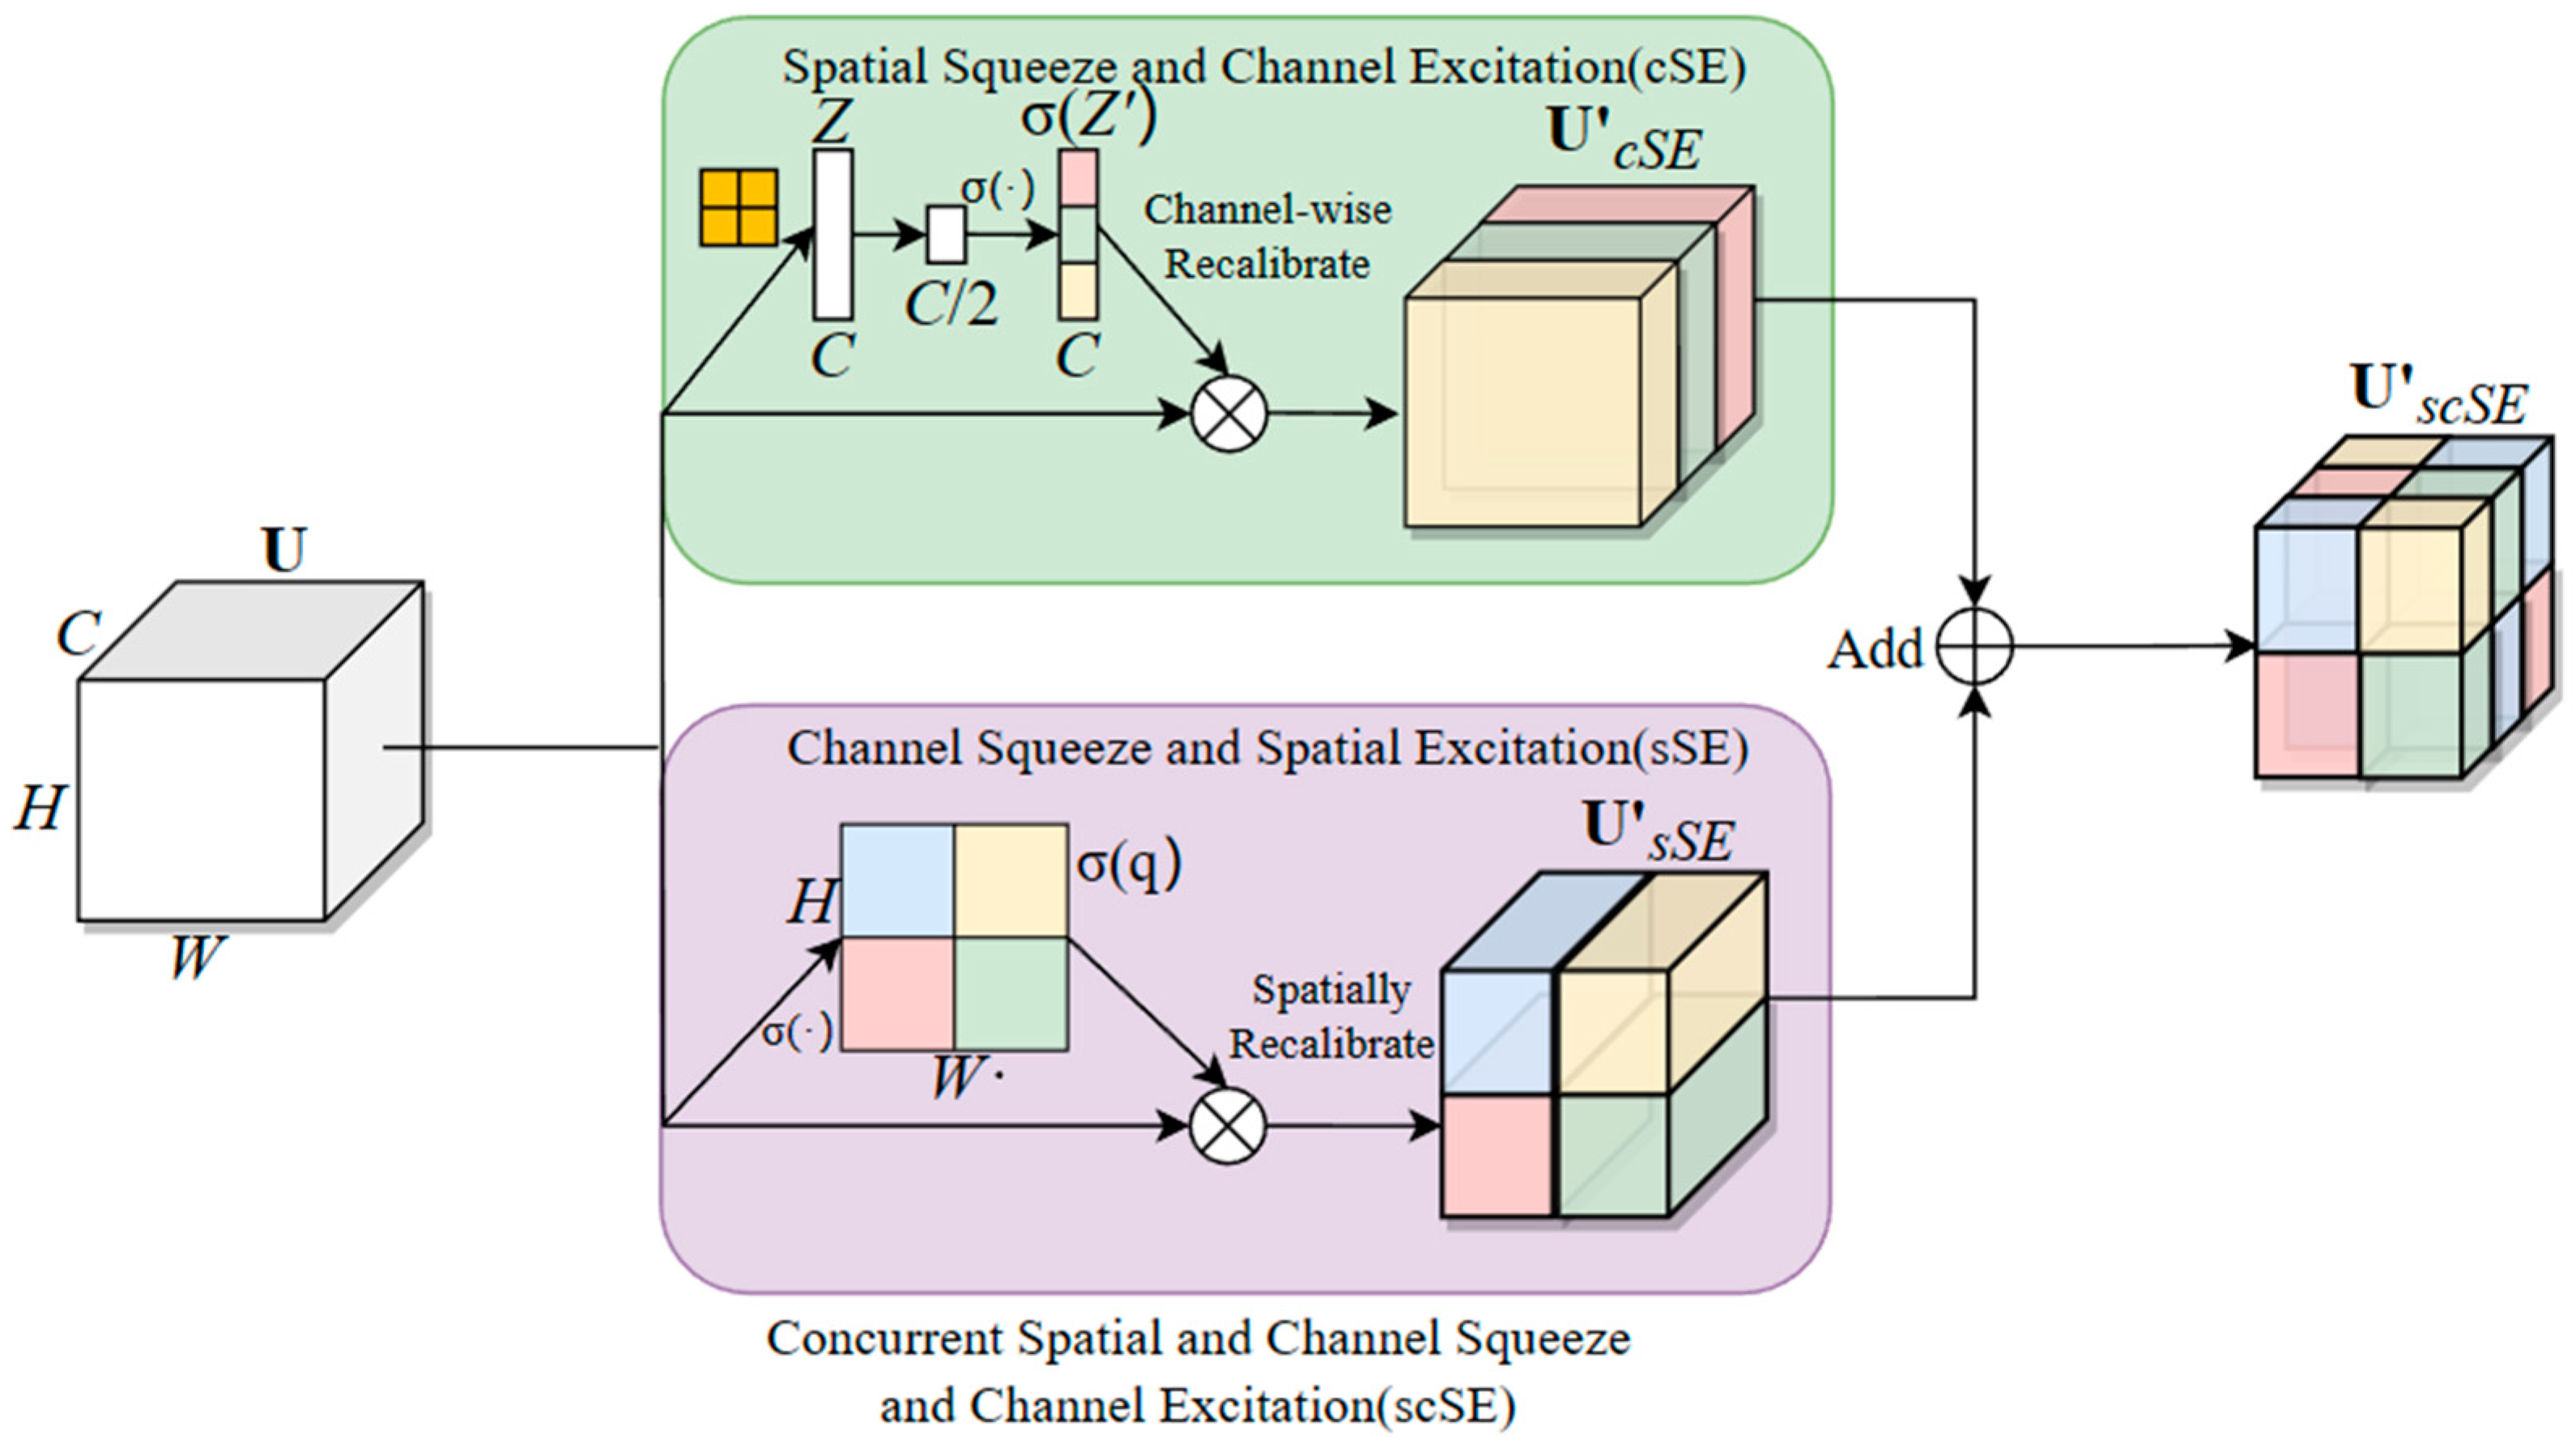
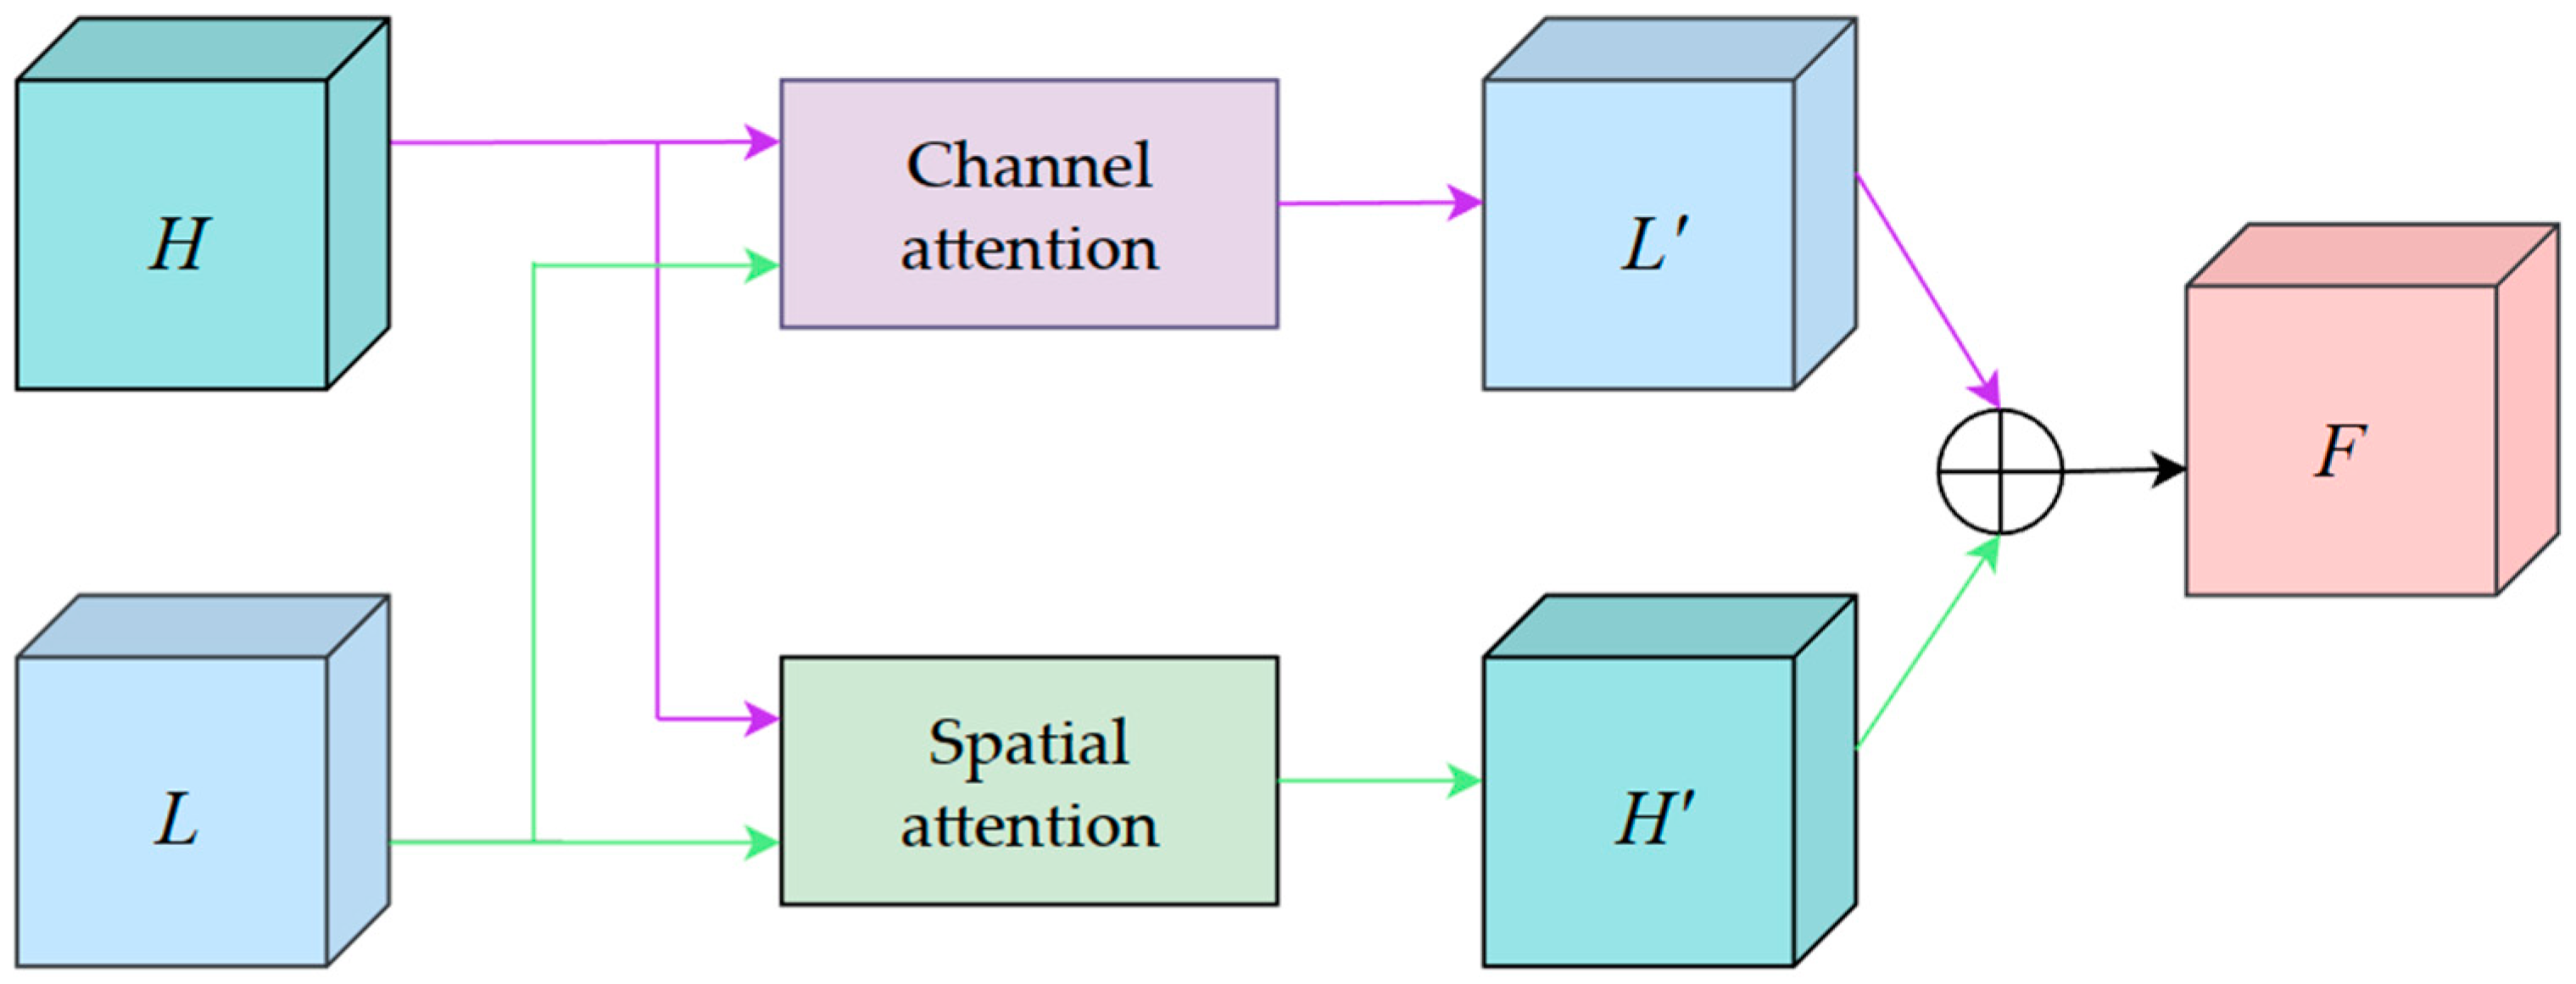
2.3.2. Improvement of Multi-Scale Feature Fusion Based on Feature-Balanced Network

In the inspection of transmission lines, the scale of fault targets spans large scales, and it is challenging to detect multi-type faults and multi-scale features. Different detection targets can be effectively identified if a higher weight ratio is assigned to the detection targets, improving detection accuracy. The attention mechanism refers to the behavior of human beings to selectively pay attention to the important parts of the received information. It can assign different proportions of weights according to different detection objects and solve the problem that multi-scale features are challenging to identify. However, a single spatial or channel attention mechanism has limitations, and it is stretched in target detection tasks with frequent scale changes. Therefore, this paper chooses the currently widely used attention mechanism, scSE [35], that combines spatial and channels. Compared with the attention mechanism CBAM [36], which also belongs to the combination of spatial and channel mechanisms, it is primarily used in the medical field of high-precision segmentation. It has the advantage of accurate recognition of fault multi-scale information. Its structure is shown in Figure 8.
The scSE process principle is shown in Equation (6). The calculation of the scSE attention mechanism consists of two steps, cSE and sSE. In cSE, the input feature map U is transformed into a feature map of 1 × 1 × C after global pooling Z. It is then normalized using a sigmoid function, noted as activations σ (Zi), and these activations are adaptively adjusted to ignore the less important channels and emphasize the important ones, and finally, the calibrated feature map (U’cSE) is obtained by channel-wise multiplication. In the sSE part, U undergoes a 1 × 1 × 1 convolution into a 1 × H × W feature map, with each value σ(qi, j) corresponding to the relative importance of the spatial information (i, j) for a given feature map. This recalibration provides the more important relevant spatial locations and ignores the irrelevant ones. The final output of the two is summed to obtain scSE [35].
U = u 1 , u 2 , , u C ,   u i R H × W Z k = A v g P o o l 2 D ( U ) = 1 H × W i H j W u k i , j ,   Z R 1 × 1 × C U c S E = F c S E U = σ Z 1 u 1 , σ Z 2 u 2 , , σ Z C u C q = W s q · U ,   W s q R 1 × 1 × C × 1 , q R H × W U s S E = F s S E U = σ q 1 , 1 u 1 , 1 , , σ q i , j u i , j , , σ q H , W u i , j , u i , j R 1 × 1 × C U s c S E = U c S E + U s S E
However, there is still the problem of the complex fusion of features at different scales in the model. Hence, this paper addresses the problem by proposing a feature-balanced network (FBN) that combines PA-Net with the scSE attention mechanism. The feature-balanced network forms the neck part of the improved algorithm, and the structure is shown in Figure 9.
The entire network takes the high-level feature map H and the low-level feature map L as output and fuses the output features of the two branches. In the channel attention branch, high-level feature maps guide low-level features with channel attention masks. The channel attention cSE enhances the network’s feature extraction in transmission lines, leading to a low-level feature map L′ with rich semantic information. In the spatial attention branch, a spatial attention mask guides the high-level feature map using the low-level feature map. The spatial attention module sSE strengthens the capture of spatial information, resulting in a high-level feature map H′ with spatial information. Finally, after the two are fused, a feature quantity containing spatial and channel information is output, and then the deep and shallow features are fused through PA-Net to balance the multi-scale features.

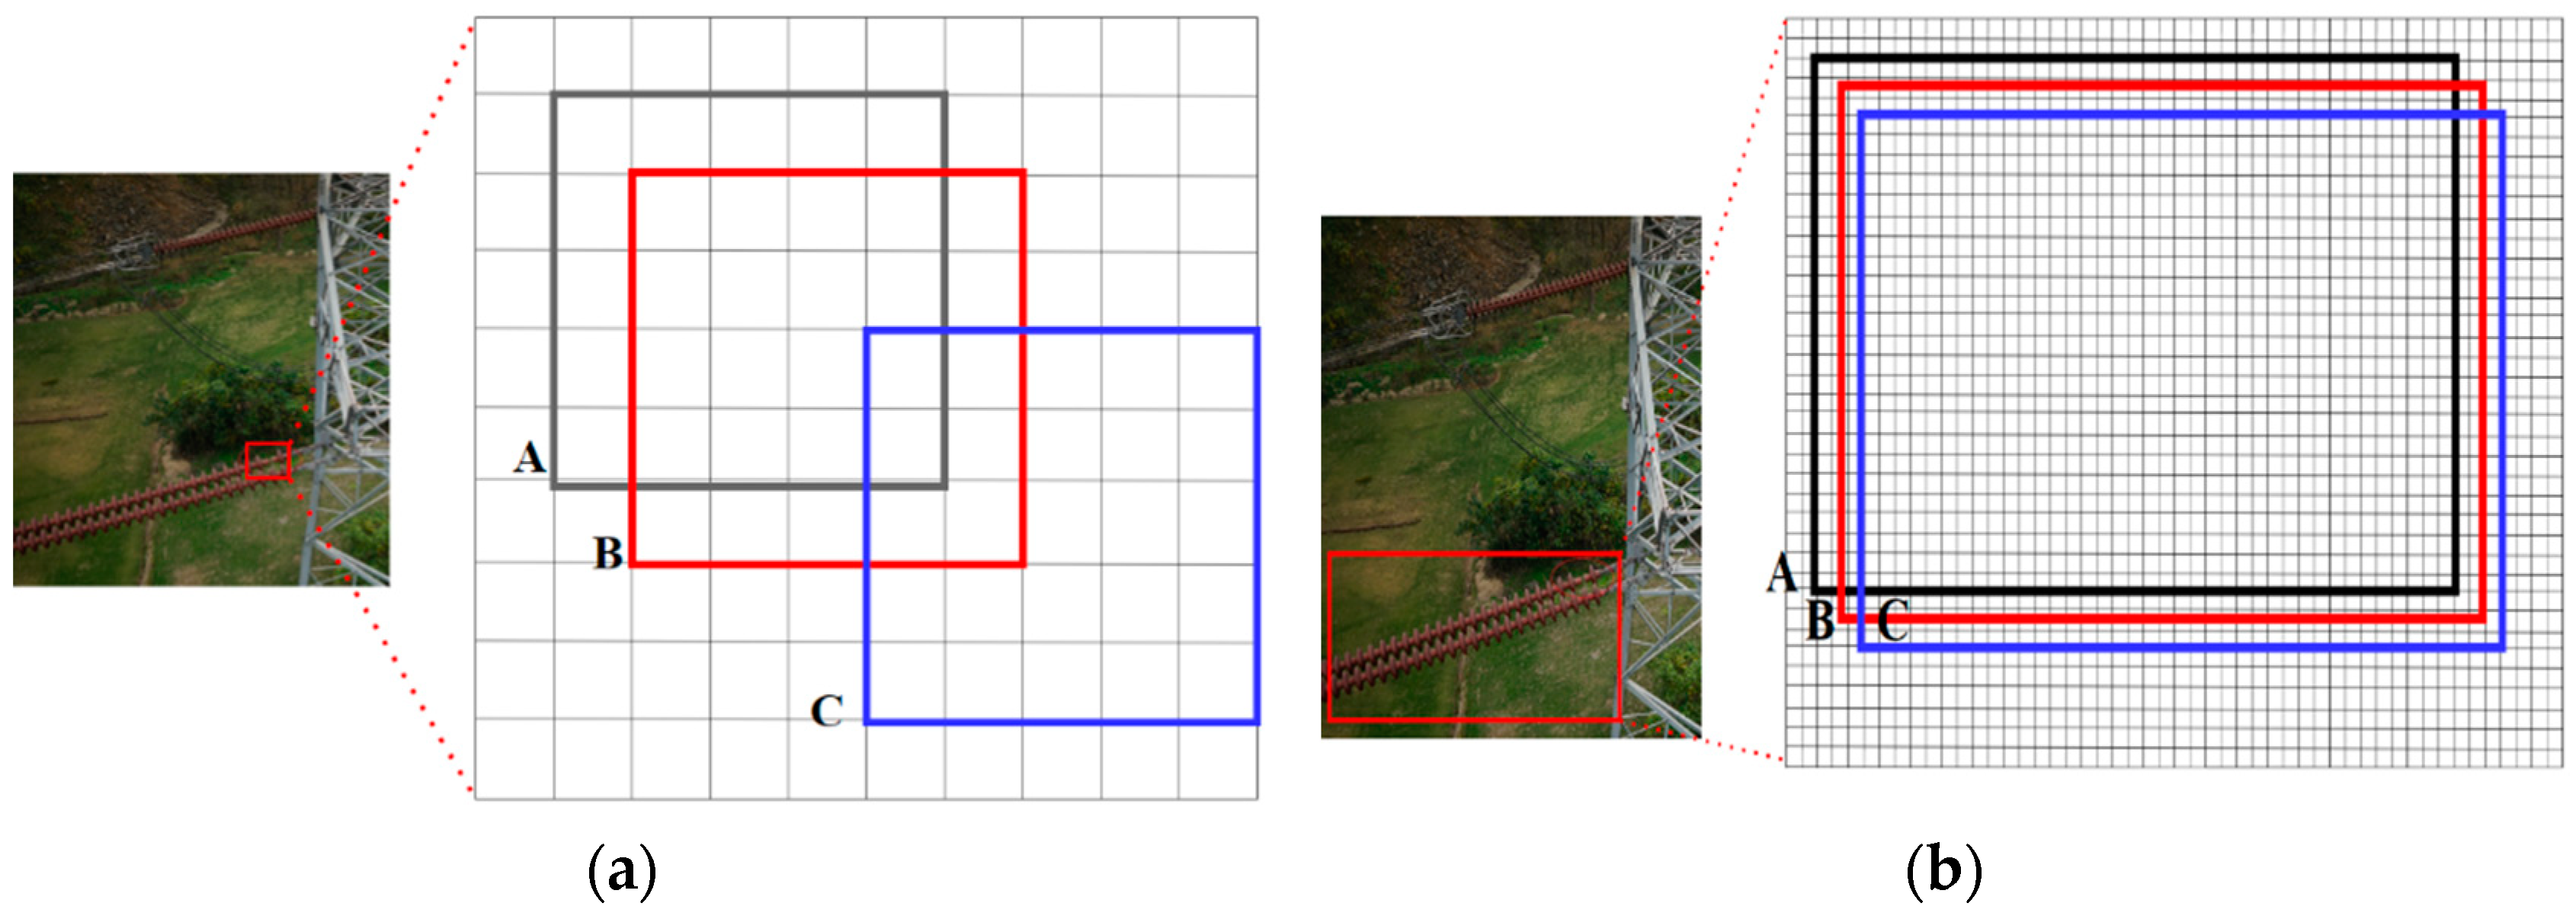
2.3.3. Small Target Detection Optimization Based on NWD Loss Function

When the object-to-image ratio is less than 0.1, it can be called a small object, a relative definition of small objects [34]. The anti-vibration hammer corrosion and insulator damage in the detection objects of this paper can be divided into small target ranges, as shown in Figure 9. Also, in Table 2 of 4.5, the results show that the detection accuracy of the anti-vibration hammer is the lowest. Hence, the detection optimization for small targets is the focus and difficulty of this paper. To solve this problem, TD-YOLO first introduces the NWD loss function for small object detection to replace part of the CIoU of the localization loss in the YOLOv7-Tiny loss function. Secondly, it explores the fusion ratio of NWD and CIoU so that the algorithm can improve the detection accuracy of small objects while retaining the advantage of the fast training speed of CIoU, effectively reducing the amount of calculation of the model.
CIoU is very sensitive to the position deviation of small targets that occupy fewer pixels [37]. If there is a slight position deviation in the position of the tiny target, the intersection of union (IoU) will drop significantly, greatly affecting the model accuracy. Taking Figure 10a as an example, damaged insulators belong to small objects, while insulators belong to ordinary objects, and the bounding boxes generated by them are shown in Figure 11. Box A represents the ground-truth bounding box, and boxes B and C represent the predicted bounding boxes with 1-pixel and 4-pixel diagonal deviation, respectively; thus, the corresponding intersection ratios can be calculated.
For the small target in Figure 11a, the IoU changes as follows:
I o U = A B A B = 0.53   I o U = A C A C = 0.06
For the normal target in Figure 11b, the IoU changes as follows:
I o U = A B A B = 0.9   I o U = A C A C = 0.65
It can be seen from Equations (7) and (8) that for small targets, a minor position deviation leads to a significant IoU drop (from 0.53 to 0.06). The IoU drop (from 0.9 to 0.65) is not evident for ordinary objects under the same position deviation. This means that the CIoU is very sensitive to the position deviation of small targets that occupy fewer pixels. If there is a slight position deviation in the position of the tiny target, the IoU will drop significantly, which will greatly affect the model’s accuracy.
Therefore, TD-YOLO chooses the NWD loss function that is insensitive to objects of different scales. NWD uses a two-dimensional Gaussian distribution to model the peripheral bounding box of the object, which can better describe the weight of different pixels, where the importance of pixels decreases from the center to the boundary. Bounding box A and bounding box B can be converted into the distribution distance between two Gaussian distributions. This new measurement method can evaluate the similarity between the model boundary and the Gaussian distribution and can more accurately judge the position information between the two boxes. To continuously improve the performance of the detector, the principle of NWD is shown in Equation (9) [38].
μ = c x c y , Σ = w 2 4 0 0 h 2 4 W 2 2 N a , N b = c x a , c y a , w a 2 , h a 2 T , c x b , c y b , w b 2 , h b 2 T 2 2 N W D N a , N b = exp W 2 2 N a , N b C
In Equation (9), cxa, cya, wa, ha, cxb, cyb, wb, and hb are the center coordinates, height, and width of bounding boxes A and B, and according to box A = (cxa, cya, wa, ha), box B = (cxb, cyb, wb, hb) can construct the inscribed ellipse of frame A and frame B; then, model the two-dimensional Gaussian distribution N (μ, Σ) according to the Gaussian density, and the Gaussian distribution of frame A and frame B is Na, Nb; C is the constraint quantity of the dataset, and the calculation of NWD is realized through this process. NWD is a better way to measure the similarity between two frames, and its insensitivity to differently scaled targets makes it more suitable for detecting small targets, which improves the accuracy of detecting anti-vibration hammer corrosion and insulator breakage significantly in this paper.

3. Experimental Results

3.1. Experimental Environment

This paper adopts the deep learning framework based on the PyTorch 1.7.1 environment; the environment is Ubuntu 20.04, python 3.7.11, CUDA = 11.4, and the training graphics card is configured as an NVIDIA RTXA6000/48 G graphics card. The processor is an Intel Xeon Platinum 8171 M CPU@2.60 GHz. The RAM is 96 G. The graphics card used by the local test computer is an NVIDIA RTX 3060 Ti, the processor is an AMD Ryzen5 5600 X, and the RAM is 32 G.

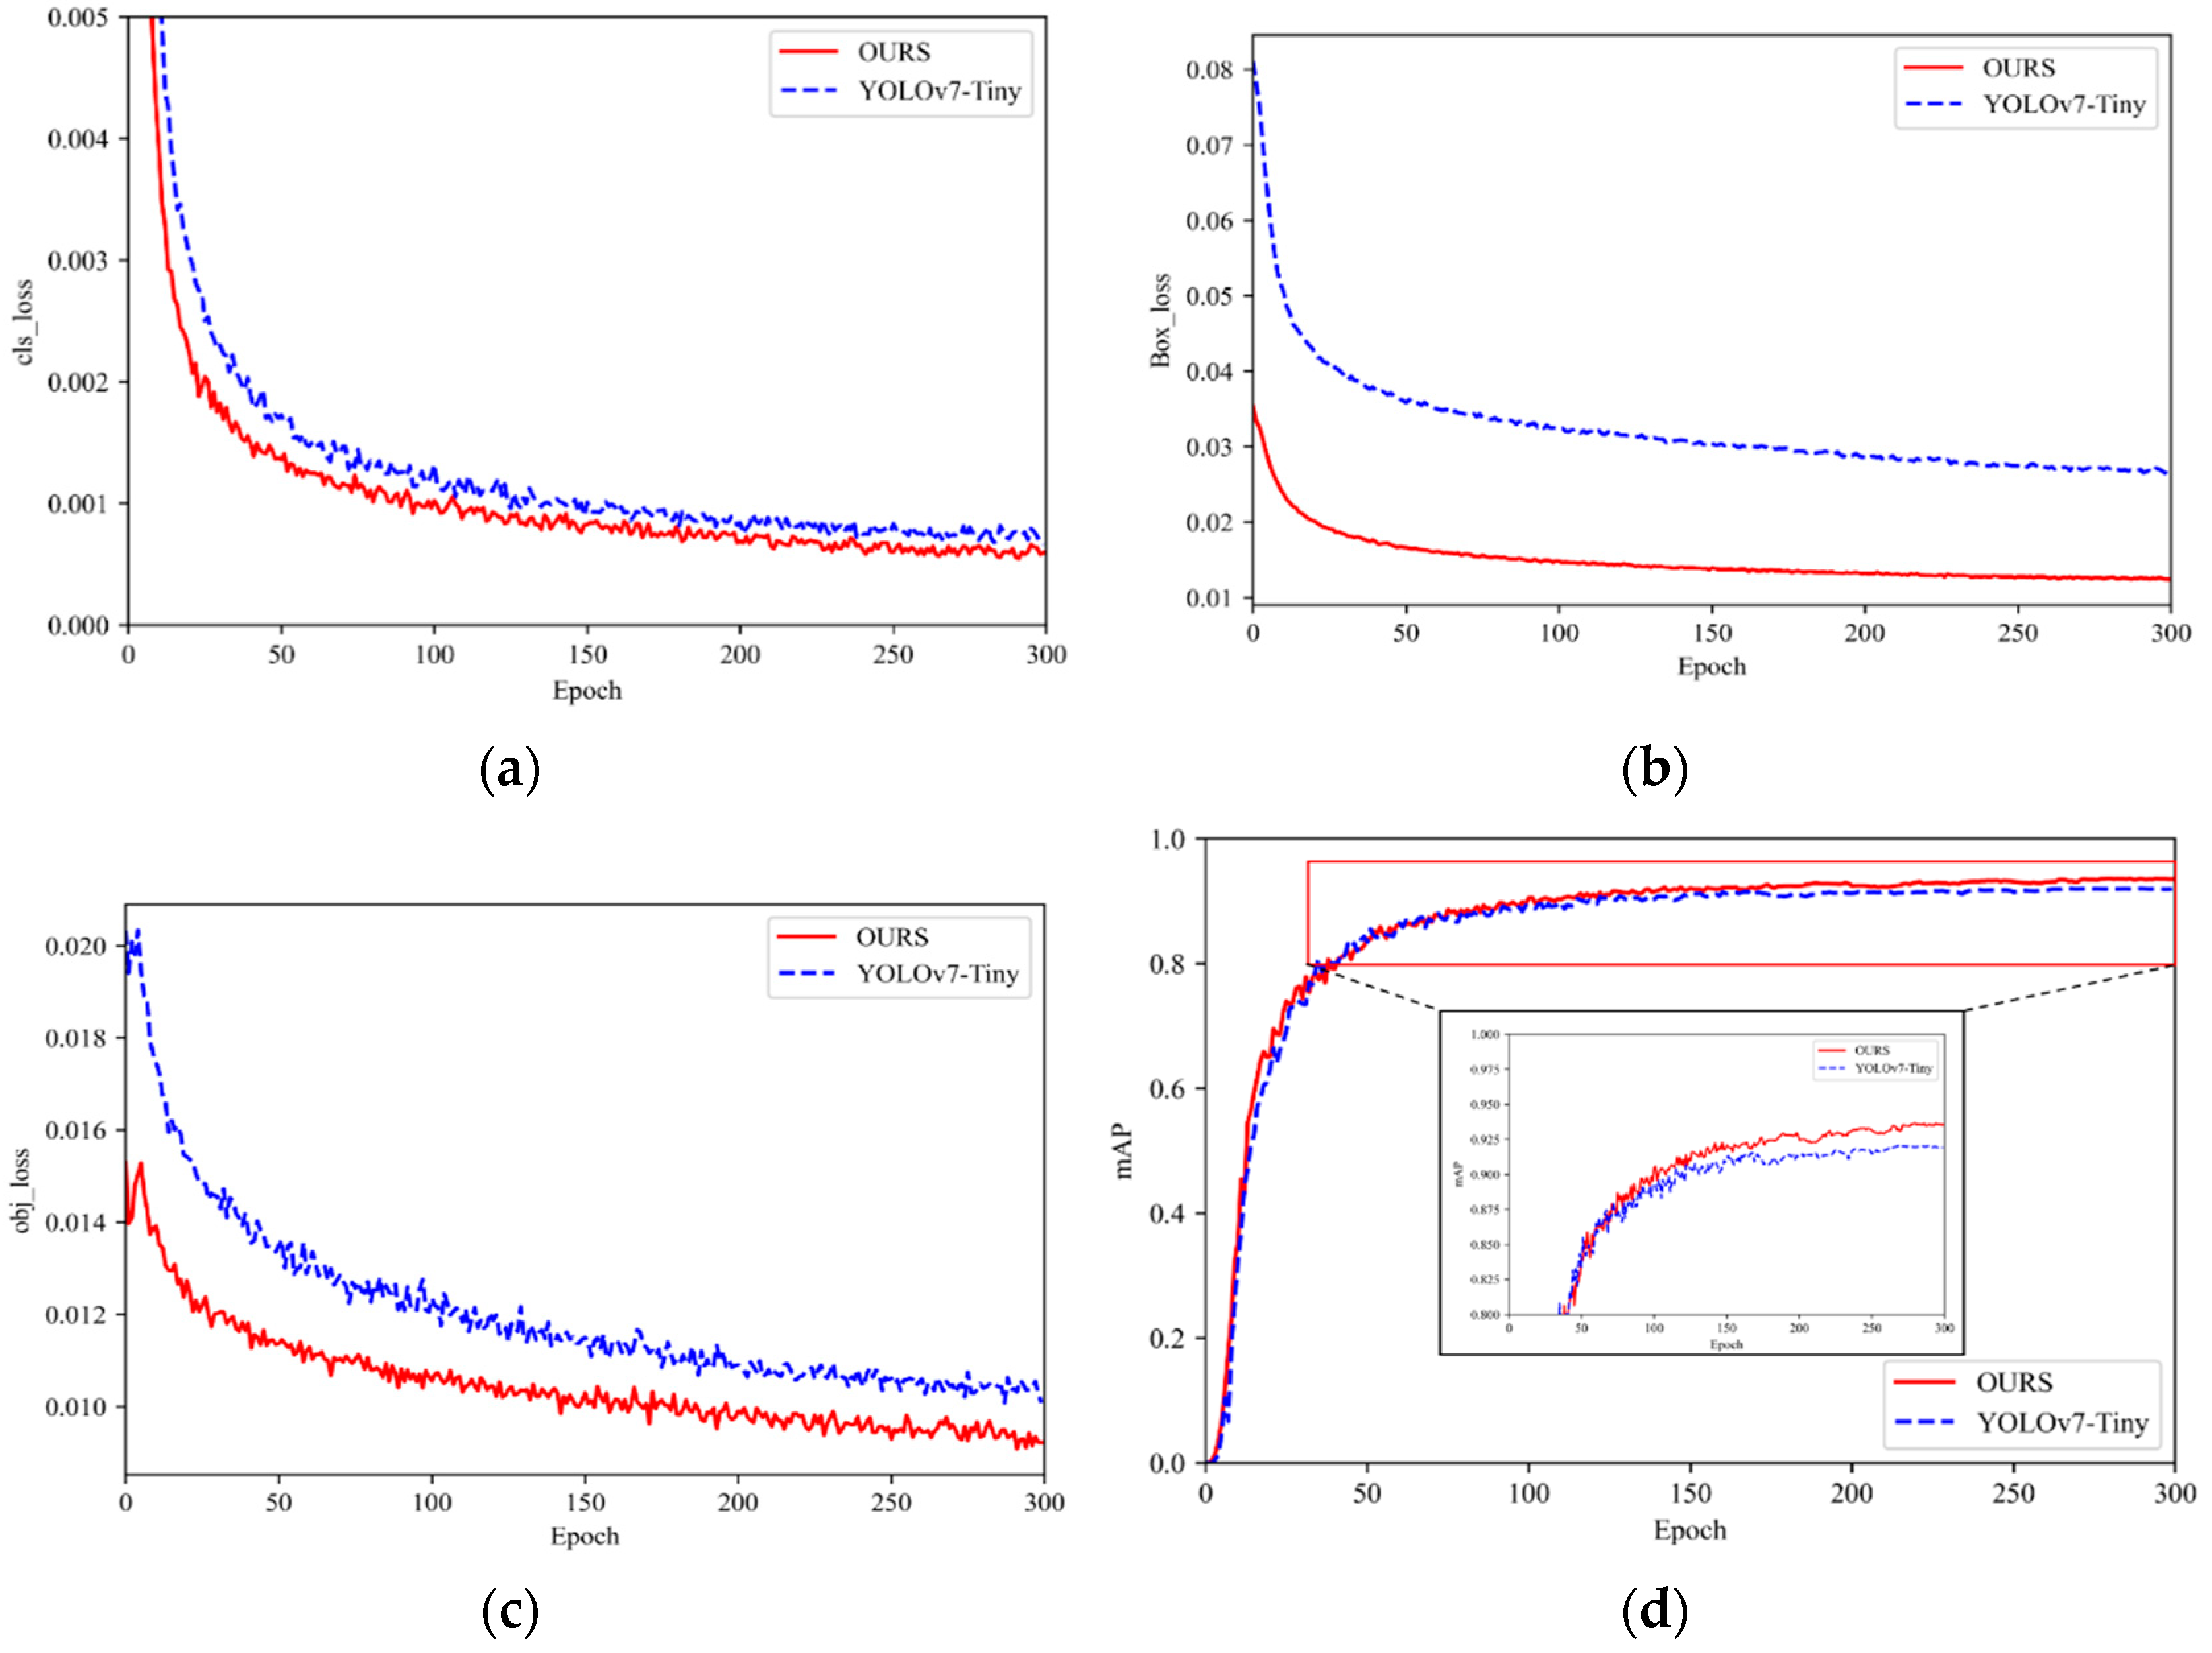
3.2. Training Process and Parameter Settings

In this paper, the backbone network is significantly modified in the improvement process; therefore, pre-training weights are not applicable. To reduce the likelihood of the model falling into a local optimum, a stochastic gradient descent (SGD) optimizer is used. The training batch was set to 8, and 300 rounds were trained. A cosine annealing learning rate was used, and a decaying learning rate was applied to the bias layer to improve the convergence speed of the model to enhance the diversity of the data with the robustness of the model itself. Figure 12a–c show the three loss curves before and after the model’s improvement. It can be seen that the improved model has improved compared to the original model, especially in Figure 12b. For the dataset containing more small targets in this paper, the improvement of the localization loss effect after replacing the NWD is particularly obvious. From Figure 12d, it can be seen that the improved model has a significant improvement in mAP, which verifies the feasibility of the improved algorithm in this paper.

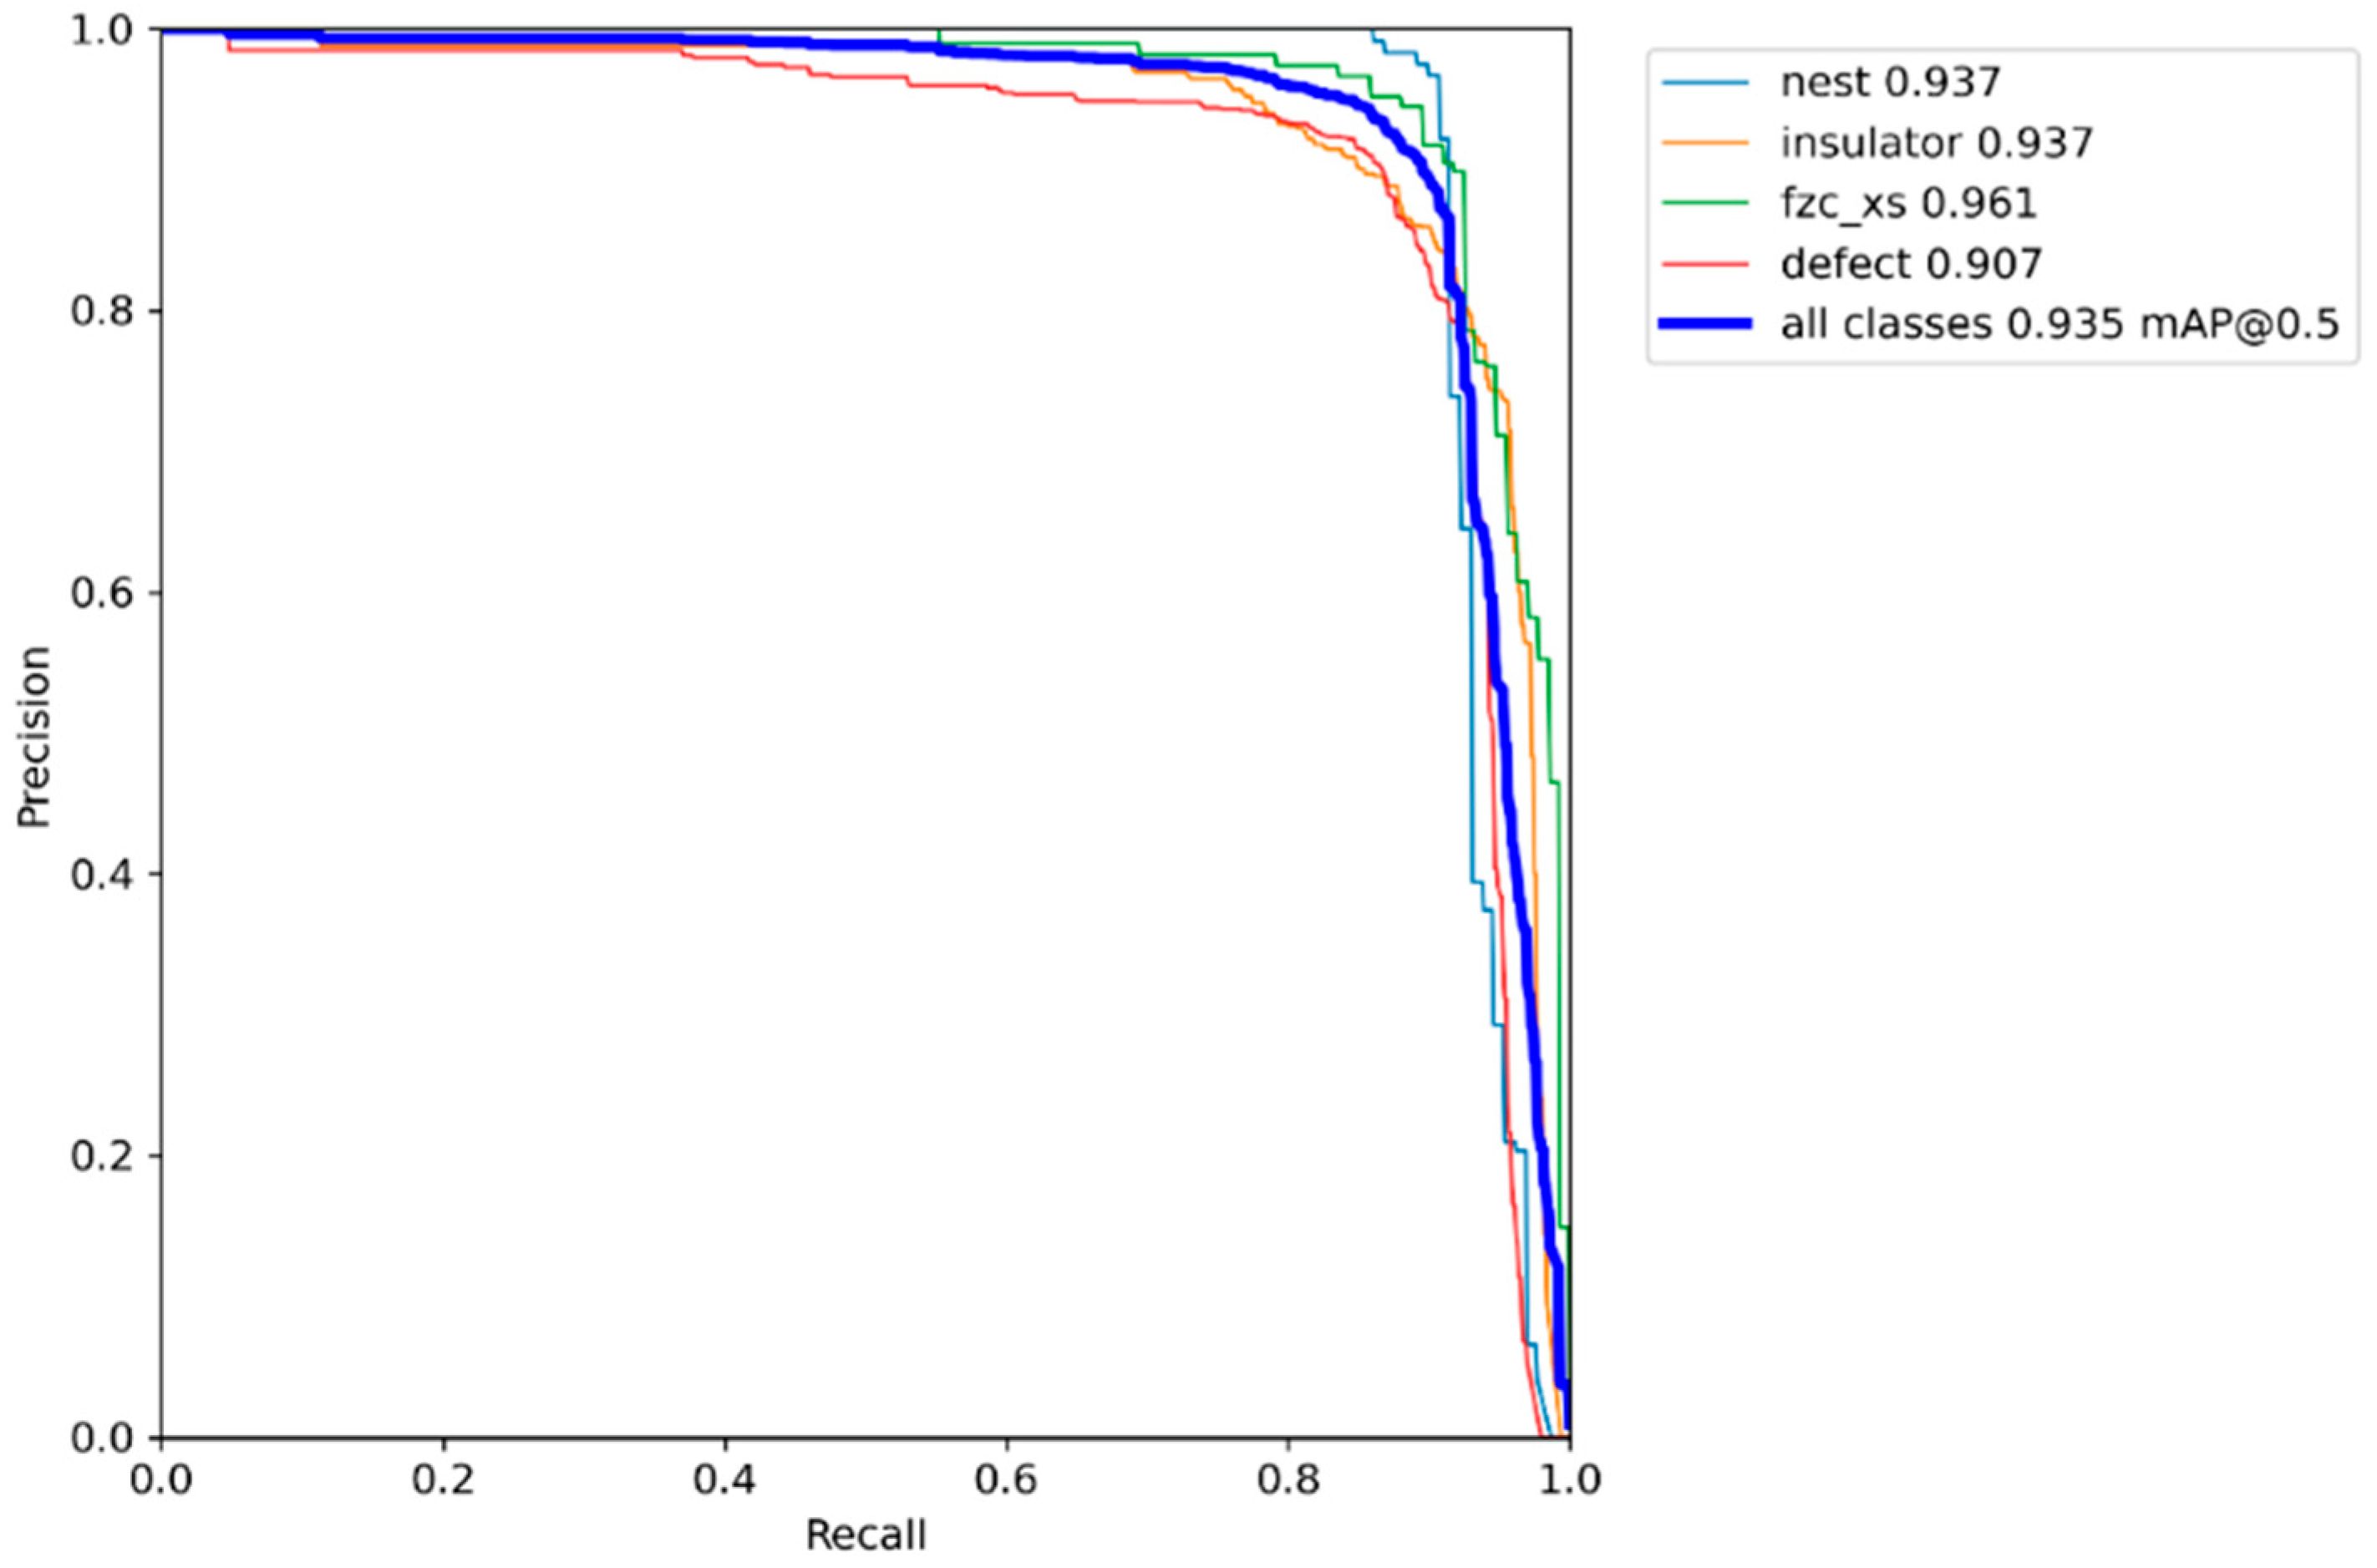
3.3. Performance Evaluation Indicators

To better evaluate the missed detection of small targets caused by the difference in scale transformation, this paper introduces the missed detection rate (miss rate) [39] and the indicators for the conventional evaluation of the advantages of target detection algorithms: mean average precision (mAP), inference delay (speed), model size (params), and number of floating point operations (FLOPs).
P r e c i s i o n = T P T P + F P
R e c a l l = T P T P + F N
m i s s R a t e = F N T P + F N
m A P = i N A P i N
In Equations (10)–(13): TP, FP, and FN represent the number of correct detections, false detections, and missed detections; AP is the integral of the P–R curve; and N is the detection category. Figure 13 is the mAP curve drawn by the improved algorithm in this paper.

4. Experimental Discussion

4.1. Validation of Model Lightweight Effects

To evaluate the impact of different improvement strategies on the detection performance of YOLOv7-Tiny, comparative experiments are carried out on the typical fault dataset of transmission lines. First, the model is improved based on Ghost Module lightweight, and the test results are shown in Table 2.
From Table 2, it can be seen that the C2fGhost improvement, due to its structural excellence, still improves mAP by 0.14% compared to YOLOv7-Tiny, with a reduced number of parameters and computation, and the GhostSPPCSPC and GhostConv(Head) improvements only replace part of the ordinary convolution, with a reduced number of parameters and computation and a slight accuracy. The three Ghost-based lightweight improvements were then subjected to ablation experiments, and after ablation for the latter two, while retaining C2fGhost, it was found that the replaced convolution in YOLOv7-C2fGhost-GhostConv(Head) involved a change in the number of channels of the three scale detection heads, the computational power decreased by 63.9%, and the number of parameters decreased by 65.1%. In terms of accuracy (mAP), since the convolution in the prediction part mainly generates a series of feature mappings that contain information on the position, category, and size of the object, and the ones in the Ghost module can obtain this information through another residual branch, then, based on this, the decrease in accuracy is not significant with fewer convolution layers, and the mAP decreases by 0.05%. The final three-improvement ablation experiment, therefore, results in a 67.7% decrease in model computation, a 76.7% decrease in the number of parameters, and a 0.81% decrease in accuracy.

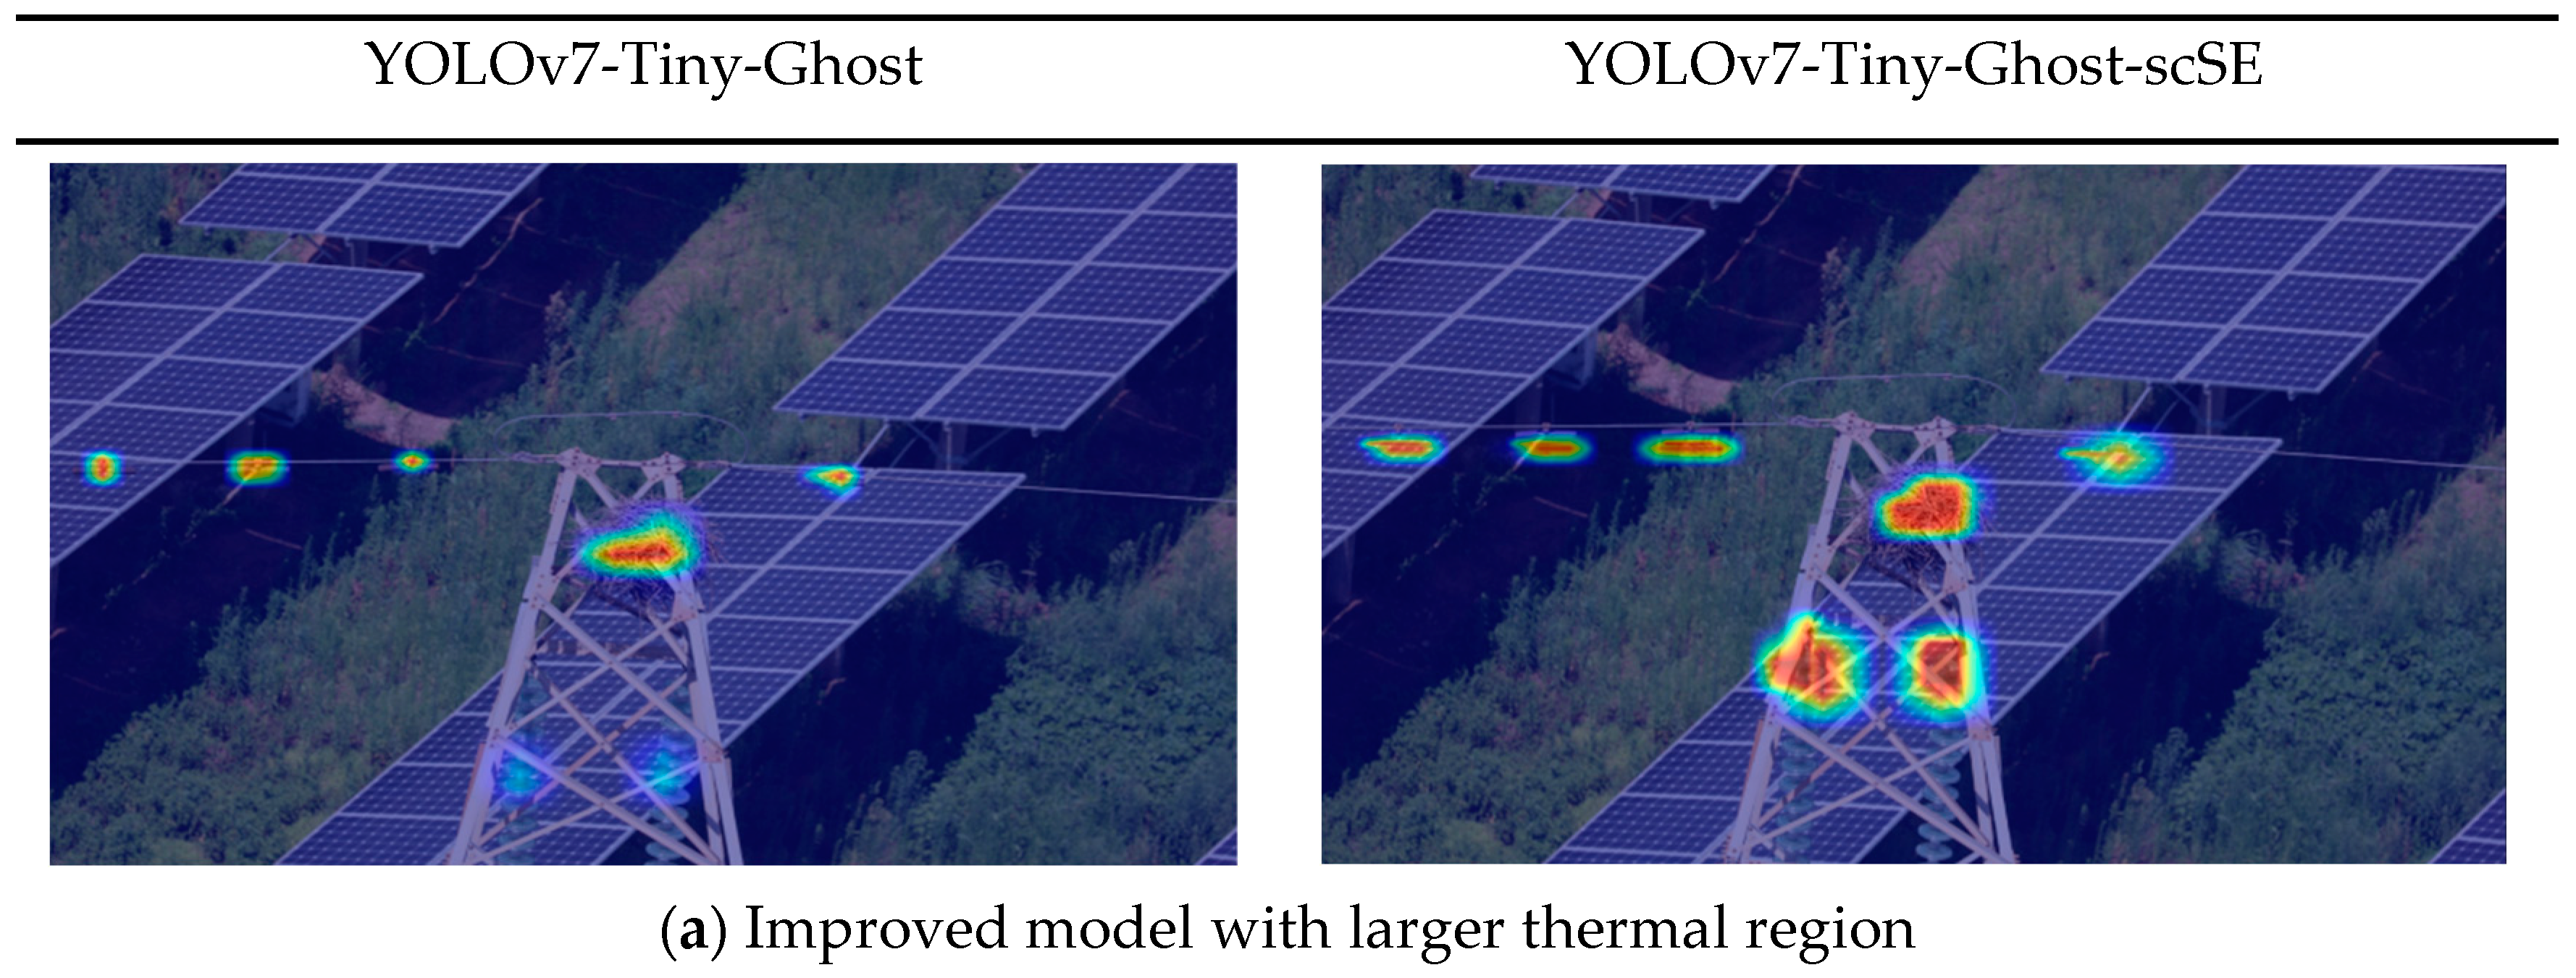
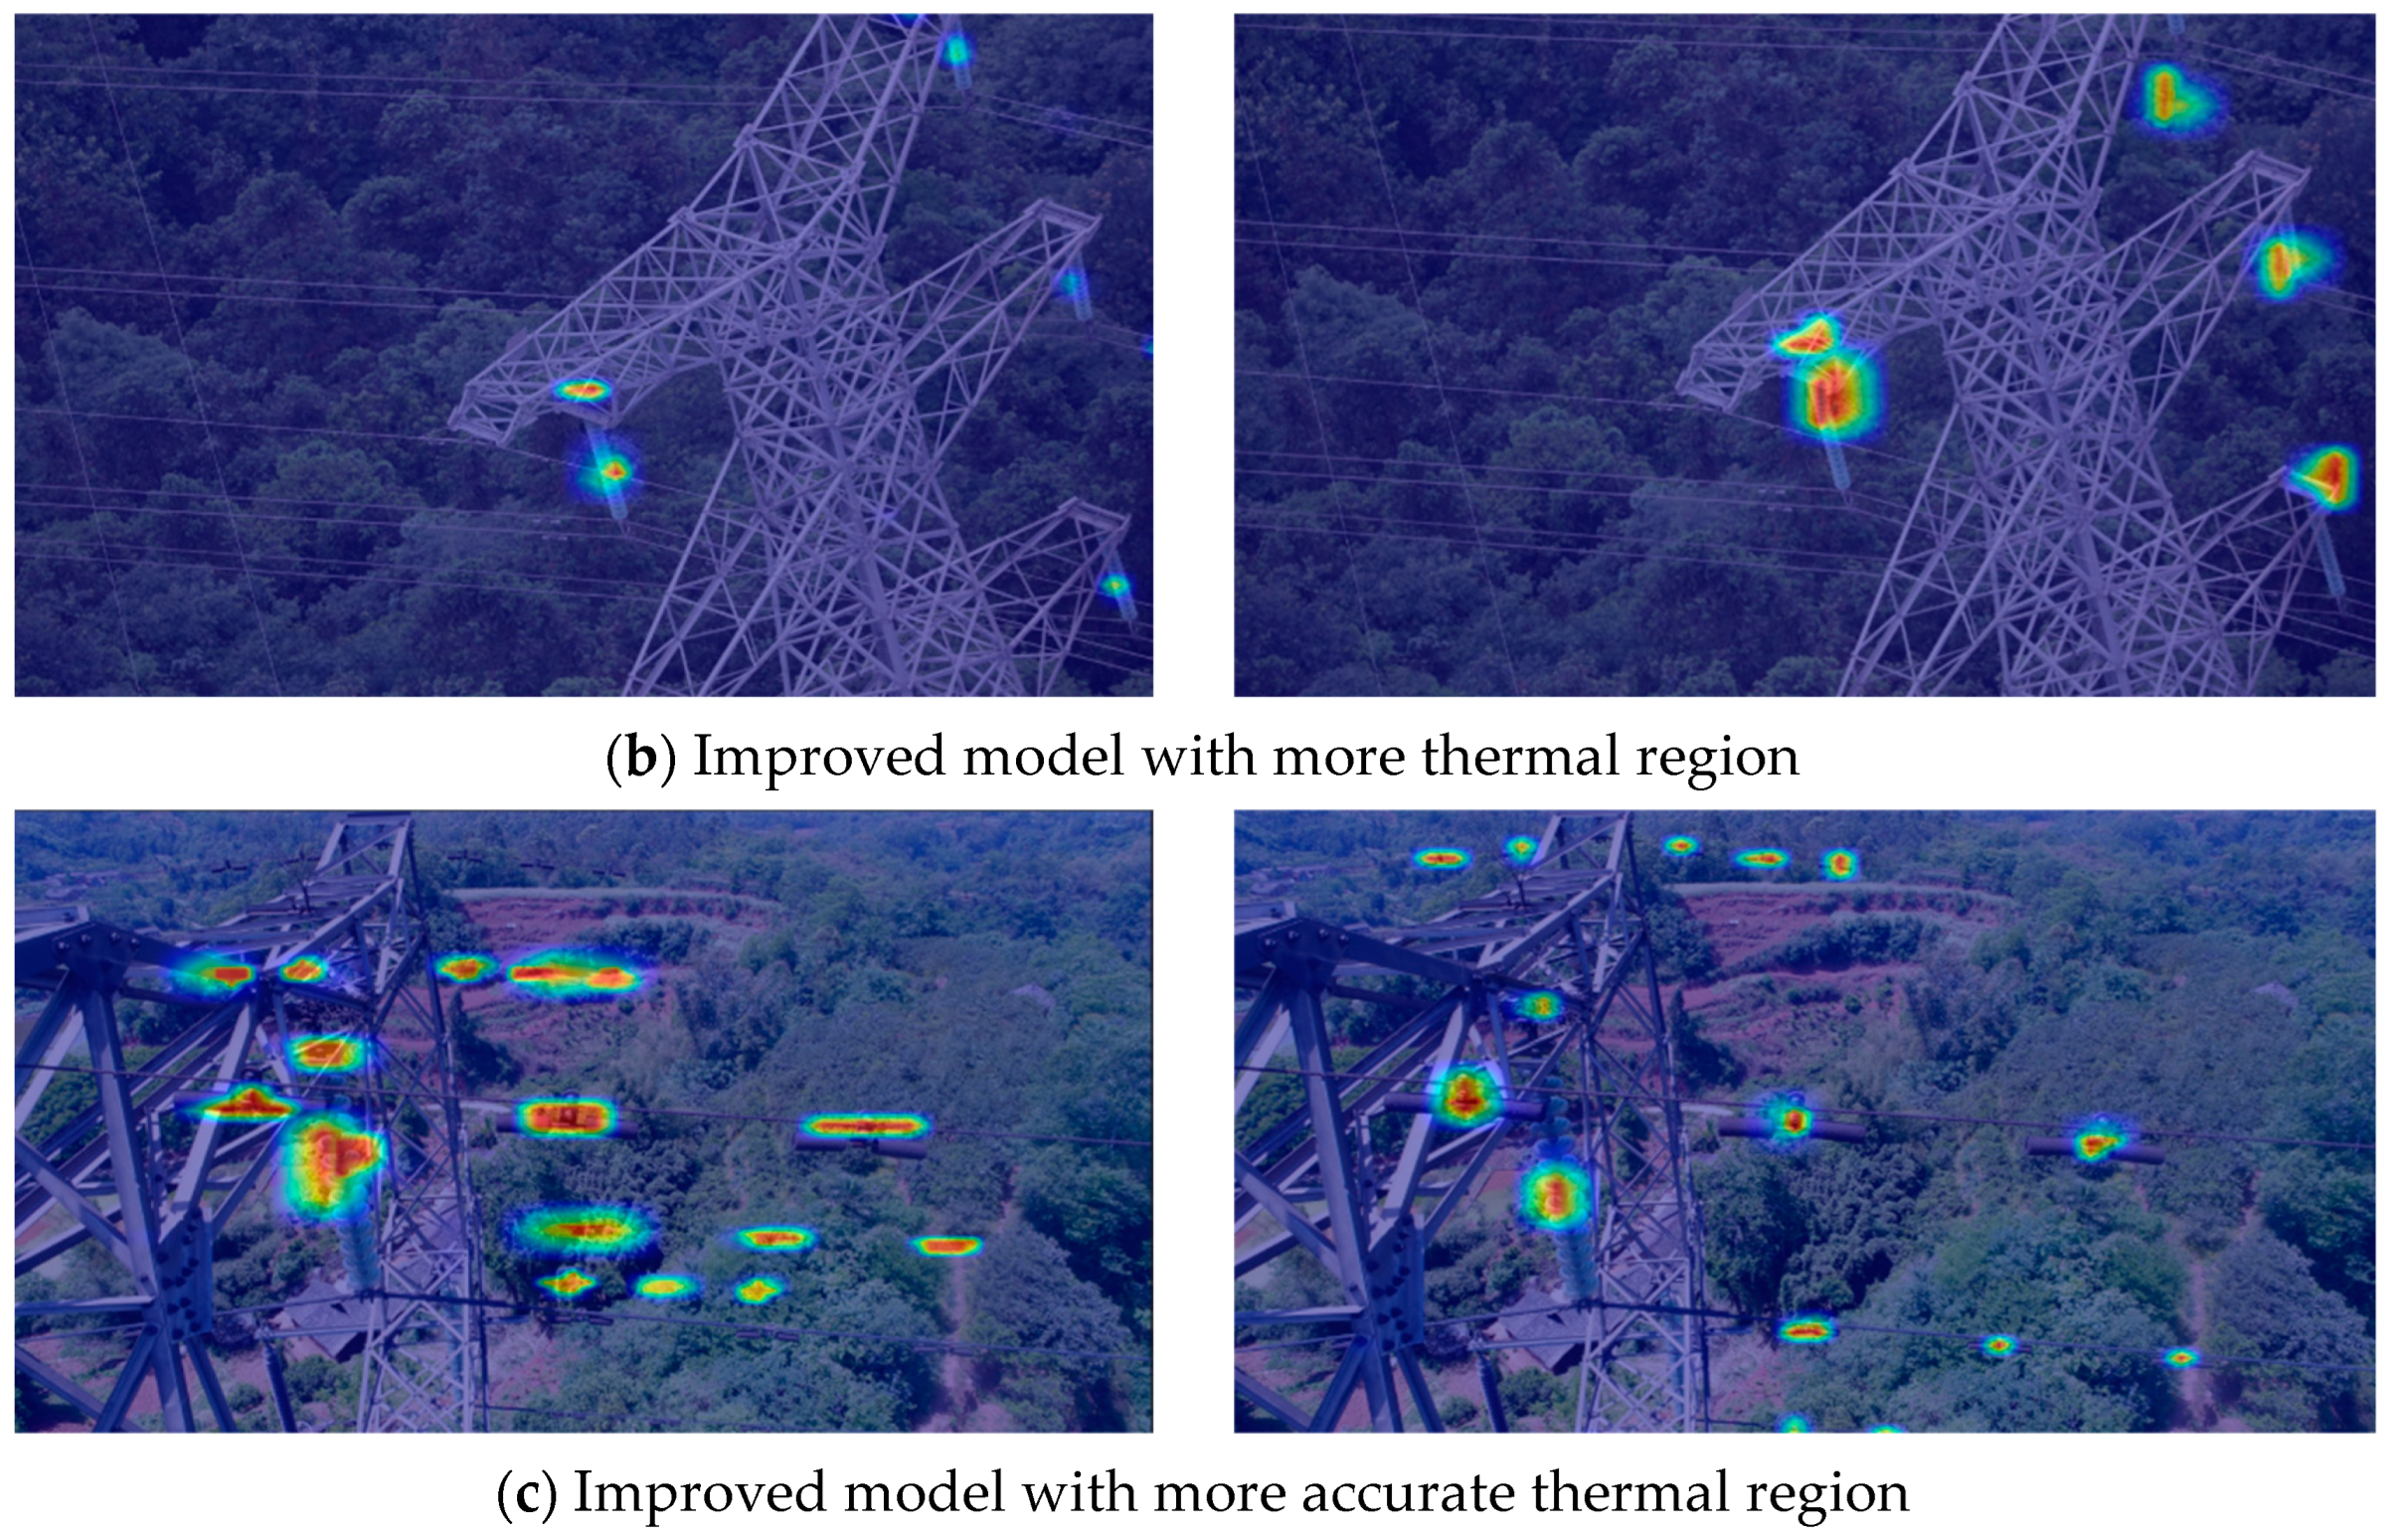
4.2. Validation of Feature-Balanced Network Validity and Comparison of Similar Attention Mechanisms

The impact of feature-balancing networks on model size, computational effort, and accuracy, as well as a comparison of the attention mechanism scSE used in the FBN with CBAM, which is also a combination of spatial and channel attention, previously used, is shown in Table 3 [39].
It can be seen in Table 3 that based on YOLOv7-Tiny-Ghost, CBAM and scSE are, respectively, added to form a feature-balanced network with different attention mechanisms. The mAP of the former increased by 0.2%, and the latter increased by 0.33%; the amount of calculation and the amount of parameters increased by 0.3 G, 0.1 G, and 0.1 MB, respectively. While the accuracy improved, the amount of calculation and the number of parameters did not increase significantly; however, the reason why scSE is ahead of CBAM is its better channel-attention mechanism structure and its parallel connection method. The former increases the accuracy, and the latter reduces the amount of calculation, which is why scSE is chosen in this paper.
To further verify its effectiveness, this paper visualizes the Grad-CAM heat map for the following typical situations, and the test results are shown in Figure 14. It can be seen in Figure 14 that in Figure 14a,b, the thermal region of the improved model is enlarged, which means that the model assigns more weights to the targets to be detected, and the darker the color, the more weights are allocated. Figure 14c shows that the model before the improvement assigns incorrect weights to areas with no detection target. Although the improved model has fewer thermal areas than before, it accurately identifies the thermal area.

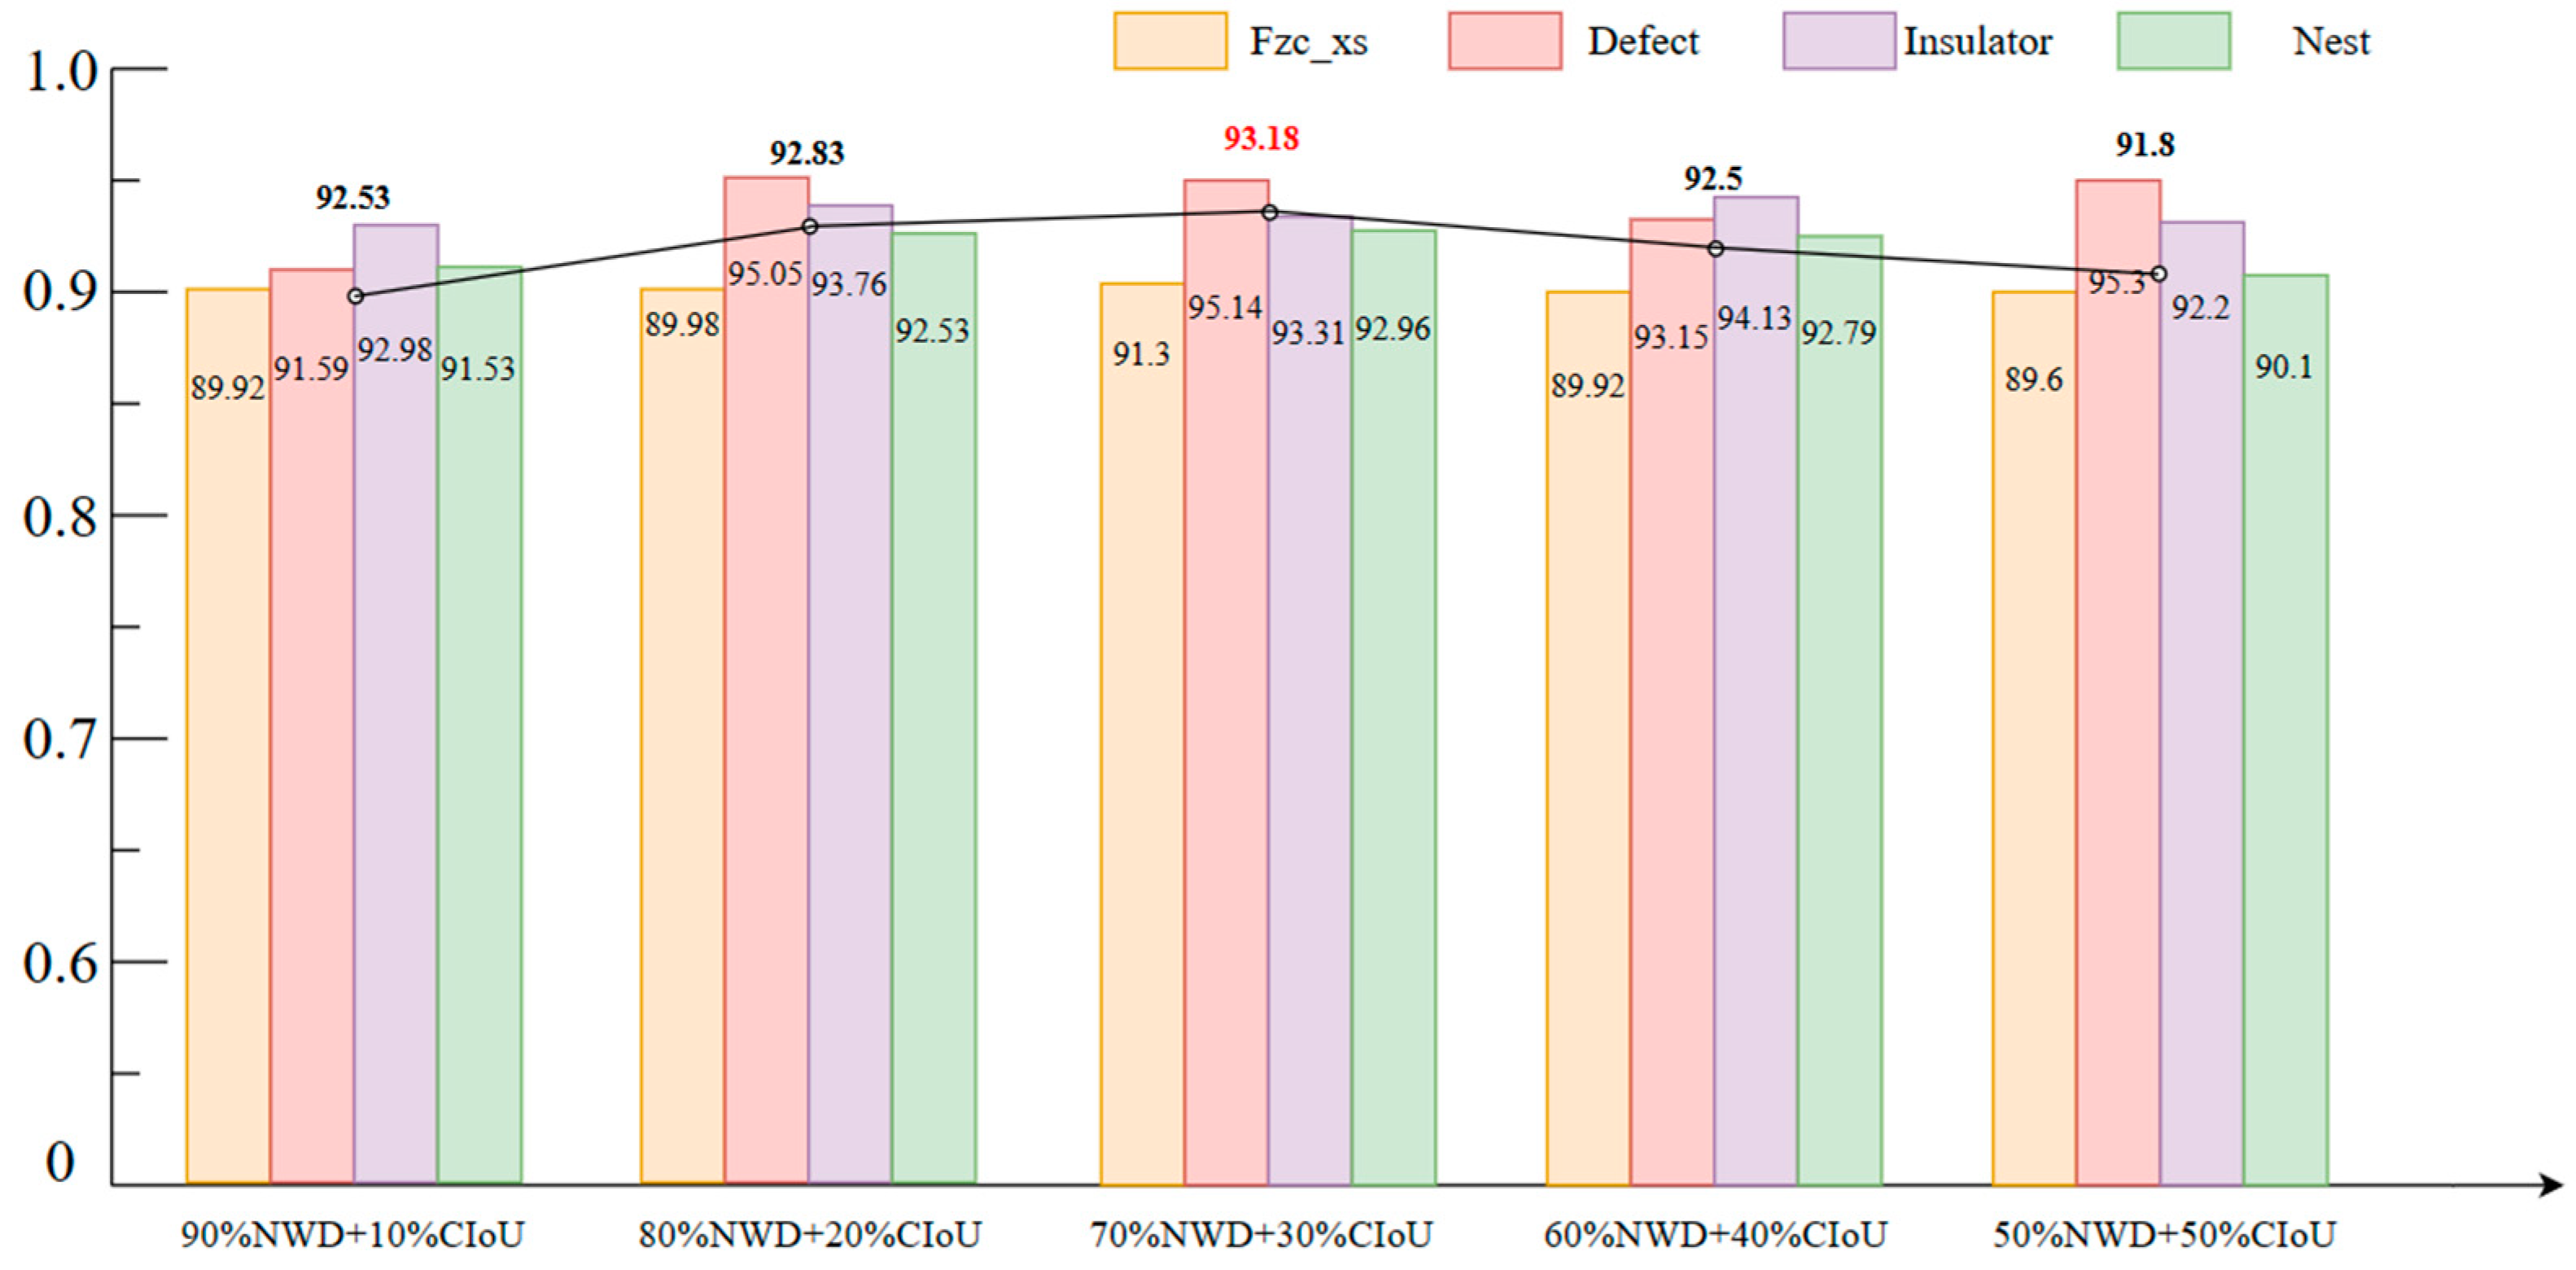
4.3. Validation of the Effect of NWD Loss Function and the Effect of NWD on the Model with Different Fusion Ratios

In this paper, CIou is replaced with an NWD loss function with better detection accuracy for small targets, and the training time is found to increase substantially after training. Then, an improvement strategy of mixing different proportions of NWD with CIoU is proposed to retain the accuracy of NWD while speeding up the training time. Finally, the models with loss functions fused in different proportions are retrained and tested on a typical fault dataset of transmission lines. The proportion of NWD loss functions in the experiments was set to 100%, 90%, 80%, 70%, and 60%, respectively, and the model performance for different fusion proportions is shown in Table 4. The 90% NWD + 10% CIoU in the table is the localization loss function consisting of 90% of the NWD loss function and 10% of the CIoU loss function together, and the others are similar.
Figure 15 shows the test results of models with different fusion ratios on the dataset. It can be seen in Table 4 and Figure 16 that as the proportion of NWD decreases, the training time also gradually increases, and mAP presents a process of rising first and then falling, and 70% is the critical value. The mAP is 1.2% higher than the initial model; the training time decreases as the proportion of NWD decreases. This study adopts a fusion ratio model of (70%NWD + 30%CIoU) to balance the training time and model accuracy. The detection effect of small targets is improved, the missed detection rate of anti-vibration hammer corrosion is reduced by 6.76%, and the missed detection rate of insulator damage is reduced by 14.61%, proving the method’s effectiveness and feasibility in this paper.

4.4. Comparison of Ablation Experiments

Table 5 is based on YOLOv7-Tiny and the comparison of the experimental results before and after adding the improvement strategy proposed in this paper. Among them, YOLOv7-Tiny is recorded as Algorithm 1.
It can be seen in Table 5 that Algorithm 1 is the initial YOLOv7-Tiny, and Algorithm 2 optimizes the lightweight structure of the Ghost module based on Algorithm 1, the amount of calculation is reduced by 67.7%, the amount of parameters is reduced by 75.6%, and mAP is only reduced by 0.81%. For Algorithm 3 and Algorithm 4, based on Algorithm 2, the scSE attention mechanism is added to form a feature-balanced network and the NWD loss function is added to enhance the detection effect of small targets. Compared with Algorithm 2, Algorithm 3 has improved AP values for all detected objects. The problem of low accuracy, caused by scale transformation in the detection process, has been greatly improved; compared with Algorithm 2, Algorithm 4 has greatly improved the accuracy of small-target anti-vibration hammer corrosion and insulator damage, which also verifies the effectiveness of NWD for small target detection. Algorithm 5 is TD-YOLO, which combines three improvement strategies. The accuracy of each type of detection object is improved. Compared with Algorithm 2, the number of parameters remains unchanged, and the amount of calculation only increases by 0.1 G.

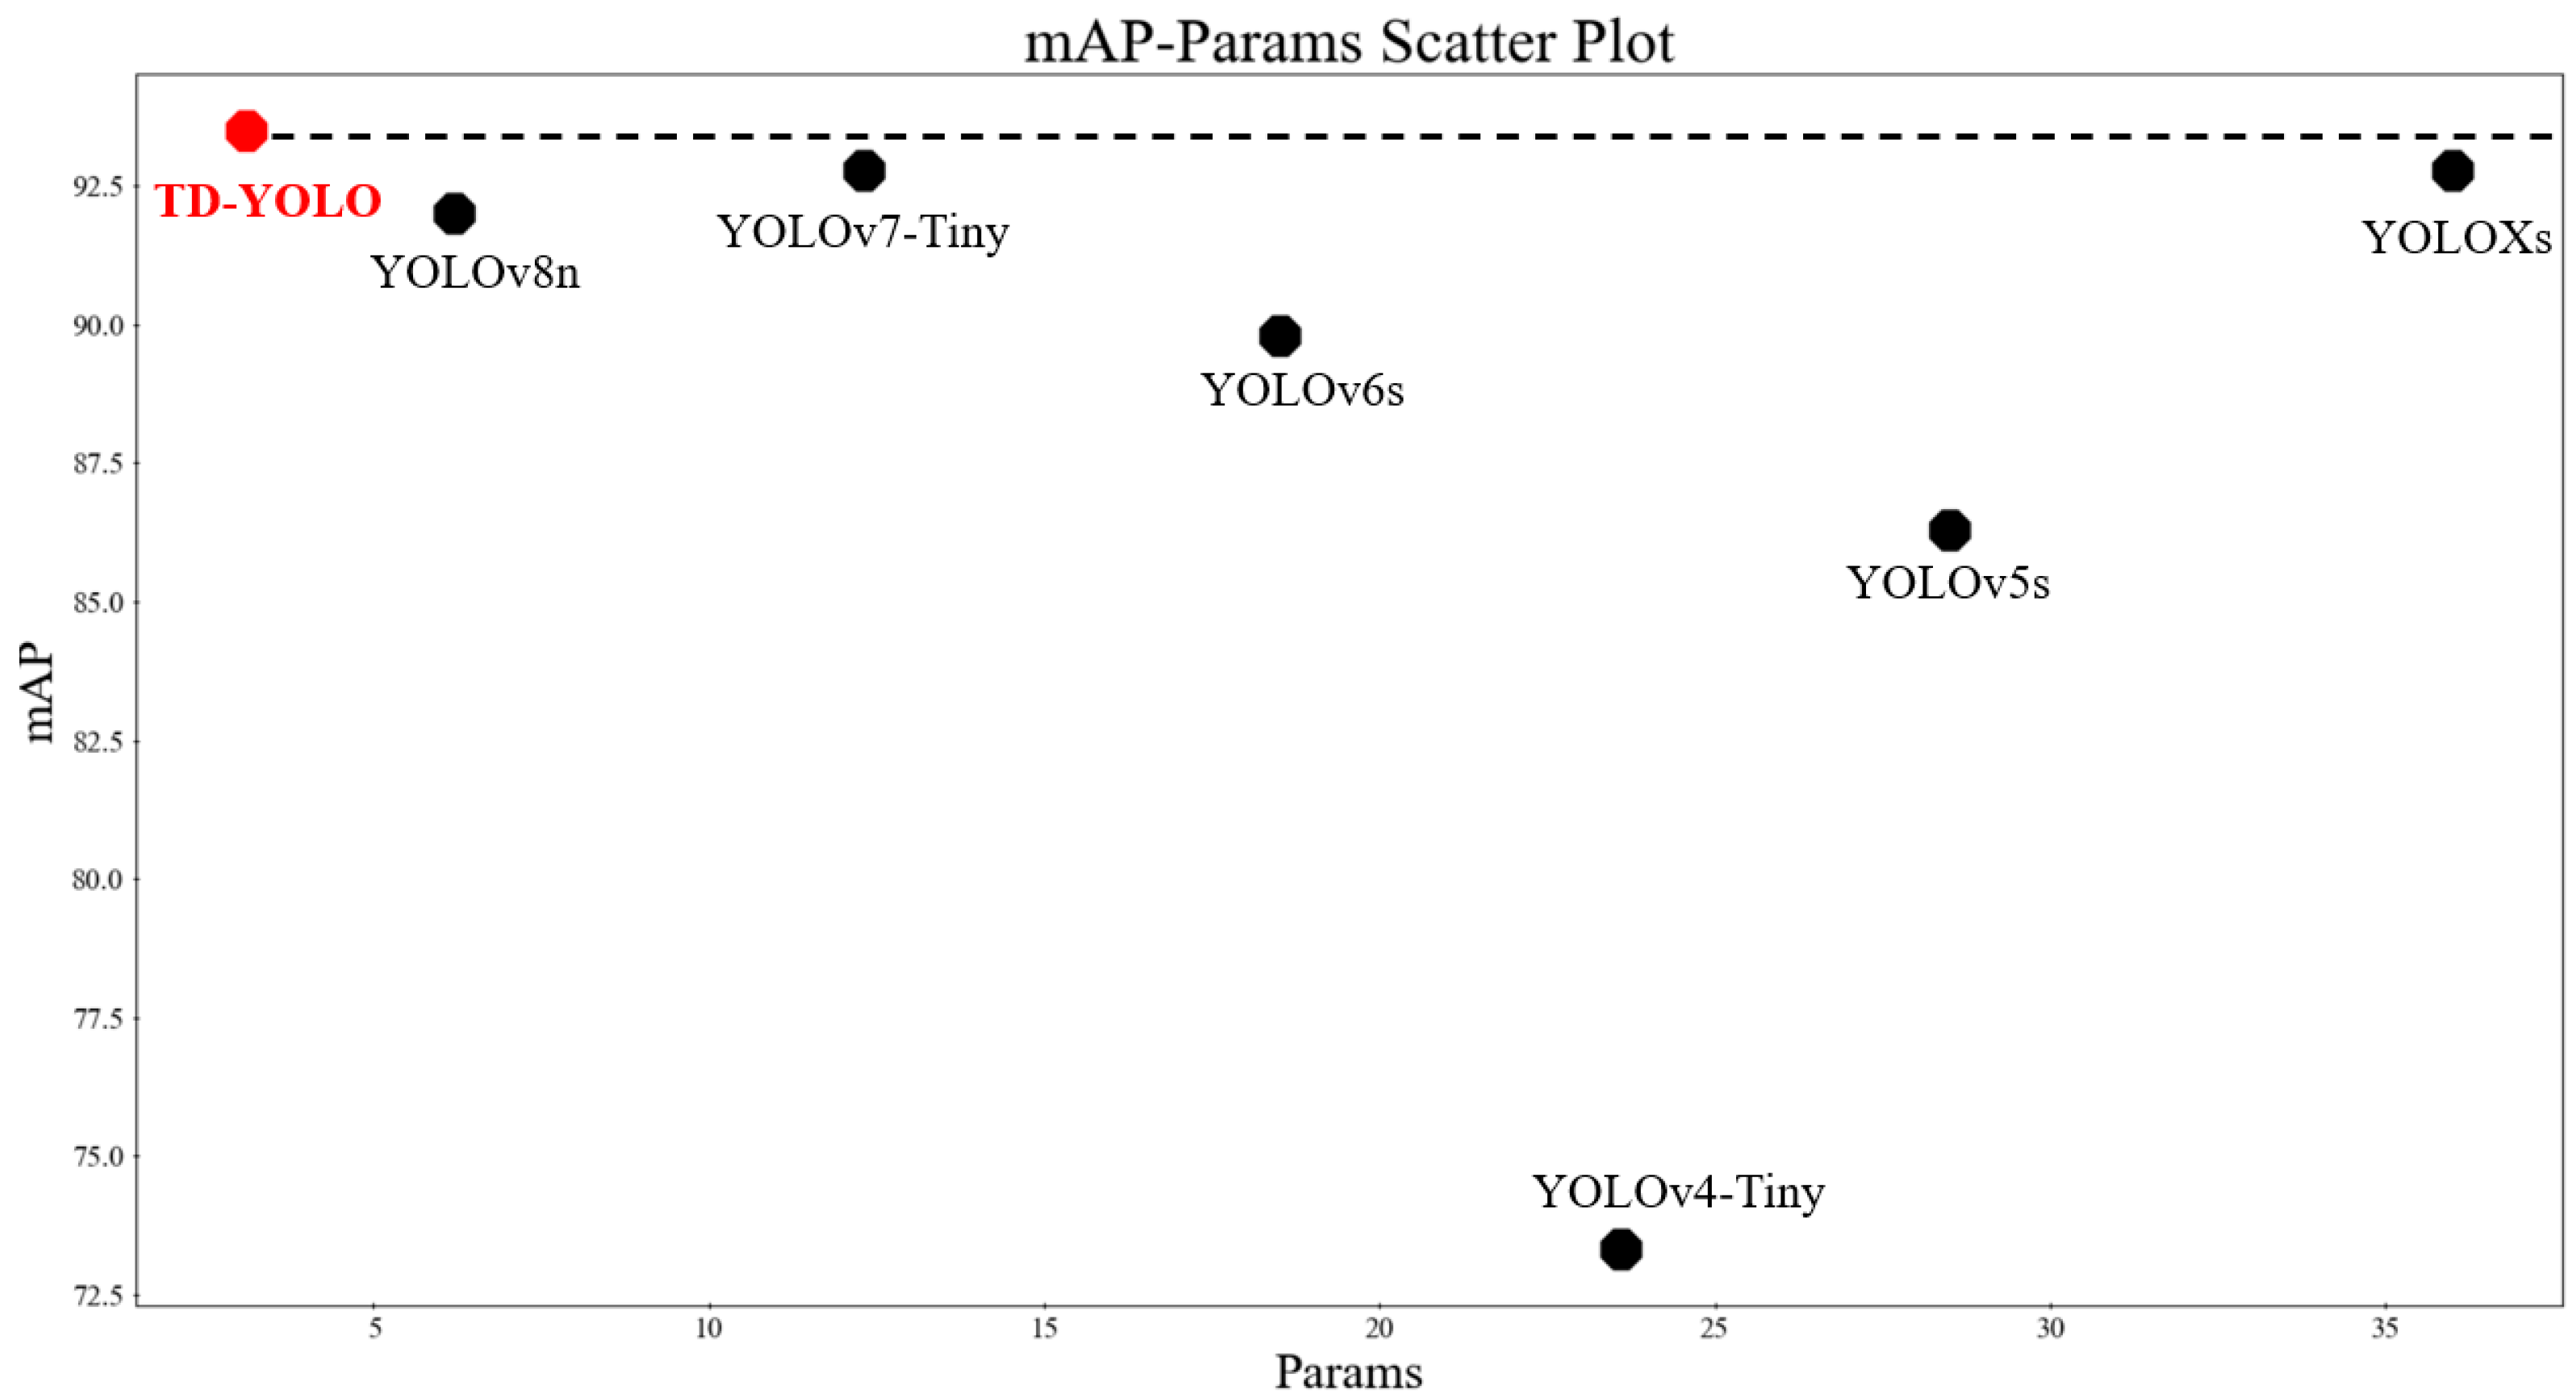
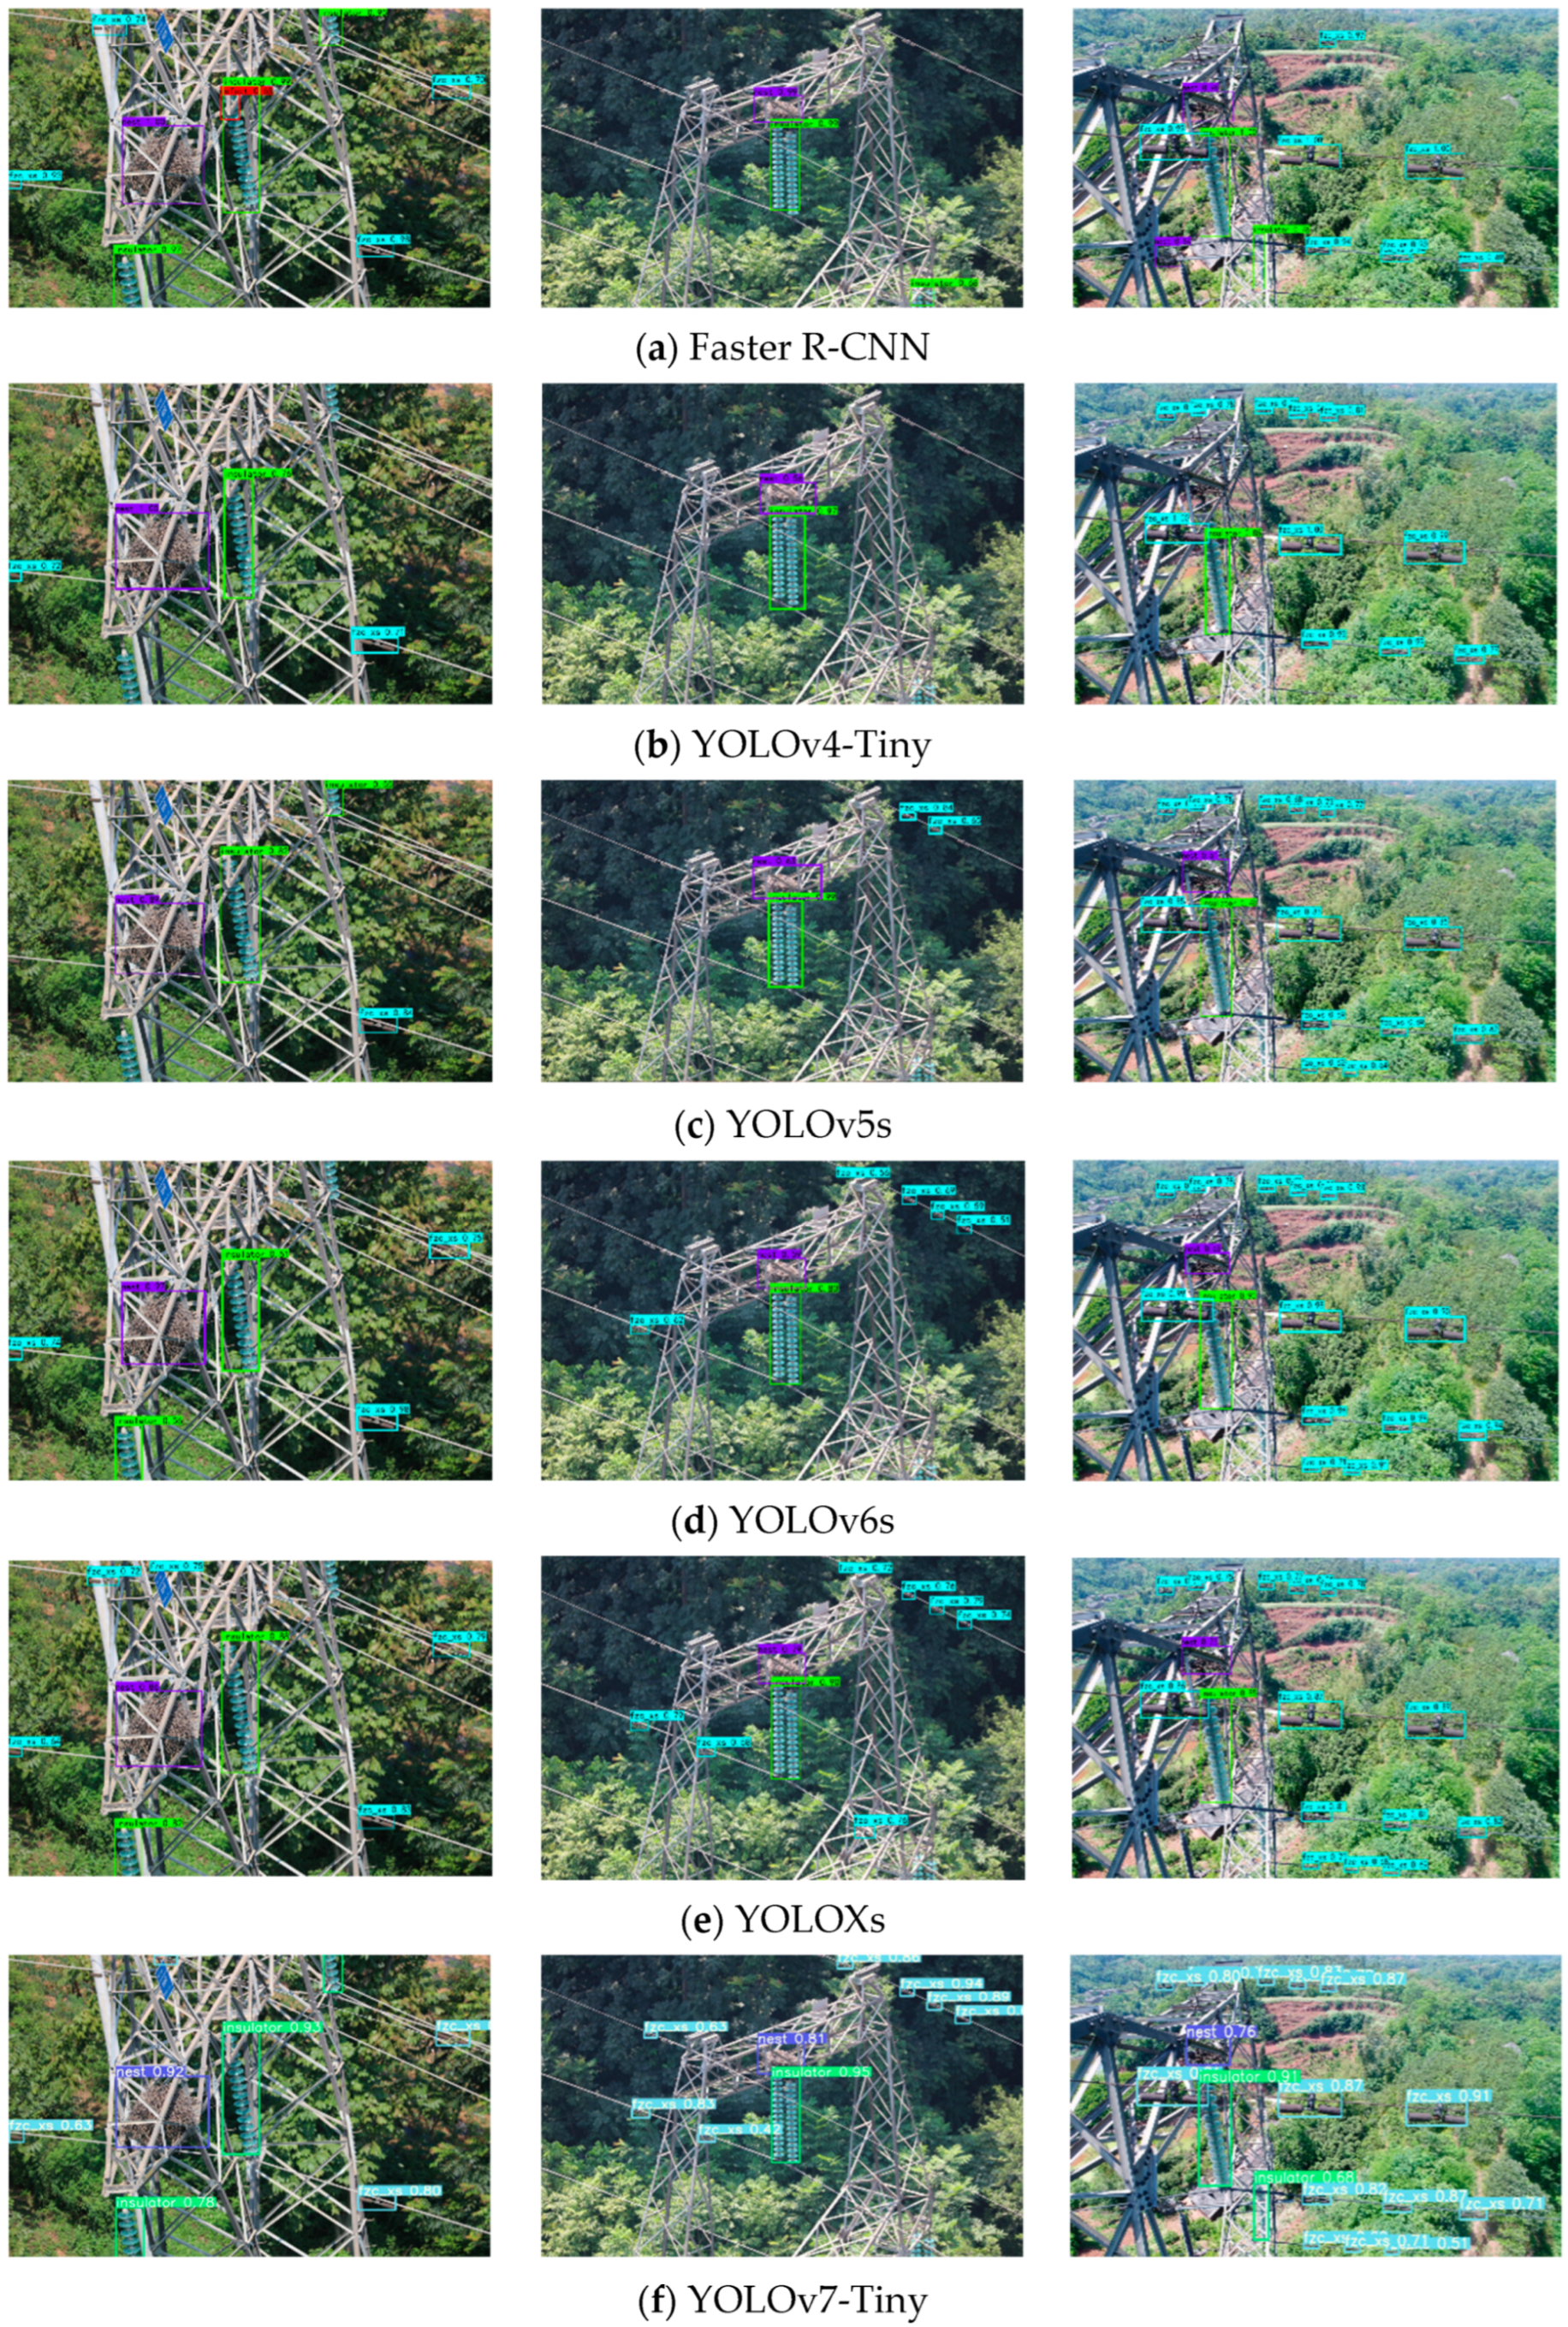
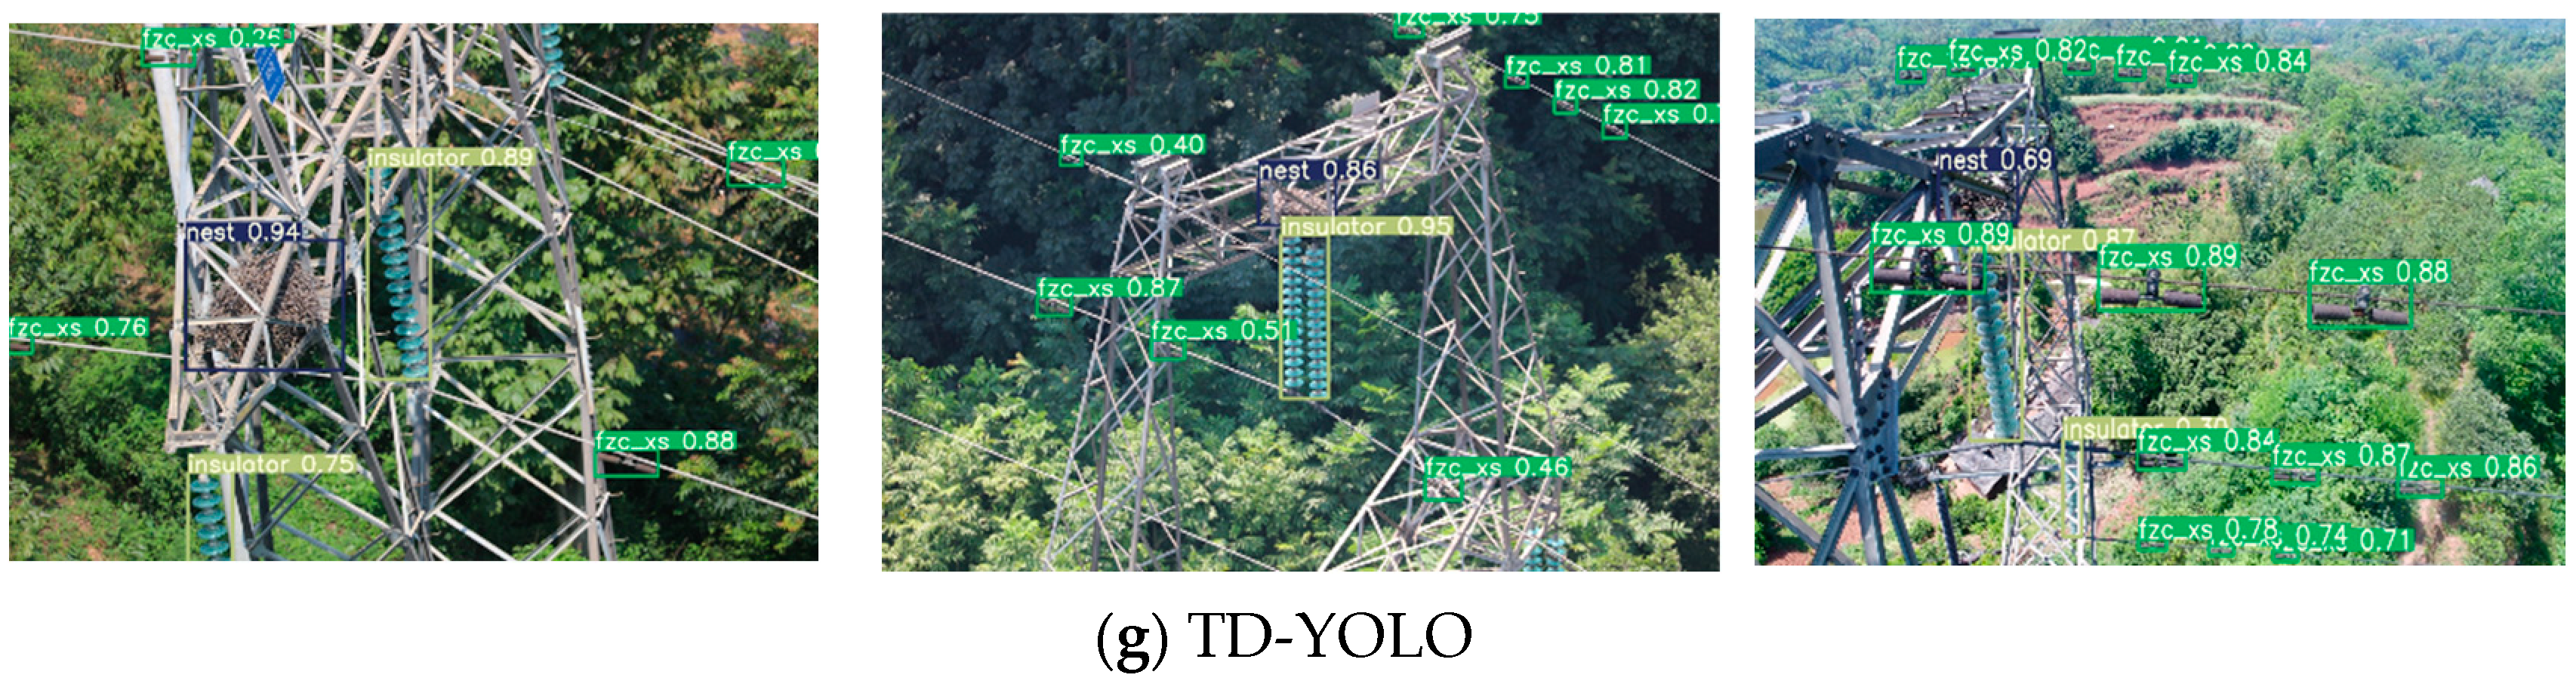
4.5. Horizontal Comparison of Experimental Results

To verify the model’s performance and detection effect of the algorithm (TD-YOLO) in this paper, the original model and the other eight models were selected for comparison, as shown in Table 6.
It can be seen in Table 5 that the accuracy and speed of the second-stage algorithm Faster R-CNN have a significant gap compared with the first-stage algorithm YOLO series, especially for tiny target anti-vibration hammer corrosion, with only a 55.72% mAP. From the algorithm extension of YOLOv4 to YOLOv4-Tiny, the YOLO series algorithms are developing towards becoming lightweight. In the table, YOLOv5s, YOLOXs, YOLOv6s, YOLOv7-Tiny, and YOLOv8n are all their corresponding lightweight versions, and the accuracy is gradually increasing. For the model, the number of parameters gradually decreases; TD-YOLO compares with the original algorithm, mAP is improved by 0.71%, and the number of model parameters is reduced by 74.8%. Further, we analyzed the position of the improved algorithm in the current mainstream lightweight algorithm and drew the data as a parameter-precision floating-point diagram, as shown in Figure 16. It can be seen from the verification results on the transmission line fault detection data that the performance of TD-YOLO is in a leading position compared with the other YOLO series lightweight algorithms in various indicators.
To further verify the advantages of the proposed algorithm, three representative scenarios are selected to verify the model, namely, target faults under shadow occlusion, multi-scale target faults, and multiple small target faults [41,42]. In the experiment, it was compared with Faster R-CNN, the mainstream lightweight algorithm in Table 6, and our TD-YOLO algorithm. The detection results are shown in Figure 17.

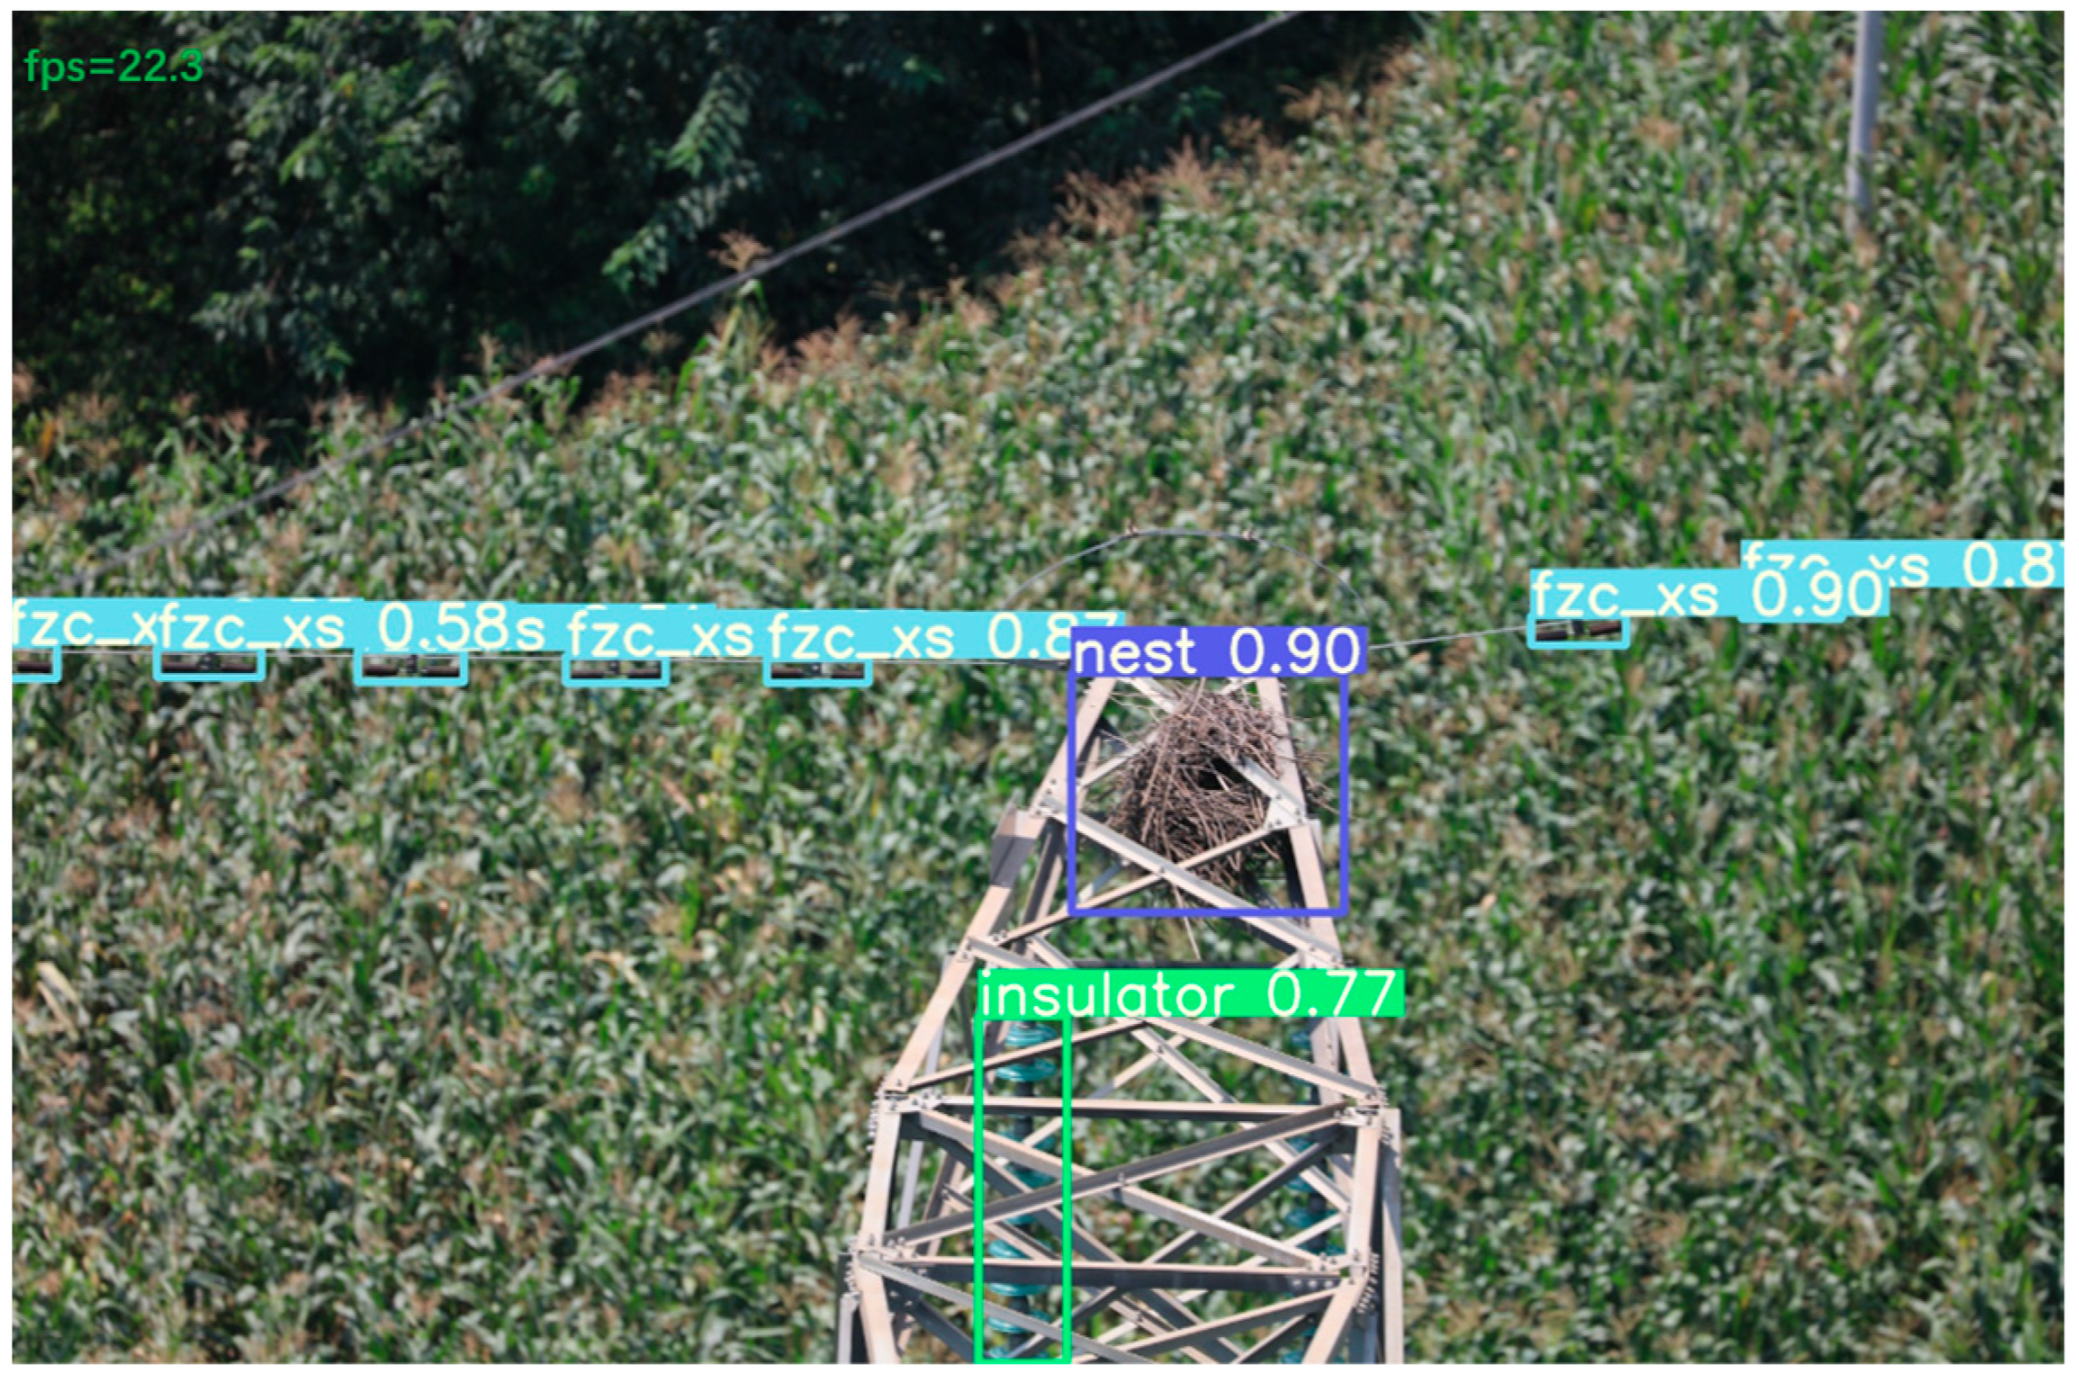
5. Edge-Side Deployment

The edge deployment object uses Jetson Xavier NX, which has 384 CUDA cores, 48 Tensor cores, and two NVIDIA engines. It can run multiple modern neural networks in parallel, processing high-resolution data from multiple sensors simultaneously. It can be mounted onto a UAV to simulate the inspection conditions of UAVs. Real-time data collection is performed by calling the hardware camera, and the test results are shown in Table 7. It can be seen in Table 7 that the improved model reduces the inference delay by 12 ms compared with the original YOLOv7-Tiny, and the real-time detection speed increases by 4.8 FPS, reaching 23.5 ± 2.2 FPS. The simulation of the live drone inspection image is shown in Figure 18. The detection results meet the typical faults of transmission lines in the process of UAV inspection testing requirements. Finally, we explored whether the hardware parameters met the conditions for UAV deployment, and the test results are shown in Table 8 [43].
The name of the algorithm in Table 7 is the same as that in Table 5. Algorithm 1 is the YOLOv7-Tiny model, and Algorithm 5 is TD-YOLO after the ablation experiment.
As can be seen from Table 8, the embedded devices tested in this paper are all suitable for deployment in the UAVs used for transmission line inspection, which further validates the feasibility of the algorithms in this paper.

6. Conclusions

1. This paper proposes a typical fault detection algorithm for transmission lines based on a lightweight module and a feature-balanced network. Through the Ghost module, YOLOv7-Tiny is reorganized in a lightweight way to reduce the parameters and computation of the model so that it can meet the deployment conditions. Through the introduction of the scSE attention mechanism and PA-Net to form a feature-balancing network, the information of the upper and lower layers is better integrated, which, to a certain extent, reduces the missed detection caused by the insufficient feature expression capability during the scale transformation process of faults. The NWD loss function is used to replace part of the CIoU to improve the detection of small target faults while ensuring the training speed of the model.
2. Based on the self-built dataset, the model designed in this paper has obvious advantages in terms of detection accuracy and detection speed compared with the lightweight models of the same stage, and the effectiveness of the model’s improvement is verified by the mobile hardware.
3. The self-built dataset in this paper mainly includes transmission line equipment faults (typically broken insulators), transmission line foreign object faults (typically bird’s nests), and transmission line metalwork faults (typically anti-vibration hammer corrosion), and the fault types are not limited to these typical faults. Further research will be carried out by adding fault-type detection to make the model more universal.

Author Contributions

Conceptualization, G.H. and R.W.; methodology, G.H.; software, R.W.; validation, R.W., Q.Y. and S.L.; formal analysis, G.H.; investigation, L.Z.; resources, M.H., S.L. and L.Q.; data curation, R.W., Q.Y. and L.Q.; writing—original draft preparation, R.W.; writing—review and editing, G.H., R.W. and L.Q.; visualization, M.H.; supervision, M.Z. and L.Q. All authors have read and agreed to the published version of the manuscript.

Funding

This work was supported by the National Key R&D Program of China (No.2020YFB0905900).

Conflicts of Interest

The authors declare no conflict of interest.

Code

https://github.com/wangruijie123/Drones-YOLOv7 (accessed on 10 October 2023).

Test Videos

https://www.youtube.com/@chrisD-zg9kc/featured (accessed on 10 October 2023).

References

  1. He, M.; Qin, L.; Deng, X. Transmission Line Segmentation Solutions for UAV Aerial Photography Based on Improved UNet. Drones 2023, 7, 274. [Google Scholar] [CrossRef]
  2. Sui, Y.; Ning, P.; Niu, P. Review on Mounted UAV for Transmission Line Inspection. Power Syst. Technol. 2021, 9, 3636–3648. [Google Scholar]
  3. Lunze, J.; Richter, J. Reconfigurable Fault-tolerant Control: A Tutorial Introduction. Eur. J. Control 2008, 14, 359–386. [Google Scholar] [CrossRef]
  4. Merrill, W.; DeLaat, J.; Bruton, W. Advanced detection, isolation, and accommodation of sensor failures–Real-time evaluation. J. Guid. Control Dyn. 1988, 11, 517–526. [Google Scholar] [CrossRef]
  5. Liu, C.; Wu, Y. Research progress of vision detection methods based on deep learning for transmission lines. Proc. CSEE 2022, 8, 31. [Google Scholar]
  6. Khodayar, M.; Liu, G.; Wang, J. Deep learning in power systems research: A review. CSEE J. Power Energy Syst. 2021, 3, 209–220. [Google Scholar]
  7. Chen, C.; Zheng, Z.; Xu, T.; Guo, S.; Feng, S.; Yao, W.; Lan, Y. YOLO-Based UAV Technology: A Review of the Research and Its Applications. Drones 2023, 7, 190. [Google Scholar] [CrossRef]
  8. Girshick, R.; Donahue, J.; Darrell, T. Rich feature hierarchies for accurate object detection and semantic segmentation. In Proceedings of the 2014 IEEE Conference on Computer Vision and Pattern Recognition (CVPR), Columbus, OH, USA, 23–28 June 2014; IEEE: Piscataway, NJ, USA, 2014; pp. 580–587. [Google Scholar]
  9. Girshick, R. Fast R-CNN. In Proceedings of the 2015 IEEE International Conference on Computer Vision (ICCV), Santiago, Chile, 7–13 December 2015; IEEE: Piscataway, NJ, USA, 2015; pp. 1440–1448. [Google Scholar]
  10. Ren, S.; He, K.; Girshick, R. Faster R-CNN: Towards Real-Time Object Detection with Region Proposal Networks. IEEE Trans. Pattern Anal. Mach. Intell. 2017, 39, 1137–1149. [Google Scholar] [CrossRef]
  11. Cai, Z.; Vasconcelos, N. Cascade R-CNN: Delving Into High Quality Object Detection. In Proceedings of the IEEE Conference on Computer Vision and Pattern Recognition (CVPR), Salt Lake City, UT, USA, 18–23 June 2018; pp. 6154–6162. [Google Scholar]
  12. Liu, W. SSD: Single Shot MultiBox Detector. In Computer Vision-ECCV; Lecture Notes in Computer Science, 9905; Springer: Cham, Switzerland, 2016. [Google Scholar]
  13. Redmon, J.; Divvala, S.; Girshick, R. You Only Look Once: Unified, Real-Time Object Detection. In Proceedings of the IEEE Conference on Computer Vision and Pattern Recognition (CVPR), Las Vegas, NV, USA, 27–30 June 2016; pp. 779–788. [Google Scholar]
  14. Redmon, J.; Farrhadi, A. YOLO9000: Better, Faster, Stronger. In Proceedings of the IEEE Conference on Computer Vision and Pattern Recognition (CVPR), Honolulu, HI, USA, 21–26 July 2017; pp. 6517–6525. [Google Scholar]
  15. Redmon, J.; Farrhadi, A. YOLOv3: An Incremental Improvement. arXiv 2018, arXiv:1804.02767. [Google Scholar]
  16. Bochkovskiy, A.; Wang, C.; Liao, H. YOLOv4: Optimal Speed and Accuracy of Object Detection. arXiv 2020, arXiv:2004.10934. [Google Scholar]
  17. YOLOv5. Available online: https://github.com/ultralytics/yolov5 (accessed on 23 July 2023).
  18. Li, C.; Li, L.; Jiang, H. YOLOv6: A Single-Stage Object Detection Framework for Industrial Applications. arXiv 2022, arXiv:2209.02976. [Google Scholar]
  19. Wang, C.; Bochkovskiy, A. YOLOv7: Trainable bag-of-freebies sets new state-of-the-art for real-time object detectors. In Proceedings of the IEEE/CVF Conference on Computer Vision and Pattern Recognition (CVPR), Vancouver, BC, Canada, 17–24 June 2023; pp. 7464–7475. [Google Scholar]
  20. Bai, J.; Zhao, R.; Gu, F. Multi-target Detection and Fault Recognition Image Processing Method. High Volt. Eng. 2019, 11, 3504–3511. [Google Scholar]
  21. Hao, S.; Ma, R.; Zhao, X. Fault Detection of YOLOv3 Transmission Line Based on Convolutional Block Attention Model. Power Syst. Technol. 2021, 8, 2979–2987. [Google Scholar]
  22. Hao, S.; Yang, L.; Ma, X. YOLOv5 Transmission Line Fault Detection Based on Attention Mechanism and Cross-scale Feature Fusion. Proc. CSEE 2023, 6, 2319–2331. [Google Scholar]
  23. Hao, S.; Zhang, X.; Ma, X. Small Target Fault Detection Method for Transmission Line Based on PKAMNet. High Volt. Eng. 2023, 3, 1–10. [Google Scholar]
  24. Qiu, Z.; Zhu, X.; Liao, C. A Lightweight YOLOv4-EDAM Model for Accurate and Real-time Detection of Foreign Objects Suspended on Power Lines. IEEE Trans. Power Deliv. 2022, 38, 1329–1340. [Google Scholar] [CrossRef]
  25. Deng, F.; Xie, Z.; Mao, W. Research on edge intelligent recognition method oriented to transmission line insulator fault detection. Int. J. Electr. Power Energy Syst. 2022, 139, 108054. [Google Scholar] [CrossRef]
  26. Han, G.; He, M. Insulator detection and damage identification based on improved lightweight YOLOv4 network. Energy Rep. 2021, 7, 187–197. [Google Scholar] [CrossRef]
  27. Li, X.; Liu, H.; Liu, G. Transmission Line Pin Defect Detection Based on Deep Learning. Power Syst. Technol. 2021, 8, 2988–2995. [Google Scholar]
  28. Zhang, H.; Qi, Q.; Zhang, J. Bird nest detection method for transmission lines based on improved YOLOv5. Power Syst. Prot. Control 2023, 2, 151–159. [Google Scholar]
  29. Zhao, W.; Xu, M.; Cheng, X. An Insulator in Transmission Lines Recognition and Fault Detection Model Based on Improved Faster RCNN. IEEE Trans. Instrum. Meas. 2021, 70, 1–8. [Google Scholar] [CrossRef]
  30. Chen, K.; Liu, X.; Jia, L. Insulator Defect Detection Based on Lightweight Network and Enhanced Multi-scale Feature Fusion. High Volt. Eng. 2023, 2, 1–12. [Google Scholar]
  31. Kang, J.; Wang, Q.; Liu, W. Detection Model of Aerial Photo Insulator Multi-defect by Integrating CAT-BiFPN and Attention Mechanism. High Volt. Eng. 2023, 2, 1–15. [Google Scholar]
  32. Li, H.; Dong, Y.; Liu, Y.; Ai, J. Design and Implementation of UAVs for Bird’s Nest Inspection on Transmission Lines Based on Deep Learning. Drones 2022, 6, 252. [Google Scholar] [CrossRef]
  33. Zheng, Z.; Wang, P.; Ren, D. Enhancing Geometric Factors in Model Learning and Inference for Object Detection and Instance Segmentation. arXiv 2020, arXiv:2005.03572v4. [Google Scholar] [CrossRef]
  34. Han, K.; Wang, Y.; Tian, Q. GhostNet: More Features From Cheap Operations. In Proceedings of the IEEE/CVF Conference on Computer Vision and Pattern Recognition (CVPR), Seattle, WA, USA, 13–19 June 2020; pp. 1580–1589. [Google Scholar]
  35. Roy, A.; Navab, N.; Wachinger, C. Recalibrating Fully Convolutional Networks with Spatial and Channel’ Squeeze & Excitation’ Blocks. IEEE Trans. Med. Imaging 2019, 2, 540–549. [Google Scholar]
  36. Woo, S.; Park, J.; Lee, J. Convolutional Block Attention Module. In Proceedings of the European Conference on Computer Vision (ECCV), Munich, Germany, 8–14 September 2018; pp. 3–19. [Google Scholar]
  37. Dong, G.; Xie, W.; Huang, X. Review of Small Object Detection Algorithms Based on Deep Learning. Comput. Eng. Appl. 2023, 11, 16–27. [Google Scholar]
  38. Wang, J.; Xu, C.; Yang, W. A Normalized Gaussian Wasserstein Distance for Tiny Object Detection. arXiv 2021, arXiv:2110.13389. [Google Scholar]
  39. Blanke, M.; Kinnaert, M.; Lunze, J.; Staroswiecki, M. Diagnosis and Fault-Tolerant Control; Springer: Berlin/Heidelberg, Germany, 2003. [Google Scholar]
  40. Han, G.; Wang, R.; Yuan, Q.; Li, S.; Zhao, L.; He, M.; Yang, S.; Qin, L. Detection of Bird Nests on Transmission Towers in Aerial Images Based on Improved YOLOv5s. Machines 2023, 11, 257. [Google Scholar] [CrossRef]
  41. Ding, S. Model-Based Fault Diagnosis Techniques; Springer: London, UK, 2013. [Google Scholar] [CrossRef]
  42. Frank, P.; Ding, S.; Marcu, T. Model-based fault diagnosis in technical processes. Trans. Inst. Meas. Control 2000, 22, 57–101. [Google Scholar] [CrossRef]
  43. Li, Y.; Fan, Q.; Huang, H.; Han, Z.; Gu, Q. A Modified YOLOv8 Detection Network for UAV Aerial Image Recognition. Drones 2023, 7, 304. [Google Scholar] [CrossRef]
Figure 1. (a,b) The typical fault sample diagram was selected in this paper.
Drones 07 00638 g001
Figure 2. YOLOv7-Tiny structure diagram.
Drones 07 00638 g002
Figure 3. Calculation diagram of CIoU.
Drones 07 00638 g003
Figure 4. TD-YOLO structure diagram.
Drones 07 00638 g004
Figure 5. Ghost module structure.
Drones 07 00638 g005
Figure 6. (a) ELAN module structure diagram; (b) C2f module structure diagram; (c) C2fGhost structure diagram.
Drones 07 00638 g006
Figure 7. Ghost bottleneck structure.
Drones 07 00638 g007
Figure 8. The scSE structure diagram [35].
Drones 07 00638 g008
Figure 9. FBN structure diagram.
Drones 07 00638 g009
Figure 10. (a) Example of a broken insulator in a small target; (b) example of vibration hammer rust in small targets.
Drones 07 00638 g010
Figure 11. (a) IoU transformation of small targets; (b) IoU transformation of normal targets.
Drones 07 00638 g011
Figure 12. (a) Comparison chart of classification loss curves; (b) comparison of positioning loss curves; (c) comparison of loss-of-confidence curves; (d) mAP curve comparison chart.
Drones 07 00638 g012
Figure 13. This paper improved the algorithm mAP curve.
Drones 07 00638 g013
Figure 14. Comparison of the results of Grad-CAM after adding scSE.
Drones 07 00638 g014aDrones 07 00638 g014b
Figure 15. Test results of models with different fusion proportions on datasets.
Drones 07 00638 g015
Figure 16. mAP-Params scatter plots of different models.
Drones 07 00638 g016
Figure 17. Comparison of three representative scene detection effects in different model test sets.
Drones 07 00638 g017aDrones 07 00638 g017b
Figure 18. Simulation of live drone inspection image.
Drones 07 00638 g018
Table 1. Fault abbreviation and quantity.
Fault AbbreviationInsulatorDefectNestFzc_xs
Numbers4556133315257287
Table 2. Comparison of lightweight ablation experiments based on Ghost modules.
mAP (%)FLOPs (G)Params (MB)
YOLOv7-Tiny92.791312.3
YOLOv7-Tiny-C2fGhost92.937.57.3
YOLOv7-Tiny-GhostSPPCSPC92.8410.39.5
YOLOv7-GhostConv(Head)92.8110.39.3
YOLOv7-Tiny-C2fGhost
-GhostSPPCSPC
92.5576.15
YOLOv7-Tiny-C2fGhost
-GhostConv(Head)
92.744.74.3
YOLOv7-Tiny-C2fGhost-
GhostSPPCSPC-GhostConv(Head)
91.984.13
Table 3. Experimental results of feature-balanced networks embedding different attention mechanisms.
ModelsMap (%)FLOPs (G)Params (MB)
YOLOv7-Tiny-Ghost91.984.13
YOLOv7-Tiny-Ghost-FBN(CBAM) [40]92.184.43.1
YOLOv7-Tiny-Ghost-FBN(scSE)92.314.23.1
Table 4. Experimental results after fusion of NWD with CIoU at different ratios.
ModelsTraining Time
/(h)
mAP
/(%)
Miss Rate
(Fzc_xs)/(%)
Miss Rate
(Defect)/(%)
YOLOv7-Tiny-Ghost11.291.9816.9623.07
−(100%NWD)24.592.9211.0310.24
−(90%NWD + 10%CIoU)2392.5314.2313.84
−(80%NWD + 20%CIoU)21.592.8314.3511.31
−(70%NWD + 30%CIoU)2093.1810.208.46
−(60%NWD + 40%CIoU)18.592.513.0412.3
−(50%NWD + 50%CIoU)1791.813.9914.6
Table 5. Ablation experiment results.
ModelsGhostFBNNWDFzc_xs
(AP%)
Defect
(AP%)
Insulator
(AP%)
Nest
(AP%)
mAP
(%)
Parmas
(MB)
FLOPs
(G)
Algorithm 1 90.8194.6792.8592.8492.7912.313
Algorithm 2 89.3592.8793.1592.5591.9834.2
Algorithm 3 89.3893.493.992.7192.313.14.2
Algorithm 4 89.795.9493.1891.0792.4734.2
Algorithm 590.796.193.793.793.53.14.3
Table 6. Comparison of various indicators of different models on the test set.
ModelsFzc_xs
(AP%)
Defect
(AP%)
Insulator
(AP%)
Nest
(AP%)
mAP
(%)
Inference
(ms)
Params
(MB)
Faster R-CNN55.7285.7689.3480.1877.7578114
YOLOv483.7486.4891.8781.898622.8256
YOLOv4-Tiny62.5875.3384.1571.1873.316.2823.6
YOLOv5s87.8683.9491.3382.0586.31328.5
YOLOXs90.8495.4296.1888.6392.771536
YOLOv6s89.688.192.688.889.8918.5
YOLOv7-Tiny90.8194.6792.8592.8492.79512.3
YOLOv8n90.693.892.890.99246.2
TD-YOLO90.796.193.793.793.53.53.1
Table 7. Test results on the Jetson Xavier NX before and after the improved model.
ModelsInference (ms)NMS (ms)Speed (FPS)mAP (%)
Algorithm 150 ± 44.5 ± 1.518.3 ± 1.892.79
Algorithm 233 ± 34.5 ± 1.526.7 ± 2.391.98
Algorithm 335.7 ± 2.84.5 ± 1.524.8 ± 2.492.31
Algorithm 434.9 ± 2.14.5 ± 1.525.3 ± 2.292.47
Algorithm 538 ± 34.5 ± 1.523.5 ± 2.293.5
Table 8. Comparison of indicators of Jeston Xavier NX and M300-RTK.
IndicatorsJeston Xavier NXM300-RTKEffective
Weight260 gMaximum load of 2.7 kg
Form Factor70 mm × 45 mm180 mm × 130 mm
Power ConsumptionMaximum 15 WRated power 17 W
Frame Rate23.5 ± 2.2 FPSMaximum 30 FPS
Disclaimer/Publisher’s Note: The statements, opinions and data contained in all publications are solely those of the individual author(s) and contributor(s) and not of MDPI and/or the editor(s). MDPI and/or the editor(s) disclaim responsibility for any injury to people or property resulting from any ideas, methods, instructions or products referred to in the content.

