1. Introduction
Nowadays, many people are suffering from diabetic retinopathy (DR). It is one of the most typical reasons among adults aged 20–74 years for blind registration in the world [
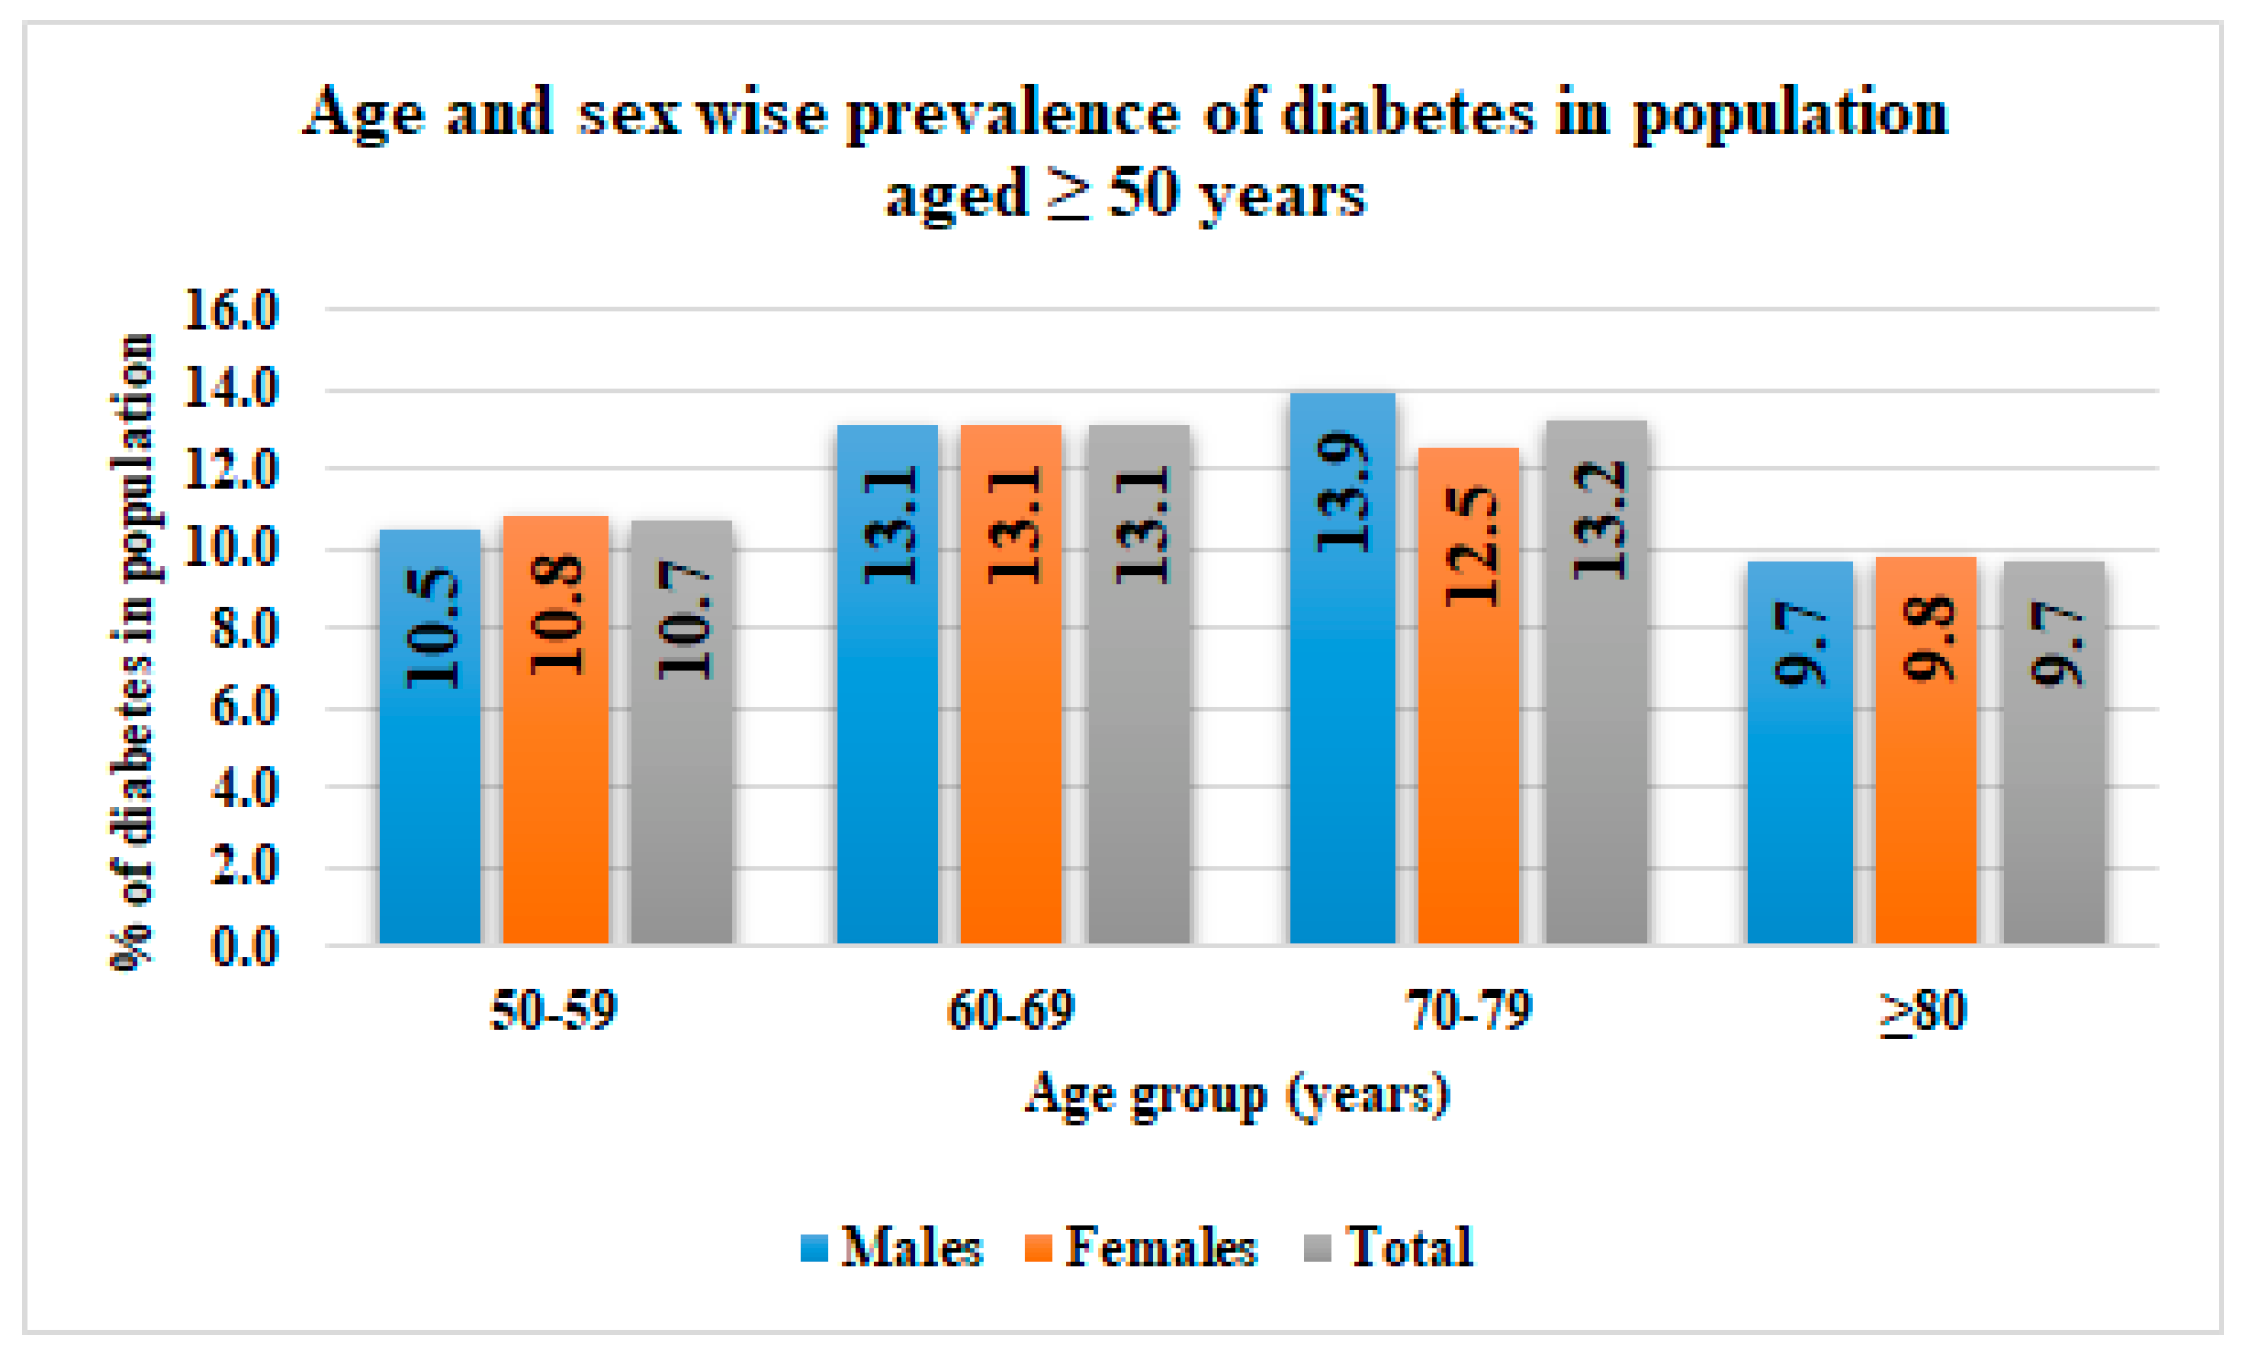
1]. Retinopathy development depends on how long a person has had diabetes. The prevalence of diabetes in India alone was 11.8%, with 10.7%, 13.1%, 13.2%, and 9.7% in the 50–59 years age group, 60–69 years age group, 70–79 years age group, and ≥80 years age group, respectively, from 2015 to 2019 [
2] (
Figure 1). In the 70–79 years age group, the prevalence of diabetes was the highest.
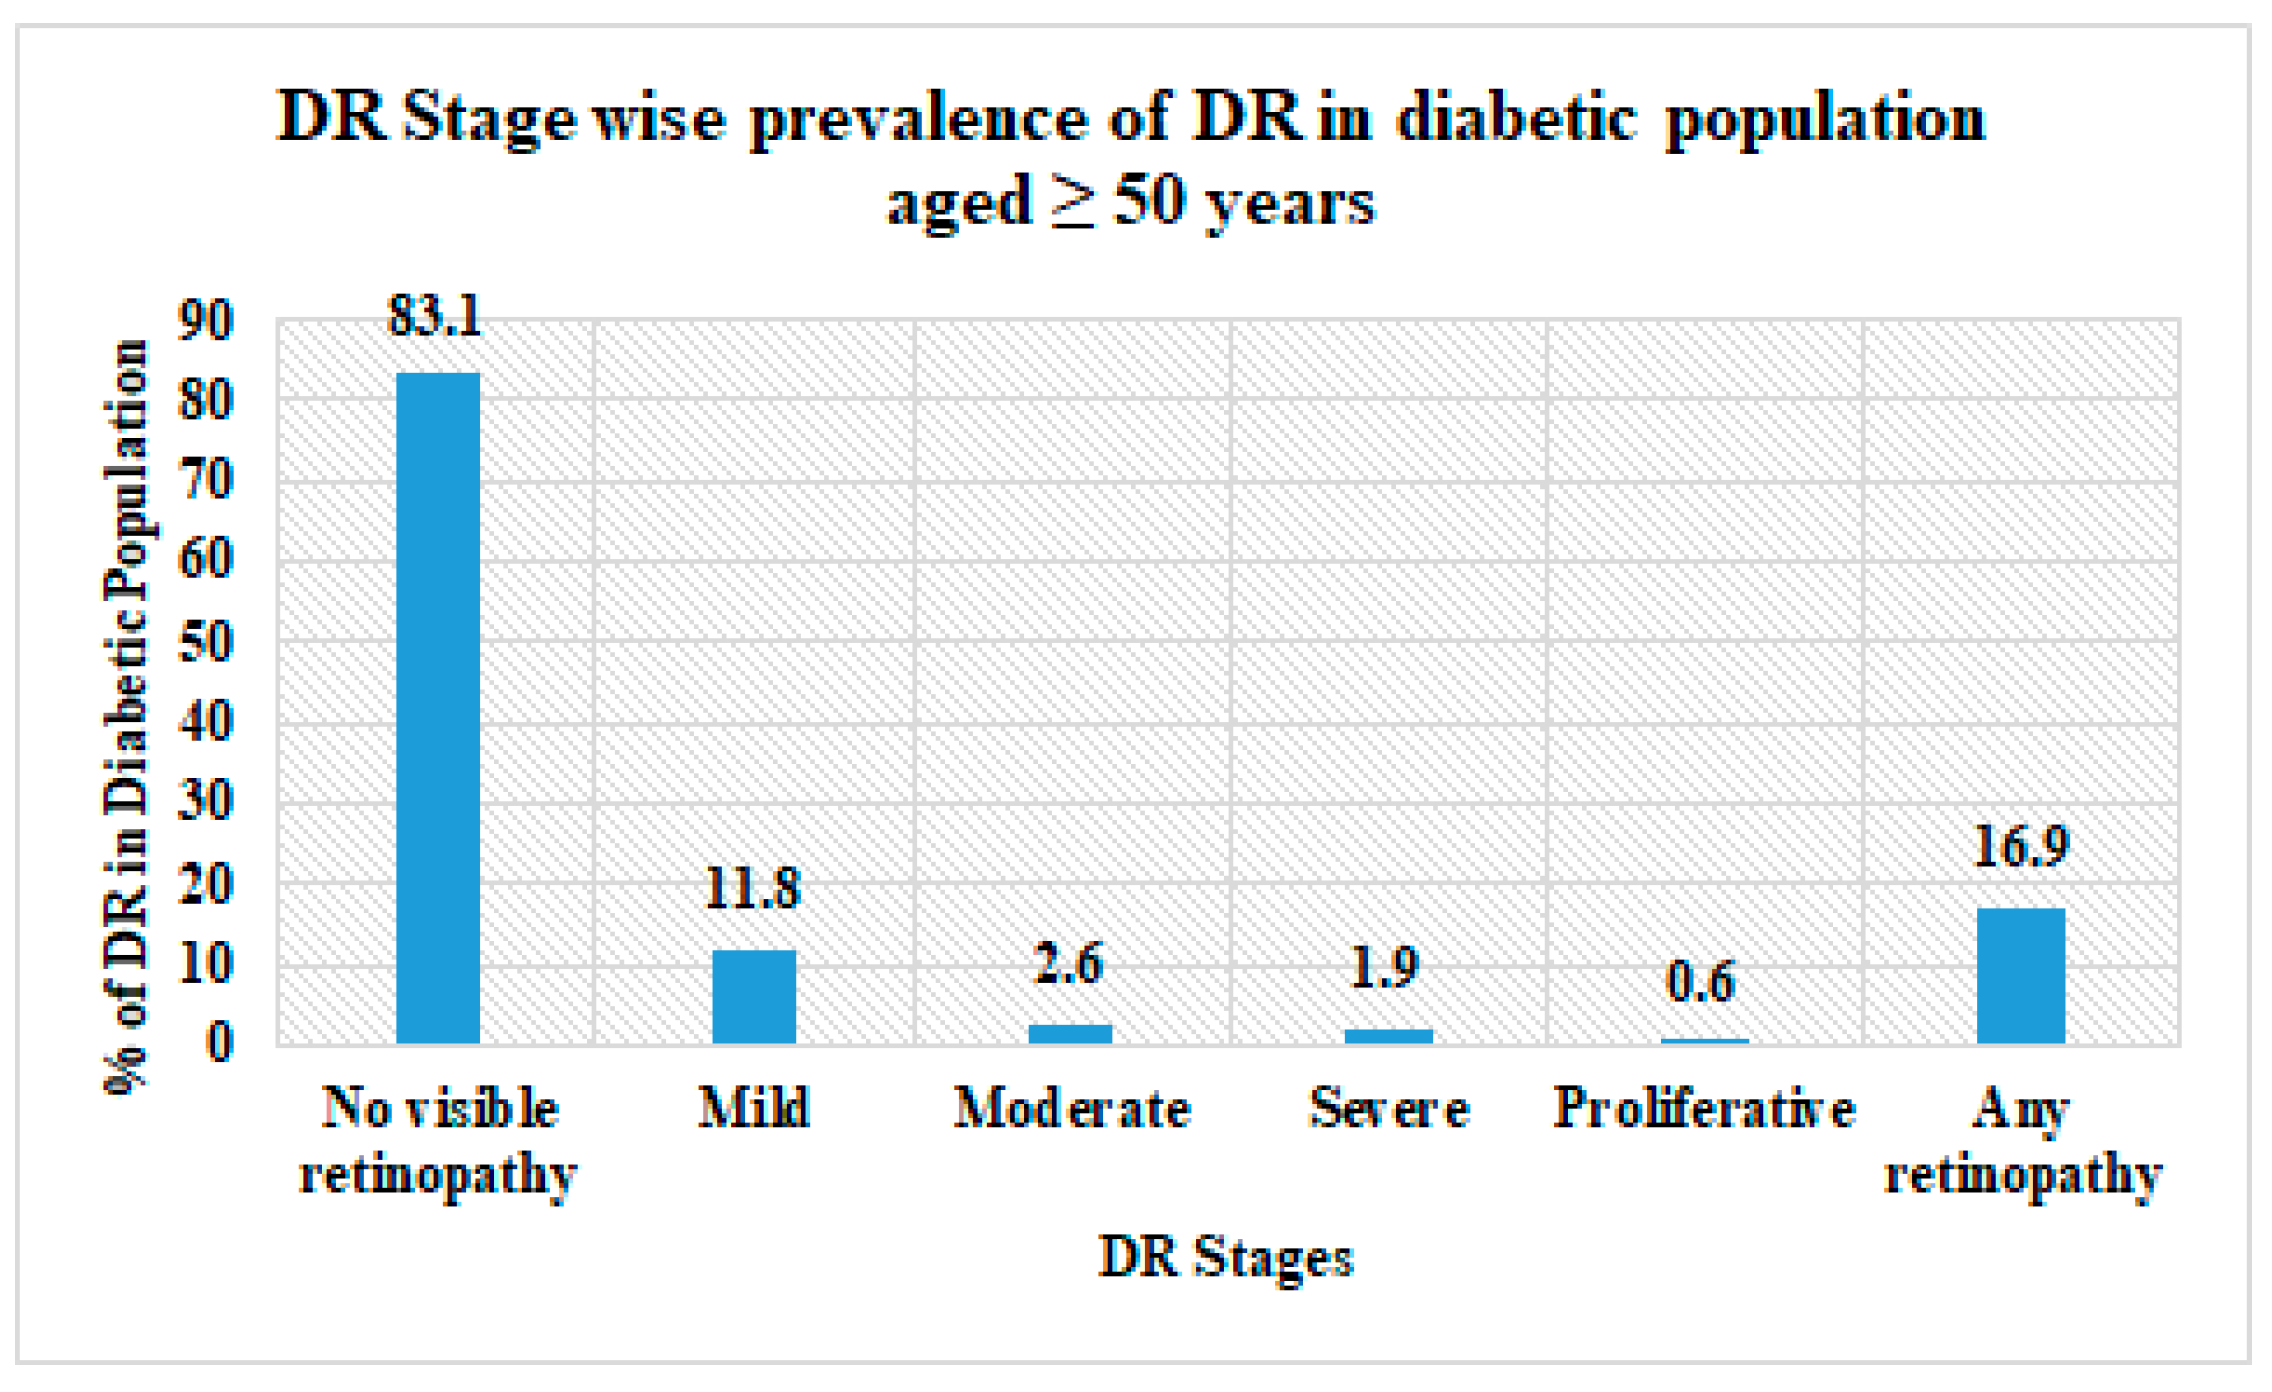
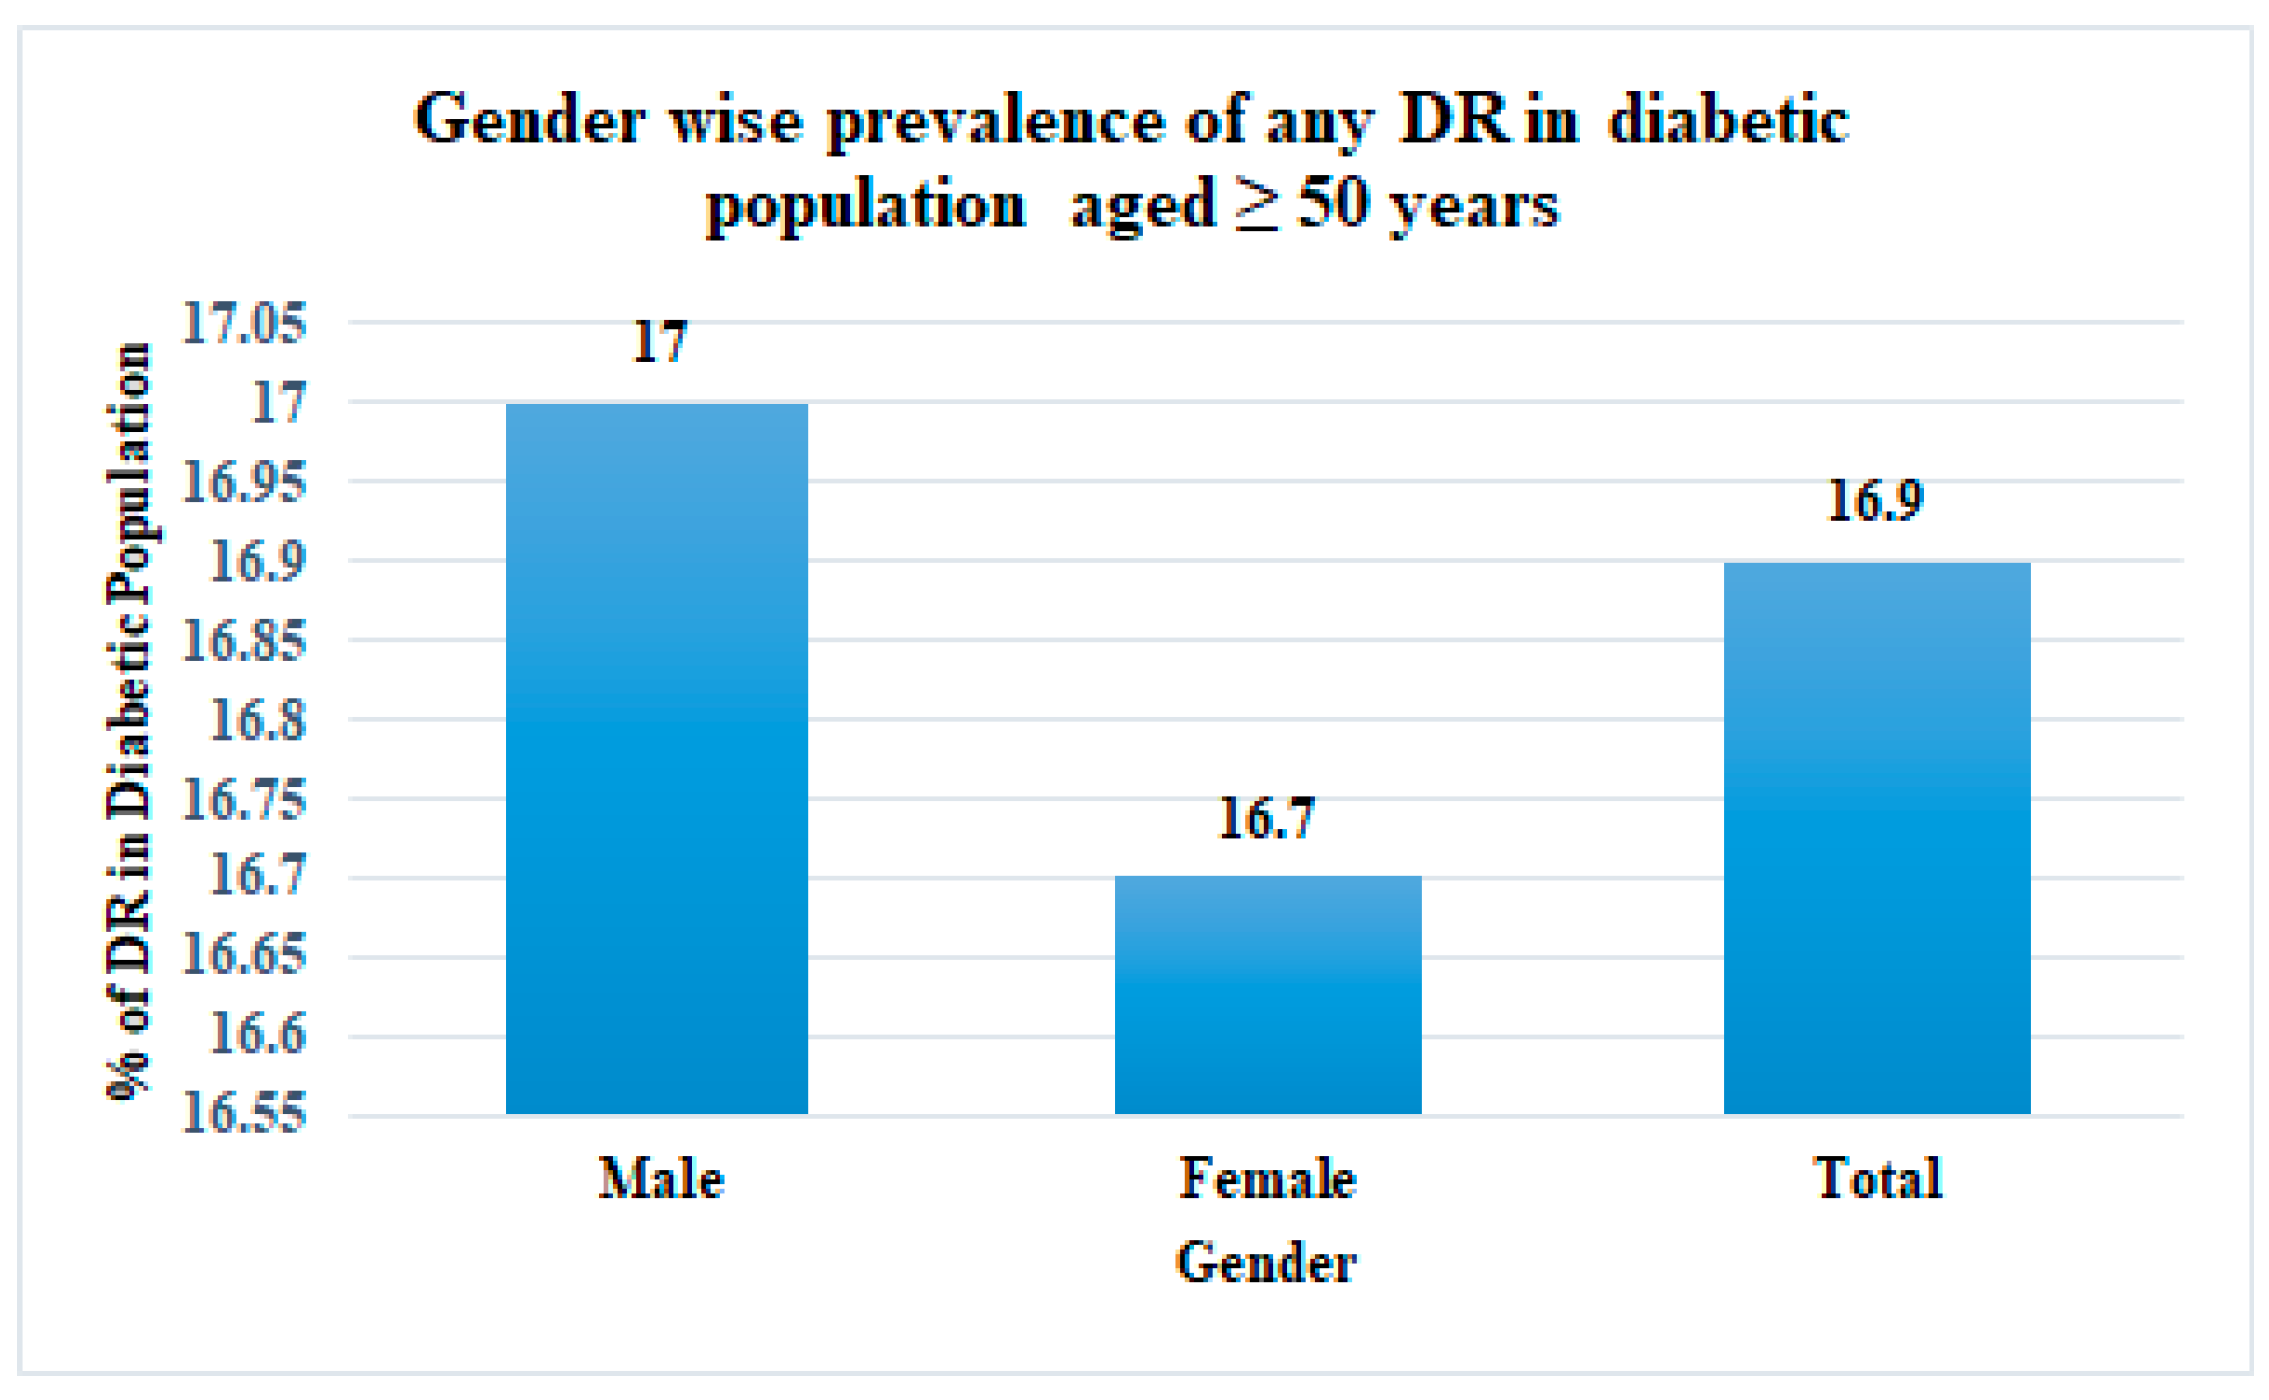
This prolonged diabetes leads to diabetic retinopathy. DR affects the vision of 463 million people worldwide and is responsible for 22.27% of global blindness (2019) [
1]. In India, 16.9% [
2] (
Figure 2 and
Figure 3), i.e., around 72.96 million cases in the population, are suffering from DR, as per a survey done from 2015 to 2019.
The Times of India article dated 14th Nov 2021 reported 77 million DR cases in India [
3]. The cases increased mainly due to type 2 diabetes.
The traditional screening of fundus images for diagnosing DR lesions takes time, thereby delaying therapy and reducing the chance of success. Therefore, the screening strategies must be changed to save the time of both doctors and patients by using a computer-aided diagnosis. Thus, new technologies, such as machine learning, come into play for detecting and classifying DR. The quality, affordability, and accessibility of DR screening in the diabetic population are all crucial parameters in preventing blindness. New technology will ease this issue in terms of cost.
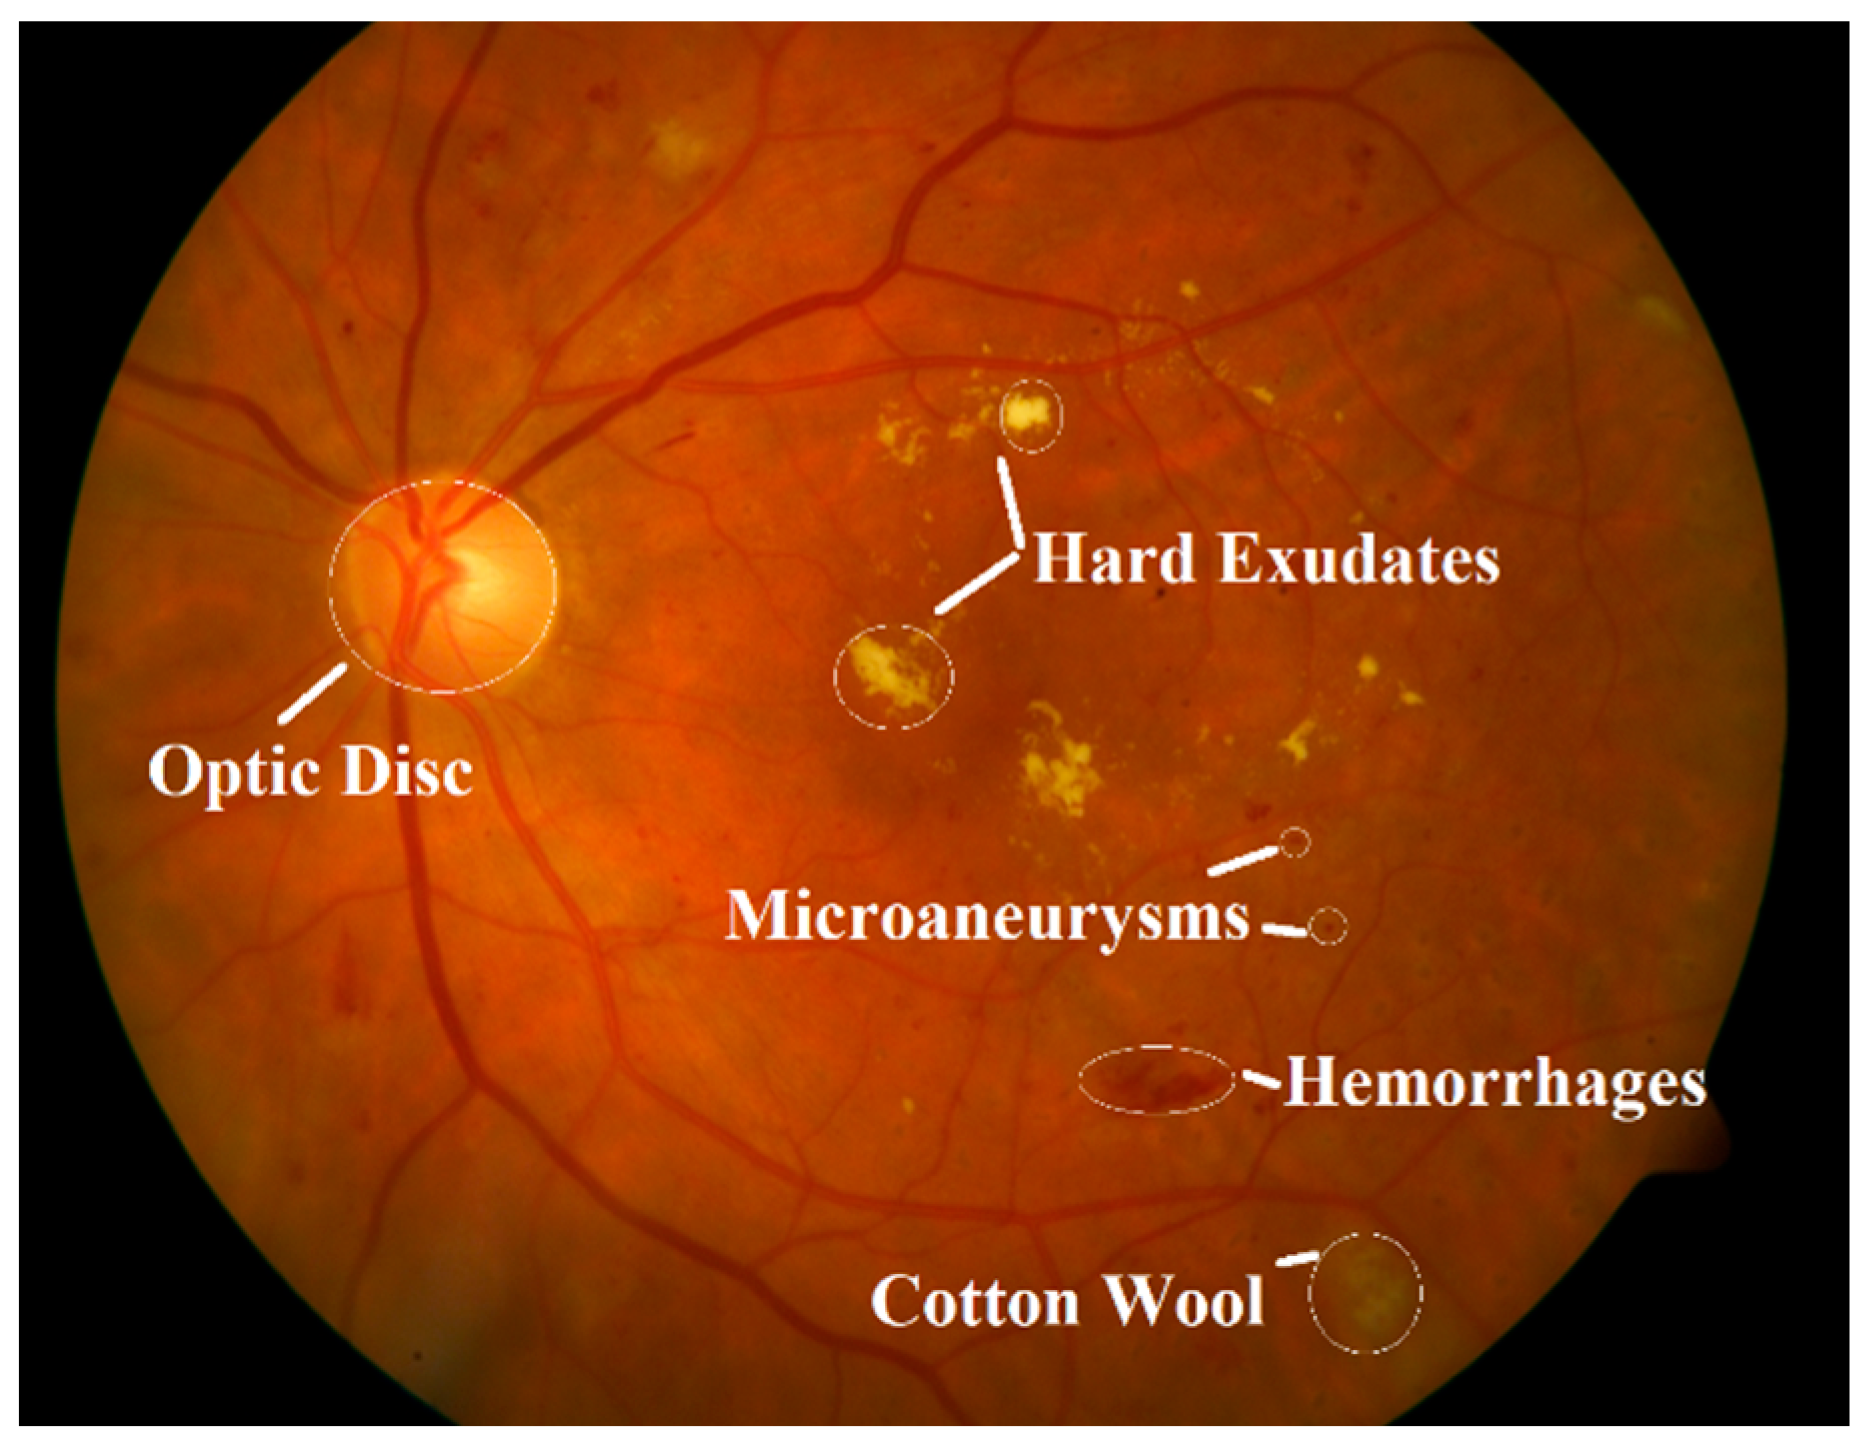
In DR patients, lesions [
4] such as microaneurysms, hemorrhages, exudates, and neovascularization (
Figure 4) may develop. These lesions need to be detected early for proper intervention. Microaneurysms are small swellings that form at the internal wall of a blood vessel, which may burst and leak blood into nearby tissues, whereas hemorrhages are ruptures of capillaries. Exudates can be hard exudates or soft exudates. Hard exudates are yellowish lipids that leak from an abnormal blood vessel, and soft exudates are whitish-grey, also called cotton wool.
Diabetic retinopathy is divided into two types: non-proliferative and proliferative. Non-proliferative DR is divided into three stages: mild, moderate, and severe [
5]. Only microaneurysms are present in mild non-proliferative DR, while exudates characterize moderate and severe stages, along with microaneurysms. However, microaneurysms may be present in later stages. During non-proliferative DR, the patient barely experiences any peculiar symptoms. However, their eyesight gradually becomes impaired as the disease progresses to the proliferative stage. It may lead to neovascularization; thus, the patient may lose vision completely. Therefore, intervention at a later stage is less helpful, and thus, diagnosing DR early is necessary [
6].
Artificial intelligence and machine learning have been widely employed in healthcare, especially for disease diagnosis. Thus, a computer-based diagnosis is required to accurately identify diabetic retinopathy symptoms for early intervention. Many studies were carried out using machine learning techniques to process medical images automatically and diagnose diseases. We categorized them based on their learning styles. This study will be helpful for researchers to acquire insights into the application of AI–ML in the research of diabetic retinopathy from the year 2000 to 2021. We used bibliometric analysis to analyze papers related to machine-learning-based diabetic retinopathy. The data was collected from the Scopus and WoS databases. An intensive quantitative study was done using VOSViewer, Gephi, Rstudio, and Biblioshiny regarding the top author’s production over time, trend topic, keywords analysis, thematic evolution, etc. Furthermore, the fundamental analysis, such as yearly publication, number of citations per year, top countries, etc., was done using Excel.
The rest of the paper is designed as follows:
Section 2 outlines the search strategy utilized in data collection from Scopus and WoS databases. The analysis results of the collected data are given in
Section 3 in various ways, such as documents published per year, the number of citations per year, source analysis, top countries, and top authors involved in research, and keyword analysis.
Section 4 expounds on the qualitative study based on different machine learning styles used in the literature.
Section 5 summarizes the paper and exhibits a few issues. Finally,
Section 6 concludes the article.
2. Research Methodology
Quantitative and qualitative analyses are the two crucial strategies used for collecting and deciphering data in research. Both quantitative and qualitative analyses were carried out in this paper, which will help research scholars to refine their research area and identify the research gaps.
Bibliometric analysis thoroughly examines the research carried out in a particular area. It is the factual investigation of journals, articles, books, or other distributions. This particular analysis assessed the significance and impact of journals and articles published in detecting diabetic retinopathy and may offer assistance regarding treatment advancement, as well as helping with financing and grants.
This research aimed to look into various machine learning algorithms for diabetic retinopathy detection, and thus, identify the areas of opportunity to improve the performance of machine learning for detecting DR.
Search Strategy
The data were collected from the most popularly known databases, i.e., Scopus and Web of Science (WoS).
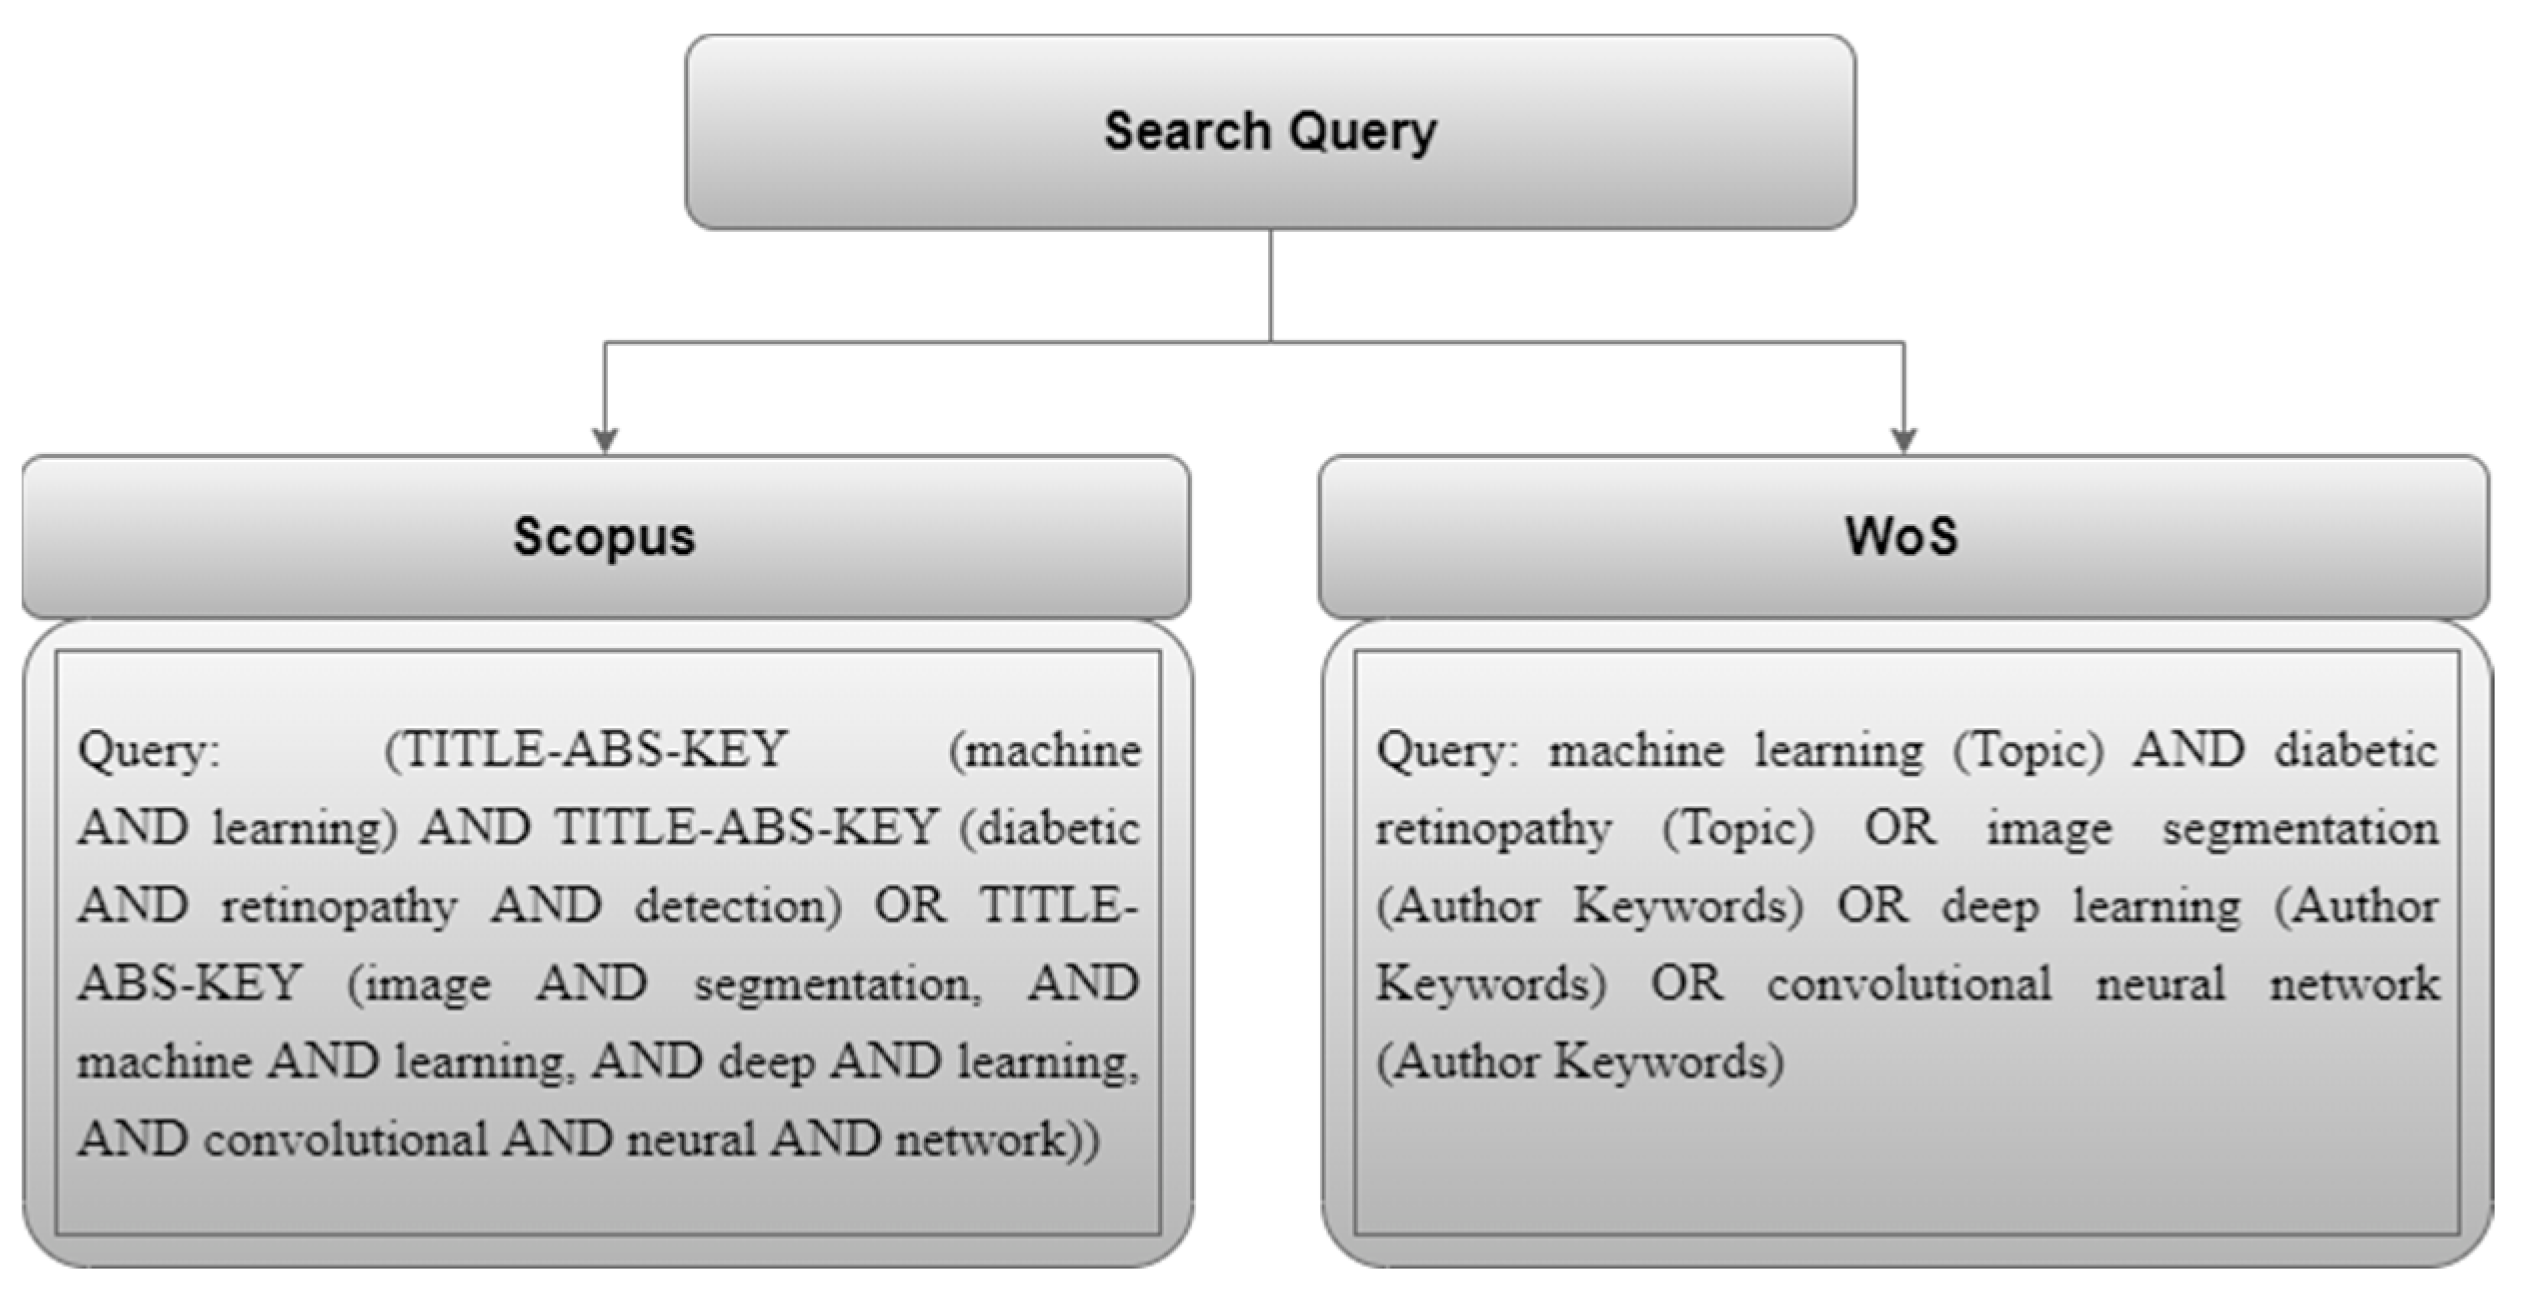
Figure 5 shows the search query [
7] used in both databases for this study.
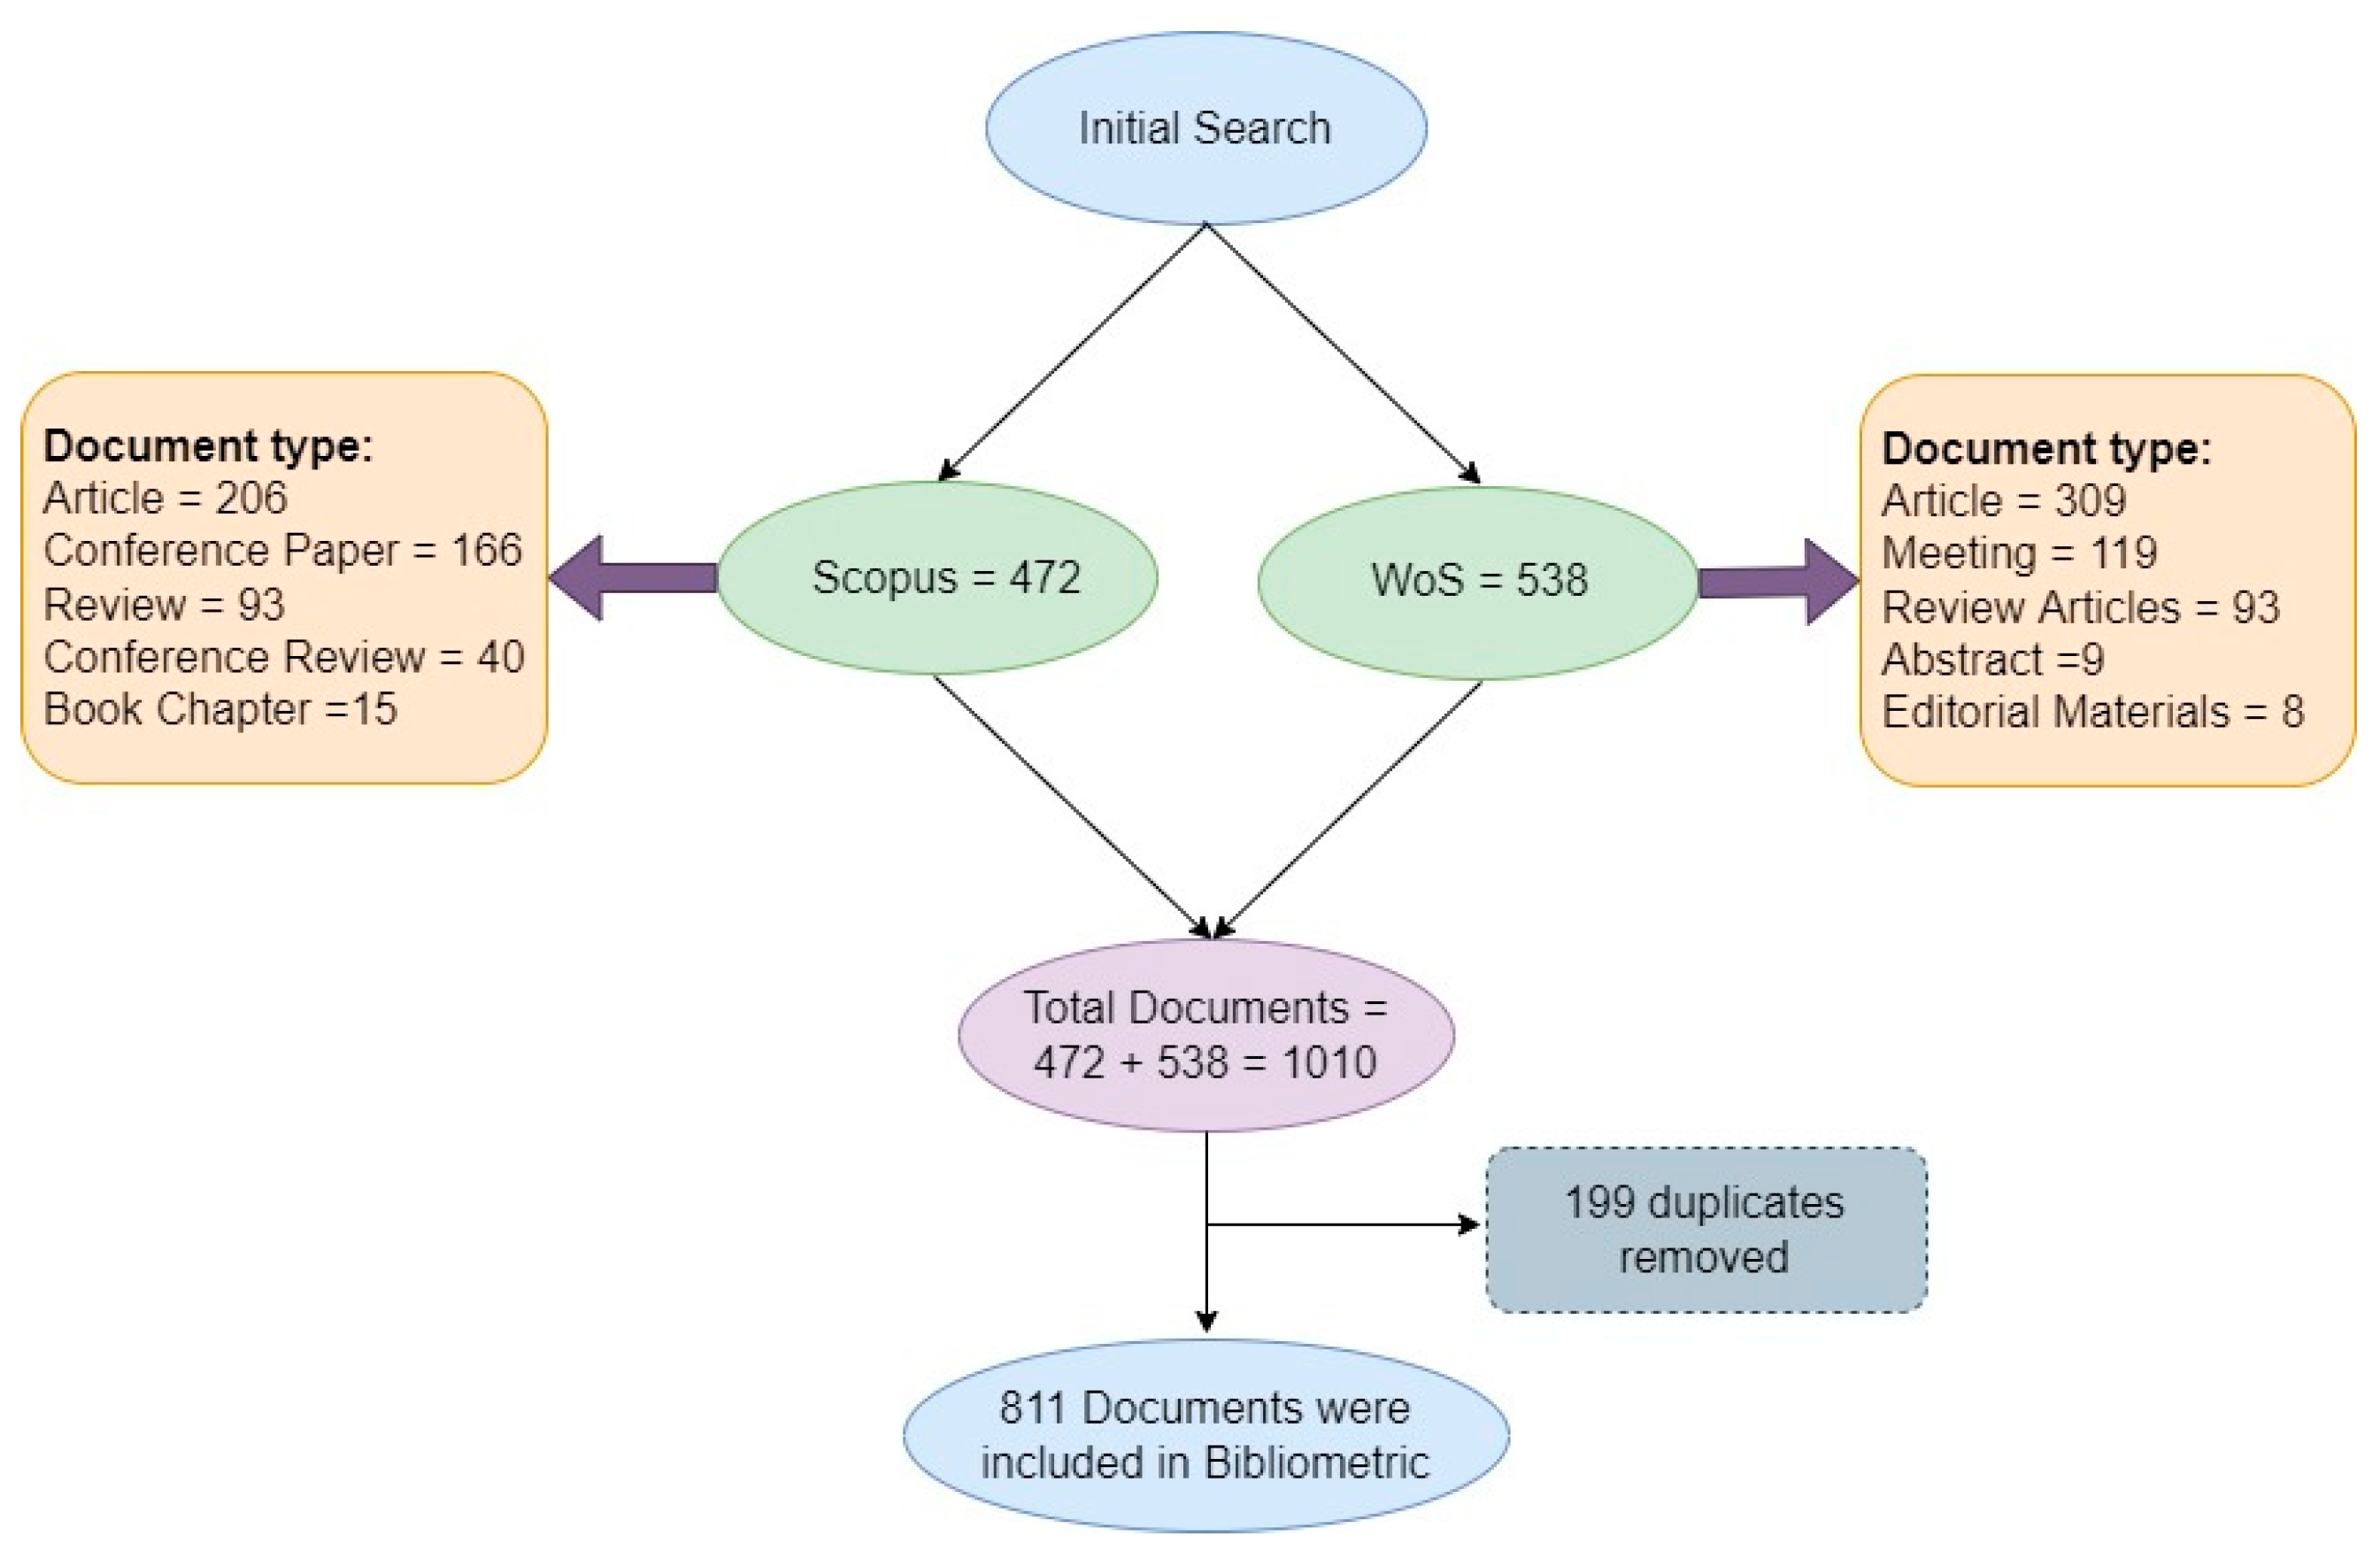
The search strategy [
8] is shown in
Figure 6, where a total of 472 documents from Scopus and 538 from WoS met the selection criteria for all different document types from 2000 to 2021. The documents were articles, conference papers, review articles, conference reviews, book chapters, letters, abstracts, meetings, early access, editorial materials, and data papers.
3. Quantitative Analysis
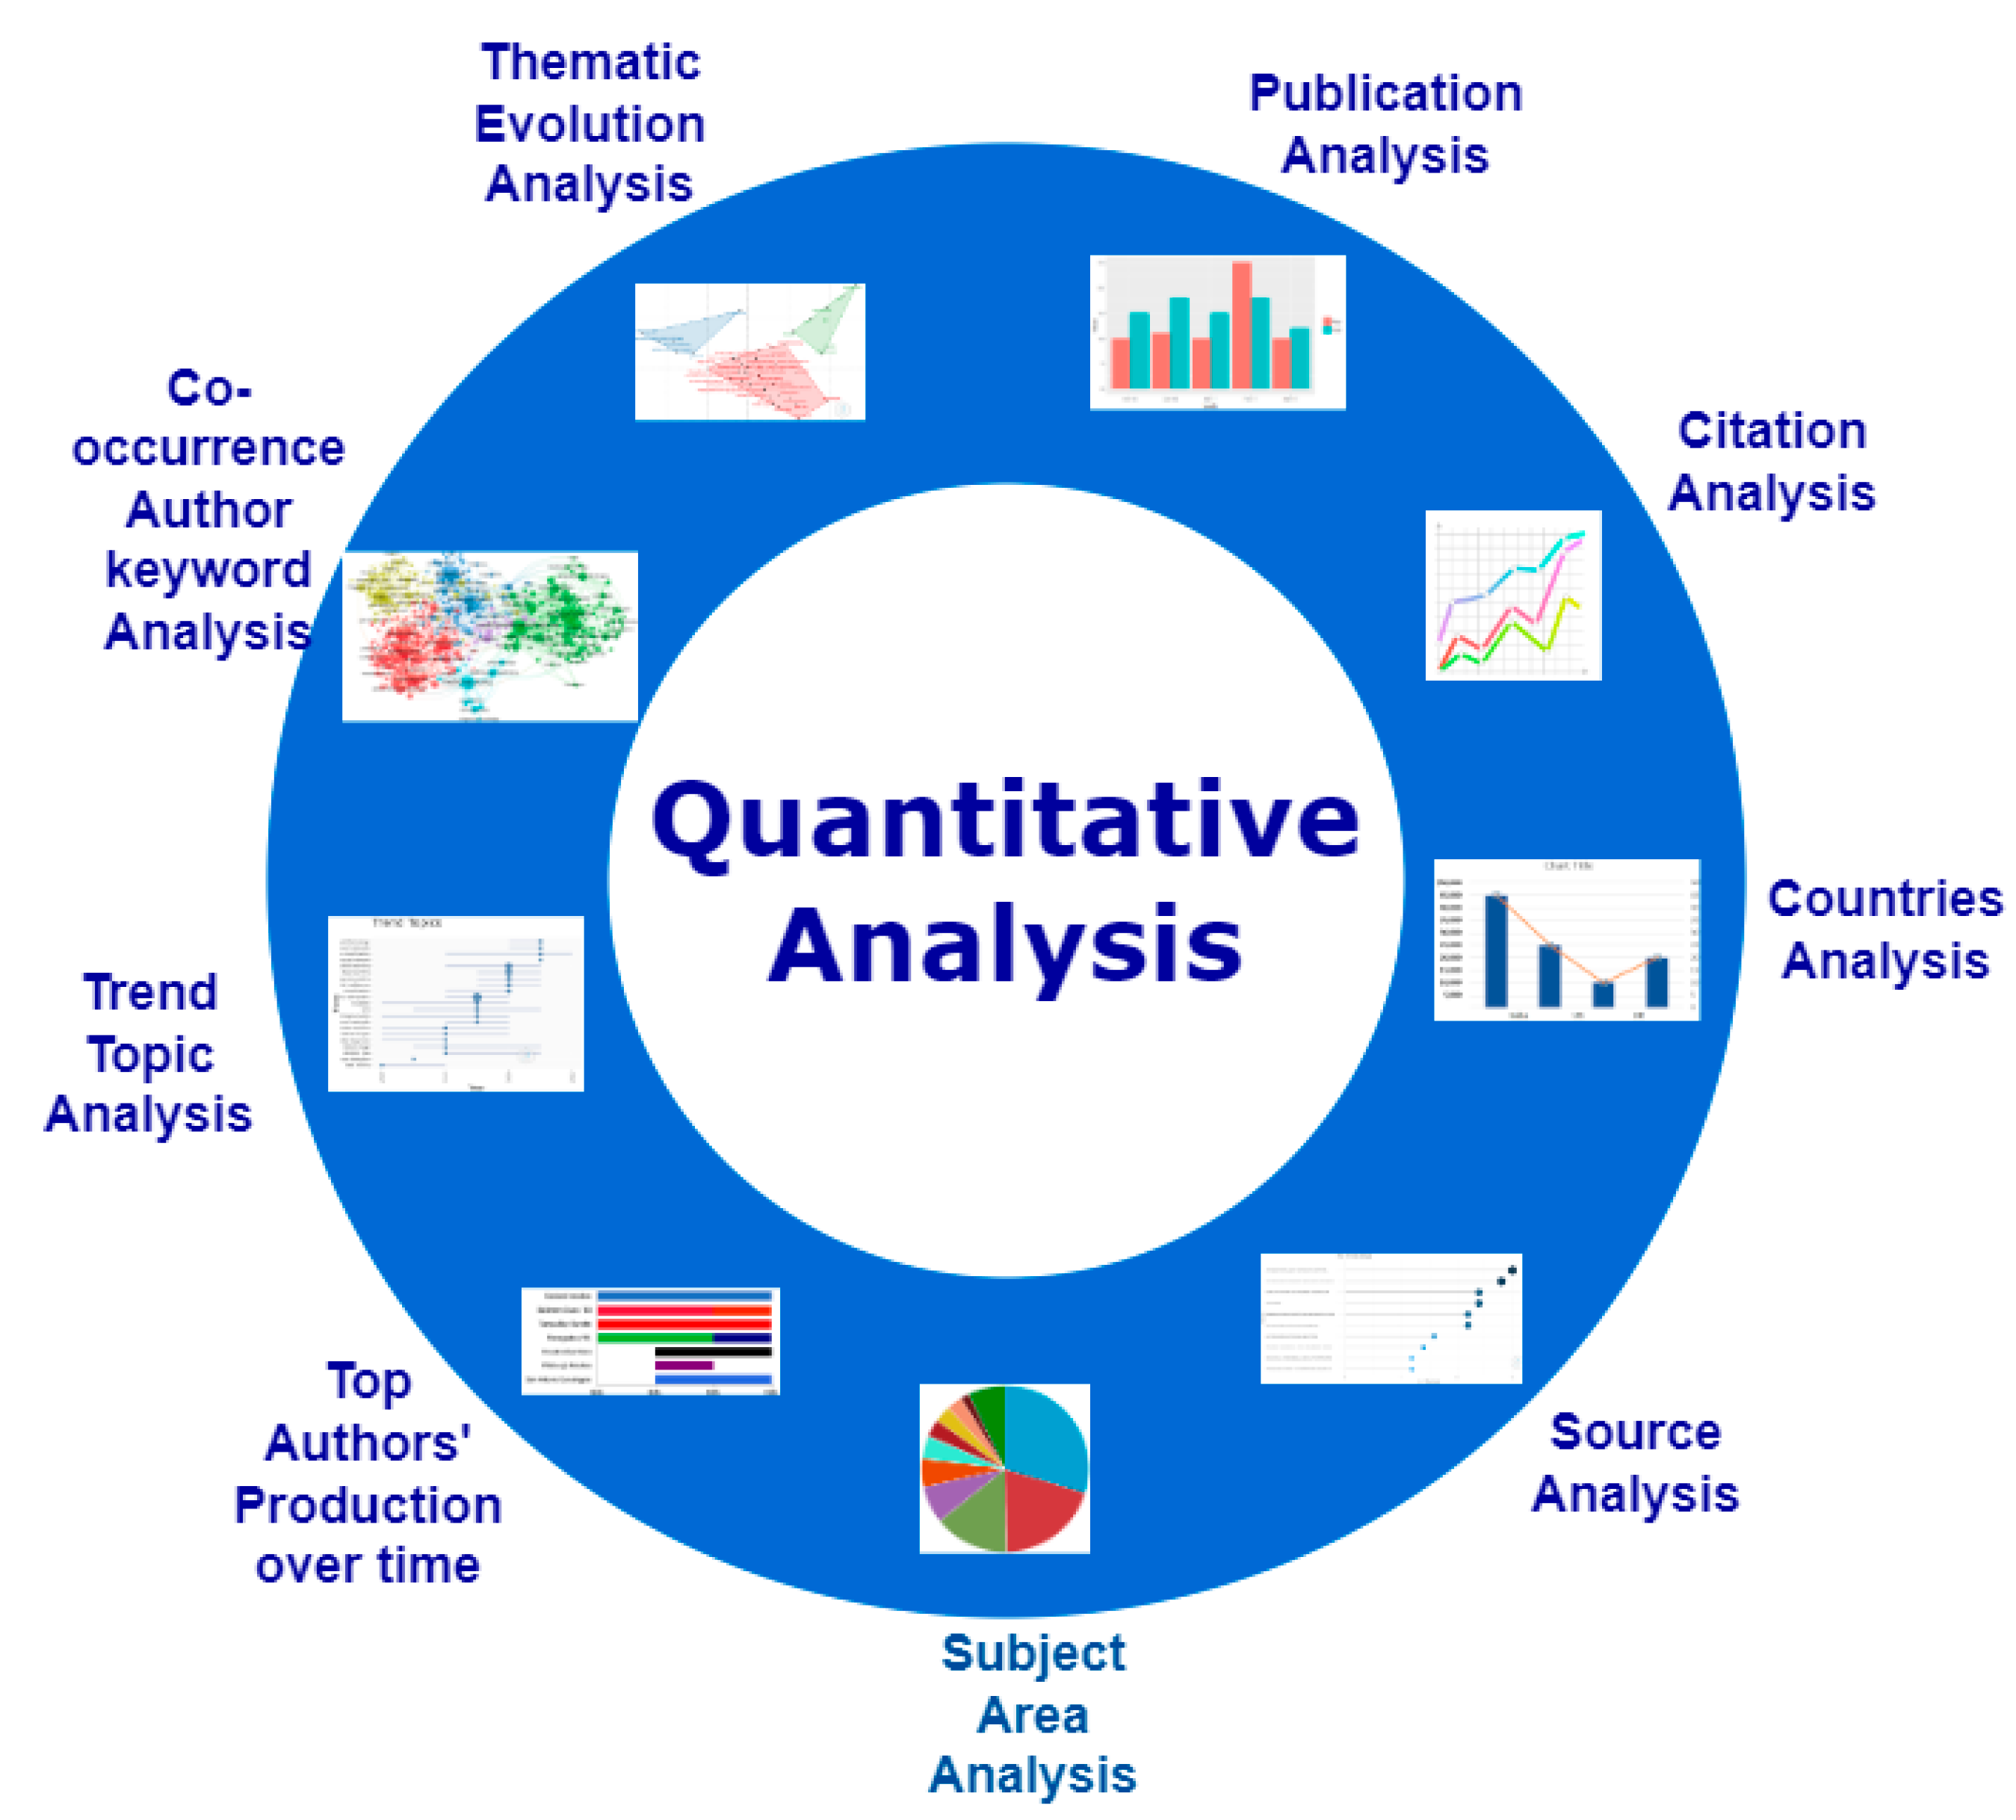
The comma-separated values (CSV) file downloaded from Scopus contained all the articles with the author, ID, title, year, source title, volume, issue, page start, page end, page count, cited by, DOI, link, affiliations, author keywords, publisher, ISSN, ISBN, document type, source type, and PubMed ID information. The text file downloaded from WoS contained all the articles with the details of the publication type, authors, book authors, article title, patent number, source title, volume, issue, DOI, publication year, ISSN, ISBN, unique ID, and PubMed ID.
We thoroughly analyzed (
Figure 7) this information using Excel, RStudio, Biblioshiny, and VOSviewer to quantify the amount of work done in detecting diabetic retinopathy using machine learning.
3.1. Publication Analysis
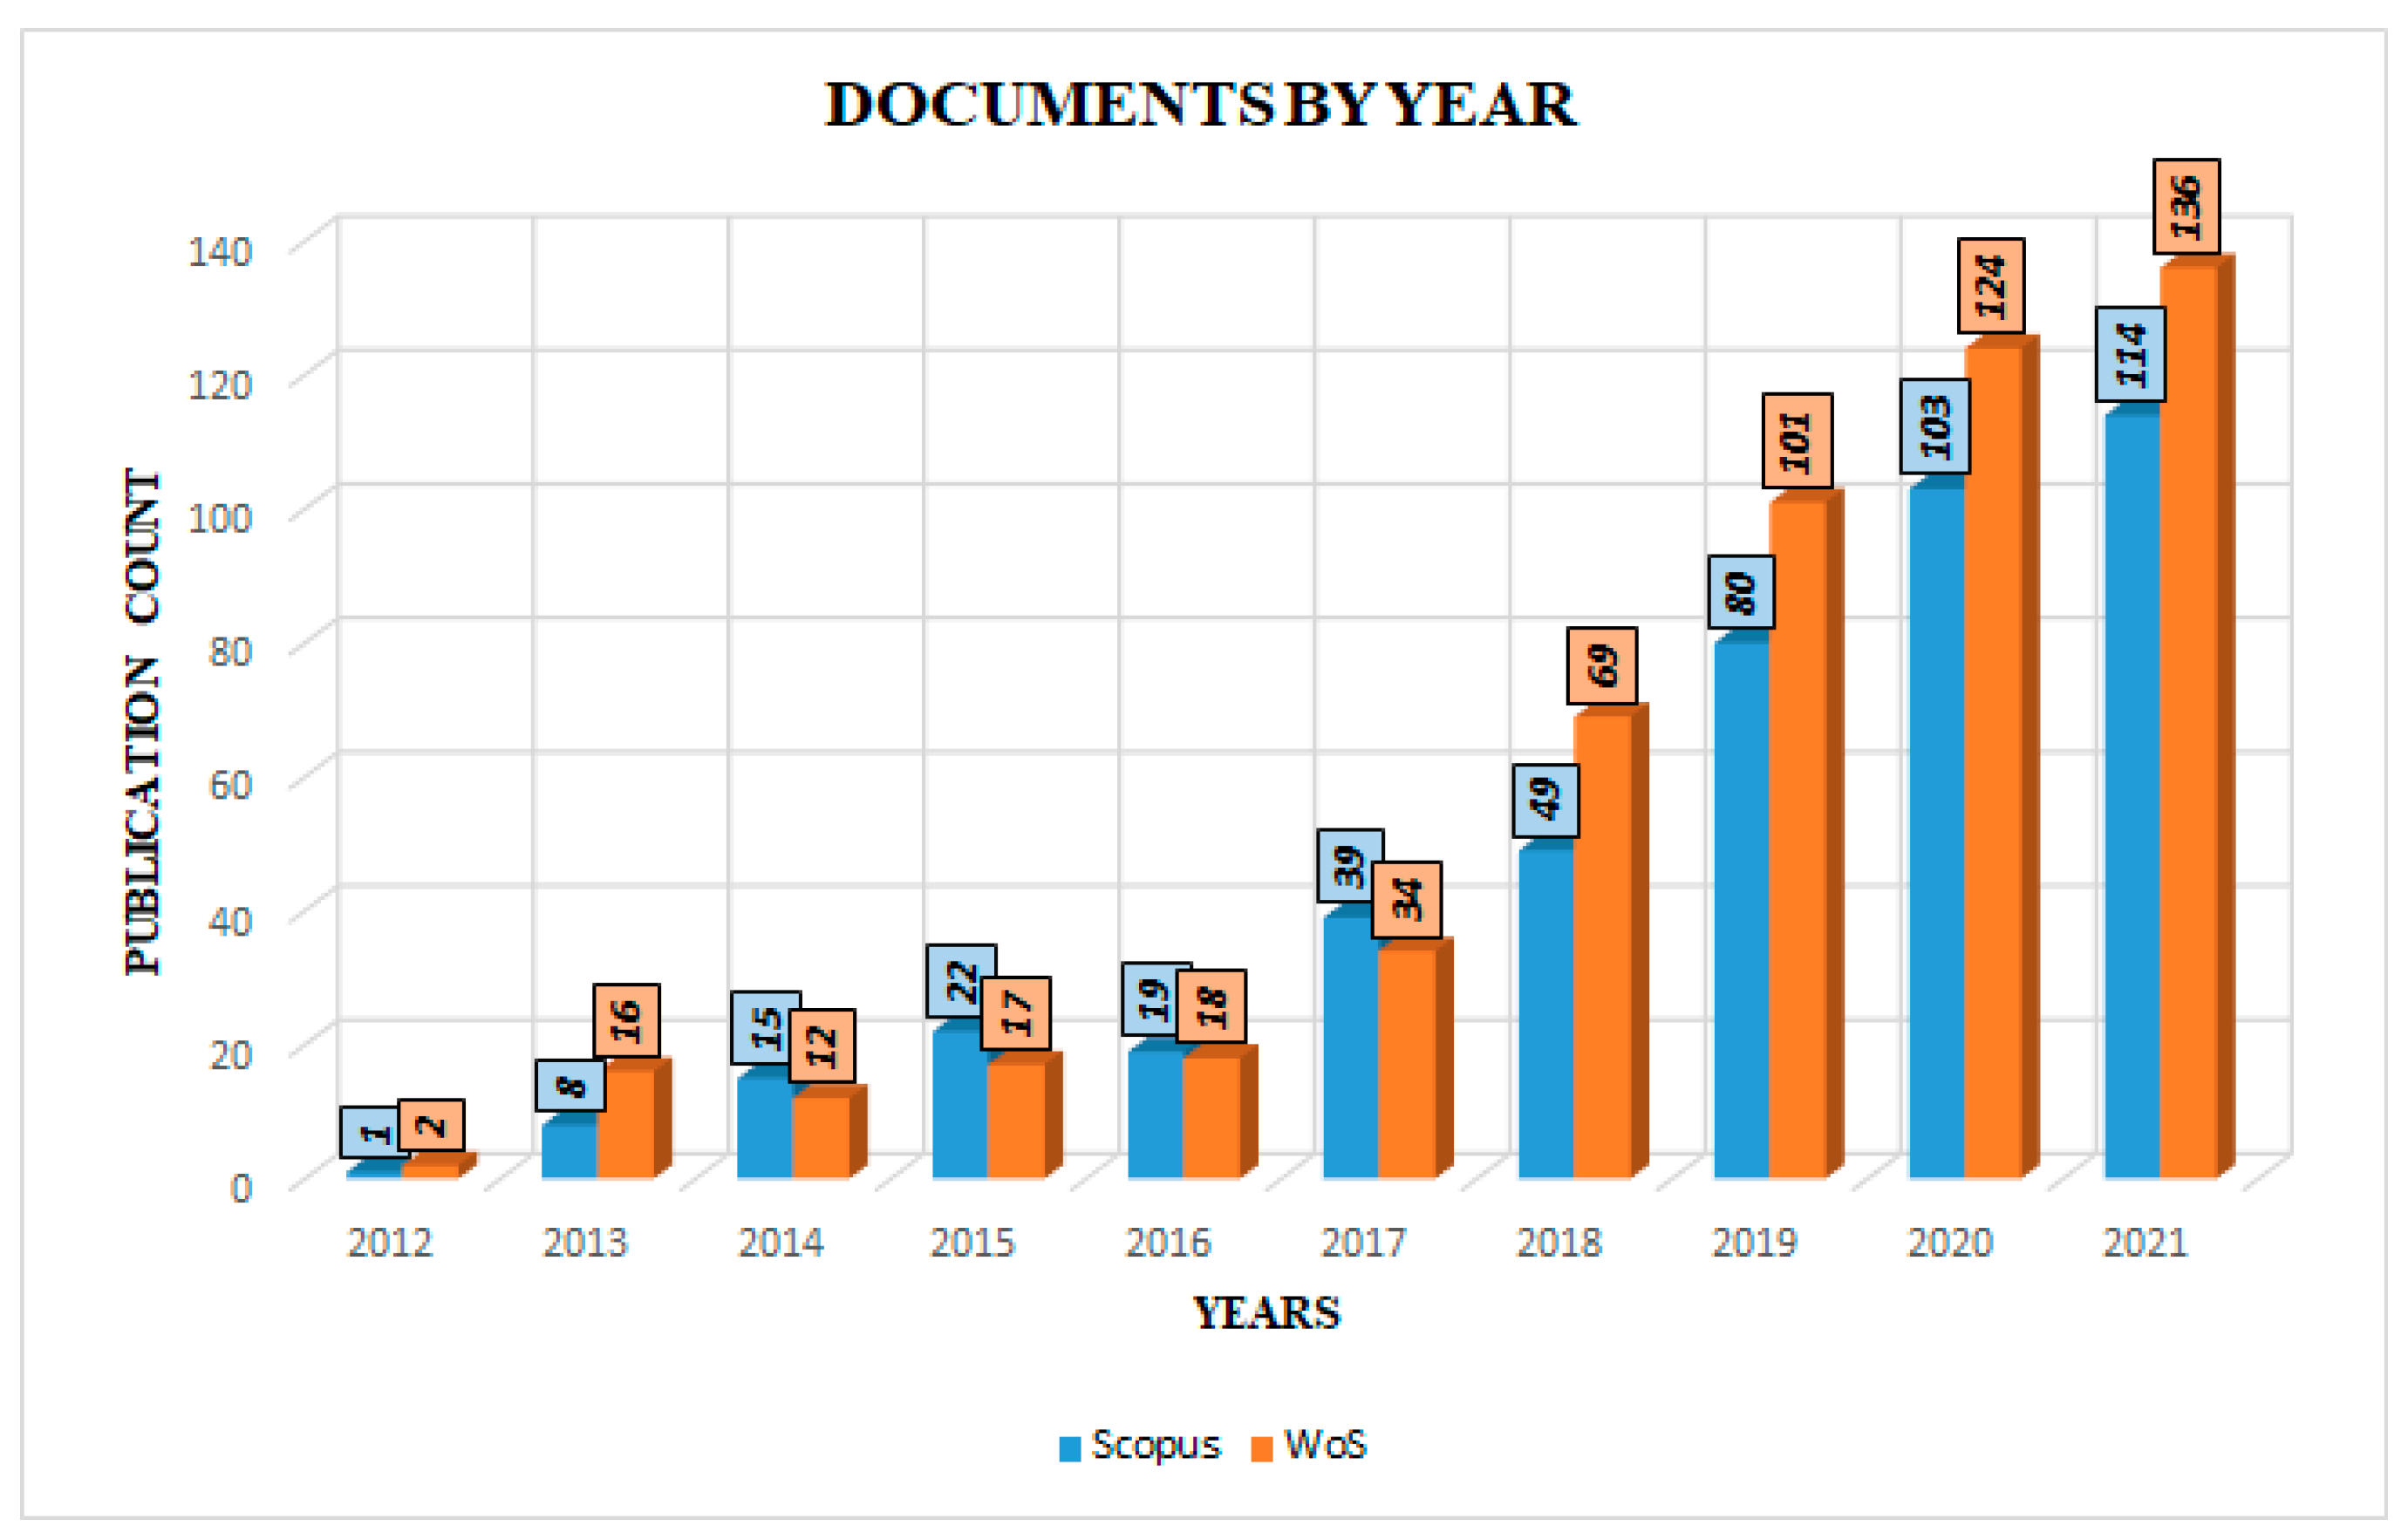
Figure 8 shows a bar graph of the number of documents published yearly in Scopus and WoS from 2012 onward. Researchers started working on diabetic retinopathy detection using machine learning in 2000. Initially, very few papers were published, and after 2013, we found a substantial increase in publications, with 114 (Scopus) and 136 (WoS) in 2021.
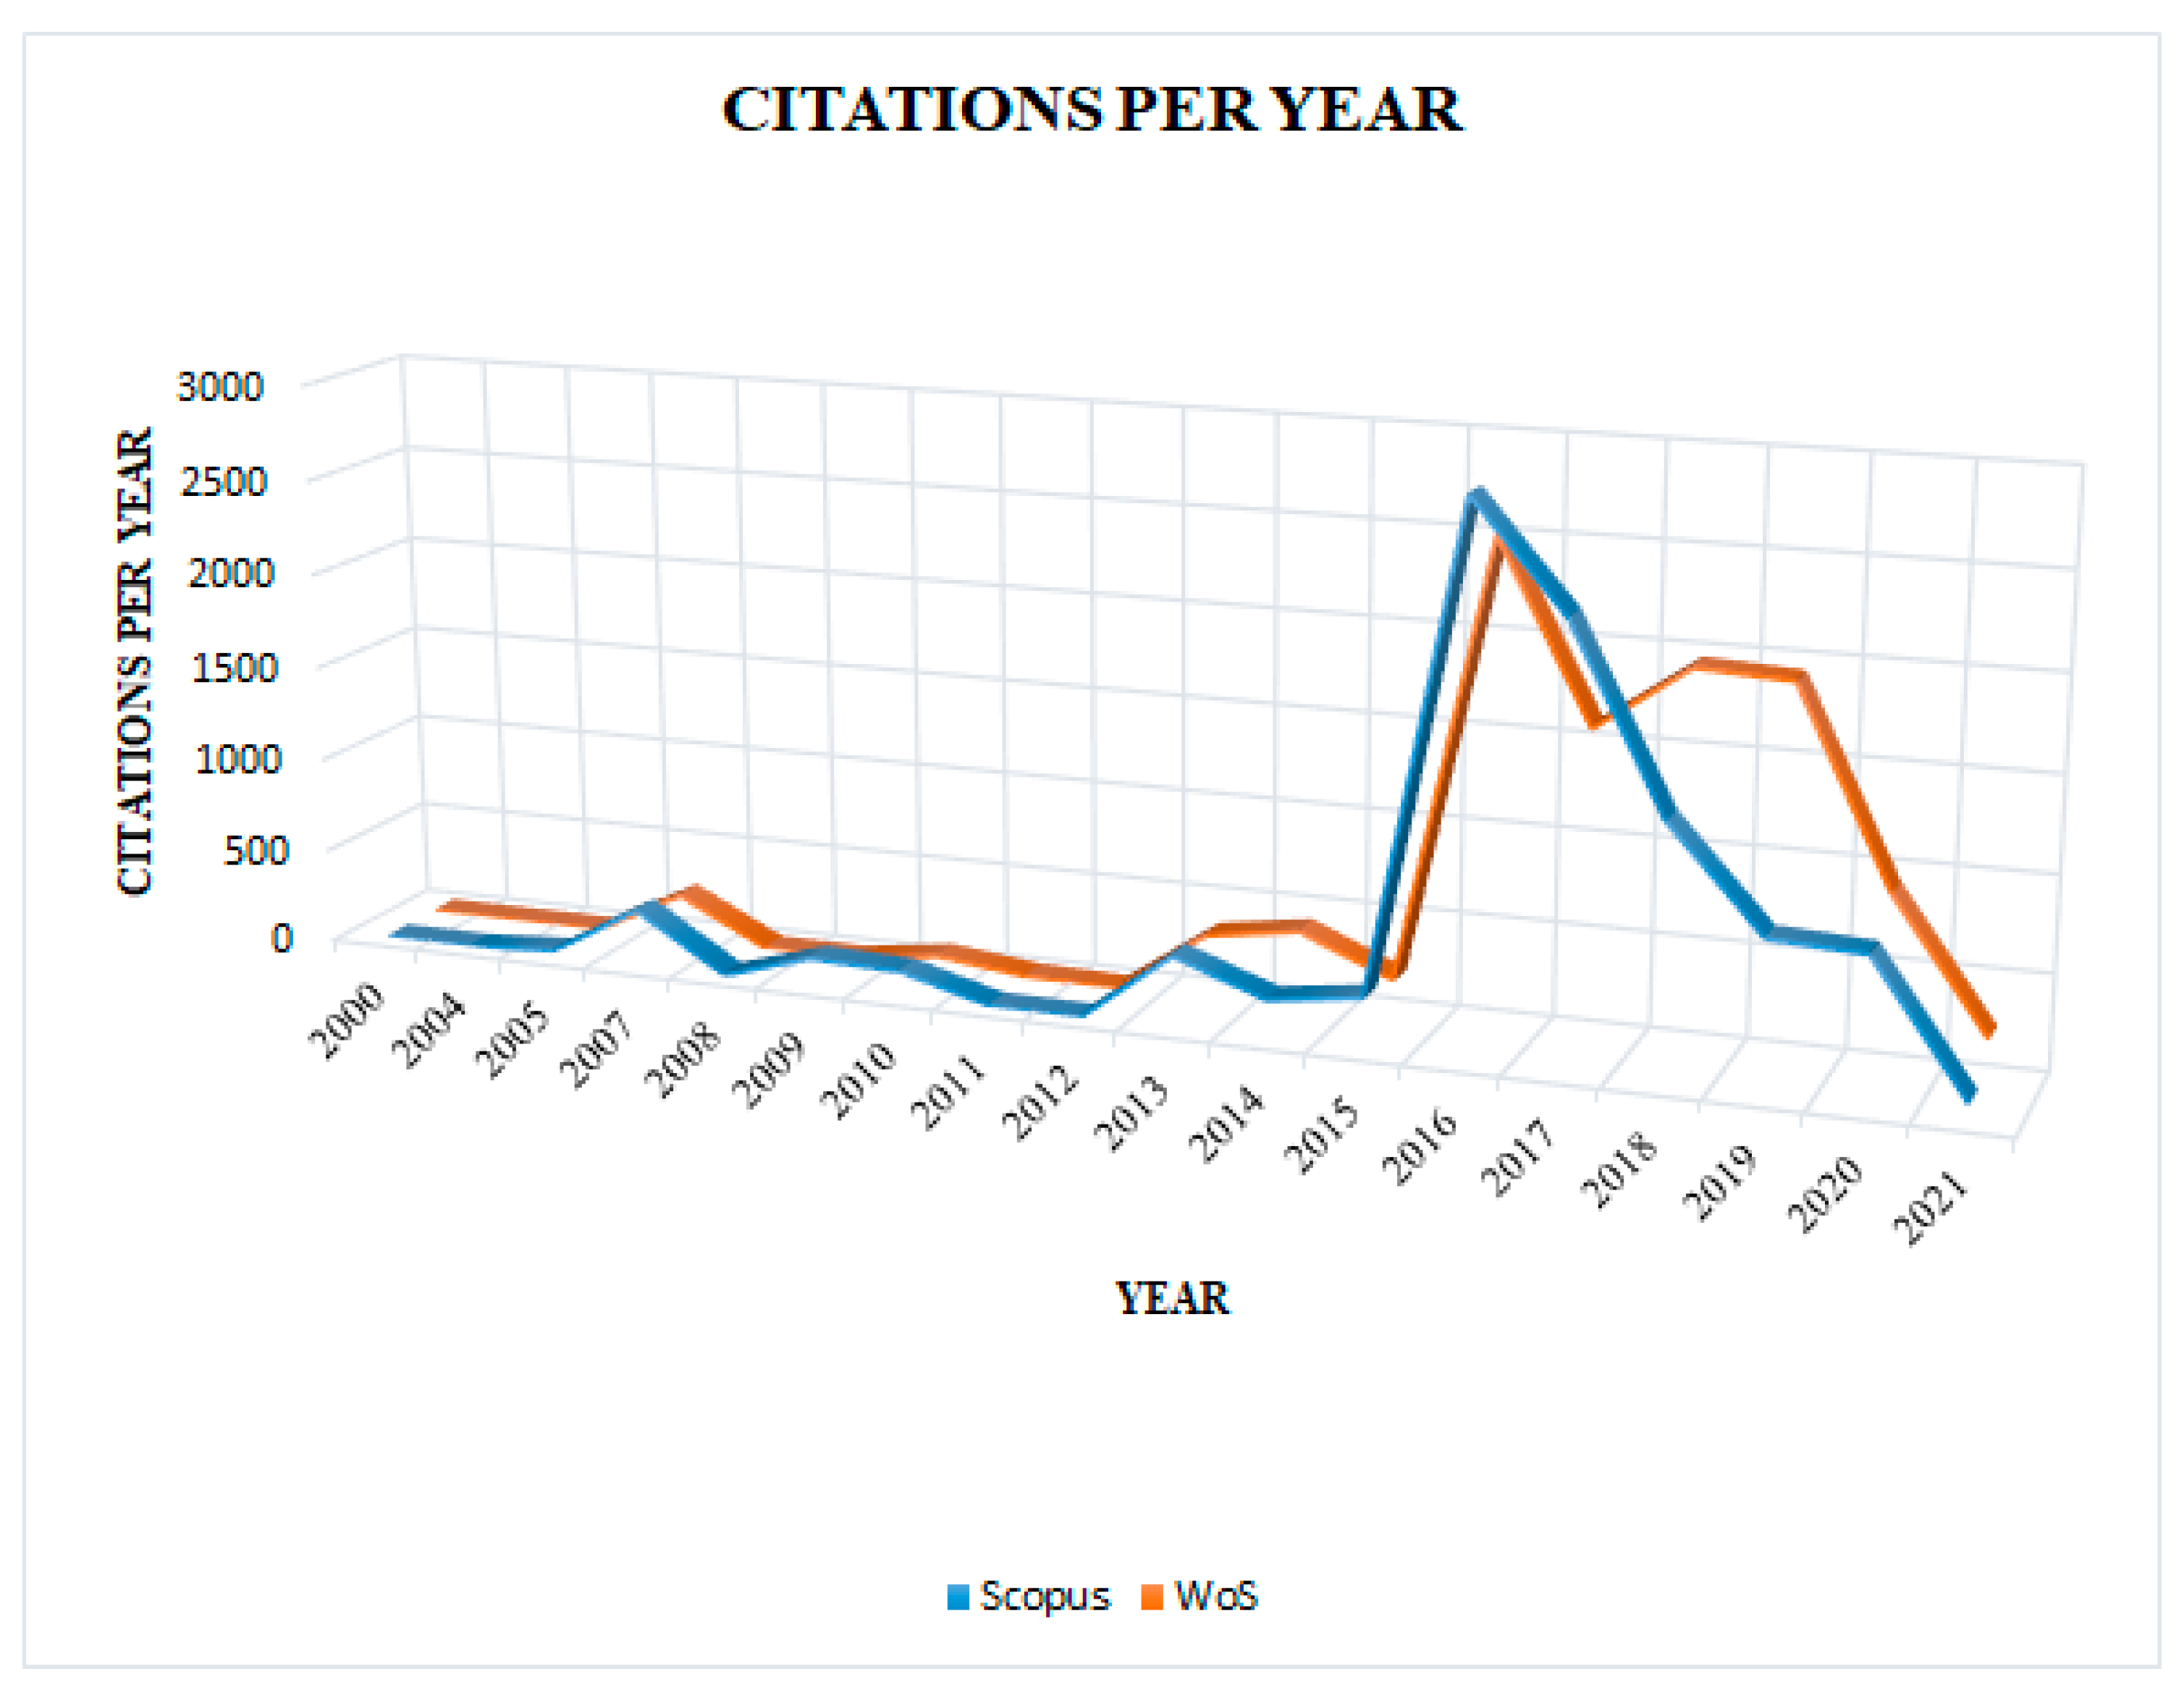
3.2. Citation Analysis
The comparative analysis of citation received per year for the papers published in both databases are tabulated, as shown in
Table 1, which indicated that around 1000 more citations were received for the documents published in WoS.
The detailed analysis is shown graphically in
Figure 9. It was observed that several citations received were at the peak for the papers published in the year 2016. One of the documents received 2571 out of 2827 citations (Scopus) and 2386 out of 2531 citations (WoS) in 2016. The document titled “Development and validation of a deep learning algorithm for the detection of diabetic retinopathy in retinal fundus photographs” was published in
JAMA—Journal of the American Medical Association by Gulshan V et al. [
9] and was included in both the databases and referred to by many researchers.
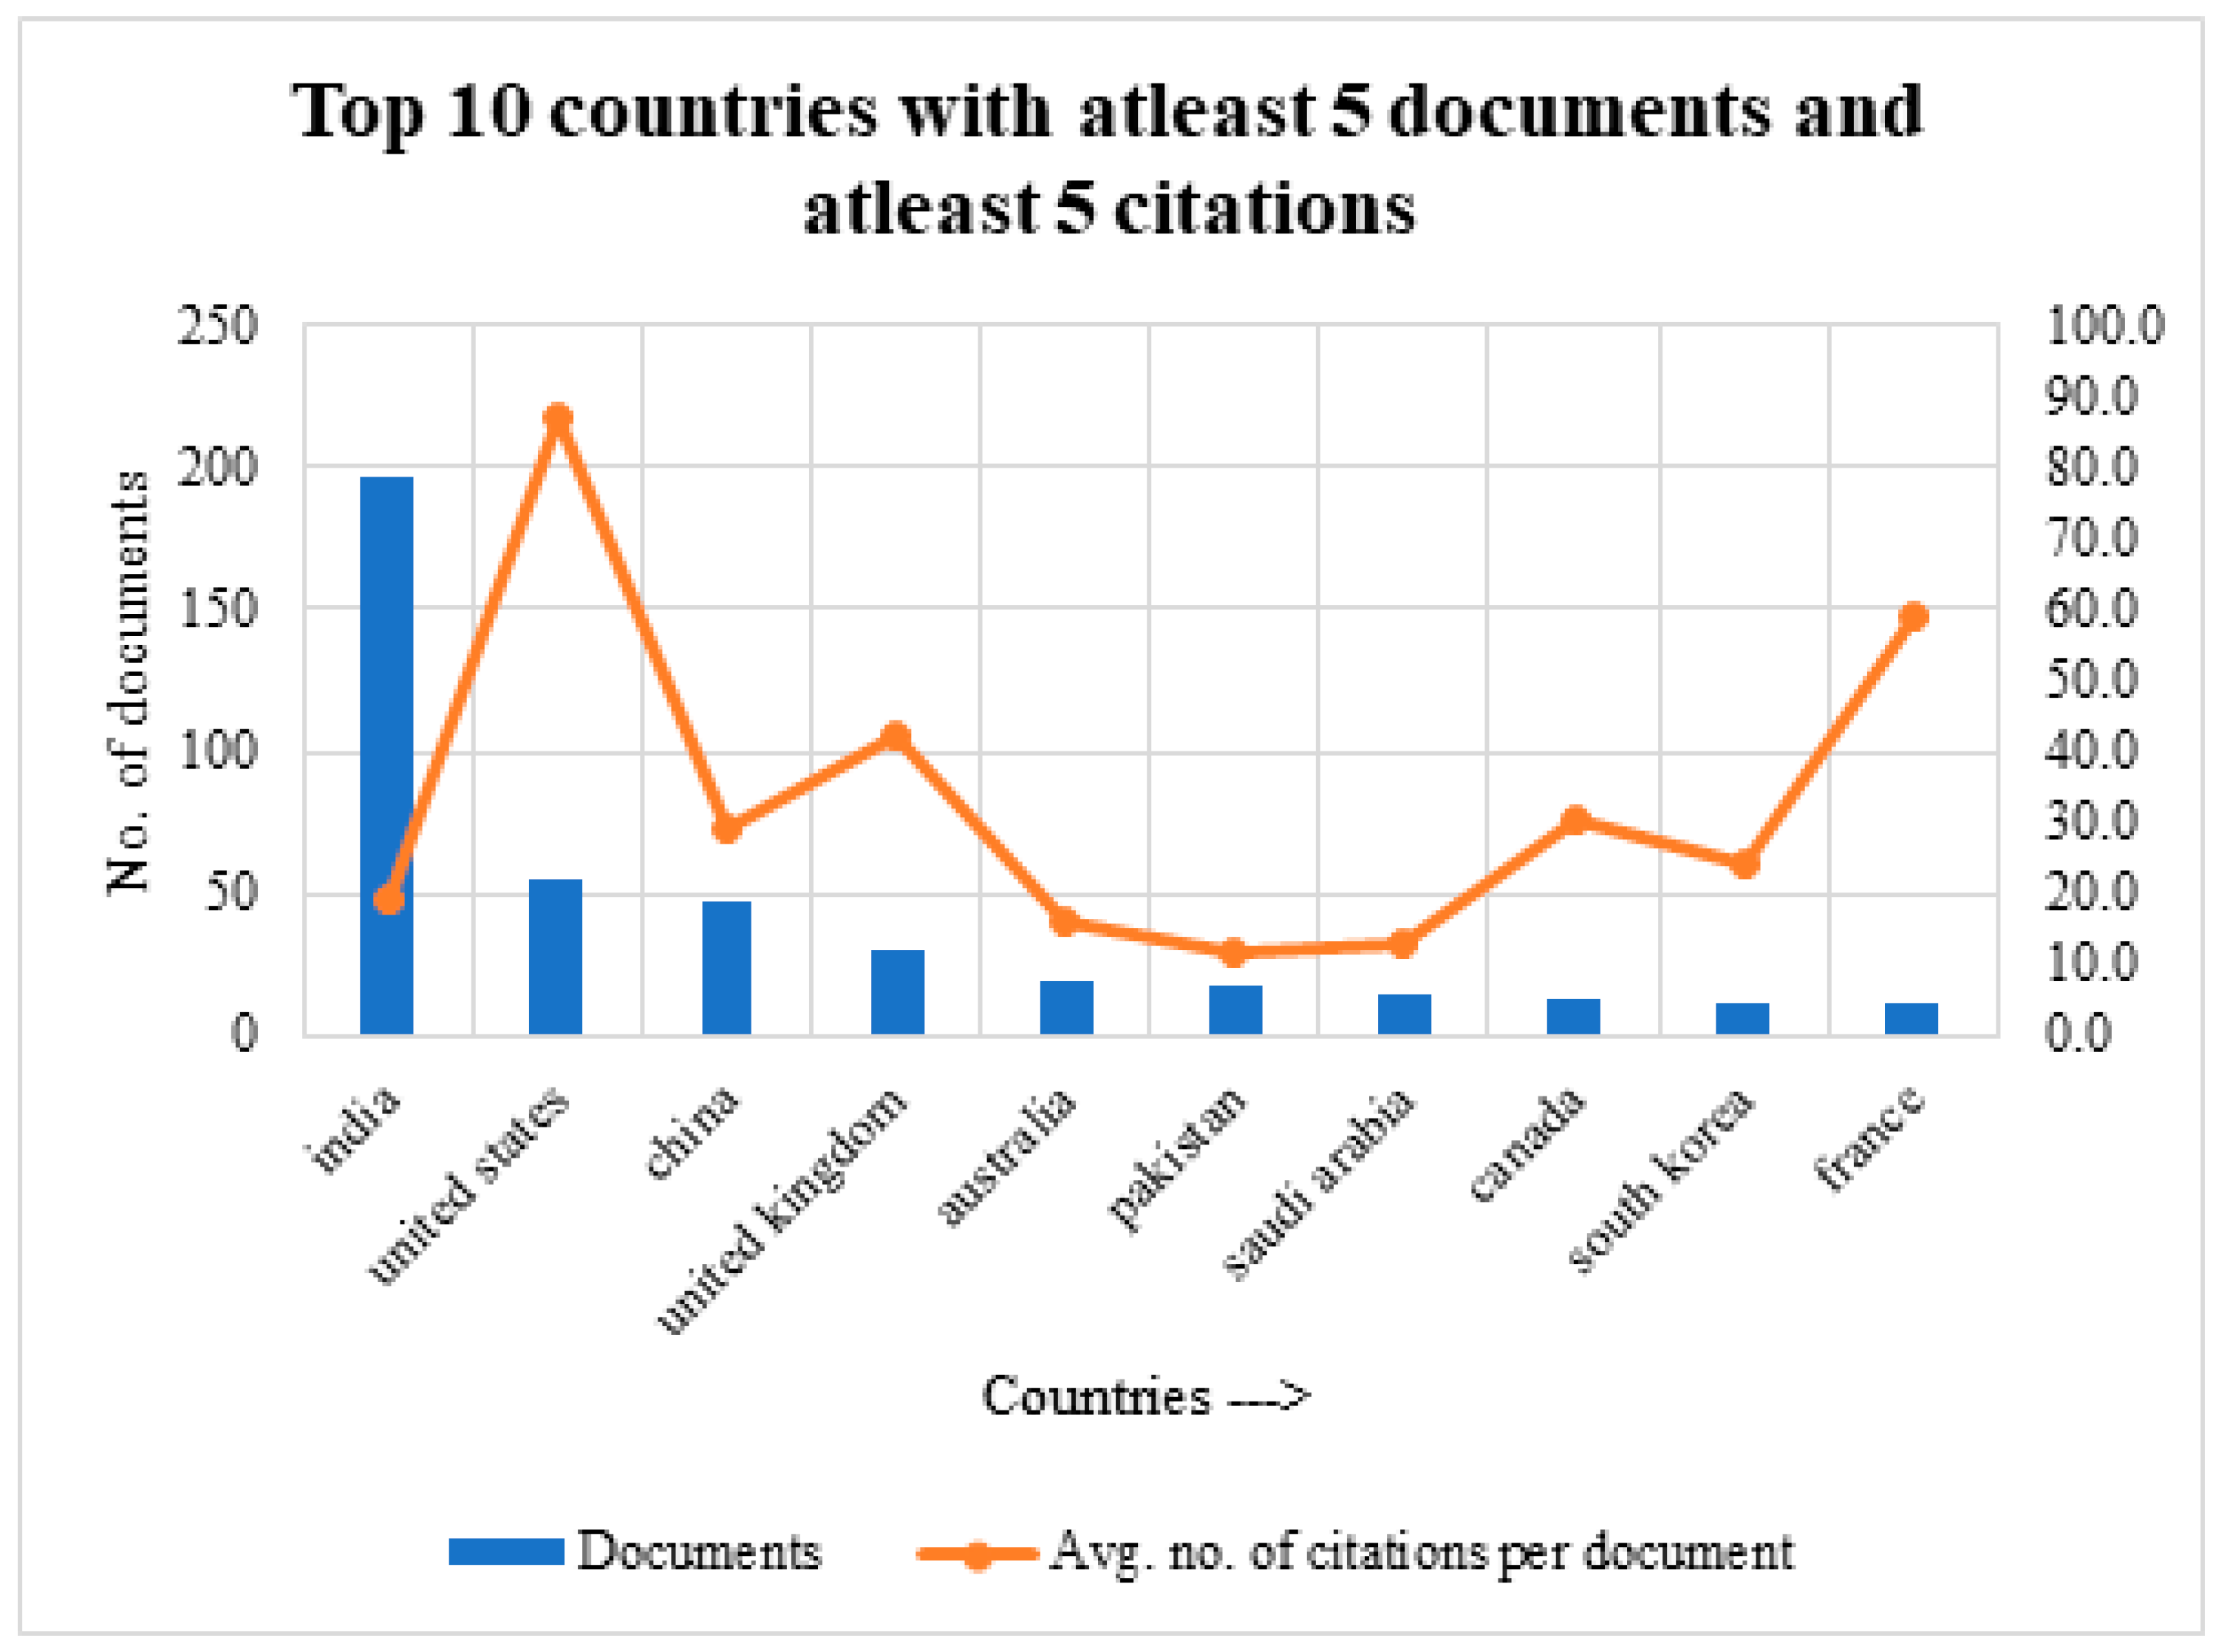
3.3. Country Analysis
The analysis shows that 24 out of 57 countries published at least five documents with at least five citations. The following graph (
Figure 10) shows the top 10 countries with at least five papers and at least five citations. From the analysis (
Table 2), it is clear that the United States published fewer documents than India, but the average number of citations received was higher.
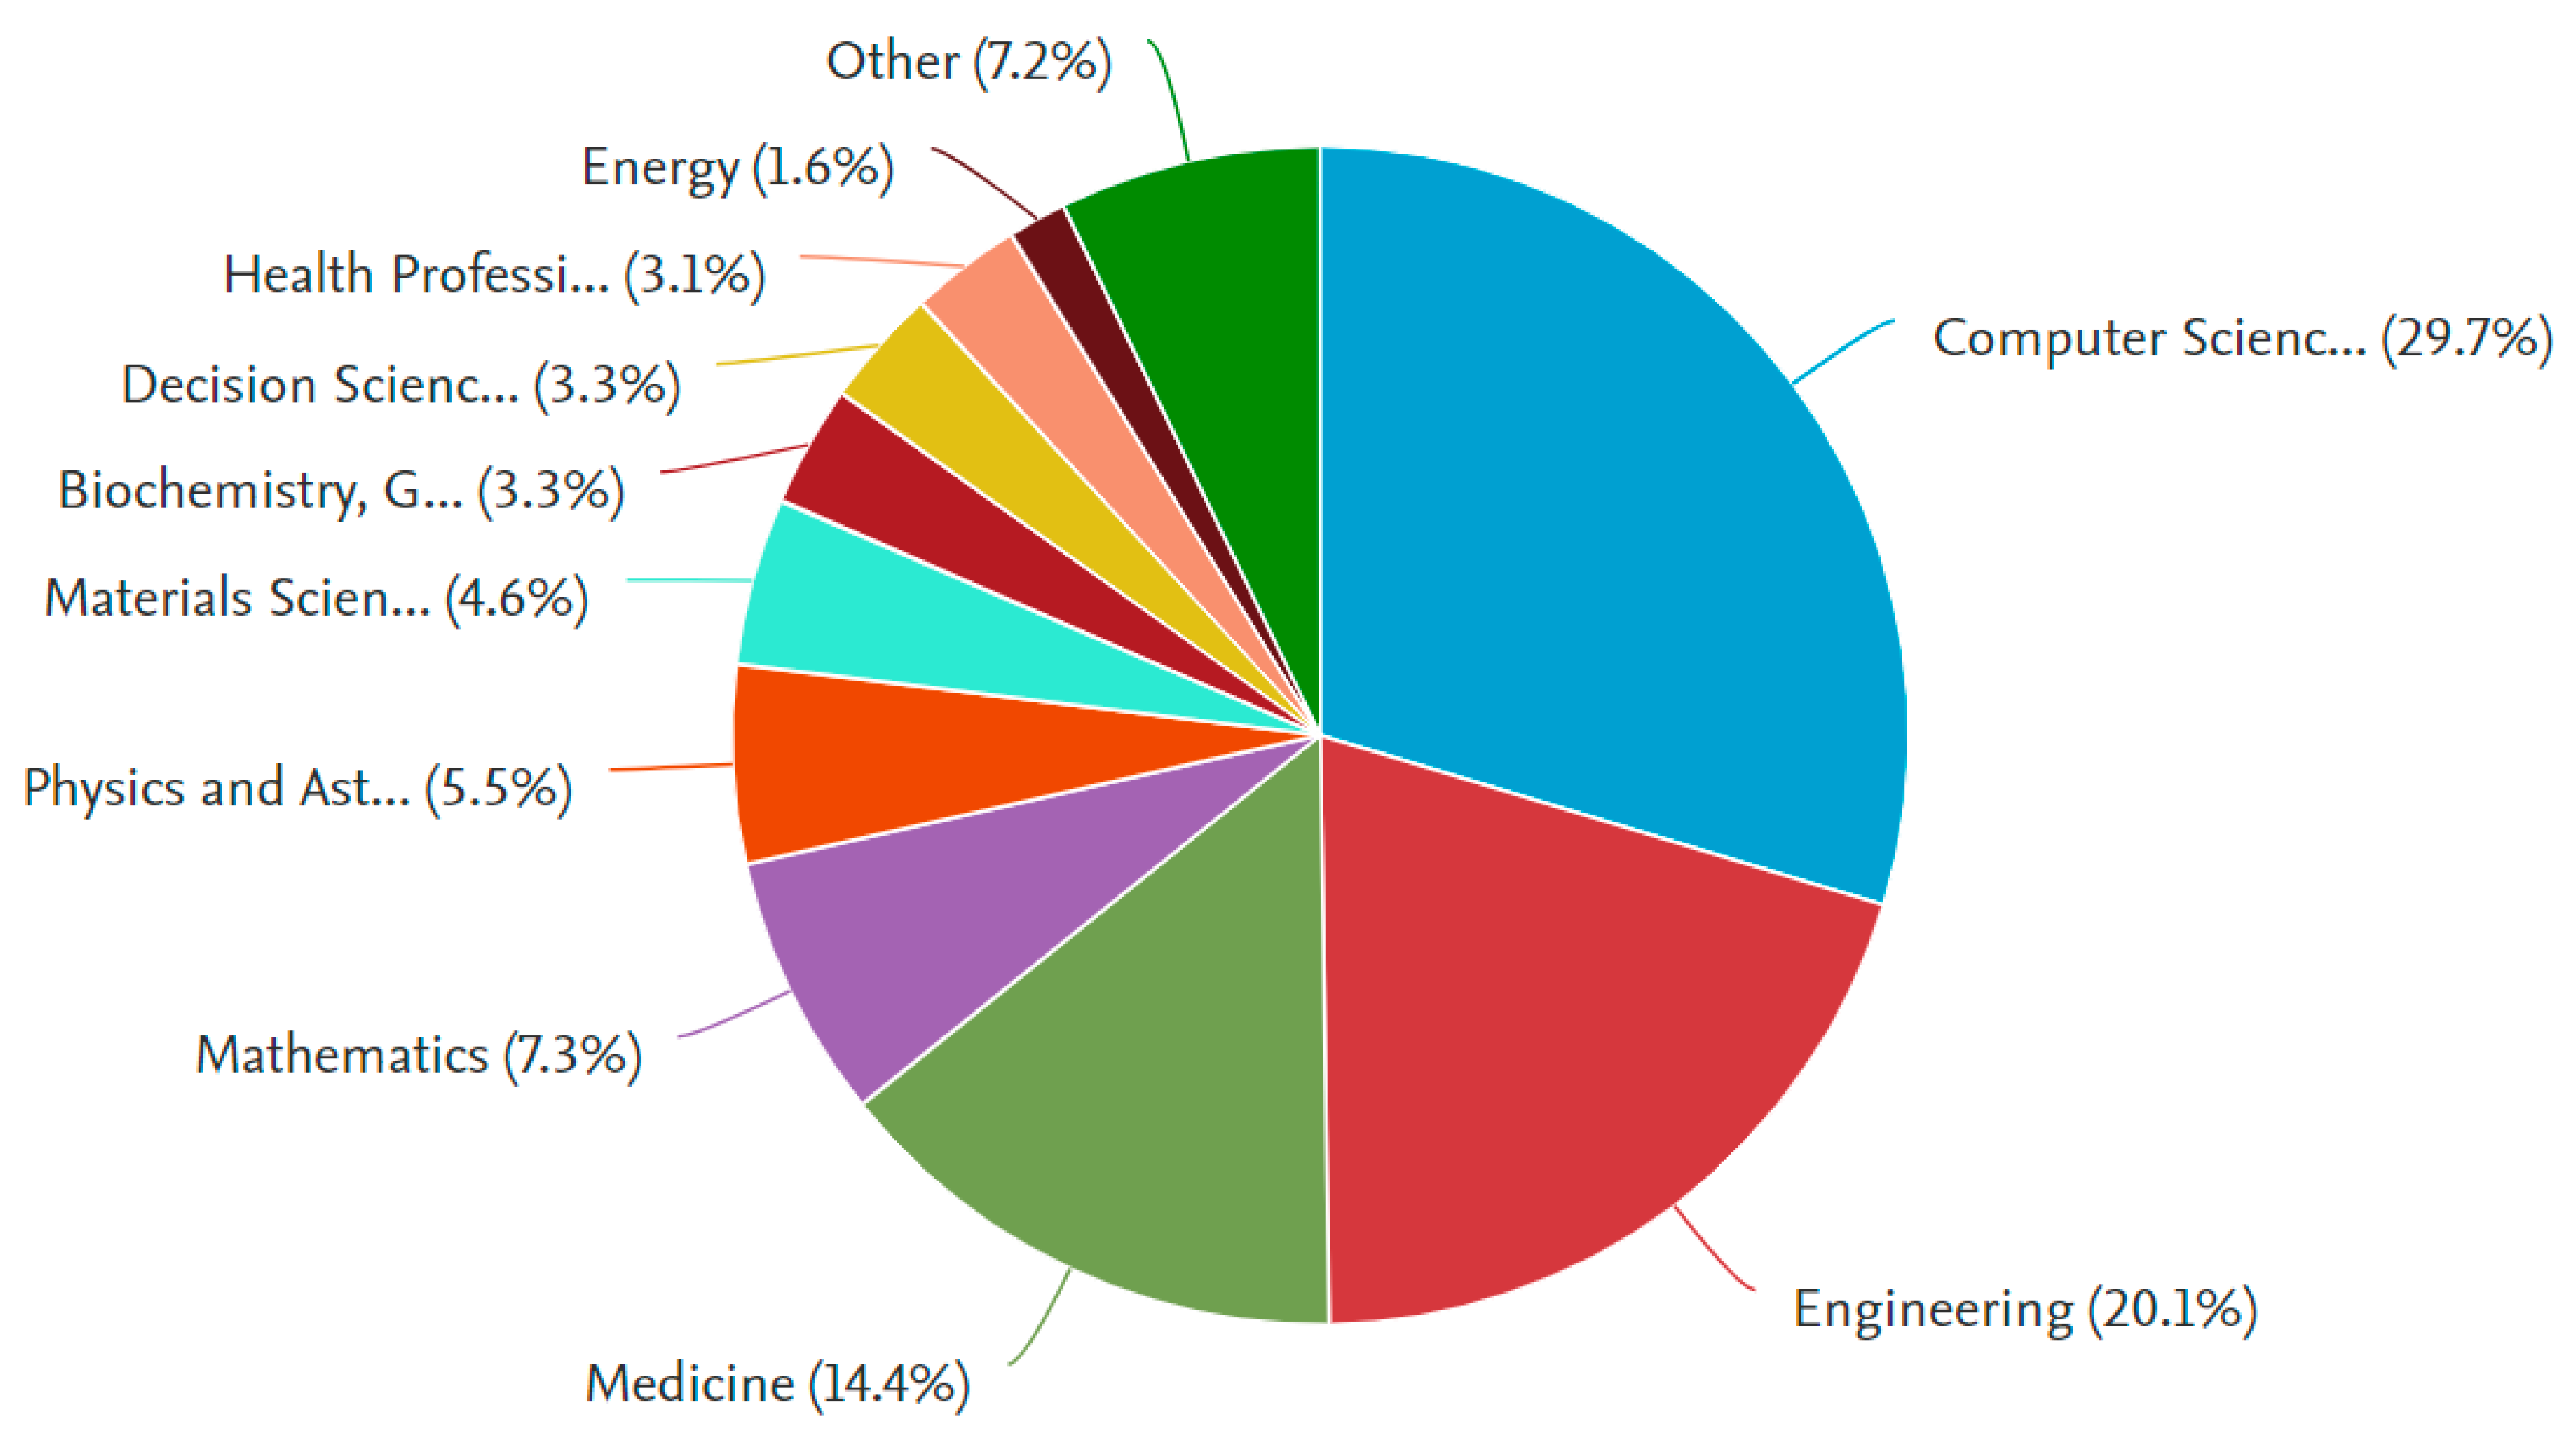
3.4. Subject Area Analysis
The highest proportion of the work was done in the computer science field at 29.7% and in the engineering domain at 20.1% (
Figure 11). Of course, people in the medical area were also working to find a solution for automated diagnosis.
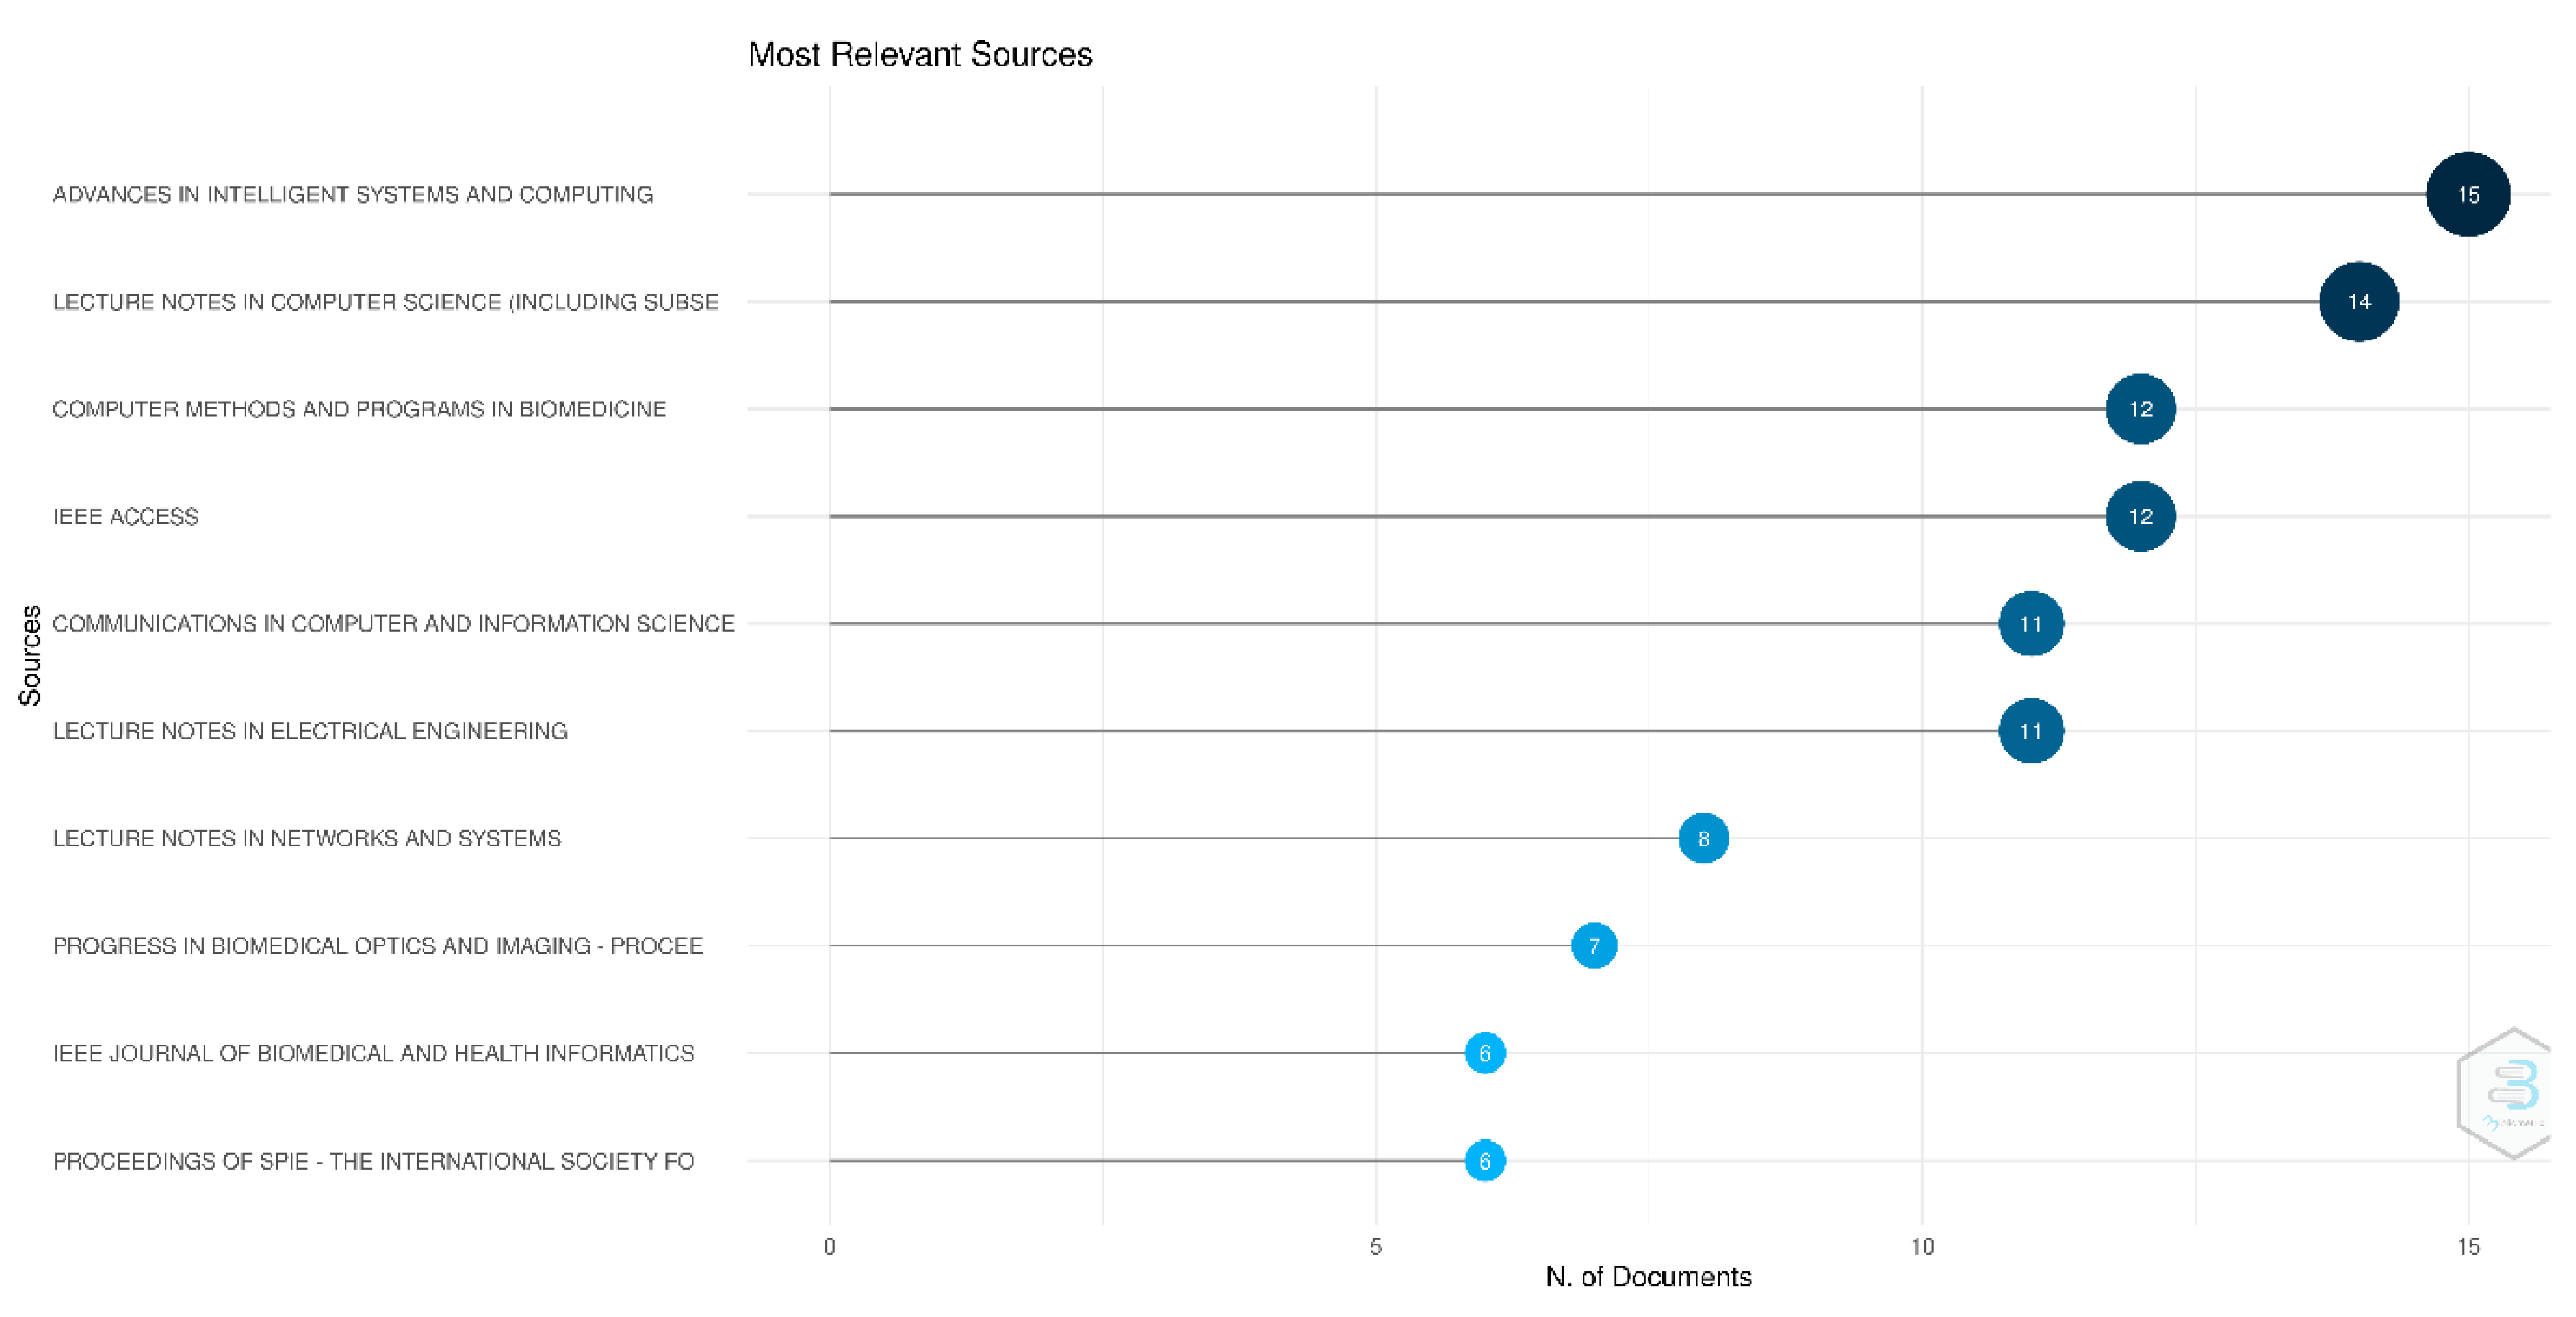
3.5. Sources Analysis
Out of 271 sources, the top 10 sources (
Figure 12) were identified in this research field, which will cast some light and provide the right direction for future research.
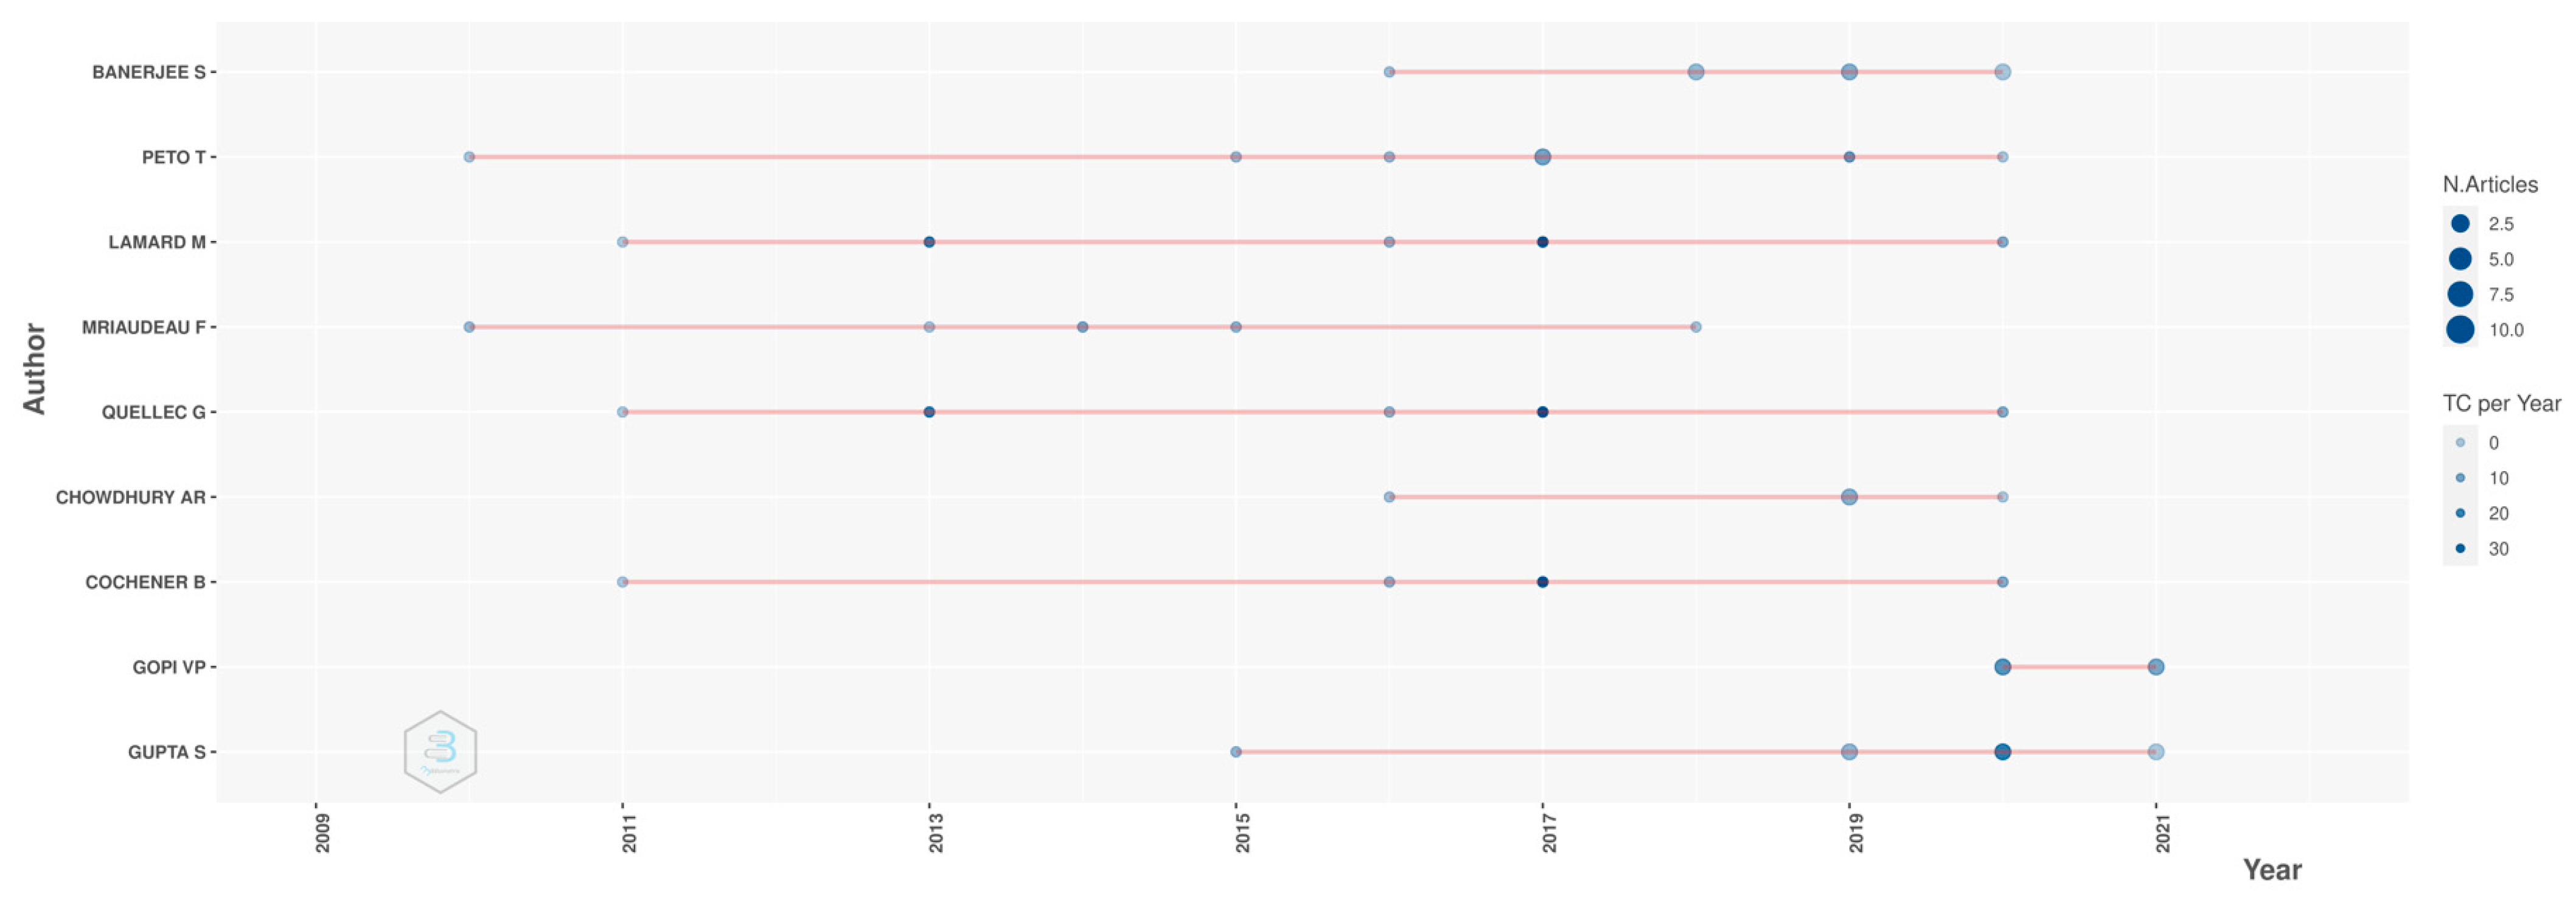
3.6. Top Authors’ Production over Time
The papers produced by the top 10 authors were analyzed over time (
Figure 13). S. Banerjee [
10] started working in this area in 2016 with one paper with total citations per year of 2.29. T. Peto [
11] and M. Lamard [
12] started their research around 2010, working till 2021 with five and seven articles, respectively. The top authors’ production over time in terms of the no. of papers and total citations per year was plotted (
Figure 13) and listed in tabular form (
Table 3).
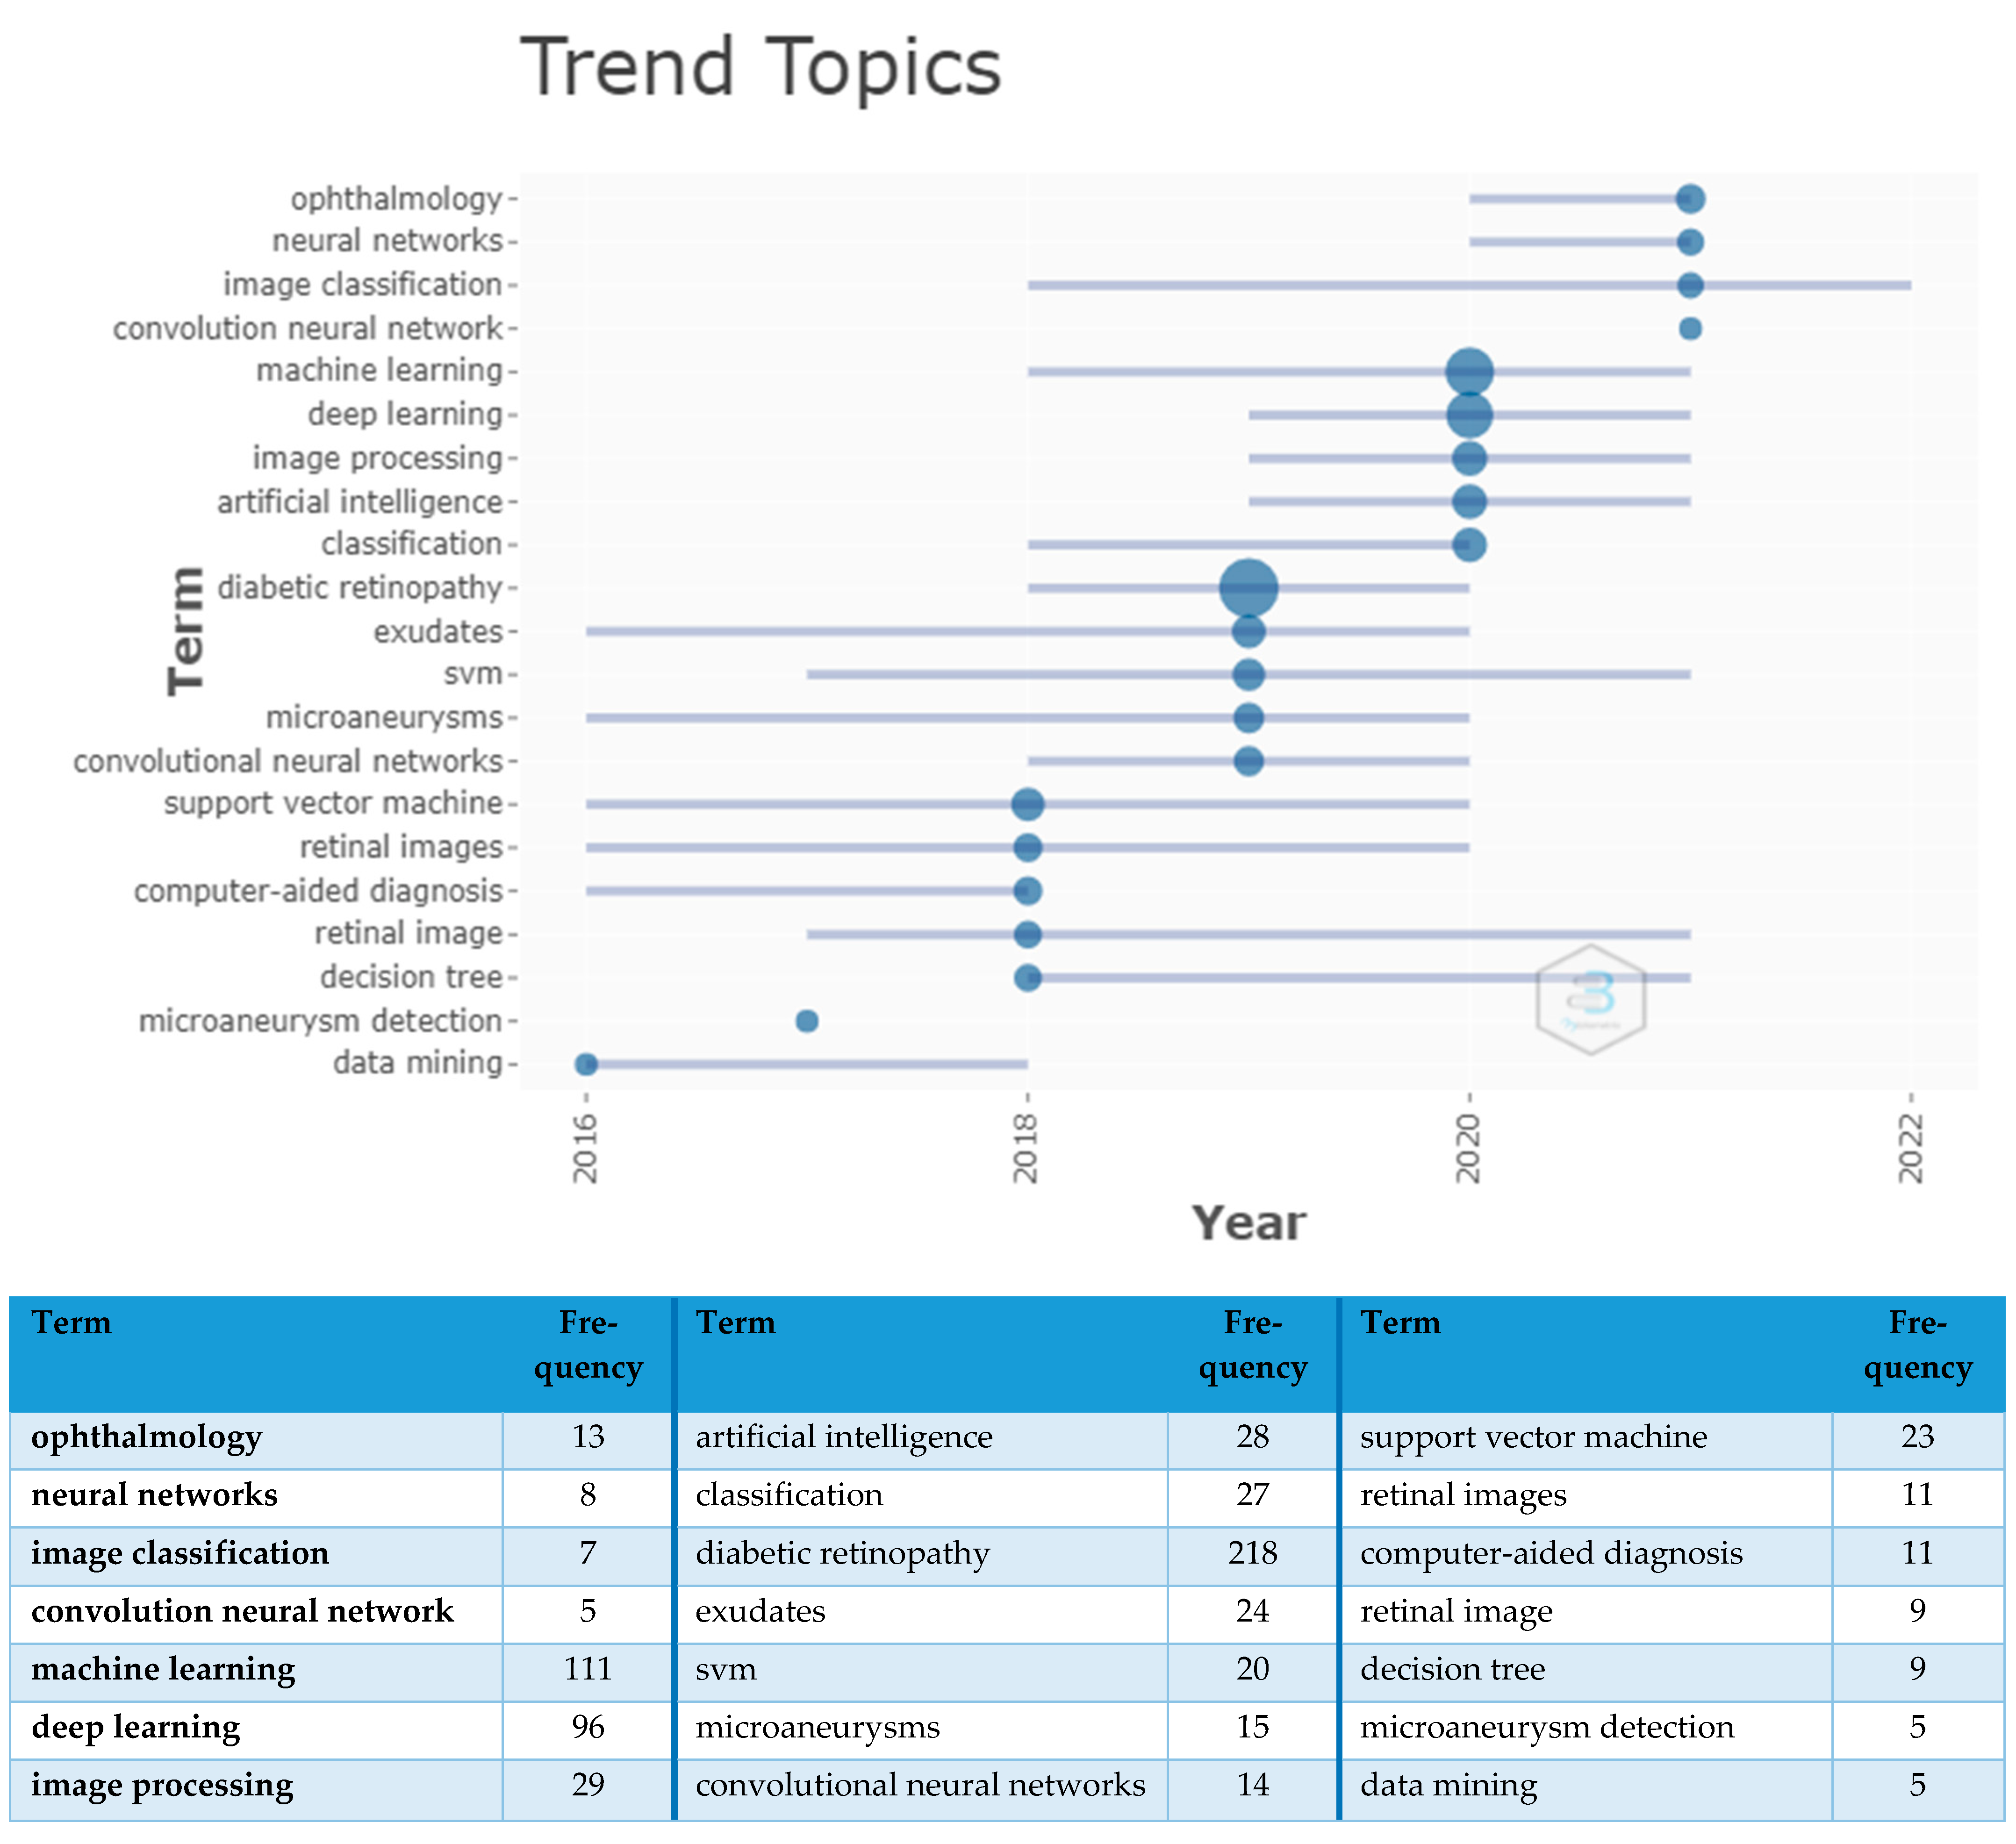
3.7. Trend Topic Analysis
We analyzed the authors’ keywords over the period (2010 to 2021) and identified the trend of the keywords used. Terms such as exudates, microaneurysm, SVM, and computer-aided diagnosis appeared in 2016. These terms indicated that SVM classifiers were used to detect exudates and microaneurysms in most of the papers. Similarly, we found that decision trees were used in addition to SVM in 2018. More emphasis was given to the keyword diabetic retinopathy. Later, in the year 2020, machine learning and deep learning became the trend (
Figure 14) to be used.
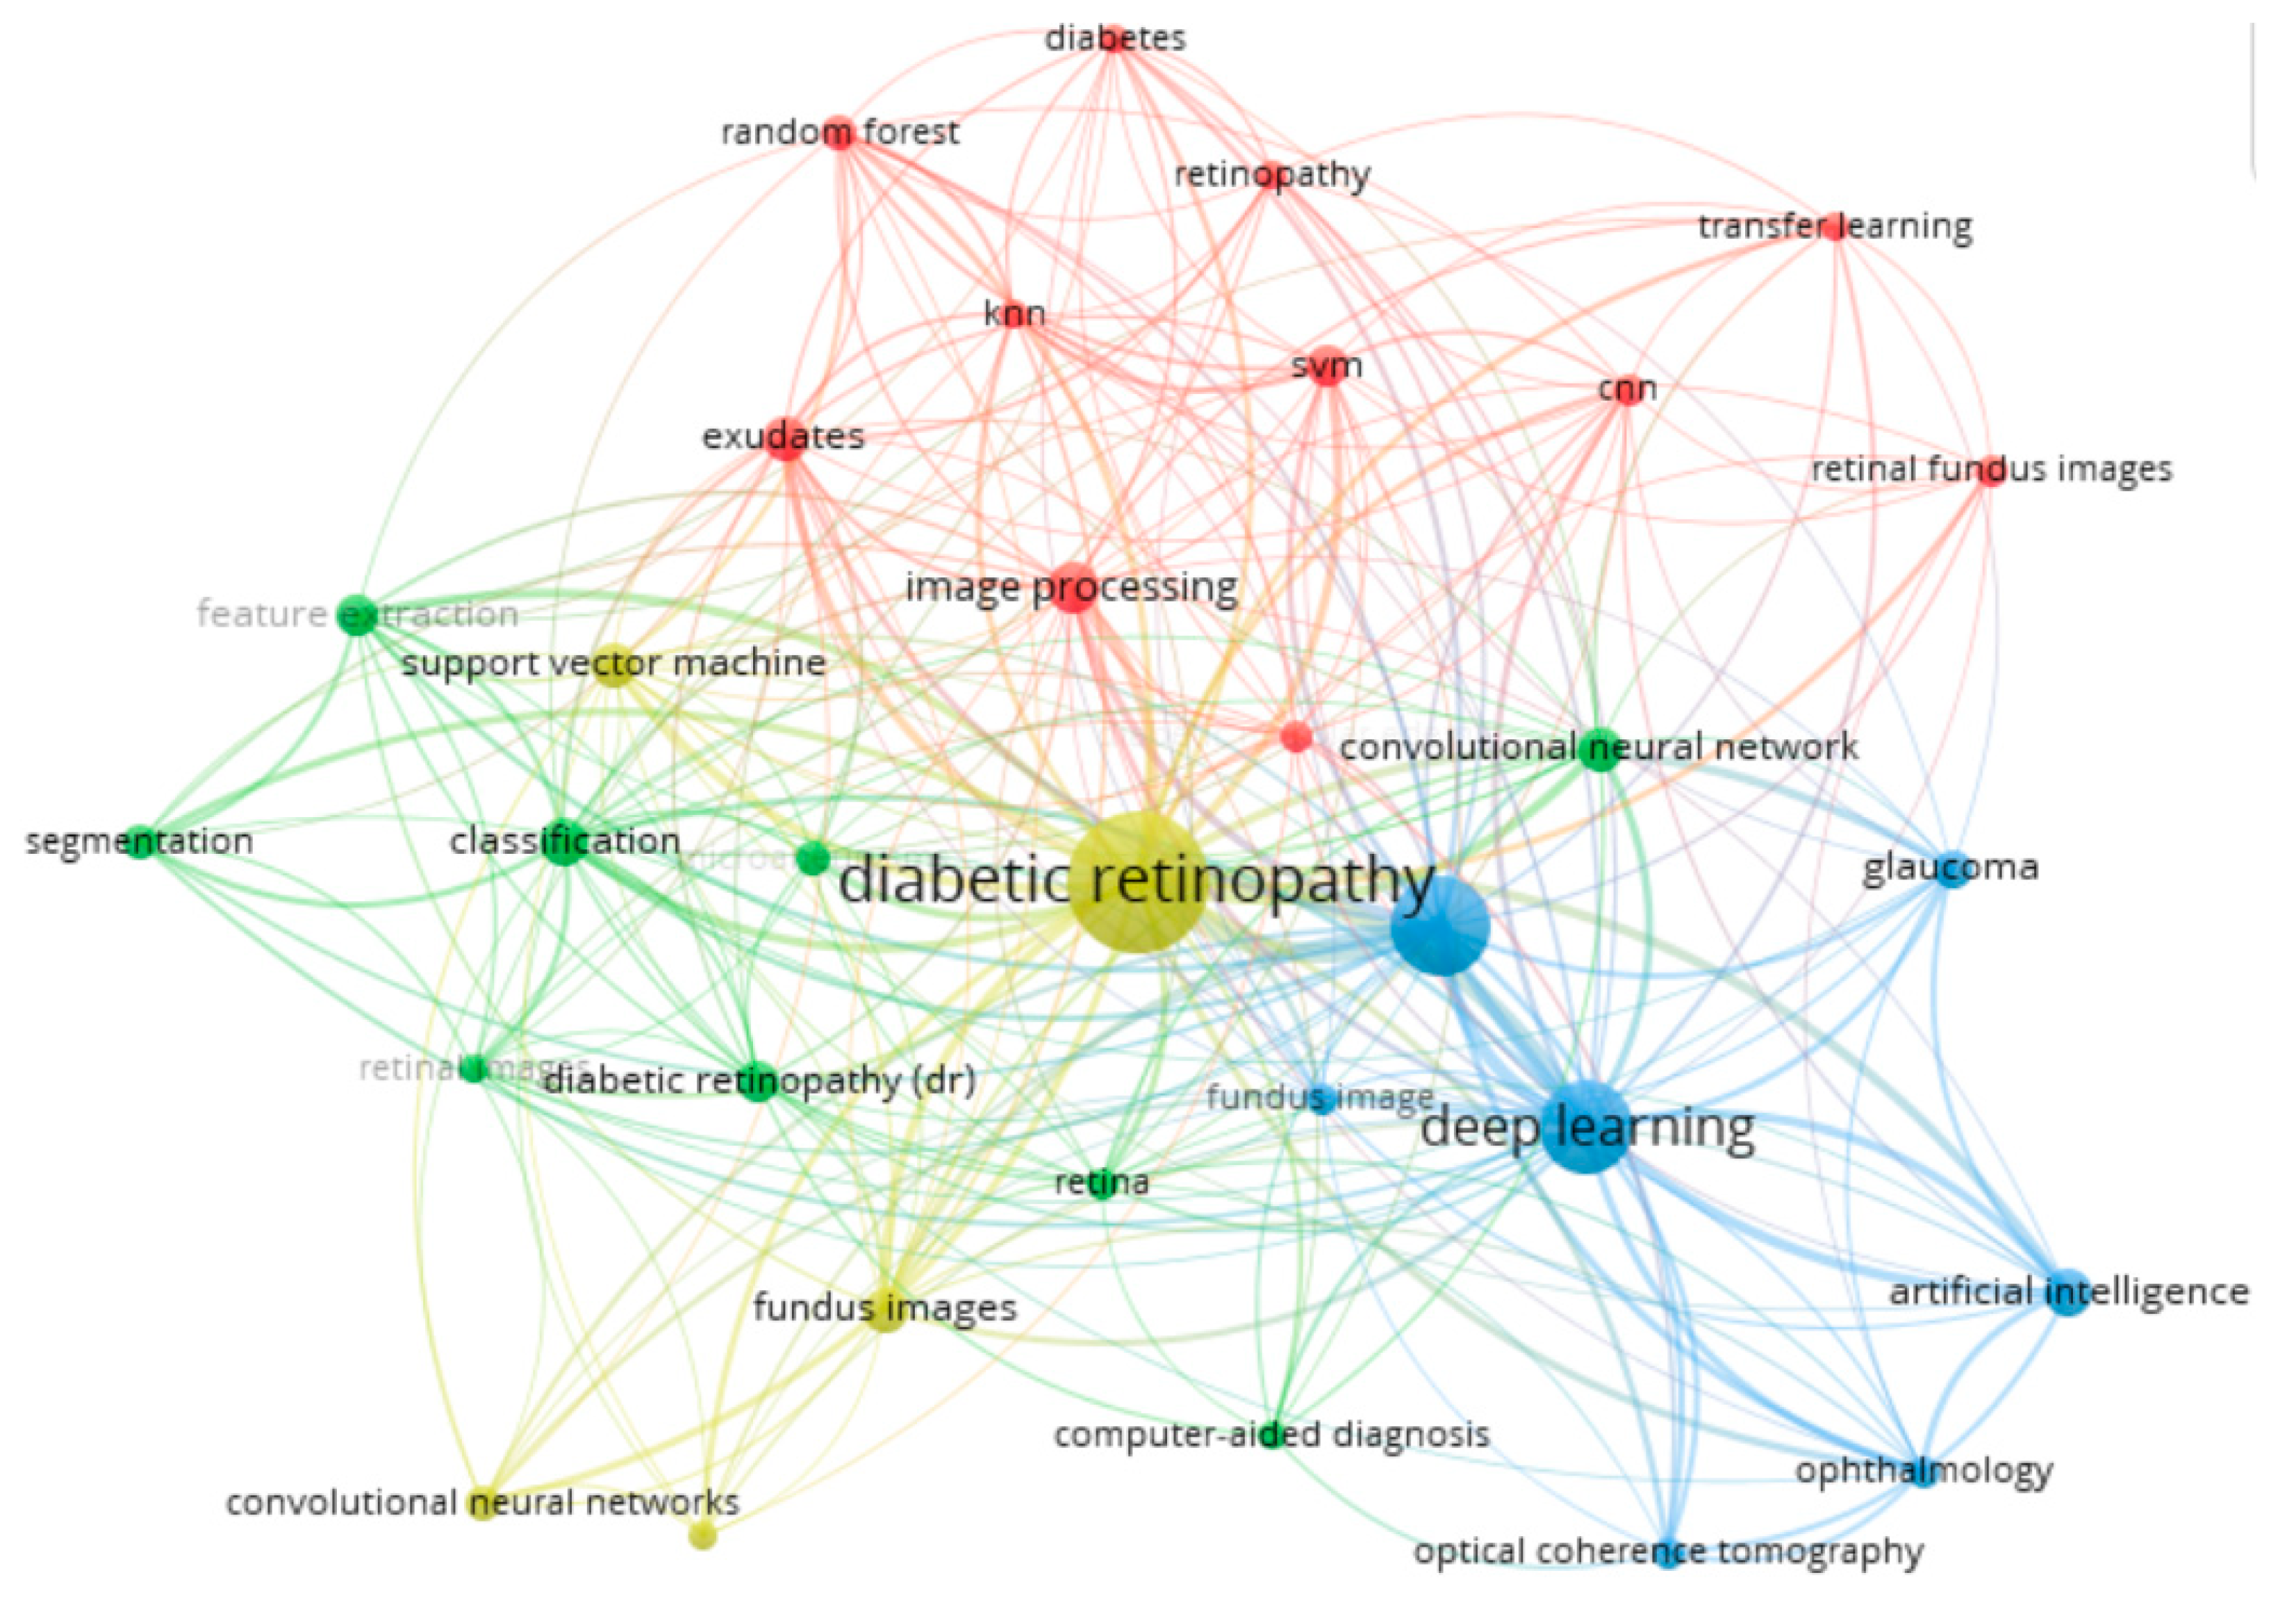
3.8. Author Keyword Co-Occurrence Analysis
The analysis was carried out on keywords with at least ten occurrences (
Figure 15). The authors defined 831 keywords, of which 32 met the threshold of 30 occurrences. The keywords deep learning occurred 95 times with 207 total link strengths, followed by image processing, artificial intelligence, convolutional neural network, etc., with fewer times. Of course, the search keywords will occur the highest number of times. Four clusters were formed, with 11 items in cluster 1, 9 in cluster 2, 7 in cluster 3, and 5 in cluster 4, which are indicated by red, green, blue, and yellow regions in the figure, respectively.
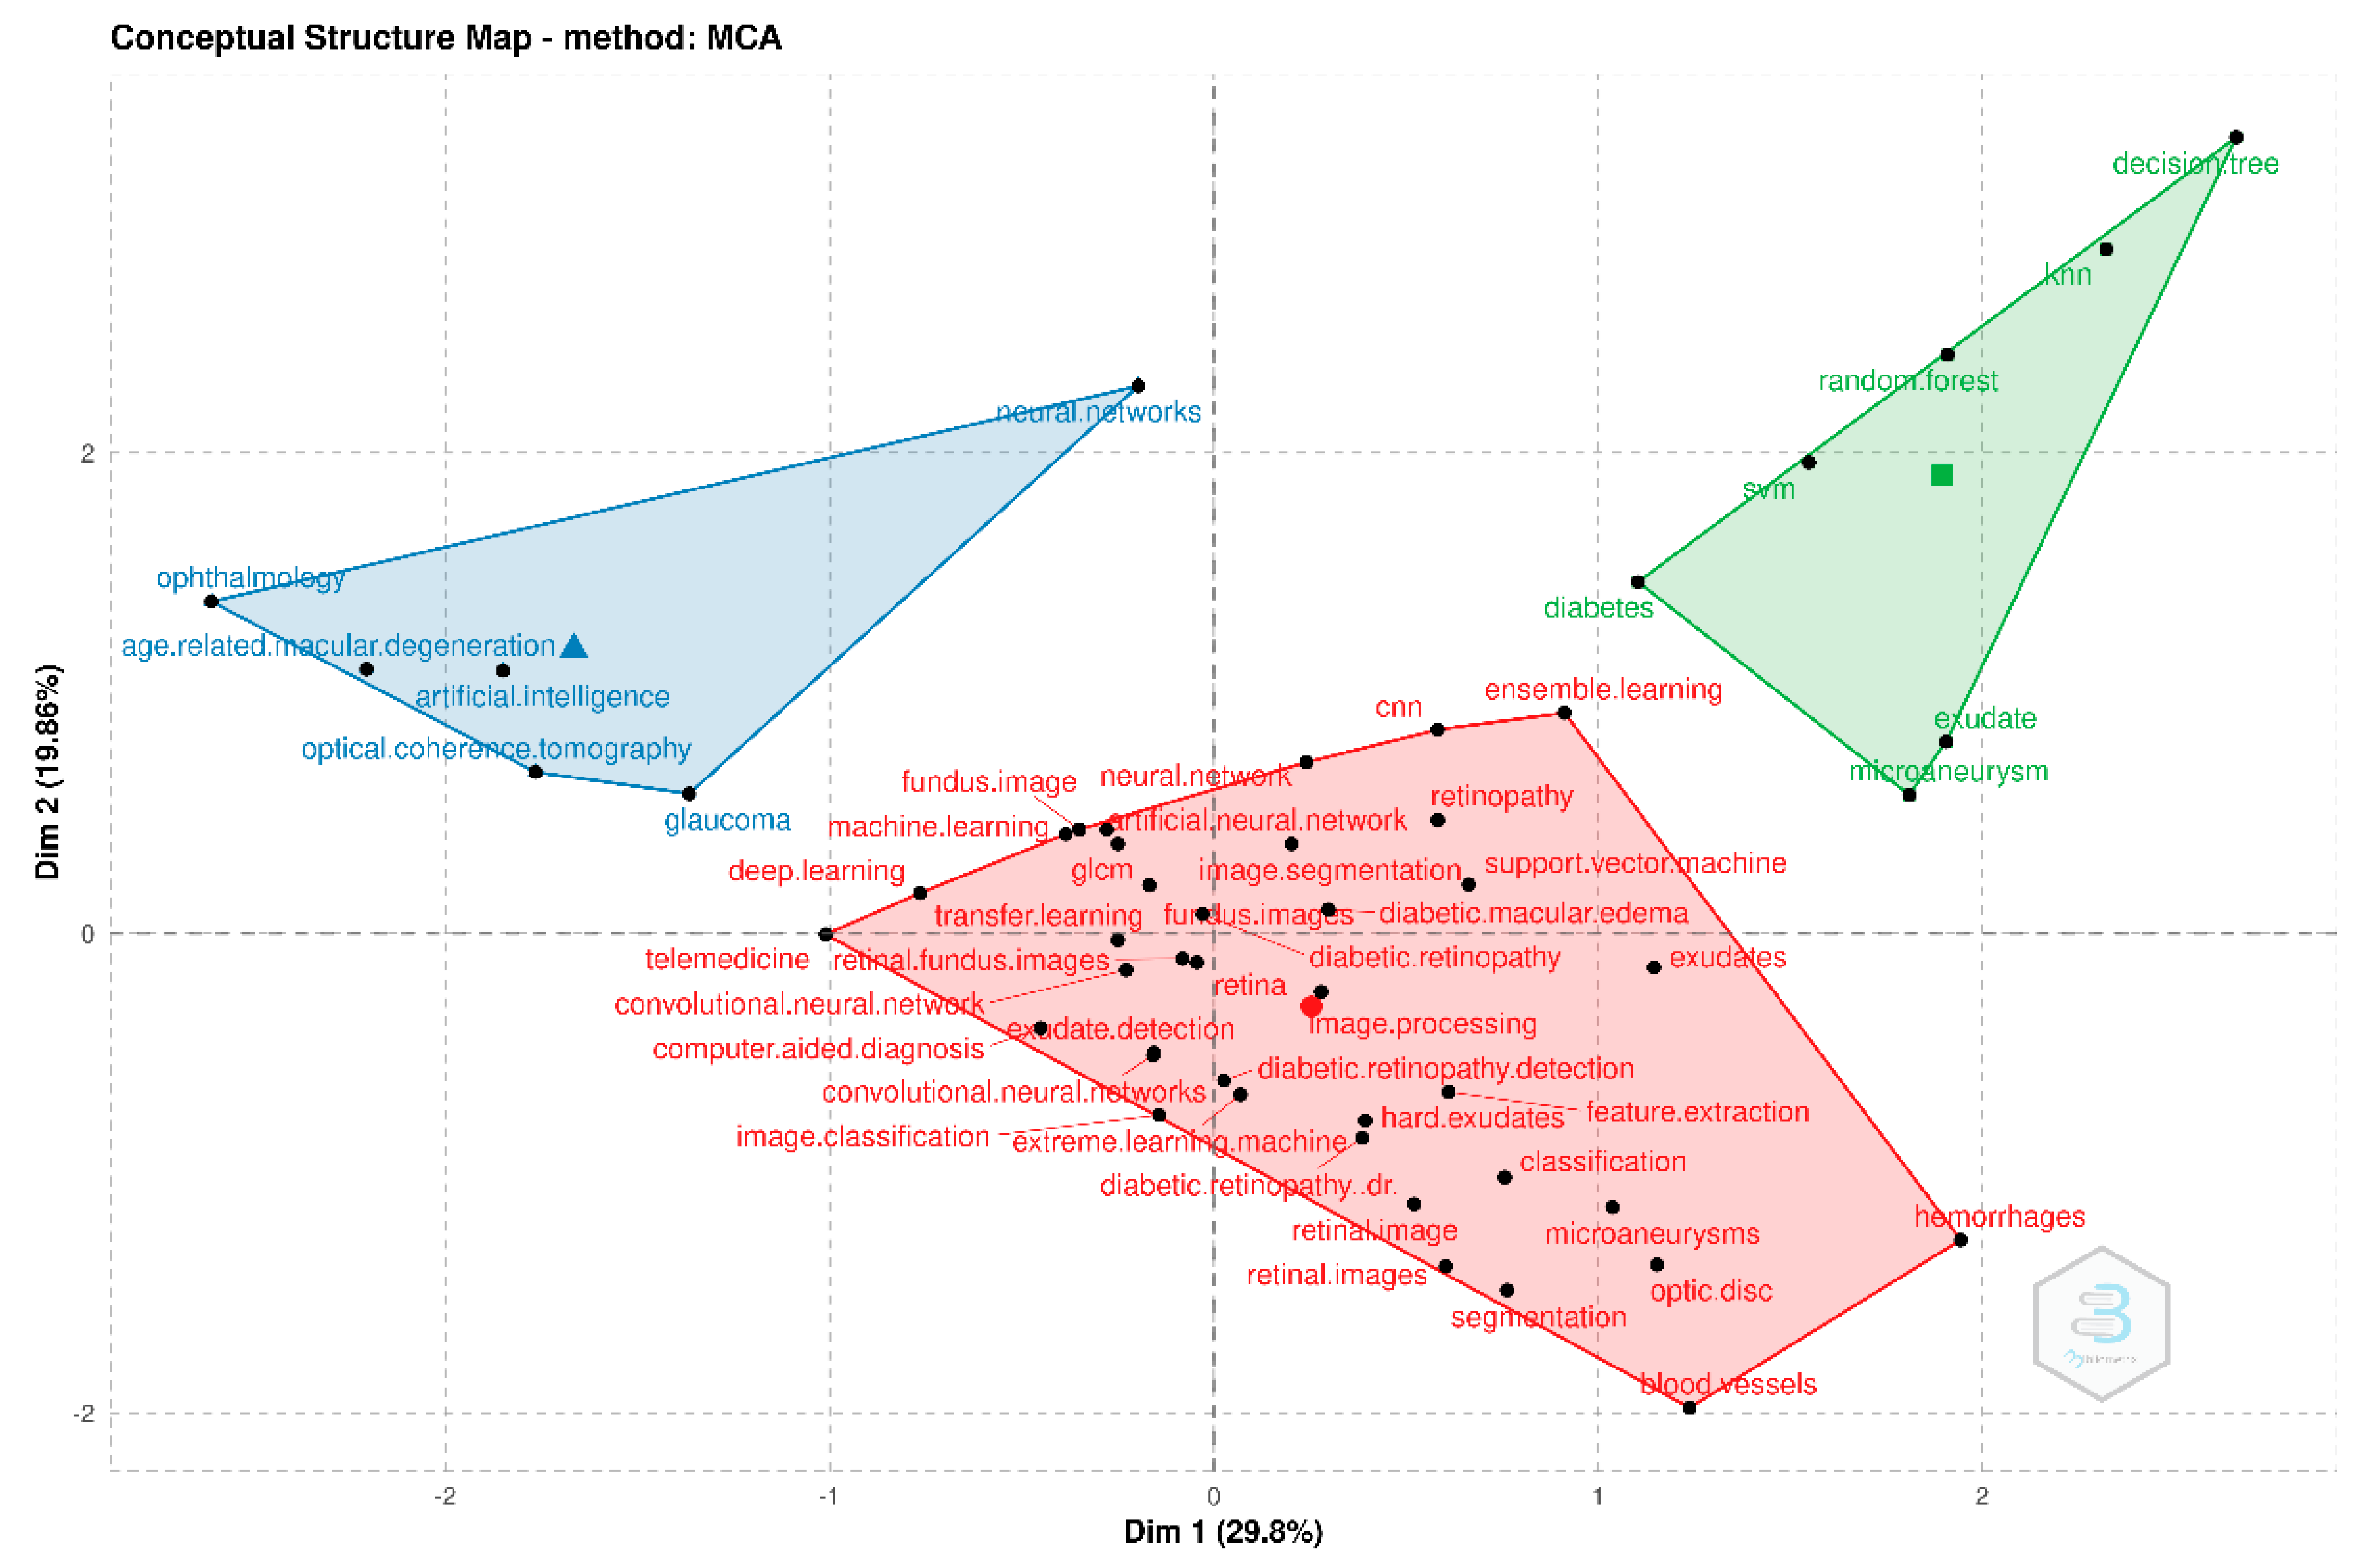
3.9. Conceptual Structure Map
The conceptual structure map was obtained from Biblioshiny using the multiple component analysis (MCA) method. This method is commonly used to analyze categorical data, which seeks to narrow down a vast number of variables into smaller sets of components that sum up the information in the data [
13]. The conceptual structure is shown in
Figure 16. It was found that exudate and microaneurysm lesions were detected by using SVM, random forest, kNN, and decision tree machine learning algorithms, which formed a single cluster. Author keywords such as ophthalmology, age-related macular degeneration, and optical coherence tomography were most frequently used, along with artificial intelligence, creating a second cluster. The maximum number of author keywords belonged to the third cluster, which included retinal landmarks (optic disc), lesions (hemorrhages, hard exudates), and fundus images. Moreover, most papers used the terms segmentation and machine learning techniques such as SVM, kNN, and advanced techniques such as deep learning, extreme learning machine, and transfer learning. The segmentation was generally used to locate retinal landmarks, lesions, etc., and machine learning techniques for classification.
3.10. Thematic Evolution Analysis
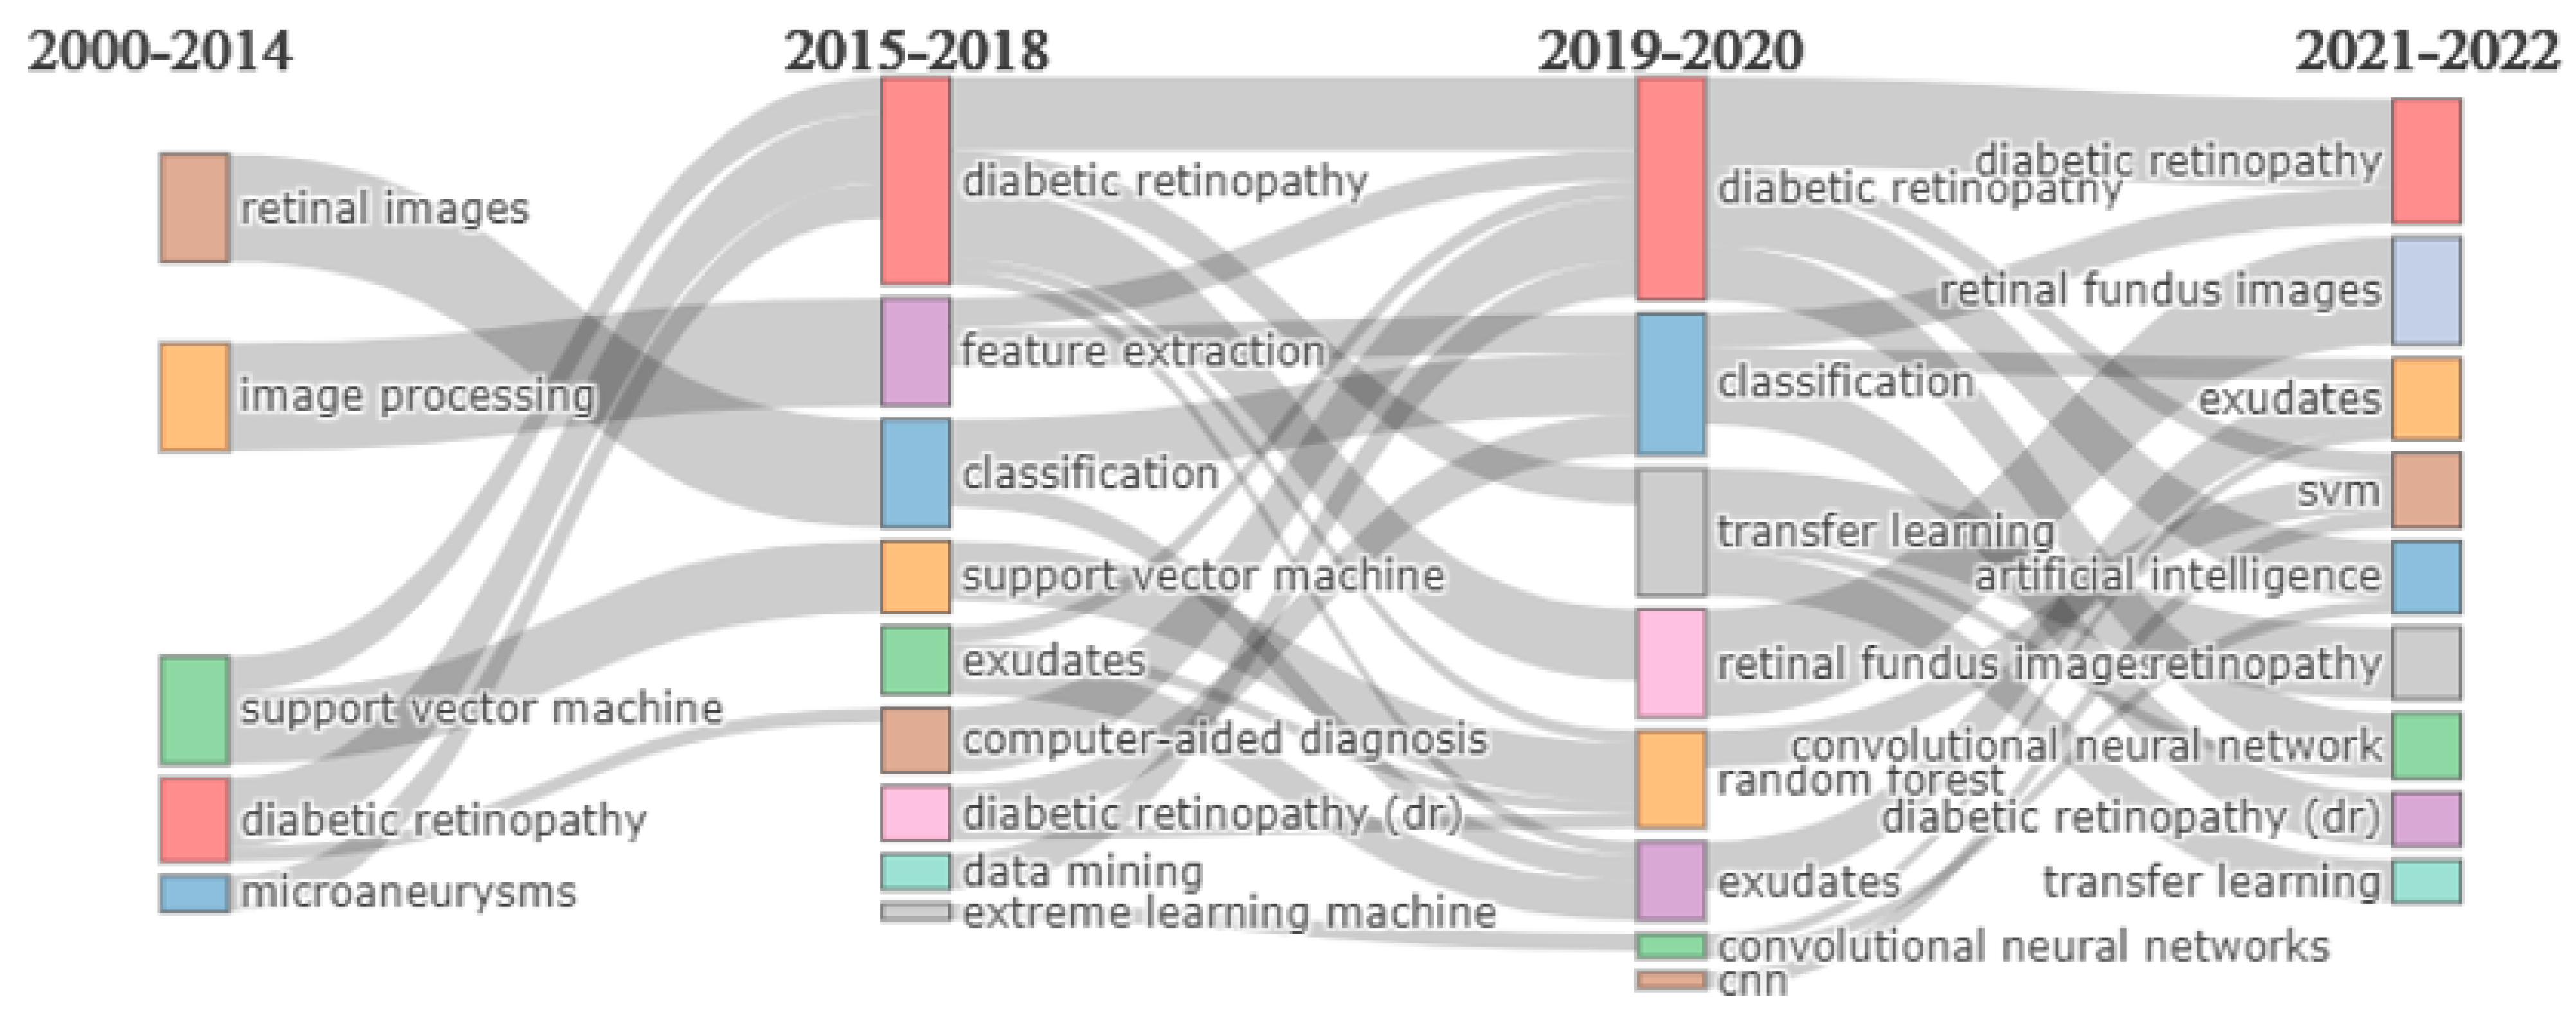
The evolution of academic publications was identified from the relationships between the keywords used in various papers over time. Here, the analysis was done in four time slices: 2000−2014, 2015−2018, 2019−2021, and 2021−2022.
These four time slices (
Figure 17) were selected based on trial and error to find the trend topics. In the first time slice, most of the research was carried out on microaneurysm detection and DR classification based on traditional image processing techniques and the SVM classifier. More concentration was given to feature extraction to improve the model (SVM, CAD, ELM) performance in the second time slice. During the same period, the work slowly moved toward exudate detection, as it also forms the early sign of diabetic retinopathy. It was noticed that in the third time slice (2019−2020), people started working on random forests, convolutional neural networks, and transfer learning techniques for exudate detection. Methods such as SVM, CNN, transfer learning, and artificial intelligence were used in recent papers.
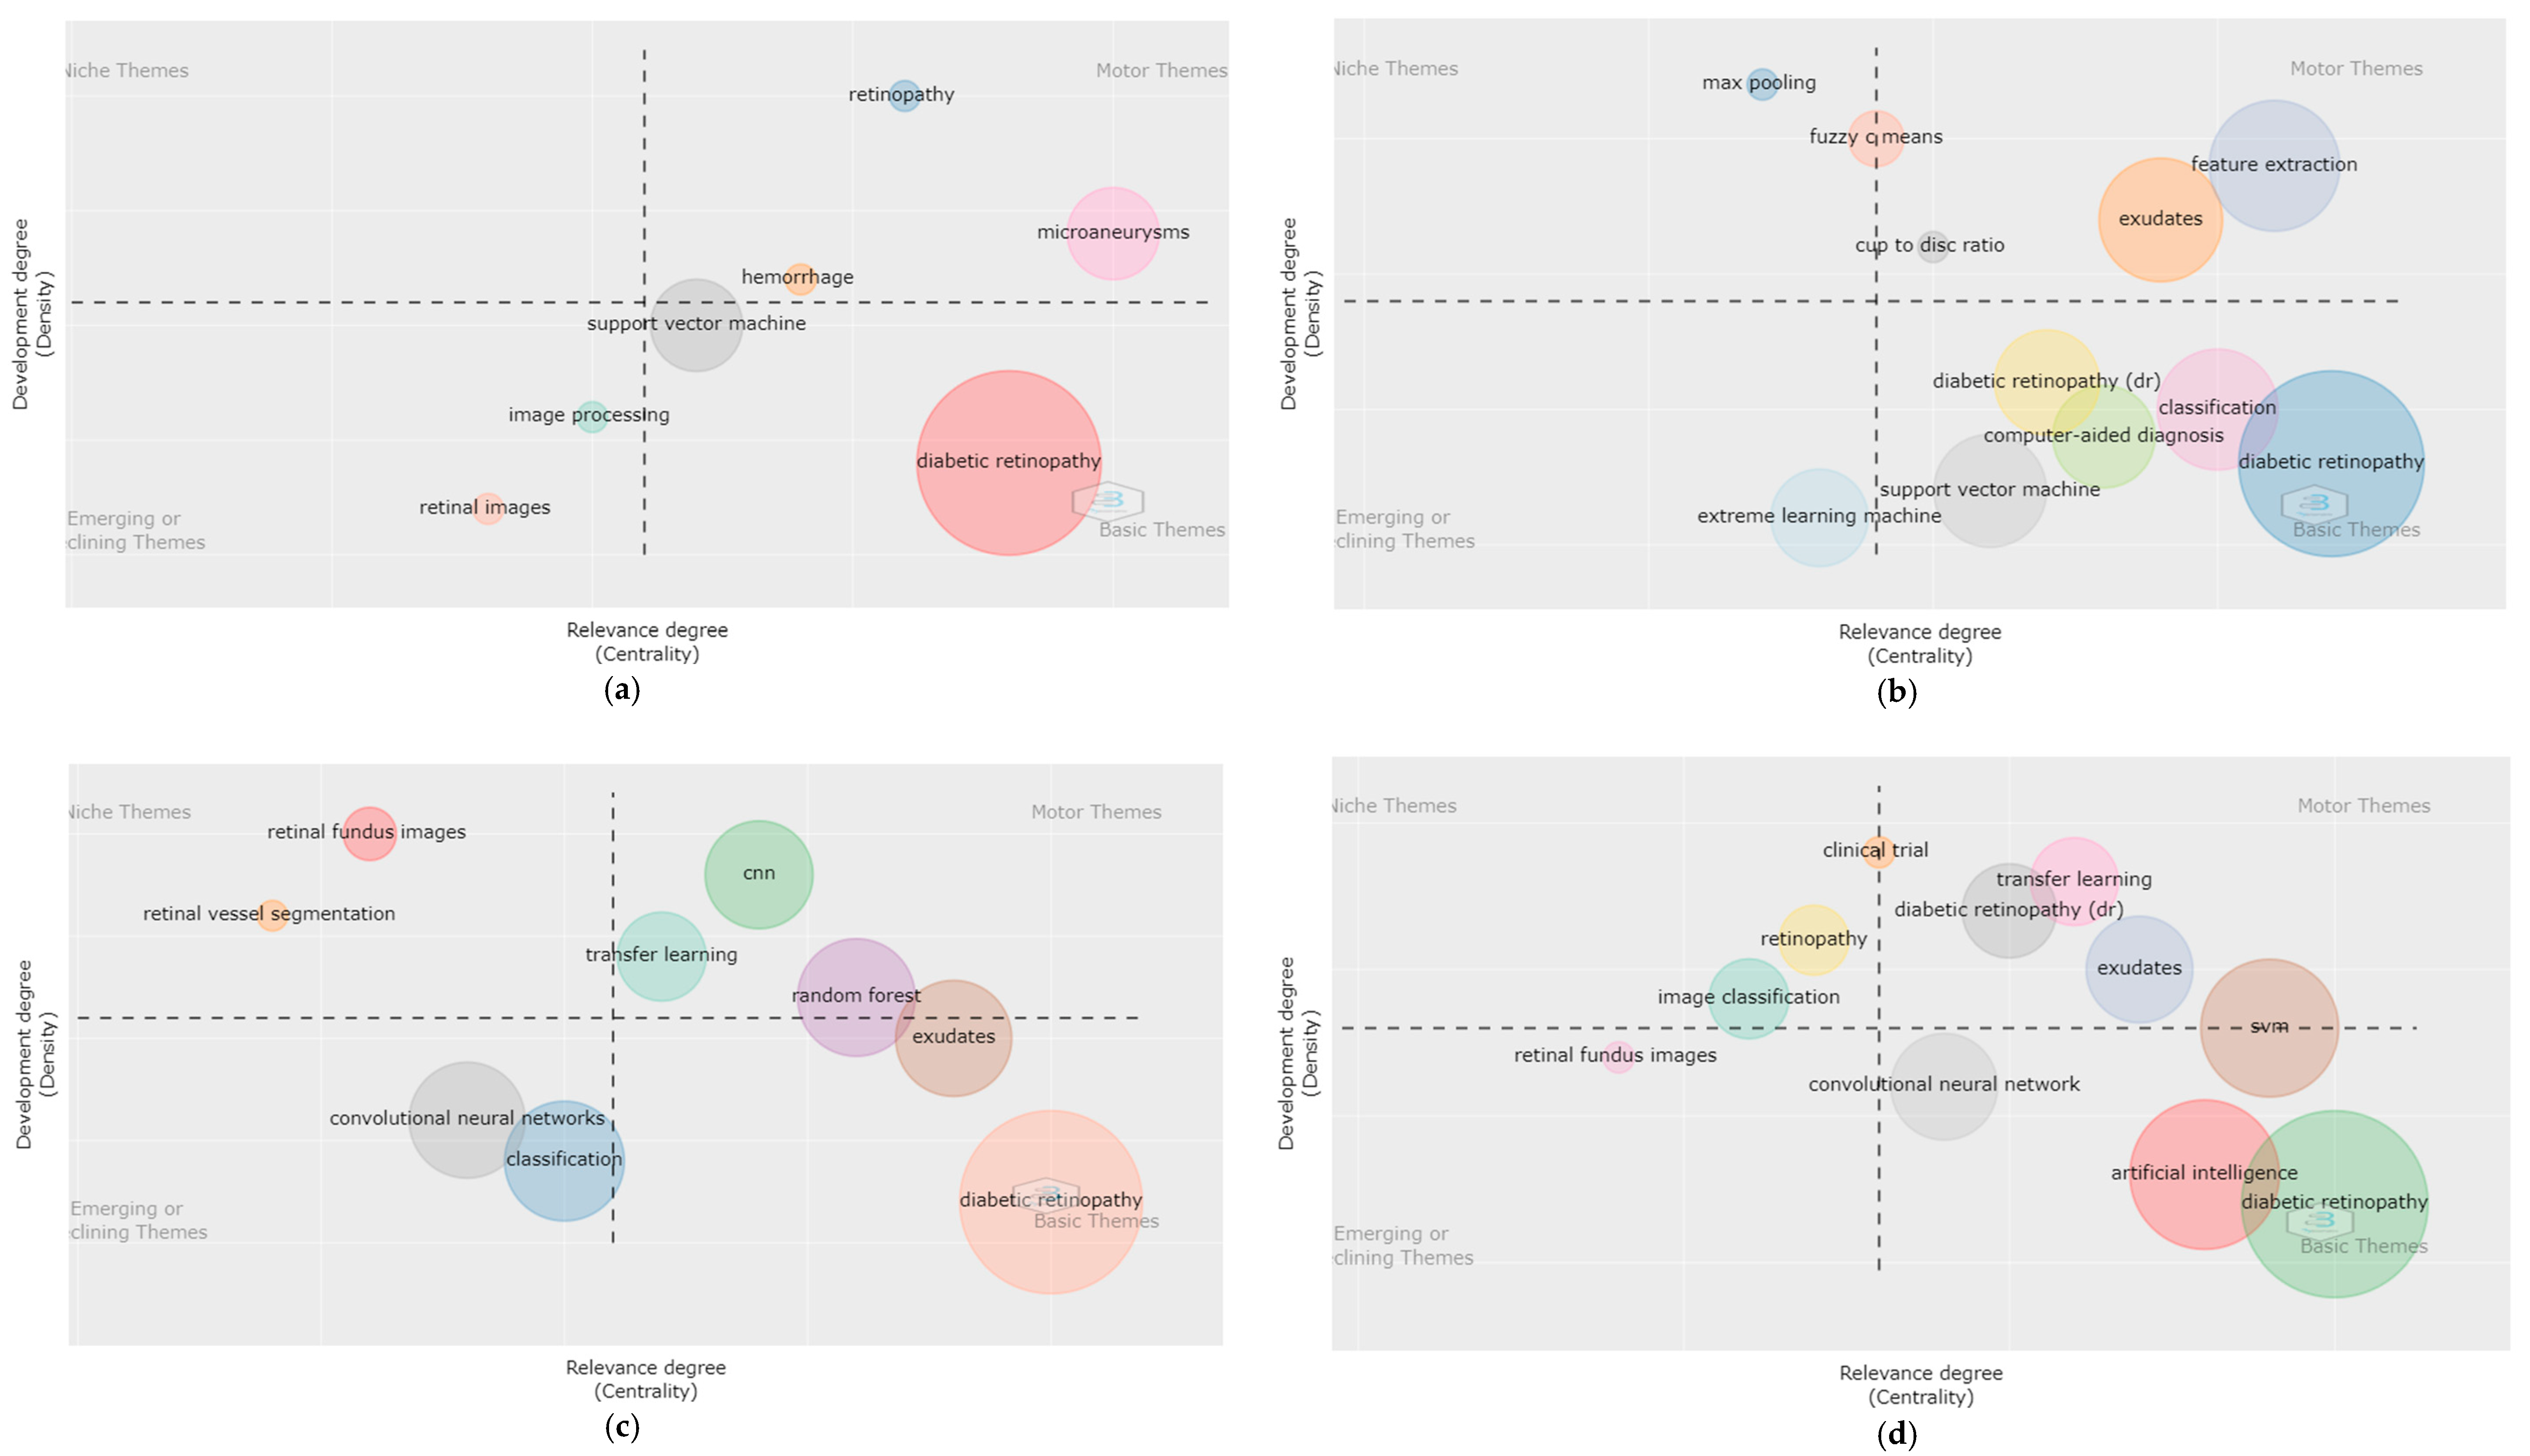
Figure 18 shows the thematic map for the above four time slices. It manifests the keywords for each time slice under different themes. The map consists of four themes: Niche, Motor, Emerging or declining, and Basic themes. The niche theme is a well-developed and isolated theme and thus lists the keywords less important for the field. The motor theme lists the keywords that are important in the organization of a research area. The emerging or declining theme list keywords that are minimally used. The basic theme list keywords that are widely used in several fields of study.
4. Qualitative Analysis
In total, 811 documents based on diabetic retinopathy detection were found. These results were further refined based on annual citation rates, ensuring the paper’s high quality.
Subjective analysis was done on these articles to pinpoint the different machine learning styles used in DR detection. This paper discusses the types of features used in detecting DR lesions that significantly impact the performance of detection and classification algorithms.
Most known approaches for detecting lesions rely solely on handcrafted features (HCFs), which cannot precisely characterize lesions. Therefore, new contextual and textural features, a combination of grey-level co-occurrence matrix with HCFs, and deep features with HCFs were used for efficient detection.
The lesion detection and classification can be done using different machine learning techniques. Various authors suggested different kinds of features in the literature. Handcrafted features such as conventional features [
14,
15], pixel-wise features and superpixel-wise features, [
16,
17,
18], and deep features [
19,
20] were used.
4.1. Diabetic Retinopathy Datasets
Many datasets are available online for retinal images to detect DR lesions and blood vessels. These datasets are generally used to train, validate, and test models. Hence, they can be used to assess the performance of a new model compared with the existing models. Many fundus images are available with varying resolutions, contrasts, etc. Fundus image datasets are tabulated in
Table 4. The most commonly used datasets are DiaretDB0, DiaretDB1, e-Ophtha Ex, IDRiD, and Kaggle DRD Kaggle.
DiaretDB0 [
21] is a publicly available dataset with 130 images, including 20 fundus images without DR and 110 images with DR early signs. It was collected from Kuopio University Hospital using a fundus camera with a 50-degree field of view.
The DiaretDB1 [
22] database is one of the publicly available datasets containing high-quality DR retinal images annotated at the lesion level. The resolution of the retinal images is 1500 pixels by 1152 pixels with a 50-degree FoV. Out of 89 fundus images, 47 and 42 are assigned for training and testing, respectively.
E. Decencière et al. proposed two datasets, e-Ophtha EX and e-Ophtha MA [
23], consisting of retinal images. Both datasets are a collection of four different resolutions, ranging from 2544 by 1696 pixels to 1440 by 960 pixels, with a 45-degree field of view. The e-Ophtha EX has 82 retinal images, of which 35 are without DR and 47 with 12,278 exudate signs. Similarly, the other dataset, e-Ophtha MA, contains 381 images, of which 233 are without DR and 148 images with 1306 microaneurysm signs. The Indian Diabetic Retinopathy Image Dataset (IDRiD) [
24] is an open-source dataset that is available online. The experts did the annotations at the pixel level. Hence, more accurate predictions can be made on DR lesions. Of 81 images, 54 are kept for training and 27 for testing with a 4288 by 2848 pixel resolution and 50-degree field of view (FoV).
The Kaggle Diabetic Retinopathy Detection challenge dataset comprises high-resolution retina photographs taken under various imaging circumstances. It contains 88,702 RGB images with varying resolutions, divided into a training set of 35,126 and a testing set of 53,576. Other freely available datasets are Messidor and Messidor-2 [
25], which contain 1200 images (400 images without pupil enlargement and 800 images with pupil enlargement) and 1748 images, respectively. The Messidor dataset is divided into three equal sets (i.e., 400 images each). The resolutions of the captured images in both datasets are 1440 by 960, 2240 by 1488, or 2304 by 1536 pixels with a 45-degree FoV. These images are graded into DR stages varying from 0 to 3 based on the no. of microaneurysms and hemorrhages. DRIVE [
26] and STARE [
27] have 40 and 400 images, respectively. The DRIVE dataset has 20 training and 20 testing images with pixel-level annotations. In STARE, the camera was a Topcon TRV with a 35-degree FoV. The pixel-level annotations of the diverse retinal images can be found in both the e-Ophtha and IDRiD datasets, and these various retinal images help to improve the model’s accuracy.
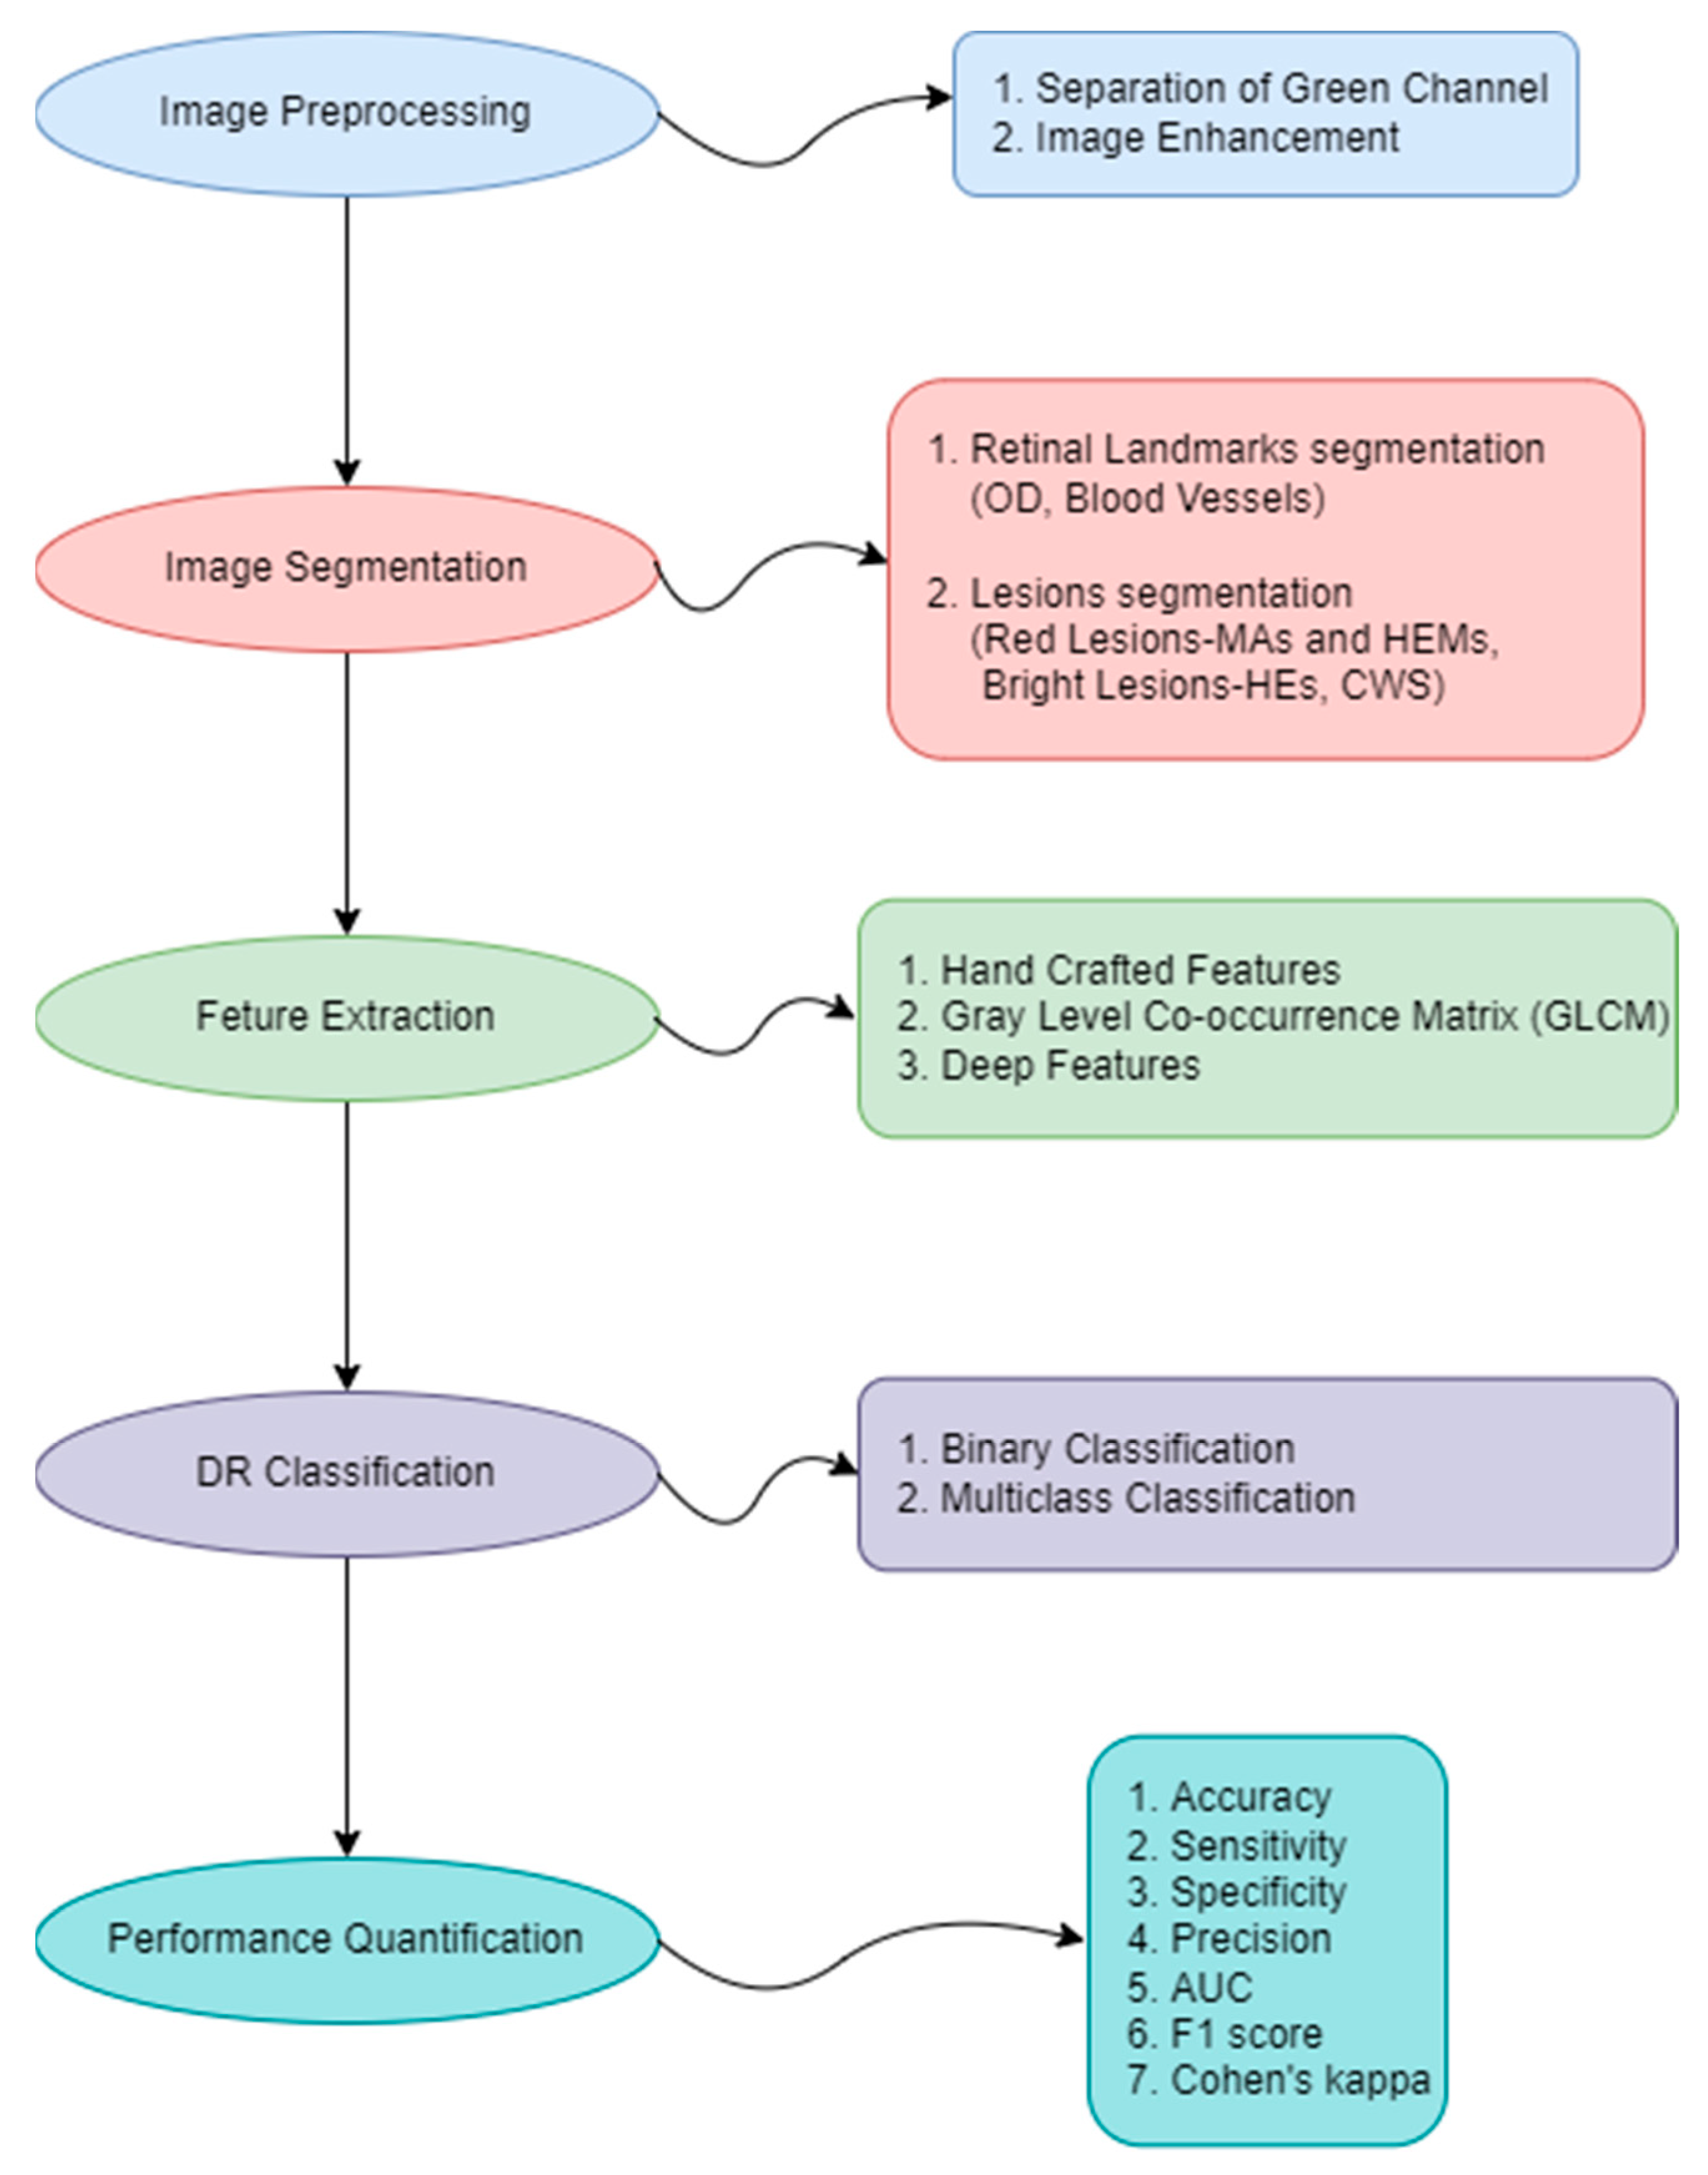
4.2. Steps in Diabetic Retinopathy Detection
Generally, the steps involved in diabetic retinopathy detection and classification are shown in
Figure 19. In image segmentation, retinal landmarks, such as the optic disc [
28,
29] and blood vessels [
30,
31] are removed to make lesion segmentation feasible.
4.3. Image Segmentation
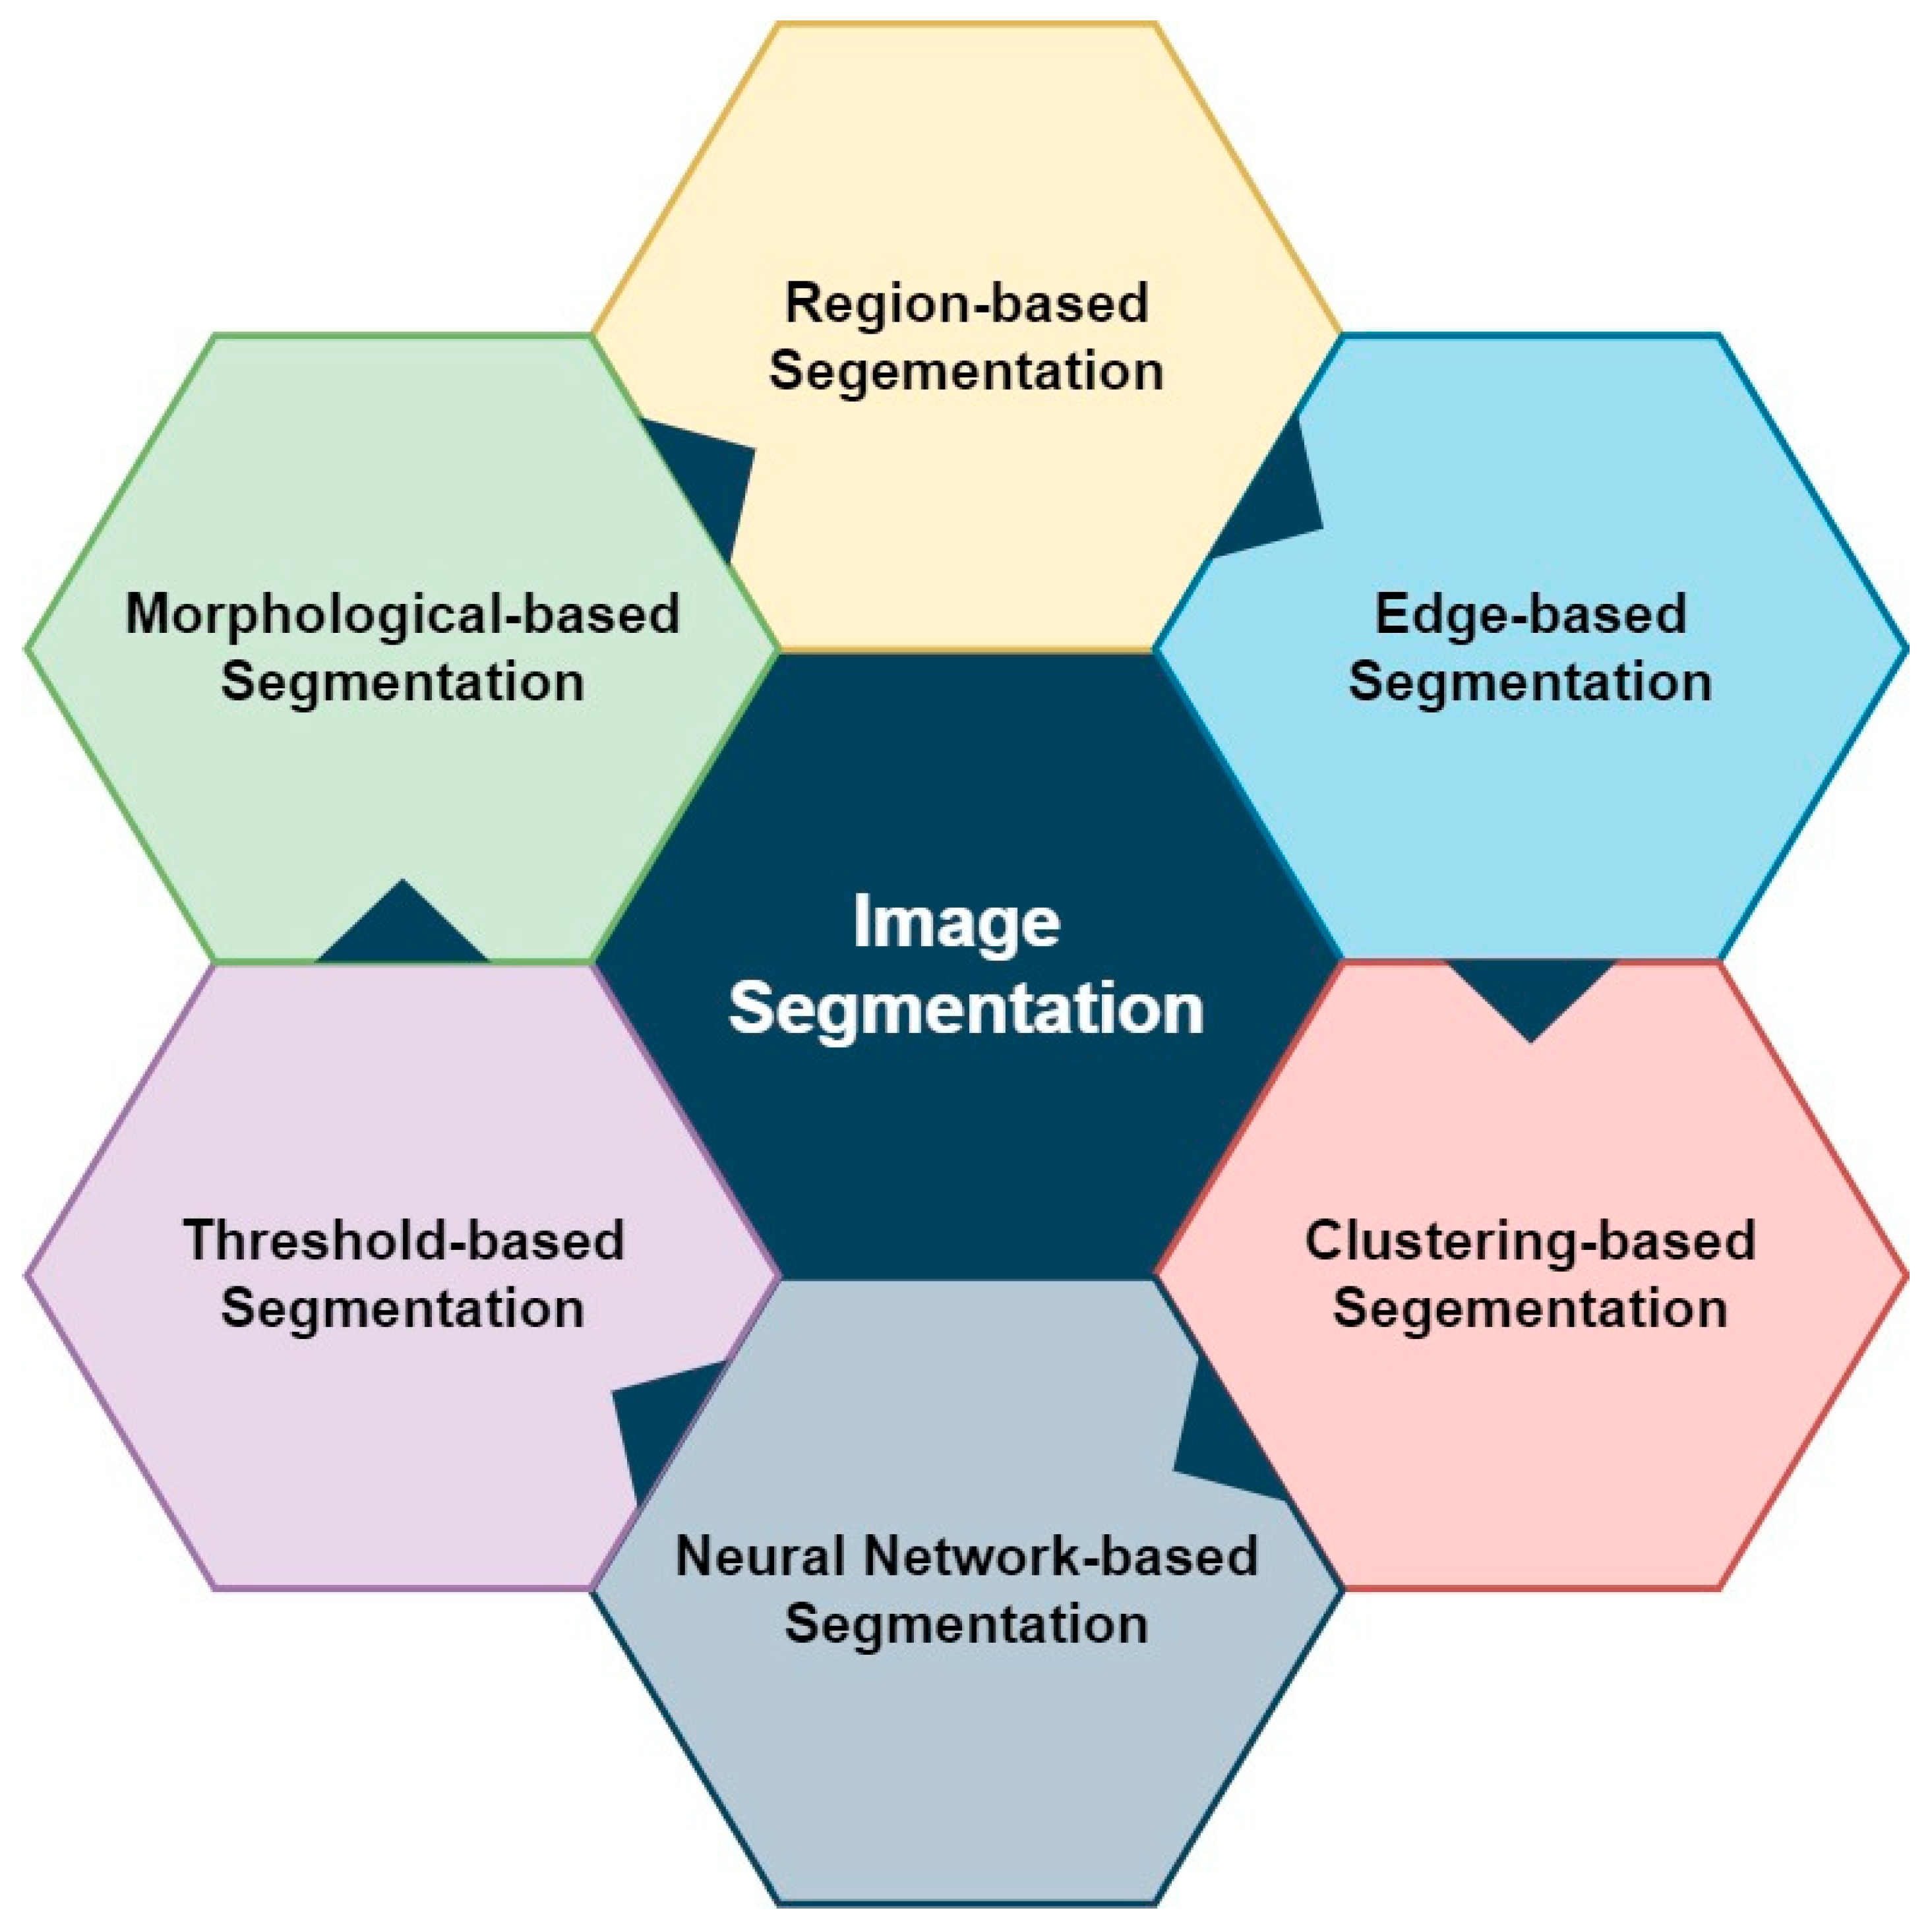
Image segmentation (
Figure 20) can be broadly categorized into traditional and machine learning approaches. The traditional approach includes threshold-based, morphological-based, region-based, and clustering-based image segmentation, which are listed in
Table 5 with the datasets that they used.
4.3.1. Threshold-Based Segmentation
The segmentation of exudates was implemented using dynamic decision thresholding and adaptive image quantization by Kaur et al. [
6]. Since the threshold value is dynamically selected for the low-contrast images with a large diversity, this leads to robustness. Using the Otsu algorithm [
17,
32] the value for adaptive thresholding, i.e., T, is selected. The histogram-based locus detection method [
33] is used on an image to segment lesions. Optic disc and blood vessel pixels are irrelevant, and thus, removed using the Hough transform and a matched filter, respectively.
4.3.2. Morphological-Based Segmentation
Morphological-based segmentation is one of the most commonly used methods for segmentation. At first, the image pre-processing is done by extracting the green channel, and then lesion candidates are computed using morphological operations [
15]. Morphological component analysis [
34] is used to separate different components that have anatomically distinct shapes in an image. Mathematical morphological methods were assessed by several authors [
35] and applied to fundus images for lesion segmentation after pre-processing using the Gabor filter, median filter, etc.
4.3.3. Region-Based Segmentation
The region is grown pixel by pixel in a recursive manner from a randomly selected seed point based on similarities and 4- or 8-connectivity with neighboring pixels [
36] in a recursive way. This method generally leads to over-segmentation. The watershed transform [
37] and circular hough transform [
38] removes a bright optic disc resembling the anatomical structure.
4.3.4. Edge-Based Segmentation
First-order and second-order derivation filters can extract high frequencies from an image. Adal et al. [
39] computed the second-order partial derivatives using the Hessian matrix, and later, microaneurysms were detected using Retinopathy Online Challenge (ROC) and University of Tennesse Health Science Center (UTHSC).
4.3.5. Clustering-Based Segmentation
Clustering-based segmentation is a method that finds similar pixels based on the distance, such as Euclidean distance and Manhattan distance, etc., from centroids and forms into groups or clusters. All elements within one cluster will look closer to each other than the elements in the other clusters. Huang C. et al. [
18] extracted 25 features at the pixel level and super-pixel level and Sopharak et al. [
17] selected four features: intensity, hue, standard deviation, and hue from contrast-enhanced images using simple linear iterative clustering and fuzzy C-means clustering methods, respectively. The initial centroid, which is randomly chosen, and the presence of noise may lead to poor segmentation.
4.3.6. Neural-Network-Based Segmentation
Technology innovation has been increasing rapidly, especially in machine learning, leading to its usage in medical fields. Machine algorithms require a neural network architecture to implement that is basically used in classification and clustering problems. Researchers are now extensively using neural networks for the same reason.
Garifullin et al. [
40] performed MAs, EX, and HEM segmentation using the Bayesian lesion segmentation method with a dense, fully connected architecture. Xia H. et al. [
41] worked on a multi-scale residual network (MSRNet). He W. et al. [
42] proposed an incremental pattern-based segmentation that refines the information obtained from the already trained model and applies it to the present model. In the feature extraction step, various features are extracted, such as the intensity, geometric and textural features, grey-level co-occurrence matrix (GLCM) [
36], and deep features [
42]. These features are given as input to a machine learning classifier, which classifies DR lesions.
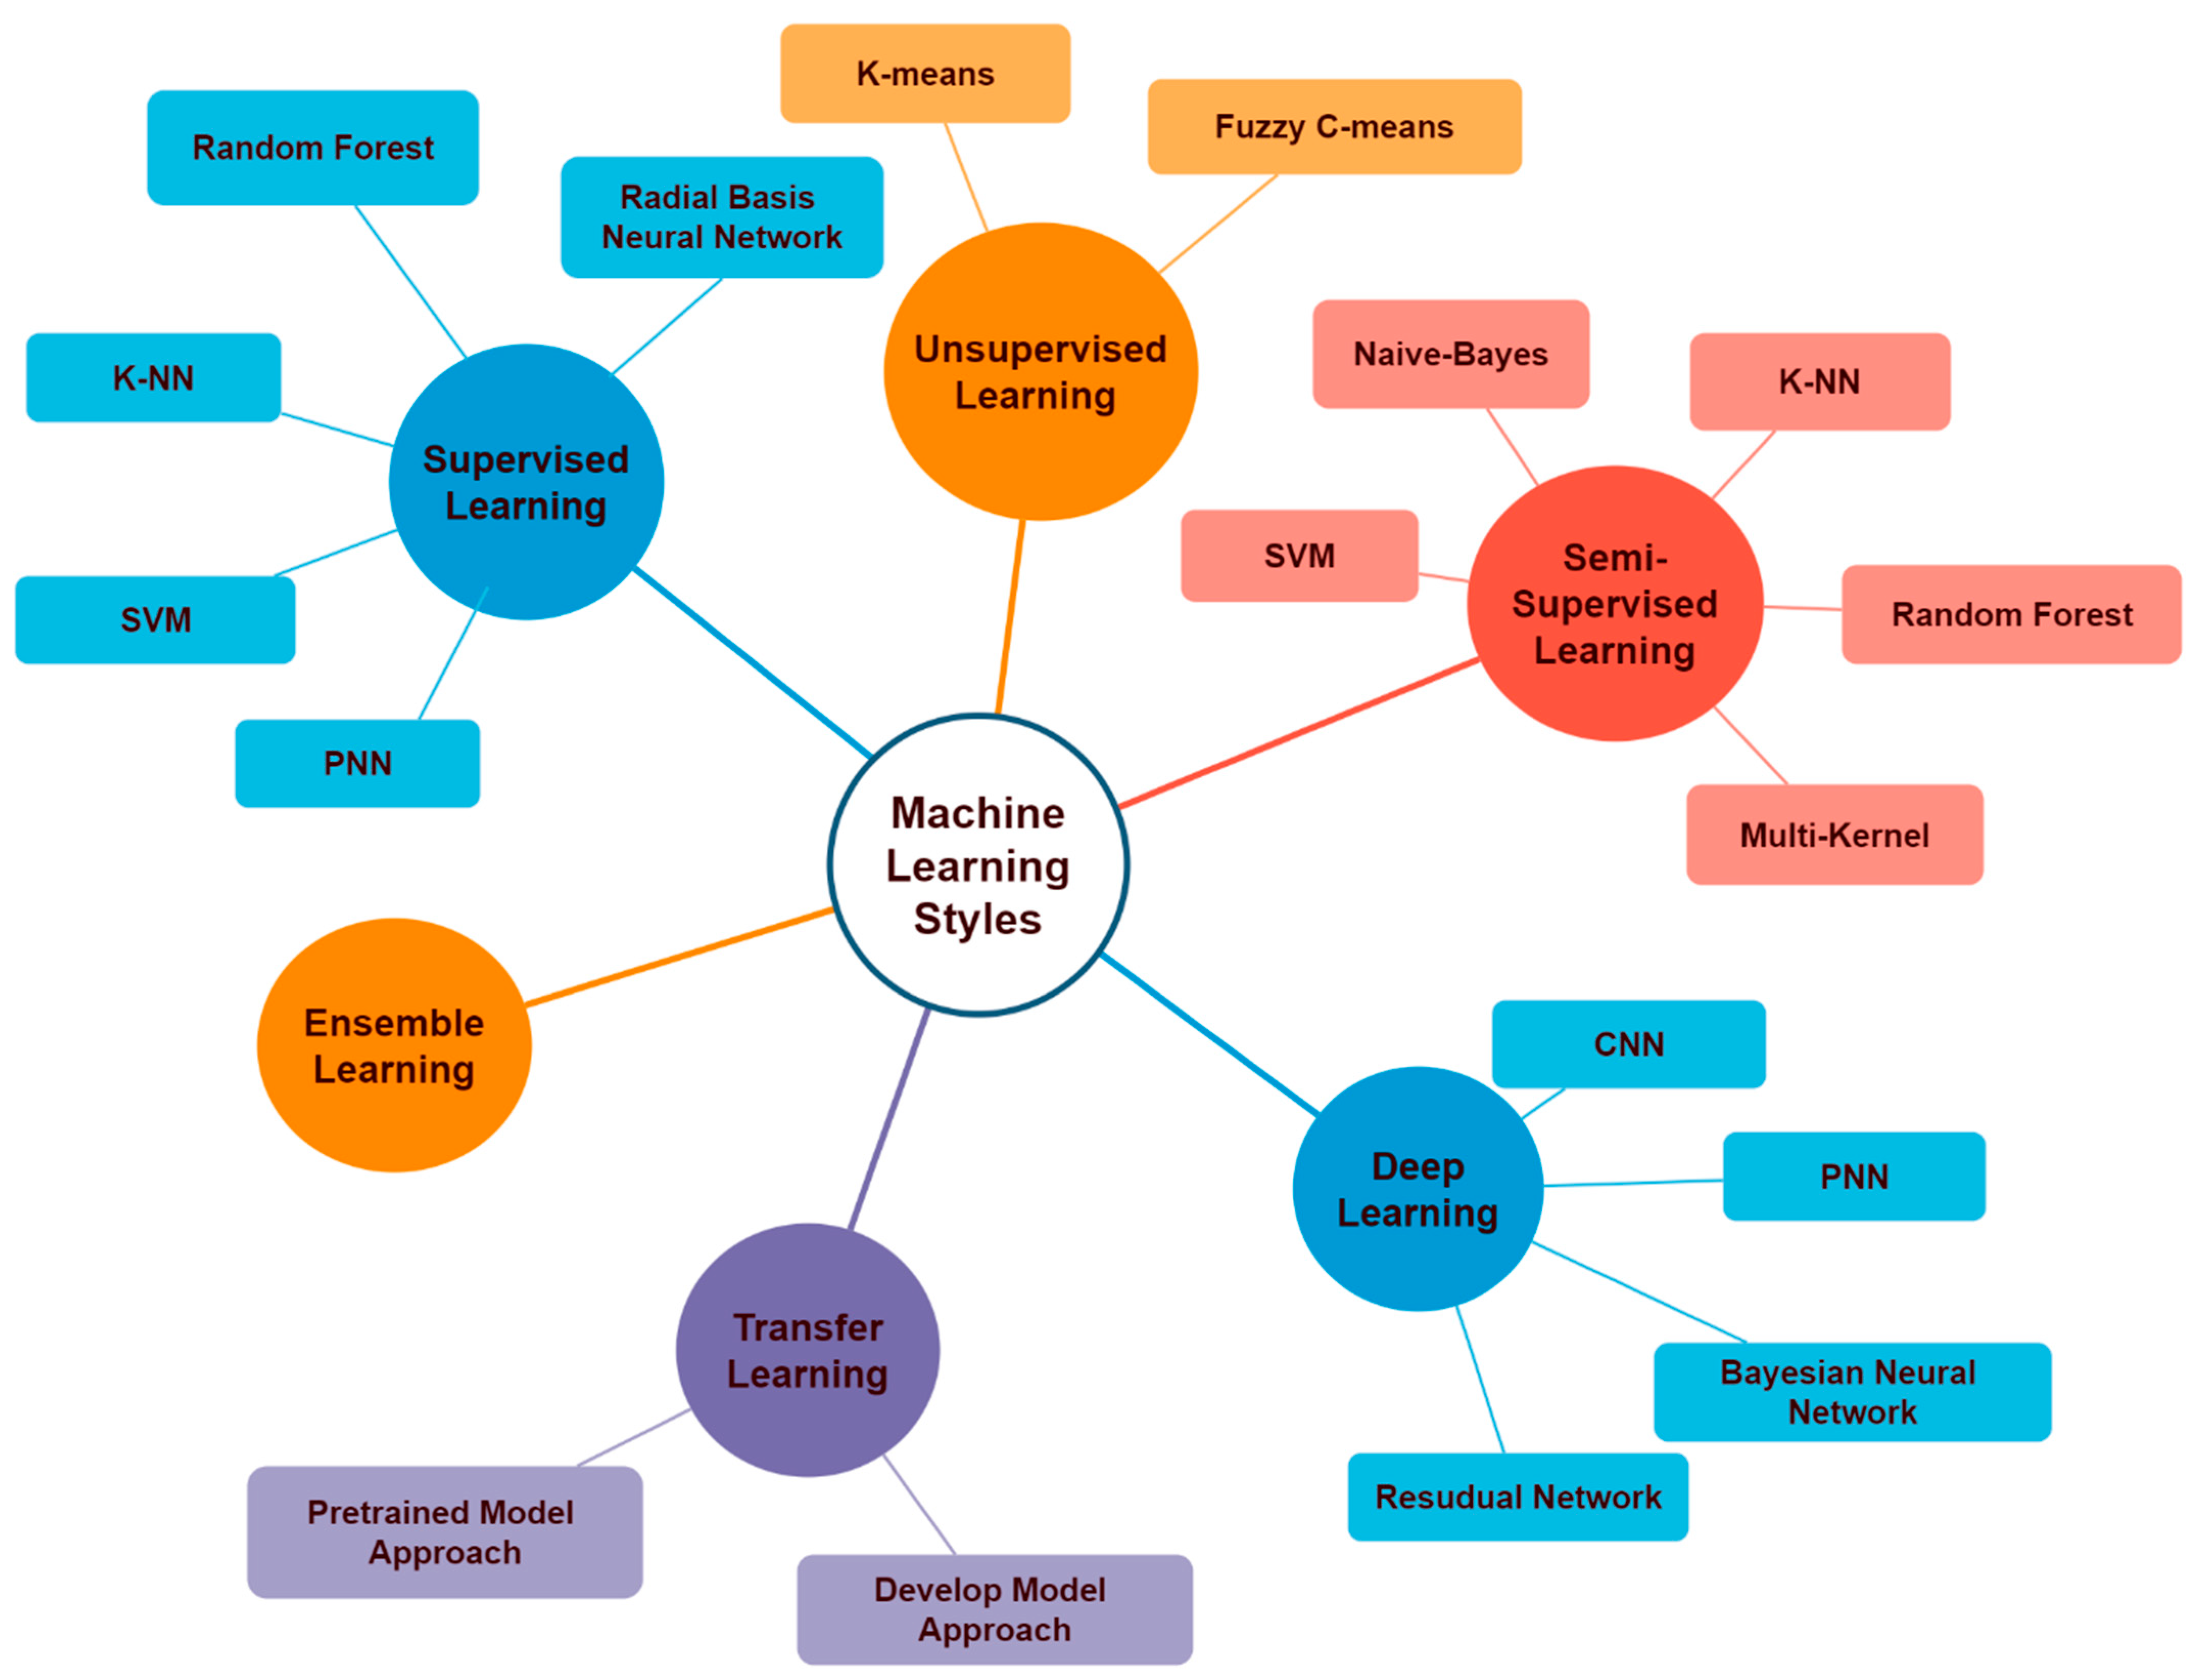
4.4. Machine Learning Styles
Machine learning techniques are broadly classified as supervised and unsupervised machine learning techniques. The former classifier requires training data to fit a model for the given data and can be used to classify diabetic retinopathy. In contrast, no training data is necessary for the latter classifier. Since the research focuses on the health of diabetics, the classification algorithms used to detect the disease must provide accurate results. The various machine learning styles for DR classification are given in
Figure 21.
4.4.1. Supervised Learning
Table 6 shows a list of studies that used supervised learning styles. Few authors [
15,
28,
29,
43] have used the random forest algorithm to classify exudate and non-exudate patches among the candidates. Mahendran et al. [
36] worked with low-contrast images to detect and localize exudates using a neighborhood-based segmentation technique. The classification of retinopathy was done using support vector machine (SVM) and probabilistic neural network (PNN) classifiers and their results were compared.
Yadav et al. [
33] and Amin et al. [
35] compared the performance of three classifiers, namely, kNN, SVM, and PNN, and found that SVM had the best accuracy among these three classifiers. An ensemble classifier is a classifier that combines two or more models to take advantage of the performances of all models, thereby increasing the accuracy.
A radial basis function neural network [
37] was trained using the features extracted from hemorrhages and microaneurysm segmented regions. A hybrid nature-inspired Hybrid Spider monkey optimization-Gradient boosting machines classifier (SMO-GBM) classifier was proposed by Badgujar et al. [
32] for exudate-based DR classification. A combination of RUS (random under-sampling) and AdaBoost [
44] was used as a classifier for MA detection, overcoming the problem of imbalanced data.
4.4.2. Unsupervised Learning
The unsupervised learning method (
Table 7) works on unlabeled data, which is beneficial since labeling is tedious and costly. It groups the pixels based on their similar characteristics.
Kaur et al. [
6] developed an adaptive k-means quantization method to form clusters based on the varying intensities of colors in retinal fundus images, whereas Huang C. et al. [
18] used the simple linear iterative clustering (SLIC) method, which provides an alternative representation of fundus images. This representation reduces noise and forms a basis for fast and precise diagnoses of exudates. The fuzzy C-means clustering technique and morphological operators were used by Sopharak et al. [
17] to segment exudates. Exudates and optic discs appear bright, making classification difficult. Akram et al. [
14] have used a combination of gaussian mixed model (GMM) and m-mediods classifier which took the advantage of the best properties of both models.
4.4.3. Semi-Supervised Machine Learning Style
The supervised machine learning style is costly due to the hand-labeling process, which is overcome by the semi-supervised machine learning style. The latter approach (
Table 8) will work even for less labeled data.
Less labeled and unlabeled data can be used to train this model. To the best of our knowledge, Adal et al. [
39] and Cao et al. [
45] implemented this learning method using well-known SVM, kNN, naïve Bayes, RF, and multi-kernel classifiers.
4.4.4. Ensemble Learning Approach
This method aims to amalgamate the decisions obtained from different models and classify an unseen image. Thus, this gleaned classifier (
Table 9) gives better accuracy. The ensemble model is obtained by combining other traditional models. Based on the combining method, an ensemble is classified into a stacking, blending, bagging, or boosting type. The optimal solution was obtained by integrating the decision tree output using the bootstrap method based on voting [
46], and RUSBoost [
44]. Ignacio Orlando et al. [
29] ensembled both HCF and deep features. A bootstrapped decision-tree-based ensemble classifier was used to classify exudate pixels and non-exudate pixels [
47].
4.4.5. Deep Learning Approach
Deep learning (
Table 10), which is a subset of machine learning, extracts lines and edges in the initial layers and deep features in the later layers using convolution operations. As a result, it is now playing an essential role in DR detection.
The optic disc was segmented using circular Hough transformation from fundus images, and CNNs [
18,
38,
48] were used to automatically detect exudates. The super-pixel is another image representation used to extract features and classify retinopathy stages.
Wang H. et al. [
28] suggested a method for exudate identification using a deep convolutional neural network (DCNN). They used a morphological approach to segment exudates; then, multiple features were extracted and classified using a random forest. Lesion identification and DR grading are done using DCNN [
41]. Sandhya et al. [
49] proposed context unit-based deep neural networks to recognize DR using a fully connected CNN to extract multi-features faster.
U-Net architecture is mainly used for semantic segmentation. It consists of encoder and decoder paths. Modified U-Net [
50] uses ResNet34 architecture (four blocks) in the encoder path and four U-Net decoder blocks. The use of ResNet blocks increases the accuracy of DR detection.
4.4.6. Transfer Learning Approach
The application of knowledge obtained by completing one task and using it in solving some related problem is known as transfer learning. It is classified as a pre-trained model and is used to develop model-based approaches.
Table 11 shows a summarization of transfer learning approaches used in the literature.
Pixel-wise segmentation is always intense labor work, which is generally used in instance segmentation. Liao et al. [
48] overcame this difficulty by using data with fewer annotations and extracted knowledge of the previous model to improve the performance of their model. The weights of online pre-trained models are used at the initial layers of their model and the user are free to choose the later layers per their requirement, thus increasing the new model’s performance [
44]. The pre-trained CNN models, such as ResNet50 [
19,
20,
47], Xception [
19,
47,
51], Inception [
19,
20,
47,
51] and VGG16 [
42] were used for segmentation and classified using a multiclass SVM ensemble classifier.
4.5. Performance Measures
Generally, accuracy is the most common metric used to test a model’s performance. It tells us how well a model performed on the entire data set, but it does not tell us how much is correctly predicted out of the DR and no DR categories. Thus, a confusion matrix is used. One can find sensitivity, specificity, precision, and negative prediction value from this confusion matrix. Sensitivity (true positive rate) and specificity show how well our model has performed. It is obtained by predicting true positive out of total positive cases and true negative out of total negative cases. The precision reveals how much is correctly predicted out of the model’s positive predictions, and the negative prediction value reveals how much is correctly predicted out of negative predictions made by the model. Researchers also evaluate their model’s performance using the F1 score, area under curve (AUC), Cohen’s score, etc., as shown in
Table 12.
From the table, it is observed that Sopharak et al. [
17], Akram et al. [
14], Amin et al. [
35], and Khojasteh et al. [
52] achieved good accuracies with 99.11%, 98.4%, 98.5%, and 98.2%, respectively. Out of them, Akram et al. and Khojasteh et al. achieved good sensitivity and specificity. Akram et al. obtained a sensitivity of 97.61% and specificity of 97.03% using an ensemble of gaussian mixture model and m-mediods for exudate detection on the Messidor dataset. Khojasteh et al. obtained a sensitivity of 99% and a specificity of 96% using ResNet50 with SVM on DIARET DB1.
Sopharak et al. [
17] created their own dataset using a KOWA-7 non-mydriatic retinal camera and obtained this good result by segmenting exudates using fuzzy C-means clustering. Amin et al. [
35] achieved a good area under curve (AUC) with better accuracy. They segmented exudates and used statistical and geometrical features to classify DR and no DR using kNN, probabilistic, tree-based, and SVM methods on publicly available datasets (DiaretDB1, DRIVE, e-Ophtha EX, Messidor). The Gaussian SVM outperformed using DiaretDB1 dataset.
Mahendran et al. [
36] achieved a 97.89% accuracy, 98.68% sensitivity, and 100% specificity using an SVM on the MESSIDOR dataset, i.e., this study achieved superior results in terms of sensitivity and specificity.
Many studies were conducted to detect other lesions, such as microaneurysms and hemorrhages, along with exudates and classify diabetic retinopathy. Author Deepa et al. [
54] have achieved 96.2% accuracy with all lesions but Gayathri et al. [
53] procured excellent results with 99.89% accuracy for DR–No DR classification.
5. Discussion and Observations
Two popular databases, namely, Scopus and Web of Science, were used to select papers based on the query already mentioned regarding the data collection under the Methods and Materials section.
Deeper and broader insights were provided through quantitative and qualitative analysis. Both analyses were necessary since they help to form hypotheses for research. Quantitative analysis was done using Excel, VOSviewer, and Biblioshiny. Such a study aims toward and can aid in the evaluation of theories. The qualitative analysis was done regarding a dataset, image segmentation methods, and different machine learning styles ranging from traditional ML styles to deep learning styles used in the literature. It aids researchers in better understanding the automated diabetic retinopathy detection system’s motives, necessity, methodology, and justifications. It provides deep insights into various kinds of datasets and suitable methods.
Most researchers used publicly available datasets, and few used private datasets collected from the hospital. However, in either case, the issues were as follows:
- (i)
First, all images collected belonged to a single modality and were captured from one particular device from one hospital. To overcome such issues, images must be captured from different devices under different circumstances, and multimodal images, such as OCT and fundus images, may be used.
- (ii)
Second, fewer DR images may lead to overfitting. Thus, the size of the dataset must be increased, or alternative ML styles, such as semi-supervised, self-supervised, and co-learning techniques, may be used to produce a good model with better performance.
- (iii)
The third issue may be due to imbalance, i.e., a biased dataset, which may be avoided by adequately collecting DR images.
In addition to the above, there may be issues of non-uniform illumination and low contrast. Since the eye structure is spherical, it leads to brightness at the center and becomes darker in the surrounding.
Thus, a robust classification model with high accuracy and speed could be possible that considers these points, and hence, can be deployed on a server to be used by ordinary people.
Various image segmentation and ML styles are discussed in this paper. For better segmentation and classification, useful features must be extracted, such as the intensity, statistical, textural, grey-level co-occurrence matrix, moments, standard deviation, and deep features (pixel level and super-pixel level) in the R, G, B, and intensity channels for both greyscale and color images.
6. Conclusions
This paper presents a literature review of different machine learning styles for diabetic retinopathy detection. It discusses datasets and the selected papers based on image segmentation, traditional ML styles, DL methods, and the parameters used for quantifying the performance of various classification models.
It also explores statistical data in DR detection and classification. The quantitative analysis was based on the Scopus and WoS databases from 2000 to 2021, with 811 documents published in various journals and conferences, including different kinds of funding received by researchers worldwide working with other organizations. It was observed that various research studies were carried out using supervised learning and, recently, deep learning. Future work can be focused on working with a balanced and multimodal dataset. The second point is to use semi-supervised, self-supervised, and co-learning techniques with deep neural networks. This paper may help researchers to narrow the research spectrum and form hypotheses by identifying the gaps.
Author Contributions
Conceptualization, S.S., S.M., and S.P.; methodology, S.S., S.M., and S.P.; software, S.S., S.M., and S.P.; validation, S.S., S.M., and S.P.; formal analysis, S.S.; investigation, S.S. and S.M.; resources, S.S.; data curation, S.S., S.M., S.P., K.S., and E.A.; writing—original draft preparation, S.S.; writing—review and editing, S.S., S.M., S.P., K.S., and E.A.; visualization, S.S.; supervision, S.M., S.P., K.S., and E.A.; project administration, S.M., S.P., K.S., and E.A. All authors have read and agreed to the published version of the manuscript.
Funding
This work was supported by the Research Support Fund (RSF) of Symbiosis International (Deemed University), Pune, India.
Institutional Review Board Statement
Not applicable.
Informed Consent Statement
Not applicable.
Data Availability Statement
Not applicable.
Conflicts of Interest
The authors declare no conflict of interest.
References
- Teo, Z.L.; Tham, Y.C.; Yu, M.; Chee, M.L.; Rim, T.H.; Cheung, N.; Bikbov, M.M.; Wang, Y.X.; Tang, Y.; Lu, Y.; et al. Global prevalence of diabetic retinopathy and projection of burden through 2045: Systematic review and meta-analysis. Ophthalmology 2021, 128, 1580–1591. [Google Scholar] [CrossRef] [PubMed]
- Vashist, P.; Senjam, S.S.; Gupta, V.; Manna, S.; Gupta, N.; Shamanna, B.R.; Bhardwaj, A.; Kumar, A.; Gupta, P. Prevalence of diabetic retinopahty in India: Results from the National Survey 2015–19. Indian J. Ophthalmol. 2021, 69, 3087. [Google Scholar] [CrossRef] [PubMed]
- Available online: https://timesofindia.indiatimes.com/city/chandigarh/burden-of-retinal-diseases-caused-by-diabetes-on-the-rise-pgi-doc/articleshow/87690561.cms (accessed on 14 November 2021).
- Kaur, J.; Mittal, D. A generalized method for the detection of vascular structure in pathological retinal images. Biocybern. Biomed. Eng. 2017, 37, 184–200. [Google Scholar] [CrossRef]
- Koetting, C. The Four Stages of Diabetic Retinopathy; Modern Optometry: Fairfax, VA, USA, 2019; pp. 21–24. [Google Scholar]
- Kaur, J.; Mittal, D. A generalized method for the segmentation of exudates from pathological retinal fundus images. Biocybern. Biomed. Eng. 2018, 38, 27–53. [Google Scholar] [CrossRef]
- Shinde, R.; Patil, S.; Kotecha, K.; Ruikar, K. Blockchain for securing ai applications and open innovations. J. Open Innov. Technol. Mark. Complex. 2021, 7, 189. [Google Scholar] [CrossRef]
- Munim, Z.H.; Dushenko, M.; Jimenez, V.J.; Shakil, M.H.; Imset, M. Big data and artificial intelligence in the maritime industry: A bibliometric review and future research directions. Marit. Policy Manag. 2020, 47, 577–597. [Google Scholar] [CrossRef]
- Gulshan, V.; Peng, L.; Coram, M.; Stumpe, M.C.; Wu, D.; Narayanaswamy, A.; Venugopalan, S.; Widner, K.; Madams, T.; Cuadros, J.; et al. Development and validation of a deep learning algorithm for detection of diabetic retinopathy in retinal fundus photographs. JAMA 2016, 316, 2402–2410. [Google Scholar] [CrossRef]
- Saha, R.; Chowdhury, A.R.; Banerjee, S. Diabetic retinopathy related lesions detection and classification using machine learning technology. In Proceedings of the International Conference on Artificial Intelligence and Soft Computing, Zakopane, Poland, 12–16 June 2016; Springer: Cham, Switzerland, 2016; pp. 734–745. [Google Scholar]
- Antal, B.; Lázár, I.; Hajdu, A.; Török, Z.; Csutak, A.; Pető, T. A multi-level ensemble-based system for detecting microaneurysms in fundus images. In Proceedings of the 4th International Workshop on Soft Computing Applications, Arad, Romania, 15–17 July 2010; pp. 137–142. [Google Scholar]
- Quellec, G.; Lamard, M.; Cazuguel, G.; Cochener, B.; Roux, C. Wavelet optimization for content-based image retrieval in medical databases. Med. Image Anal. 2010, 14, 227–241. [Google Scholar] [CrossRef] [Green Version]
- Mori, Y.; Kuroda, M.; Makino, N. Variable Selection in Multiple Correspondence Analysis. In Nonlinear Principal Component Analysis and Its Applications; Springer: Singapore, 2016; pp. 31–45. [Google Scholar]
- Akram, M.U.; Khalid, S.; Tariq, A.; Khan, S.A.; Azam, F. Detection and classification of retinal lesions for grading of diabetic retinopathy. Comput. Biol. Med. 2014, 45, 161–171. [Google Scholar] [CrossRef]
- Zhang, X.; Thibault, G.; Decencière, E.; Marcotegui, B.; Laè, B.; Danno, R.; Cazuguel, G.; Quellec, G.; Lamard, M.; Massin, P.; et al. Exudate detection in color retinal images for mass screening of diabetic retinopathy. Med. Image Anal. 2014, 18, 1026–1043. [Google Scholar] [CrossRef]
- Perdomo, O.; Otalora, S.; Rodríguez, F.; Arevalo, J.; González, F.A. A novel machine learning model based on exudate localization to detect diabetic macular edema. In Proceedings of the Ophthalmic Medical Image Analysis Third International Workshop, Athens, Greece, 21 October 2016; pp. 137–144. [Google Scholar]
- Sopharak, A.; Uyyanonvara, B.; Barman, S. Automatic exudate detection from non-dilated diabetic retinopathy retinal images using fuzzy c-means clustering. Sensors 2009, 9, 2148–2161. [Google Scholar] [CrossRef] [PubMed]
- Huang, C.; Zong, Y.; Ding, Y.; Luo, X.; Clawson, K.; Peng, Y. A new deep learning approach for the retinal hard exudates detection based on super-pixel multi-feature extraction and patch-based CNN. Neurocomputing 2021, 452, 521–533. [Google Scholar] [CrossRef]
- Samanta, A.; Saha, A.; Satapathy, S.C.; Fernandes, S.L.; Zhang, Y.D. Automated detection of diabetic retinopathy using convolutional neural networks on a small dataset. Pattern Recognit. Lett. 2020, 135, 293–298. [Google Scholar] [CrossRef]
- Saxena, G.; Verma, D.K.; Paraye, A.; Rajan, A.; Rawat, A. Improved and robust deep learning agent for preliminary detection of diabetic retinopathy using public datasets. Intell.-Based Med. 2020, 3, 100022. [Google Scholar] [CrossRef]
- Kauppi, T.; Kalesnykiene, V.; Kamarainen, J.K.; Lensu, L.; Sorri, I.; Uusitalo, H.; Kälviäinen, H.; Pietilä, J. DIARETDB0: Evaluation database and methodology for diabetic retinopathy algorithms. In Machine Vision and Pattern Recognition Research Group; Lappeenranta University of Technology: Lappeenranta, Finland, 2006; Volume 73, pp. 1–17. [Google Scholar]
- Kauppi, T.; Kalesnykiene, V.; Kamarainen, J.K.; Lensu, L.; Sorri, I.; Raninen, A.; Kälviäinen, H.; Pietilä, J. The diaretdb1 diabetic retinopathy database and evaluation protocol. In Proceedings of the BMVC 2007, Warwick, UK, 10–13 September 2007; Volume 1, pp. 1–10. [Google Scholar]
- Decenciere, E.; Cazuguel, G.; Zhang, X.; Thibault, G.; Klein, J.C.; Meyer, F.; Marcotegui, B.; Quellec, G.; Lamard, M.; Danno, R.; et al. TeleOphta: Machine learning and image processing methods for teleophthalmology. IRBM 2013, 34, 196–203. [Google Scholar] [CrossRef]
- Porwal, P.; Pachade, S.; Kamble, R.; Kokare, M.; Deshmukh, G.; Sahasrabuddhe, V.; Meriaudeau, F. Indian diabetic retinopathy image dataset (IDRiD): A database for diabetic retinopathy screening research. Data 2018, 3, 25. [Google Scholar] [CrossRef] [Green Version]
- Decencière, E.; Zhang, X.; Cazuguel, G.; Lay, B.; Cochener, B.; Trone, C.; Gain, P.; Ordóñez-Varela, J.-R.; Massin, P.; Erginay, A.; et al. Feedback on a publicly distributed image database: The Messidor database. Image Anal. Stereol. 2014, 33, 231–234. [Google Scholar] [CrossRef] [Green Version]
- Niemeijer, M.; Staal, J.J.; Ginneken, B.; Loog, M.; Abramoff, M.D. DRIVE: Digital retinal images for vessel extraction. Methods for evaluating segmentation and indexing techniques dedicated to retinal ophthalmology. IEEE Trans. Med. Imaging 2004, 23, 501–509. [Google Scholar]
- Goldbaum, M.D.M.; Hoover, A. STARE Dataset Website; Clemson University: Clemson, SC, USA, 1975. [Google Scholar]
- Wang, H.; Yuan, G.; Zhao, X.; Peng, L.; Wang, Z.; He, Y.; Yingchuan, F.; Peng, Z. Hard exudate detection based on deep model learned information and multi-feature joint representation for diabetic retinopathy screening. Comput. Methods Programs Biomed. 2020, 191, 105398. [Google Scholar] [CrossRef]
- Orlando, J.I.; Prokofyeva, E.; Del Fresno, M.; Blaschko, M.B. An ensemble deep learning based approach for red lesion detection in fundus images. Comput. Methods Programs Biomed. 2018, 153, 115–127. [Google Scholar] [CrossRef] [Green Version]
- Zago, G.T.; Andreão, R.V.; Dorizzi, B.; Salles, E.O.T. Diabetic retinopathy detection using red lesion localization and convolutional neural networks. Comput. Biol. Med. 2020, 116, 103537. [Google Scholar] [CrossRef] [PubMed]
- Atli, I.; Gedik, O.S. Sine-Net: A fully convolutional deep learning architecture for retinal blood vessel segmentation. Eng. Sci. Technol. Int. J. 2021, 24, 271–283. [Google Scholar] [CrossRef]
- Badgujar, R.D.; Deore, P.J. Hybrid nature inspired SMO-GBM classifier for exudate classification on fundus retinal images. IRBM 2019, 40, 69–77. [Google Scholar] [CrossRef]
- Yadav, D.; Karn, A.K.; Giddalur, A.; Dhiman, A.; Sharma, S.; Yadav, A.K. Microaneurysm detection using color locus detection method. Measurement 2021, 176, 109084. [Google Scholar] [CrossRef]
- Imani, E.; Pourreza, H.R. A novel method for retinal exudate segmentation using signal separation algorithm. Comput. Methods Programs Biomed. 2016, 133, 195–205. [Google Scholar] [CrossRef]
- Amin, J.; Sharif, M.; Yasmin, M.; Ali, H.; Fernandes, S.L. A method for the detection and classification of diabetic retinopathy using structural predictors of bright lesions. J. Comput. Sci. 2017, 19, 153–164. [Google Scholar] [CrossRef]
- Mahendran, G.; Dhanasekaran, R. Investigation of the severity level of diabetic retinopathy using supervised classifier algorithms. Comput. Electr. Eng. 2015, 45, 312–323. [Google Scholar] [CrossRef]
- Kumar, S.; Adarsh, A.; Kumar, B.; Singh, A.K. An automated early diabetic retinopathy detection through improved blood vessel and optic disc segmentation. Opt. Laser Technol. 2020, 121, 105815. [Google Scholar] [CrossRef]
- Adem, K. Exudate detection for diabetic retinopathy with circular Hough transformation and convolutional neural networks. Expert Syst. Appl. 2018, 114, 289–295. [Google Scholar] [CrossRef]
- Adal, K.M.; Sidibé, D.; Ali, S.; Chaum, E.; Karnowski, T.P.; Mériaudeau, F. Automated detection of microaneurysms using scale-adapted blob analysis and semi-supervised learning. Comput. Methods Programs Biomed. 2014, 114, 1–10. [Google Scholar] [CrossRef] [Green Version]
- Garifullin, A.; Lensu, L.; Uusitalo, H. Deep Bayesian baseline for segmenting diabetic retinopathy lesions: Advances and challenges. Comput. Biol. Med. 2021, 136, 104725. [Google Scholar] [CrossRef] [PubMed]
- Xia, H.; Lan, Y.; Song, S.; Li, H. A multi-scale segmentation-to-classification network for tiny microaneurysm detection in fundus images. Knowl.-Based Syst. 2021, 226, 107140. [Google Scholar] [CrossRef]
- He, W.; Wang, X.; Wang, L.; Huang, Y.; Yang, Z.; Yao, X.; Zhao, X.; Ju, L.; Wu, L.; Lu, H.; et al. Incremental learning for exudate and hemorrhage segmentation on fundus images. Inf. Fusion 2021, 73, 157–164. [Google Scholar] [CrossRef]
- Liu, Q.; Zou, B.; Chen, J.; Ke, W.; Yue, K.; Chen, Z.; Zhao, G. A location-to-segmentation strategy for automatic exudate segmentation in colour retinal fundus images. Comput. Med. Imaging Graph. 2017, 55, 78–86. [Google Scholar] [CrossRef] [PubMed] [Green Version]
- Du, J.; Zou, B.; Chen, C.; Xu, Z.; Liu, Q. Automatic microaneurysm detection in fundus image based on local cross-section transformation and multi-feature fusion. Comput. Methods Programs Biomed. 2020, 196, 105687. [Google Scholar] [CrossRef]
- Cao, P.; Ren, F.; Wan, C.; Yang, J.; Zaiane, O. Efficient multi-kernel multi-instance learning using weakly supervised and imbalanced data for diabetic retinopathy diagnosis. Comput. Med. Imaging Graph. 2018, 69, 112–124. [Google Scholar] [CrossRef]
- Fraz, M.M.; Jahangir, W.; Zahid, S.; Hamayun, M.M.; Barman, S.A. Multi-scale segmentation of exudates in retinal images using contextual cues and ensemble classification. Biomed. Signal Process. Control 2017, 35, 50–62. [Google Scholar] [CrossRef] [Green Version]
- Zhang, W.; Zhong, J.; Yang, S.; Gao, Z.; Hu, J.; Chen, Y.; Yi, Z. Automated identification and grading system of diabetic retinopathy using deep neural networks. Knowl.-Based Syst. 2019, 175, 12–25. [Google Scholar] [CrossRef]
- Liao, Y.; Xia, H.; Song, S.; Li, H. Microaneurysm detection in fundus images based on a novel end-to-end convolutional neural network. Biocybern. Biomed. Eng. 2021, 41, 589–604. [Google Scholar] [CrossRef]
- Sandhya, S.G.; Suhasini, A. An efficient detection of micro aneurysms from fundus images with CDLNN algorithm. Mater. Today Proc. 2021. [Google Scholar] [CrossRef]
- Sambyal, N.; Saini, P.; Syal, R.; Gupta, V. Modified U-Net architecture for semantic segmentation of diabetic retinopathy images. Biocybern. Biomed. Eng. 2020, 40, 1094–1109. [Google Scholar] [CrossRef]
- Sugeno, A.; Ishikawa, Y.; Ohshima, T.; Muramatsu, R. Simple methods for the lesion detection and severity grading of diabetic retinopathy by image processing and transfer learning. Comput. Biol. Med. 2021, 137, 104795. [Google Scholar] [CrossRef] [PubMed]
- Khojasteh, P.; Júnior, L.A.P.; Carvalho, T.; Rezende, E.; Aliahmad, B.; Papa, J.P.; Kumar, D.K. Exudate detection in fundus images using deeply-learnable features. Comput. Biol. Med. 2019, 104, 62–69. [Google Scholar] [CrossRef] [PubMed]
- Gayathri, S.; Gopi, V.P.; Palanisamy, P. A lightweight CNN for Diabetic Retinopathy classification from fundus images. Biomed. Signal Process. Control 2020, 62, 102115. [Google Scholar]
- Deepa, V.; Kumar, C.S.; Cherian, T. Ensemble of multi-stage deep convolutional neural networks for automated grading of diabetic retinopathy using image patches. J. King Saud Univ. Comput. Inf. Sci. 2022, 34, 6255–6265. [Google Scholar] [CrossRef]
Figure 1.
Age–wise and sex–wise prevalence of diabetes in the population aged ≥50 years.
Figure 1.
Age–wise and sex–wise prevalence of diabetes in the population aged ≥50 years.
Figure 2.
DR stage-wise prevalence of DR in the diabetic population.
Figure 2.
DR stage-wise prevalence of DR in the diabetic population.
Figure 3.
Gender-wise prevalence of any DR in the diabetic population aged ≥50 years.
Figure 3.
Gender-wise prevalence of any DR in the diabetic population aged ≥50 years.
Figure 4.
Diabetic retinopathy retinal image showing lesions.
Figure 4.
Diabetic retinopathy retinal image showing lesions.
Figure 5.
Search queries.
Figure 5.
Search queries.
Figure 6.
Search strategy.
Figure 6.
Search strategy.
Figure 7.
Quantitative analysis.
Figure 7.
Quantitative analysis.
Figure 8.
Year-wise number of documents published in Scopus and WoS.
Figure 8.
Year-wise number of documents published in Scopus and WoS.
Figure 9.
The number of citations per year.
Figure 9.
The number of citations per year.
Figure 10.
Number of documents published and citations received by the top 10 countries.
Figure 10.
Number of documents published and citations received by the top 10 countries.
Figure 11.
Analysis of documents by subject area.
Figure 11.
Analysis of documents by subject area.
Figure 12.
Top 10 most relevant sources.
Figure 12.
Top 10 most relevant sources.
Figure 13.
Top 10 authors’ production over time.
Figure 13.
Top 10 authors’ production over time.
Figure 14.
Trend topics over time.
Figure 14.
Trend topics over time.
Figure 15.
Author keyword co-occurrence analysis.
Figure 15.
Author keyword co-occurrence analysis.
Figure 16.
Factorial map.
Figure 16.
Factorial map.
Figure 17.
Thematic evolution of the author keywords.
Figure 17.
Thematic evolution of the author keywords.
Figure 18.
Thematic map of author keywords is plotted with the relevance degree and the work quantity for all four time slices shown in (a–d).
Figure 18.
Thematic map of author keywords is plotted with the relevance degree and the work quantity for all four time slices shown in (a–d).
Figure 19.
Steps in diabetic retinopathy detection.
Figure 19.
Steps in diabetic retinopathy detection.
Figure 20.
Image segmentation.
Figure 20.
Image segmentation.
Figure 21.
Machine learning styles for DR classification.
Figure 21.
Machine learning styles for DR classification.
Table 1.
Comparative yearly citation analysis.
Table 1.
Comparative yearly citation analysis.
| Database/Year | <2017 | 2017 | 2018 | 2019 | 2020 | 2021 | Total |
|---|
| SCOPUS Citations | 4308 | 2270 | 1322 | 793 | 768 | 88 | 9549 |
Web of Science
Citations | 3822 | 1608 | 1955 | 1930 | 926 | 248 | 10,489 |
Table 2.
List of top countries with the no. of documents and citations.
Table 2.
List of top countries with the no. of documents and citations.
| Country | No. of
Documents | No. of Citations | Total Link Strength | Avg. No. of Citations per Document |
|---|
| India | 197 | 3778 | 342 | 19.2 |
| United States | 55 | 4784 | 341 | 87 |
| China | 47 | 1382 | 196 | 29.4 |
| United Kingdom | 30 | 1271 | 145 | 42.4 |
| Australia | 20 | 324 | 81 | 16.2 |
| Pakistan | 18 | 211 | 78 | 11.7 |
| Saudi Arabia | 15 | 193 | 69 | 12.9 |
| Canada | 13 | 397 | 84 | 30.5 |
| South Korea | 12 | 287 | 74 | 23.9 |
| France | 11 | 649 | 83 | 59 |
Table 3.
No. of articles and total citations per year for the top authors.
Table 3.
No. of articles and total citations per year for the top authors.
| AUTHOR | YEAR | 2010 | 2011 | 2012 | 2013 | 2014 | 2015 | 2016 | 2017 | 2018 | 2019 | 2020 | 2021 |
|---|
| BANERJEE S | No. of articles | | | | | | | 1 | | 2 | 2 | 2 | |
| Total citations per year (TCpY) | | | | | | | 2.29 | | 3 | 5.5 | 0.33 | |
| PETO T | No. of articles | 1 | | | | | 1 | 1 | 2 | | 1 | 1 | |
| Total citations per year (TCpY) | 1 | | | | | 3.25 | 3.43 | 8.83 | | 10.3 | 0.33 | |
| LAMARD M | No. of articles | | 1 | | 1 | | | 1 | 1 | | | 1 | |
| Total citations per year (TCpY) | | 0.08 | | 20.7 | | | 4.71 | 29.7 | | | 5.33 | |
| MRIAUDEAU F | No. of articles | 1 | | | 1 | 1 | 1 | | | 1 | | | |
| Total citations per year (TCpY) | 3.54 | | | 1.2 | 8 | 4.63 | | | 1.2 | | | |
| QUELLEC G | No. of articles | | 1 | | 1 | | | 1 | 1 | | | 1 | |
| Total citations per year (TCpY) | | 0.08 | | 20.7 | | | 4.71 | 29.7 | | | 5.33 | |
| CHOWDHURY AR | No. of articles | | | | | | | 1 | | | 2 | 1 | |
| Total citations per year (TCpY) | | | | | | | 2.29 | | | 5.5 | 0 | |
| COCHENER B | No. of articles | | 1 | | | | | 1 | 1 | | | 1 | |
| Total citations per year (TCpY) | | 0.08 | | | | | 4.71 | 29.7 | | | 5.33 | |
| GOPI VP | No. of articles | | | | | | | | | | | 2 | 2 |
| Total citations per year (TCpY) | | | | | | | | | | | 10.3 | 5 |
| GUPTA S | No. of articles | | | | | | 1 | | | | 2 | 2 | 2 |
| Total citations per year (TCpY) | | | | | | 4.63 | | | | 4 | 14.7 | 0 |
Table 4.
Details of diabetic retinopathy datasets.
Table 4.
Details of diabetic retinopathy datasets.
| Dataset | No. of Fundus Images | Field-of-View | Training Set (No. of Images) | Test Set (No. of Images) | Normal | Abnormal | Lesions | Image Resolution | Data Source
Location | Annotations | Website |
|---|
| DiaretDB0 | 130 | 50° | - | - | 20 | 110 | - | - | Kuopio university hospital | - | https://www.it.lut.fi/project/imageret/diaretdb0/ |
| DiaretDB1 | 89 | 50° | 28 | 61 | 5 | 84 | 15 soft exudates, 39 microaneurysm, and 39 hemorrhages | 1500 × 1152 pixels | Kuopio university hospital | - | https://www.it.lut.fi/project/imageret/diaretdb1/index.html |
| e-Ophtha EX | 82 | 40° | - | - | 35 | 47 | 12,278 exudates | 1440 × 960 pixels to 2544 × 1696 pixels | - | Pixel level | https://www.adcis.net/en/third-party/e-ophtha/ |
| e-Ophtha MA | 381 | 40° | - | - | 233 | 148 | 1306 microaneurysms | 1440 × 960 pixels to 2544 × 1696 pixels | - | Pixel level |
| IDRiD | 516 | 50° | 413 | 103 | 164 | 81 | - | 4288 × 2848 pixels | Eye Clinic, Sushrusha Hospital Building, Nanded, (M.S.), India | Pixel level | https://ieee-dataport.org/open-access/indian-diabetic-retinopathy-image-dataset-idrid |
| Kaggle DRD | 88,702 | - | 35,126 | 53,576 | 65,343 | 23,359 | - | Different resolution | - | - | https://www.kaggle.com/competitions/diabetic-retinopathy-detection/data |
| Messidor | 1200 | 45° | - | - | 540 | 660 | - | 1440 × 960, 2240 × 1488 or 2304 × 1536 pixels | - | - | https://www.adcis.net/en/third-party/messidor/ |
| Messidor-2 | 1748 | 45° | - | - | - | - | - | 1440 × 960, 2240 × 1488 or 2304 × 1536 pixels | - | - | https://www.adcis.net/en/third-party/messidor2/ |
| DRIVE | 40 | 45° | 20 | 20 | 33 | 7 | - | 768 × 584 pixels | - | Pixel level | https://drive.grand-challenge.org/ |
| STARE | 400 | 35° | - | - | - | - | - | 605 × 700 pixels | - | - | http://cecas.clemson.edu/~ahoover/stare |
Table 5.
Image segmentation methods used in the literature.
Table 5.
Image segmentation methods used in the literature.
| Author (Year) | Publication | Dataset | Lesion | Segmentation
Technique |
|---|
| Kaur et al. (2017) [6] | Biocybernetics and Biomedical Engineering | Stare, Messidor, DiaretDB1 and e-Optha EX | EX | Threshold-based segmentation |
| Akram et al. (2014) [14] | Computers in Biology and Medicine | Messidor, Hamilton Eye Institute Macular Edema (HEI-MED) | EX | Thresholding based segmentation |
| Zhang X. et al. (2014) [15] | Medical Image Analysis | e-Ophtha EX | EX | Morphological top-hat |
| Sopharak et al. (2009) [17] | Sensors | Thammasat university hospital | EX | Fuzzy Cmeans (FCM) clustering |
| Huang C.et al. (2020) [18] | Neurocomputing | DiaretDB1, e-Ophtha EX and IDRiD | EX | Simple Linear Iterative Clustering (SLIC) |
| Wang H. et al. (2020) [28] | Computer Methods and Programs in Biomedicine | e-Ophtha, HEI-MED | EX | Morphological |
| Badgujar et al. (2019) [32] | IRBM | STARE | | Otsu’s segmentation method |
| Yadav et al. (2021) [33] | Measurement | e-Ophtha | MA | Locus detection method |
| Imani E et al. (2016) [34] | Computer Methods and Programs in Biomedicine | DiaretDB, HEI-MED and e-Ophtha | EX | Morphological Component Analysis |
| Amin et al. (2017) [35] | Journal of Computational Science | e-Ophtha, Messidor | EX | Mathematical Morphology |
| Mahendran et al. (2015) [36] | Computers & Electrical Engineering | Messidor | EX | Region based segmentation |
| Kumar S. et al. (2019) [37] | Optics & Laser Technology | Diaretdb1 and Diaretdb0 | EX | Watershed transform |
| Adem et al. (2018) [38] | Expert Systems with Applications | DiaretDB0, DiaretDB1 and DrimDB | EX | Circular Hough transform |
| Adal et al. (2013) [39] | Computer methods and programs in biomedicine | Retinopathy Online Challenge (ROC), University of Tennessee Health Science Center (UTHSC) | MA | Hessian Operator |
| Garifullin et al. (2021) [40] | Computers in biology and Medicine | IDRiD | HE, SE,
HEM, MA | Bayesian lesion segmentation |
| Xia H. et al. (2021) [41] | Knowledge-Based Systems | e-Ophtha | MA | Multiscale Residual Network (MSRNet) |
| He W. et al. (2021) [42] | Information Fusion | Private Dataset | EX, HEM | VGG-based U-Net |
Table 6.
Supervised machine learning styles used in the literature.
Table 6.
Supervised machine learning styles used in the literature.
| Author (Year) | Publication | Dataset | Lesion | Features
Extracted | Classifier |
|---|
| Zhang X. et al. (2014) [15] | Medical Image Analysis | e-Ophtha EX | EX | HCF | Random Forest |
| Wang H. et. al. (2020) [28] | Computer Methods and Programs in Biomedicine | e-Ophtha, HEI-MED | EX | HCF and Deep Features | Random Forest |
| Orlando et al. (2017) [29] | Computer Methods and Programs in Biomedicine | DIARETDB1 and e-Ophtha | MA and HEM | HCF and Deep Features | Random Forest |
| Badgujar et al. [32] | IRBM | STARE | EX | HCF | SMO-GBM classifier |
| Yadav et al. (2021) [33] | Measurement | e-Ophtha | MA | HCF | k-NN, SVM, Naive Bayes, Decision Tree, and Random Forest |
| Amin et al. (2017) [35] | Journal of Computational Science | e-Ophtha, Messidor | EX | HCF | SVM |
| Mahendran et al. (2015) [36] | Computers & Electrical Engineering | Messidor | EX | HCF | SVM, PNN |
| Shailesh et al. (2029) [37] | Optics & Laser Technology | DiaRetDB1 and DiaRetDB0 | MA, HEM | HCF | RBF NN |
| Liu et al. (2017) [43] | Computerized Medical Imaging and Graphics | e-Ophtha EX, DiaRetDB1 | EX | HCF | Random Forest |
| Du J. et al. (2020) [44] | Computer Methods and Programs in Biomedicine | e-Ophtha-MA, DiaretDB1 and ROC | MA | HCF | RUSBoost using Decision Tree Classifier |
Table 7.
Unsupervised machine learning styles used in the literature.
Table 7.
Unsupervised machine learning styles used in the literature.
| Author (Year) | Publication | Dataset | Lesion | Features
Extracted | Classifier |
|---|
| Kaur et al. (2017) [6] | Biocybernetics and Biomedical Engineering | STARE, Messidor, DiaretDB1 and e-Optha EX | EX | Shape and Intensity features | k-means |
| Akram et al. (2014) [14] | Computers in Biology and Medicine | DRIVE, STARE, DiaretDB, Messidor | MA, EX | HCF | GMM and m-Mediods based classifier |
| Sopharak et al. (2009) [17] | Sensors | Thammasat university hospital | EX | HCF | Fuzzy Cmeans (FCM) clustering |
| Huang C. et al. (2020) [18] | Neurocomputing | DiaretDB1, e-Ophtha EX and IDRiD | EX | Pixel and super pixel level features | SLIC, CNN |
Table 8.
Semi-supervised learning styles used in the literature.
Table 8.
Semi-supervised learning styles used in the literature.
| Author (Year) | Publication | Dataset | Lesion | Features Extracted | Classifier |
|---|
| Adal et al. (2014) [39] | Computer methods and programs in medicine | ROC, UTHSC | MA | Scale-Space features, SURF features, Radon features | SVM, KNN, Naïve Bayes, RF |
| Cao et al. (2018) [45] | Computerized Medical Imaging and Graphics | Messidor | MA | HCF (37) | Multi-kernel classifier |
Table 9.
Ensemble learning styles used in the literature.
Table 9.
Ensemble learning styles used in the literature.
| Author (Year) | Publication | Dataset | Lesion | Features Extracted | Classifier |
|---|
| Orlando et al. (2017) [29] | Computer Methods and Programs in Biomedicine | DIARETDB1 and e-ophtha | MA, HEM | HCF and Deep Features | Random Forest |
| Du J. et al. [44] | Computer Methods and Programs in Biomedicine | e-Ophtha-MA, DiaretDB1 and ROC | MA | HCF | Decision Tree |
| Fraz et al. (2017) [46] | Biomedical Signal Processing and Control | DIARETDB1, e-Ophtha EX, HEI-MED and Messidor | EX | HCF | Decision Tree |
| Zhang W. et al. (2019) [47] | Knowledge-Based Systems | Sichuan Provincial Peoples Hospital | EX | Deep Features | Pretrained model and Standard Deep neural network |
Table 10.
Deep learning styles used in the literature.
Table 10.
Deep learning styles used in the literature.
| Author (Year) | Publication | Dataset | Lesion | Features
Extracted | Classifier |
|---|
| Huang C. et al. (2020) [18] | Neurocomputing | DiaretDB1, e-Ophtha (EX) and IDRiD | EX | Pixel and super pixel level features | CNN |
| Wang H. et al. (2020) [28] | Computer Methods and Programs in Biomedicine | e-Ophtha, HEI-MED | EX, MA, HEM, CWS | HCF and Deep features | CNN |
| Adem et al. (2018) [38] | Expert Systems with Applications | DiaretDB0, DiaretDB1 and DrimDB | EX | Deep features | CNN |
| Xia H et al. (2021) [41] | Knowledge-Based Systems | e-ophtha | MA | Deep features | MS-EfficientNet |
| Liao (2021) [48] | Biocybernetics and biomedical engineering | ROC, e-Ophtha (MA) | MA | Deep Features | UNet |
| Sandhya et al. (2021) [49] | Materials Today: Proceedings | Kaggle dataset | EX, MA, HEM, CWS | HCF | Context unit based Deep Learning NN |
| Sambyal et al. (2020) [50] | Biocybernetics and biomedical engineering | IDRiD and e-Ophtha | EX, MA | Deep features | Modified U-Net architecture |
Table 11.
Transfer learning styles used in the literature.
Table 11.
Transfer learning styles used in the literature.
| Author (Year) | Publication | Dataset | Lesion | Features
Extracted | Classifier |
|---|
| Samanta et al. (2020) [19] | Pattern Recognition Letters | Kaggle dataset | EX | Deep Features | Inception, Xception, VGG16, ResNet-50, DenseNet and AlexNet |
| Saxena et al. (2020) [20] | Intelligence based medicine | EyePACS, Messidor1, Messidor2 | MA, HEM, EX, CWS | Deep features | Inception V3 and Inception, ResNet |
| He W. et al. (2021) [42] | Information Fusion | Private Dataset | EX | Deep features | VGG-based U-Net |
| Zhang W. et al (2019) [47] | Knowledge-Based Systems | Sichuan Provincial Peoples Hospital | EX | Deep features | InceptionV3, Xception and Inception, ResNetV2 |
| Sugeno et al. (2021) [51] | Computers in Biology and Medicine | Little flower hospital, DIARETDB, STARE, e-ophtha, ROC, Diabetic Retinopathy Dataset | MA, HEM, EX, CWS | Deep features | Inception V3 and Xception |
| Khojasteh et al. (2018) [52] | Computers in Biology and Medicine | DiaretDB1, e-Ophtha EX | EX | Deep Features | ResNet50 |
Table 12.
Performance metrics achieved by various authors.
Table 12.
Performance metrics achieved by various authors.
| Author (Year) | Lesion | Accuracy | Sensitivity | Specificity | Precision | Recall | F1-Score | AUC | Cohen’s Kappa Score |
|---|
| Akram et al. (2014) [14] | EX | Messidor: 97.59%,
DRIVE: 94.03%, STARE: 97.89%, DiaretDB0: 92.96% | Messidor: 97.61%, DRIVE: 94.26%, STARE: 98.79%, DiaretDB0: 93.08% | Messidor: 97.03%,
DRIVE: 94.74%, STARE:97.43%, DiaretDB0: 92.76% | - | - | - | - | - |
| Zhang X et al. (2014) [15] | EX | - | - | - | - | - | - | e-optha EX: 0.95 | - |
| Sopharak et al. (2009) [17] | EX | Private dataset: 99.11% | Private dataset: 87.28% | Private dataset: 99.24% | Private dataset: 42.77% | - | - | - | - |
| Huang et al. (2020) [18] | HE | e-ophtha:
97.58%,
IDRiD:
98.19% | e-Ophtha:
97.96%, IDRiD:
98.40% | e-Ophtha:
90.84%, IDRiD:
90.67% | - | - | - | e-Ophtha:
0.9682, IDRiD:
0.9674 | - |
| Samanta et al. (2020) [19] | HEM, MA | - | - | - | - | - | - | - | Kaggle dataset: 0.8836 |
| Saxena et al. (2020) [20] | All | - | Messidor:
88.84%, Messidor-2:
81.02% | Messidor:
89.92%, Messidor-2:
86.09% | - | - | - | Messidor:
0.958, Messidor-2:
0.92 | - |
| Wang H. et al. (2020) [28] | HE | - | - | - | - | - | e-Ophtha:
0.8929,
HEI-MED:
0.9326 | e-Ophtha:
0.9644, HEI-MED:
0.9323 | - |
| Orlando et al. (2017) [29] | MA | - | Messidor: 0.9109 | - | - | - | - | Messidor: 0.8932 | - |
| Imani et al. (2016) [34] | EX | - | DiaretDB0: 89.01%, HEI-MED:
81.26%,
e-Ophtha:
80.32% | DiaretDB0: 99.93%, HEI-MED:
99.81%,
e-Ophtha:
99.83% | DiaretDB0: 82.64%, HEI-MED:
63.57%,
e-Ophtha:
77.28% | - | - | DiaretDB: 0.961,
HEI-MED: 0.948,
e-Ophtha: 0.937 | - |
| Amin et al. (2017) [35] | EX | Seven publicly available dataset: 98.58% | - | - | - | - | - | Seven publicly available dataset: 0.98 | - |
| Mahendran et al. (2015) [36] | MA | Messidor: 97.89% | Messidor: 98.68% | Messidor: 100% | - | - | - | - | - |
| Garifullin et al. (2021) [40] | All | - | - | - | - | - | - | IDRiD: 0.84 | - |
| Liu et al. (2016) [43] | EX | - | e-Optha EX: 76% | - | e-Optha EX: 75% | - | e-Optha EX: 76% | - | - |
| Fraz et al. (2017) [46] | EX | DiaretDB1:
0.87,
e-Ophtha (EX):
0.89,
HEI-MED:
0.95,
Messidor:
0.98 | - | - | - | - | - | DiaretDB1:
0.9310,
e-Ophtha:
0.9403,
HEI-MED:
0.9842,
Messidor:
0.9996 | - |
| Zhang W. et al. (2019) [47] | All | - | - | - | Private dataset: 0.97 | Private dataset: 0.98 | Private dataset: 0.97 | - | - |
| Khojasteh et al. (2018) [52] | EX | DiaretDB1:
98.2%,
e-Ophtha:
97.6% | DiaretDB1:0.99,
e-Ophtha:
0.98 | DiaretDB1:
0.96,
e-Ophtha:
0.95 | - | - | - | - | - |
| Sugeno et al. (2021) [51] | All | DiaretDB1: 0.842 | DiaretDB1: 0.985 | DiaretDB1: 0.988 | - | - | - | - | - |
| Gayathri et al. (2020) [53] | All | Three publicly available dataset: 99.89% | - | - | - | - | - | - | Three publicly available dataset: 0.994 |
| Deepa et al. (2021) [54] | All | Private dataset: 96.20% | - | - | - | - | - | - | - |
| Publisher’s Note: MDPI stays neutral with regard to jurisdictional claims in published maps and institutional affiliations. |
© 2022 by the authors. Licensee MDPI, Basel, Switzerland. This article is an open access article distributed under the terms and conditions of the Creative Commons Attribution (CC BY) license (https://creativecommons.org/licenses/by/4.0/).

 ,
, 


