
An Advanced Big Data Quality Framework Based on Weighted Metrics


Abstract
:1. Introduction
- Extending the number of the measured dimensions by defining four new data quality metrics: Integrity, Accessibility, Ease of manipulation, and Security.
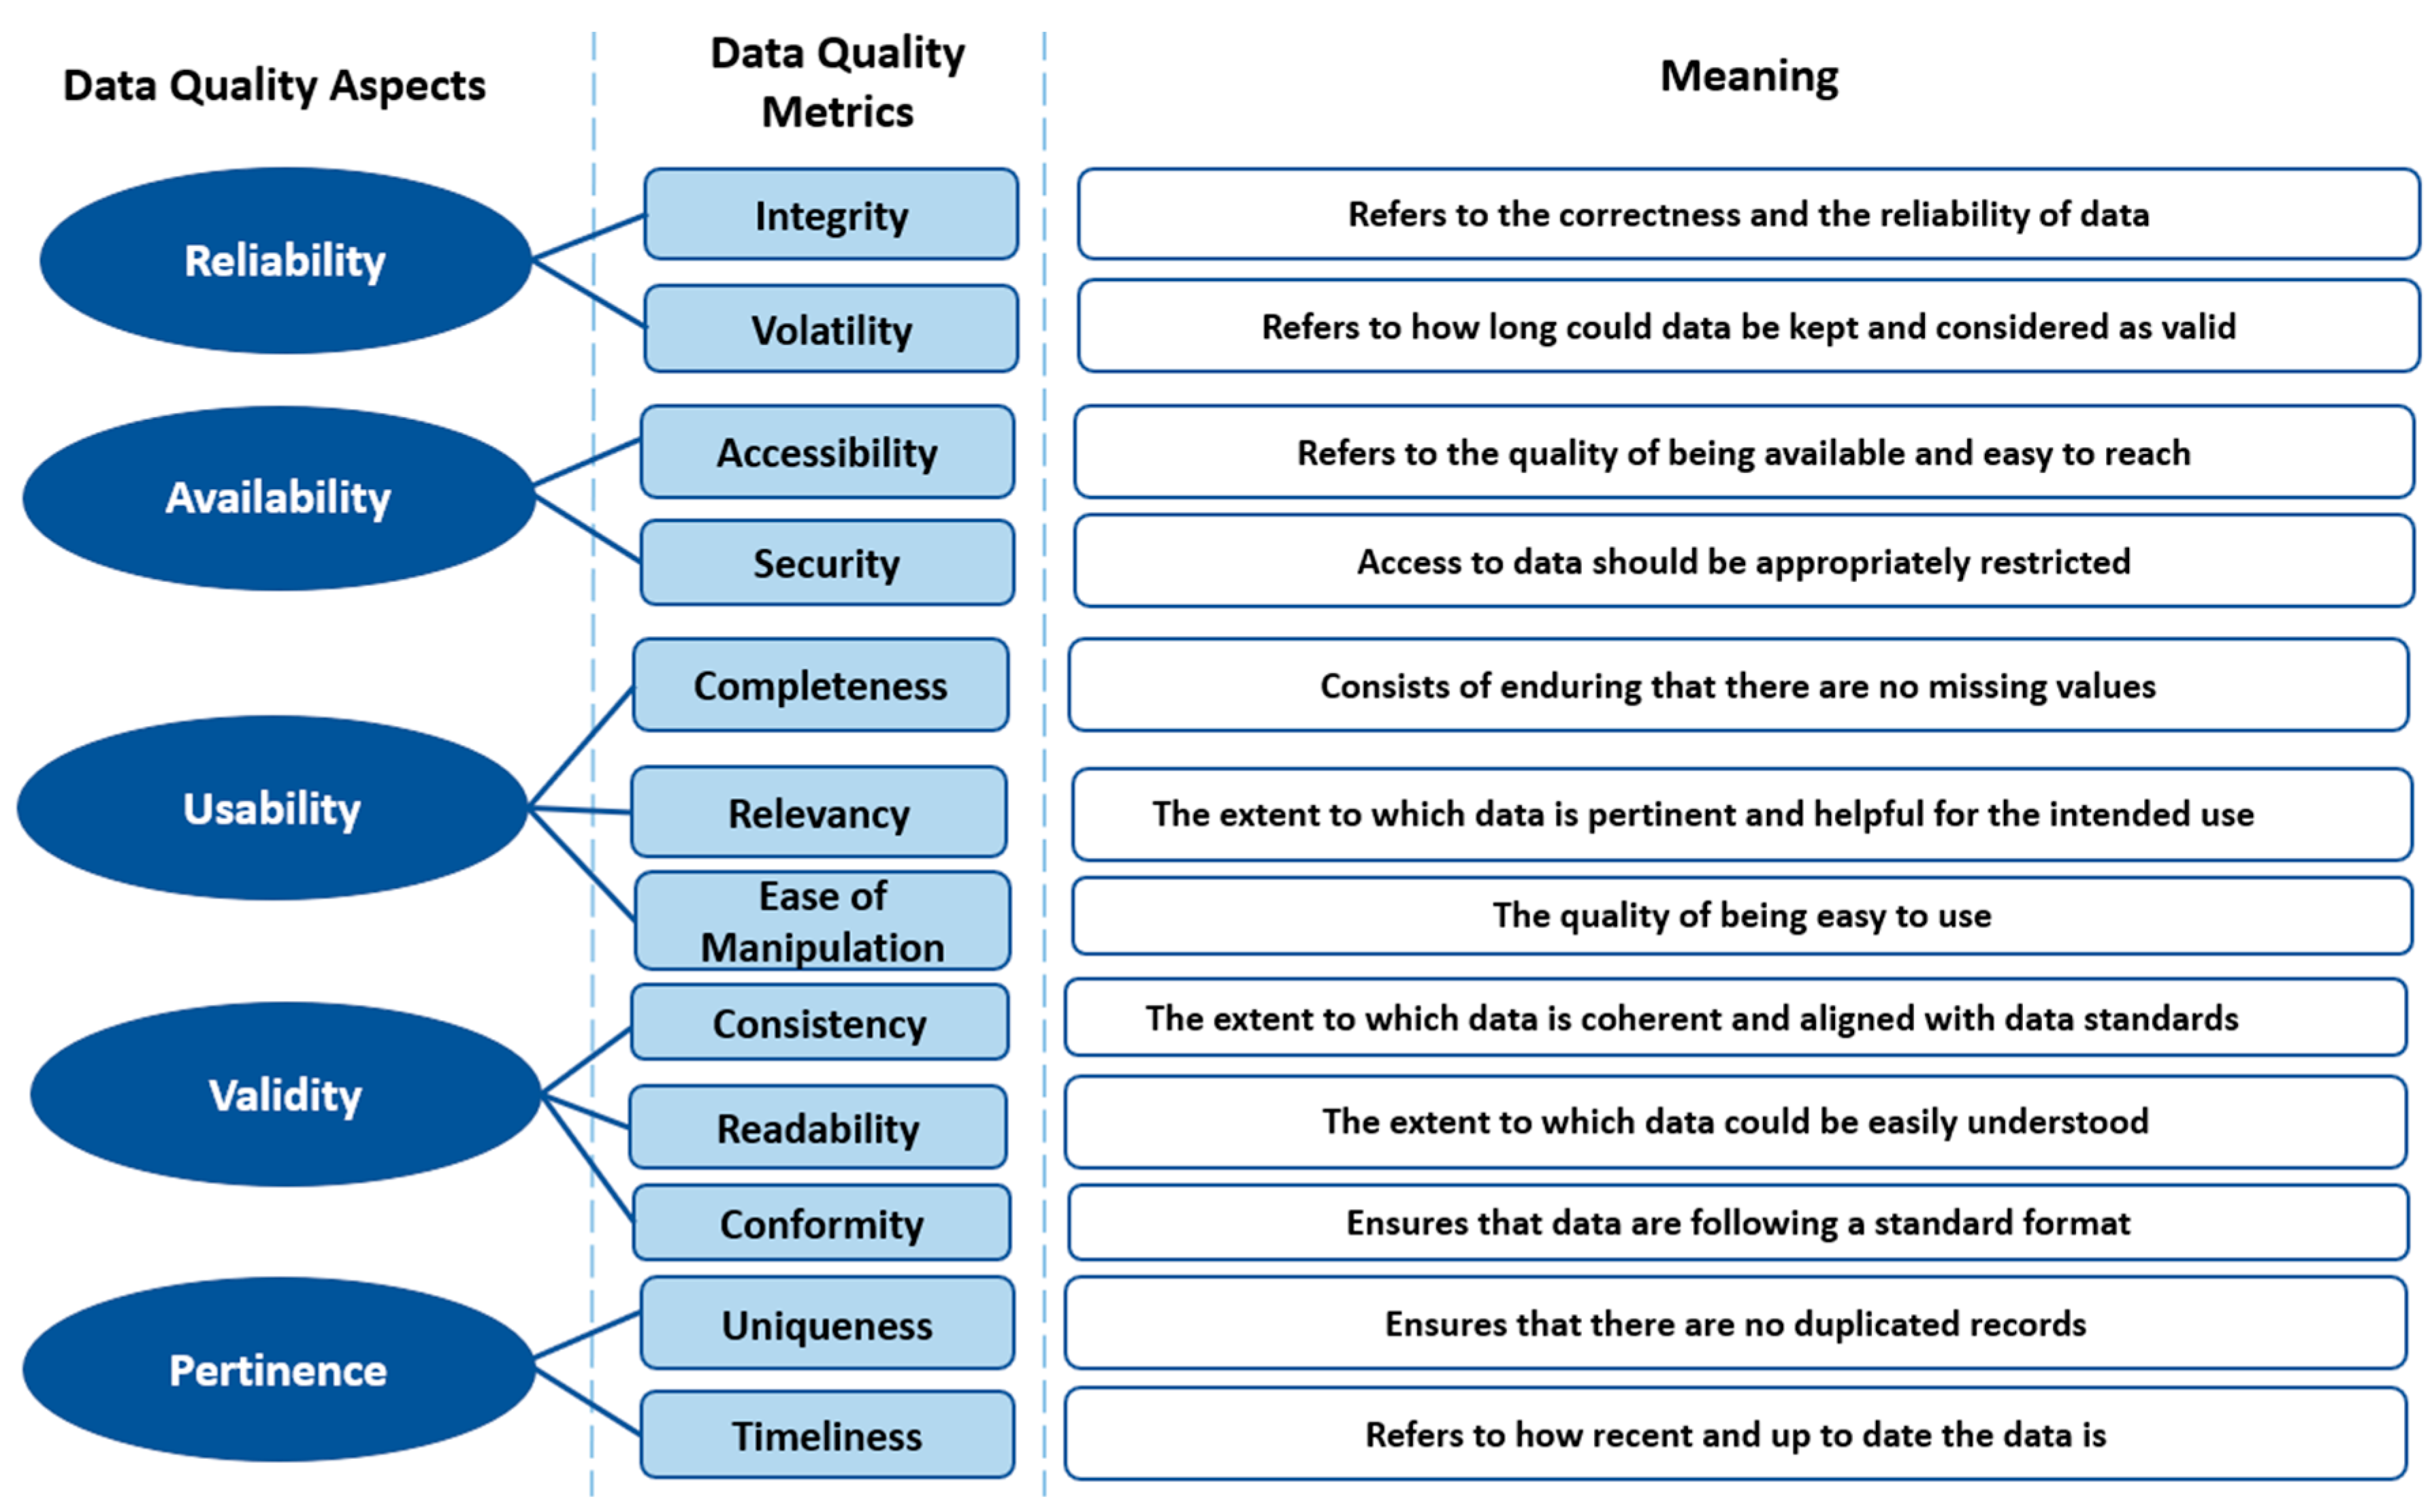
- Defining a comprehensive Big Data Quality Assessment Framework based on 12 metrics: Completeness, Timeliness, Volatility, Uniqueness, Conformity, Consistency, Ease of manipulation, Relevancy, Readability, Security, Accessibility, and Integrity.
- Improving the precision of the measures by considering the weights of data fields, data quality metrics, and aspects.
- Providing a macro-view of Big Data Quality by defining and measuring five quality aspects: Reliability, Availability, Usability, Pertinence, and Validity.
2. The Big Importance of BDQM for Big Data Use Cases
- Provide measurable insights into data quality: Assessing data quality metrics provides excellent insights into the health of data and, thus, allows data managers to better anticipate and address quality issues. In a big data environment where data is exposed to continuous changes, such as preprocessing and analysis, it is essential to diagnose the quality state of data using BDQM to assess the impact of the performed changes on data quality [12].
- Lead to further data quality enhancement: Assessing BDQM allows locating data quality weaknesses and addressing them effectively. A recent study [13] investigating the impact of data quality on business has shown that less than 50% of companies are confident in their internal data quality, and only 15% are satisfied with the data provided by third parties. These numbers reveal the criticality of the issue of data quality, especially when companies rely mainly on data to make their business decisions.
- Identify data quality defects: Sometimes, the interest in measuring metrics is not necessarily to address them but to be aware of them. Indeed, data may contain hidden weaknesses that data managers do not even realize. This may severely impact the rest of the data value chain, as fuzzy data lead to fuzzy and inaccurate results. A study [14] performed to assess the impact of BDQM using sentiment analytical approaches for big data has shown that ignoring big data quality metrics entirely biases the prediction results with a sentiment analytical accuracy of 32.40%; thus, this study concludes that not considering the quality metrics for big data has a powerful influence on the predicted results.
- Separate high-quality data from low-quality data: This will allow the processing of data differently depending on the quality level. This approach is time- and cost-effective, especially in big data environments where data preparation is the most complex and critical part of data processing.
- What are the data quality metrics defined in the literature?
- Given the large gap between the defined dimensions and the measured dimensions, do existing metrics really cover all of the data quality aspects?
- Are there any big data quality requirements that need to be captured in terms of quality metrics?
- Are there any new metrics introduced in the literature that fit big data requirements?
- How could big data quality assessment be enhanced in terms of accuracy and precision?
- How could big data quality assessment be enhanced in terms of exhaustivity?
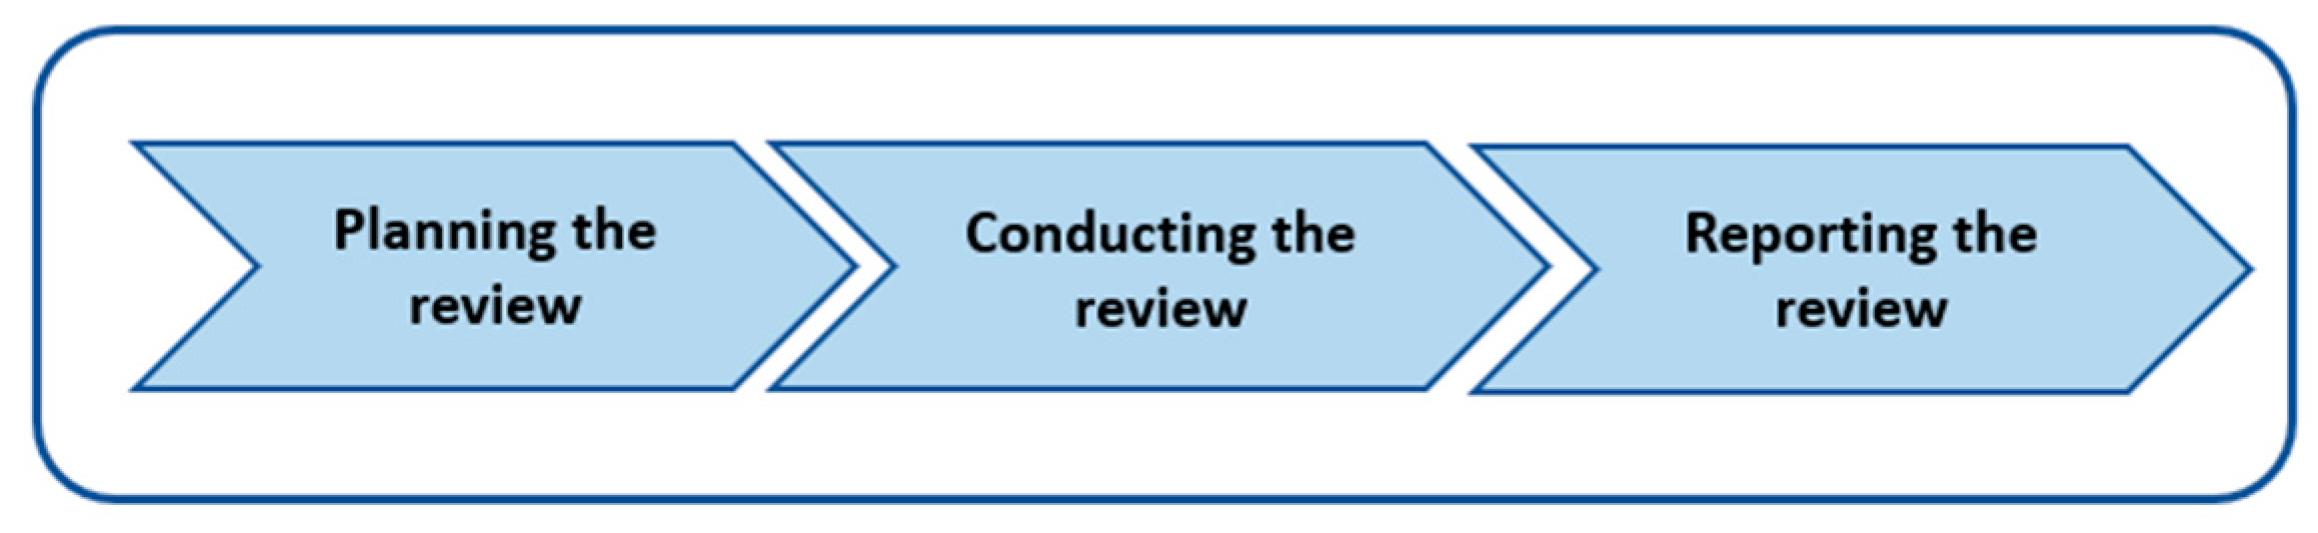
3. Research Methodology
3.1. Planning the Review
Aim and Scope
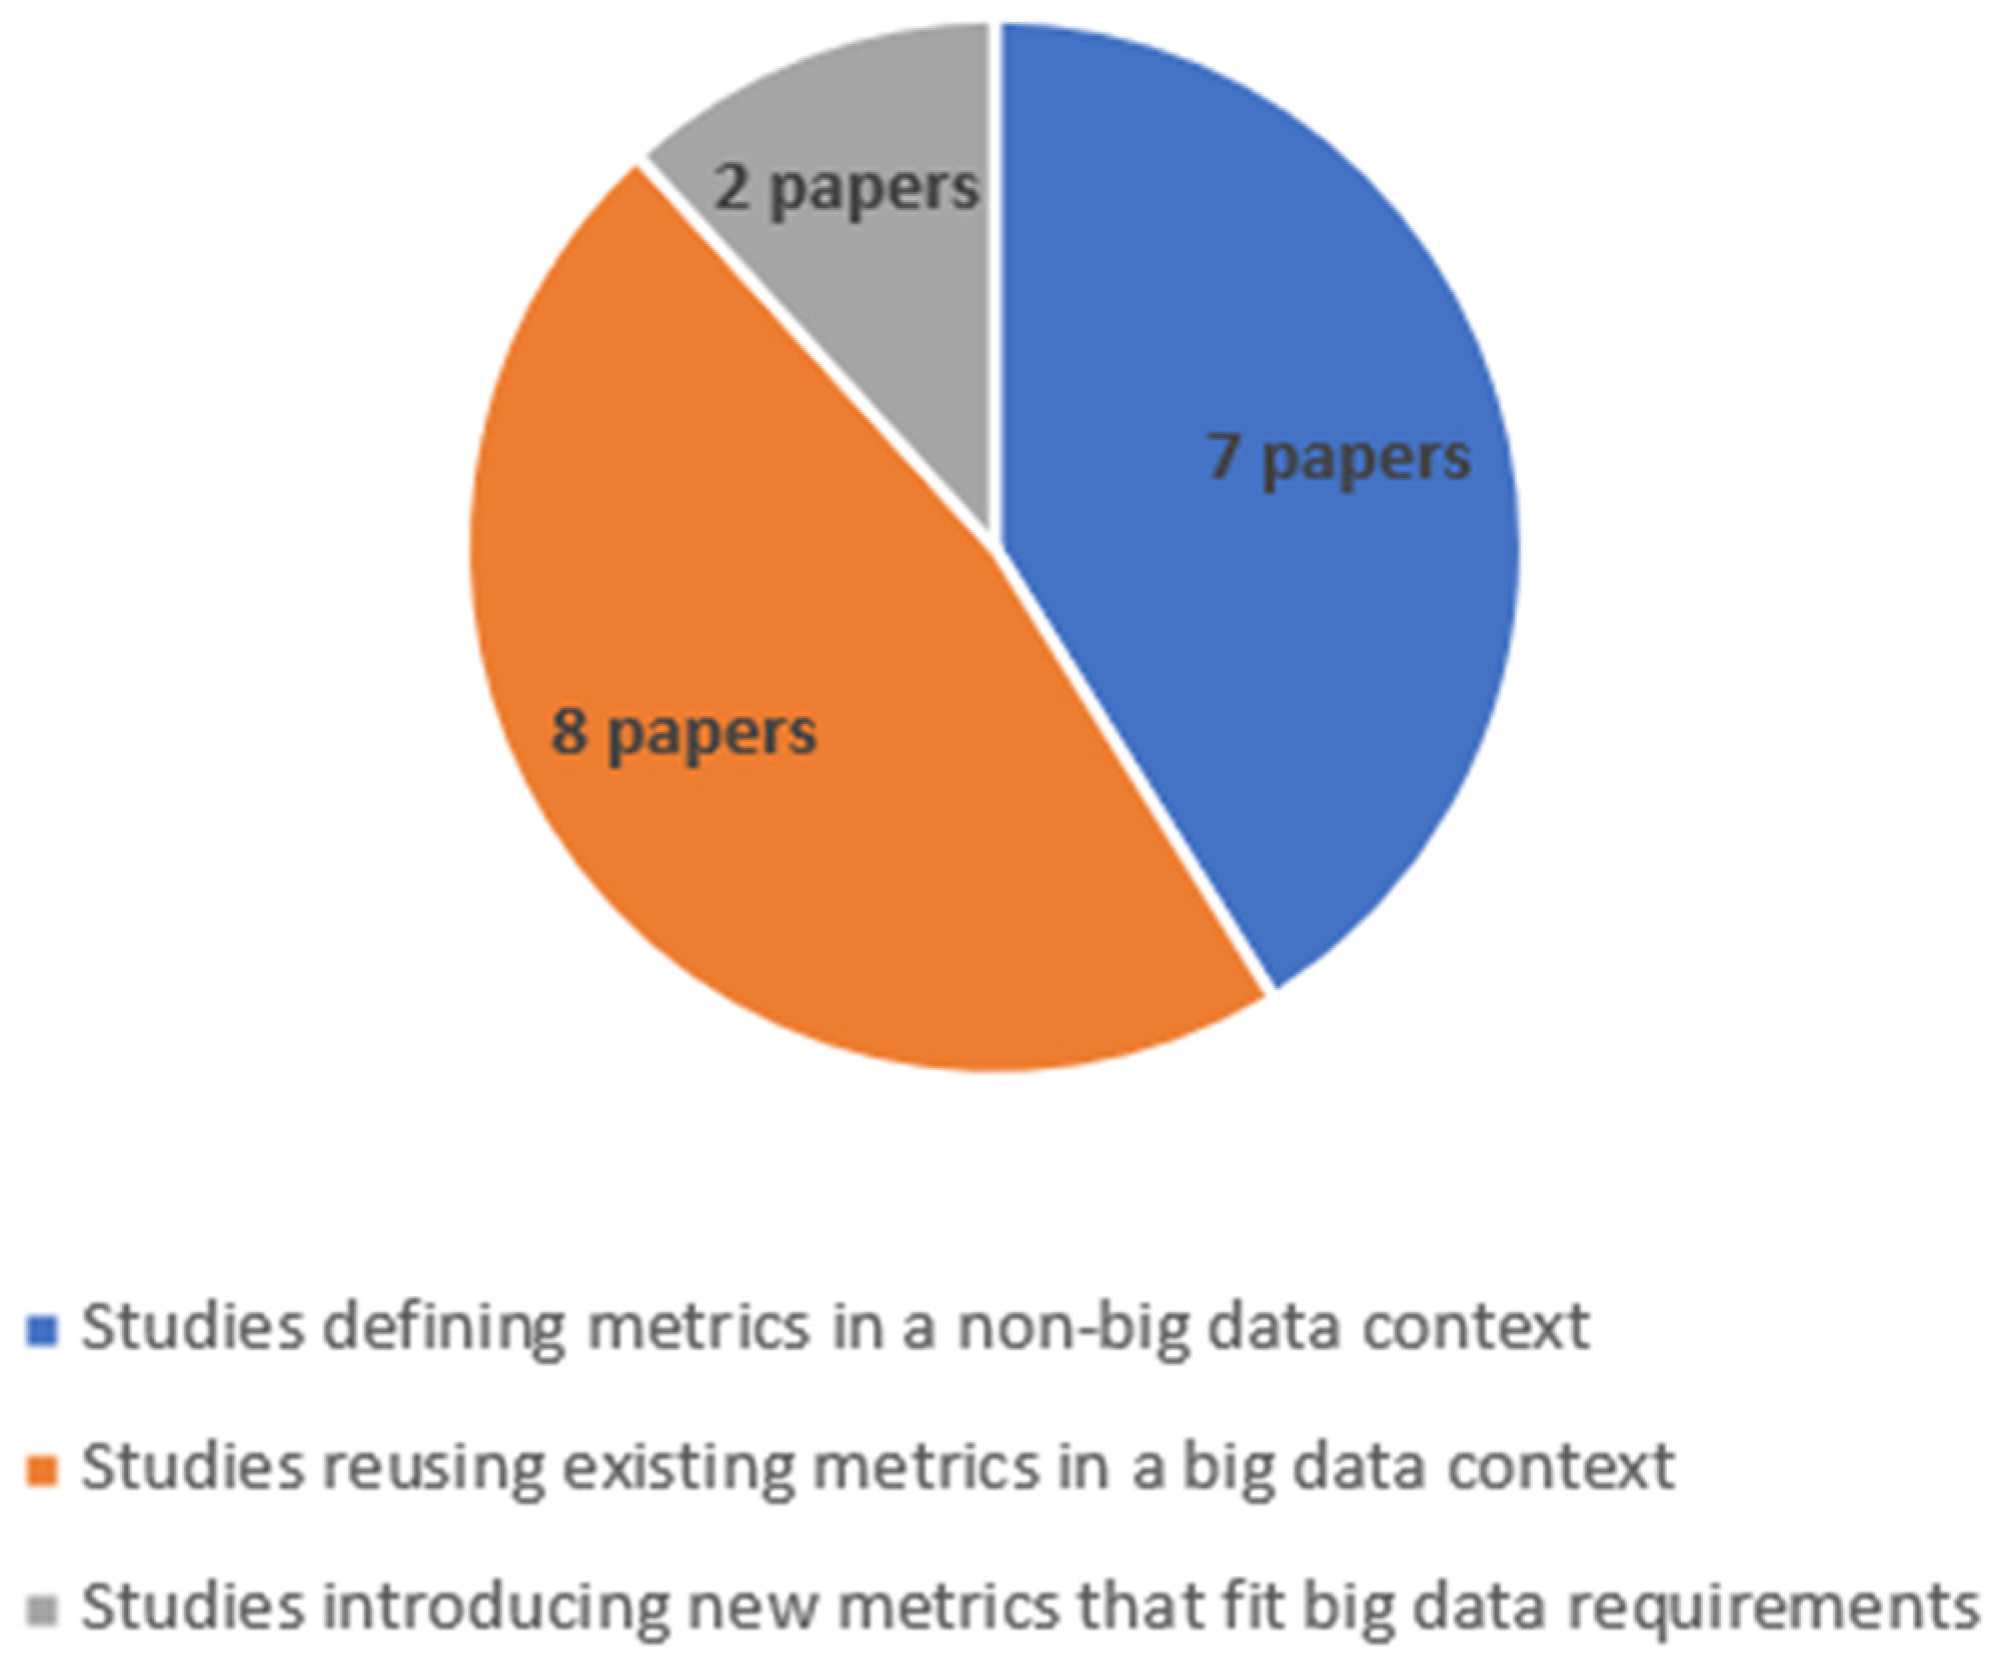
- Studies that have defined new data quality metrics or used existing metrics in a big data context.
- Studies that have defined new quality metrics in non-big data context (small datasets).
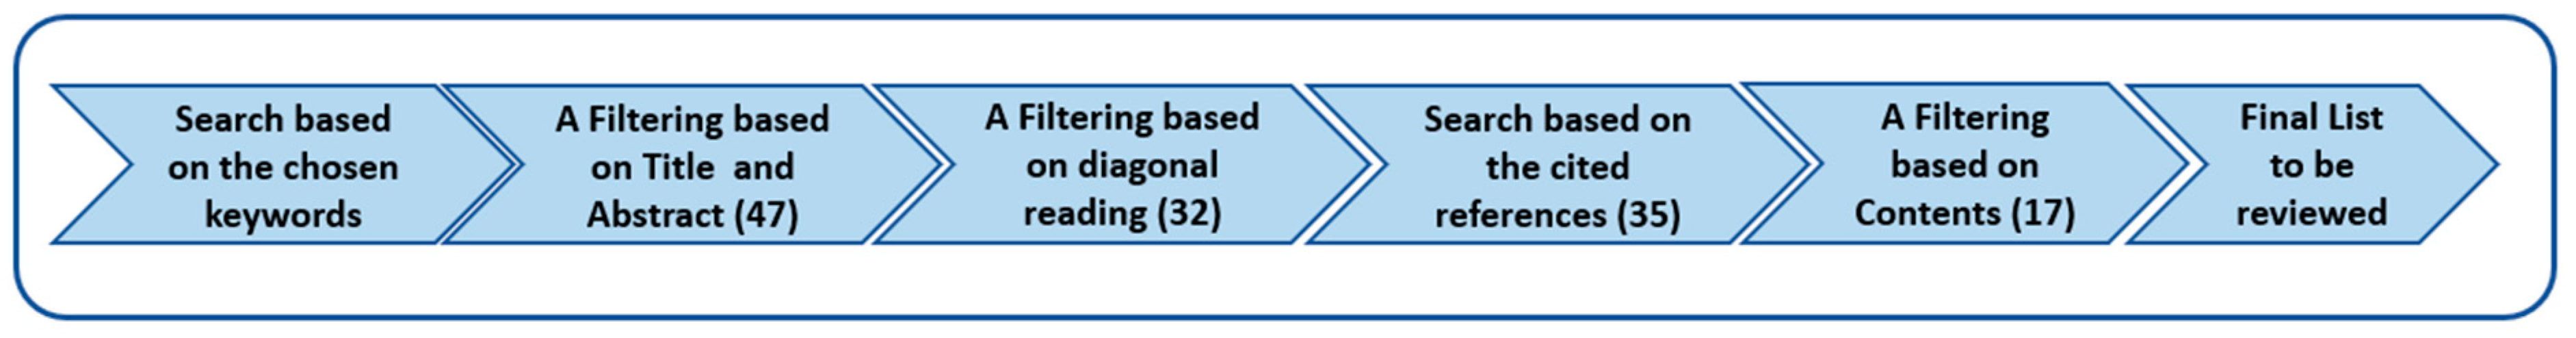
3.2. Conducting the Review
3.2.1. Research Keywords
3.2.2. Digital Libraries
- Springer (http://www.springer.com/gp/ (accessed on 23 September 2021))
- IEEE Xplore (http://ieeexplore.org/ (accessed on 23 September 2021))
- Scopus (https://www.scopus.com/ (accessed on 23 September 2021))
- Science Direct (http://www.sciencedirect.com/ (accessed on 23 September 2021))
- Research Gate (https://www.researchgate.net/ (accessed on 23 September 2021))
3.2.3. Inclusion and Exclusion Criteria
- Defining new data quality metrics or using the existing quality metrics in a big data context.
- Available in the digital libraries.
- Recent (from 2015 to 2022).
- Written in English.
3.3. Reporting the Review
4. Related Work
- In a big data context, ensuring data quality requires a specific and in-depth study that could not be limited to a few metrics. Indeed, while the number of metrics considered by the existing approaches does not exceed 11 metrics, more than 50 dimensions have been defined in the literature.
- Despite the high impact of data weights on the accuracy of measurements, most existing studies do not consider the weight of data elements when measuring data quality.
- Even if some studies have proposed classifications of the data quality dimensions, no studies have measured the quality aspects.
5. Big Data Quality Aspects and Metrics
5.1. Big Data Quality Aspects
- Contextual: Refers to the context of use of data and points to the extent to which data are pertinent to the intended use.
- Representational: Data should be represented in a readable and understandable format.
- Intrinsic: Implies that data values are accurate and in conformance with real world values.
- Accessibility: Data should be available and reachable in an appropriate way by data consumers.
- Reliability: Refers to the trustworthiness and credibility aspect of data
- Availability: Refers to the accessibility and shareability of data while maintaining the appropriate level of data security.
- Usability: Refers to the relevancy and the ease of use of data.
- Validity: Assures that data conform to a specific format and comply with the defined business rules.
- Pertinence: Refers to what make data appropriate and suitable for the context of use.
5.2. Big Data Quality Metrics
5.2.1. Completeness
5.2.2. Uniqueness
5.2.3. Consistency
5.2.4. Conformity
5.2.5. Timeliness
5.2.6. Volatility
5.2.7. Readability
5.2.8. Ease of Manipulation
5.2.9. Relevancy
5.2.10. Security
- Is there a security policy restricting data use? (20%)
- Are security protocols used for data transfer? (20%)
- Are there measures for threat detection? (20%)
- Are data appropriately encrypted? (20%)
- Is there a security documentation that accompanies the data? (20%)
5.2.11. Accessibility
5.2.12. Integrity
5.3. Weighted Quality Metrics
- 1-
- Email.
- 2-
- Phone Number.
- 3-
- Address.
- 4-
- City and Country.
- 5-
- First name, Last Name, and Age.
- Data Fields: The data attributes are of varying relevancy and, thus, should have different weights when measuring a quality metric.
- Quality Dimensions: The quality metrics are of varying relevancy and, thus, should have different weights when measuring a quality aspect.
- Quality Aspects: The quality aspects are of varying relevancy and, thus, should have different weights when measuring the global quality score.
6. Implementation
6.1. Dataset Description
6.2. Tools
- Apache SPARK 3.1.2, a big data processing system used to handle large datasets.
- Python 3.8.8
- Jupiter Notebook 6.3.0, a web-based computing platform that serves as a development environment.
- Great Expectation Package [40], a python library that offers multiple functions for validating and profiling data. The library is open-source and appropriate for large datasets (scalable).
- Scientific Python libraries, such as Numpy, Spell Checker, Matplotplib, Pandas, Scipy, and Datetime.
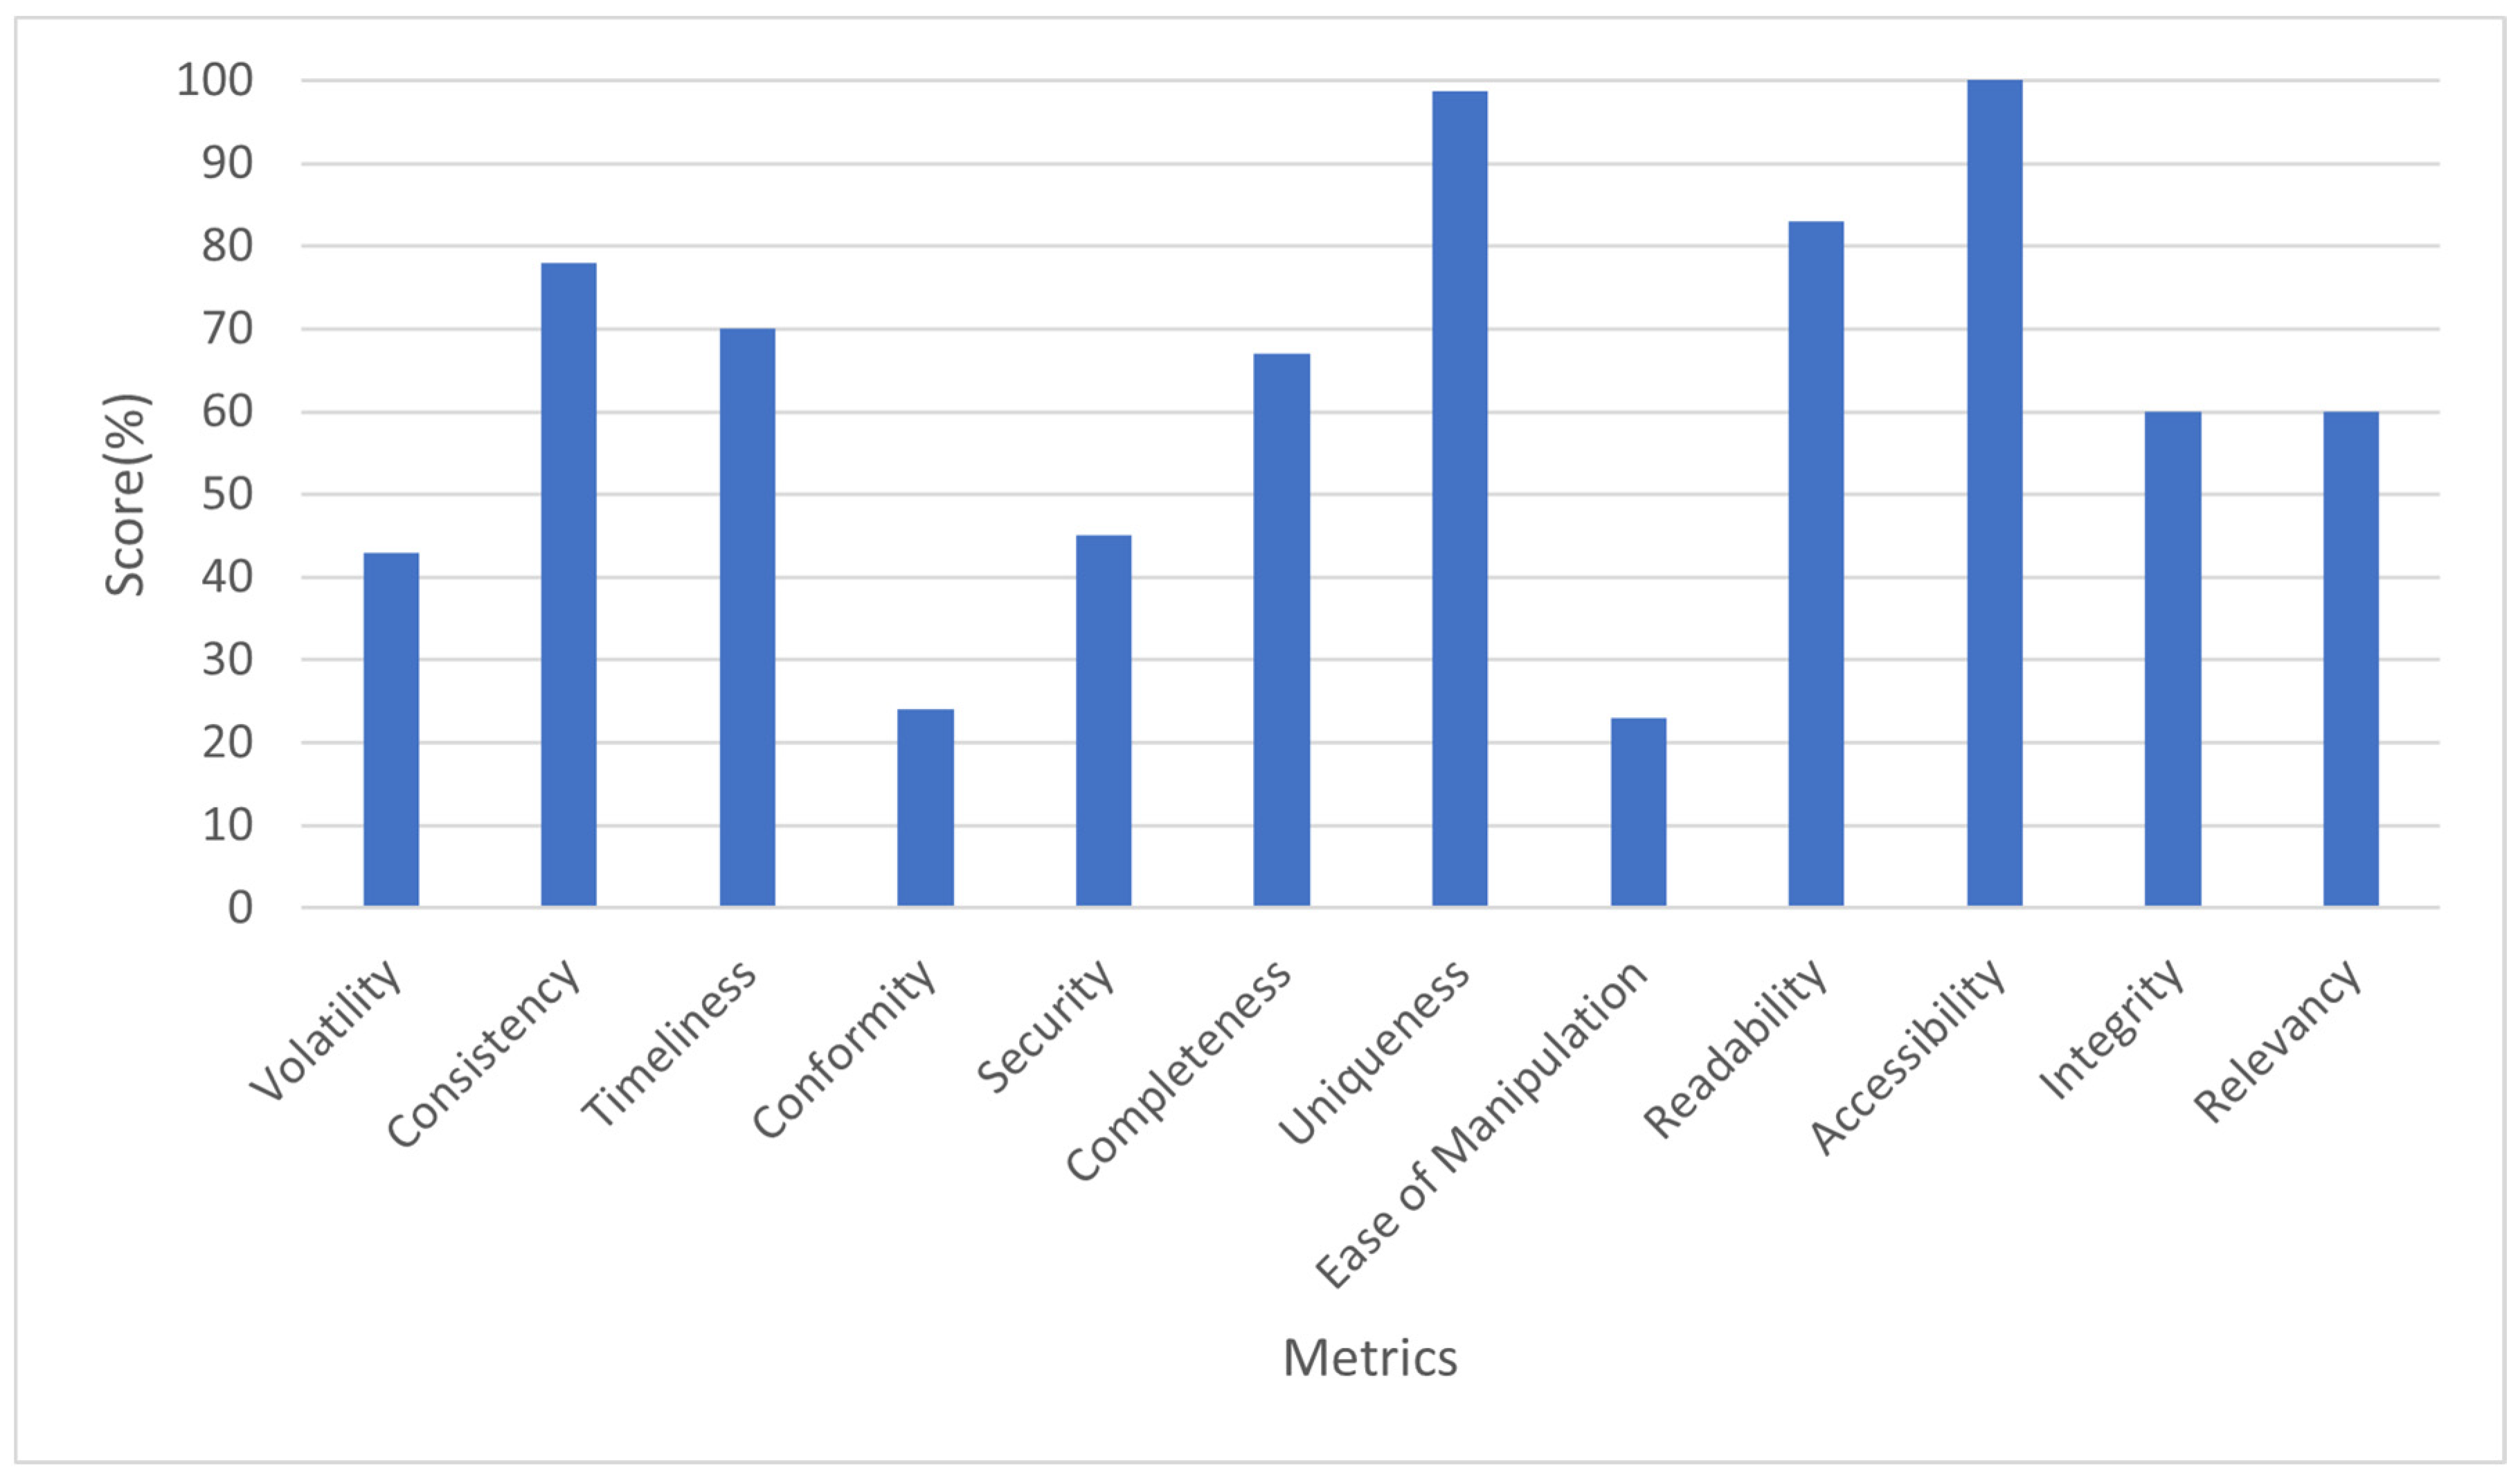
6.3. Results
- Measuring the following quality metrics: Completeness, Timeliness, Volatility, Uniqueness, Conformity, Consistency, Ease of manipulation, Relevancy, Security, Readability, Accessibility, and Integrity, while considering the attribute weights in Table 7.

| Tweet | Language | Country | Creation Date Time | Last Modification Date Time |
|---|---|---|---|---|
| 0.4 | 0.15 | 0.15 | 0.15 | 0.15 |
| Reliability | Availability | Pertinence | |||
|---|---|---|---|---|---|
| Integrity | Volatility | Security | Accessibility | Timeliness | Uniqueness |
| 0.7 | 0.3 | 0.8 | 0.2 | 0.7 | 0.3 |
| Validity | Usability | ||||
|---|---|---|---|---|---|
| Consistency | Conformity | Readability | Completeness | Relevancy | Ease of Manipulation |
| 0.4 | 0.4 | 0.2 | 0.5 | 0.3 | 0.2 |
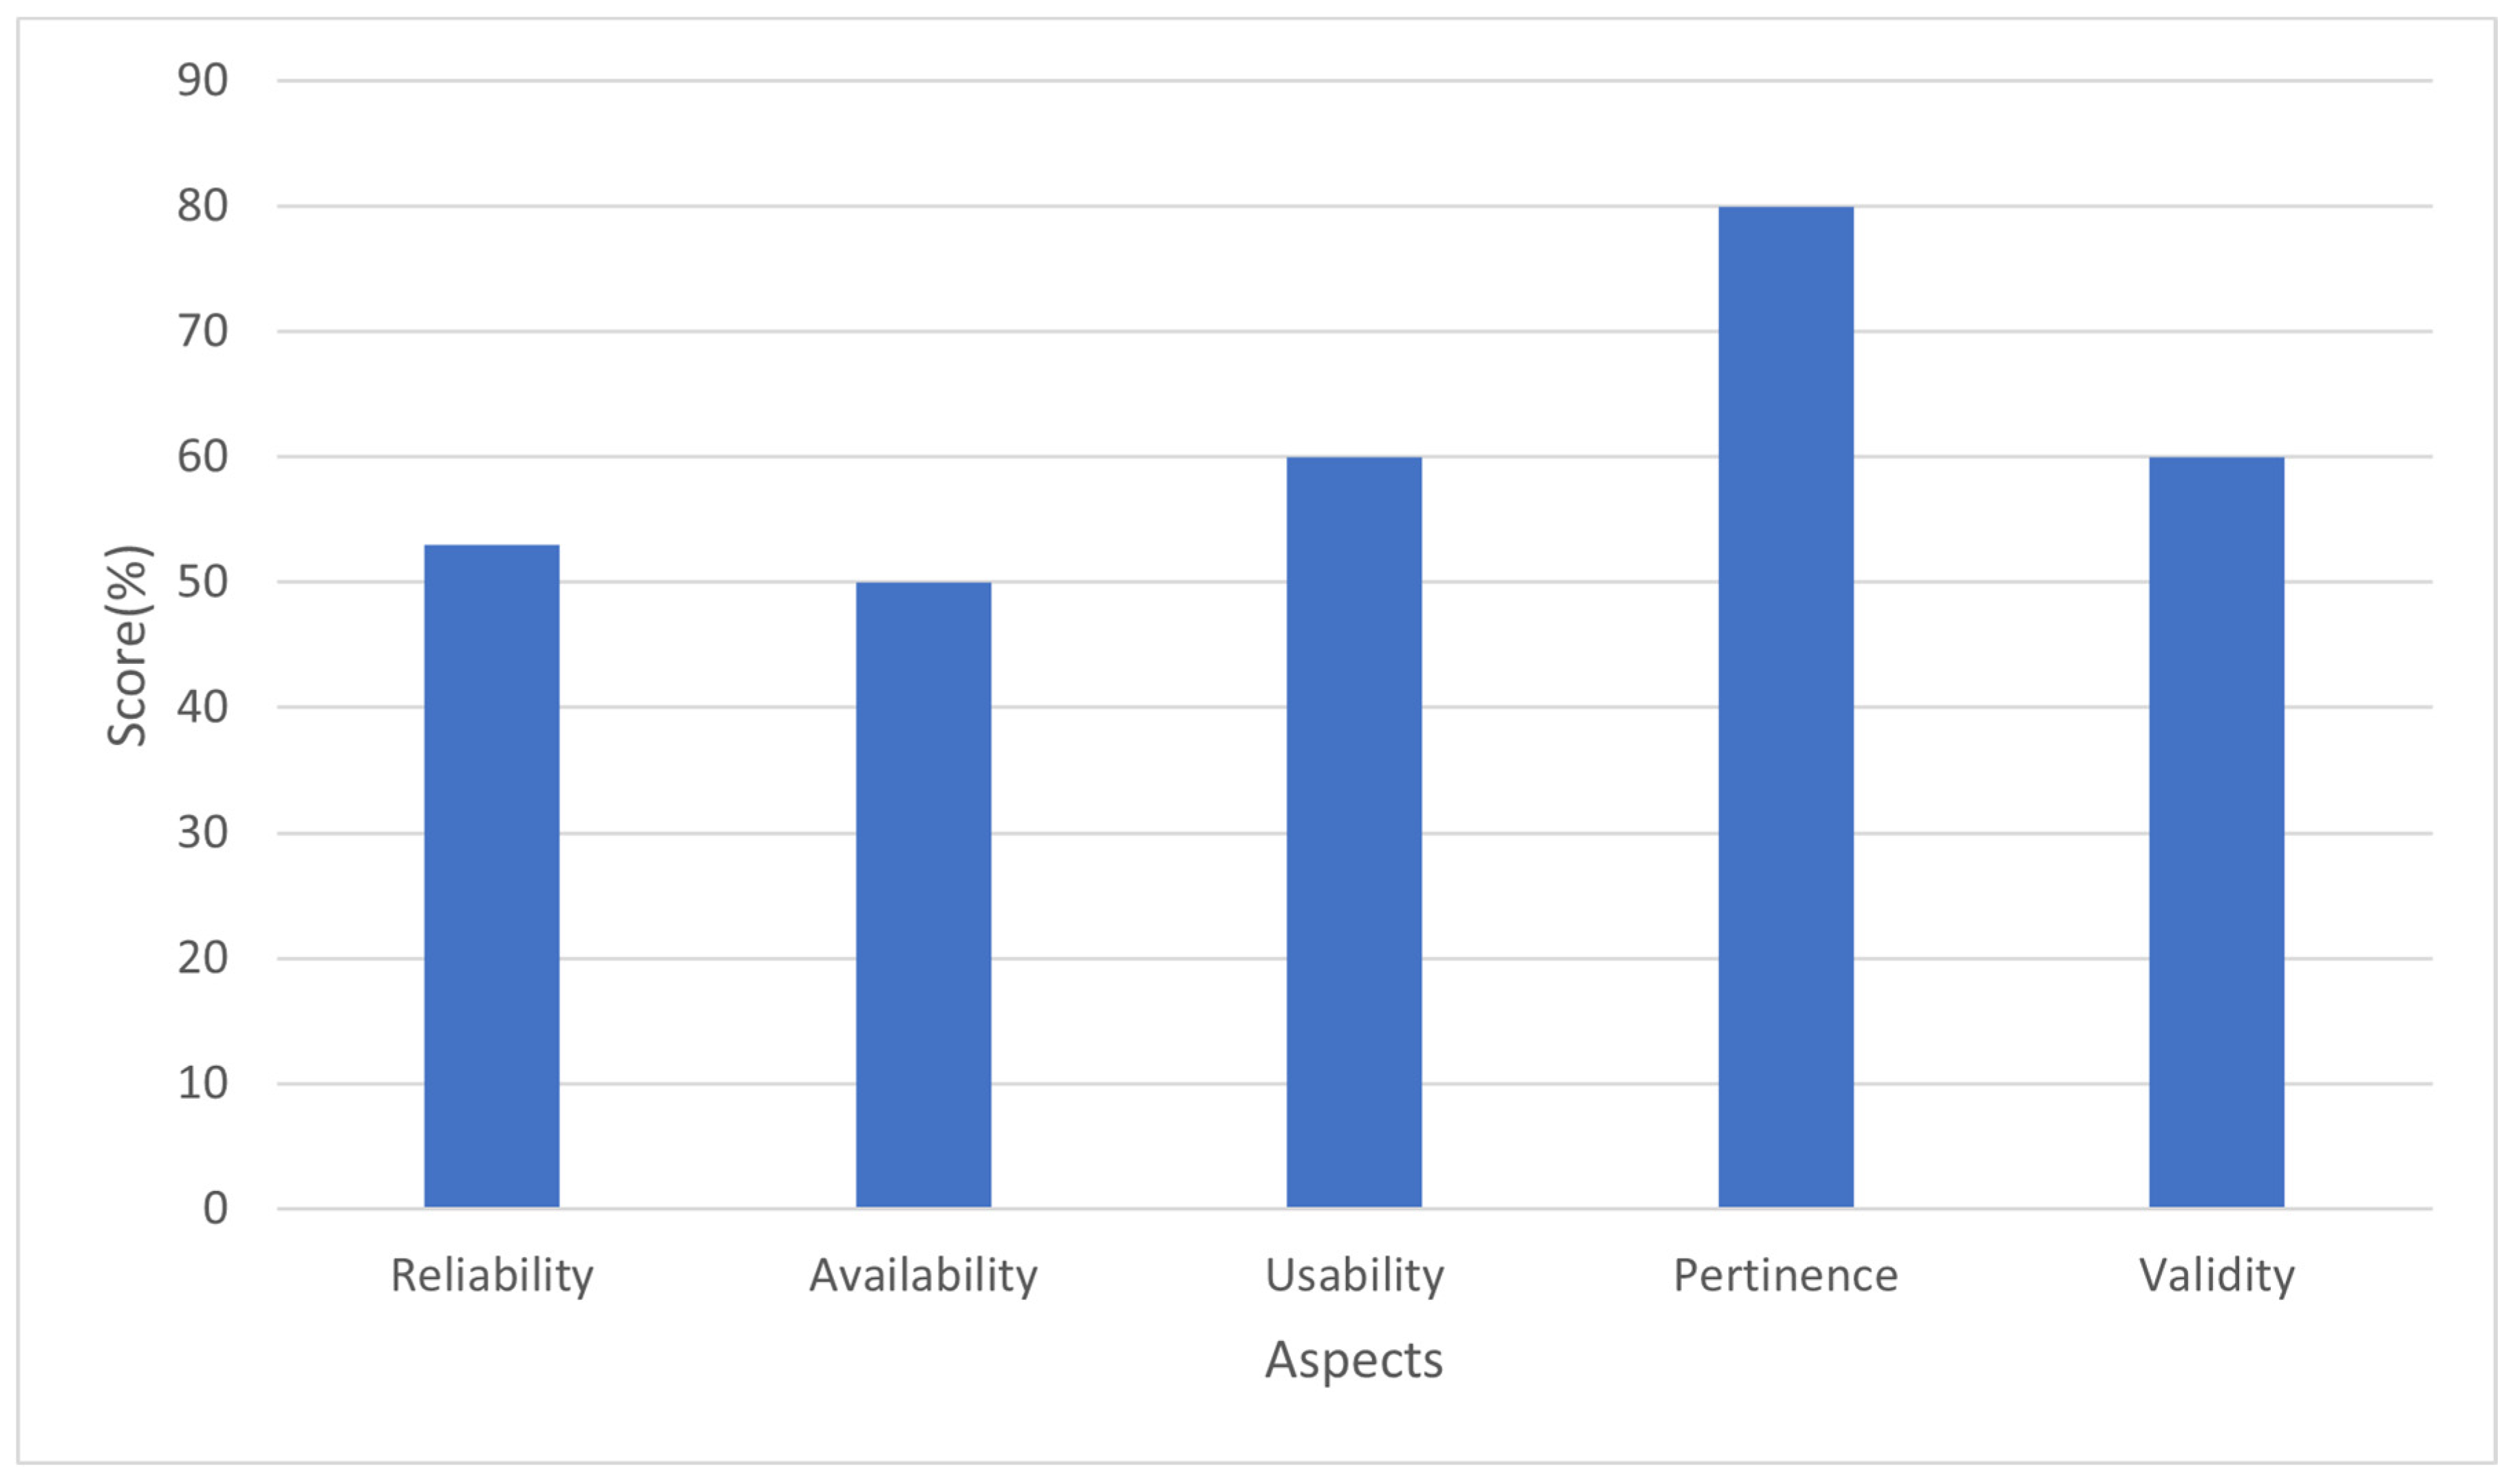
- Measuring a weighted data quality score while considering the aspect weights in Table 10
| Reliability | Availability | Pertinence | Validity | Usability |
|---|---|---|---|---|
| 0.3 | 0.1 | 0.1 | 0.3 | 0.2 |
6.4. Comparative Study
6.4.1. Framework Model
- We provided a data quality definition, so D = 1.
- We proposed a new quality model based on 12 metrics and 5 quality aspects, so M = 1.
- We defined 12 evaluation metrics, so Mt = 1.
- We did not conduct polling, so P = 0.
- We outlined the state of the art, so A = 1.
- We conducted a simulation, so S = 1.
- We proposed an assessment framework providing a weighted data quality score, so F = 1.
6.4.2. Used Existing Metrics
6.4.3. New Metrics
6.4.4. Scope and Precision
6.4.5. Discussion
- Big data must be preprocessed before any use, as the gathered data are usually not consistent and of low quality.
- Considering data weights is mandatory for an accurate and significant assessment.
- Data managers should be aware of the dependencies between data quality metrics as improving a quality dimension may degrade the other ones.
- The quality assessment should be performed in each stage of the BDVC as every change in the data may degrade data quality.
- There is still a great need to implement new metrics especially for big data.
- Some metrics, such as Relevancy and Accessibility, need to be defined using generic and non-context-aware approaches [42].
7. Conclusions and Future Work
Author Contributions
Funding
Data Availability Statement
Conflicts of Interest
Abbreviations
References
- Elouataoui, W.; Alaoui, I.E.; Gahi, Y. Data Quality in the Era of Big Data: A Global Review. In Big Data Intelligence for Smart Applications; Baddi, Y., Gahi, Y., Maleh, Y., Alazab, M., Tawalbeh, L., Eds.; Springer International Publishing: Cham, Switzerland, 2022; pp. 1–25. [Google Scholar] [CrossRef]
- Li, Y.; Yang, J.; Zhang, Z.; Wen, J.; Kumar, P. Healthcare Data Quality Assessment for Cybersecurity Intelligence. IEEE Trans. Ind. Inform. 2022, 19, 841–848. [Google Scholar] [CrossRef]
- Elouataoui, W.; El Alaoui, I.; Gahi, Y. Metadata Quality Dimensions for Big Data Use Cases. In Proceedings of the International Conference on Big Data, Modelling and Machine Learning (BML), Kenitra, Morocco, 6 August 2022; pp. 488–495. [Google Scholar] [CrossRef]
- Kapil, G.; Agrawal, A.; Khan, R.A. A study of big data characteristics. In Proceedings of the 2016 International Conference on Communication and Electronics Systems (ICCES), Coimbatore, India, 21–22 October 2016; pp. 1–4. [Google Scholar] [CrossRef]
- Faroukhi, A.Z.; El Alaoui, I.; Gahi, Y.; Amine, A. An Adaptable Big Data Value Chain Framework for End-to-End Big Data Monetization. Big Data Cogn. Comput. 2020, 4, 34. [Google Scholar] [CrossRef]
- Faroukhi, A.Z.; El Alaoui, I.; Gahi, Y.; Amine, A. Big data monetization throughout Big Data Value Chain: A comprehensive review. J. Big Data 2020, 7, 3. [Google Scholar] [CrossRef]
- Juddoo, S. Overview of data quality challenges in the context of Big Data. In Proceedings of the 2015 International Conference on Computing, Communication and Security (ICCCS), Pointe aux Piments, Mauritius, 4–5 December 2015; pp. 1–9. [Google Scholar] [CrossRef]
- Eouataoui, W.; El Alaoui, I.; Gahi, Y. Metadata Quality in the Era of Big Data and Unstructured Content. In Advances in Information, Communication and Cybersecurity; Maleh, Y., Alazab, M., Gherabi, N., Tawalbeh, L., Abd El-Latif, A.A., Eds.; Advances in Information, Communication and Cybersecurity. Lecture Notes in Networks and Systems; Springer: Cham, Switzerland, 2021; Volume 357. [Google Scholar] [CrossRef]
- Alaoui, I.E.; Gahi, Y.; Messoussi, R.; Todoskoff, A.; Kobi, A. Big Data Analytics: A Comparison of Tools and Applications. In Innovations in Smart Cities and Applications; Ben Ahmed, M., Boudhir, A., Eds.; Lecture Notes in Networks and Systems; Springer: Cham, Switzerland, 2018; Volume 37. [Google Scholar] [CrossRef]
- Alaoui, I.E.; Gahi, Y.; Messoussi, R. Full Consideration of Big Data Characteristics in Sentiment Analysis Context. In Proceedings of the 4th International Conference on Cloud Computing and Big Data Analysis (ICCCBDA), Chengdu, China, 12–15 April 2019; pp. 126–130. [Google Scholar] [CrossRef]
- Sidi, F.; Shariat Panahy, P.H.; Affendey, L.S.; Jabar, M.A.; Ibrahim, H.; Mustapha, A. Data quality: A survey of data quality dimensions. In Proceedings of the 2012 International Conference on Information Retrieval Knowledge Management, Kuala Lumpur, Malaysia, 13–15 March 2012; pp. 300–304. [Google Scholar] [CrossRef]
- El Alaoui, I.; Gahi, Y.; Messoussi, R. Big Data Quality Metrics for Sentiment Analysis Approaches. In Proceedings of the 2019 International Conference on Big Data Engineering, New York, NY, USA, 11 June 2019; pp. 36–43. [Google Scholar] [CrossRef]
- Wang, R.Y.; Strong, D.M. Beyond Accuracy: What Data Quality Means to Data Consumers. J. Manag. Inf. Syst. 1996, 12, 5–33. [Google Scholar] [CrossRef]
- Alaoui, I.E.; Gahi, Y. The Impact of Big Data Quality on Sentiment Analysis Approaches. Procedia Comput. Sci. 2019, 160, 803–810. [Google Scholar] [CrossRef]
- Tranfield, D.; Denyer, D.; Smart, P. Towards a Methodology for Developing Evidence-Informed Management Knowledge by Means of Systematic Review. Br. J. Manag. 2003, 14, 207–222. [Google Scholar] [CrossRef]
- Wang, R.Y. A product perspective on total data quality management. Commun. ACM 1998, 41, 58–65. [Google Scholar] [CrossRef]
- Lee, Y.W.; Strong, D.M.; Kahn, B.K.; Wang, R.Y. AIMQ: A methodology for information quality assessment. Inf. Manag. 2002, 40, 133–146. [Google Scholar] [CrossRef]
- Bors, C.; Gschwandtner, T.; Kriglstein, S.; Miksch, S.; Pohl, M. Visual Interactive Creation, Customization, and Analysis of Data Quality Metrics. J. Data Inf. Qual. 2018, 10, 1–26. [Google Scholar] [CrossRef]
- Vaziri, R.; Mohsenzadeh, M.; Habibi, J. Measuring data quality with weighted metrics. Total Qual. Manag. Bus. Excell. 2019, 30, 708–720. [Google Scholar] [CrossRef]
- Batini, C.; Barone, D.; Cabitza, F.; Grega, S. A Data Quality Methodology for Heterogeneous Data. Int. J. Database Manag. Syst. 2011, 3, 60–79. [Google Scholar]
- Li, Y.; Chao, X.; Ercisli, S. Disturbed-entropy: A simple data quality assessment approach. ICT Express 2022, 8, 3. [Google Scholar] [CrossRef]
- Taleb, I.; Serhani, M.A.; Bouhaddioui, C.; Dssouli, R. Big data quality framework: A holistic approach to continuous quality management. J. Big Data 2021, 8, 76. [Google Scholar] [CrossRef]
- Wong, K.Y.; Wong, R.K. Big data quality prediction informed by banking regulation. Int. J. Data Sci. Anal. 2021, 12, 147–164. [Google Scholar] [CrossRef]
- Azeroual, O.; Saake, G.; Abuosba, M. Data Quality Measures and Data Cleansing for Research Information Systems. arXiv 2019, arXiv:1901.06208. Available online: http://arxiv.org/abs/1901.06208 (accessed on 12 November 2021).
- Timmerman, Y.; Bronselaer, A. Measuring data quality in information systems research. Decis. Support Syst. 2019, 126, 113138. [Google Scholar] [CrossRef]
- Mylavarapu, G.; Thomas, J.P.; Viswanathan, K.A. An Automated Big Data Accuracy Assessment Tool. In Proceedings of the 2019 IEEE 4th International Conference on Big Data Analytics (ICBDA), Suzhou, China, 15–18 March 2019; pp. 193–197. [Google Scholar] [CrossRef]
- Taleb, I.; Serhani, M.A.; Dssouli, R. Big Data Quality: A Data Quality Profiling Model. In Services—SERVICES 2019; Springer: Cham, Switzerland, 2019; pp. 61–77. [Google Scholar] [CrossRef]
- Heinrich, B.; Hristova, D.; Klier, M.; Schiller, A.; Szubartowicz, M. Requirements for Data Quality Metrics. J. Data Inf. Qual. 2018, 9, 1–32. [Google Scholar] [CrossRef]
- Arolfo, F.A.; Vaisman, A.A. Data Quality in a Big Data Context. In Advances in Databases and Information Systems; Benczúr, A., Thalheim, B., Horváth, T., Eds.; Lecture Notes in Computer Science; Springer: Cham, Switzerland, 2018; Volume 11019. [Google Scholar]
- Micic, N.; Neagu, D.; Campean, F.; Zadeh, E.H. Towards a Data Quality Framework for Heterogeneous Data. In Proceedings of the 2017 IEEE International Conference on Internet of Things (iThings) and IEEE Green Computing and Communications (GreenCom) and IEEE Cyber, Physical and Social Computing (CPSCom) and IEEE Smart Data (SmartData), Exeter, UK, 21–23 June 2017; pp. 155–162. [Google Scholar] [CrossRef] [Green Version]
- Taleb, I.; Kassabi, H.T.E.; Serhani, M.A.; Dssouli, R.; Bouhaddioui, C. Big Data Quality: A Quality Dimensions Evaluation. In Proceedings of the 2016 Intelligence IEEE Conferences on Ubiquitous Intelligence Computing, Advanced and Trusted Computing, Scalable Computing and Communications, Cloud and Big Data Computing, Internet of People, and Smart World Congress (UIC/ATC/ScalCom/CBDCom/IoP/SmartWorld), Toulouse, France, 18–21 July 2016; pp. 759–765. [Google Scholar] [CrossRef]
- Serhani, M.A.; El Kassabi, H.T.; Taleb, I.; Nujum, A. An Hybrid Approach to Quality Evaluation across Big Data Value Chain. IEEE. In Proceedings of the 2016 IEEE International Congress on Big Data (BigData Congress), Washington, DC, USA, 5–8 December 2016; pp. 418–425. [Google Scholar] [CrossRef]
- Firmani, D.; Mecella, M.; Scannapieco, M.; Batini, C. On the Meaningfulness of “Big Data Quality” (Invited Paper). Data Sci. Eng. 2016, 1, 6–20. [Google Scholar] [CrossRef]
- Cai, L.; Zhu, Y. The Challenges of Data Quality and Data Quality Assessment in the Big Data Era. Data Sci. J. 2015, 14, 2. [Google Scholar] [CrossRef] [Green Version]
- Zhang, P.; Xiong, F.; Gao, J.; Wang, J. Data quality in big data processing: Issues, solutions and open problems. In Proceedings of the 2017 IEEE SmartWorld, Ubiquitous Intelligence & Computing, Advanced & Trusted Computed, Scalable Computing & Communications, Cloud & Big Data Computing, Internet of People and Smart City Innovation (SmartWorld/SCALCOM/UIC/ATC/CBDCom/IOP/SCI), San Francisco, CA, USA, 4–8 August 2017; pp. 1–7. [Google Scholar] [CrossRef]
- Wand, Y.; Wang, R.Y. Anchoring data quality dimensions in ontological foundations. Commun. ACM 1996, 39, 86–95. [Google Scholar] [CrossRef]
- Gahi, Y.; El Alaoui, I. Machine Learning and Deep Learning Models for Big Data Issues. In Machine Intelligence and Big Data Analytics for Cybersecurity Applications; Maleh, Y., Shojafar, M., Alazab, M., Baddi, Y., Eds.; Studies in Computational Intelligence; Springer: Cham, Switzerland, 2021; Volume 919. [Google Scholar] [CrossRef]
- Elouataoui, W.; Alaoui, I.E.; Mendili, S.E.; Gahi, Y. An End-to-End Big Data Deduplication Framework based on Online Continuous Learning. Int. J. Adv. Comput. Sci. Appl. 2022, 13, 33. [Google Scholar] [CrossRef]
- COVID-19: Twitter Dataset Of 100+ Million Tweets. Available online: https://kaggle.com/adarshsng/covid19-twitter-dataset-of-100-million-tweets (accessed on 7 October 2021).
- Great Expectations Home Page. Available online: https://www.greatexpectations.io/ (accessed on 24 August 2022).
- Reda, O.; Sassi, I.; Zellou, A.; Anter, S. Towards a Data Quality Assessment in Big Data. In Proceedings of the 13th International Conference on Intelligent Systems: Theories and Applications, New York, NY, USA, 23–24 September 2020; pp. 1–6. [Google Scholar] [CrossRef]
- Alaoui, I.E.; Gahi, Y. Network Security Strategies in Big Data Context. Procedia Comput. Sci. 2020, 175, 730–736. [Google Scholar] [CrossRef]


| Keywords/Digital Libraries | Springer | Scopus | IEEE Xplore | Research Gate | Science Direct |
|---|---|---|---|---|---|
| “Data Quality Metrics” | 8 | 9 | 7 | 21 | 2 |
| “Data Quality Measurement” | 2 | 3 | 2 | 7 | 1 |
| “Data Quality Aspects” | 2 | 5 | 0 | 5 | 1 |
| “Big Data Quality Metrics” | 5 | 4 | 5 | 10 | 2 |
| “Big Data Quality Measures” | 1 | 1 | 0 | 3 | 0 |
| “Weighted Data Quality” | 1 | 0 | 0 | 1 | 0 |
| Total | 19 | 22 | 14 | 47 | 6 |
| Ref | Year | Main Idea | For Big Data | The Defined Dimensions | New Metrics | Techniques Used |
|---|---|---|---|---|---|---|
| [2] | 2022 | The authors defined a normalized double entropy (NDE) method to assess image data quality using probability entropy and distance entropy. This work focuses on healthcare data quality and data redundancy. | No | Uniqueness | No | Normalizing probability entropy and distance entropy |
| [21] | 2022 | The authors suggested a novel data quality assessment framework based on image classification. The data are represented as pixel prototypes, and disturbed entropy is then measured to assess data redundancy. | No | Uniqueness | No | Disturbed entropy |
| [22] | 2021 | Taleb et al. defined a framework to manage the quality of big data that consists of storing valuable information, including project parameters and requirements, data quality rules proposals, and data quality profiling. The framework is applied to the whole big data value chain. It was implemented and evaluated. | Yes | Generic | No | Used the definitions of Completeness, Consistency, Accuracy, and Uniqueness. Used a sampling and profiling algorithm. |
| [23] | 2021 | The authors implemented a machine learning model for data quality prediction. The suggested model consists of 3 steps: data noise detection, data noise impact assessment based on Generative Mixture Methods, and, finally, data quality prediction using the sequential learning of a deep-learning network. | Yes | Data Quality Rating functions (DQRi) | No | Used Recurrent Neural Network and Long Short-Term Memory techniques. |
| [24] | 2019 | The authors presented some data quality measuring approaches, such as laissez-faire, reactive, and proactive approaches. Also, they have described the different steps of each approach allowing to improve the quality of data. | No | Generic | No | Presented some data quality measuring approaches, such as laissez-faire, reactive, and proactive approaches |
| [25] | 2019 | The authors presented a framework for data quality measurement based on rule-based measurement. The suggested framework allows the handling of uncertainty. It was implemented using survey data. | No | Generic | Yes | Provided formulas for rule-based data quality measurement |
| [26] | 2019 | Goutam et al. suggested a big data accuracy assessment tool. The suggested model consists of comparing datasets to choose the optimal one using record linkage and word embeddings. | Yes | Accuracy | No | Word embeddings and record linkage, K-NN, Logistic Regression, and Decision Trees |
| [27] | 2019 | The authors suggested a data quality profiling model for big data based on the following modules: sampling, exploratory quality profiling, profiling, quality profile repository, and data quality profile. | Yes | Generic | No | Sampling and profiling algorithms |
| [28] | 2018 | The authors presented the requirements that should fulfill the metrics: Interval-Scaled Values, Existence of Minimum and Maximum, Quality of the Configuration Parameters, Efficiency of the Metric, and Sound Aggregation of the Metric Values. In addition, the authors showed the applicability of these requirements by evaluating five data quality metrics. | Yes | Timeliness, Completeness, Reliability, Correctness, and Consistency | Yes | Defined the requirements without formulas. Used the definitions of Timeliness, Completeness, Reliability, Correctness, and Consistency |
| [18] | 2018 | The authors developed an environment in which users can interactively customize data quality metrics to meet the requirements. | No | Completeness, Validity, Plausibility, Time Interval Metrics, and Uniqueness | No | Provided a generic definition of quality metrics. Defined Completeness, Validity, Plausibility, Time Interval Metrics, and Uniqueness. |
| [29] | 2018 | The authors highlighted the meanings of domain model, metrics, and weights of metrics. In this study, the authors built a system that allows users to seek tweets using a keyword search. | Yes | Readability, Completeness, and Usefulness | No | Used Readability, Completeness, and Usefulness for big data. |
| [19] | 2017 | The authors defined new data quality metrics that consider data weights (the importance of the information contained within the data). The suggested metrics were also implemented. | No | Completeness, Relevancy, Accuracy, Timeliness, and Consistency | Yes | Provided formulas to measure weighted Completeness, Relevancy, Accuracy, Timeliness, and Consistency. |
| [30] | 2017 | The authors reviewed some of the existing data quality approaches. They classified them based on three criteria: the degree of heterogeneity, the scope of the assessment approach, and the techniques used. | No | Completeness, Semantic Consistency, Structural Consistency, and Uniqueness | No | Used the definitions of Completeness, Semantic Consistency, Structural Consistency, and Uniqueness. |
| [31] | 2016 | The authors suggested a data quality assessment approach based on data proofing and sampling, allowing the optimization of processing time. The suggested approach comprises data quality evaluation using data profiling, data sampling, and data quality analysis. | Yes | Accuracy, Completeness, and Consistency | No | Used the definitions of Accuracy, Completeness, and Consistency. Used a sampling and profiling algorithm. |
| [32] | 2016 | The authors proposed a novel approach that combines data-driven and process-driven quality assessments throughout the whole data chain value. For each phase of the suggested approach, the authors defined the quality metrics that should be considered. | Yes | Timeliness, Currency, Volatility, Accuracy, Completeness, and Consistency | No | Used the definitions of Timeliness, Currency, Volatility, Accuracy, Completeness, and Consistency |
| [33] | 2015 | The authors highlighted how quality dimensions can be defined in a big data context. In addition, they showed that there are many quality notions that can be applied depending on the data types, which should be considered. | Yes | Redundancy, Consistency, Freshness, Accuracy, Copying, Spread, Completeness, and Trustworthiness | Yes | Defined Redundancy, Consistency, Freshness, Accuracy, Copying, Spread, Completeness, and Trustworthiness |
| [7] | 2015 | This paper aims to present the data quality challenges raised by the emergence of big data. The authors also highlighted various activities and components of data quality management, such as measuring metrics, data profiling, sampling, and data quality rules. | Yes | Generic | No | Provided a generic definition of quality metrics. |
| First Name | Last Name | Age | Address | Phone Number | City | Country | |
|---|---|---|---|---|---|---|---|
| 90% | 90% | 80% | 40% | 30% | 20% | 65% | 70% |
| Factor Range | 1–2 | 3–4 | 5 | 6–7 | 8–10 |
| Impact Degree | Very Low | Low | Moderate | Significant | Very High |
| First Name | Last Name | Age | Address | Phone Number | City | Country | |
|---|---|---|---|---|---|---|---|
| 1 | 1 | 1 | 3 | 6 | 4 | 2 | 2 |
| First Name | Last Name | Age | Address | Phone Number | City | Country | |
|---|---|---|---|---|---|---|---|
| 1/20 = 0.05 | 1/20 = 0.05 | 1/20 = 0.05 | 3/20 = 0.15 | 6/20 = 0.3 | 4/20 = 0.2 | 2/20 = 0.1 | 2/20 = 0.1 |
| Evaluation Criteria | Description |
|---|---|
| D | Providing a data quality definition |
| M | Proposing a quality model |
| Mt | Offering an assessment metrics |
| F | Proposing a methodology or framework |
| S | Making a simulation or prototype |
| A | Presenting a state of the art |
| P | Conducting a poll |
| Ref. | [28] | [18] | [2] | [33] | [19] | [21] | [29] | [32] | [31] | [30] | [26] | Our Framework | |
|---|---|---|---|---|---|---|---|---|---|---|---|---|---|
| Score | D | 1 | 1 | 1 | 1 | 1 | 1 | 1 | 1 | 1 | 1 | 1 | 1 |
| M | 1 | 1 | 1 | 1 | 1 | 1 | 1 | 1 | 1 | 0 | 0 | 1 | |
| Mt | 1 | 1 | 0 | 1 | 1 | 0 | 1 | 1 | 1 | 1 | 1 | 1 | |
| F | 1 | 0 | 0 | 0 | 0 | 0 | 0 | 0 | 1 | 1 | 1 | 1 | |
| S | 0 | 1 | 1 | 0 | 0 | 1 | 1 | 1 | 0 | 0 | 1 | 1 | |
| A | 1 | 1 | 1 | 1 | 1 | 1 | 1 | 1 | 1 | 1 | 1 | 1 | |
| P | 0 | 0 | 0 | 0 | 0 | 0 | 0 | 0 | 0 | 0 | 0 | 0 | |
| Score | 7.5 | 7.5 | 5.5 | 6 | 6 | 5.5 | 7.5 | 7.5 | 7.5 | 5.5 | 7 | 9 |
| Ref. | [28] | [18] | [2] | [33] | [19] | [21] | [29] | [32] | [31] | [30] | [26] | Our Framework | |
|---|---|---|---|---|---|---|---|---|---|---|---|---|---|
| Metrics | Completeness | * | * | * | * | * | * | * | * | * | |||
| Timeliness | * | * | * | * | * | * | |||||||
| Volatility | * | * | |||||||||||
| Uniqueness | * | * | * | * | * | * | |||||||
| Accuracy | * | * | * | * | * | * | |||||||
| Conformity | * | * | * | ||||||||||
| Consistency | * | * | * | * | * | * | * | * | |||||
| Correctness | * | * | |||||||||||
| Relevancy | * | * | * | ||||||||||
| Readability | * | * | |||||||||||
| Spread | * |
Publisher’s Note: MDPI stays neutral with regard to jurisdictional claims in published maps and institutional affiliations. |
© 2022 by the authors. Licensee MDPI, Basel, Switzerland. This article is an open access article distributed under the terms and conditions of the Creative Commons Attribution (CC BY) license (https://creativecommons.org/licenses/by/4.0/).
Share and Cite
Elouataoui, W.; El Alaoui, I.; El Mendili, S.; Gahi, Y. An Advanced Big Data Quality Framework Based on Weighted Metrics. Big Data Cogn. Comput. 2022, 6, 153. https://doi.org/10.3390/bdcc6040153
Elouataoui W, El Alaoui I, El Mendili S, Gahi Y. An Advanced Big Data Quality Framework Based on Weighted Metrics. Big Data and Cognitive Computing. 2022; 6(4):153. https://doi.org/10.3390/bdcc6040153
Chicago/Turabian StyleElouataoui, Widad, Imane El Alaoui, Saida El Mendili, and Youssef Gahi. 2022. "An Advanced Big Data Quality Framework Based on Weighted Metrics" Big Data and Cognitive Computing 6, no. 4: 153. https://doi.org/10.3390/bdcc6040153