
A Systematic Literature Review on Diabetic Retinopathy Using an Artificial Intelligence Approach


Abstract
:1. Introduction
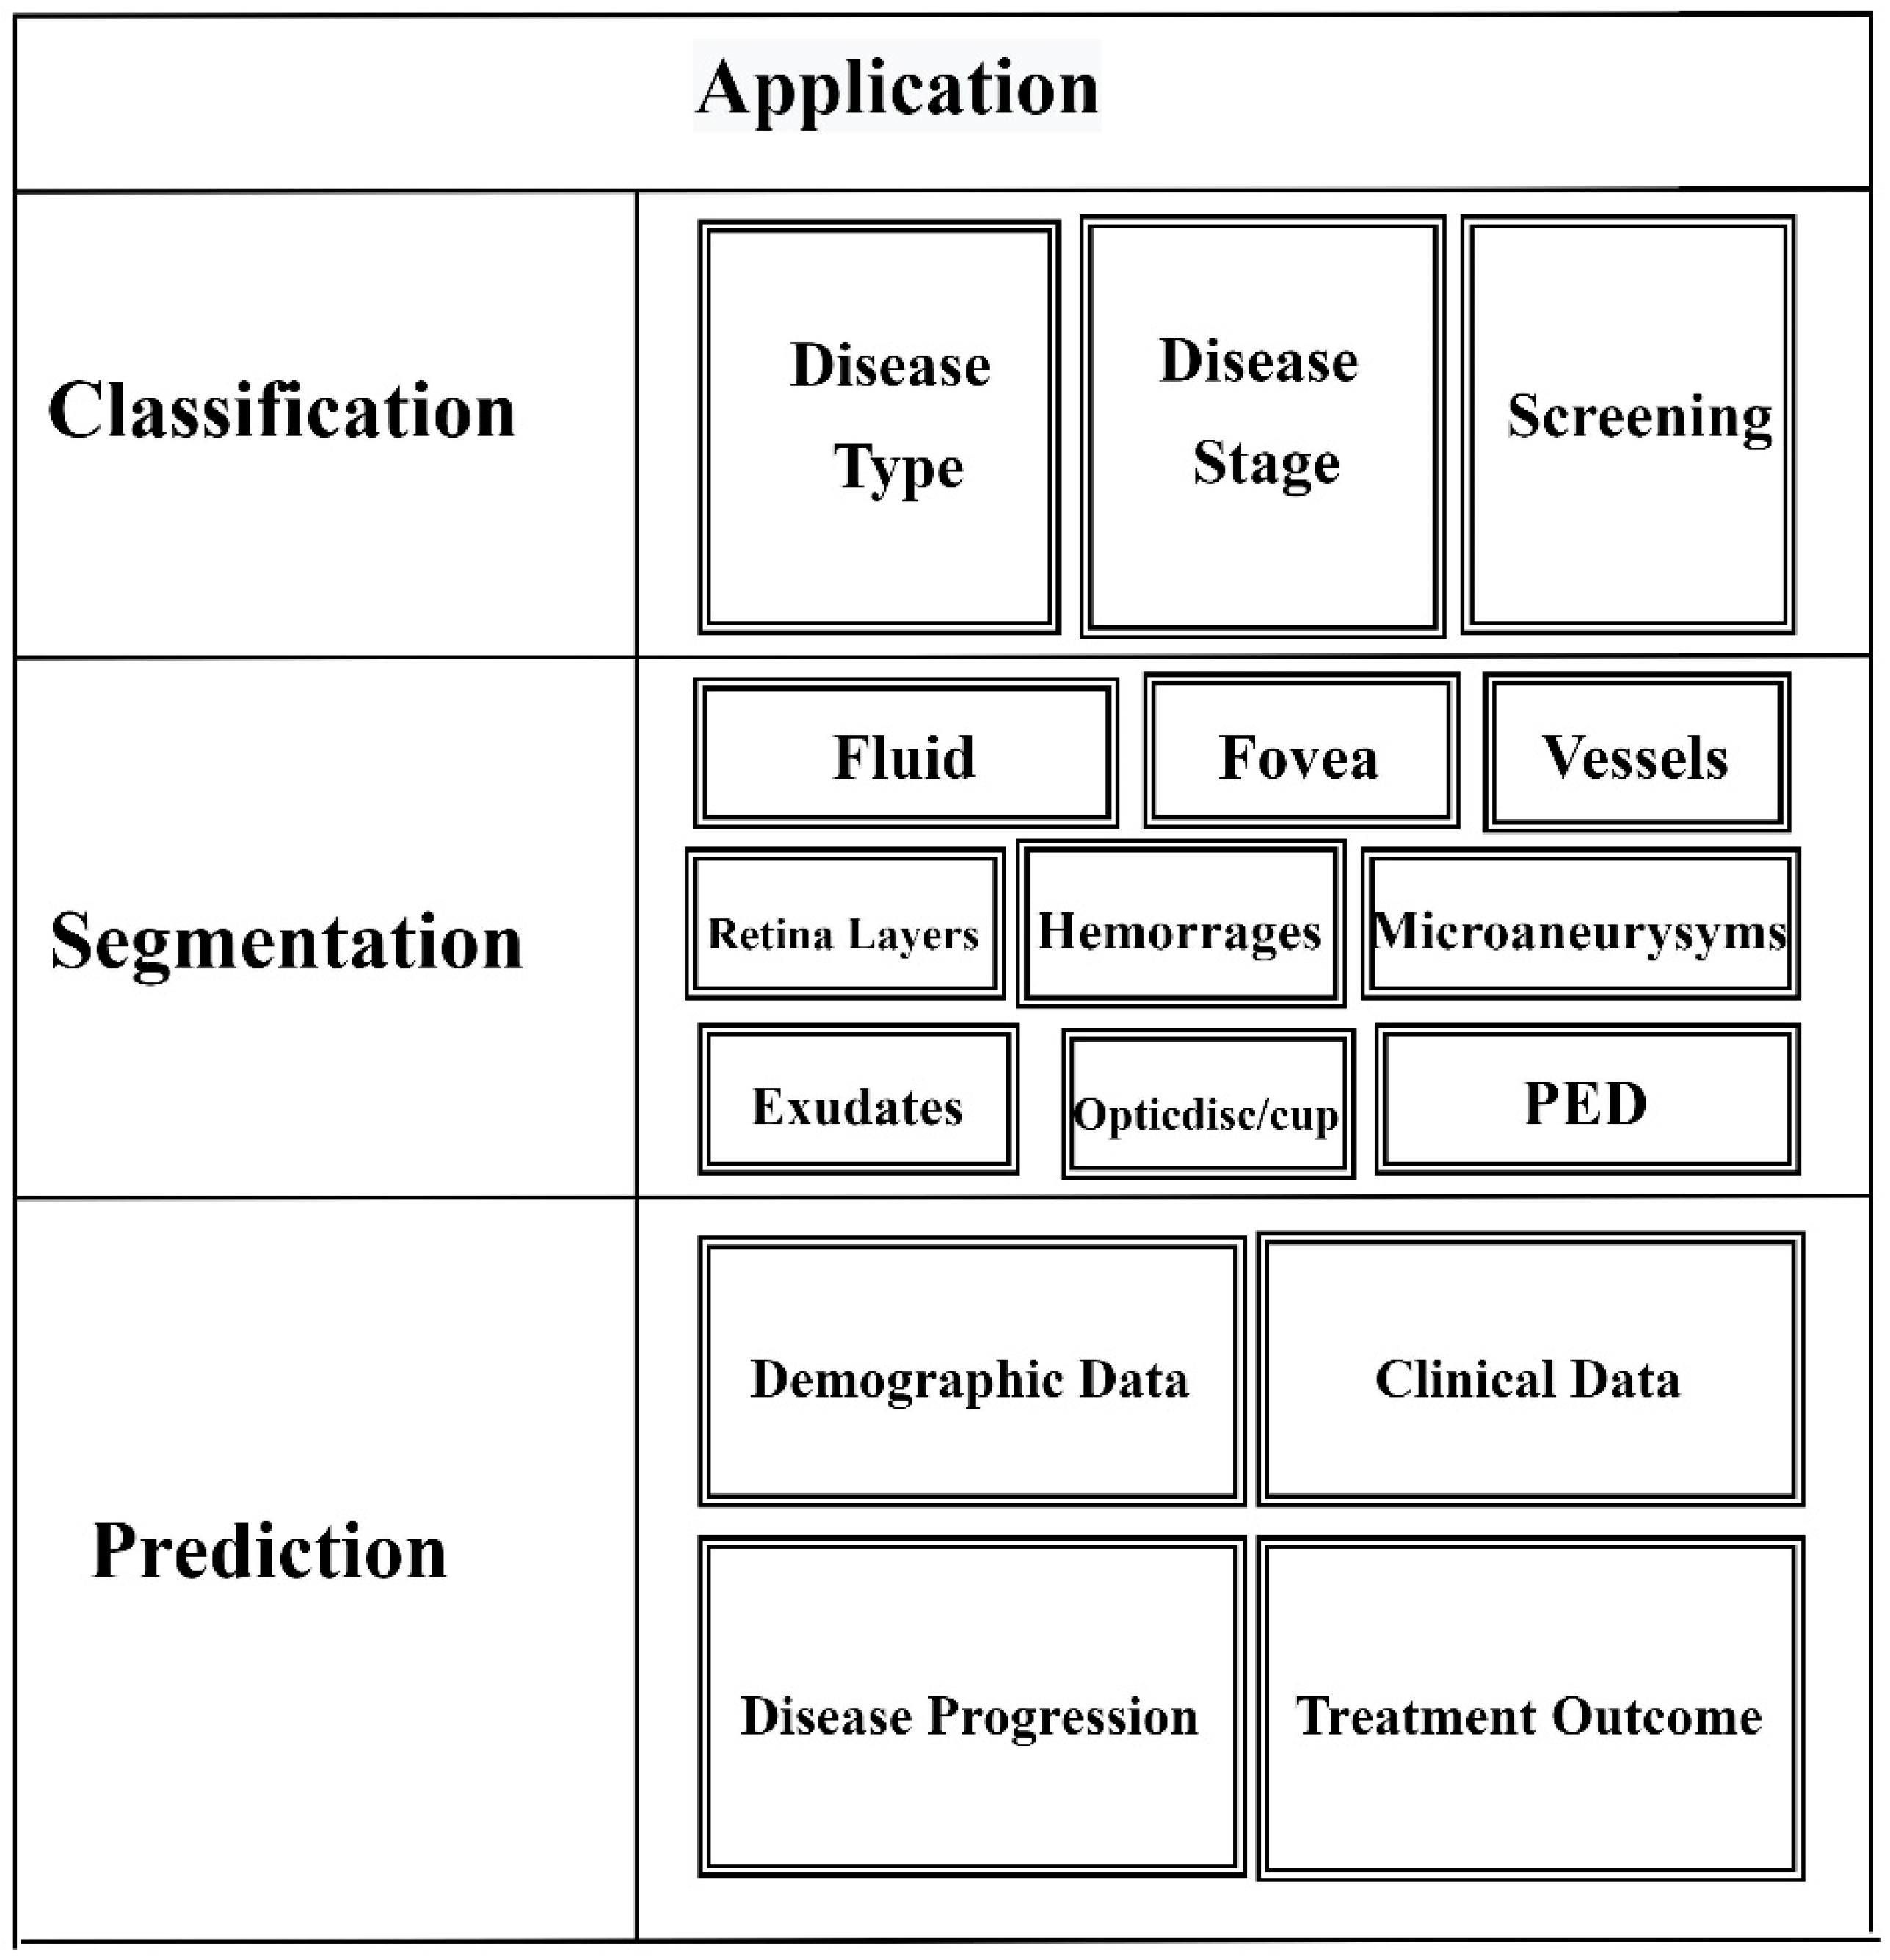
1.1. Applications of AI in Retina Images
- Classification: Categorization cases are commonly used in binary or multi-class retinal image analysis, such as automated screenings or detecting of the stage of disease or type. ML and DL methods are applicable here based on the level of understandability required or the quantity of the dataset provided.
- Segmentation: The fundamental goal of segmentation-based approaches is to subdivide the objects in a picture. The primary purpose of all these techniques is to investigate morphological features or retrieve a meaningful pattern or feature of relevance from a snapshot, such as borders in 2D or 3D imaging. Segmentation of pigment epithelial detachment (PED) is used to diagnose chorioretinal diseases.
- Prediction: Most predicted situations are alarmed with illness development, future treatment outcomes based on an image, etc. The prediction approach can also be used to depict the local retention region.
1.2. Diabetic Retinopathy (DR)
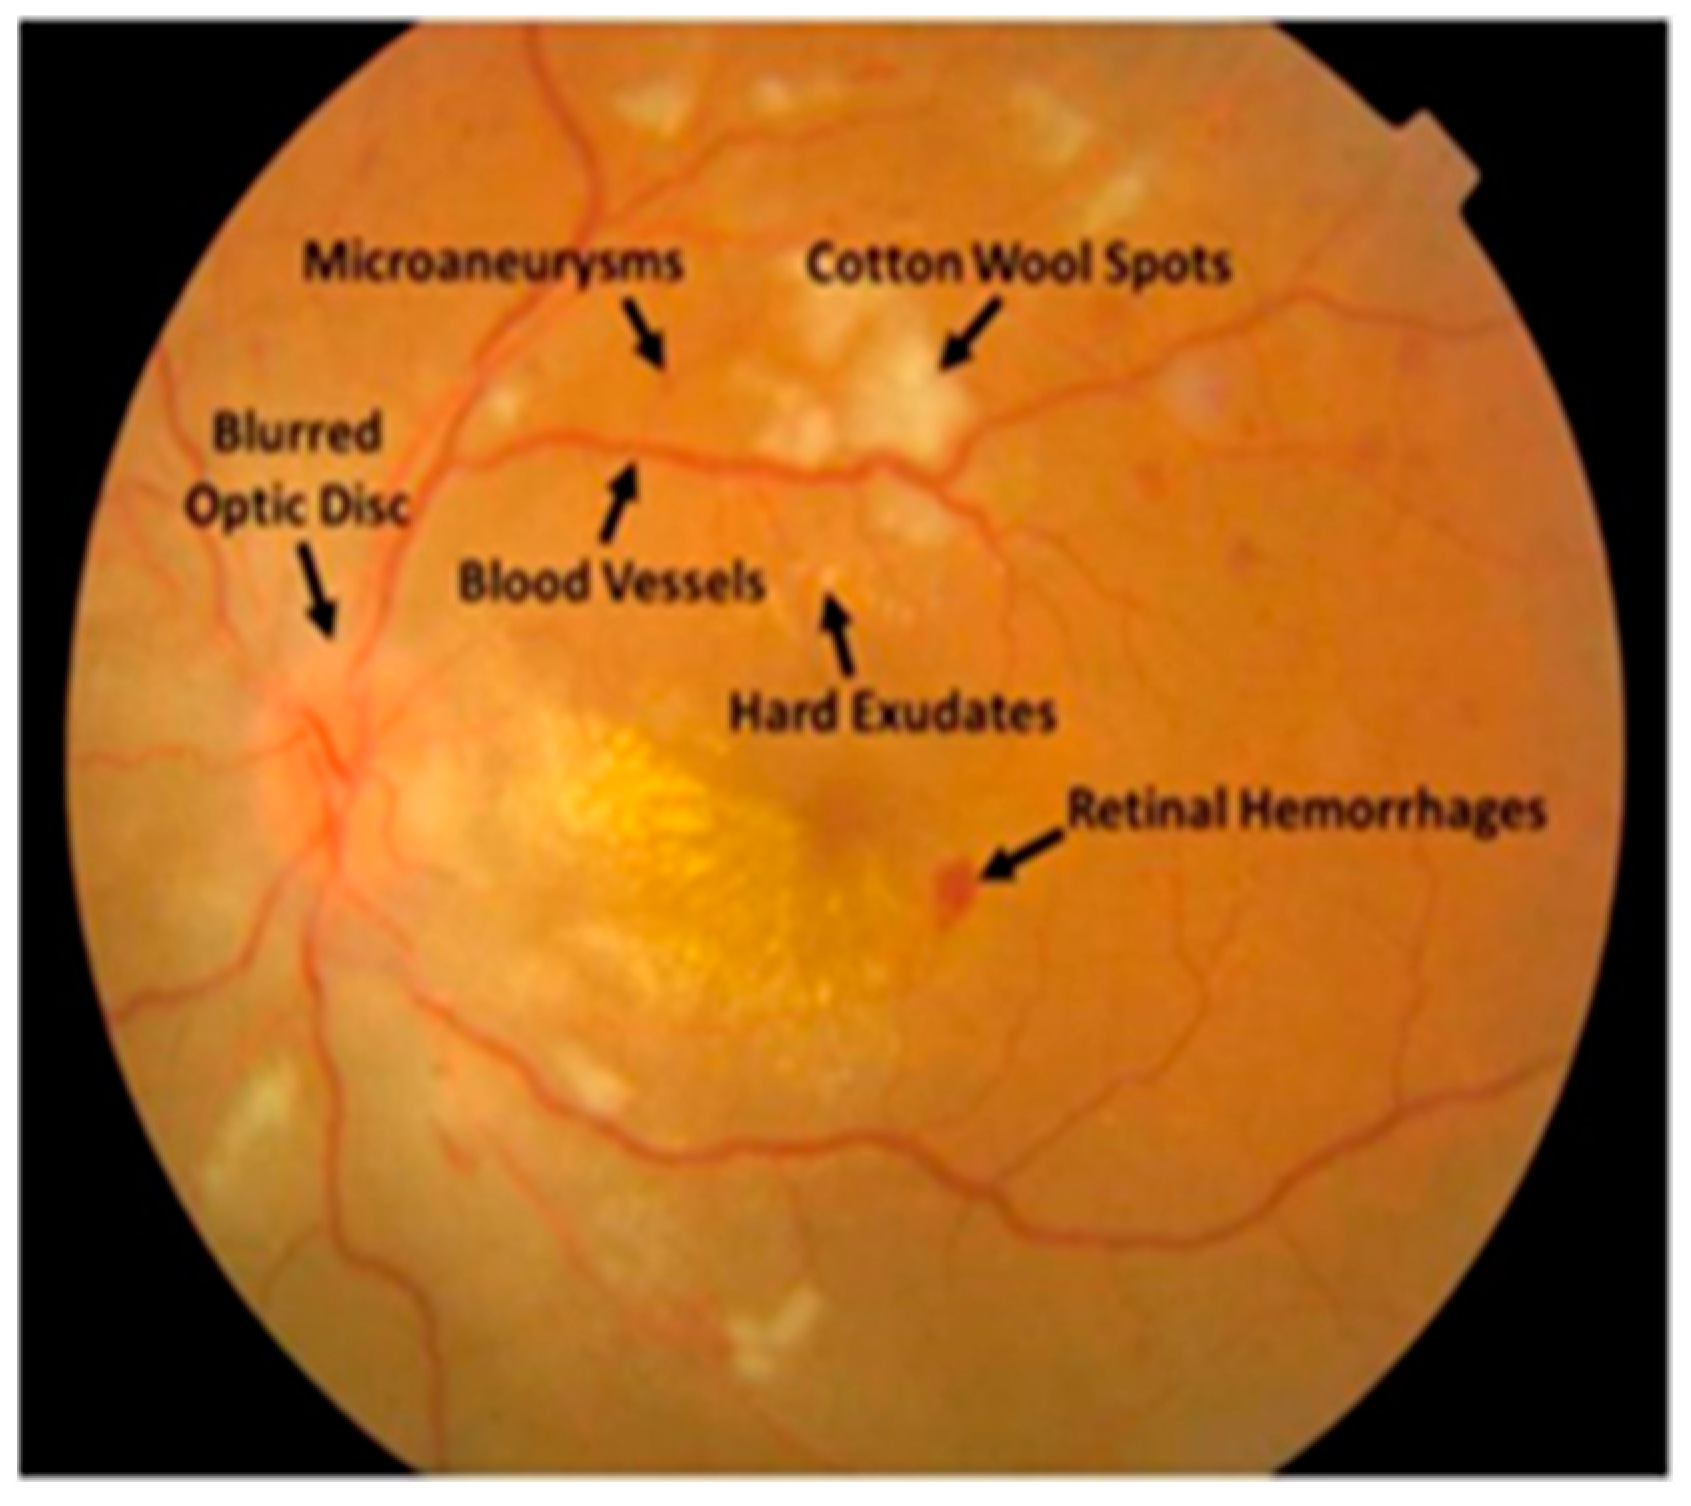
- Hemorrhages (HM) appear as patches on the retina which can be 125 μm in diameter with an uneven edge. Its two categories are flames (superficial HM) and blot (deep HM) [23].
- Hard exudates: Hard exudates, which typically can be seen as bright yellow areas on the eye, are caused by hemolysis. These were also found in the eye’s coastal parts and had clear boundaries.
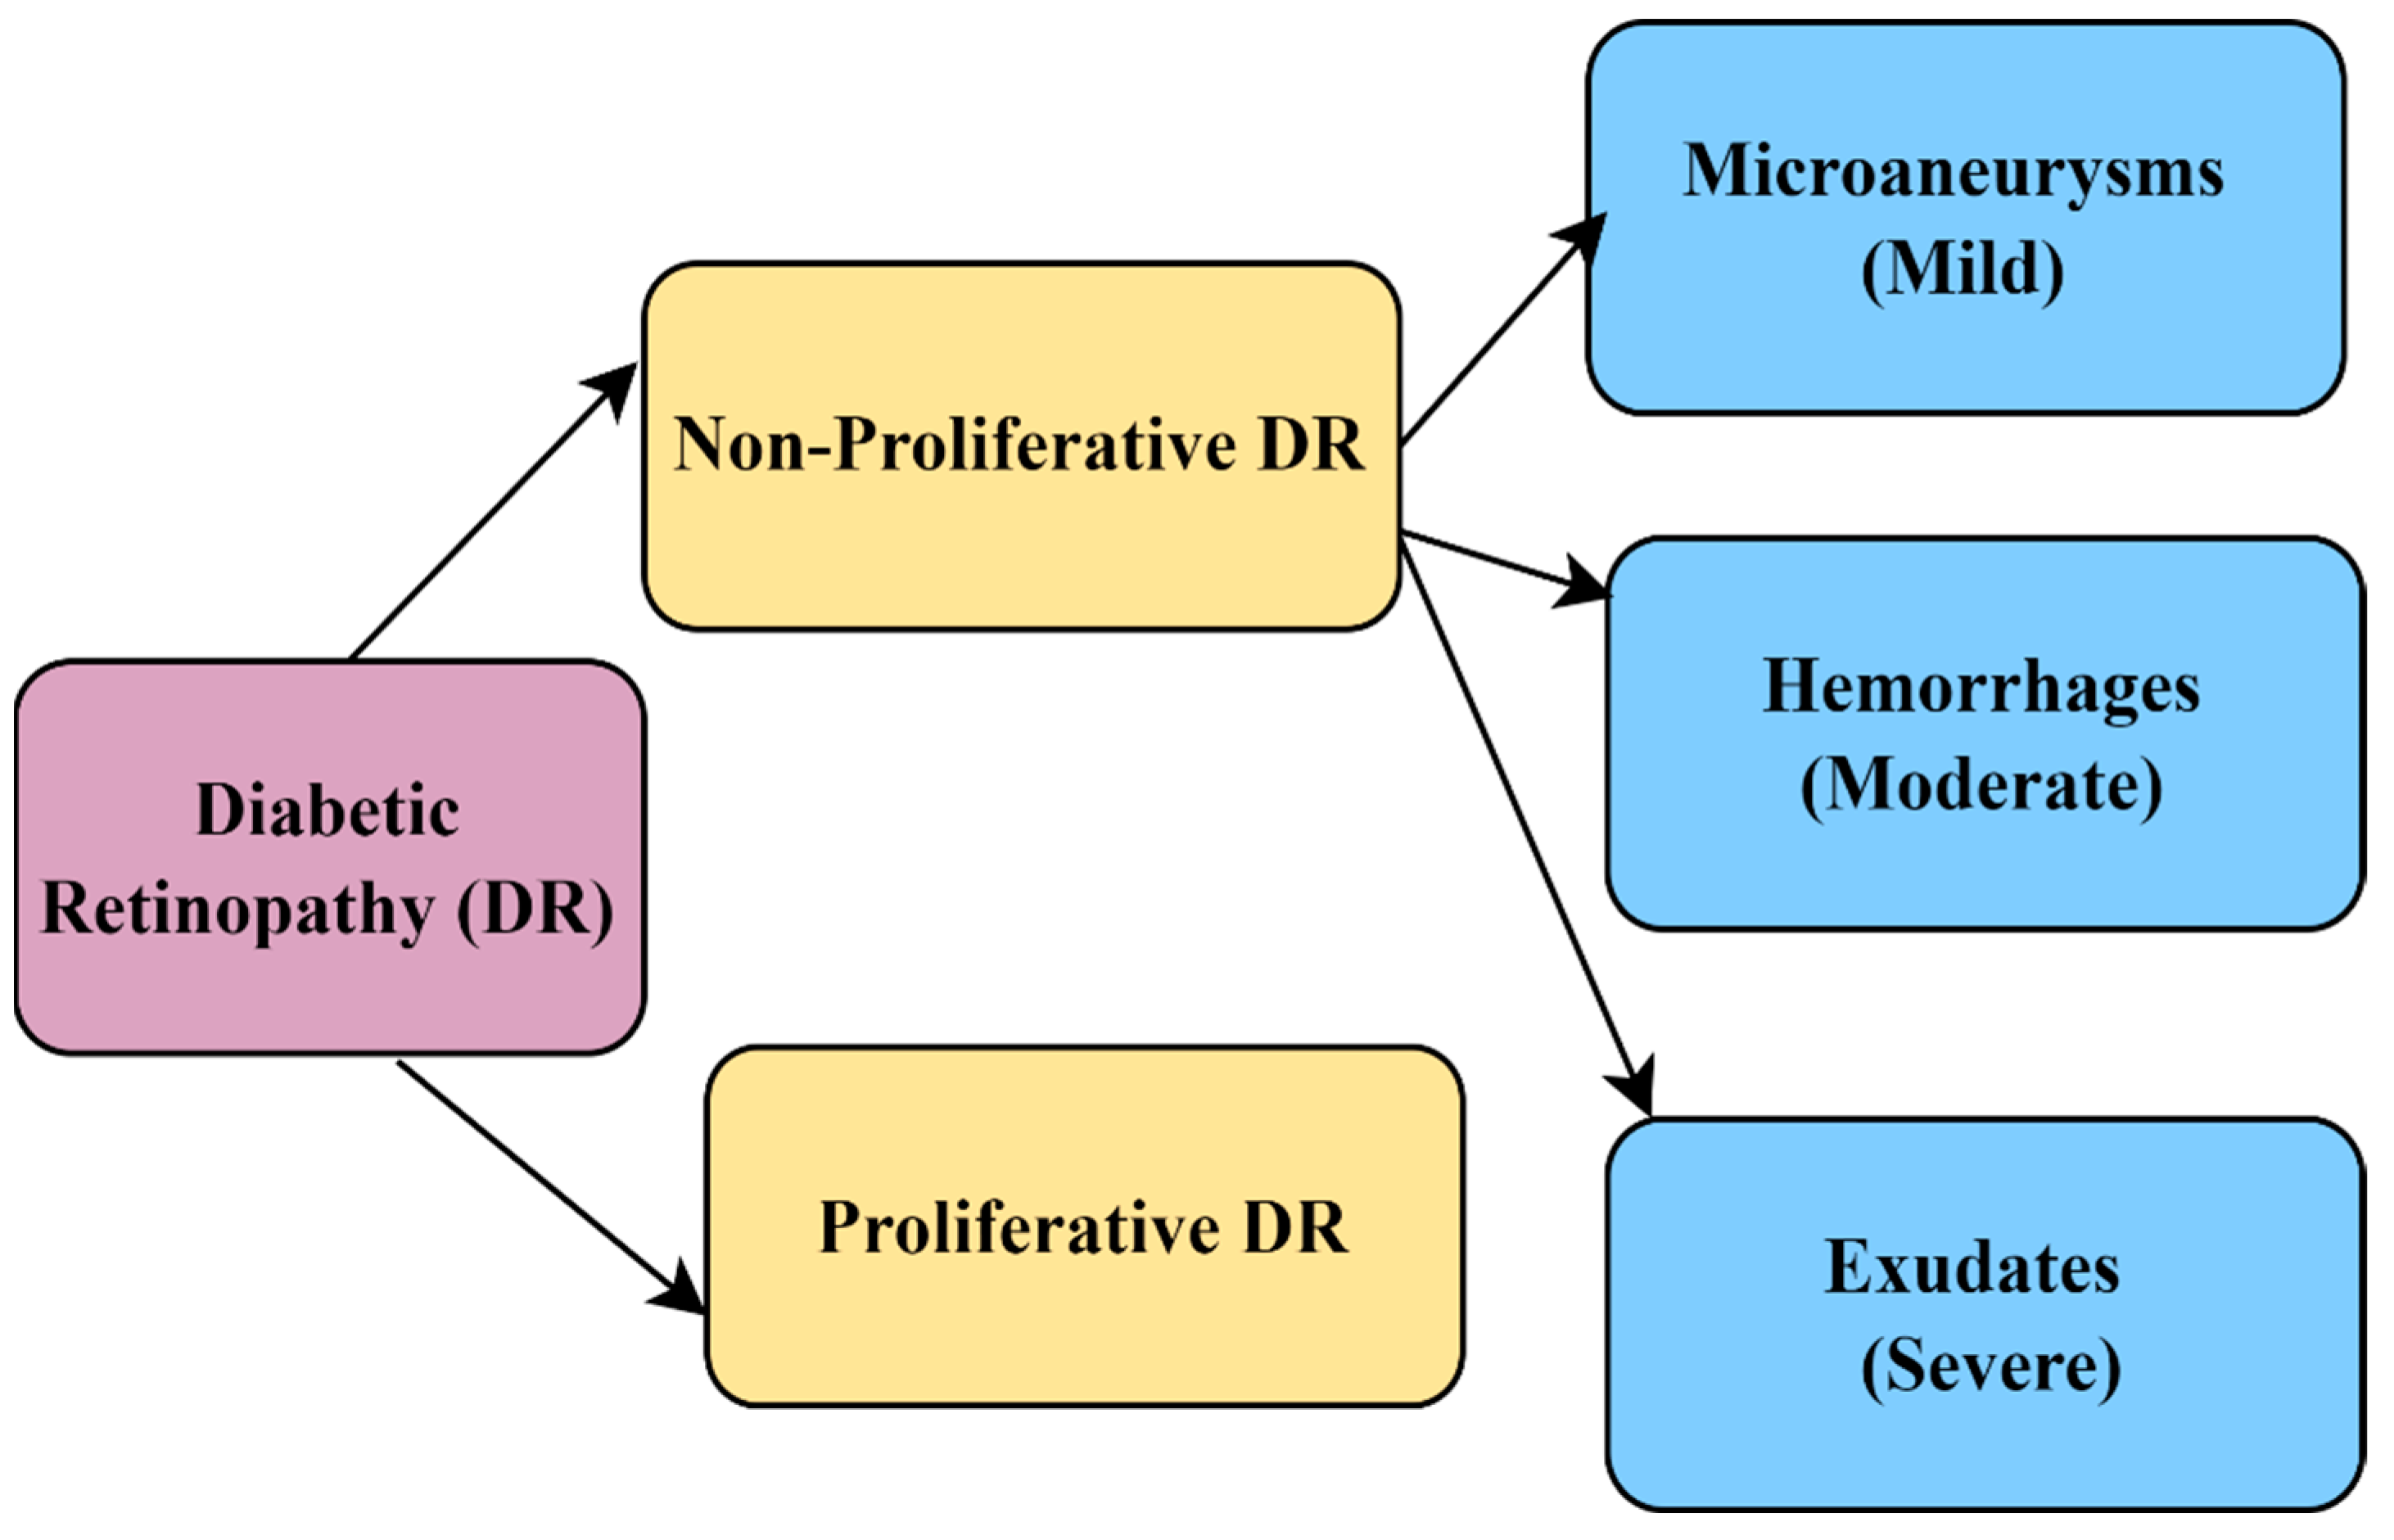
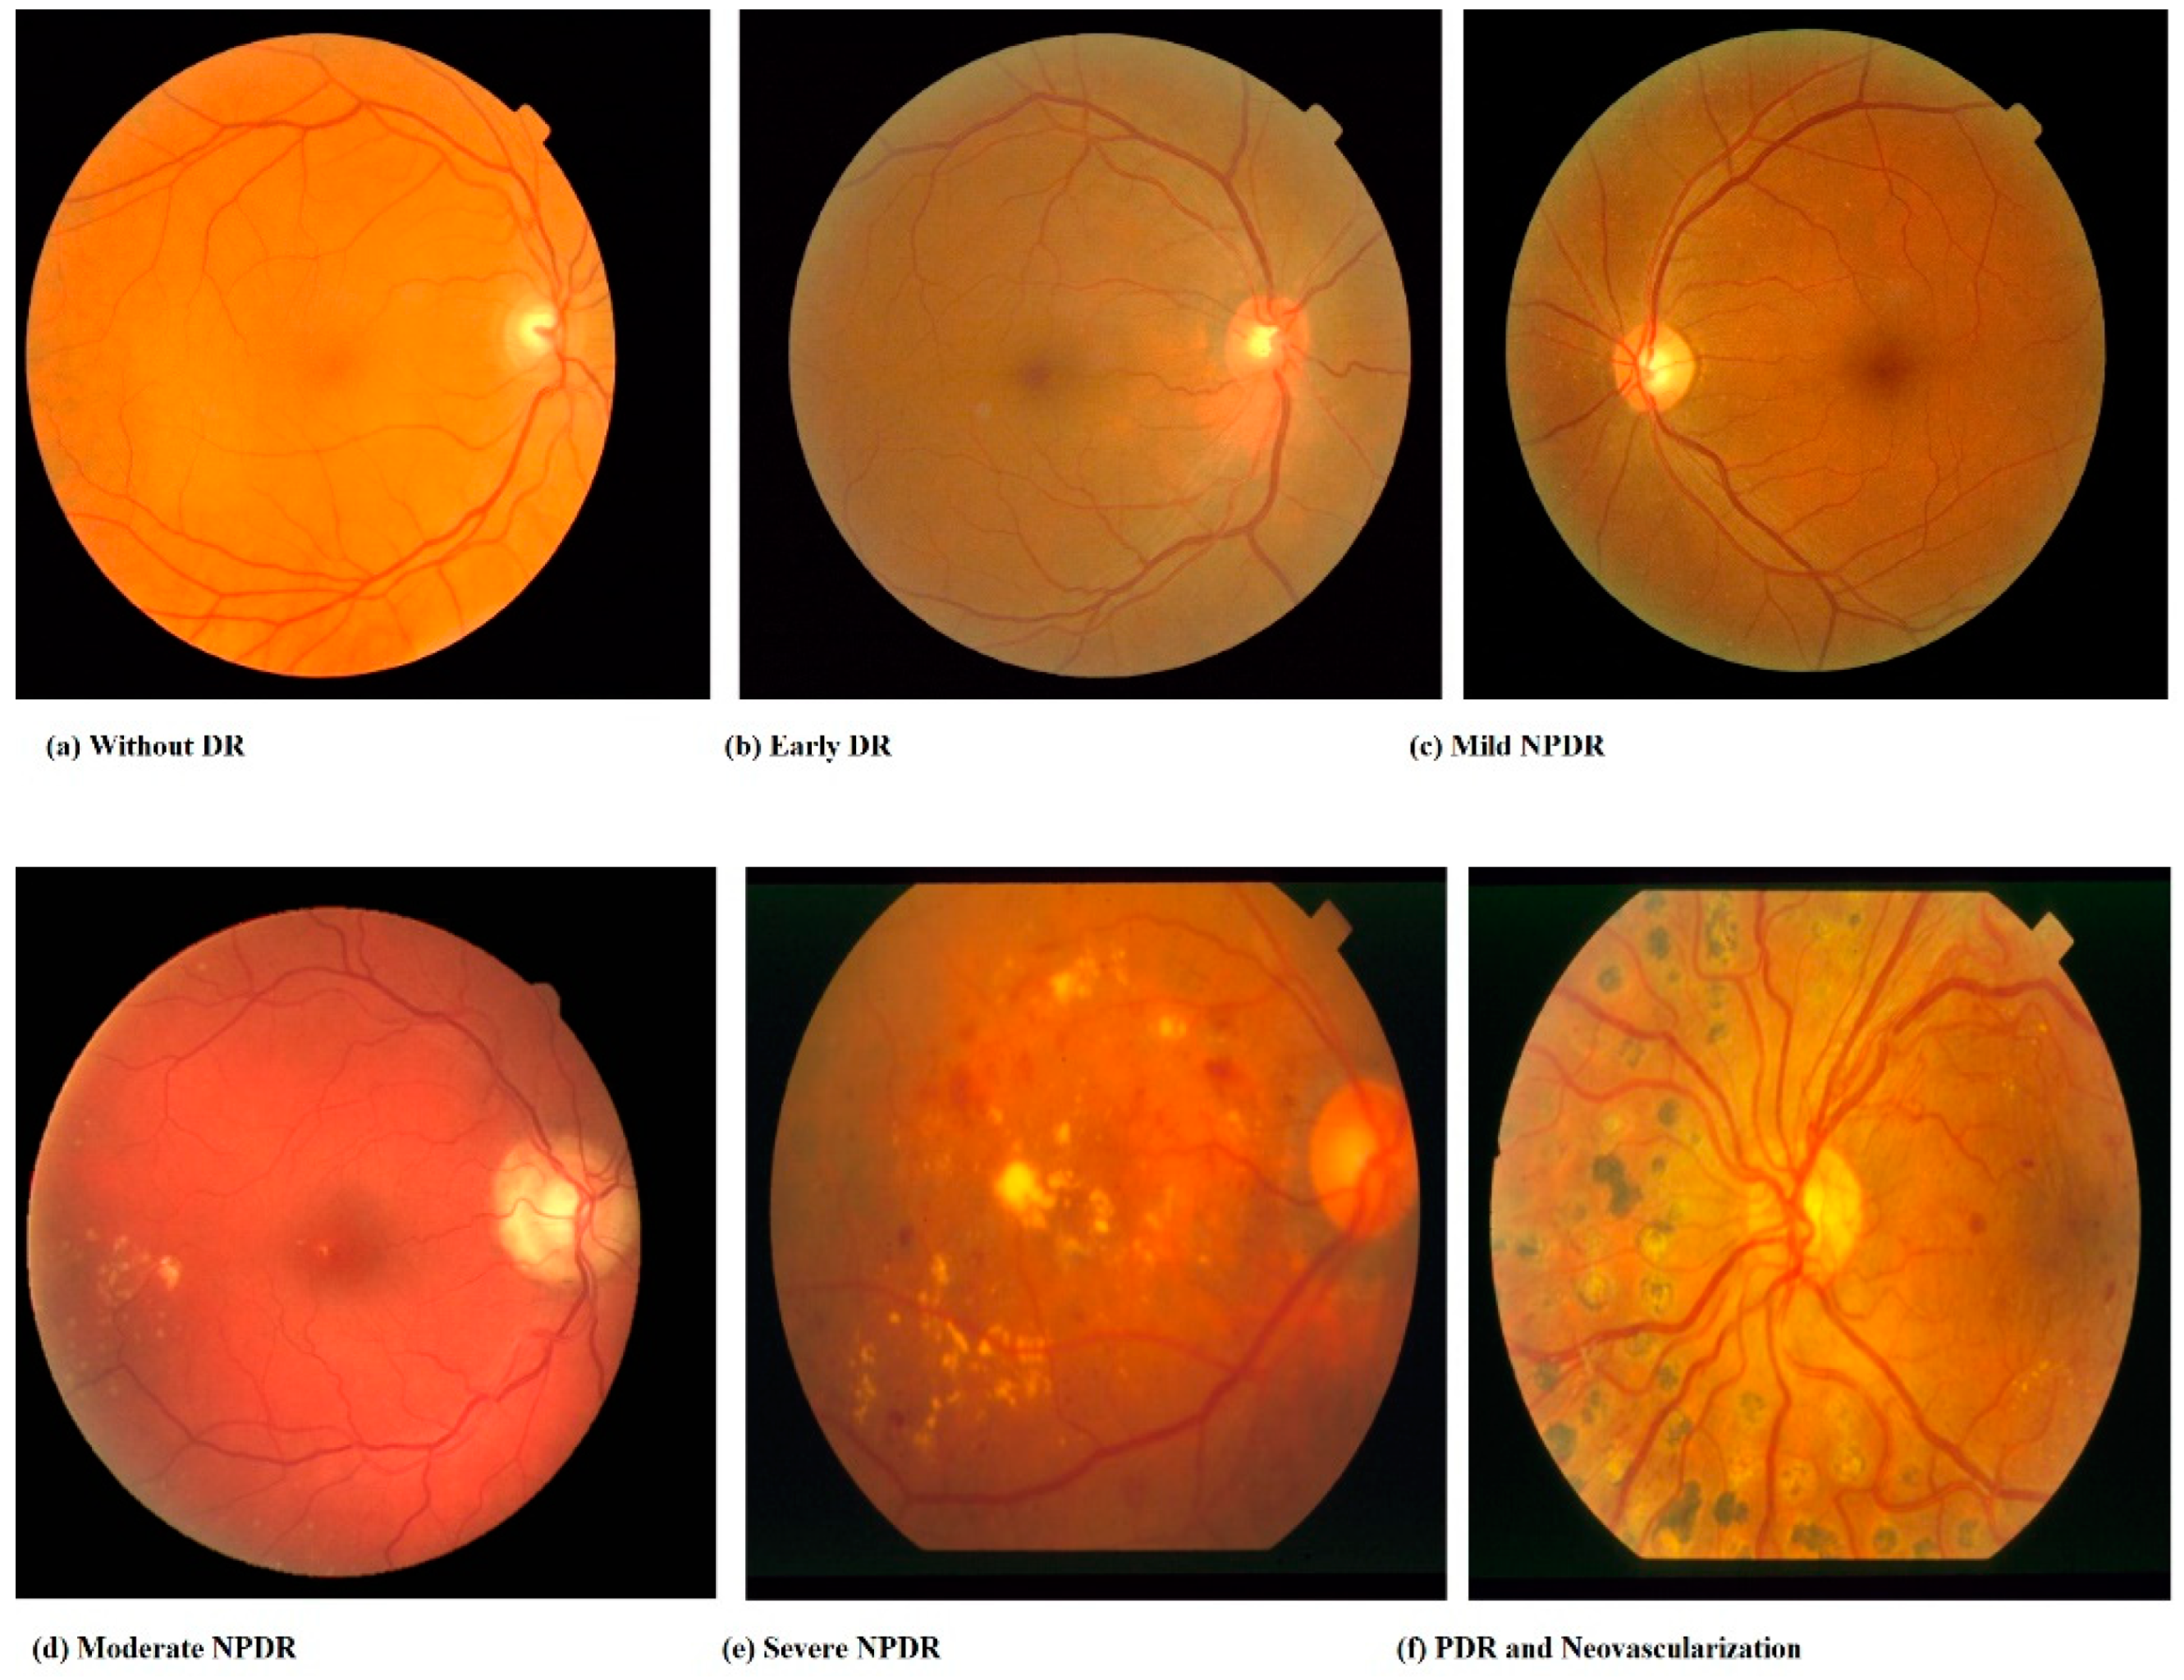
- Soft exudates: White spots on the eye generated from nerve fiber swelling are called soft exudates (cotton wool). These are ovular or circular. Soft or hard secretions constitute white lesions, whereas MA and HM were red growths (EX). A sample image of various stages of DR is provided in Figure 4. DR is classified as non-proliferative DR (NPDR) and proliferative DR (PDR). Further, NPDR is classified as mild, moderate, and severe, as shown in Figure 5.

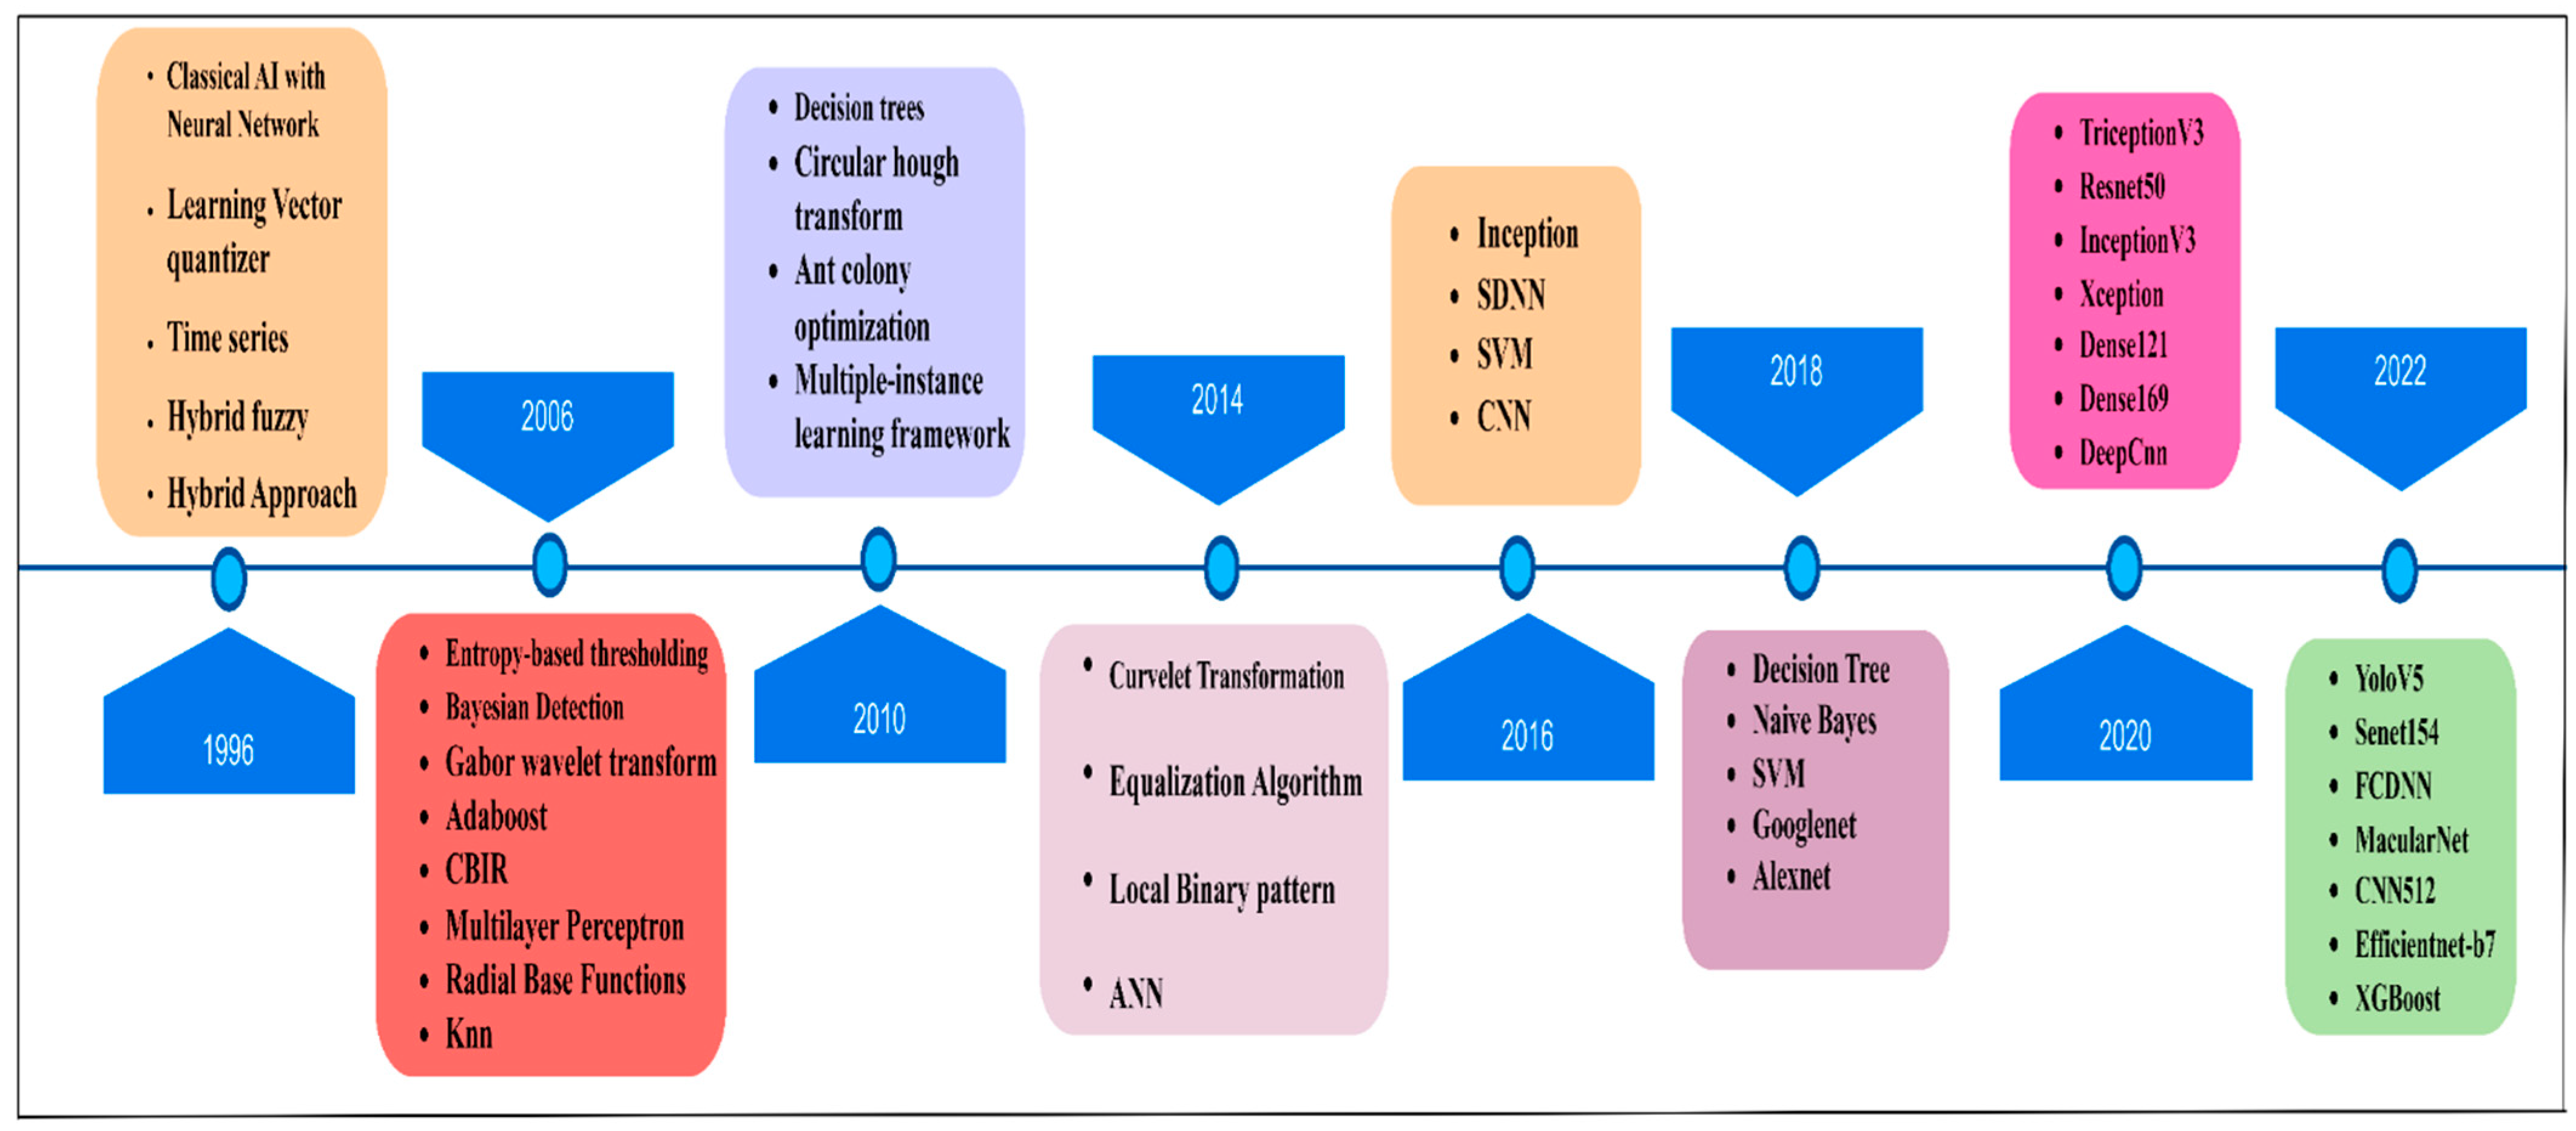
1.3. Evolution of DR Using AI
1.4. Prior Research
- Datastores in the discipline of DR detection are accessible online, as well as the existence of DR datasets.
- An exhaustive survey of widely used ML and DL methodologies for DR detection is discussed.
- Feature extraction and classification techniques used in DR are discussed.
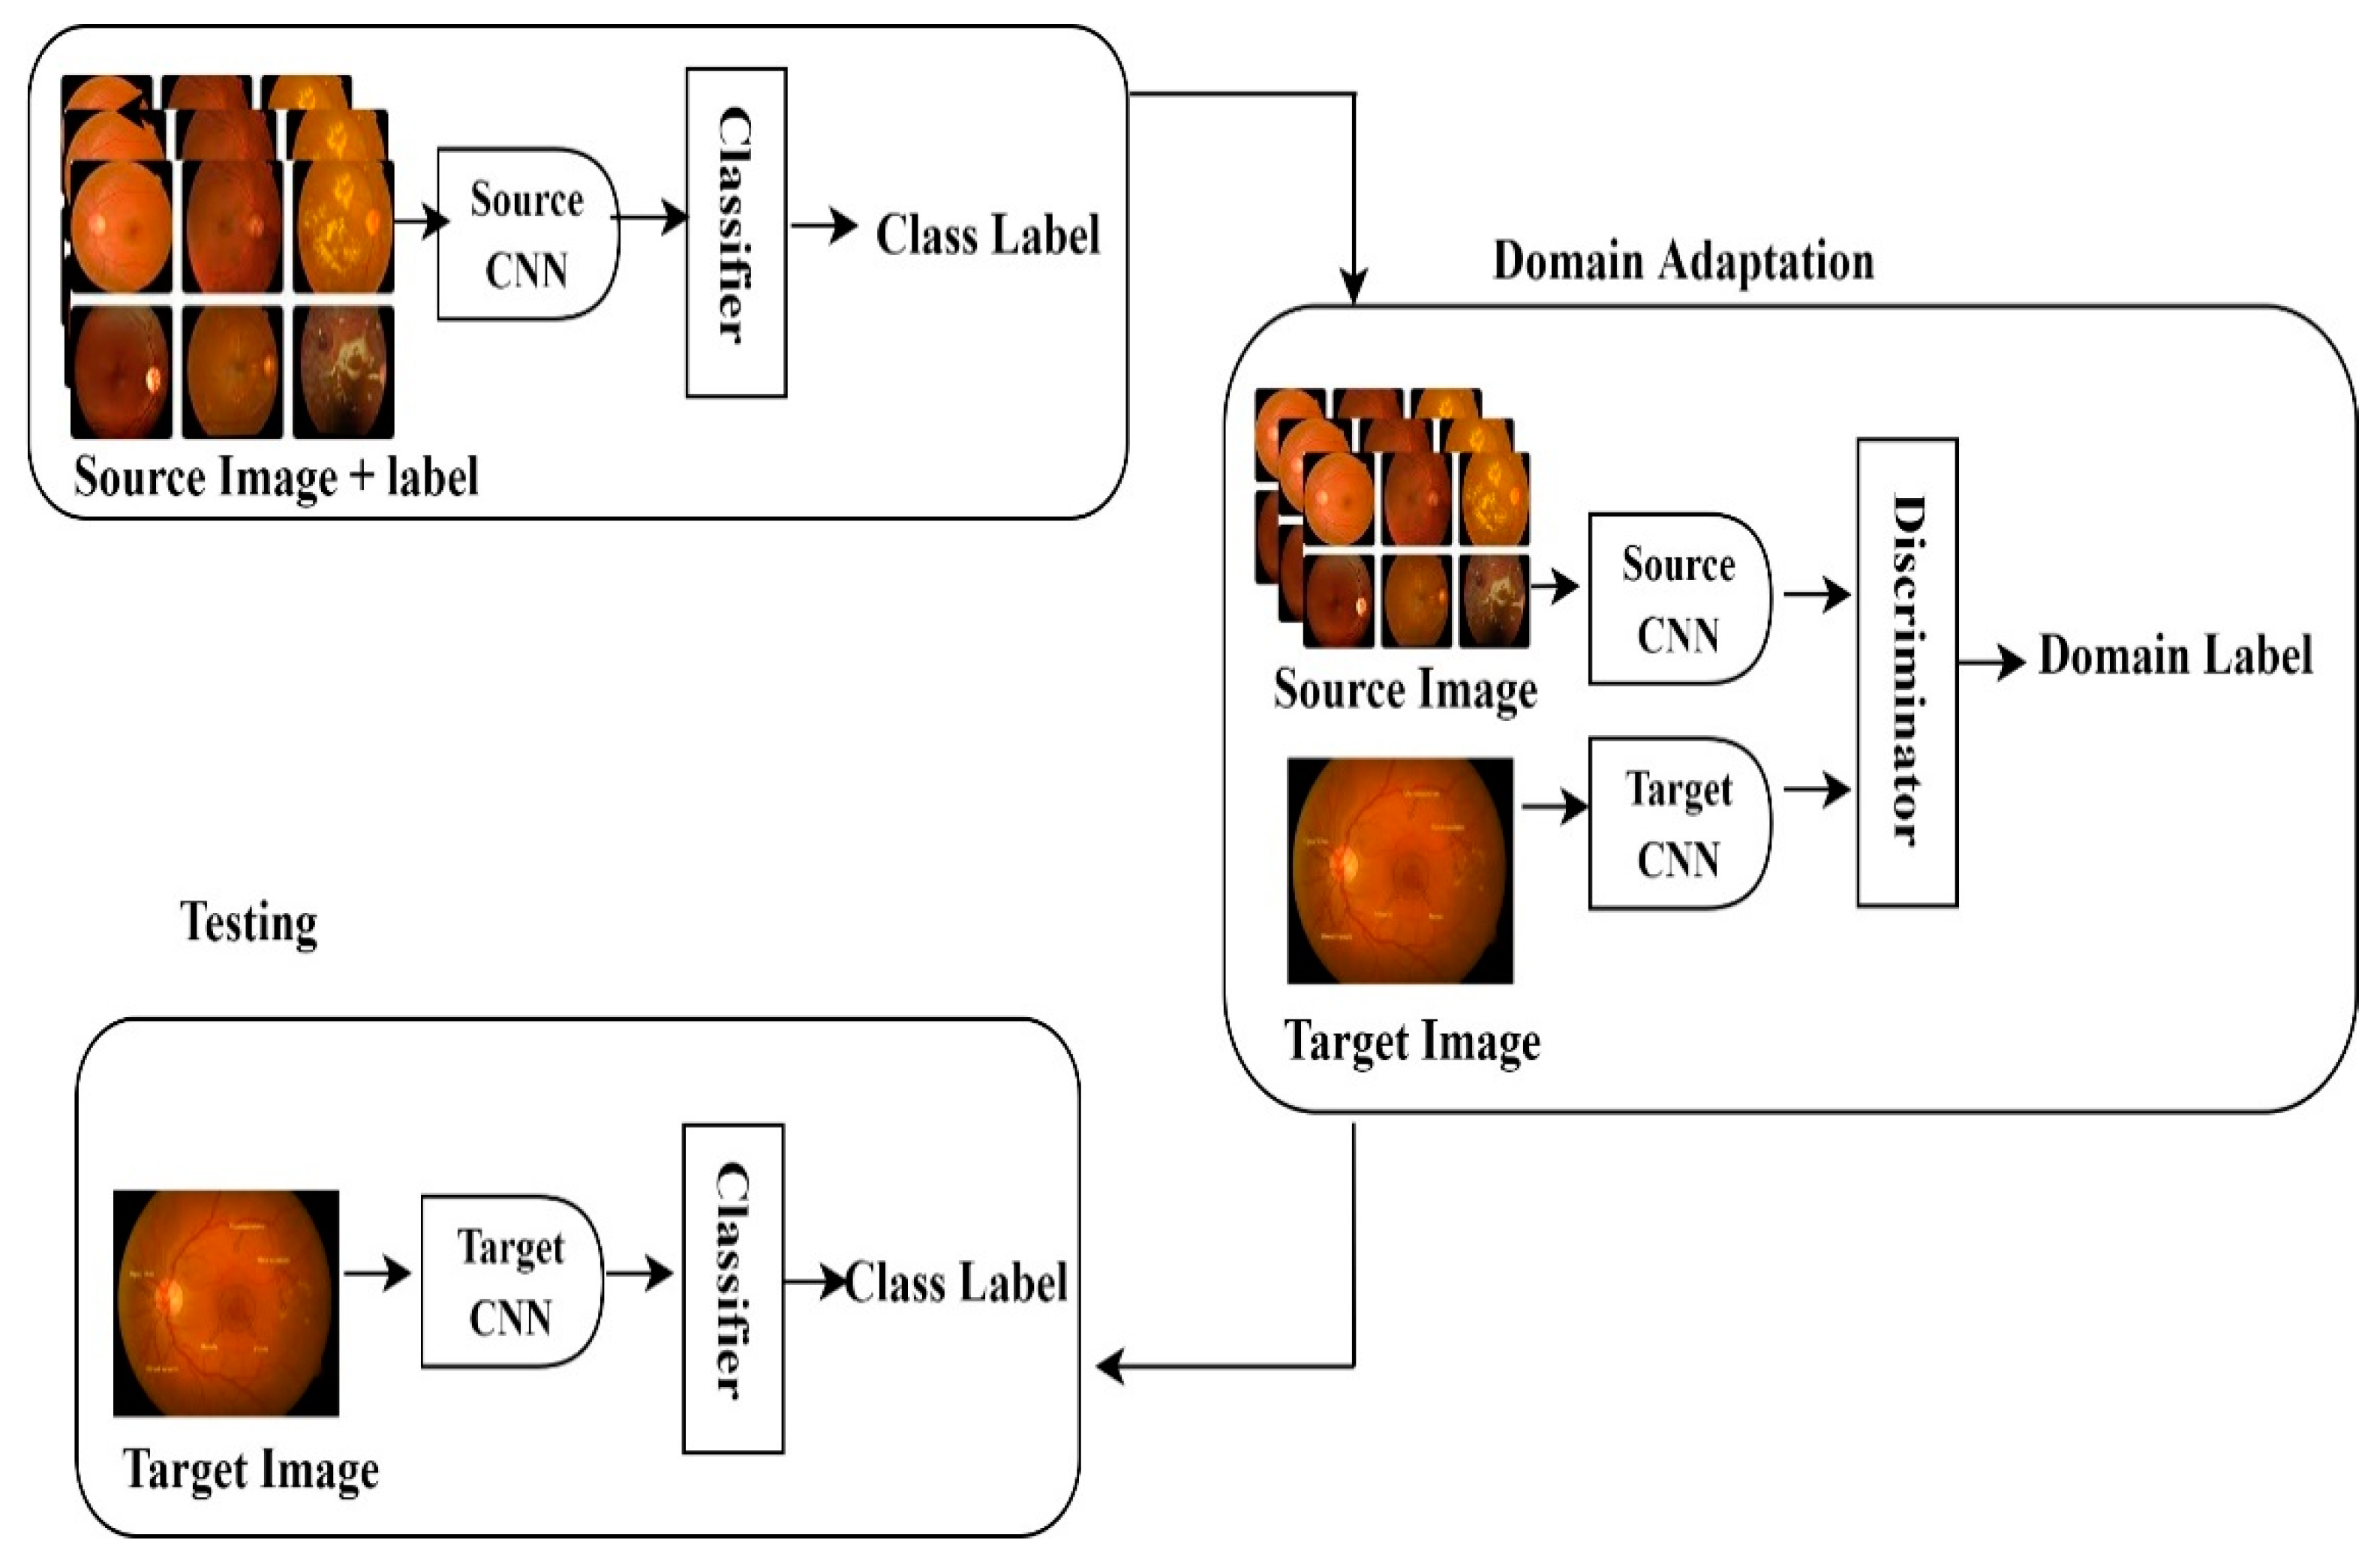
- Future research concepts such as domain adaptation, multitask learning, and explainable AI in DR detection are discussed
1.5. Motivation
1.6. Research Goals
1.7. Contribution of the Study
- To exploring available data sets which have been used for detecting DR.
- To investigate artificial intelligence strategies that have been employed in the literature for DR detection.
- To explore feature extraction and classification.
- To study multiple assessment metrics to analyze DR detection and categorization.
- To highlight the scope of future research, concepts such as domain adaptation, multitask learning, and explainable AI in DR detection techniques used in DR.
2. Research Mechanism of Study
Paradigms for Inclusion and Exclusion
- (a)
- Insignificant scientific studies were weeded out depending on the info and terms found in study summaries. Summaries of scientific papers that fulfilled a minimum of 40% of an IC are maintained for other stages.
- (b)
- Full-text screening: Articles with summaries that only address limited elements of the keyword search are rejected if they do not reference or connect to a particular keyword in Table 3.
- (c)
- Step of quality assurance: The leftover scientific studies were subject to something such as a qualitative review, and those that did not meet any of the eligibility principles were eliminated.
- RC1: Recommendations and results must be included in research articles.
- RC2: Scientific data must be included in scientific papers to support their conclusions.
- RC3: The aims and findings of the research must be expressed.
- RC4: For scientific studies, citations must be proper and adequate.
3. RQ1 Artificial Intelligence for DR Detection
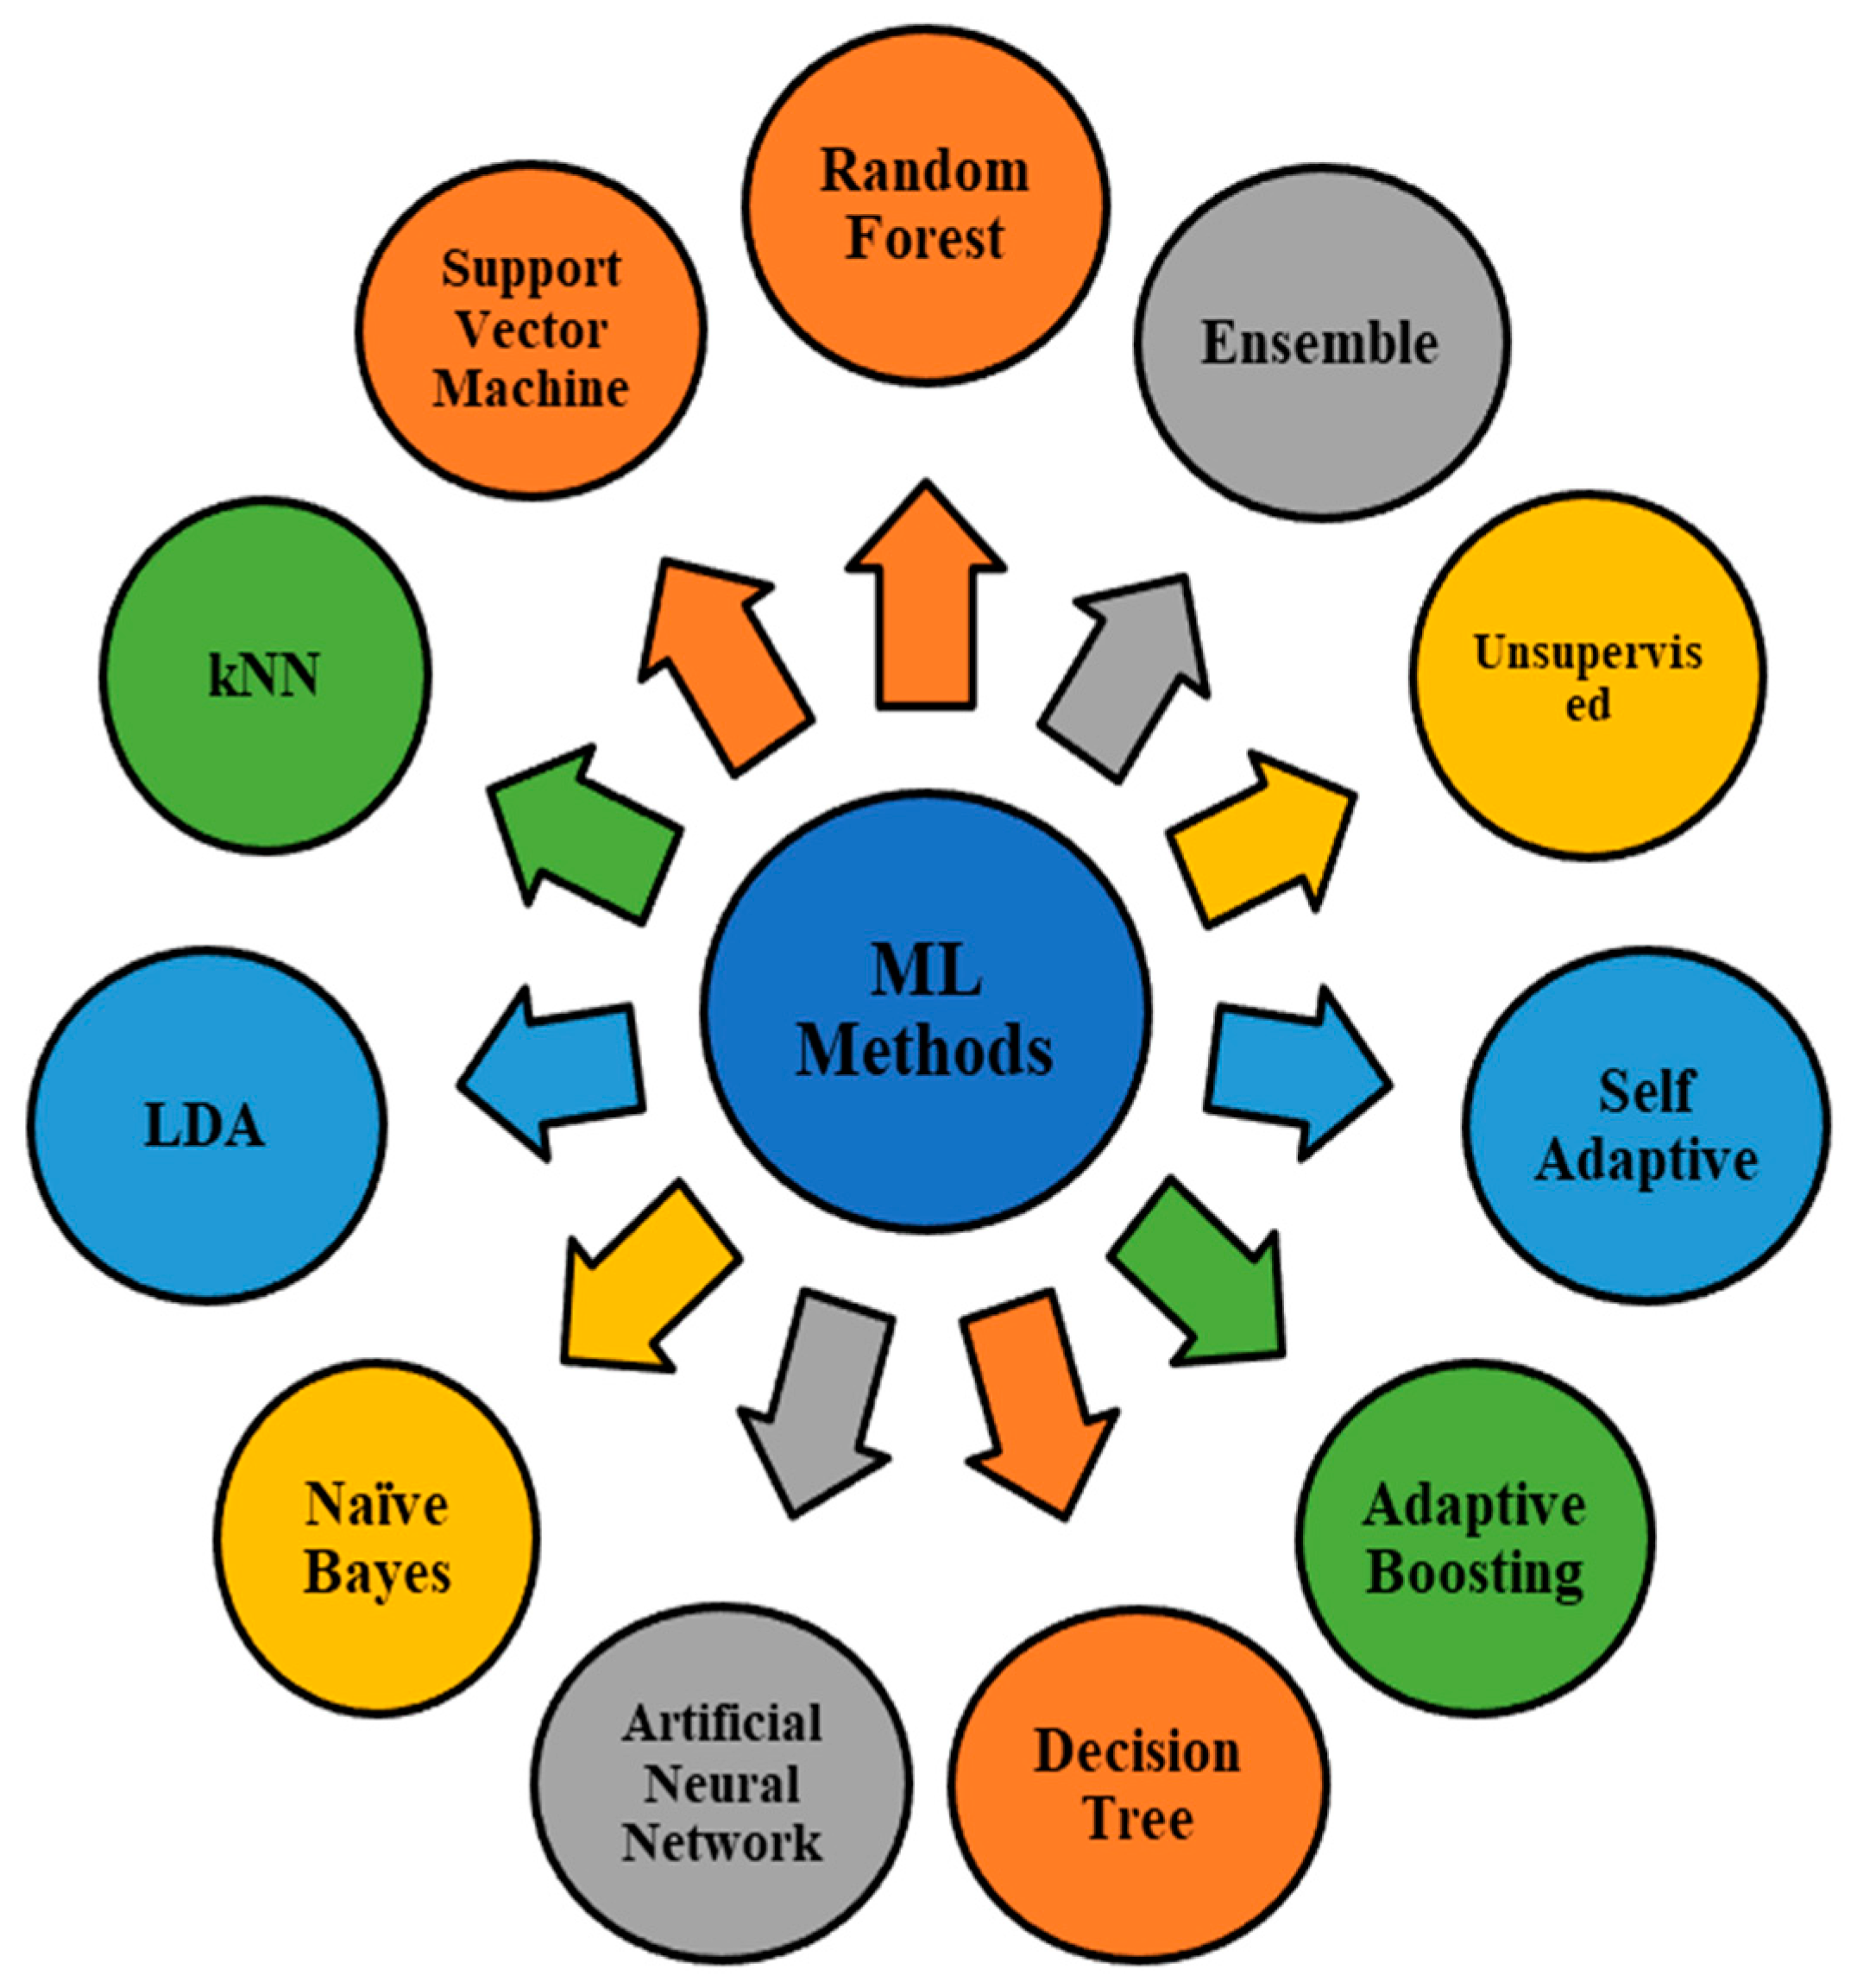
3.1. Machine Learning Techniques in DR Detection
- (a)
- Linear Discrimination Analysis: The local linear discriminating study forms the most extensively utilized classifications and dimension reduction methods. It can be used to discriminate between multiple classes. It finds a projection to a line, allowing samples from various classes to be separated [15]. In the critical ML investigations, LLDA was utilized only once. Wu and Xin [52] used the LLDA algorithm to detect microaneurysms and compared the results with the SVM and k-NN in the ROC dataset. The authors found that the LLDA algorithm failed to perform, and the SVM gave good results for both the LLDA and k-NN, in terms of accuracy.
- (b)
- Decision Trees: A fundamental tool for solving classification tasks. Its structure is similar to a tree and hierarchical, where an internal node represents a test on an attribute, a branch represents a test outcome, and a terminal node carries a class label. A root node is a topmost node in a tree. It is used to represent decisions in decision analysis. One of the benefits of a DT is that it does not necessitate much data preparation. One downside of a DT is that it can occasionally result in overly complicated DTs, often known as overfitting. With DIARETDB0 and DIARETDB1 datasets, Rahim and Jayne [53] detected microaneurysms from retinopathy images using SVM and k-NN.90% of the total photos were used for training, while the remaining 10% were used to test the classification algorithms.
- (c)
- Support Vector Machines: SVMs (support vector machines) is a CNN model for categorizing data. This generates a binary classifier around the datasets example (support vectors and hyperplane). Accordingly, the A+ and A− categories denote the nearest distances toward the positively and negatively extreme examples. A hyperplane is a plane that separates the A+ and A− levels, featuring A+ on one side of the hyperplane and A− on another [15]. In various studies, researchers successfully employed SVM techniques to classify distinct DR conditions, including [54,55,56,57,58]. Furthermore, the authors claim that the SVM improves classification performance. SVM, SCG-BPN, and GRN exudates within retinal photos have been detected and classified using techniques by Vanithamani and Renee Christina [59]. The DIARETDB1 dataset, consisting of 40 training and 40 testing images, was used. The experimental findings revealed that the SVM algorithm outperformed the SCG-BPN and GRN algorithms in classification performance.
- (d)
- Naïve Bayes: As a result, it is a quick and straightforward categorization algorithm. Wang and Tang [60] examined three classification systems for microaneurysm detection: NB, k-NN, and SVM. Tests were conducted on the private and public datasets. k-NN outperformed in its research compared to the NB method.
- (e)
- K-Nearest Neighbor: One of the most basic and straightforward ML techniques is the k-nearest neighbor (k-NN) methodology. It classifies items in a feature set using the training set’s nearest instances. The character “k” shows the cluster count utilized by the classifiers to build its prediction. Among the 40 publications about ML, the k-NN algorithm was employed in numerous investigations [15]. The k-NN method was utilized by Nijalingappa and Sandeep [61] to classify DR into severity stages. They employed 169 photos from Messidor and DIARETDB1 datasets and a unique dataset [53] in their research. They used 119 photos to train their ML method and 50 photographs to test it. The classification results produced by k-NN are satisfactory.
- (f)
- Random Forest: Random forest is an effective and successful ML classification method. It forms decision trees in forests (DT). The projections will be much more accurate if enough bushes are in the forests. Every tree casts a judgment about categorizing a novel method depending on its characteristics, and the models are then stored with the tree’s name. The category with the best scores is chosen by forest. To put it differently, an RF classification technique is comparable to the bagging technique. A subset of the training dataset is formed in RF, and a DT is created for each subset. In the testing set, every input sequence is classified by all the DTs, as well as the forest chooses the one with the best scores [15]. The RF classifier was only used once in the experiments that were chosen. The RF classifier was used by Xiao and Yu [62] to detect bleeding in retinal images. They used 35 photos from a unique dataset and 55 images from DIARETDB1. They employed 70% of the photos for training the ML network, and the remaining 30% were used for testing and classification with the RF technique. The RF algorithm acquired good sensitivity, according to the findings of the experiments.
- (g)
- Artificial Neural Networks: This classifier comprises three layers: input nodes, hidden nodes, and an output vector. There seem to be numerous nodes in the input and hidden nodes, but only one in the output nodes. A neuron is a type of activating unit in a neural network. Patterns are sent from the input nodes layer, which does the actual processing. The node with hidden units is allocated random weights. The output node is equipped with a hidden layer, ready for the outcome. It is similar to a perceptron in that it takes numerous inputs and creates a single output.
- (h)
- Unsupervised Classification: Unsupervised classification is employed when prior knowledge is unavailable. Inside this circumstance, just the set of information and characteristics that correspond to specific occurrences is revealed. In the chosen papers, unsupervised classification techniques were used many times. Zhou and Wu [22,69] used a ROC dataset with 100 images to perform unsupervised classification for microaneurysm identification. 50% of the photos were used for training, and the other 50% were used for testing in their experiments. In their experiments, the authors found that unsupervised classifiers performed reasonably well. Unsupervised classification methods were used by Kusakunniran and Wu [70], and Biyani and Patre [53], to identify exudates in DR scans, with a sensitivity of 89% and 88%, accordingly.
- (i)
- Ensemble Classifiers: It is also called group learning and it combines different classification methods to create a more accurate model, and is a type of learning that takes place in groups [71]. There are three ways to do it: bagging, boosting, and stacking. Many classifying techniques work at a time in parallel during bagging, and the most accurate one is voted on at the end. The final classifier is the one that receives the most votes. Boosting is a technique that employs a sequence of classification algorithms. The weight of every model is adjusted based on the prior iteration. The data are split into many segments, each of which is checked with the help of others, and so on [72]. The stacking comprises base models, often known as level-0 models, as well as a meta-model that combines the level-0 model prediction. Stacking contrasts with boosting, in which a meta-model focuses on learning how to effectively combine the predictions again from base models, rather than a series of models that solve former models’ prediction mistakes [73].
- (j)
- Adaptive Boosting: AdaBoost is a systematic way to analyze a wide range of empirical systems. It works step-by-step, wherein each tree fits into a modified version of the original dataset before producing a robust classifier. This technique was utilized once in the chosen significant research. The AdaBoost method was used by Prentasic and Loncaric [76], wherein exudates were detected in DR images and a sensitivity of 75% was achieved, according to their experiments.
- (k)
- Self-Adaptive Resource Allocation Network Classifier: It selects training data based on self-regularized phenomena and then discards redundant data, requiring less memory and computer capacity. The network is then trained using the selected samples that have more information. Although the SRAN method was used two times in the primary ML tests, it did not perform as well as other categorization techniques. The authors of [22,77] evaluated the SRAN classification method to the McNN and SVM classifiers again to identify and track different ocular illnesses. A dataset from Coimbatore, India’s Lotus Eye Hospital, was used in their study.
3.2. Deep Learning in DR Screening
3.3. Transfer Learning in DR
4. RQ2 Feature Extraction Techniques for DR
4.1. Explicit or Traditional Feature Extraction Methods
4.2. Direct Methods
5. RQ3 Datasets Available for DR
6. RQ4 Evaluation Measures Used for DR Detection
6.1. False Positive Rate (FPR)
6.2. False Negative Rate (FNR)
6.3. Accuracy [89]
6.4. Specificity
6.5. Sensitivity/Recall Rate
6.6. F-Score
6.7. ROC
6.8. Positive Predictive Value (PPV)
6.9. Negative Predictive Value (NPV)
6.10. False Discovery Rate (FDR)
6.11. Confusion Matrix
- True Negative: when the model’s predicted and the actual value is No.
- True Positive: when the model’s predicted and the actual value is Yes.
- False Negative: when the model’s predicted value is Yes, and the actual value is No. It is also known as a Type-II mistake.
- False Positive: when the model’s predicted value is No, and the actual value is Yes. A type-I mistake is another name for it.
6.12. Kappa Value
7. EMR and Biomarkers in DR
- Genetics: The investigation of genes associated with the development of advanced DR, vascular endothelial growth factor (VEGF), lipoproteins, and inflammation. There have been genome-wide association studies and single nucleotide polymorphisms (SNPs) linked to an enhanced danger of sight-threatening retinopathy [164].
- Proteomics: It is the study of protein structure and function research in cultured cells and tissues. A current study shows that diabetic patients have higher levels of transport proteins (vitamin D binding protein), arginine N-methyltransferase 5, and inflammatory proteins (leucine-rich alpha-2-glycoprotein) [167,168].
- Metabolomics: The study of chemical traces left by biological activities. Data on increased metabolite cytidine, cytosine, and thymidine found in DR patients using mass spectrometry is included in the studies. These nucleotide concentrations may be relevant in monitoring DR progression and evaluating therapy [169].
8. RQ5 Challenges and Future Research Directions
9. Discussion
10. Conclusions
Author Contributions
Funding
Institutional Review Board Statement
Informed Consent Statement
Data Availability Statement
Conflicts of Interest
References
- Khatri, M. Diabetes Complications. Available online: https://www.webmd.com/diabetes/diabetes-complications (accessed on 18 May 2022).
- Chakrabarti, R.; Harper, C.A.; Keeffe, J.E. Diabetic Retinopathy Management Guidelines. Expert Rev. Ophthalmol. 2012, 7, 417–439. [Google Scholar] [CrossRef]
- Early Treatment Diabetic Retinopathy Study Research Group. Grading diabetic retinopathy from stereoscopic color fundus photographs- an extension of the modified Airlie House classification. Ophthalmology 2020, 127, S99–S119. [Google Scholar] [CrossRef] [PubMed]
- Scanlon, P.H.; Wilkinson, C.P.; Aldington, S.J.; Matthews, D.R. A Practical Manual of Diabetic Retinopathy Management, 1st ed.; Wiley-Blackwell: Hoboken, NJ, USA, 2009; pp. 1–214. [Google Scholar] [CrossRef]
- Ravelo, J.L. Aging and Population Growth, Challenges for Vision Care: WHO Report. 2019. Available online: https://www.devex.com/news/aging-and-population-growth-challenges-for-vision-care-who-report-95763 (accessed on 3 January 2022).
- WHO. World Report on Vision, 2019. Available online: https://www.who.int/publications/i/item/9789241516570 (accessed on 3 January 2022).
- Kumar, R.; Pal, R. India achieves WHO recommended doctor population ratio: A call for a paradigm shift in public health discourse! J. Fam. Med. Prim. Care 2018, 7, 841–844. [Google Scholar] [CrossRef] [PubMed]
- WHO. Global Data on Visual Impairment. 2010. Available online: http://www.who.int/blindness/GLOBALDATAFINALforweb.pdf (accessed on 5 May 2022).
- Centers for Disease Control and Prevention. Common Eye Disorders and Diseases. 2020. Available online: https://www.cdc.gov/visionhealth/basics/ced/index.html (accessed on 10 May 2022).
- Malik, U. Most Common Eye Problems—Signs, Symptoms and Treatment Options. 2021. Available online: https://irisvision.com/most-common-eye-problems-signs-symptoms-and-treatment/ (accessed on 3 April 2022).
- Stoitsis, J.; Valavanis, I.; Mougiakakou, S.G.; Golemati, S.; Nikita, A.; Nikita, K.S. Computer aided diagnosis based on medical image processing and artificial intelligence methods. Nucl. Instrum. Methods Phys. Res. Sect. A 2006, 569, 591–595. [Google Scholar] [CrossRef]
- Mushtaq, G.; Siddiqui, F. Detection of diabetic retinopathy using deep learning methodology. IOP Conf. Ser. Mater. Sci. Eng. 2021, 1070, 012049. [Google Scholar] [CrossRef]
- Taylor, R.; Batey, D. Handbook of Retinal Screening in Diabetes: Diagnosis and Management. In Handbook of Retinal Screening in Diabetes: Diagnosis and Management, 2nd ed.; Wiley-Blackwell: Chichester, UK, 2012; pp. 89–103. [Google Scholar]
- Gupta, A.; Chhikara, R. Diabetic Retinopathy: Present and Past. Procedia Comput. Sci. 2018, 132, 1432–1440. [Google Scholar] [CrossRef]
- Ishtiaq, U.; Kareem, S.A.; Abdullah, E.R.M.F.; Mujtaba, G.; Jahangir, R.; Ghafoor, H.Y. Diabetic retinopathy detection through artificial intelligent techniques: A review and open issues. Multimedia Tools Appl. 2019, 79, 15209–15252. [Google Scholar] [CrossRef]
- Lin, J.; Yu, L.; Weng, Q.; Zheng, X. Retinal image quality assessment for diabetic retinopathy screening: A survey. Multimedia Tools Appl. 2020, 79, 16173–16199. [Google Scholar] [CrossRef]
- Qureshi, I. Glaucoma Detection in Retinal Images Using Image Processing Techniques: A Survey. Int. J. Adv. Netw. Appl. 2015, 7, 2705–2718. Available online: http://www.ijana.in/papers/V7I2-10.pdf (accessed on 5 April 2022).
- Wang, Z.; Yin, Y.; Shi, J.; Fang, W.; Li, H.; Wang, X. Zoom-in-Net: Deep Mining Lesions for Diabetic Retinopathy Detection. In Proceedings of the International Conference on Medical Image Computing and Computer-Assisted Intervention, Quebec City, QC, Canada, 11–13 September 2017; pp. 267–275. [Google Scholar]
- Scotland, G.S.; McNamee, P.; Fleming, A.D.; Goatman, K.A.; Philip, S.; Prescott, G.J.; Sharp, P.F.; Williams, G.J.; Wykes, W.; Leese, G.P.; et al. Costs and consequences of automated algorithms versus manual grading for the detection of referable diabetic retinopathy. Br. J. Ophthalmol. 2010, 94, 712–719. [Google Scholar] [CrossRef]
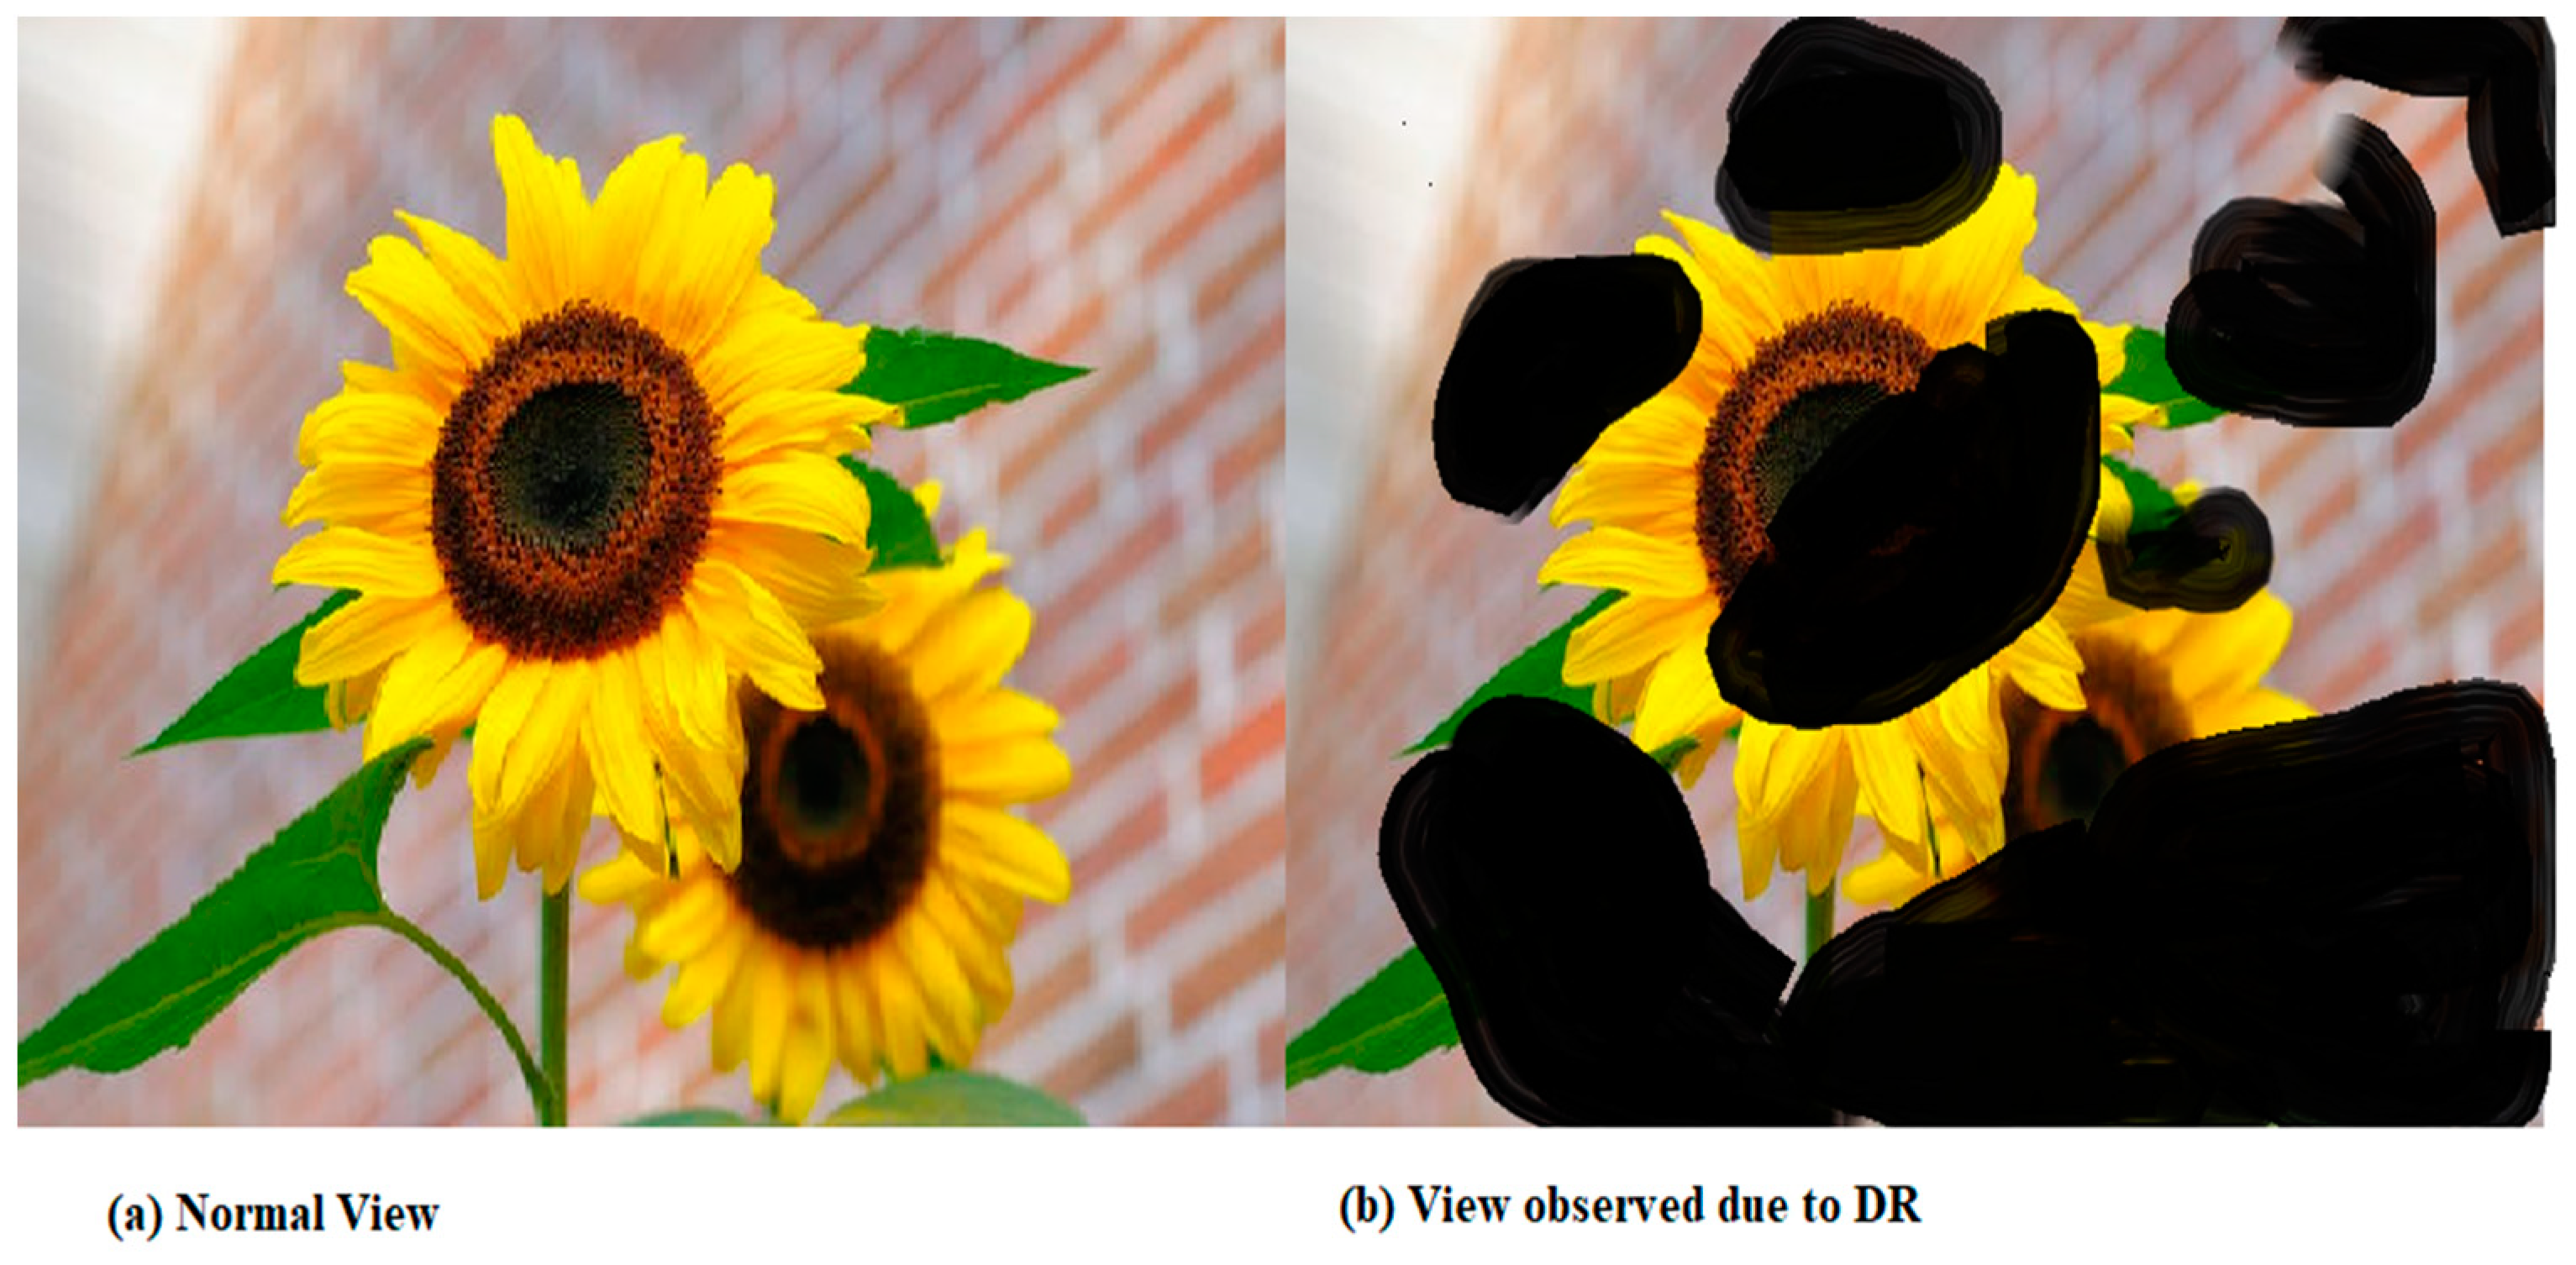
- Difference between Normal Vision and DR Vision. Available online: https://www.researchgate.net/publication/350930649_DRISTI_a_hybrid_deep_neural_network_for_diabetic_retinopathy_diagnosis/figures?lo=1 (accessed on 20 May 2022).
- Li, T.; Gao, Y.; Wang, K.; Guo, S.; Liu, H.; Kang, H. Diagnostic assessment of deep learning algorithms for diabetic retinopathy screening. Inf. Sci. 2019, 501, 511–522. [Google Scholar] [CrossRef]
- Pratt, H.; Coenen, F.; Broadbent, D.M.; Harding, S.P.; Zheng, Y. Convolutional neural networks for diabetic retinopathy. Procedia Comput. Sci. 2016, 90, 200–205. [Google Scholar] [CrossRef] [Green Version]
- Alyoubi, W.L.; Shalash, W.M.; Abulkhair, M.F. Diabetic retinopathy detection through deep learning techniques: A review. Inform. Med. Unlocked 2020, 20, 100377. [Google Scholar] [CrossRef]
- Arrigo, A.; Teussink, M.; Aragona, E.; Bandello, F.; Parodi, M.B. MultiColor imaging to detect different subtypes of retinal microaneurysms in diabetic retinopathy. Eye 2020, 35, 277–281. [Google Scholar] [CrossRef] [PubMed]
- Yasin, S.; Iqbal, N.; Ali, T.; Draz, U.; Alqahtani, A.; Irfan, M.; Rehman, A.; Glowacz, A.; Alqhtani, S.; Proniewska, K.; et al. Severity Grading and Early Retinopathy Lesion Detection through Hybrid Inception-ResNet Architecture. Sensors 2021, 21, 6933. [Google Scholar] [CrossRef] [PubMed]
- Guo, S.; Li, T.; Kang, H.; Li, N.; Zhang, Y.; Wang, K. An end-to-end unified framework for multi-lesion segmentation offundus images. Neurocomput 2019, 349, 52–63. [Google Scholar] [CrossRef]
- Li, B.; Li, H.K. Automated Analysis of Diabetic Retinopathy Images: Principles, Recent Developments, and Emerging Trends. Curr. Diabetes Rep. 2013, 13, 453–459. [Google Scholar] [CrossRef] [PubMed]
- Mishra, A.; Singh, L.; Pandey, M. Short Survey on machine learning techniques used for diabetic retinopathy detection. In Proceedings of the IEEE 2021 International Conference on Computing, Communication, and Intelligent Systems (ICCCIS), Greater Noida, India, 19–20 February 2021; pp. 601–606. [Google Scholar] [CrossRef]
- Oh, K.; Kang, H.M.; Leem, D.; Lee, H.; Seo, K.Y.; Yoon, S. Early detection of diabetic retinopathy based on deep learning and ultra-wide-field fundus images. Sci. Rep. 2021, 11, 1–9. [Google Scholar] [CrossRef]
- Kermany, D.S.; Goldbaum, M.; Cai, W.; Valentim, C.C.S.; Liang, H.; Baxter, S.L.; McKeown, A.; Yang, G.; Wu, X.; Yan, F.; et al. Identifying Medical Diagnoses and Treatable Diseases by Image-Based Deep Learning. Cell 2018, 172, 1122–1131.e9. [Google Scholar] [CrossRef]
- Mansour, R.F. Deep-learning-based automatic computer-aided diagnosis system for diabetic retinopathy. Biomed. Eng. Lett. 2017, 8, 41–57. [Google Scholar] [CrossRef]
- Pepose, J.S. A prospective randomized clinical evaluation of 3 presbyopia-correcting intraocular lenses after cataract extraction. Am. J. Ophthalmol. 2014, 3–9. [Google Scholar] [CrossRef] [PubMed]
- Boudry, C.; Denion, E.; Mortemousque, B.; Mouriaux, F. Trends and topics in eye disease research in PubMed from 2010 to 2014. PeerJ 2016, 4, e1557. [Google Scholar] [CrossRef] [PubMed] [Green Version]
- Gardner, G.G.; Keating, D.; Williamson, T.H.; Elliott, A.T. ORIGINAL ARTICLES-Clinical science Automatic detection of diabetic retinopathy using an artificial neural network: A screening tool. Br. J. Ophthalmol. 1996, 80, 940–944. [Google Scholar] [CrossRef] [Green Version]
- Shi, C.; Lee, J.; Wang, G.; Dou, X.; Yuan, F.; Zee, B. Assessment of image quality on color fundus retinal images using the automatic retinal image analysis. Sci. Rep. 2022, 12, 1–11. [Google Scholar] [CrossRef] [PubMed]
- Franklin, S.W.; Rajan, S.E. An automated retinal imaging method for the early diagnosis of diabetic retinopathy. Technol. Health Care 2013, 21, 557–569. [Google Scholar] [CrossRef]
- Li, S.; Zhao, R.; Zou, H. Artificial intelligence for diabetic retinopathy. Chin. Med. J. 2021, 135, 253–260. [Google Scholar] [CrossRef]
- Pragathi, P.; Rao, A.N. An effective integrated machine learning approach for detecting diabetic retinopathy. Open Comput. Sci. 2022, 12, 83–91. [Google Scholar] [CrossRef]
- Zhang, W.; Zhong, J.; Yang, S.; Gao, Z.; Hu, J.; Chen, Y.; Yi, Z. Automated identification and grading system of diabetic retinopathy using deep neural networks. Knowl. Based Syst. 2019, 175, 12–25. [Google Scholar] [CrossRef]
- Asiri, N.; Hussain, M.; Al Adel, F.; Alzaidi, N. Deep learning based computer-aided diagnosis systems for diabetic retinopathy: A survey. Artif. Intell. Med. 2019, 99, 101701. [Google Scholar] [CrossRef]
- Kamal, M.M.; Shanto, M.H.I.; Mirza Mahmud Hossan, M.; Hasnat, A.; Sultana, S.; Biswas, M. A Comprehensive Review on the Diabetic Retinopathy, Glaucoma and Strabismus Detection Techniques Based on Machine Learning and Deep Learning. Eur. J. Med. Health Sci. 2022, 24–40. [Google Scholar] [CrossRef]
- Aoun, S.M.; Breen, L.J.; Oliver, D.; Henderson, R.D.; Edis, R.; O’Connor, M.; Howting, D.; Harris, R.; Birks, C. Family carers’ experiences of receiving the news of a diagnosis of Motor Neurone Disease: A national survey. J. Neurol. Sci. 2017, 372, 144–151. [Google Scholar] [CrossRef] [PubMed]
- Khade, S.; Ahirrao, S.; Phansalkar, S.; Kotecha, K.; Gite, S.; Thepade, S.D. Iris Liveness Detection for Biometric Authentication: A Systematic Literature Review and Future Directions. Inventions 2021, 6, 65. [Google Scholar] [CrossRef]
- Grzybowski, A.; Brona, P.; Lim, G.; Ruamviboonsuk, P.; Tan, G.S.W.; Abramoff, M.; Ting, D.S.W. Artificial intelligence for diabetic retinopathy screening: A review. Eye 2020, 34, 451–460. [Google Scholar] [CrossRef] [PubMed]
- Ribeiro, L.; Oliveira, C.M.; Neves, C.; Ramos, J.D.; Ferreira, H.; Cunha-Vaz, J. Screening for Diabetic Retinopathy in the Central Region of Portugal. Added Value of Automated ‘Disease/No Disease’ Grading. Ophthalmologica 2015, 233, 96–103. [Google Scholar] [CrossRef] [PubMed]
- Ipp, E.; Liljenquist, D.; Bode, B.; Shah, V.N.; Silverstein, S.; Regillo, C.D.; Lim, J.I.; Sadda, S.; Domalpally, A.; Gray, G.; et al. Pivotal Evaluation of an Artificial Intelligence System for Autonomous Detection of Referrable and Vision-Threatening Diabetic Retinopathy. JAMA Netw. Open 2021, 4, e2134254. [Google Scholar] [CrossRef]
- Larsen, N.; Godt, J.; Grunkin, M.; Lund-Andersen, H.; Larsen, M. Automated Detection of Diabetic Retinopathy in a Fundus Photographic Screening Population. Investig. Opthalmology Vis. Sci. 2003, 44, 767–771. [Google Scholar] [CrossRef] [Green Version]
- Ting, D.S.W.; Cheung, C.Y.-L.; Lim, G.; Tan, G.S.W.; Quang, N.D.; Gan, A.; Hamzah, H.; Garcia-Franco, R.; Yeo, I.Y.S.; Lee, S.Y.; et al. Development and Validation of a Deep Learning System for Diabetic Retinopathy and Related Eye Diseases Using Retinal Images from Multiethnic Populations With Diabetes. JAMA 2017, 318, 2211–2223. [Google Scholar] [CrossRef]
- Gulshan, V.; Peng, L.; Coram, M.; Stumpe, M.C.; Wu, D.; Narayanaswamy, A.; Venugopalan, S.; Widner, K.; Madams, T.; Cuadros, J.; et al. Development and Validation of a Deep Learning Algorithm for Detection of Diabetic Retinopathy in Retinal Fundus Photographs. JAMA 2016, 316, 2402–2410. [Google Scholar] [CrossRef]
- Abràmoff, M.D.; Lavin, P.T.; Birch, M.; Shah, N.; Folk, J.C. Pivotal trial of an autonomous AI-based diagnostic system for detection of diabetic retinopathy in primary care offices. NPJ Digit. Med. 2018, 39, 1–8. [Google Scholar] [CrossRef]
- Dong, X.; Du, S.; Zheng, W.; Cai, C.; Liu, H.; Zou, J. Evaluation of an Artificial Intelligence System for the Detection of Diabetic Retinopathy in Chinese Community Healthcare Centers. Front. Med. 2022, 9, 840024. [Google Scholar] [CrossRef]
- Wu, J.; Xin, J.; Hong, L.; You, J.; Zheng, N. New hierarchical approach for microaneurysms detection with matched filter and machine learning. In Proceedings of the 2015 37th Annual International Conference of the IEEE Engineering in Medicine and Biology Society (EMBC), Milan, Italy, 25–29 August 2015; IEEE: Milan, Italy, 2015; pp. 4322–4325. [Google Scholar] [CrossRef] [Green Version]
- Biyani, R.S.; Patre, B.M. A clustering approach for exudates detection in screening of diabetic retinopathy. In Proceedings of the 2016 International Conference on Signal and Information Processing (IConSIP), Nanded, India, 6–8 October 2016; pp. 1–5. [Google Scholar] [CrossRef]
- Naqvi, S.A.G.; Zafar, M.F.; Haq, I.U. Referral system for hard exudates in eye fundus. Comput. Biol. Med. 2015, 64, 217–235. [Google Scholar] [CrossRef] [PubMed]
- Rahimy, E. Deep learning applications in ophthalmology. Curr. Opin. Ophthalmol. 2018, 29, 254–260. [Google Scholar] [CrossRef] [PubMed]
- Sisodia, D.S.; Nair, S.; Khobragade, P. Diabetic Retinal Fundus Images: Preprocessing and Feature Extraction for Early Detection of Diabetic Retinopathy. Biomed. Pharmacol. J. 2017, 10, 615–626. [Google Scholar] [CrossRef]
- Xiao, Z.; Zhang, X.; Geng, L.; Zhang, F.; Wu, J.; Tong, J.; Ogunbona, P.O.; Shan, C. Automatic non-proliferative diabetic retinopathy screening system based on color fundus image. Biomed. Eng. Online 2017, 16, 122. [Google Scholar] [CrossRef] [PubMed] [Green Version]
- Srivastava, R.; Duan, L.; Wong, D.W.; Liu, J.; Wong, T.Y. Detecting retinal microaneurysms and hemorrhages with robustness to the presence of blood vessels. Comput. Methods Programs Biomed. 2017, 138, 83–91. [Google Scholar] [CrossRef] [PubMed]
- Vanithamani, R.R.C.R.; Renee Christina, R. Exudates in detection and classification of diabetic retinopathy. In International Conference on Soft Computing and Pattern Recognition; Springer: Cham, Germany, 2016; pp. 252–261. Available online: https://books.google.co.in/books?id=hFNuDwAAQBAJ&pg=PA108&lpg=PA108&dq=Vanithamani+R,+Renee+Christina+R+(2018)+Exudates+in+detection+and+classification+of+diabetic+retinopathy:+252–261&source=bl&ots=CWbiXEy9bP&sig=ACfU3U1vfBvwrh06MvSJbSKzMp8Sl2Cm4w&hl=en& (accessed on 5 April 2022).
- Wang, S.; Tang, H.L.; Al Turk, L.I.; Hu, Y.; Sanei, S.; Saleh, G.M.; Peto, T. Localizing Microaneurysms in Fundus Images Through Singular Spectrum Analysis. IEEE Trans. Biomed. Eng. 2016, 64, 990–1002. [Google Scholar] [CrossRef] [PubMed]
- Nijalingappa, P.; Sandeep, B. Machine learning approach for the identification of diabetes retinopathy and its stages. In Proceedings of the 2015 International Conference on Applied and Theoretical Computing and Communication Technology (iCATccT), Davangere, India, 29–31 October 2016; pp. 653–658. [Google Scholar] [CrossRef]
- Xiao, D.; Yu, S.; Vignarajan, J.; An, D.; Tay-Kearney, M.-L.; Kanagasingam, Y. Retinal hemorrhage detection by rule-based and machine learning approach. In Proceedings of the 2017 39th Annual International Conference of the IEEE Engineering in Medicine and Biology Society (EMBC), Jeju Island, Republic of Korea, 11–15 July 2017; pp. 660–663. [Google Scholar] [CrossRef]
- Almotiri, J.; Elleithy, K.; Elleithy, A. Retinal Vessels Segmentation Techniques and Algorithms: A Survey. Appl. Sci. 2018, 8, 155. [Google Scholar] [CrossRef] [Green Version]
- Bui, T.; Maneerat, N.; Watchareeruetai, U. Detection of cotton wool for diabetic retinopathy analysis using neural network. In Proceedings of the IEEE 10th International Workshop on Computational Intelligence and Applications, Hiroshima, Japan, 11–12 November 2017; pp. 203–206. [Google Scholar] [CrossRef]
- Franklin, S.W.; Rajan, S.E. Computerized screening of diabetic retinopathy employing blood vessel segmentation in retinal images. Biocybern. Biomed. Eng. 2014, 34, 117–124. [Google Scholar] [CrossRef]
- Hanđsková, V.; Pavlovičova, J.; Oravec, M.; Blaško, R. Diabetic Rethinopathy Screening by Bright Lesions Extraction from Fundus Images. J. Electr. Eng. 2013, 64, 311–316. [Google Scholar] [CrossRef] [Green Version]
- Kavitha, M.; Palani, S. Hierarchical classifier for soft and hard exudates detection of retinal fundus images. J. Intell. Fuzzy Syst. 2014, 27, 2511–2528. [Google Scholar] [CrossRef]
- Paing, M.P.; Choomchuay, S.; Yodprom, M.D.R. Detection of lesions and classification of diabetic retinopathy using fundus images. In Proceedings of the 2016 9th Biomedical engineering international conference (BMEiCON), Laung Prabang, Laos, 7–9 December 2016; pp. 1–5. [Google Scholar] [CrossRef]
- Zhou, W.; Wu, C.; Chen, D.; Yi, Y.; Du, W. Automatic Microaneurysm Detection Using the Sparse Principal Component Analysis-Based Unsupervised Classification Method. IEEE Access 2017, 5, 2563–2572. [Google Scholar] [CrossRef]
- Kusakunniran, W.; Wu, Q.; Ritthipravat, P.; Zhang, J. Hard exudates segmentation based on learned initial seeds and iterative graph cut. Comput. Methods Programs Biomed. 2018, 158, 173–183. [Google Scholar] [CrossRef] [PubMed]
- Khade, S.; Gite, S.; Thepade, S.D.; Pradhan, B.; Alamri, A. Detection of Iris Presentation Attacks Using Feature Fusion of Thepade’s Sorted Block Truncation Coding with Gray-Level Co-Occurrence Matrix Features. Sensors 2021, 21, 7408. [Google Scholar] [CrossRef] [PubMed]
- Wen, L. Algorithms: A Comparative Study of Bagging, Boosting and Stacking Techniques. Remote Sens 2020, 12, 1683. [Google Scholar] [CrossRef]
- Brownlee, J. Stacking Ensemble Machine Learning with Python. In Machine Learning Mastery; Machine Learning Mastery: San Francisco, CA, USA, 2020; Available online: https://machinelearningmastery.com/stacking-ensemble-machine-learning-with-python/ (accessed on 21 May 2022).
- Mane, V.M.; Jadhav, D.V.; Shirbahadurkar, S.D. Hybrid classifier and region-dependent integrated features for detection of diabetic retinopathy. J. Intell. Fuzzy Syst. 2017, 32, 2837–2844. [Google Scholar] [CrossRef]
- Fraz, M.M.; Jahangir, W.; Zahid, S.; Hamayun, M.M.; Barman, S.A. Multiscale segmentation of exudates in retinal images using contextual cues and ensemble classification. Biomed. Signal Process. Control. 2017, 35, 50–62. [Google Scholar] [CrossRef] [Green Version]
- Prentašić, P.; Lončarić, S. Detection of exudates in fundus photographs using deep neural networks and anatomical landmark detection fusion. Comput. Methods Programs Biomed. 2016, 137, 281–292. [Google Scholar] [CrossRef]
- Bala, M.P.; Vijayachitra, S. Early detection and classification of microaneurysms in retinal fundus images using sequential learning methods. Int. J. Biomed. Eng. Technol. 2014, 15, 128. [Google Scholar] [CrossRef]
- Sopharak, A.; Uyyanonvara, B.; Barman, S.; Williamson, T. Comparative Analysis of Automatic Exudate Detection between Machine Learning and Traditional Approaches. IEICE Trans. Inf. Syst. 2009, 92, 2264–2271. [Google Scholar] [CrossRef] [Green Version]
- Srinivasan, R.; Surya, J.; Ruamviboonsuk, P.; Chotcomwongse, P.; Raman, R. Influence of Different Types of Retinal Cameras on the Performance of Deep Learning Algorithms in Diabetic Retinopathy Screening. Life 2022, 12, 1610. [Google Scholar] [CrossRef]
- Valarmathi, S.; Vijayabhanu, R. A Survey on Diabetic Retinopathy Disease Detection and Classification using Deep Learning Techniques. In Proceedings of the 2021 IEEE 7th International Conference on Bio Signals, Images and Instrumentation, ICBSII, Chennai, India, 25–27 March 2021; pp. 1–4. [Google Scholar] [CrossRef]
- Wang, X.; Lu, Y.; Wang, Y.; Chen, W.-B. Diabetic Retinopathy Stage Classification Using Convolutional Neural Networks. In Proceedings of the 2018 IEEE 19th International Conference on Information Reuse and Integration for Data Science, IRI, Salt Lake City, UT, USA, 7–9 July 2018; pp. 465–471. [Google Scholar] [CrossRef]
- Chudzik, P.; Majumdar, S.; Calivá, F.; Al-Diri, B.; Hunter, A. Microaneurysm detection using fully convolutional neural networks. Comput. Methods Programs Biomed. 2018, 158, 185–192. [Google Scholar] [CrossRef]
- Yan, Y.; Gong, J.; Liu, Y. A Novel Deep Learning Method for Red Lesions Detection Using Hybrid Feature. In Proceedings of the 31st Chinese Control and Decision Conference, CCDC, Nanchang, China, 3–5 June 2019; pp. 2287–2292. [Google Scholar] [CrossRef]
- Guo, Y.; Liu, Y.; Oerlemans, A.; Lao, S.; Wu, S.; Lew, M.S. Deep learning for visual understanding: A review. Neurocomputing 2016, 187, 27–48. [Google Scholar] [CrossRef]
- Abbas, Q.; Ibrahim, M.E.A.; Jaffar, M.A. Video scene analysis: An overview and challenges on deep learning algorithms. Multimed. Tools Appl. 2017, 77, 20415–20453. [Google Scholar] [CrossRef]
- Gurcan, O.F.; Beyca, O.F.; Dogan, O. A Comprehensive Study of Machine Learning Methods on Diabetic Retinopathy Classification. Int. J. Comput. Intell. Syst. 2021, 14, 1132–1141. [Google Scholar] [CrossRef]
- Khade, S.; Gite, S.; Pradhan, B. Iris Liveness Detection Using Multiple Deep Convolution Networks. Big Data Cogn. Comput. 2022, 6, 67. [Google Scholar] [CrossRef]
- Ketkar, N.; Moolayil, J. Deep Learning with Python; Manning Publications: New York, NY, USA, 2021. [Google Scholar] [CrossRef]
- Olivas, E.S.; Guerrero, J.D.M.; Martinez-Sober, M.; Magdalena-Benedito, J.R.; Serrano, L. Magdalena-Benedito, Handbook of Research on Machine Learning Applications and Trends: Algorithms, Methods, and Techniques; IGI Global: Pennsylvania, PA, USA, 2010. [Google Scholar]
- Masood, S.; Luthra, T.; Sundriyal, H.; Ahmed, M. Identification of diabetic retinopathy in eye images using transfer learning. In Proceedings of the International Conference on Computing, Communication and Automation (ICCCA), Greater Noida, India, 5–6 May 2017; pp. 1183–1187. [Google Scholar] [CrossRef]
- Xu, X.; Lin, J.; Tao, Y.; Wang, X. An Improved DenseNet Method Based on Transfer Learning for Fundus Medical Images. In Proceedings of the 2018 7th international conference on digital home (ICDH), Guilin, China, 30 November–1 December 2018; pp. 137–140. [Google Scholar] [CrossRef]
- Lian, C.; Liang, Y.; Kang, R.; Xiang, Y. Deep Convolutional Neural Networks for Diabetic Retinopathy Classification. ACM Int. Conf. Proceeding Ser. 2018, 72, 68–72. [Google Scholar] [CrossRef]
- Blakely, M. ‘The Importance of Sight and Vision,’ Marvel Optics. 2015. Available online: https://www.marveloptics.com/blog/the-importance-of-sight-and-vision-molly-blakely/ (accessed on 7 April 2022).
- Quellec, G.; Charrière, K.; Boudi, Y.; Cochener, B.; Lamard, M. Deep image mining for diabetic retinopathy screening. Med. Image Anal. 2017, 39, 178–193. [Google Scholar] [CrossRef] [PubMed]
- Oliveira, A.; Pereira, S.; Silva, C. Retinal vessel segmentation based on Fully Convolutional Neural Networks. Expert Syst. Appl. 2018, 112, 229–242. [Google Scholar] [CrossRef] [Green Version]
- Orlando, J.I.; Prokofyeva, E.; del Fresno, M.; Blaschko, M.B. An ensemble deep learning based approach for red lesion detection in fundus images. Comput. Methods Programs Biomed. 2018, 153, 115–127. [Google Scholar] [CrossRef] [Green Version]
- Mahendran, G.; Dhanasekaran, R. Investigation of the severity level of diabetic retinopathy using supervised classifier algorithms. Comput. Electr. Eng. 2015, 45, 312–323. [Google Scholar] [CrossRef]
- Wu, D.; Zhang, M.; Liu, J.-C.; Bauman, W. On the Adaptive Detection of Blood Vessels in Retinal Images. IEEE Trans. Biomed. Eng. 2006, 53, 341–343. [Google Scholar] [CrossRef]
- Sánchez, C.I.; García, M.; Mayo, A.; Lopez, M.I.; Hornero, R. Retinal image analysis based on mixture models to detect hard exudates. Med. Image Anal. 2009, 13, 650–658. [Google Scholar] [CrossRef] [PubMed]
- García, M.; Sánchez, C.I.; López, M.I.; Abásolo, D.; Hornero, R. Neural network based detection of hard exudates in retinal images. Comput. Methods Programs Biomed. 2009, 93, 9–19. [Google Scholar] [CrossRef] [PubMed] [Green Version]
- Sánchez, C.I.; Hornero, R.; López, M.I.; Aboy, M.; Poza, J.; Abásolo, D. A novel automatic image processing algorithm for detection of hard exudates based on retinal image analysis. Med. Eng. Phys. 2008, 30, 350–357. [Google Scholar] [CrossRef] [PubMed] [Green Version]
- Quellec, G.; Lamard, M.; Abramoff, M.; Decencière, E.; Lay, B.; Erginay, A.; Cochener, B.; Cazuguel, G. A multiple-instance learning framework for diabetic retinopathy screening. Med. Image Anal. 2012, 16, 1228–1240. [Google Scholar] [CrossRef]
- Köse, C.; Şevik, U.; Ikibaş, C.; Erdöl, H. Simple methods for segmentation and measurement of diabetic retinopathy lesions in retinal fundus images. Comput. Methods Programs Biomed. 2012, 107, 274–293. [Google Scholar] [CrossRef]
- Giancardo, L.; Meriaudeau, F.; Karnowski, T.P.; Li, Y.; Garg, S.; Tobin, K.W.; Chaum, E. Exudate-based diabetic macular edema detection in fundus images using publicly available datasets. Med. Image Anal. 2012, 16, 216–226. [Google Scholar] [CrossRef]
- Zhang, B.; Karray, F.; Li, Q.; Zhang, L. Sparse Representation Classifier for microaneurysm detection and retinal blood vessel extraction. Inf. Sci. 2012, 200, 78–90. [Google Scholar] [CrossRef]
- Qureshi, R.J.; Kovacs, L.; Harangi, B.; Nagy, B.; Peto, T.; Hajdu, A. Combining algorithms for automatic detection of optic disc and macula in fundus images. Comput. Vis. Image Underst. 2012, 116, 138–145. [Google Scholar] [CrossRef]
- Noronha, K.; Acharya, U.R.; Nayak, K.P.; Kamath, S.; Bhandary, S.V. Decision support system for diabetic retinopathy using discrete wavelet transform. Proc. Inst. Mech. Eng. Part H J. Eng. Med. 2012, 227, 251–261. [Google Scholar] [CrossRef]
- Gharaibeh, N.; Al-Hazaimeh, O.M.; Abu-Ein, A.; Nahar, K.M. A Hybrid SVM NAÏVE-BAYES Classifier for Bright Lesions Recognition in Eye Fundus Images. Int. J. Electr. Eng. Inform. 2021, 13, 530–545. [Google Scholar] [CrossRef]
- Al Hazaimeh, O.M.; Nahar, K.M.; Al Naami, B.; Gharaibeh, N. An effective image processing method for detection of diabetic retinopathy diseases from retinal fundus images. Int. J. Signal Imaging Syst. Eng. 2018, 11, 206. [Google Scholar] [CrossRef]
- Akram, M.U.; Khalid, S.; Khan, S.A. Identification and classification of microaneurysms for early detection of diabetic retinopathy. Pattern Recognit. 2013, 46, 107–116. [Google Scholar] [CrossRef]
- Harini, R.; Sheela, N. Feature extraction and classification of retinal images for automated detection of Diabetic Retinopathy. In Proceedings of the 2016 Second International Conference on Cognitive Computing and Information Processing (CCIP), Mysuru, India, 12–13 August 2016; Nagabhusan, T.N., Sundararajan, N., Suresh, S., Eds.; Sri Jayachamarajendra College of Engineering, JSS TI Campus: Mysuru, India, 2016; p. 570006. [Google Scholar]
- Umapathy, A.; Sreenivasan, A.; Nairy, D.S.; Natarajan, S.; Rao, B.N. Image Processing, Textural Feature Extraction and Transfer Learning based detection of Diabetic Retinopathy. In Proceedings of the 2019 9th International Conference on Bioscience, Biochemistry and Bioinformatics, Singapore, 7–9 January 2019; pp. 17–21. [Google Scholar] [CrossRef]
- Zago, G.T.; Andreão, R.V.; Dorizzi, B.; Salles, E.O.T. Diabetic retinopathy detection using red lesion localization and convolutional neural networks. Comput. Biol. Med. 2019, 116, 103537. [Google Scholar] [CrossRef]
- Jiang, H.; Yang, K.; Gao, M.; Zhang, D.; Ma, H.; Qian, W. An Interpretable Ensemble Deep Learning Model for Diabetic Retinopathy Disease Classification. In Proceedings of the 2019 41st Annual International Conference of the IEEE Engineering in Medicine and Biology Society (EMBC), Berlin, Germany, 23–27 July 2019; pp. 2045–2048. [Google Scholar] [CrossRef]
- Abràmoff, M.D.; Garvin, M.K.; Sonka, M. Retinal Imaging and Image Analysis. IEEE Rev. Biomed. Eng. 2010, 3, 169–208. [Google Scholar] [CrossRef]
- Gargeya, R.; Leng, T. Automated Identification of Diabetic Retinopathy Using Deep Learning. Ophthalmology 2017, 124, 962–969. [Google Scholar] [CrossRef]
- Doshi, D.; Shenoy, A.; Sidhpura, D.; Gharpure, P. Diabetic retinopathy detection using deep convolutional neural networks. In Proceedings of the 2016 International Conference on Computing, Analytics and Security Trends (CAST), Pune, India, 11 July 2016; pp. 261–266. [Google Scholar]
- Ghosh, R.; Ghosh, K.; Maitra, S. Automatic detection and classification of diabetic retinopathy stages using CNN. In Proceedings of the 2017 4th International Conference on Signal Processing and Integrated Networks (SPIN), Delhi, India, 26–27 August 2017; pp. 550–554. [Google Scholar] [CrossRef]
- Gondal, W.M.; Kohler, J.M.; Grzeszick, R.; Fink, G.A.; Hirsch, M. Weakly-supervised localization of diabetic retinopathy lesions in retinal fundus images. In Proceedings of the 2017 IEEE international conference on image processing (ICIP), Beijing, China, 17–20 September 2017; pp. 2069–2073. [Google Scholar] [CrossRef] [Green Version]
- Jiang, Y.; Wu, H.; Dong, J. Automatic Screening of Diabetic Retinopathy Images with Convolution Neural Network Based on Caffe Framework. In Proceedings of the 1st International Conference on Medical and Health Informatics 2017, Taichung city, Taiwan, 20–22 May 2017; pp. 90–94. [Google Scholar] [CrossRef]
- Prentasic, P.; Loncaric, S. Weighted ensemble based automatic detection of exudates in fundus photographs. IEEE 2014, 2014, 138–141. [Google Scholar] [CrossRef]
- Roy, P.; Tennakoon, R.; Cao, K.; Sedai, S.; Mahapatra, D.; Maetschke, S.; Garnavi, R. A novel hybrid approach for severity assessment of Diabetic Retinopathy in colour fundus images. In Proceedings of the 2017 IEEE 14th International Symposium on Biomedical Imaging (ISBI 2017), Melbourne, Australia, 18–21 April 2017; pp. 1078–1082. [Google Scholar] [CrossRef]
- Xu, K.; Feng, D.; Mi, H. Deep Convolutional Neural Network-Based Early Automated Detection of Diabetic Retinopathy Using Fundus Image. Molecules 2017, 22, 2054. [Google Scholar] [CrossRef] [Green Version]
- Yang, Y.; Li, T.; Li, W.; Wu, H.; Fan, W.; Zhang, W. Lesion Detection and Grading of Diabetic Retinopathy via Two-Stages Deep Convolutional Neural Networks. In International Conference on Medical Image Computing and Computer-Assisted Intervention; Springer: Cham, Germany, 2017; pp. 533–540. [Google Scholar] [CrossRef] [Green Version]
- van Grinsven, M.J.J.P.; van Ginneken, B.; Hoyng, C.B.; Theelen, T.; Sanchez, C.I. Fast Convolutional Neural Network Training Using Selective Data Sampling: Application to Hemorrhage Detection in Color Fundus Images. IEEE Trans. Med. Imaging 2016, 35, 1273–1284. [Google Scholar] [CrossRef]
- Budak, U.; Şengür, A.; Guo, Y.; Akbulut, Y. A novel microaneurysms detection approach based on convolutional neural networks with reinforcement sample learning algorithm. Health Inf. Sci. Syst. 2017, 5, 14. [Google Scholar] [CrossRef]
- Zhou, W.; Wu, C.; Chen, D.; Wang, Z.; Yi, Y.; Du, W. Automatic Microaneurysms Detection Based on Multifeature Fusion Dictionary Learning. Comput. Math. Methods Med. 2017, 2017, 1–11. [Google Scholar] [CrossRef] [PubMed] [Green Version]
- Barkana, B.D.; Sariçiçek, I.; Yildirim, B. Performance analysis of descriptive statistical features in retinal vessel segmentation via fuzzy logic, ANN, SVM, and classifier fusion. Knowl. Based Syst. 2017, 118, 165–176. [Google Scholar] [CrossRef]
- Dasgupta, A.; Singh, S. A fully convolutional neural network based structured prediction approach towards the retinal vessel segmentation. In Proceedings of the 14th International Symposium on Biomedical Imaging (ISBI), Melbourne, VIC, Australia, 18–21 April 2017; pp. 248–251. [Google Scholar]
- Mo, J.; Zhang, L. Multi-level deep supervised networks for retinal vessel segmentation. Int. J. Comput. Assist. Radiol. Surg. 2017, 12, 2181–2193. [Google Scholar] [CrossRef] [PubMed]
- Tan, J.H.; Acharya, U.R.; Bhandary, S.V.; Chua, K.C.; Sivaprasad, S. Segmentation of optic disc, fovea, and retinal vasculature using a single convolutional neural network. J. Comput. Sci. 2017, 20, 70–79. [Google Scholar] [CrossRef] [Green Version]
- Vega, R.; Sanchez-Ante, G.; Falcon-Morales, L.E.; Sossa, H.; Guevara, E. Retinal vessel extraction using lattice neural networks with dendritic processing. Comput. Biol. Med. 2015, 58, 20–30. [Google Scholar] [CrossRef] [PubMed]
- Wang, S.; Yin, Y.; Cao, G.; Wei, B.; Zheng, Y.; Yang, G. Hierarchical retinal blood vessel segmentation based on feature and ensemble learning. Neurocomputing. Neurocomputing 2015, 149, 708–717. [Google Scholar] [CrossRef]
- Choi, J.Y.; Yoo, T.K.; Seo, J.G.; Kwak, J.; Um, T.T.; Rim, T.H. Multi-categorical deep learning neural network to classify retinal images: A pilot study employing small database. PLoS ONE 2017, 12, 16. [Google Scholar] [CrossRef] [PubMed] [Green Version]
- Mumtaz, R.; Hussain, M.; Sarwar, S.; Khan, K.; Mumtaz, S.; Mumtaz, M. Automatic detection of retinal hemorrhages by exploiting image processing techniques for screening retinal diseases in diabetic patients. Int. J. Diabetes Dev. Ctries. 2017, 38, 80–87. [Google Scholar] [CrossRef]
- Santhi, D.; Manimegalai, D.; Parvathi, S.; Karkuzhali, S. Segmentation and classification of bright lesions to diagnose diabetic retinopathy in retinal images. Biomed. Eng. Biomed. Tech. 2016, 61, 443–453. [Google Scholar] [CrossRef]
- Li, G.; Zheng, S.; Li, X. Exudate Detection in Fundus Images via Convolutional Neural Network. In International Forum on Digital TV and Wireless Multimedia Communications; Springer: Singapore, 2018; pp. 193–202. [Google Scholar] [CrossRef]
- Bala, P.; Vijayachitra, S. A Sequential learning method for detection and classification of exudates in retinal images to assess diabetic retinopathy. J. Biol. Syst. 2014, 22, 413–428. [Google Scholar] [CrossRef]
- Rahim, S.S.; Jayne, C.; Palade, V.; Shuttleworth, J. Automatic detection of microaneurysms in colour fundus images for diabetic retinopathy screening. Neural Comput. Appl. 2015, 27, 1149–1164. [Google Scholar] [CrossRef]
- Omar, M.; Khelifi, F.; Tahir, M.A. Detection and classification of retinal fundus images exudates using region based multiscale LBP texture approach. In Proceedings of the 2016 International Conference on Control, Decision and Information Technologies (CoDIT), Saint Julian’s, Malta, 6–8 April 2016; pp. 227–232. [Google Scholar] [CrossRef]
- Abbas, Q.; Fondon, I.; Sarmiento, A.; Jiménez, S.; Alemany, P. Automatic recognition of severity level for diagnosis of diabetic retinopathy using deep visual features. Med. Biol. Eng. Comput. 2017, 55, 1959–1974. [Google Scholar] [CrossRef] [PubMed]
- Ouyang, W.; Luo, P.; Zeng, X.; Qiu, S.; Tian, Y.; Li, H.; Yang, S.; Wang, Z.; Xiong, Y.; Qian, C.; et al. Deepid-net: Multi-stage and deformable deep convolutional neural networks for object detection. arXiv 2014, arXiv:1409.3505. [Google Scholar]
- Shan, J.; Li, L. A deep learning method for microaneurysm detection in fundus images. In Proceedings of the IEEE First International Conference on Connected Health: Applications, Systems, and Engineering Technologies, Washington, DC, USA, 27–29 June 2016; pp. 357–358. [Google Scholar]
- Shirbahadurkar, S.D.; Mane, V.M.; Jadhav, D.V. Early Stage Detection of Diabetic Retinopathy Using an Optimal Feature Set. In Advances in Intelligent Systems and Computing; Springer: Berlin/Heidelberg, Germany, 2017; Volume 678, pp. 15–23. [Google Scholar] [CrossRef]
- SK, S. A Machine Learning Ensemble Classifier for Early Prediction of Diabetic Retinopathy. J. Med. Syst. 2017, 41, 201. [Google Scholar] [CrossRef]
- Abràmoff, M.D.; Lou, Y.; Erginay, A.; Clarida, W.; Amelon, R.; Folk, J.C.; Niemeijer, M. Improved Automated Detection of Diabetic Retinopathy on a Publicly Available Dataset Through Integration of Deep Learning. Investig. Ophthalmol. Vis. Sci. 2016, 57, 5200–5206. [Google Scholar] [CrossRef] [PubMed] [Green Version]
- Antal, B.; Hajdu, A. An ensemble-based system for automatic screening of diabetic retinopathy. Knowl. Based Syst. 2014, 60, 20–27. [Google Scholar] [CrossRef] [Green Version]
- Carrera, E.V.; Gonzalez, A.; Carrera, R. Automated detection of diabetic retinopathy using SVM. In Proceedings of the IEEE XXIV International Conference on Electronics, Electrical Engineering and Computing (INTERCON), Cusco, Peru, 15–18 August 2017; pp. 1–4. [Google Scholar] [CrossRef]
- Gegundez-Arias, M.E.; Marin, D.; Ponte, B.; Alvarez, F.; Garrido, J.; Ortega, C.; Vasallo, M.J.; Bravo, J.M. A tool for automated diabetic retinopathy pre-screening based on retinal image computer analysis. Comput. Biol. Med. 2017, 88, 100–109. [Google Scholar] [CrossRef]
- Li, X.; Pang, T.; Xiong, B.; Liu, W.; Liang, P.; Wang, T. Convolutional neural networks based transfer learning for diabetic retinopathy fundus image classification. In Proceedings of the 10th International Congress on Image and Signal Processing, BioMedical Engineering and Informatics (CISP-BMEI), Shanghai, China, 14–16 October 2017. [Google Scholar]
- Arunkumar, R.; Karthigaikumar, P. Multi-retinal disease classification by reduced deep learning features. Neural Comput. Applic. 2017, 28, 329–334. [Google Scholar] [CrossRef]
- Tan, J.H.; Fujita, H.; Sivaprasad, S.; Bhandary, S.V.; Rao, A.K.; Chua, K.C.; Acharya, U.R. Automated segmentation of exudates, hemorrhages, and microaneurysms using a single convolutional neural network. Inf. Sci. 2017, 420, 66–76. [Google Scholar] [CrossRef]
- Takahashi, H.; Tampo, H.; Arai, Y.; Inoue, Y.; Kawashima, H. Applying artificial intelligence to disease staging: Deep learning for the improved staging of diabetic retinopathy. PLoS ONE 2017, 12, e0179790. [Google Scholar] [CrossRef] [Green Version]
- Hemanth, D.J.; Anitha, J.; Indumathy, A. Diabetic Retinopathy Diagnosis in Retinal Images Using Hopfield Neural Network. IETE J. Res. 2016, 62, 893–900. [Google Scholar] [CrossRef]
- Sharma, S.; Singh, G.; Sharma, M. A comprehensive review and analysis of supervised-learning and soft computing techniques for stress diagnosis in humans. Comput. Biol. Med. 2021, 134, 104450. [Google Scholar] [CrossRef] [PubMed]
- Lakshminarayanan, V.; Kheradfallah, H.; Sarkar, A.; Balaji, J.J. Automated Detection and Diagnosis of Diabetic Retinopathy: A Comprehensive Survey. J. Imaging 2021, 7, 165. [Google Scholar] [CrossRef]
- Shultz, T.R.; Fahlman, S.E.; Craw, S.; Andritsos, P.; Tsaparas, P.; Silva, R.; Drummond, C.; Lanzi, P.L.; Gama, J.; Wiegand, R.P. Confusion Matrix. Encycl. Mach. Learn. 2011, 61, 209. [Google Scholar]
- Wikipedia, F. Cohen Kappa. 2006. Available online: https://thenewstack.io/cohens-kappa-what-it-is-when-to-use-it-and-how-to-avoid-its-pitfalls (accessed on 12 March 2022).
- Hernández, C.; Porta, M.; Bandello, F.; Grauslund, J.; Harding, S.P.; Aldington, S.J.; Egan, C.; Frydkjaer-Olsen, U.; García-Arumí, J.; Gibson, J.; et al. The Usefulness of Serum Biomarkers in the Early Stages of Diabetic Retinopathy: Results of the EUROCONDOR Clinical Trial. J. Clin. Med. 2020, 9, 1233. [Google Scholar] [CrossRef] [PubMed]
- Jacoba, C.M.P.; Celi, L.A.; Silva, P.S. Biomarkers for Progression in Diabetic Retinopathy: Expanding Personalized Medicine through Integration of AI with Electronic Health Records. Semin. Ophthalmol. 2021, 36, 250–257. [Google Scholar] [CrossRef]
- Records, H. HHS Public Access. Biomarkers 2022, 36, 250–257. [Google Scholar]
- Control, D.; Trial, C. Progression of Retinopathy with Intensive versus Conventional Treatment in the Diabetes Control and Complications Trial. Ophthalmology 1995, 102, 647–661. [Google Scholar] [CrossRef]
- Group, A.S.; Group, A.E.S.; Chew, E.Y.; Ambrosius, W.T.; Davis, M.D.; Danis, R.P.; Gangaputra, S.; Greven, C.M.; Hubbard, L.; Esser, B.A.; et al. Effects of Medical Therapies on Retinopathy Progression in Type 2 Diabetes. N. Engl. J. Med. 2010, 363, 233–244. [Google Scholar] [CrossRef]
- Kuo, J.Z.; Wong, T.Y.; Rotter, J.I. Challenges in elucidating the genetics of diabetic retinopathy. JAMA Ophthalmol. 2014, 132, 96–107. [Google Scholar] [CrossRef] [Green Version]
- Mastropasqua, R.; Toto, L.; Cipollone, F.; Santovito, D.; Carpineto, P.; Mastropasqua, L. Role of microRNAs in the modulation of diabetic retinopathy. Prog. Retin. Eye Res. 2014, 43, 92–107. [Google Scholar] [CrossRef] [PubMed]
- Cooper, M.E.; El-Osta, A. Epigenetics. Circ. Res. 2010, 107, 1403–1413. [Google Scholar] [CrossRef] [PubMed] [Green Version]
- Torok, Z.; Peto, T.; Csosz, E.; Tukacs, E.; Molnar, A.M.; Berta, A.; Tozser, J.; Hajdu, A.; Nagy, V.; Domokos, B.; et al. Combined Methods for Diabetic Retinopathy Screening, Using Retina Photographs and Tear Fluid Proteomics Biomarkers. J. Diabetes Res. 2015, 2015, 1–8. [Google Scholar] [CrossRef] [PubMed] [Green Version]
- Lu, C.-H.; Lin, S.-T.; Chou, H.-C.; Lee, Y.-R.; Chan, H.-L. Proteomic analysis of retinopathy-related plasma biomarkers in diabetic patients. Arch. Biochem. Biophys. 2013, 529, 146–156. [Google Scholar] [CrossRef]
- Xia, J.-F.; Wang, Z.-H.; Liang, Q.-L.; Wang, Y.-M.; Li, P.; Luo, G.-A. Correlations of six related pyrimidine metabolites and diabetic retinopathy in Chinese type 2 diabetic patients. Clin. Chim. Acta 2011, 412, 940–945. [Google Scholar] [CrossRef] [PubMed]
- Hussain, F.; Hussain, R.; Hossain, E. Explainable Artificial Intelligence (XAI): An Engineering Perspective. arXiv 2021, arXiv:2101.03613. Available online: http://arxiv.org/abs/2101.03613 (accessed on 21 March 2022).
- Jang, S.I.; Girard, M.J.; Thiéry, A.H. Thiery, Explainable diabetic retinopathy classification based on neural-symbolic learning. CEUR Workshop Proc. 2021, 2986, 104–113. [Google Scholar]
- Deshpande, N.M.; Gite, S.; Pradhan, B.; Assiri, M.E. Explainable Artificial Intelligence–A New Step towards the Trust in Medical Diagnosis with AI Frameworks: A Review. Comput. Model. Eng. Sci. 2022, 133, 1–30. [Google Scholar] [CrossRef]
- Leopold, H.A.; Singh, A.; Sengupta, S.; Zelek, J.S.; Lakshminarayanan, V. Recent advances in deep learning applications for retinal diagnosis using OCT. 2020. In State of the Art in Neural Networks; Elsevier: New York, NY, USA, 2020. [Google Scholar]
- Liu, R.; Li, Q.; Xu, F.; Wang, S.; He, J.; Cao, Y.; Shi, F.; Chen, X.; Chen, J. Application of artificial intelligence-based dual-modality analysis combining fundus photography and optical coherence tomography in diabetic retinopathy screening in a community hospital. Biomed. Eng. Online 2022, 21, 1–11. [Google Scholar] [CrossRef]
- Nguyen, D.M.H.; Mai, T.T.N.; Than, N.T.T.; Prange, A.; Sonntag, D. Self-supervised Domain Adaptation for Diabetic Retinopathy Grading Using Vessel Image Reconstruction. In German Conference on Artificial Intelligence (Künstliche Intelligenz); Springer: Cham, Germany, 2021; pp. 349–361. [Google Scholar] [CrossRef]
- Song, R.; Cao, P.; Yang, J.; Zhao, D.; Zaiane, O.R. A Domain Adaptation Multi-instance Learning for Diabetic Retinopathy Grading on Retinal Images. In Proceedings of the 2020 IEEE International Conference on Bioinformatics and Biomedicine (BIBM), Seoul, Republic of Korea, 16–19 December 2020; pp. 743–750. [Google Scholar] [CrossRef]
- Crawshaw, M. Multi-task learning with deep neural networks: A survey. arXiv 2020, arXiv:2009.09796. [Google Scholar]
- Foo, A.; Hsu, W.; Lee, M.L.; Lim, G.; Wong, T.Y. Multi-Task Learning for Diabetic Retinopathy Grading and Lesion Segmentation. Proc. Conf. AAAI Artif. Intell. 2020, 34, 13267–13272. [Google Scholar] [CrossRef]


| Ref No | Objectives and Topic | Discussions | Type |
|---|---|---|---|
| [15] | Datasets, picture preparation methods, ML-based methods, DL-based strategies, and evaluation metrics are presented as five components of DR screening methodologies. | Did not follow the PRISMA approach. Studies that were released between January 2013 and March 2018 are considered in this study. | Review |
| [39] | It discusses DeepDR, an automated DR identification, and grading system. DeepDR uses transfer learning and ensemble learning to detect the presence and severity of DR in fundus images. | Did not follow the PRISMA approach. Experiment results indicate the importance and effectiveness of the ideal number and combinations of component classifiers in model performance. | Review |
| [38] | It discusses an integrated ML approach that incorporates support vector machines (SVMs), principal component analysis (PCA), and moth flame optimization approaches for DR. | Did not follow the PRISMA approach. Utilizing the PCA technique to reduce the dimensions has had a detrimental impact on the performance of the majority of ML algorithms. | Review |
| [40] | It presents the latest DL algorithms used in DR detection, highlighting the contributions and challenges of recent research papers. | Did not follow the PRISMA approach. Robust deep-learning methods must be developed to give satisfactory performance in cross-database evaluation, i.e., trained with one dataset and tested with another. | Review |
| [41] | It presents a comprehensive survey of automated eye diseases detection systems using available datasets, techniques of image preprocessing, and deep learning models. | Studies that did not follow the PRISMA approach are considered from January 2016 to June 2021. | Review |
| RQ. No. | Research Question | Objective/Discussion |
|---|---|---|
| 1 | What are the most common artificial intelligence-based methods for DR detection? | It assists in determining the most relevant artificial intelligence algorithms for DR diagnosis applications nowadays. |
| 2 | What are the various Features Extraction Techniques for DR? | List various feature extraction techniques used for DR. |
| 3 | What are the relevant datasets for DR? | Discovers several publicly available datasets that may be used as benchmarks to compare and assess the performance of various methodologies, as well as gives new researchers a head start. |
| 4 | What are the various evaluation measures used for DR detection? | The most used standards and metrics for DR detection are reviewed. |
| 5 | What are the potential solutions for a robust and reliable DR detection system? | It makes it easier to find significant research areas to be studied. |
| Fundamental Keyword | “Diabetic Retinopathy” | |||
|---|---|---|---|---|
| Direct Keyword | “Artificial Intelligence” | “Machine Learning” | “Deep Learning” | |
| Indirect Keyword | “Ophthalmology” | “Fundus Images” | “DR Stages” | “OCT” |
| Database | Query | Initial Outcome |
|---|---|---|
| Scopus | (Diabetic AND Retinopathy AND Artificial AND Intelligence AND Machine AND Learning AND Deep AND Learning) | 149 |
| Web of Science | 79 |
| Inclusion Criteria |
|---|
| Rather than reviews or survey pieces, scientific papers should be primary research papers. |
| Scholarly articles that appeared between 2014 and April 2022. |
| Query terms must be included in the titles, abstracts, or whole body of peer-reviewed publications. |
| Articles that address at least one research question. |
| The developed solution should aim at resolving issues with diabetic retinopathy detection using AI. |
| Exclusion Criteria |
| Articles that are written in languages other than English. |
| Studies published that are identical. |
| Complete scientific papers are not always available. |
| Research papers that are not related to diabetic retinopathy using AI. |
| Software | Sample Size | Only DR OR Controls | Device | Grading/ Mechanism | Limitation | Software Mechanism | Used | Accuracy |
|---|---|---|---|---|---|---|---|---|
| Bosch [44] | 1128 | DR with age of 18+. | Bosch Mobile Eye Care fundus camera. Single field non-mydriatic. | ETDRS. | In some of the eyes diagnosed as normal, the other eye may have had early evidence. Further, while the study notes the findings of DR, it would be useful to know how accurate this software is for individual lesions, such as exudates, microaneurysms, and macular edema. | CNN-based AI software. | For DR screening in India. | Sensitivity—91%. Specificity—96%. Positive predicted value (PPV)—94%. Negative predictive value (NPV)—95%. |
| Retmarker DR [45] | 45,148 | Screening diabetic patients. | Used non-mydriatic cameras. Canon CR6-45NM with a Sony DXC-950P 3CCD color video camera other cameras, such as Nidek AFC-330 and CSO Cobra, have been used temporarily. | Coimbra Ophthalmology. Reading Centre (CORC). | The short duration of the study (2 years) and the lack of more detailed information on systemic parameters, such as lipid stratification. | Feature-based ML algorithms. | Used in local DR screening in Portugal, Aveiro, Coimbra, Leiria, Viseu, Castelo Branco, and Cova da Beira. | R0—71.5%, RL—22.7%, M—2.2%, RP—0.1%, NC—3.5%. Human grading burden reduction of 48.42%. |
| Eye Art [46] | 78,685 | A cross-sectional diagnostic study of individuals with diabetes. | Two-field undilated fundus photograph. Two-field retinal CFP images (one disc-centered and one macula-centered) were taken for each eye (Canon CR-2 AF or Canon CR-2 Plus AF; Canon USA Inc.). | ETDRS. | A limitation of the study is that optical coherence tomography was not used to determine clinically significant macular edema. Color fundus photographs CFP is known to be an accurate, sufficient, and widely accepted clinical reference standard, including by the FDA. | AI Algo. | Used in Canada for detection of both mtmDR and vtDR without physician assistance. | Sensitivity—91.7%. Specificity—91.5%. |
| Retinalyze [47] | 260 | Retrospective cross-sectional study of diabetic patients attending routine. | Mydriatic 60° fundus photography on 35-mm color transparency film was used, with a single fovea-centered field fundus camera (CF-60UV; Canon Europa NV, Amstelveen, The Netherlands) set. | Routine grading was based on a visual examination of slide-mounted transparencies. Reference grading was performed with specific emphasis on achieving high sensitivity. | Commercially unavailable for a long time until reintroduced into its web-based form with DL improvements. | Deep learning based. | Used in Europe to a greater extent. | Sensitivity 93.1% and specificity 71.6%. |
| Singapore SERI-NUS [48] | 76,370 SIDRP between 2010 and 2013 (SIDRP 2010–2013) | With diabetes. | FundusVue, Canon, Topcon, and Carl Zeiss nonmydriatic. | Grading was completed by a certified ophthalmologist and retina specialist. | Identification of diabetic macular edema from fundus photographs may not identify all cases appropriately without clinical examination and optical coherence tomography. | Using a deep learning system. | Singapore. | Sensitivity 90.5% and specificity 91.6%. AUC—0.936 |
| Google [49] | 128,175 Aravind Eye Hospital, Sankara Nethralaya, and Narayana Nethralaya | Macula-centered retinal fundus images were retrospectively obtained from EyePACS in the United States and three eye hospitals in India among patients presenting for diabetic retinopathy screening. | Two sets of 9963 Eyepacs images from Centervue DRS, Optovue iCam, Canon CR1/DGi/CR2, and Topcon NW using 45° FOV and 40% acquired with pupil dilation. Images from a 1748- Messidor-2 from a Topcon TRC NW6 nonmydriatic camera and 45° FOV with 44% pupil dilation. | DR severity (none, mild, moderate, severe, or proliferative) was graded according to the International Clinical Diabetic Retinopathy scale. | Further research is necessary to determine the feasibility of applying this algorithm in the clinical setting and to determine whether the use of the algorithm could lead to improved care and outcomes compared with current ophthalmologic assessment. | CNN based. Inception-v3 architecture. | Used in North Carolina to a greater extent. | Sensitivity—97.5%. Specificity—93.4%. |
| IDx-DR [50] | 900 | With no history of DR. | Widefield stereoscopic photography mydriatic. | FPRC Wisconsin Fundus Photograph Reading Center, and ETDRS. | The prevalence of referable retinopathy in this population is small, which limits the comparison to other populations with higher disease prevalence. | AI-based logistic regression model. | Dutch diabetic Care system-1410. | Sensitivity—87.2%. Specificity—90.7%. |
| Comprehensive Artificial Intelligence Retinal Expert (CARE)system [51] | 443 subjects (848 eyes) | Previously diagnosed diabetic patients. | One-field color fundus photography (CFP) (macula-centered with a 50◦ field of vision) was taken for both eyes using a nonmydriatic fundus camera (RetiCam 3100, China) by three trained ophthalmologists in dark rooms. | International Clinical Diabetic Retinopathy (ICDR) classification criteria. | This technique has drawbacks when it comes to detecting severe PDR and DME. (1) Poor imaging results from fundus such as ghost images and fuzzy lesions, in leukoplakia, lens opacity, and tiny pupils. Cases create difficulty in AI identification. (2) The difference in the results was caused by the study’s insufficient sample size. (3) Some lesions were overlooked during the 50-degree fundus photography focused on the macula. | AI-based. | Chinese community health care centers. | Sensitivity—75.19%. Specificity 93.99%. |
| Ref. No | Authors | Feature Selected | Features and Classifiers (Technique) | Weakness | Database | (Performance Analysis) |
|---|---|---|---|---|---|---|
| [98] | Di Wu, Wu, Zhang, Liu, and Bauman, 2006. | To find out blood vessels in the retina. | Gabor filters. | Requires high-performance time with greater feature vector dimension. | STARE. | Tested 20 images. For normal images, TPR—80 to 91% and FPR—2.8 to 5.5%. For abnormal images, TPR—73.8–86.5% FPR—2.1–5.3%. |
| [99] | Sanchez et al. (2009). | To detect hard exudates from cotton wool spots and other artifacts. | Edge detection and mixture models. | The diversity of brightness and size makes it difficult to detect the hard exudates, hence method may fail when they appear very few in the retina. | Eighty retinal images with variable color, brightness, and quality. | A sensitivity of 90.2% and a positive predictive value of 96.8% for an image-based classification accuracy sensitivity of 100% and a specificity of 90%. |
| [100] | Garcia, Sanchez, Lopez, Abasolo, and Hornero (2009). | Red lesions image and shape features. | Neural networks with multilayer perceptron (MLP), radial basis function (RBF), and support vector machine (SVM). | The black box nature of ANN and more accuracy requires more amount of data. | The database was composed of 117 images with variable color, brightness, and quality. 50 were used for training and 67 for testing. | Using lesion-based sensitivity and positive prediction values in percent. MLP—88.1, 80.722. RBF—88.49, 77.41. SVM—87.61, 83.51. Using image-based sensitivity and specificity in percent. MLP—100, 92.59. RBF—100, 81.48. SVM—100, 77.78. |
| [101] | Sanchez et al. (2008). | Hard exudates. | Color information and Fisher’s linear discriminant analysis. | When there are only a few very faint HEs in the retina, this proposed algorithm may have limited performance. More images are required for better results. | Fifty-eight retinal images with variable color, brightness, and quality from the Instituto de Oftalmobiología Aplicadaat University of Valladolid, Spain. | Using a lesion-based performance sensitivity of 88% with a mean number of 4.83 ± 4.64 false positives per image. Using Image-based sensitivity-100 and Specificity of 100% is achieved. |
| [102] | Quellec et al. (2012). | Abnormal patterns in fundus images. | Multiple-instance learning. | The training procedure is complex and takes a lot of time. | Messidor (1200 images) and e-optha (25,000 images). | In the Messidor dataset, the proposed framework achieved an area under the ROC curve of Az = 0.881 and e-optha Az = 0.761. |
| [103] | Kose, ¸SEvik, ˙IKiba¸s, and Erdo¨l (2012). | Image pixel information. | Inverse segmentation using region growing, adaptive region growing, and Bayesian approaches. | Difficult to choose the correct way to select a prior. | A total of 328 images with 760 X 570 resolution from the Department of Ophthalmology at the Faculty of Medicine at Karadeniz Technical University were used. | This approach successfully identifies and localizes over 97% of ODs and segments around 95% of DR lesions. |
| [104] | Giancardo et al. (2012). | Exudates in fundus images. | Feature cector generated using an exudate probability map, the color analysis, and the wavelet analysis. Exudate probability map and wavelet analysis. | Intensive calculation. | HEI-MED, Messidor, and DIARETDB1. | AUC is between 0.88 and 0.94, depending on the dataset/features used. |
| [105] | Zhang, Karray, Li, and Zhang (2012). | Microaneurysms and blood vessel detection. | Locate MAs using multi-scale Gaussian correlation filtering (MSC) with dictionary learning and sparse representation classifier (SRC). | Dictionaries for vessel extraction are artificially generated using Gaussian functions which can cause a low discriminative ability for SRC. Additionally, a larger dataset is required. | STARE and DRIVE. | For STARE: FPR—0.00480. TPR—0.73910. PPV—0.740888. For DRIVE: FPR—0.0028. TPR—0.5766. PPV—0.8467. |
| [106] | Qureshi et al. (2012). | Identifying macula and optic disk (OD). | Ensemble combined algorithm of edge detectors, Hough transform, and pyramidal decomposition. | It is difficult to determine which one is the best approach because good results were reported for healthy retinas but less precise on a difficult data set. | Diaretdb0, Diaretdb1, and DRIVE 40% of the images from each benchmark are used for training and 60% of the images are used for testing. | The average detection rate of macula is 96.7 and OD is 98.6. |
| [107] | Noronha and Nayak (2013). | Two energy features and six energy values in three orientations. | Wavelet transforms and support vector machine (SVM) kernels. | The performance depends on factors such size and quality of the training features, the robustness of the training, and the features extracted. | Fundus images were used. | Accuracy, sensitivity, and specificity of more than 99% are achieved. |
| [108] | Gharaibeh N (2021). | Cotton wool spots, exudates. Nineteen features were extracted from the fundus image. | Unsupervised particle swarm optimization based relative reduct algo (US-PSO-RR), SVM, and naïve-Bayes classifiers. | Detection and elimination of optic discs from fundus images are difficult, hence lesion detection is challenging. | Image-Ret. | Obtained a sensitivity of 99%, A specificity of 99% and a high accuracy of 98.60%. |
| [109] | Gharaibeh N (2018). | Microaneurysm, hemorrhage, and exudates. | Co-occurrence matrix and SVM. | Can be tried on larger datasets. | DIARETDB1. | Obtained a sensitivity of 99%, a specificity of 96%, and an accuracy of 98.4%. |
| [110] | Akram, Khalid, and Khan (2013). | Image shape and statistics. | Gaussian mixture models and support vector machine and Gabor filter bank. | Need to work on a large dataset. | Four hundred and thirty-eight Fundus images. | An accuracy of 99.4%, a sensitivity of 98.64%, and a specificity of 99.40% are achieved. |
| [111] | Harini R and Sheela N (2016). | Blood vessels, microaneurysms, and exudates. | The gray level co-occurrence matrix (GLCM) is utilized to extract textural features the classification is completed using SVM. | Problem working with large datasets since training requires more time with SVMs. | Seventy-five Fundus images were considered, forty-five were used for training, and thirty for testing | An accuracy of 96.67%, a sensitivity of fundus of 100%, and a specificity of 95.83% are achieved. |
| [112] | Anjana Umapathy, Anusha Sreenivasan, Divya S. Nairy (2019). | Exudates and red lesions in the fundus image. | Decision tree classifier. | Requires more time for training and persistent overfitting. | STARE, HRF, MESSIDOR, and a novel dataset created from Retina Institute of Karnataka. | The approach achieved an accuracy of 94.4%. |
| Sr. No | Dataset Name | Description | References | Availability | Link |
|---|---|---|---|---|---|
| 1 | Kaggle | EyePACS has supplied this dataset for the DR detection challenge. There are 88,702 photos in this collection (35,126 for training and 53,576 for testing) [116]. | [31,49,55,56,116,117,118,119,120,121,122,123,124,125] | Free | https://www.kaggle.com/c/diabetic-retinopathy-detection/data (accessed on 2 May 2022). |
| 2 | ROC (Retinopathy Online Challenge) | There are 100 photos in this collection. Canon CR5-45NM, Topcon NW 100, and NW 200 cameras were used. | [52,57,60,69,82,126,127] | Free | http://webeye.ophth.uiowa.edu/ROC/ (accessed on 2 May 2022) |
| 3 | DRIVE | This dataset contains 40 photos from a DR program in Holland (split into training and testing, 20 images each). The camera was a Canon CR5 non-mydriatic 3CCD with a 45-degree field of view (FOV). | [57,65,128,129,130,131,132,133] | Free | https://www.isi.uu.nl/Research/Databases/DRIVE/Gulshan (accessed on 2 May 2022) |
| 4 | STARE | There are 400 photos in total in this dataset. The fundus camera used was a Topcon TRV-50 with a 35-degree field of view. | [57,128,130,132,133,134,135,136] | Free | http://www.cecas.clemson.edu/~ahoover/stare/ (accessed on 3 May 2022) |
| 5 | E-Optha | The OPHDIAT telemedical network created this dataset. E-Ophtha MA and E-Ophtha EX are the two datasets that make up this collection. Both have 381 and 82 photos in them, respectively. | [55,70,75,82,96,137,138,139] | Free | http://www.adcis.net/en/Download-Third-Party/E-Ophtha.html (accessed on 3 May 2022) |
| 6 | DIARETDB0 | There are 130 photos in this dataset (normal images = 20, images with DR symptoms = 110). The photos were obtained with a fundus camera with a field of view of 50 degrees. | [55,61,74,140] | Free | http://www.it.lut.fi/project/imageret/diaretdb0/ (accessed on 3 May 2022) |
| 7 | DIARETDB1 | There are 89 photos in this dataset (standard images = 5, images with at least mild DR = 84). The photos were obtained with a fundus camera with a field of view of 50 degrees. | [53,55,57,58,59,60,62,63,64,67,70,74,75,82,96,97,119,135,137,139,141,142,143,144,145] | Free | http://www.it.lut.fi/project/imageret/diaretdb1/index.html (accessed on 4 May 2022) |
| 8 | Messidor-2 | This dataset includes 1748 photos collected with a Topcon TRC NW6 non-mydriatic fundus camera with a 45-degree field of view. | [146] | On-demand | http://www.latim.univ-brest.fr/indexfce0.html (accessed on 3 May 2022) |
| 9 | Messidor | This dataset includes 1748 photos collected with a Topcon TRC NW6 non-mydriatic fundus camera with a 45-degree field of view. | [58,61,66,75,97,125,137,141,147,148,149,150] | Free | http://www.adcis.net/en/Download-Third-Party/Messidor.html (accessed on 3 May 2022) |
| 10 | DRiDB | This dataset, which includes 50 photos, is accessible upon request. | [76,94] | On-demand | https://www.ipg.fer.hr/ipg/resources/image_database (accessed on 3 May 2022) |
| 11 | DR1 | The Department of Ophthalmology of the Federal University of Sao Paulo created this dataset. (UNIFESP). It contains 234 images captured with TRX-50X, the mydriatic camera having 45 degrees FOV. | [54,150] | Free | http://www.recod.ic.unicamp.br/site/asdr (accessed on 4 May 2022) |
| 12 | DR2 | The Department of Ophthalmology at the Federal University of Sao Paulo also contributed to this dataset (UNIFESP). It contains 520 photographs taken with the TRC-NW8, a non-mydriatic camera with a 45-degree field of view. | [54] | Free | http://www.recod.ic.unicamp.br/site/asdr (accessed on 3 May 2022) |
| 13 | ARIA | This dataset contains 143 images. The camera used was a Zeiss FF450+ fundus camera with a 50-degree field of view. | [151] | Free | http://www.damianjjfarnell.com/?page_id=276 (accessed on 5 May 2022) |
| 14 | FAZ (Foveal Avascular Zone) | There are 60 photos in this dataset (25 images that are normal and 35 images with DR). | [141] | Free | http://www.biosigdata.com/?download=Zone (accessed on 5 May 2022) |
| 15 | CHASE-DB1 | There are 28 photos of 14 children included in this dataset (consisting of one image/eye). CHASE-DB1 deals with Child Heart and Health Study (CHASE) in England. | [130] | Free | https://www.blogs.kingston.ac.uk/retinal/chasedb1/ (accessed on 5 May 2022) |
| 16 | Tianjin Medical University Metabolic Diseases Hospital | This dataset contains 414 fundus images. | [57] | Not publicly available | http://eng.tmu.edu.cn/ResearchCenter/list.htm (accessed on 5 May 2022) |
| 17 | Moorfields Eye Hospital | Data from countries such as Kenya, Botswana, Mongolia, China, Saudi Arabia, Italy, Lithuania, and Norway are collected at Moorfields Eye Hospital in London. | [60] | Not publicly available | https://www.moorfields.nhs.uk/research-and-development (accessed on 5 May 2022) |
| 18 | CLEOPATRA | The CLEOPATRA collection consists of 298 fundus images. It includes images from 15 hospitals across the United Kingdom to diagnose DR. | [152] | Not publicly available | Not available |
| 19 | Jichi Medical University | There are 9939 posterior pole fundus images of diabetic patients in this dataset. The camera used was a NIDEK Co., Ltd., Aichi, Japan, AFC-230, with a 45-degree field of view. | [153] | Not publicly available | https://www.jichi.ac.jp/ (accessed on 5 May 2022) |
| 20 | Singapore National DR Screening Program | This dataset was collected during the Singapore National Diabetic Screening Program (SIDRP) between 2010 and 2013; a total of 197,085 retinal images were collected. | [97] | Not publicly available | Not available |
| 21 | Lotus Eye Care Hospital Coimbatore, India | It contains 122 fundus images (normal = 28, DR = 94). A Canon non-mydriatic Zeiss fundus camera with a FOV of 90 degrees was used. | [22,77,154] | Not publicly available | https://www.lotuseye.org/centers/sitra/ (accessed on 5 May 2022) |
| 22 | Department of Ophthalmology, Kasturba Medical College, Manipal, India | This dataset contains 340 images (normal = 170, with retinopathy = 170). Non-mydriatic retinal camera, namely, TOPCON, was used | [155] | Not publicly available | https://manipal.edu/kmc-manipal/department-faculty/department-list/ophthalmology.html (accessed on 5 May 2022) |
| 23 | HUPM, Cádiz, Spain | Fundus photos from Hospital Puerta del Mar in Spain were taken, including 250 photos (50 normal and 200 with DR symptoms). | [156] | Not publicly available | https://hospitalpuertadelmar.com/ (accessed on 5 May 2022) |
| N = Total Predictions | Actual: NO | Actual: Yes |
|---|---|---|
| Predicted: No | True Negative | False Positive |
| Predicted: Yes | False Negative | True Positive |
Publisher’s Note: MDPI stays neutral with regard to jurisdictional claims in published maps and institutional affiliations. |
© 2022 by the authors. Licensee MDPI, Basel, Switzerland. This article is an open access article distributed under the terms and conditions of the Creative Commons Attribution (CC BY) license (https://creativecommons.org/licenses/by/4.0/).
Share and Cite
Bidwai, P.; Gite, S.; Pahuja, K.; Kotecha, K. A Systematic Literature Review on Diabetic Retinopathy Using an Artificial Intelligence Approach. Big Data Cogn. Comput. 2022, 6, 152. https://doi.org/10.3390/bdcc6040152
Bidwai P, Gite S, Pahuja K, Kotecha K. A Systematic Literature Review on Diabetic Retinopathy Using an Artificial Intelligence Approach. Big Data and Cognitive Computing. 2022; 6(4):152. https://doi.org/10.3390/bdcc6040152
Chicago/Turabian StyleBidwai, Pooja, Shilpa Gite, Kishore Pahuja, and Ketan Kotecha. 2022. "A Systematic Literature Review on Diabetic Retinopathy Using an Artificial Intelligence Approach" Big Data and Cognitive Computing 6, no. 4: 152. https://doi.org/10.3390/bdcc6040152