Article

Measurement of Mechanical Behavior of 11B-Enriched MgB2 Wire Using a Pulsed Neutron Source

1
Department of Mechanical Engineering, Daido University, 10-3 Takiharu-cho, Minami-Ku, Nagoya 457-8530, Japan
2
Resarch Institute for Applied Science, 49 Tanaka-ohi-cho, Sakyo-ku, Kyoto 606-8202, Japan
3
National Institute for Fusion Science, 322-6 Oroshi-cho, Toki-shi 509-5292, Japan
4
Osaka Alloying Works, Co., Ltd. 45-5-9 Shirakata-cho, Fukui-shi 910-3138, Japan
5
J-PARC Center, Japan Atomic Energy Agency, Tokai-Mura, Naka-Gun, Ibaraki 319-1195, Japan
*
Author to whom correspondence should be addressed.
Quantum Beam Sci. 2023, 7(4), 34; https://doi.org/10.3390/qubs7040034
Submission received: 24 July 2023 / Revised: 29 September 2023 / Accepted: 18 October 2023 / Published: 31 October 2023

Abstract

:
MgB2 represents a hexagonal superconductive material renowned for its straightforward composition, which has facilitated the development of cost-effective practical wires. Its capacity to function at temperatures as low as liquid hydrogen (LH2) has made it a prominent candidate as wire material for the coils of next-generation fusion reactors. Much like other superconducting wires, a prevalent issue arises when these wires are employed in coils, wherein electromagnetic forces induce tensile stress and strain within the wire. This, in turn, diminishes the critical current, which is the maximum current capable of flowing within the generated magnetic field and strain. The techniques and methods for accurately measuring the actual strain on the filaments are of paramount importance. While strain measurements have been conducted with synchrotron radiation and neutrons for other practical wires in the past, no such measurements have been undertaken for MgB2. Presumably, this lack of measurement is attributed to its relatively greater thickness, making it less suitable for synchrotron radiation measurements. Additionally, the high absorption cross-section of the included boron-10 poses challenges in obtaining elastic scattering data for neutron measurements. In response, we fabricated a wire enriched with boron-11, an isotope with a smaller neutron absorption cross-section. We then embarked on the endeavor to measure its strain under tensile loading using pulsed neutrons. Consequently, we succeeded in obtaining changes in the lattice constant under tensile loading through Rietveld analysis. This marks the inaugural instance of strain measurement on an MgB2 filament, signifying a significant milestone in superconductivity research.

1. Introduction

The MgB2 superconducting compound was first discovered in 2001 [1]. MgB2 possesses several notable characteristics, including a higher critical temperature (Tc) of 39 K, a simple binary chemical composition, lower specific gravity, and a relatively cost-effective production process. One of its key advantages is its usability at liquid hydrogen (LH2) temperatures around 20 K. This makes it particularly well-suited for cable applications, thanks to its low strain and ease of use [2]. While most current coil applications fall within the low stress–strain range [3,4,5], the prospect of high-current applications like nuclear fusion necessitates an enhancement of the wire’s strain properties, a critical concern. Notably, superconducting wire finds substantial use in fusion reactor projects. The ITER project, currently under construction, is slated to operate in a 4 K environment using copious amounts of liquid helium, referred to as LTS (low-temperature superconductor). However, the supply of liquid helium has experienced instability over several years, leading to a substantial increase in its price. This situation underscores the need for the next generation of fusion reactors to be helium-free for practicality reasons. Most contemporary fusion plans hinge on high-temperature superconductors (HTS) [6,7]. MgB2 emerges as a promising candidate for helium-free fusion due to its compatibility with liquid hydrogen. However, when employed in coils for applications like nuclear fusion, the electromagnetic forces generated induce tensile stress or strain within the wire. Superconducting wires typically confront the issue of diminishing critical current, the maximum current-carrying capacity, under the influence of tensile or compressive strain. These effects, elucidated by Ekin as the Strain effect [8], originate from crystal deformation. In the case of Nb3Sn, it is known that the strain-free state is most conducive to current flow. While Ekin was able to conduct strain-free experiments using large single crystals [8], practical wires necessitate quantum beam measurements to accurately gauge filament strain. Consequently, in composite superconducting wires, filament strain significantly influences performance under tension or compression, emphasizing the importance of non-destructive filament strain measurement. The measurement of real filament strain has been achieved in practical superconducting wires such as REBCO [9,10], Nb3Sn [11], and BSCCO [12] through quantum beam experiments. However, this has yet to be reported for MgB2 wires. In the design of high-field magnet coils, the prediction or measurement of actual filament strain for performance estimation constitutes a crucial element. It is anticipated that filament strain measurement technology will be indispensable for MgB2 coil applications.
Natural boron comprises two isotopes: 20 wt% boron-10 (10B) and 80 wt% boron-11 (11B). Material stability holds paramount significance when considering its application in nuclear fusion [12]. Among these materials, 10B has been identified as prone to decomposing into Li and He gases through nuclear reactions with neutrons. To circumvent this issue, research efforts are underway to develop superconductors with 11B substitutions [13,14,15]. The 10B isotope exhibits a substantial neutron absorption cross-section [16], rendering materials containing boron challenging to assess using neutron scattering. Consequently, no prior neutron scattering measurements have been conducted on MgB2 wire. Although MgB2 is intrinsically brittle, it possesses the capacity to withstand strains exceeding 0.2%. Given the numerous defects present in MgB2 filaments, the reasons enabling practical use within this strain range remain largely unexplored. While oxide-type high-temperature superconductors experience current transport interruptions when crystal grain boundaries are disrupted, it has been suggested that MgB2 superconducting wire may not be as affected by grain boundaries. Nevertheless, the extent to which the filament contributes to this aspect remains unknown. We believe that this can be conclusively ascertained through non-destructive measurements of the stress applied to the filament. To address this challenge, there is no alternative to experiments employing quantum beams. We conducted experiments at SPring-8 using high-energy X-rays. However, the large diameter of the MgB2 wire posed difficulties in these measurements. Experiments using high-energy X-rays above 70 keV were infeasible, leaving neutron scattering as the sole viable option. Unfortunately, the original MgB2 wire’s neutron scattering experiment was infeasible due to the substantial neutron absorption cross-section of 10B. Consequently, we opted to prepare 11B-enriched MgB2 wire to assess its filament’s mechanical behavior. This 11B-enriched wire was developed for fusion reactors by Hishinuma et al. Its primary purpose was to mitigate heat generation during neutron irradiation, a function dependent on its neutron absorption cross-section, while also preventing decomposition into lithium and helium through nuclear reactions. We also conducted neutron scattering experiments on commercially available practical MgB2 wires to explore the possibility of MgB2 diffraction. These measurements were carried out at Takumi (MLF BL19) of J-PARC [17], a neutron research facility at the Japan Atomic Energy Agency (JAEA). The measurement method employed at Takumi is the Time-of-Flight (ToF) method.

2. Materials and Methods

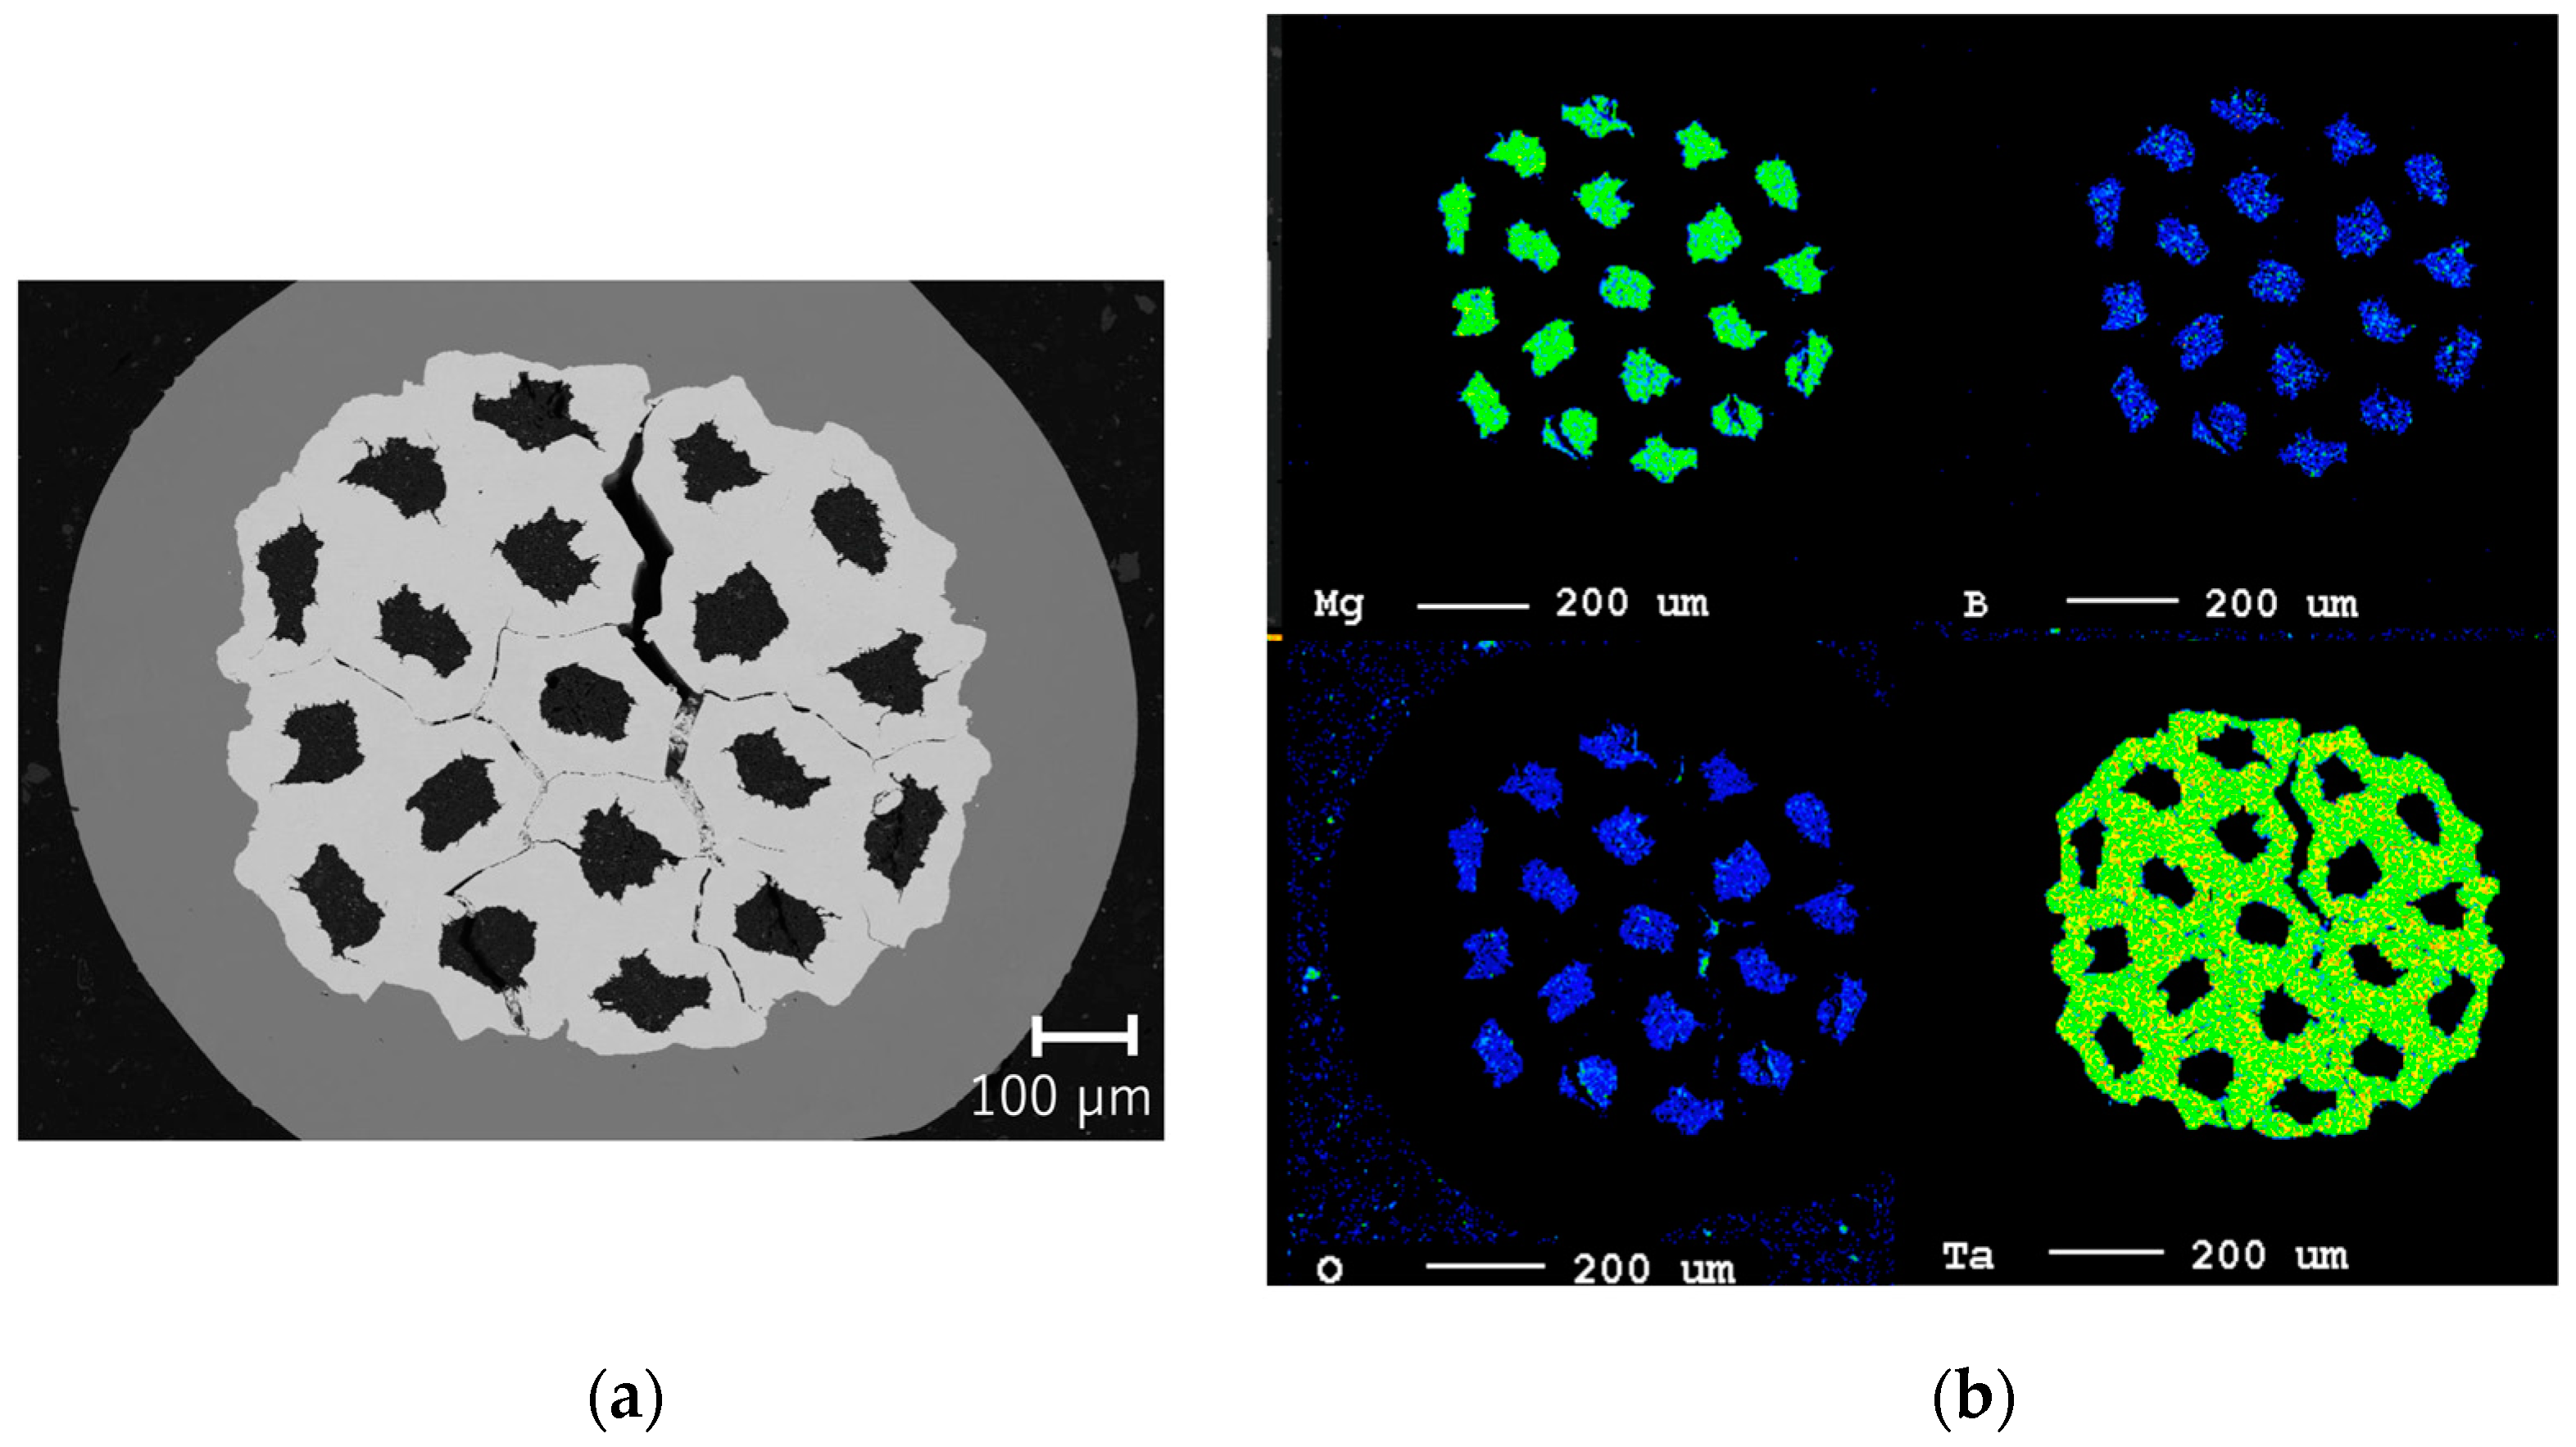
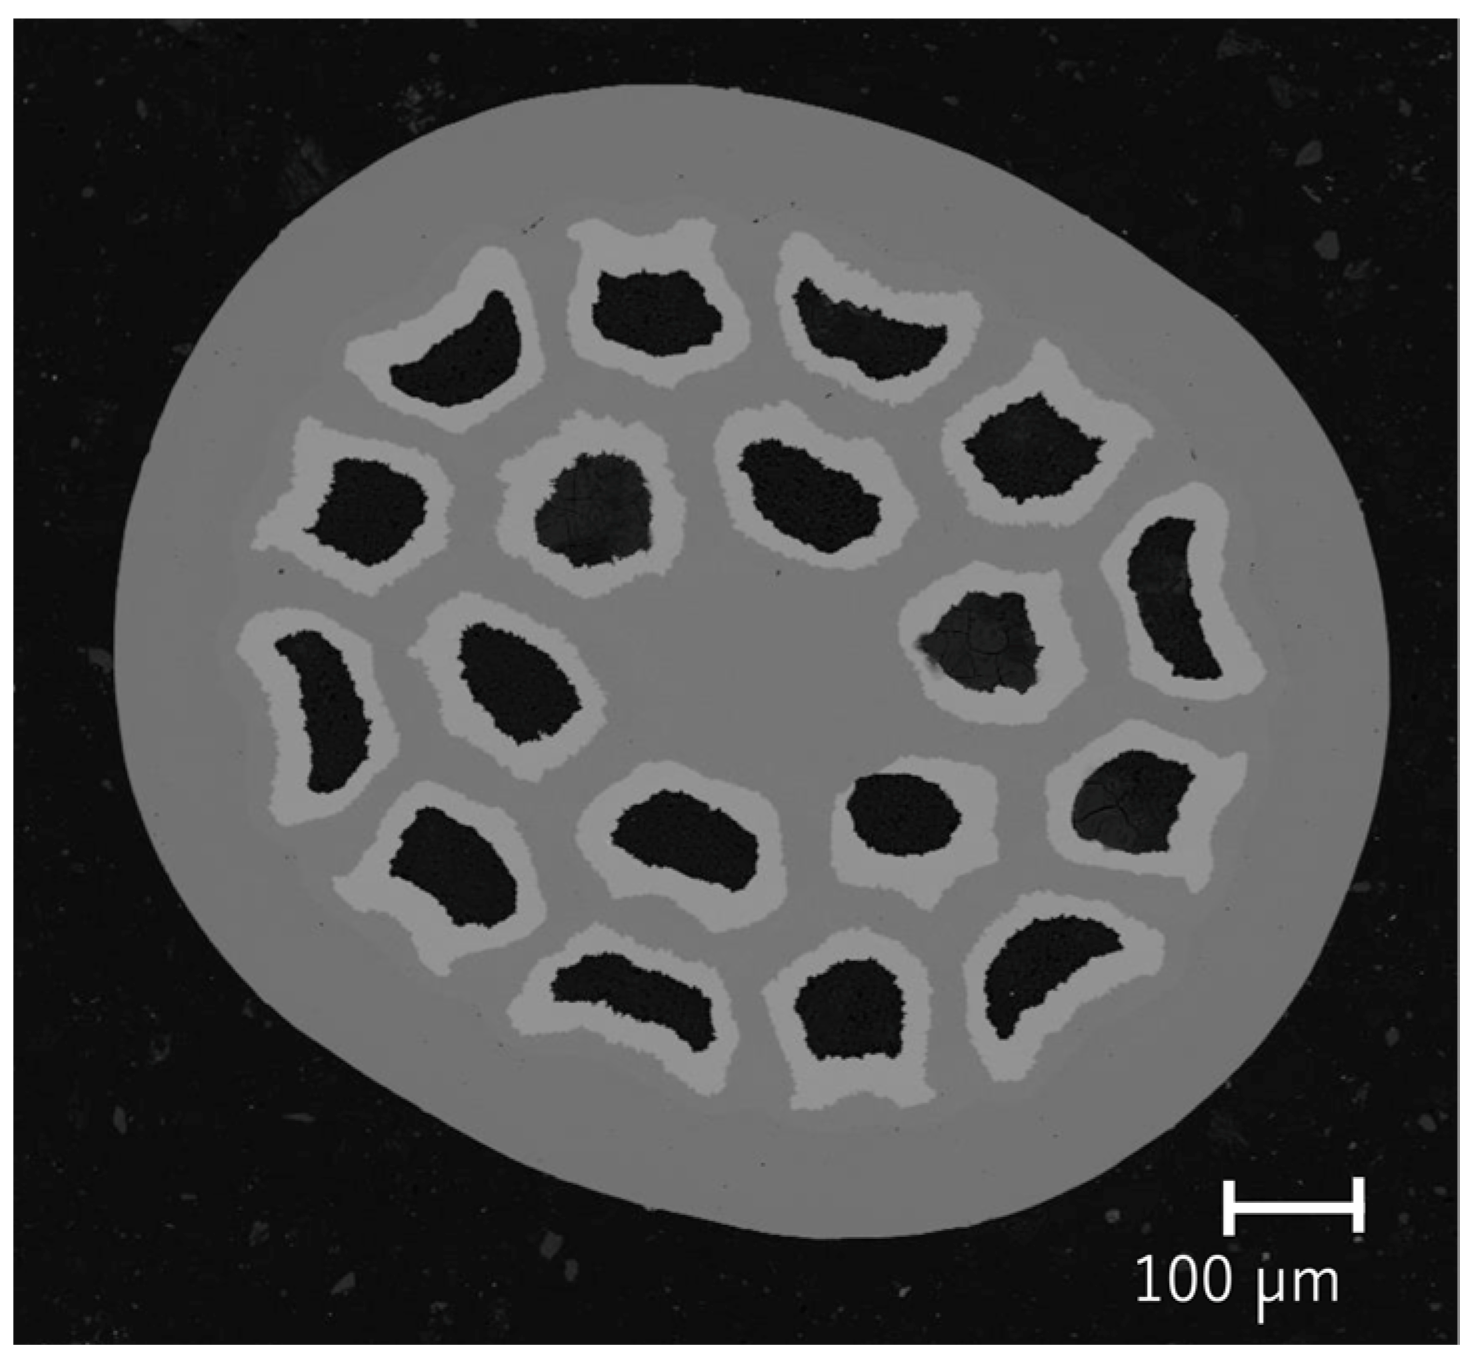
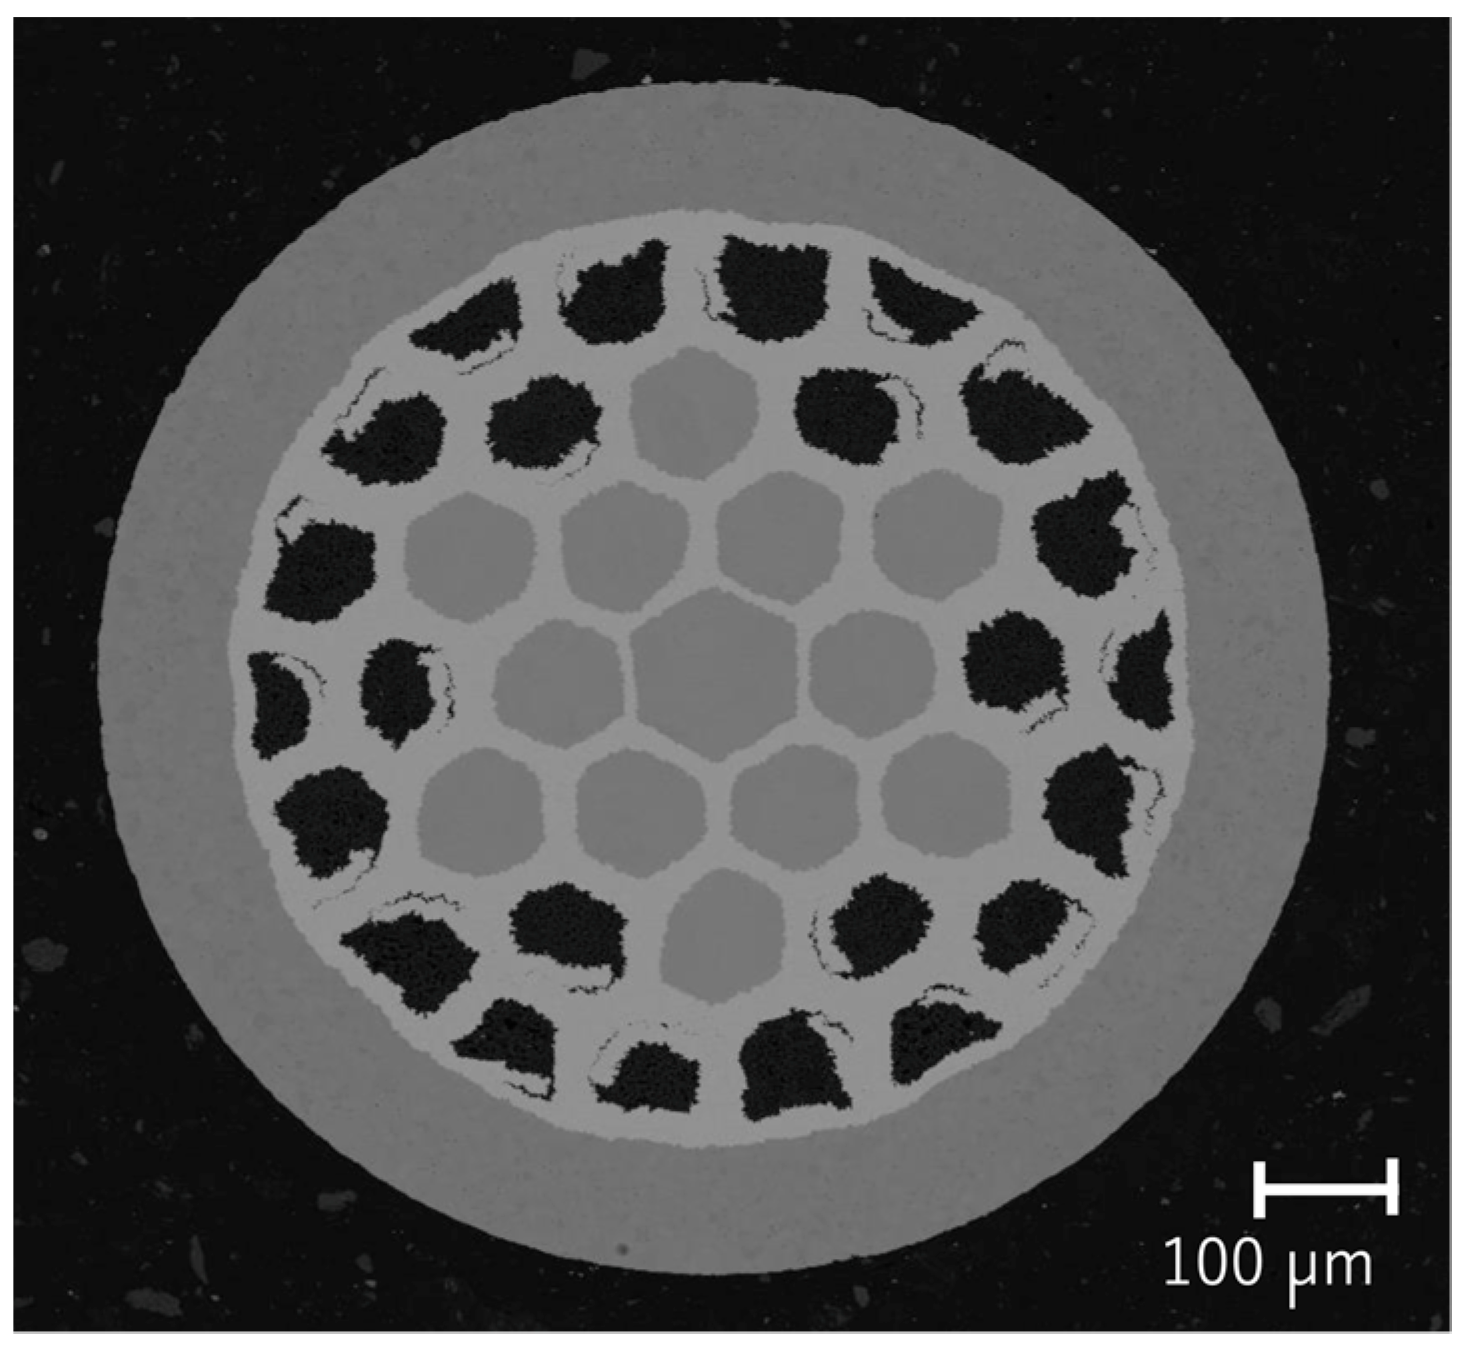
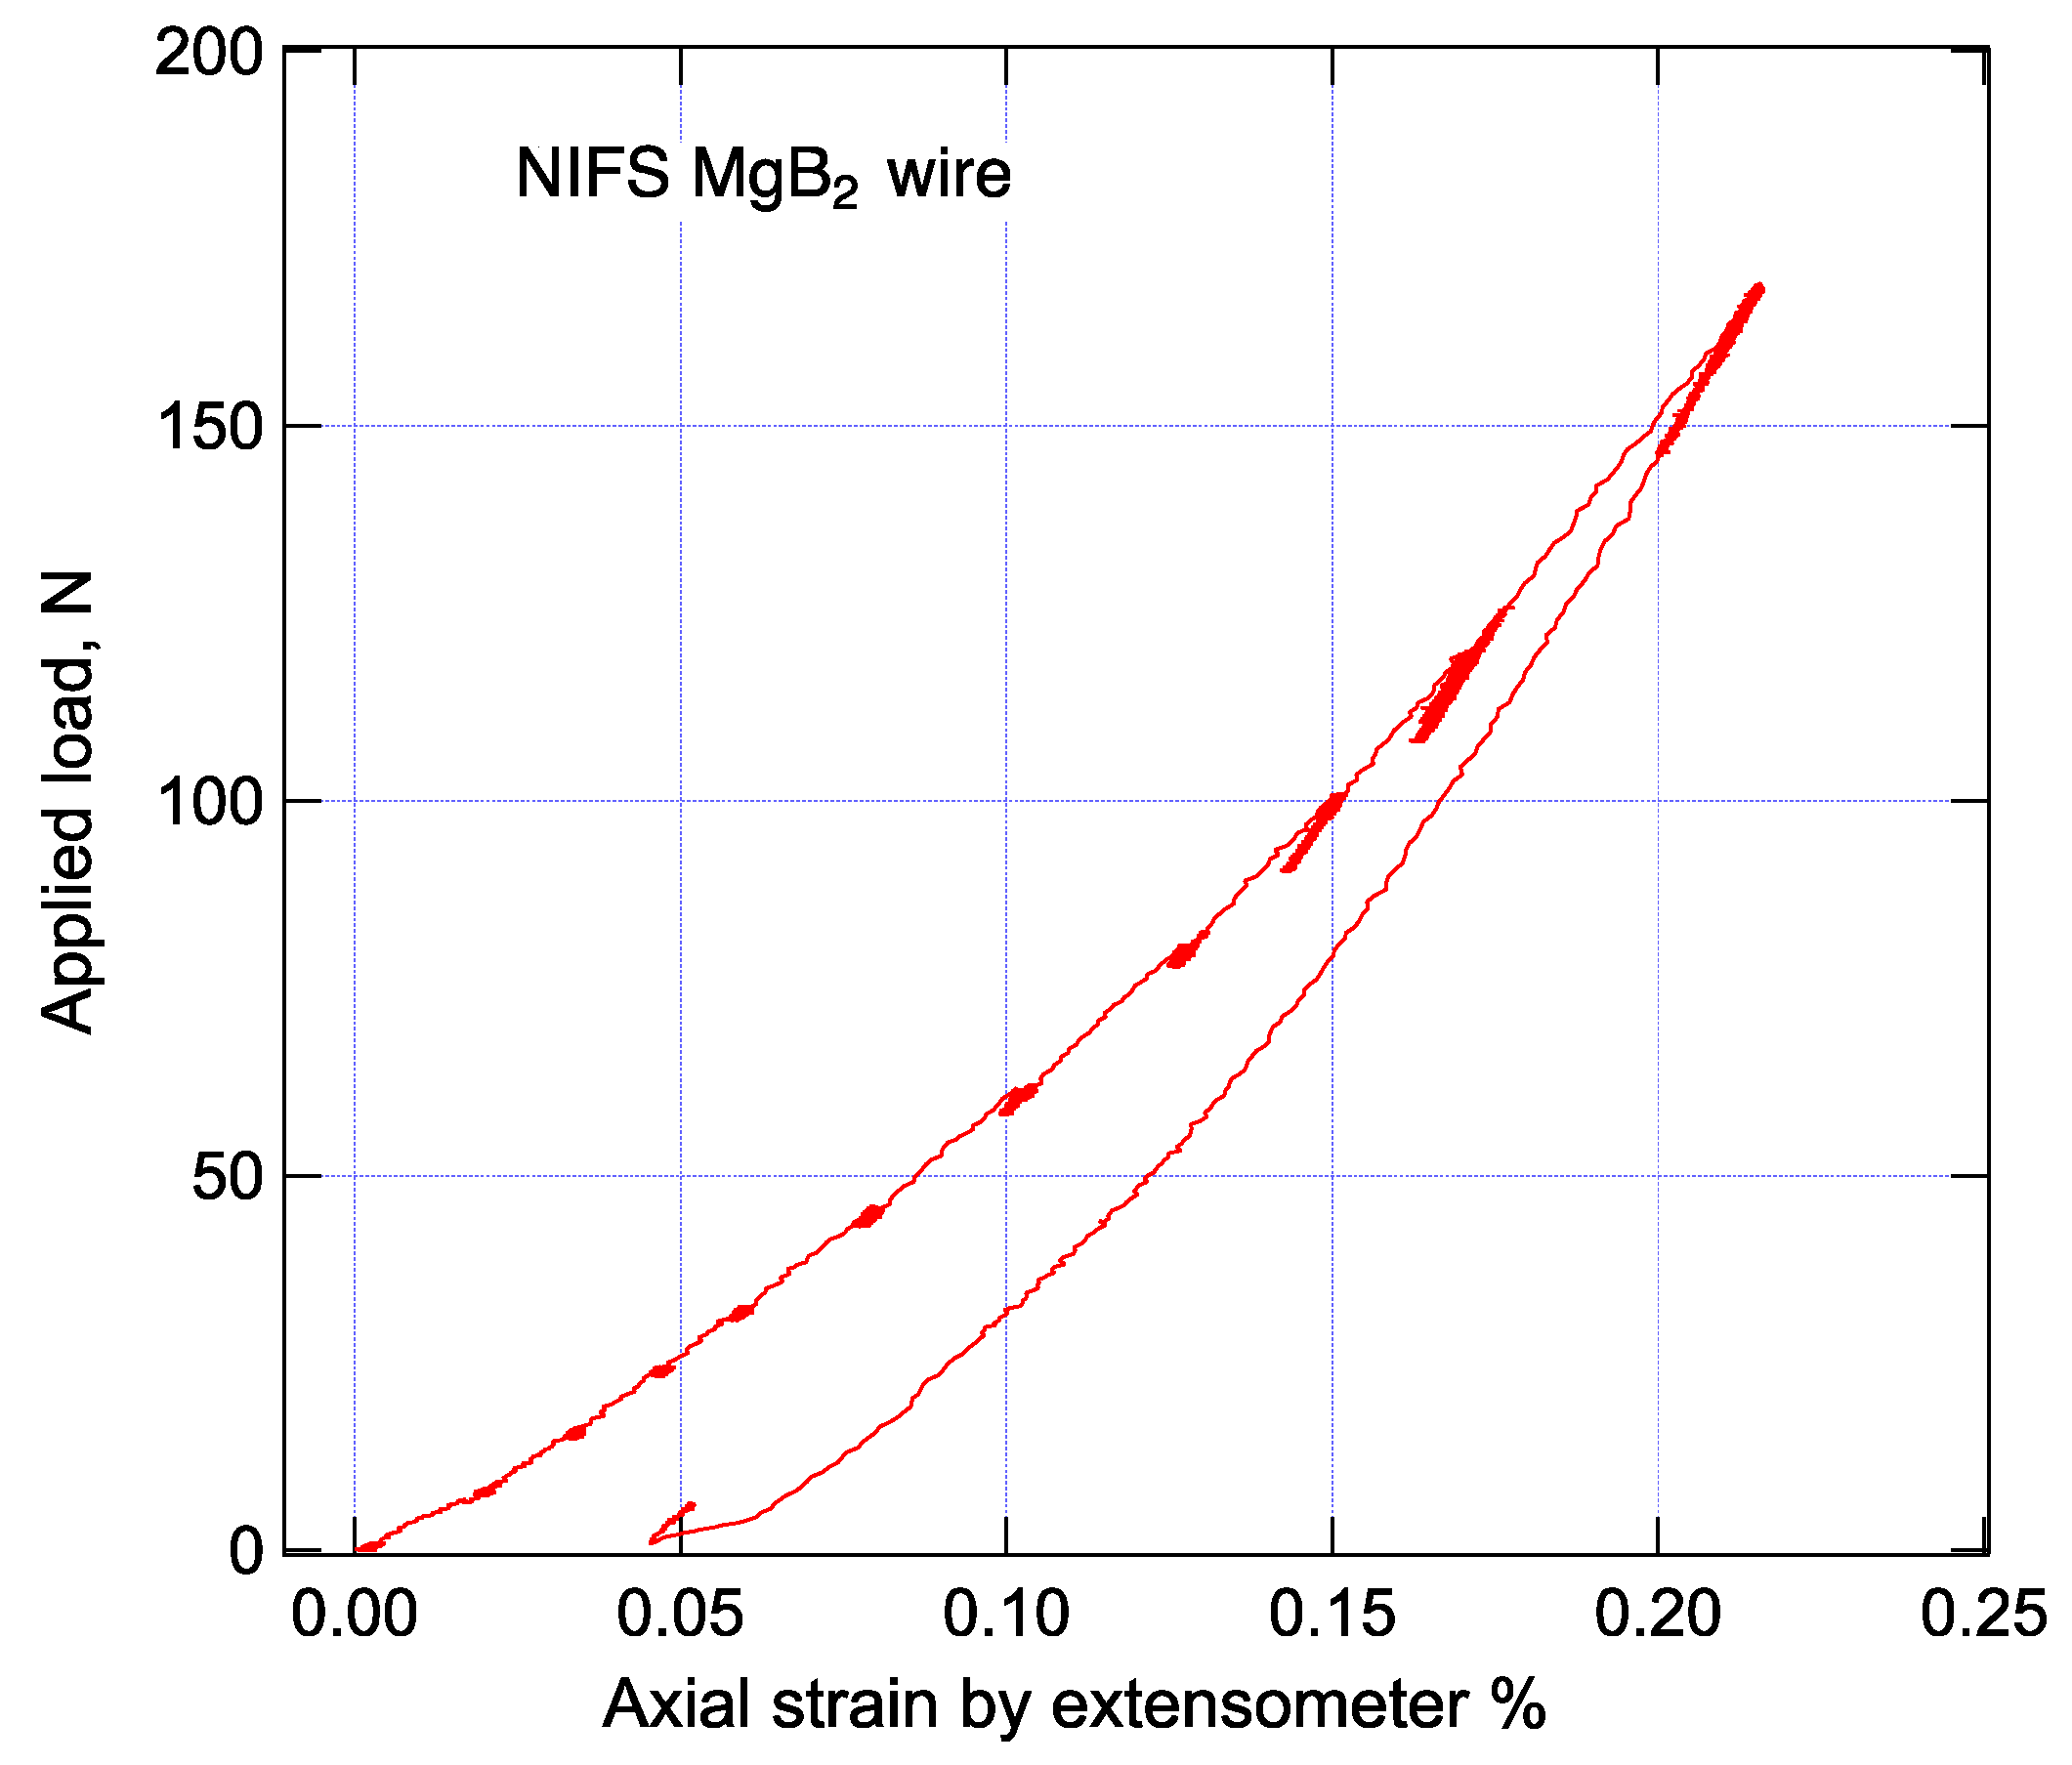
2.1. Preparation of MgB2 Wires

Figure 1 displays a multi-filamentary MgB2 wire enriched with 11B. The wire has a diameter of approximately 1.07 mm. This 11B-enriched sample was developed by the National Institute for Fusion Science (NIFS) in Japan. The cracks seen in the photographs are a result of lateral compression near the chuck of the specimen used for tensile testing and are not representative of the wire’s typical condition. The manufacturing process is outlined below.
Mg powder (purity: 99.9%, −200 mesh) and 11B isotopic powders, which were isotopically separated from natural boron, were prepared. The 11B powder was sourced from Ceradyne and had a purity of 98%. The Mg2Cu intermetallic compound was used as the source of Cu additive [18]. To ensure uniform dispersion within the precursor powder, microparticulation was employed. In this study, Mg2Cu microparticles were produced through mechanical milling using a ball mill. The amount added was equivalent to 3 at% Cu, which was considered optimal for the precursor powder. The powder-in-tube (PIT) method was utilized to fill a metallic tantalum tube with an outer diameter of 10 mm and an inner diameter of 6 mm. In the subsequent step, 19 hexagonal single-core wires were cut and assembled into oxygen-free copper tubes (outer diameter: 14 mm, inner diameter: 10 mm). Finally, this composite billet was drawn using a cassette roller die, resulting in a final diameter of 1.07 mm to obtain the multi-core wire. In the last stage, the heat treatment temperature was raised from 450 to 600 degrees Celsius over a period of 200 h in an argon atmosphere to facilitate low-temperature diffusion. Figure 1a provides a cross-sectional view of the resulting wire via SEM, while Figure 1b displays the color map of EPMA results for the main elements. Some oxygen is observed in the EPMA results, which is typical in practical wires and is likely attributed to residual oxides.
Practical MgB2 wires are commercially produced by several manufacturers using both ex situ and in situ methods. The filaments consist of sintered MgB2 components and are enclosed by an inner sheath to prevent chemical reactions with the matrix. The outer sheath is crucial for ensuring consistent superconducting and mechanical properties over long-scale wires. In this particular case, we used wires produced by the Hypertech and Samdong in situ methods. These boron isotopes are assumed to be in their natural ratio. Table 1 illustrates the structural details of the two types of MgB2 wires commonly used in practical applications. Additionally, Figure 2 and Figure 3 display SEM cross-sectional images of these wires. The outermost sheath is a Ni-Cu-Fe alloy known as Monel, the darker region represents the MgB2 filament, and each filament is surrounded by an Nb sheath. The diameter of each wire is 0.83 mm for both Samdong and Hypertech.

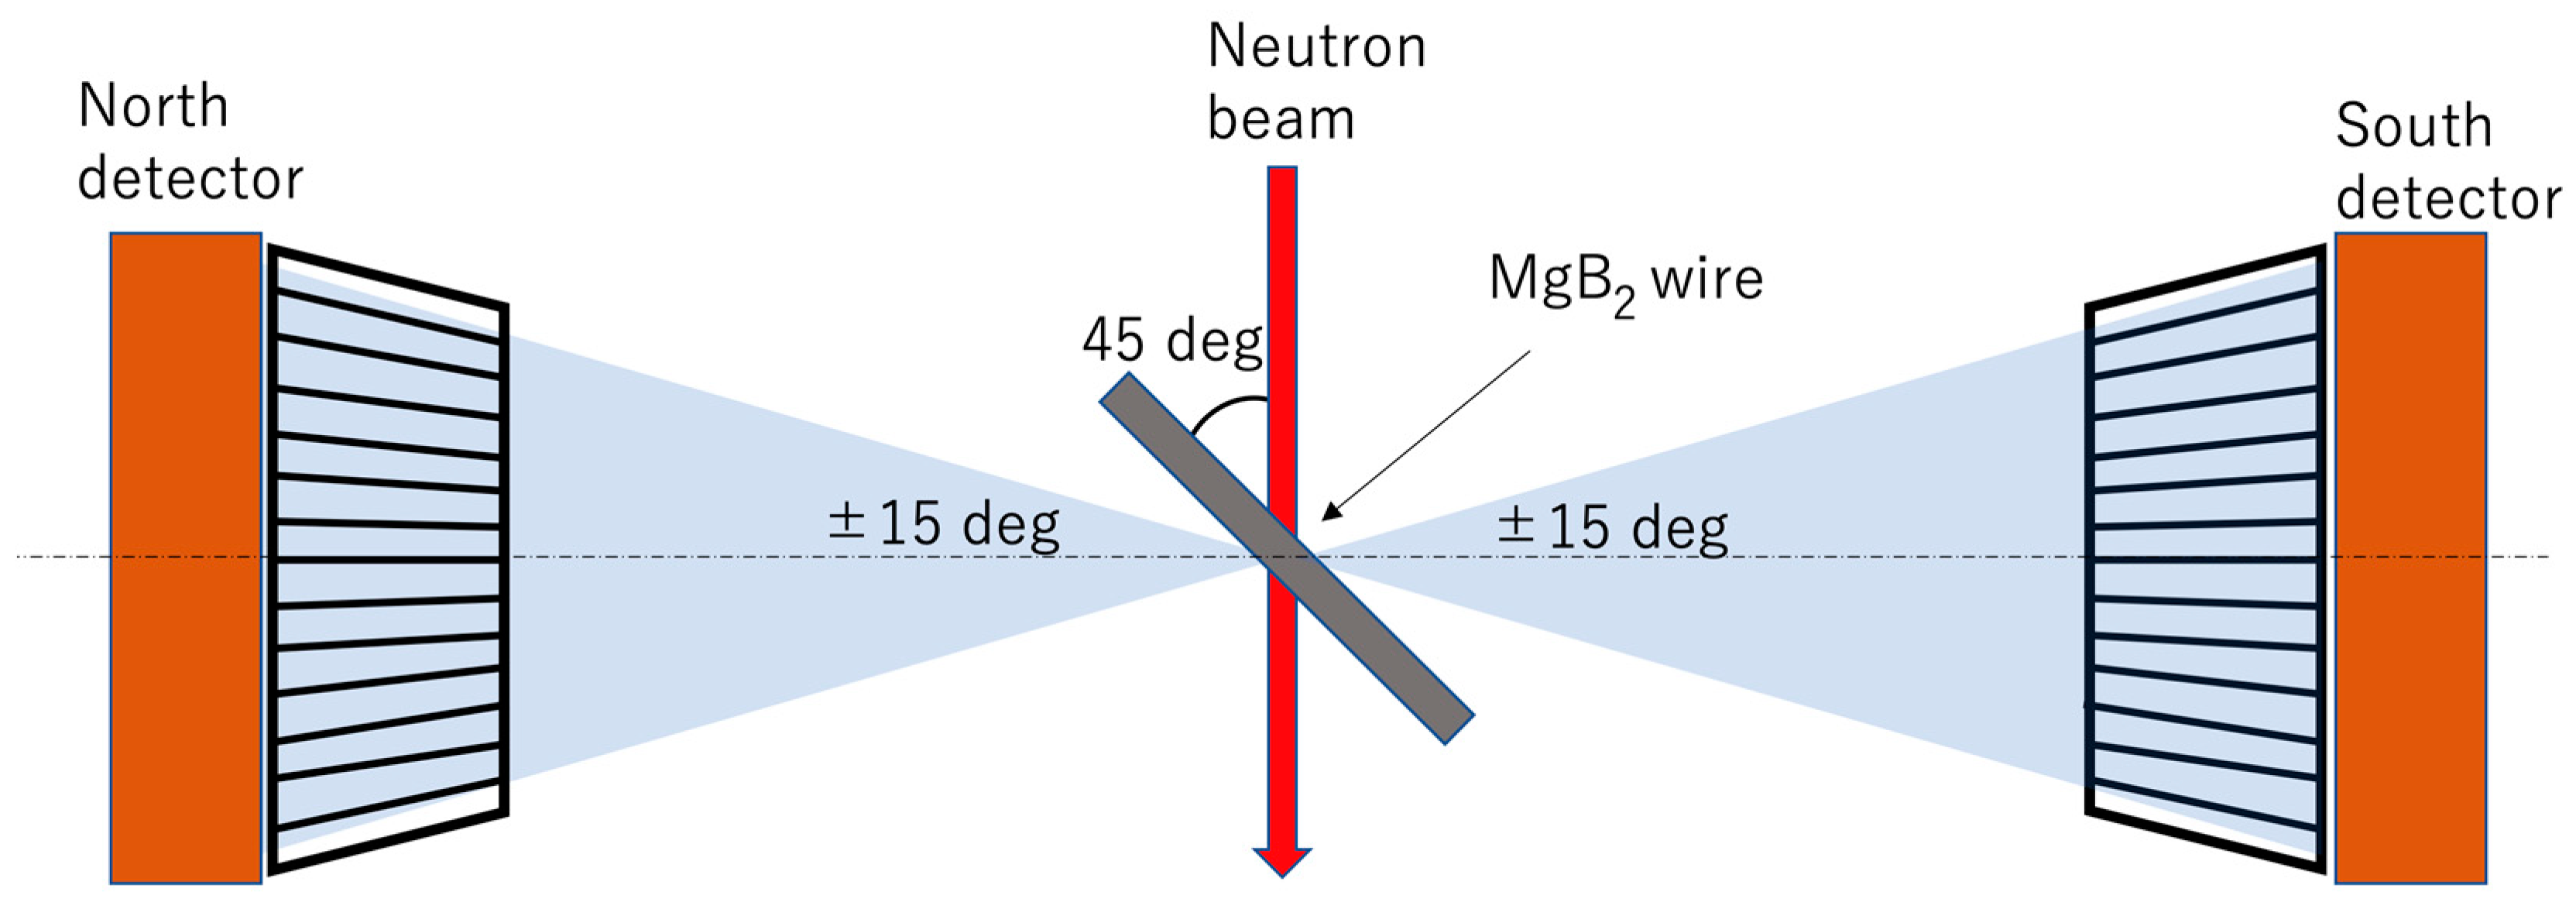
2.2. Strain Calculation Using the ToF Method

The strains were derived from measurements conducted using the Time-of-Flight (ToF) method at Takumi (BL19 of MLF) [17]. The pulsed neutron method, also referred to as the ToF method, is a technique that captures the lattice spacing (d) of crystals in a histogram-like fashion, similar to a spectrometer. This method involves utilizing a single pulse of neutrons with varying speeds: faster neutrons diffract and are detected more rapidly, while slower neutrons are detected at a slower pace. In the case of Takumi, it can be conceptualized as a diffractometer with a 2θ angle fixed at approximately 90 degrees and −90 degrees. In practice, the precisely fixed 90-degree angle is less efficient for detection, so the angle is extended to encompass ±15 degrees. If 2θ is rigidly fixed to maintain a stringent scattering vector, fewer crystals will satisfy the diffraction conditions. Therefore, the ToF machine employs a method to enhance detection efficiency by widening the detector’s range beyond 90 degrees. The relationship between lattice spacing (d) and flight time (t) in the Time-of-Flight method is elucidated by the following equation:
d = λ 2 sin θ = 1 2 sin θ · h t m L
where (h) is Planck’s constant and (m) is the mass of a neutron. (L) is a flight distance of neutrons from the chopper to the nearby target. From Equation (1), the lattice spacing (d) can be calculated using the flight times conversion parameter.
ε = d d 0 d 0
Strain (ε) is determined through Equation (2). It is important to note that both d and ToF share the same dimensions, and this strain relationship remains valid whether we use d or ToF. In cases where there is no d0 sample, which represents the strain-free d spacing (for instance, in tensile tests), the point at which zero load is applied is often calculated as d0.

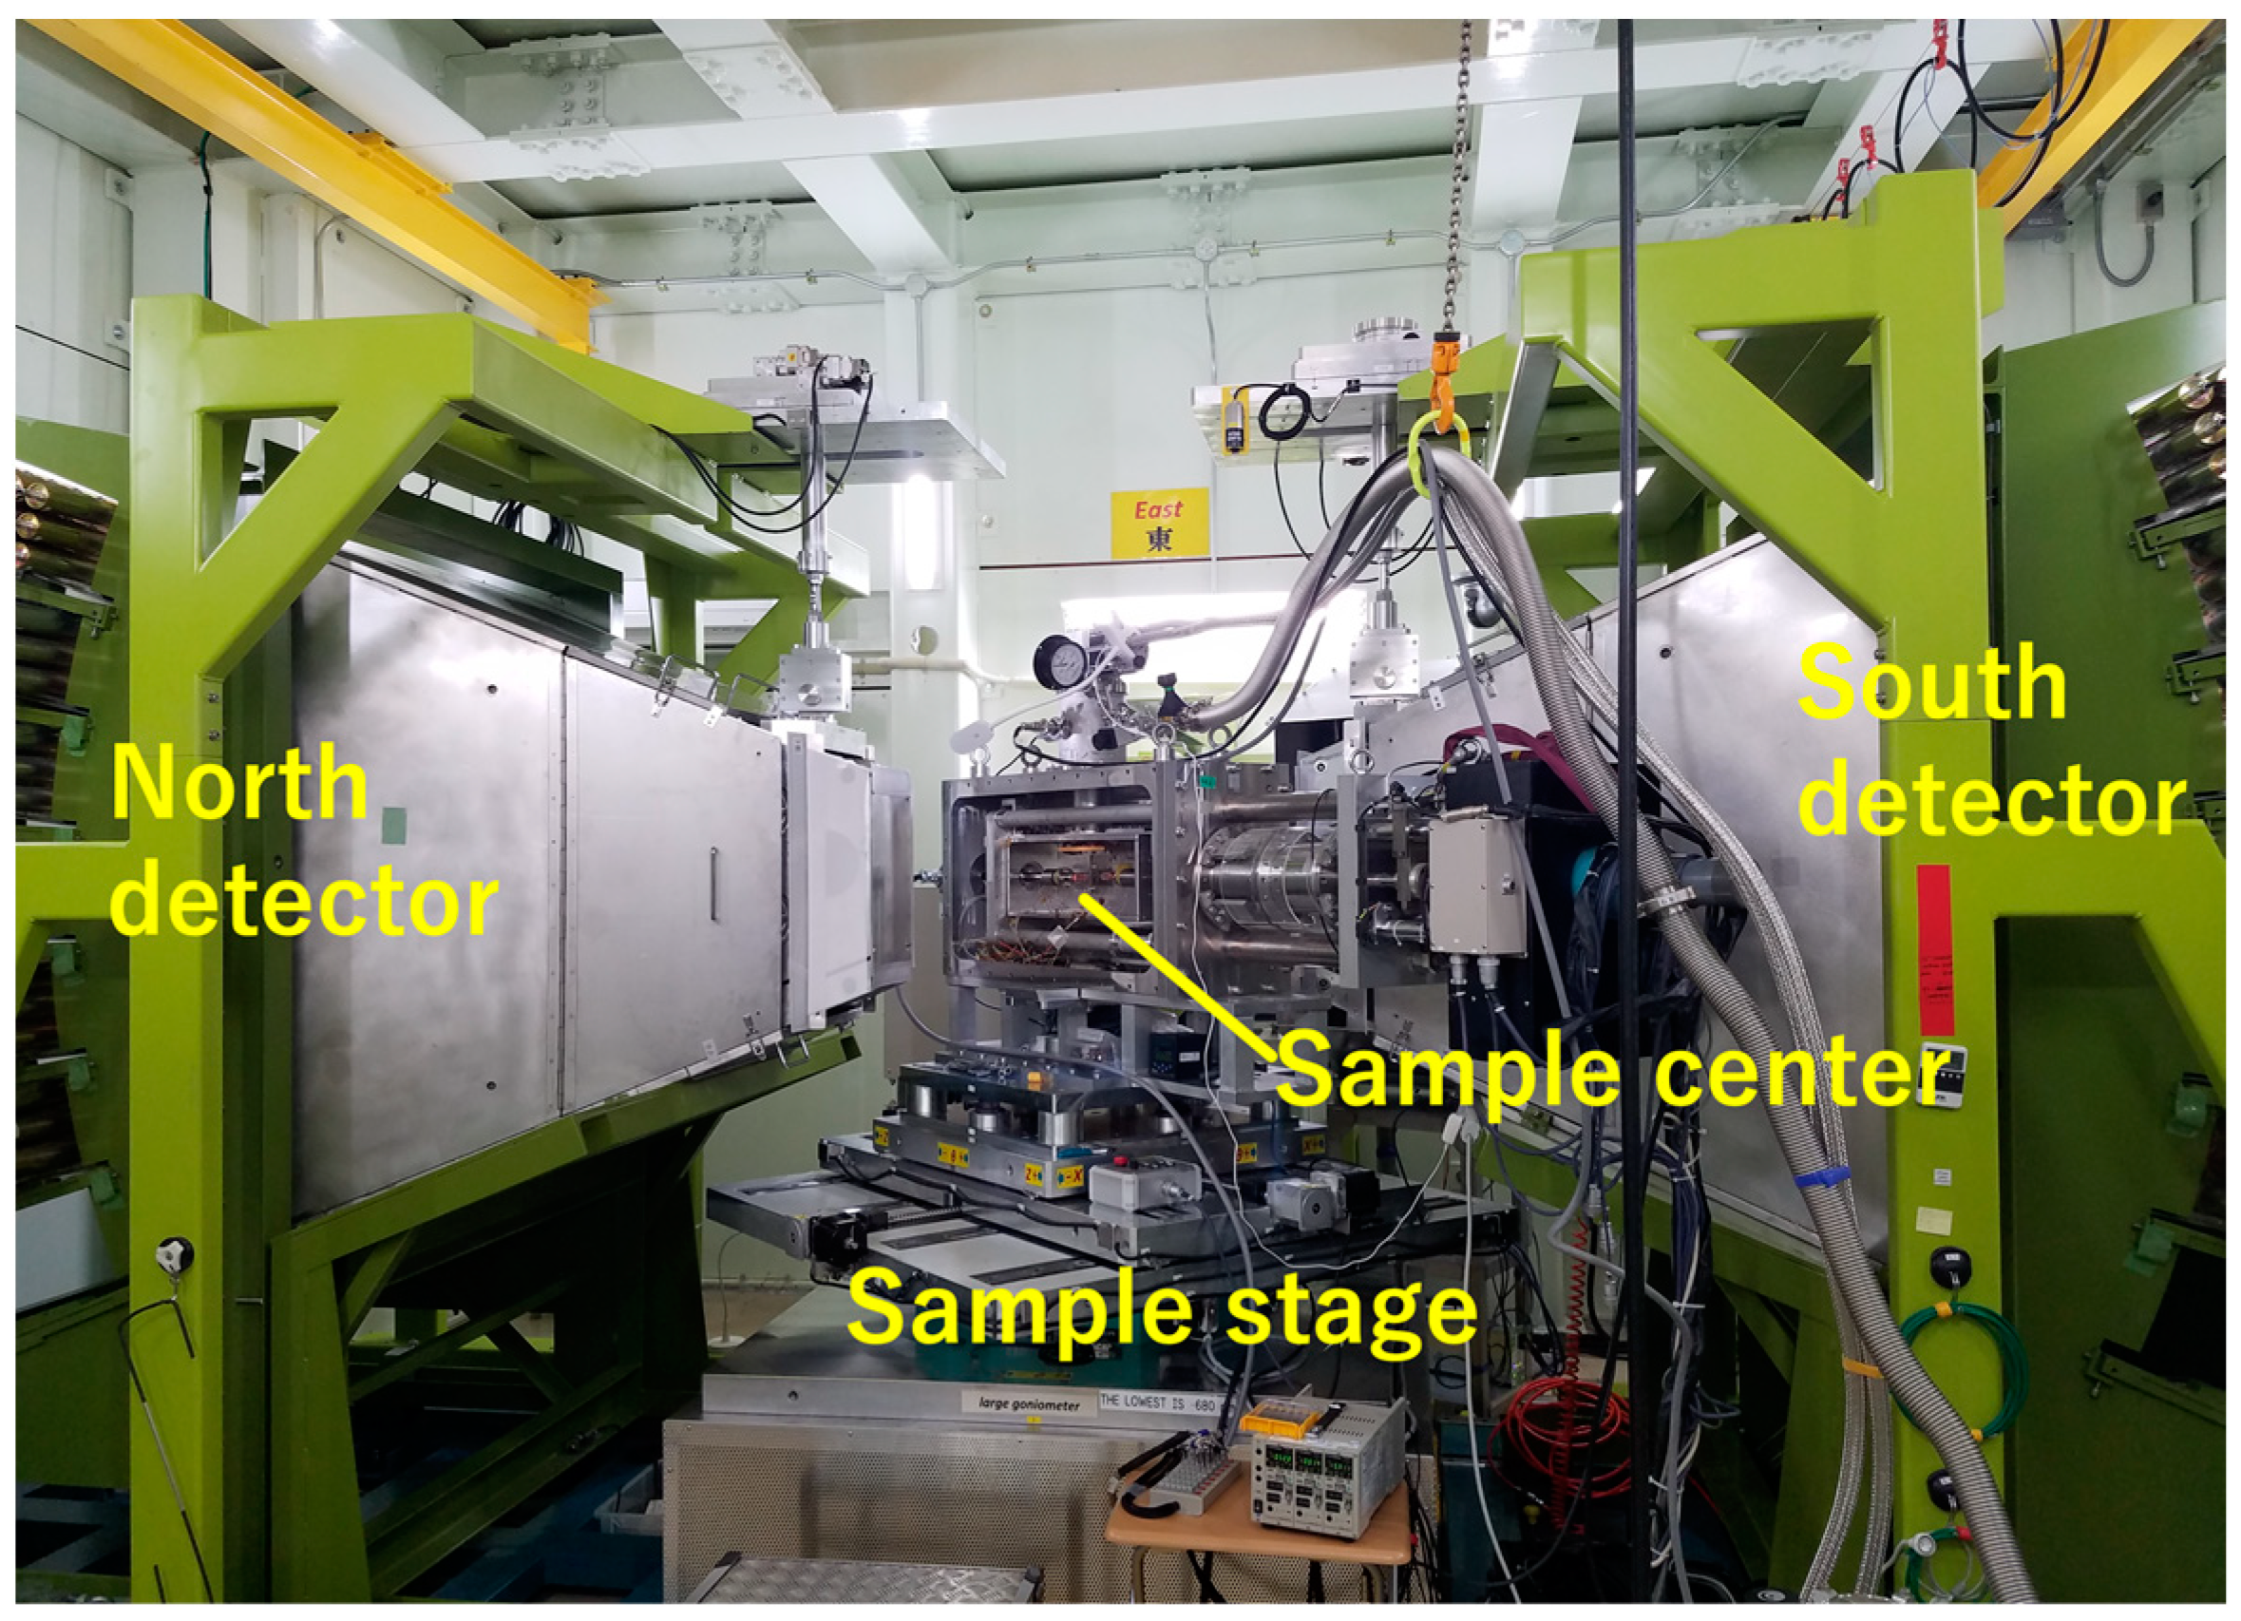
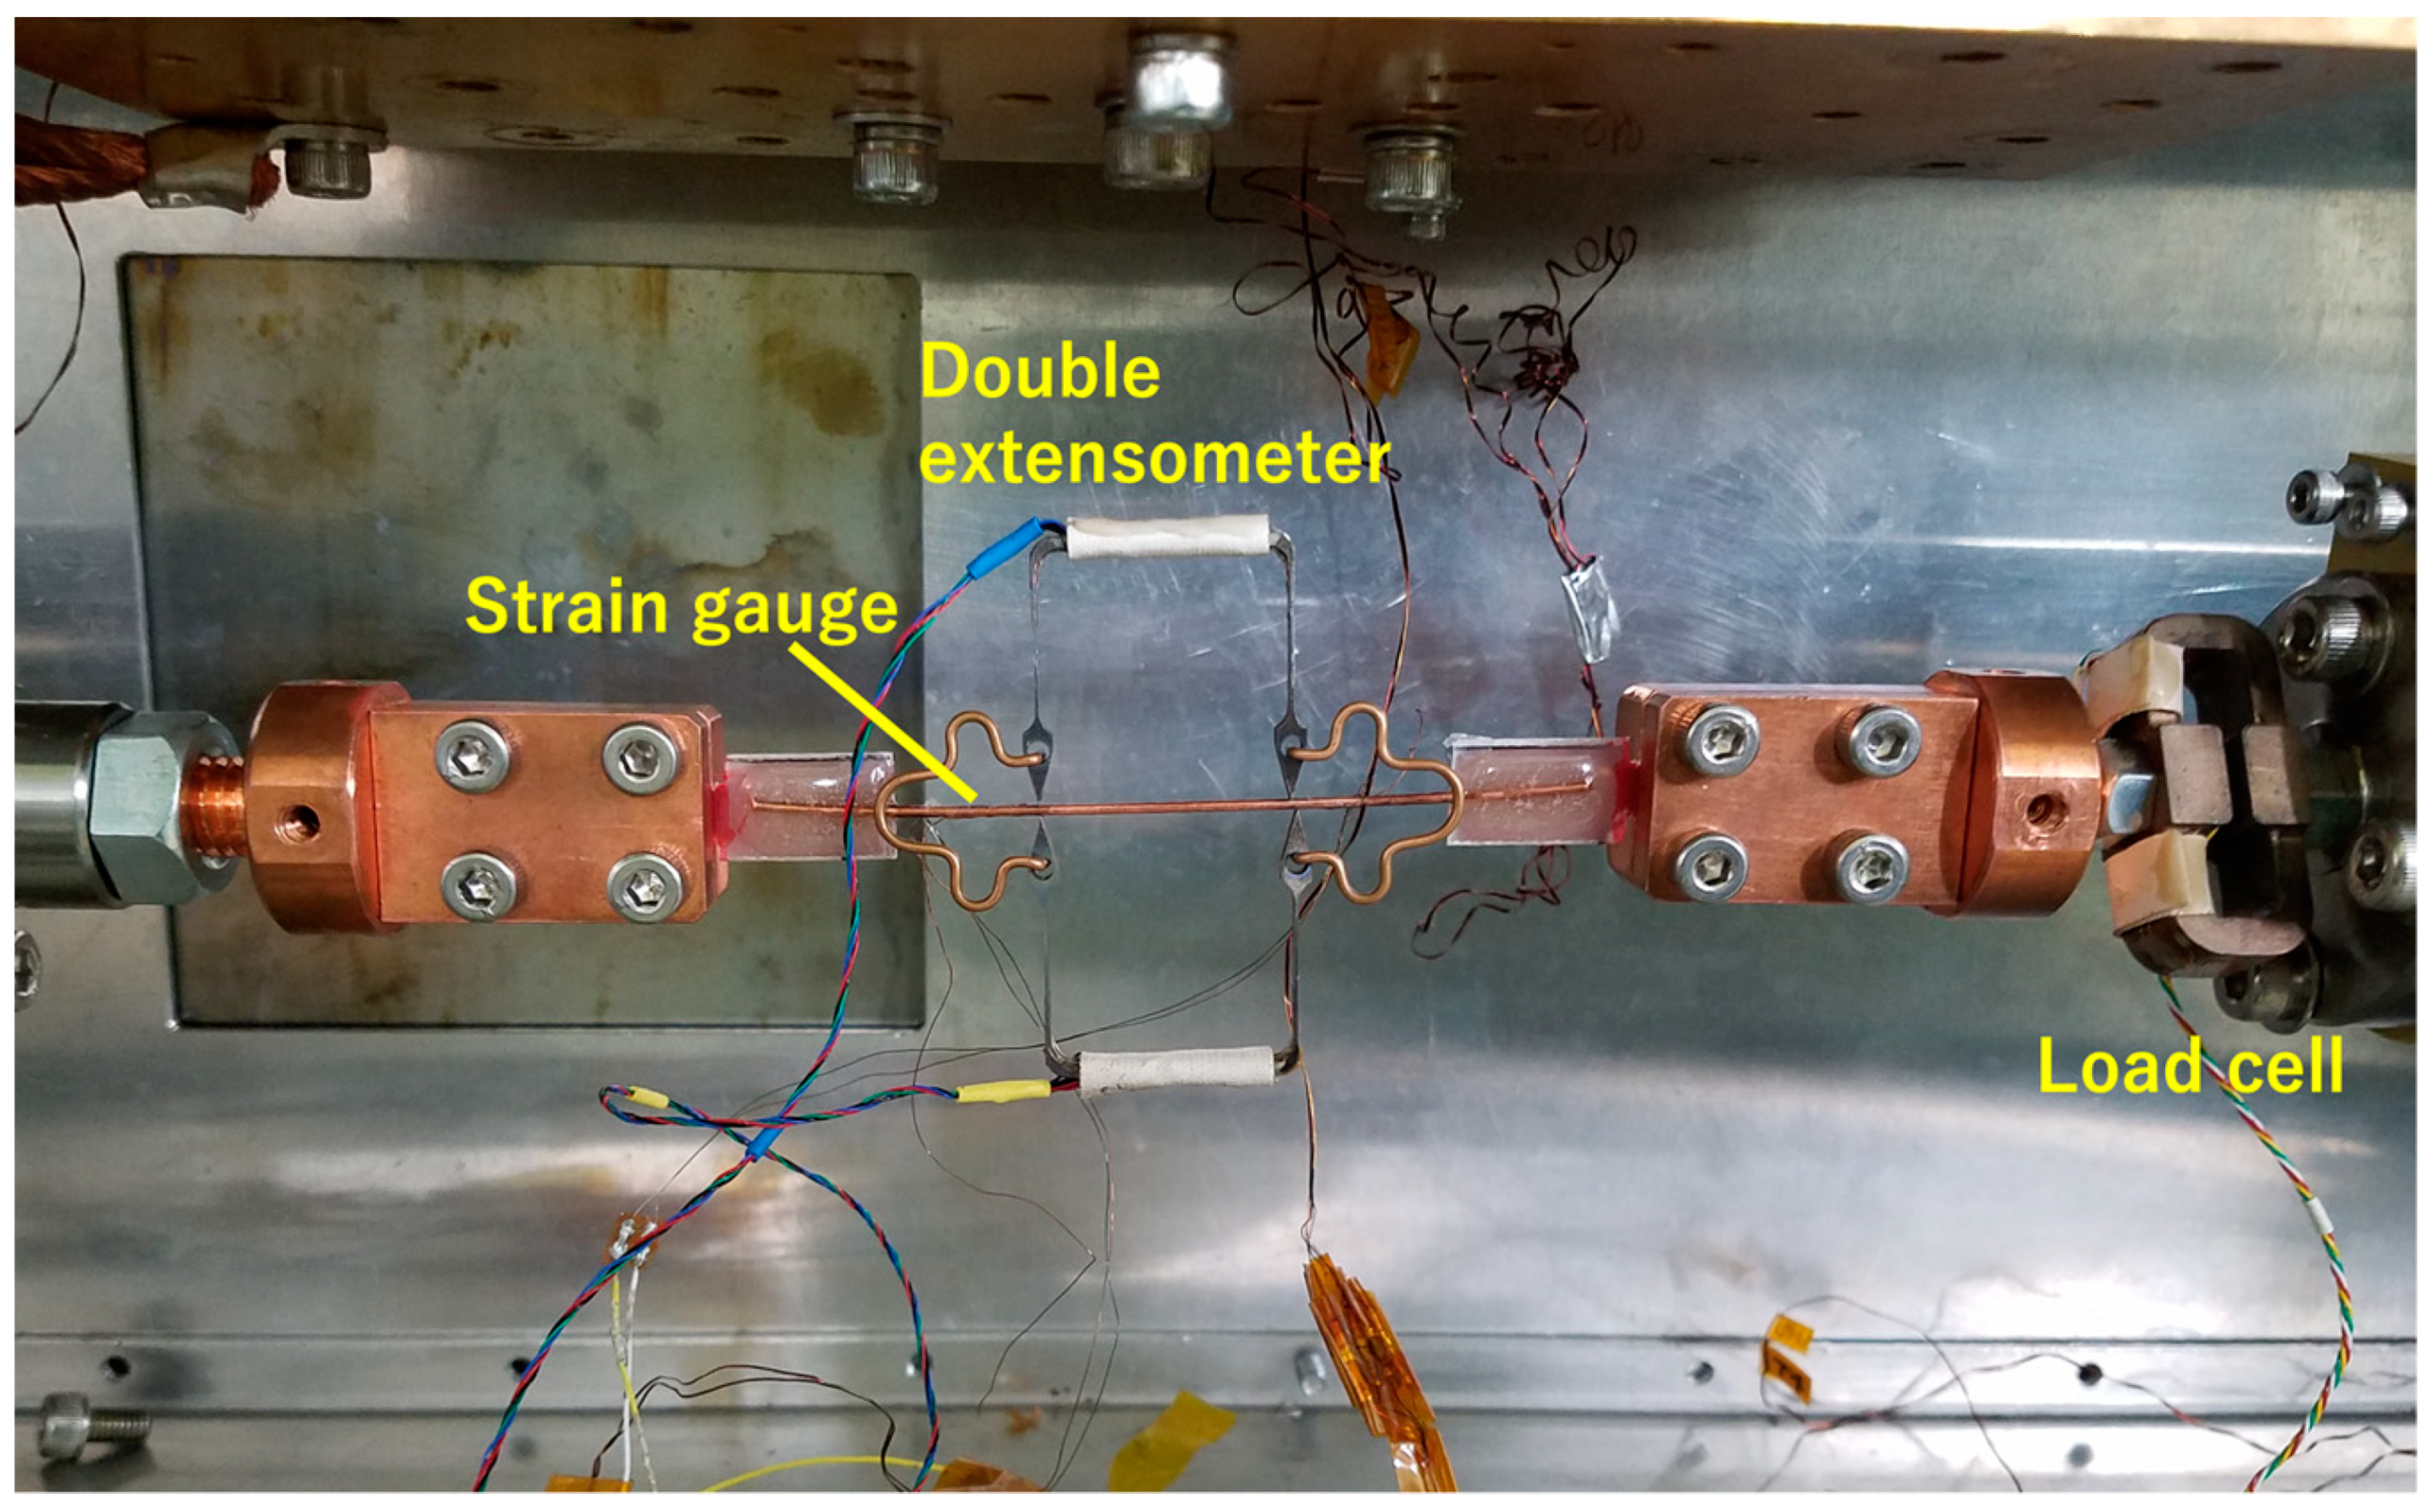
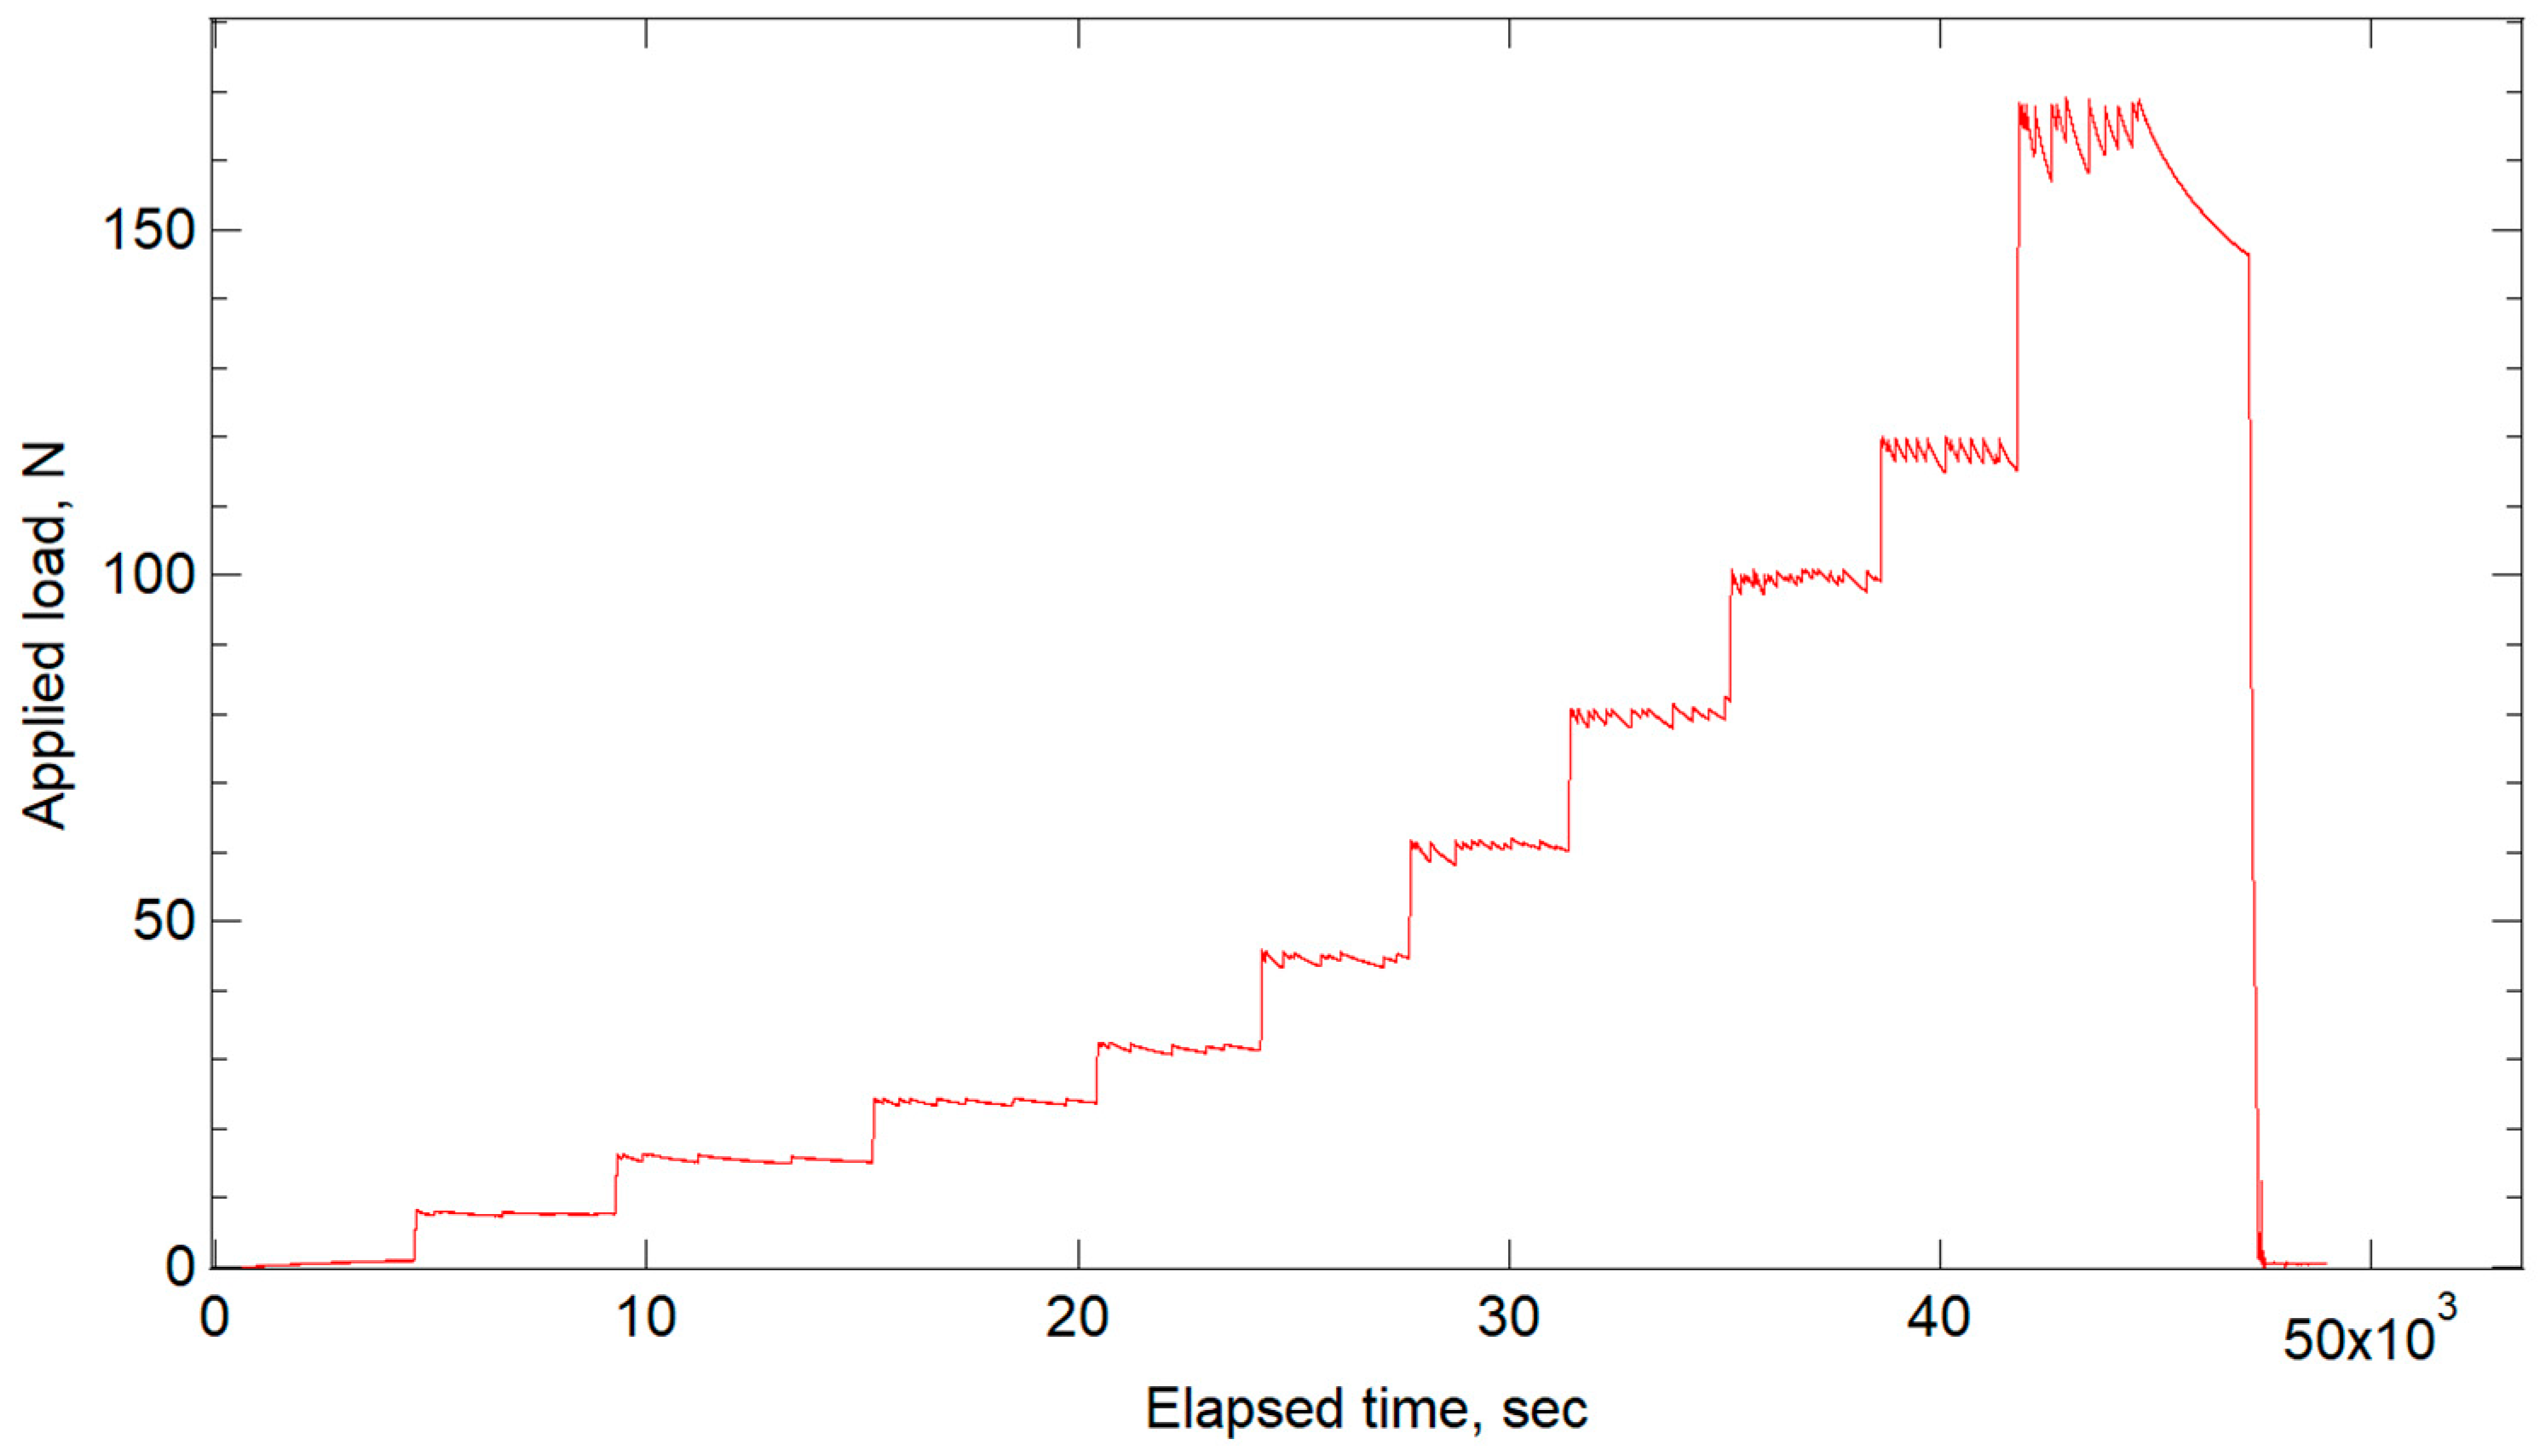
2.3. In Situ Strain Measurement under Tensile Test and Equipment
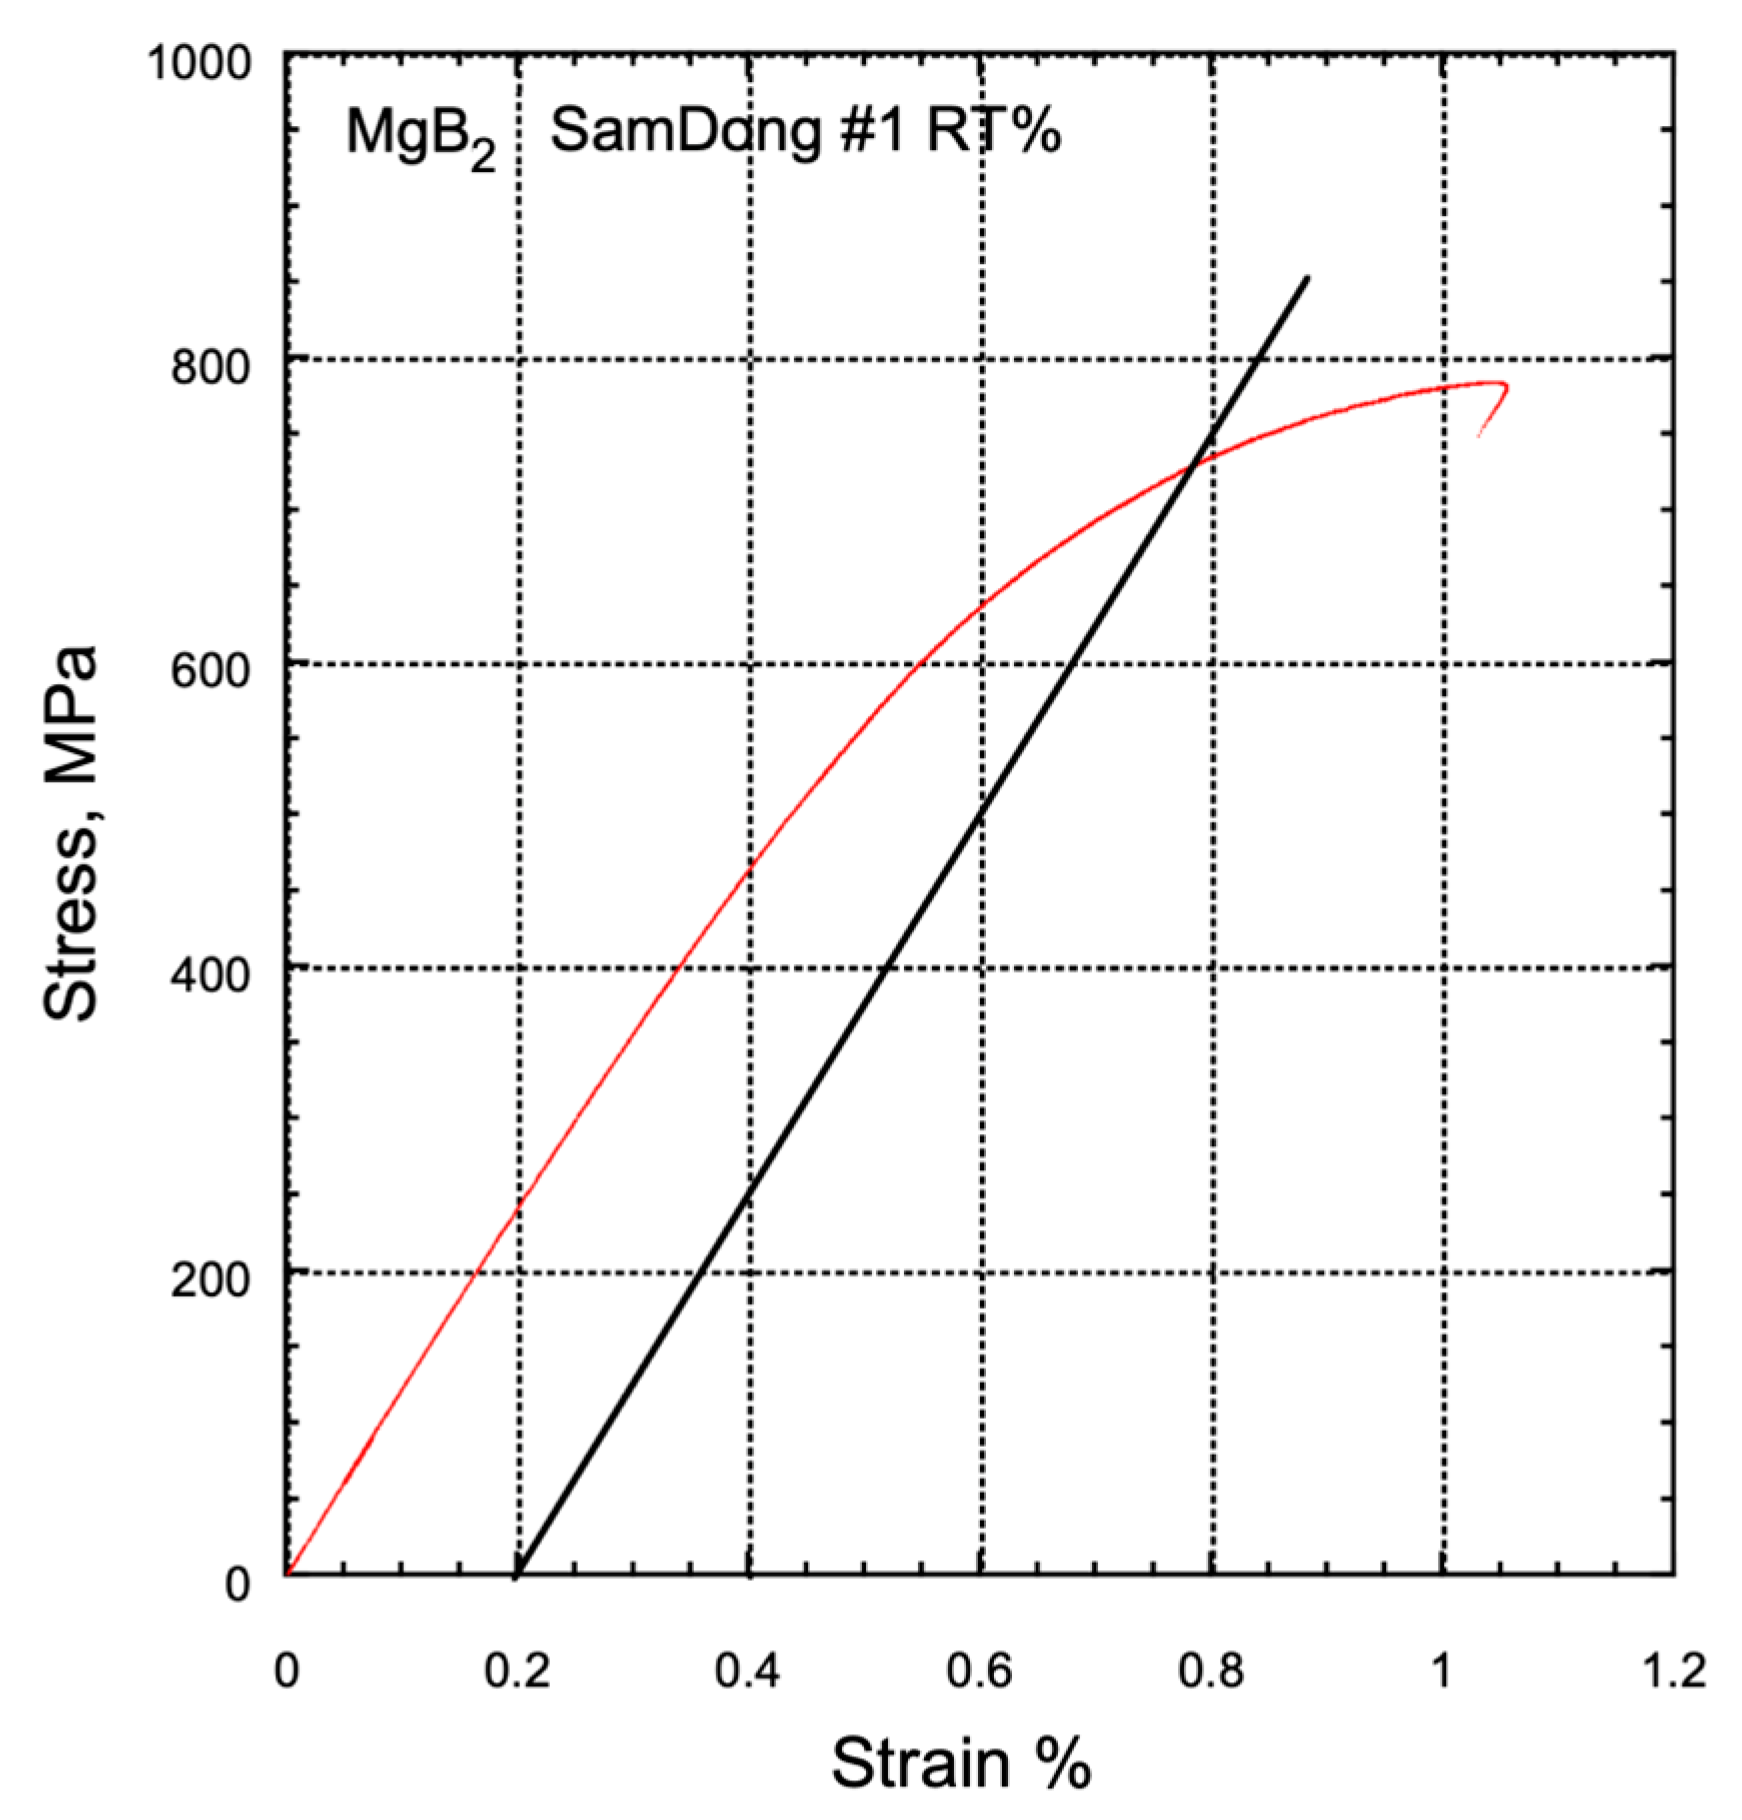
BL19 Takumi is a Time-of-Flight (ToF) neutron powder diffractometer designed for engineering science. What sets it apart from other powder scattering systems is its unique ability to precisely define the principal strain direction, aligning it with the scattering vector. As depicted in Figure 4, the detector comprises two opposing banks, North and South. When the sample is oriented at a 45° angle, the system can measure the lattice spacing (d) along the sample axis using the North bank and the lattice spacing (d) along the sample diameter using the South bank. It is worth noting that while the diffraction angle 2θ is theoretically fixed at 90 degrees, in practice, it is measured within the range of 75 to 105 degrees. This extended range allows for the measurement of diffraction from crystals with orientations that deviate by up to ±7.5° from the nominal principal strain direction. However, due to the nature of the sine function, the impact of such deviations is negligible.
The detector’s field of view is constrained by a radial collimator, which selectively captures scattering within a central 5 mm area while blocking out other contributions. An actual photograph of the diffractometer with the sample mounted is given in Figure 5. While diffraction appears to be primarily detected within the same beam plane, the actual detector is three-dimensional and can capture diffraction events within a solid angle ranging from −15 degrees to +15 degrees relative to the out-of-plane direction of the beam.
The samples were affixed to a low-temperature tensile testing frame, although the measurements themselves were conducted solely at room temperature. The size of the neutron beam for irradiation was delimited by a slit, measuring 5 mm in length and 10 mm in width. The beam power generated by the MLF target was nominally set at 500 kW.
The wires used for the tensile tests were all 100 mm in length. Figure 6 displays a photograph of the actual sample setup. Although the tensile test frame was originally designed as a cryogenic tensile frame capable of conducting tests at temperatures around 10 K [19], these measurements were conducted at room temperature. The existing load cell was initially designed to accommodate large loads of up to 50 kN and therefore possessed excessive capacity, rendering it unsuitable for the current samples. Consequently, a smaller 2 kN load cell was custom-manufactured and positioned adjacent to the sample.
Engineering strain measurements were conducted using a Niylas-type double extensometer [20], known for its compactness, lightweight design, and precision. This type of extensometer is frequently employed for tensile measurements on superconducting wires and operates seamlessly at temperatures up to 4 K.
To secure the wire, epoxy adhesive was used to affix it to a 1 mm thick GFRP (glass fiber reinforced polymer) plate, which was subsequently clamped between copper chucks. Additionally, to mitigate potential issues such as extensometer wire breakage, strain measurements were also carried out using custom-made strain gauges. These strain gauges were affixed to wires with a diameter of approximately 1 mm and were capable of measuring axial strain.
As illustrated in the image, even in the presence of neutrons, single-wire measurements were feasible. The ability to conduct experiments with a favorable signal-to-noise ratio (S/N) on a single wire owes much to the potent pulsed neutrons available at the J-PARC MLF. We previously conducted similar experiments using reactor-based steady-state neutron sources, but those experiments involved multiple wires [11]. In those cases, conducting experiments became challenging due to load-sharing variations among multiple wires. Considering that composite wires with a diameter of about 1 mm are employed to measure the strain of the ceramics contained within, it is reasonable to assume that conducting experiments with a single wire using a steady-state neutron source would be considerably more challenging.
Preliminary tensile tests were conducted before the experiments at the neutron facility. The stress–strain curve for the NIFS wire is depicted in Figure 7. In the stress–strain diagram, the horizontal axis represents the strain in percentage, calculated as the ratio of elongation, and it is dimensionless. The vertical axis represents the load in Newtons (N), measured using the load cell. Young’s modulus can be determined from the initial slope of this curve, while the 0.2% proof stress can be found by offsetting a line with the same slope as Young’s modulus to the right by 0.2% from the origin. To improve the accuracy of the Young’s modulus measurement in accordance with IEC standards (IEC 61788-19:2013) [21] for superconducting wire, the load was briefly reduced to 0.15% strain. Three tensile tests were conducted, resulting in an average Young’s modulus of 84 GPa and a 0.2% proof stress of 213 MPa. In this figure, the solid line represents a straight line with the same slope as Young’s modulus, starting at 0.2% strain, and the point where this line intersects the stress–strain curve is the 0.2% proof stress.
Hypertech and Samdong conducted similar tests, although the data for these tests are not presented here due to the lack of comparative neutron measurement data. Stress–strain curves for Hypertech and Samdong are shown in Figure 8 and Figure 9, respectively. The average Young’s modulus and 0.2% proof stress obtained for Hypertech were 133 GPa and 233 MPa, while for Samdong, they were 123 GPa and 734 MPa. The straight line in the diagram is the slope of Young's modulus and, as in Figure 7, is an auxiliary line for determining the 0.2% proof stress.
For the neutron measurements of the NIFS sample, the experiments were conducted under load control, with load steps at 0 N, 8 N, 16 N, 24 N, 32 N, 45 N, 60 N, 80 N, 100 N, 120 N, and 168 N at 11 points.

3. Results

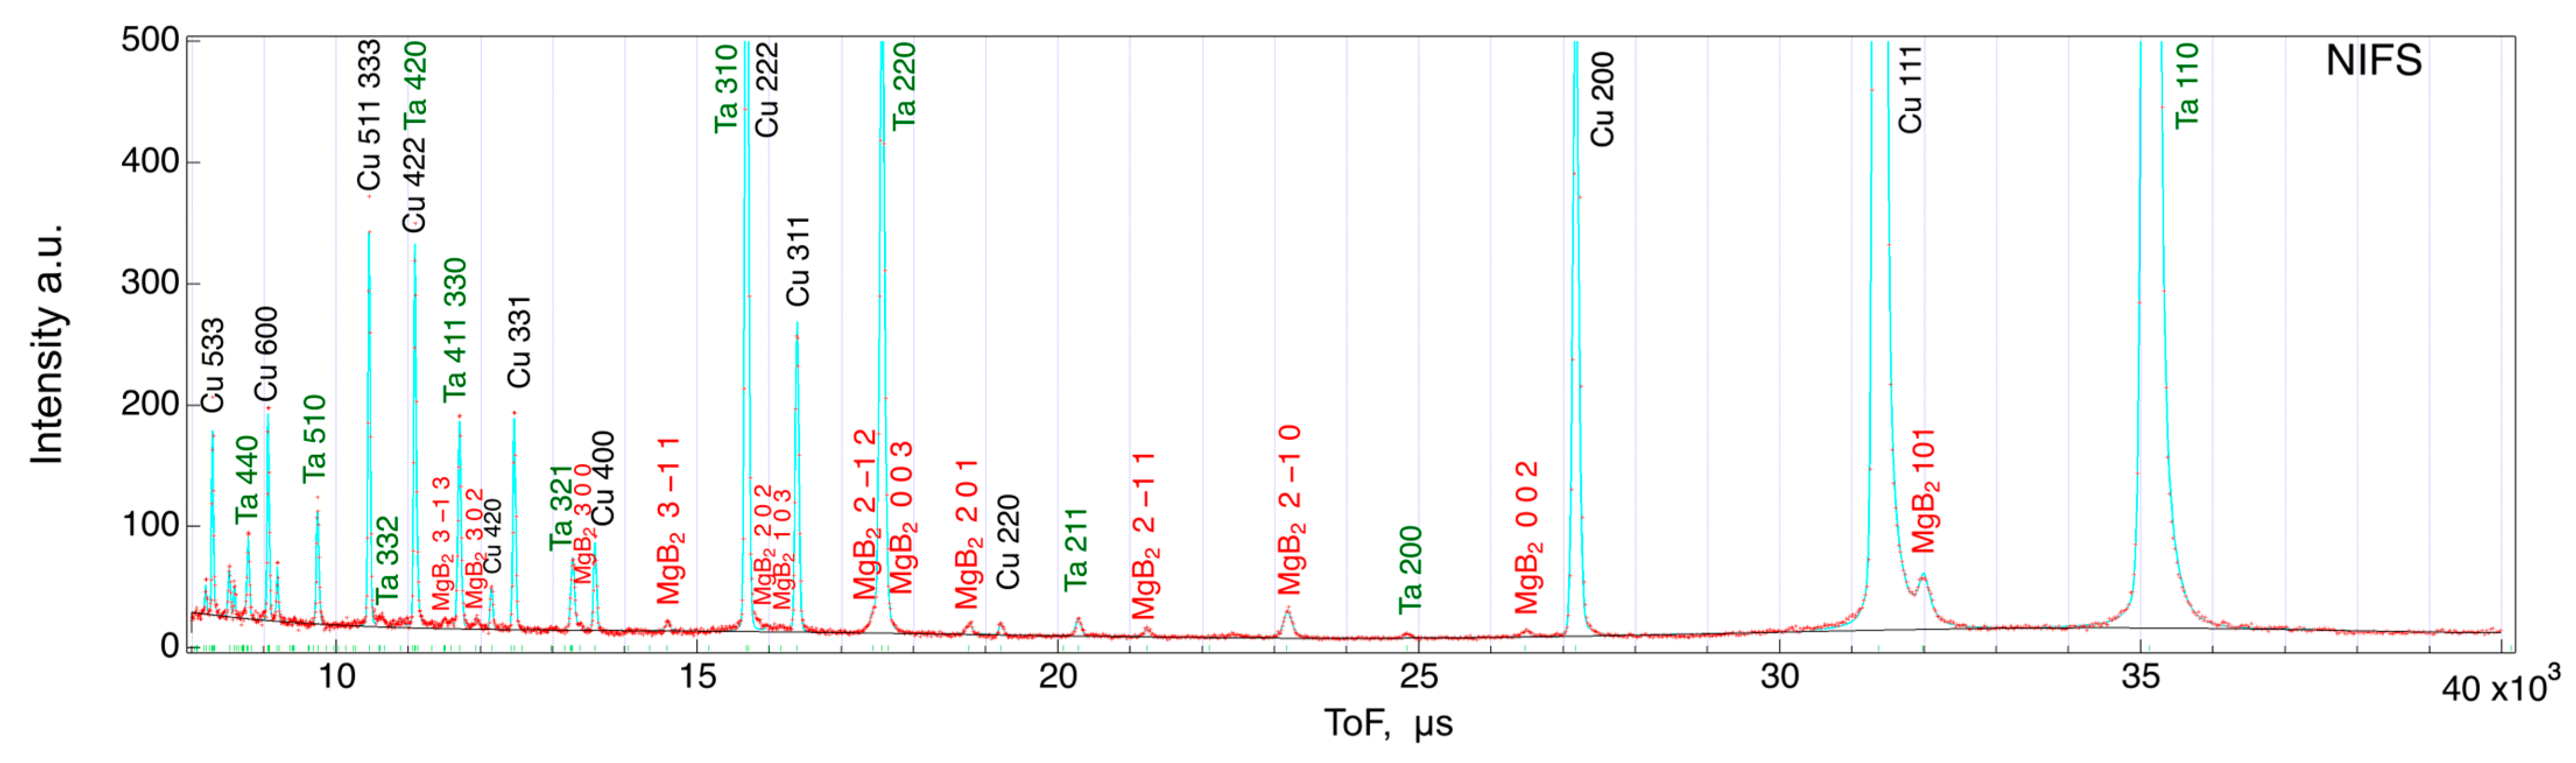
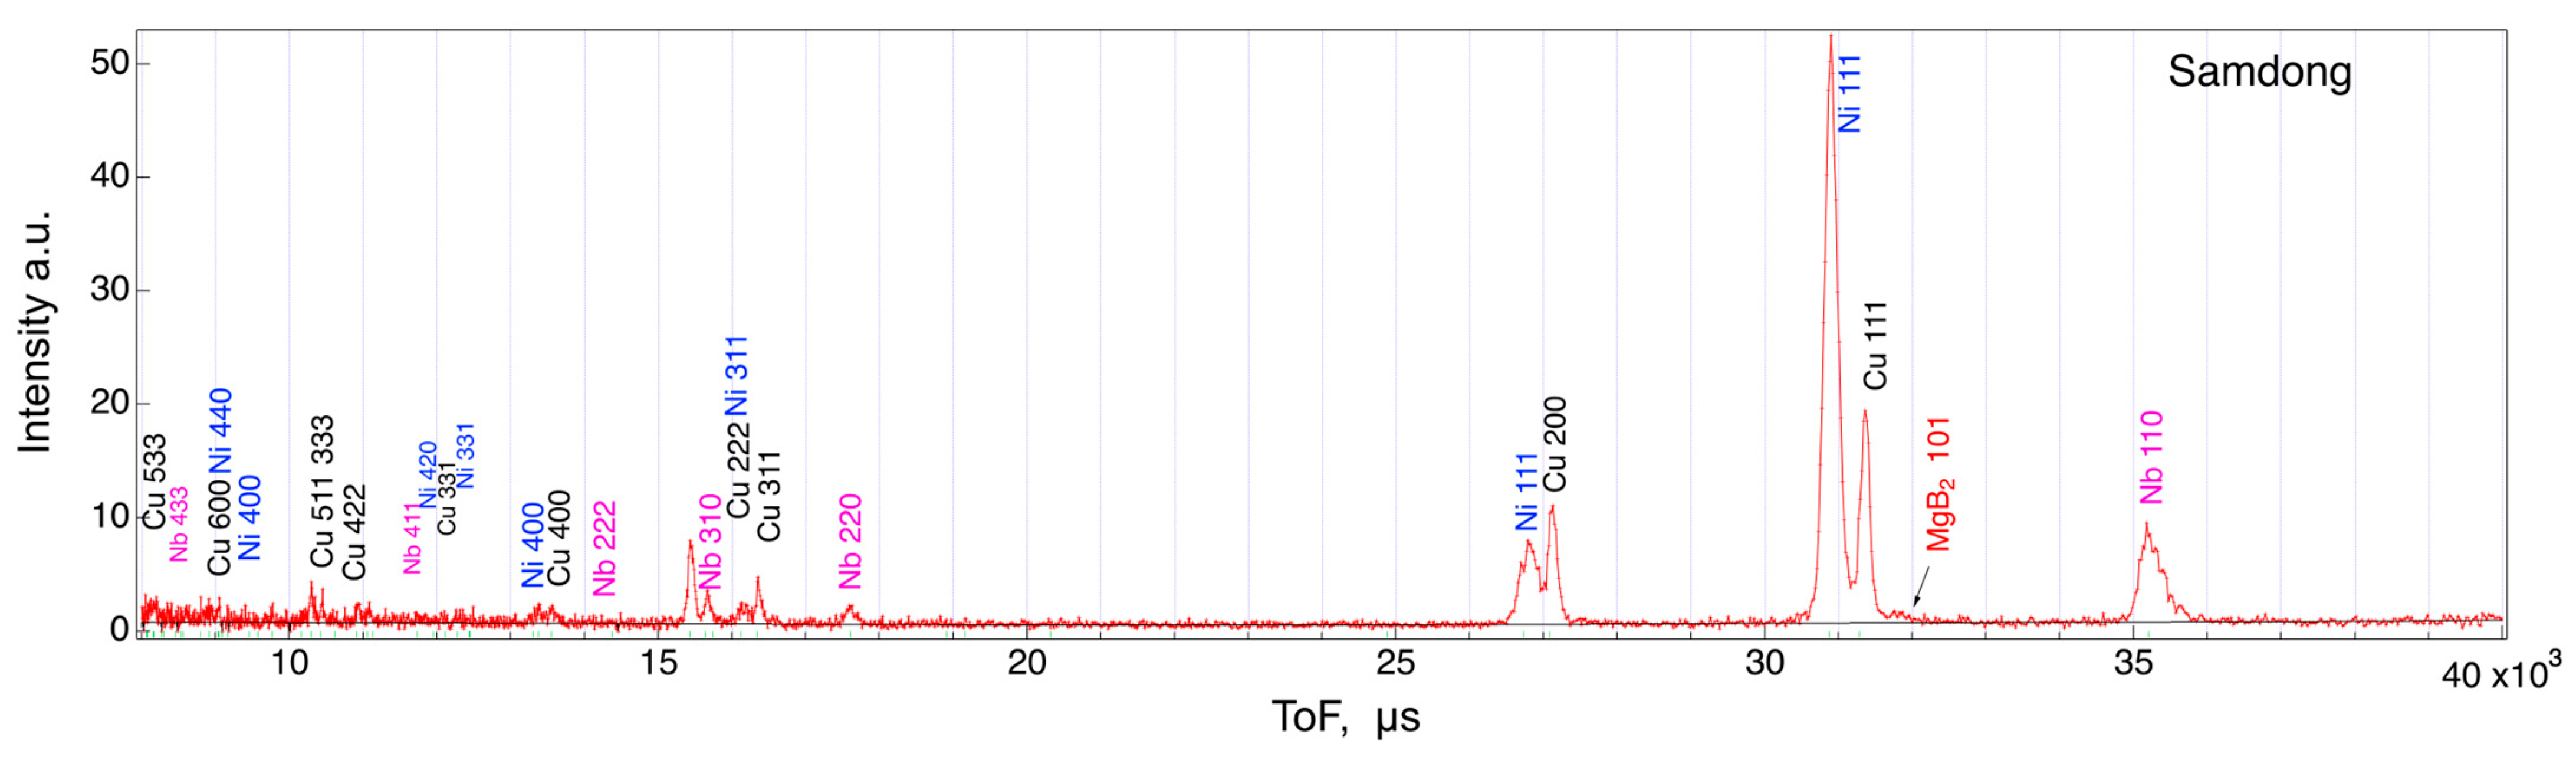
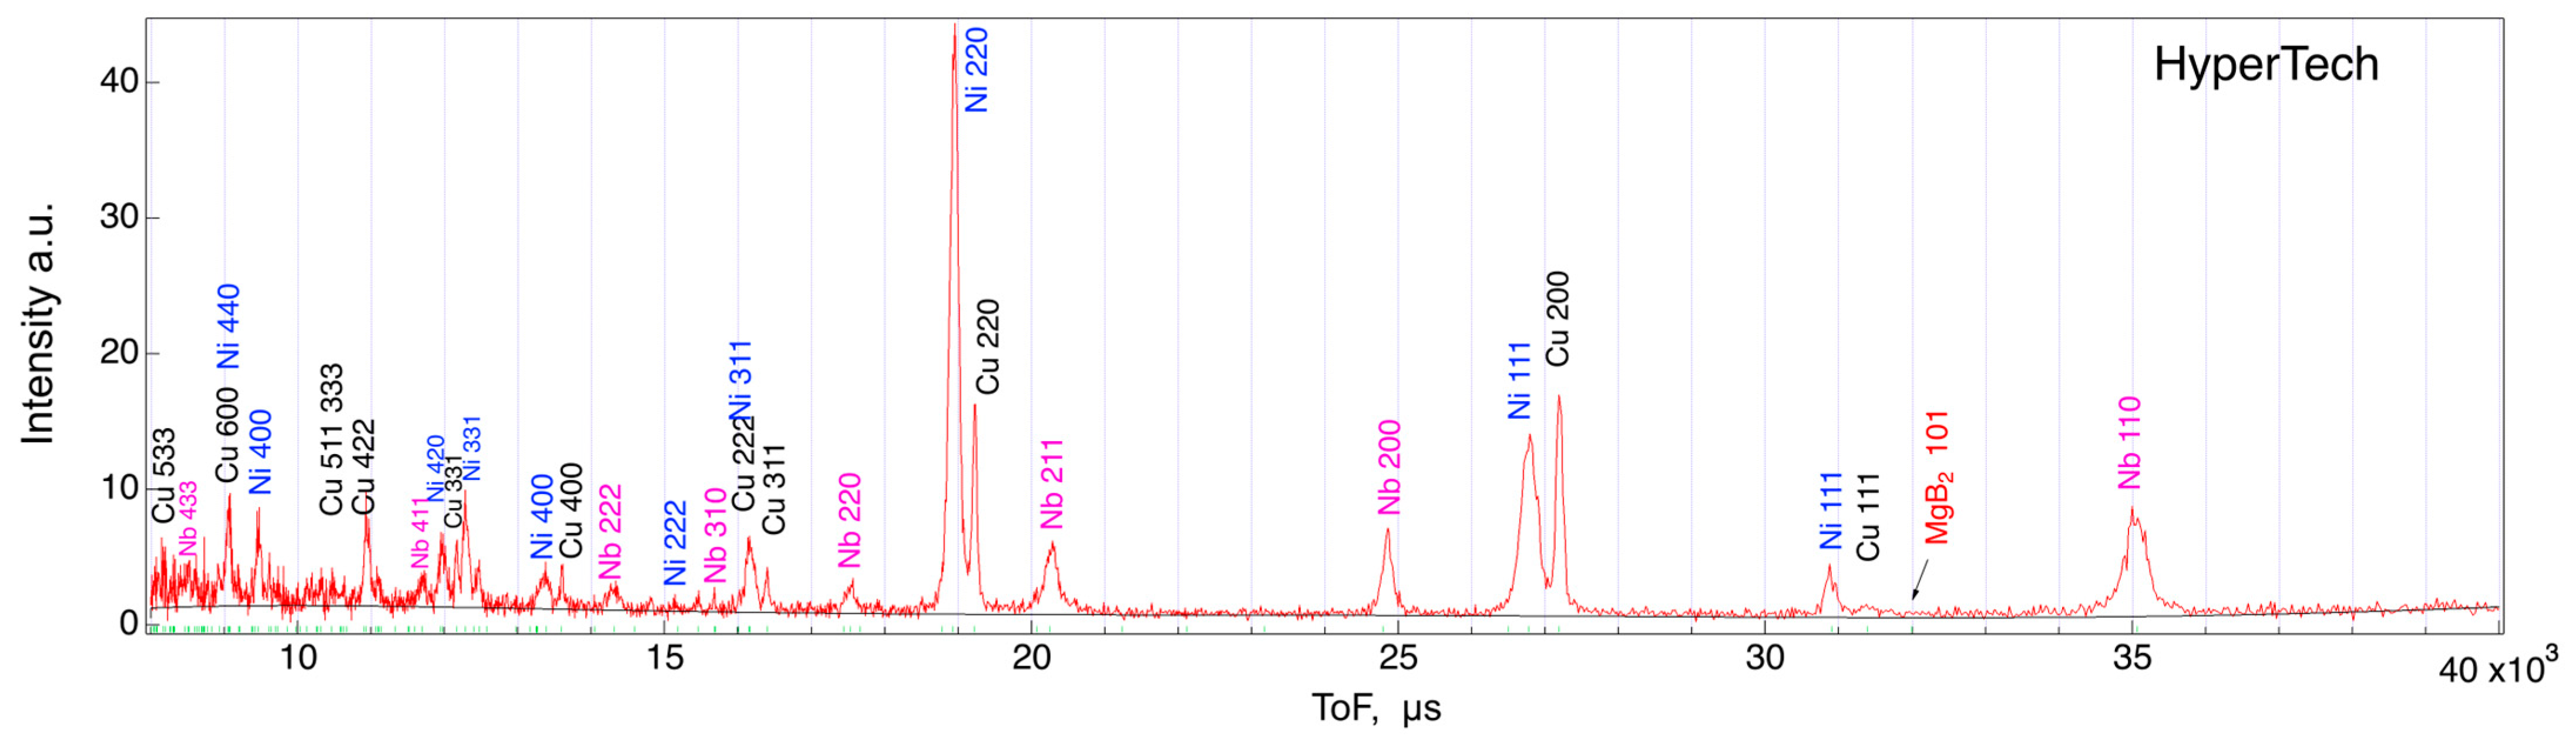
3.1. Diffraction Histogram by the ToF Method

Figure 10 illustrates the load history of the NIFS wire, subjected to load levels of 0 N, 8 N, 16 N, 24 N, 32 N, 45 N, 60 N, 80 N, 100 N, 120 N, and 168 N. Each step allowed for approximately 1 h of irradiation time. The horizontal axis represents elapsed time in seconds, while the vertical axis denotes the load in Newtons, as measured by the load cell. With increasing load, stress relaxation occurs due to plasticity. Careful manual load control was employed to prevent excessive load reduction. Some experiments had extended durations due to beam stoppage times. Stress–strain diagrams were derived from strain and load data collected via a double extensometer and load cell. The data, acquired using a horizontal-type tensile frame, display slight non-linearity compared to data from the dedicated vertical tensile frame. Nonetheless, the gradients are generally consistent with those presented in Figure 7. Figure 11 displays the results, with the horizontal axis representing strain in percentage obtained from extensometers, and the vertical axis representing load in Newtons from the load cell. This stress–strain diagram includes data from unloading, revealing a residual strain of approximately 0.05% from the maximum strain of 0.216%.
To generate histograms of Time-of-Flight (ToF) events, data from all North detector events in the 75° to 105° range were utilized. A 120 min test scan was conducted on any sample when the load was 0. The results for NIFS (11B-enriched sample), Samdong, and Hypertech are presented in Figure 12, Figure 13 and Figure 14, respectively. The vertical axis in these figures represents diffraction intensity, while the horizontal axis depicts ToF in microseconds, obtained from the axial lattice plane of the wire. This ToF value can be converted into common lattice spacing (in angstroms (Å)) by dividing it by approximately 15,000. The three-digit numbers in these figures denote the Miller indices of diffraction for each phase, determined through Rietveld analysis.
As shown in Figure 4, the wires are positioned at a 45° angle to the incident beam, resulting in North bank data that provide a histogram of lattice spacing (d) or ToF along the sample’s axis direction. The results for the NIFS wire exhibit peaks corresponding to the included MgB2, pure copper, and tantalum phases, with sufficient intensity for Rietveld analysis. For this analysis, we employed the Z-Rietveld software [22], capable of powder diffraction data analysis and Rietveld analysis, which was developed in Japan and includes instrument parameters specific to J-PARC. Rietveld analysis allows the determination of lattice constants for both refined ‘a’ and ‘c’ values, considering that MgB2 exhibits a hexagonal crystal structure.
In general, crystals exhibit elastic anisotropy, meaning that some orientations are more deformable than others under the same stress, and different crystal planes possess distinct elastic constants. While the lattice spacing of crystals elongates in the axial direction during tensile tests, the rate of change varies from one lattice plane to another. Rietveld analysis permits the refinement of an average lattice constant, closely aligning with the mechanical properties. Although similar calculations can be performed using single peaks, the method employing Rietveld analysis is more prevalent for ToF instruments, as it enhances accuracy.
A few MgB2 peaks were observed for the Samdong and Hypertech commercial wires in Figure 11 and Figure 12. These wires are thought to contain a natural ratio of boron isotopes and about 20% 10B, which has a large neutron absorption cross-section. As this experiment was carried out with a single wire, measures could be taken to increase the diffraction intensity by increasing the number of wires. However, assuming multi-twisted wires, such as superconducting wires, the diffraction intensity is likely to eventually decrease because of its own absorption problems. Materials with very large neutron absorption cross-sections, such as 10B, do not prevent diffraction per se, but absorb diffraction themselves, resulting in a significant reduction in diffraction intensity.

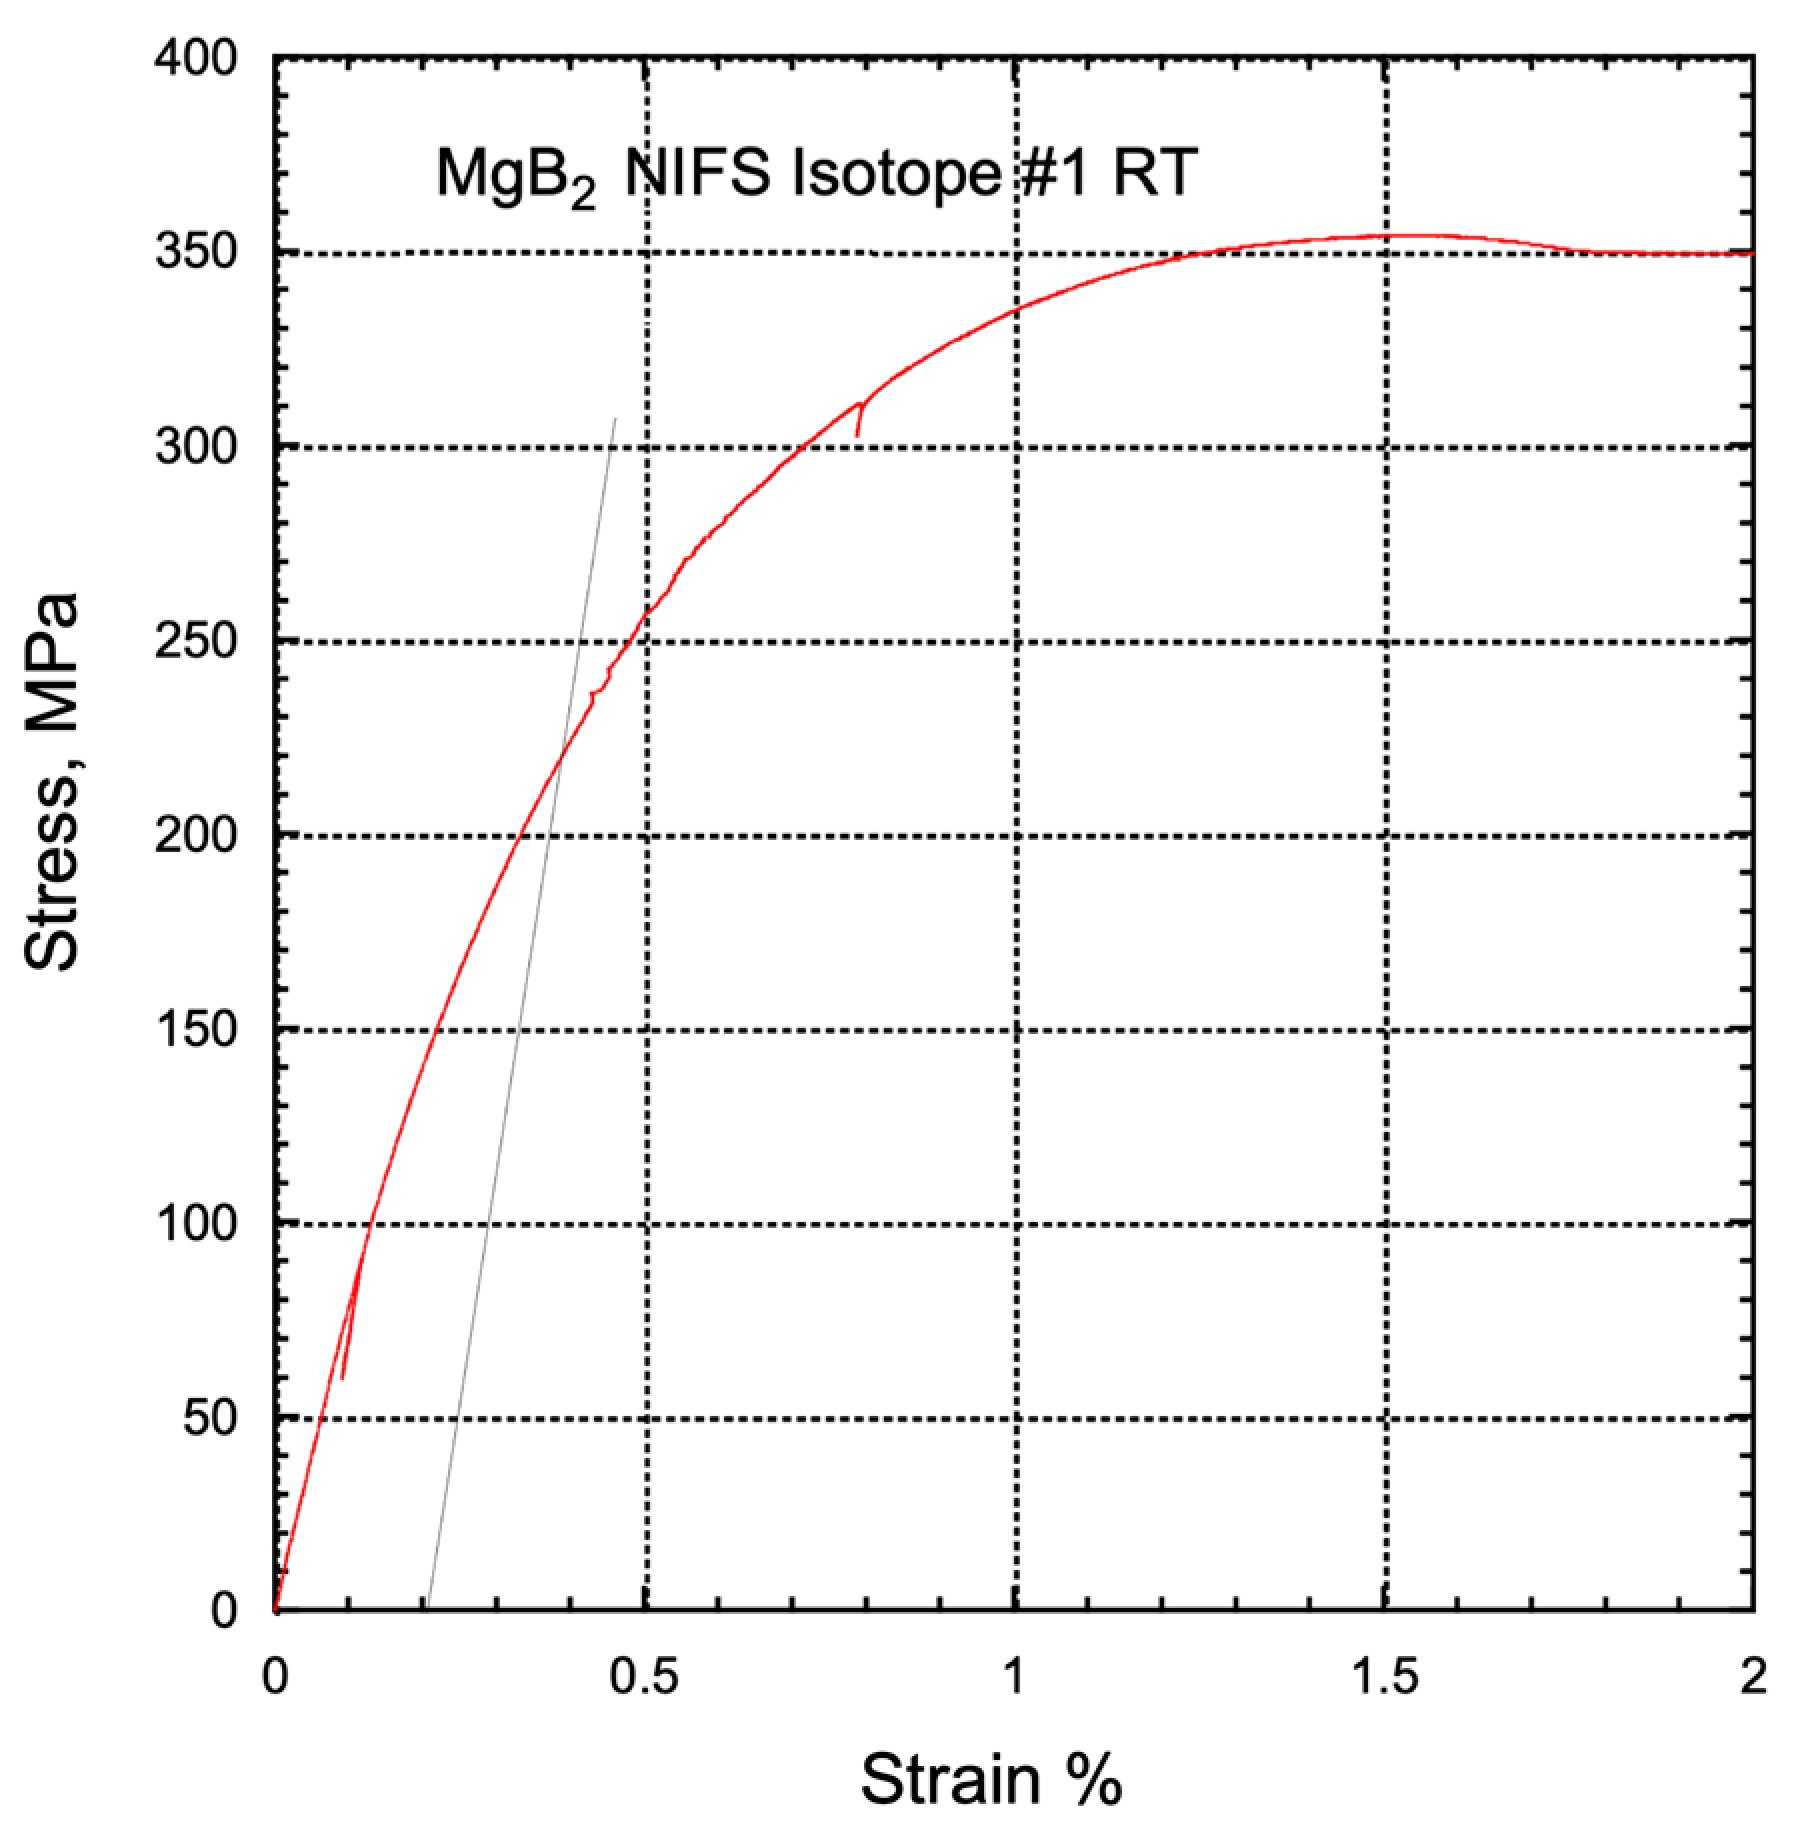
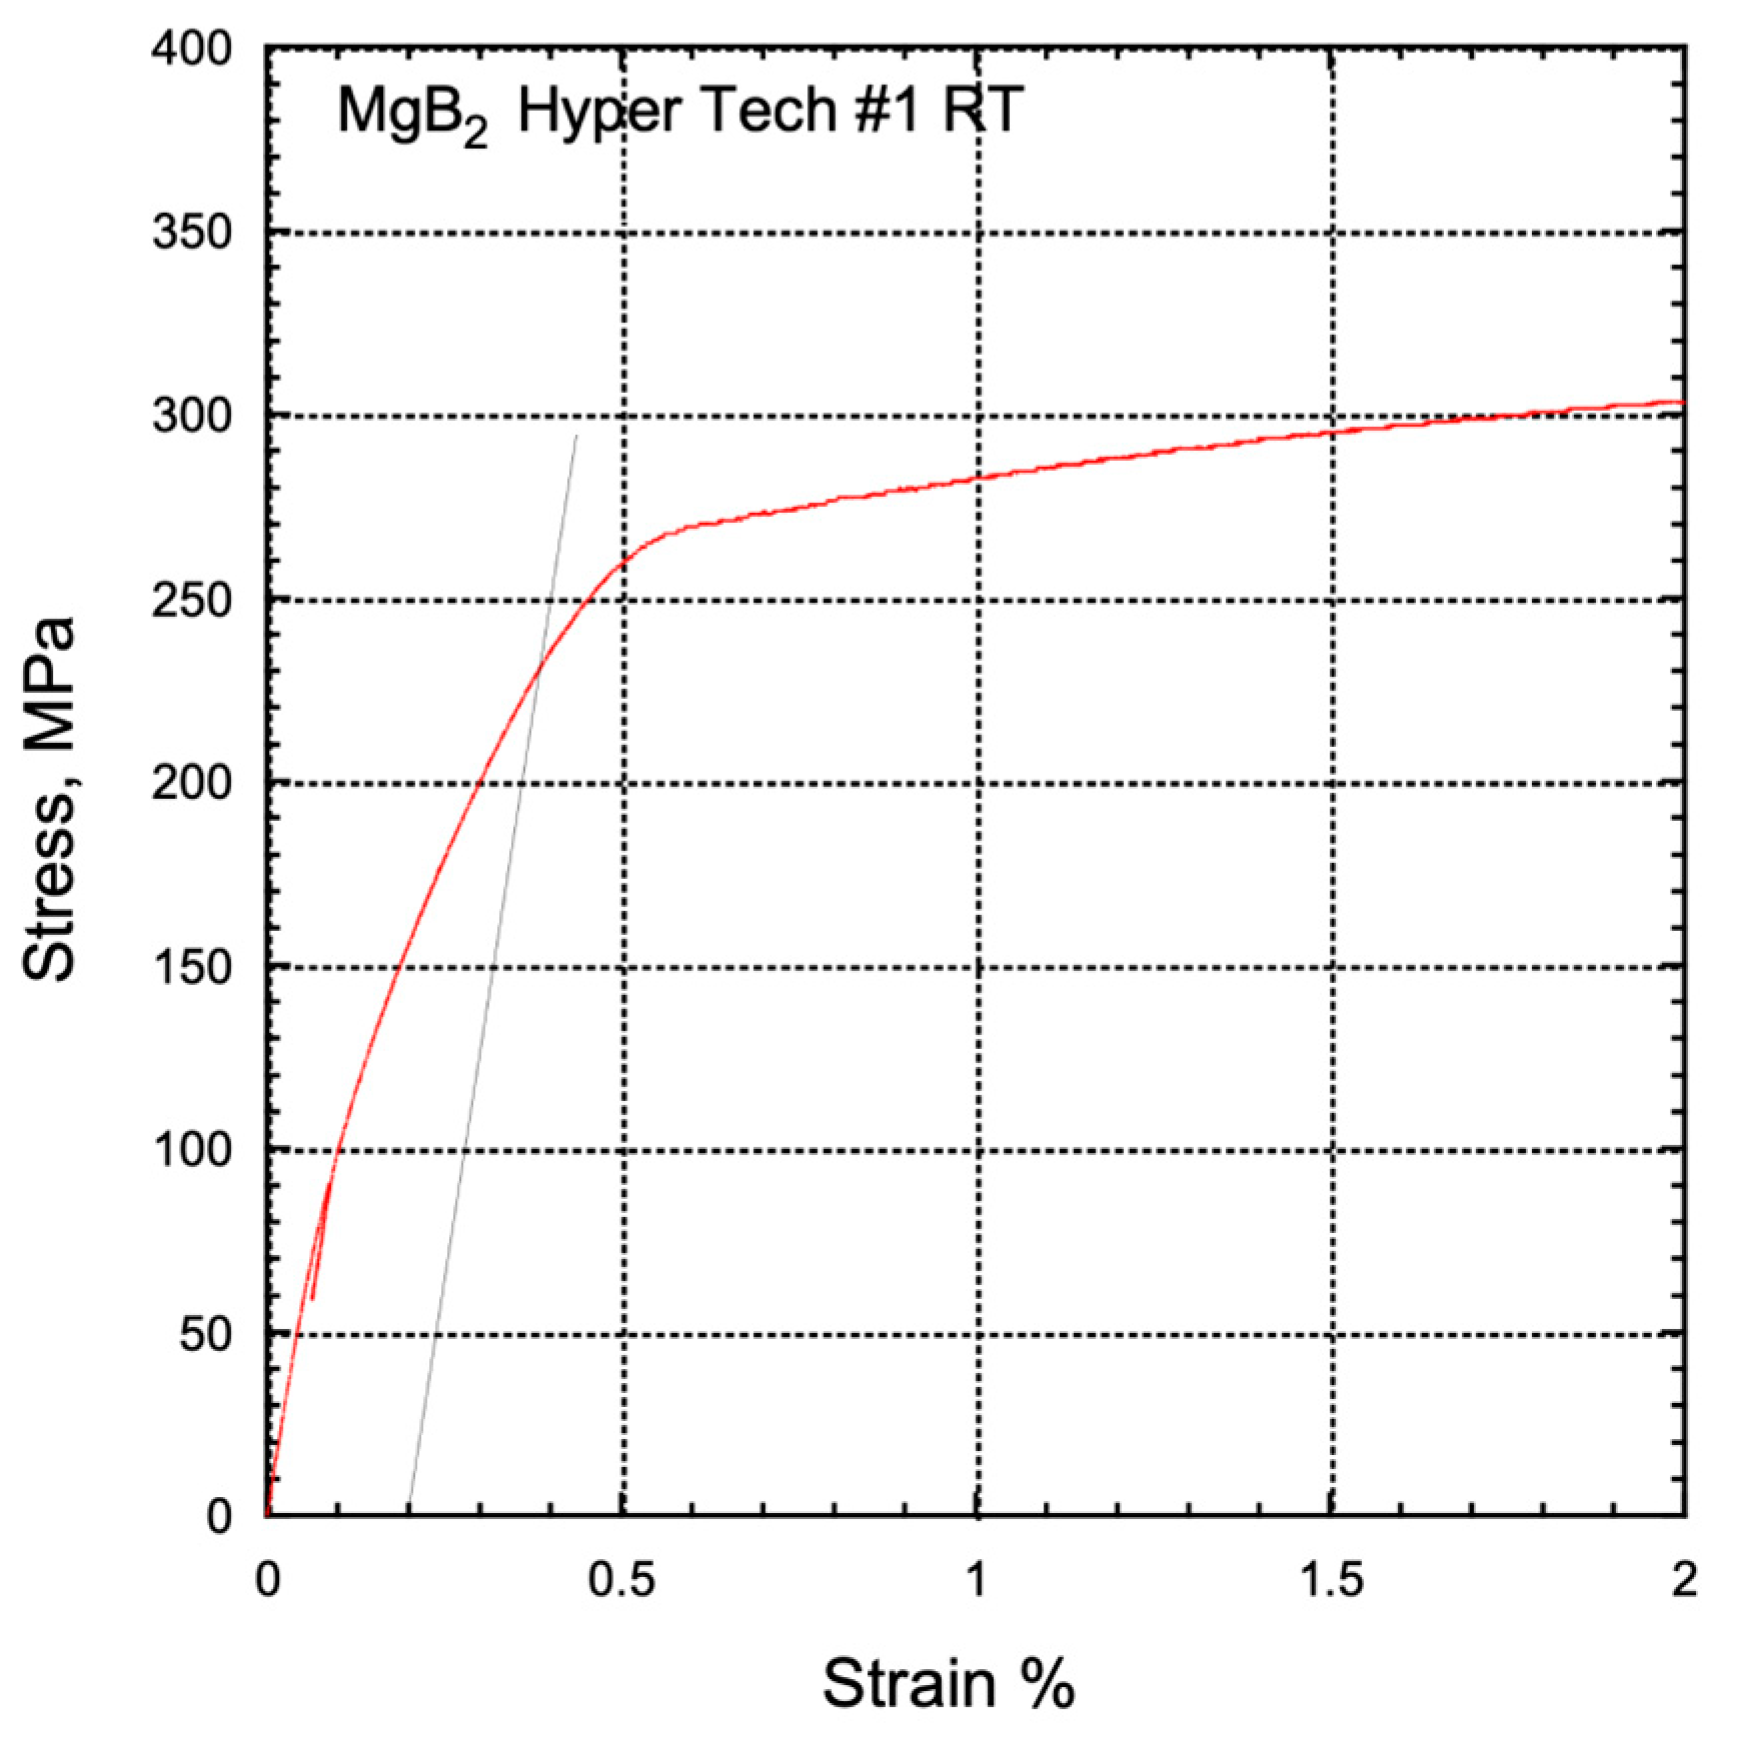
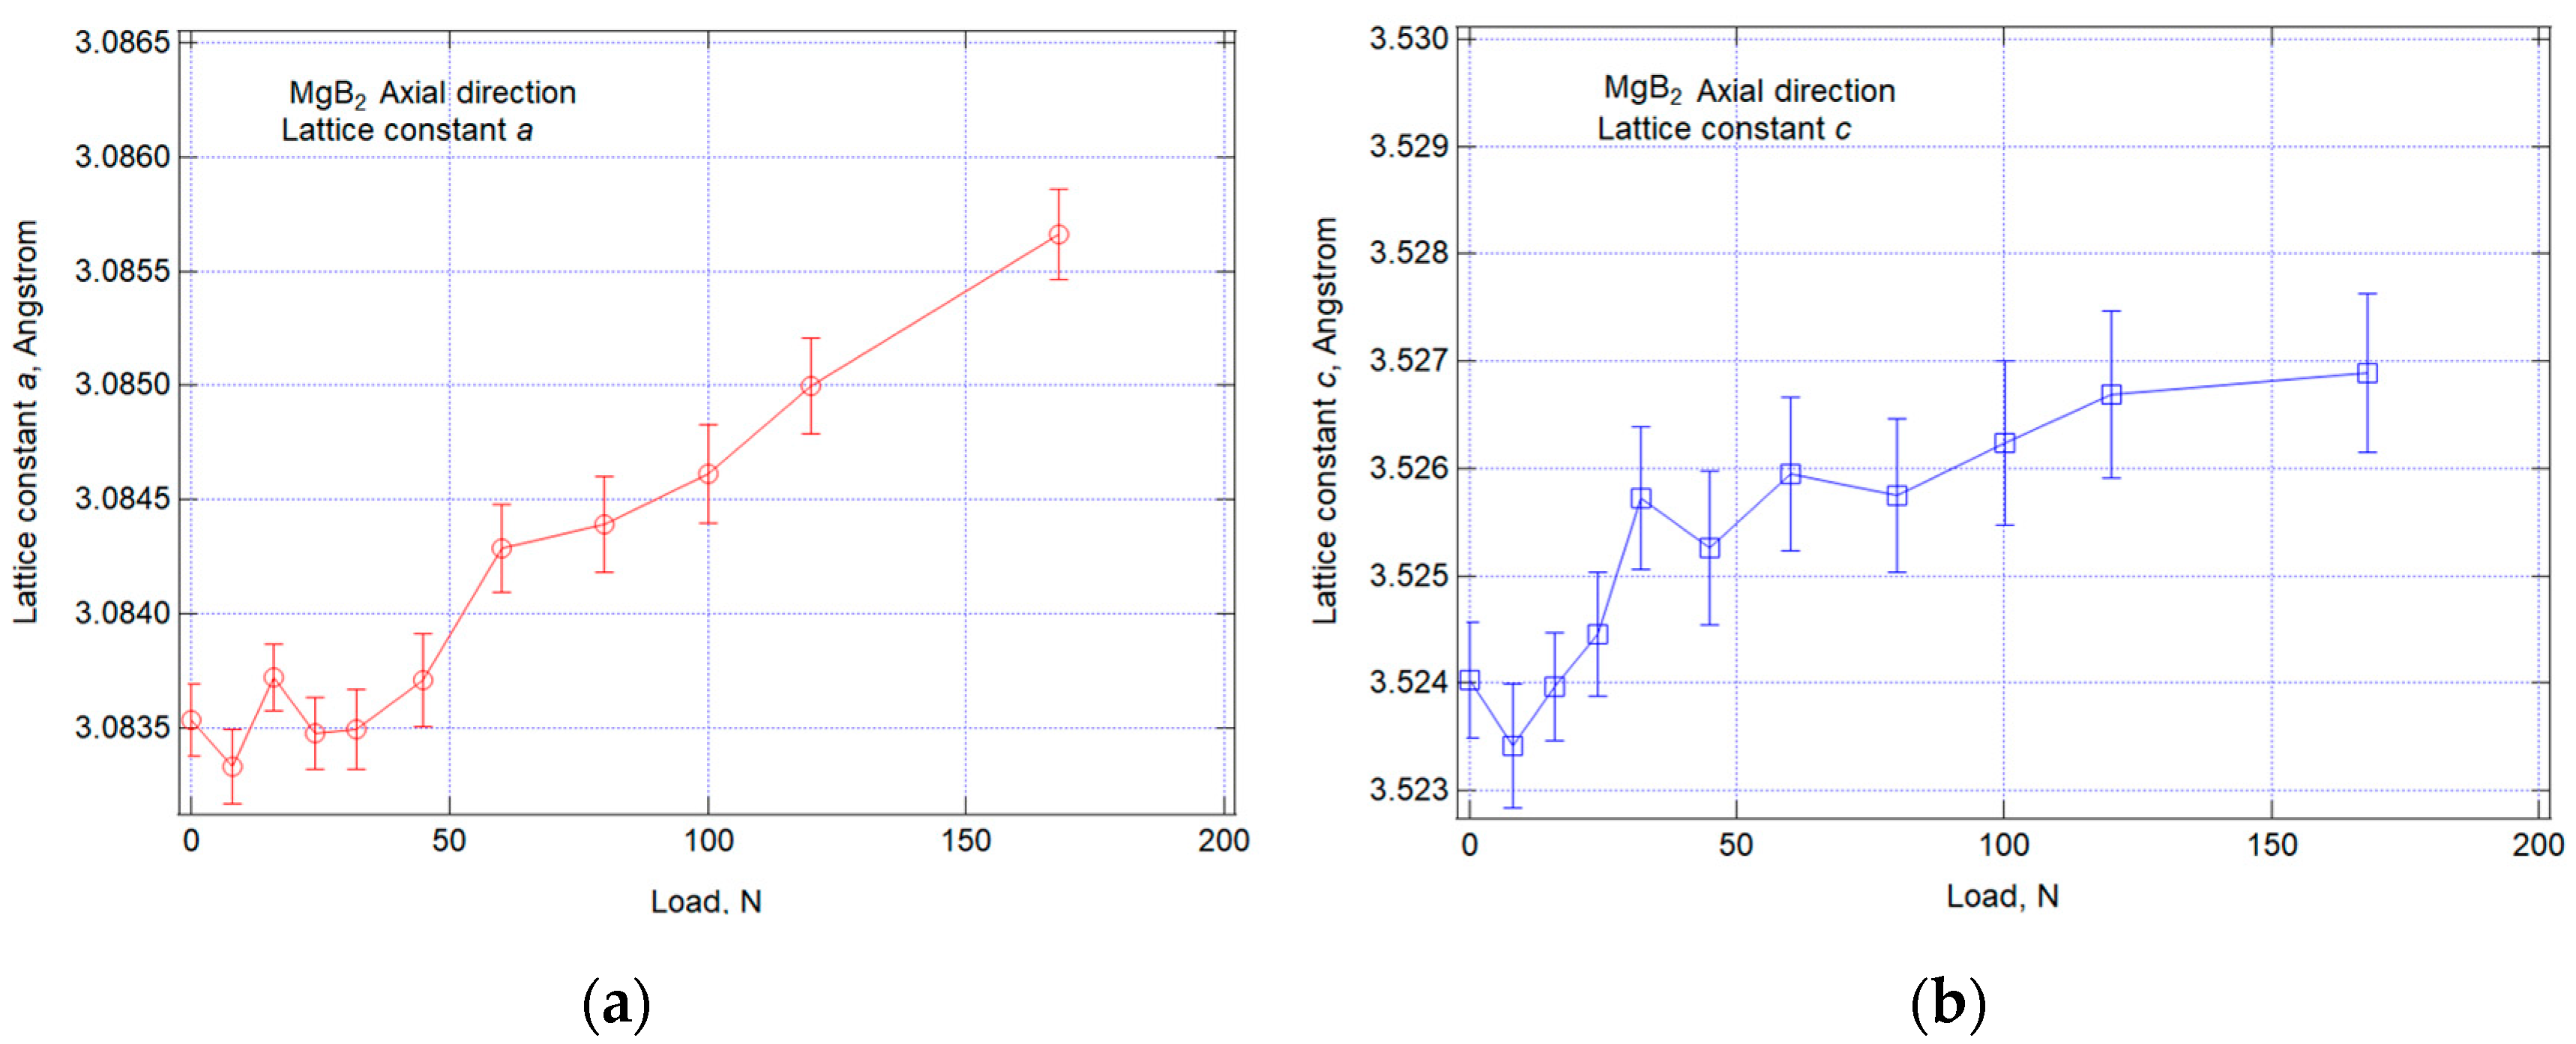
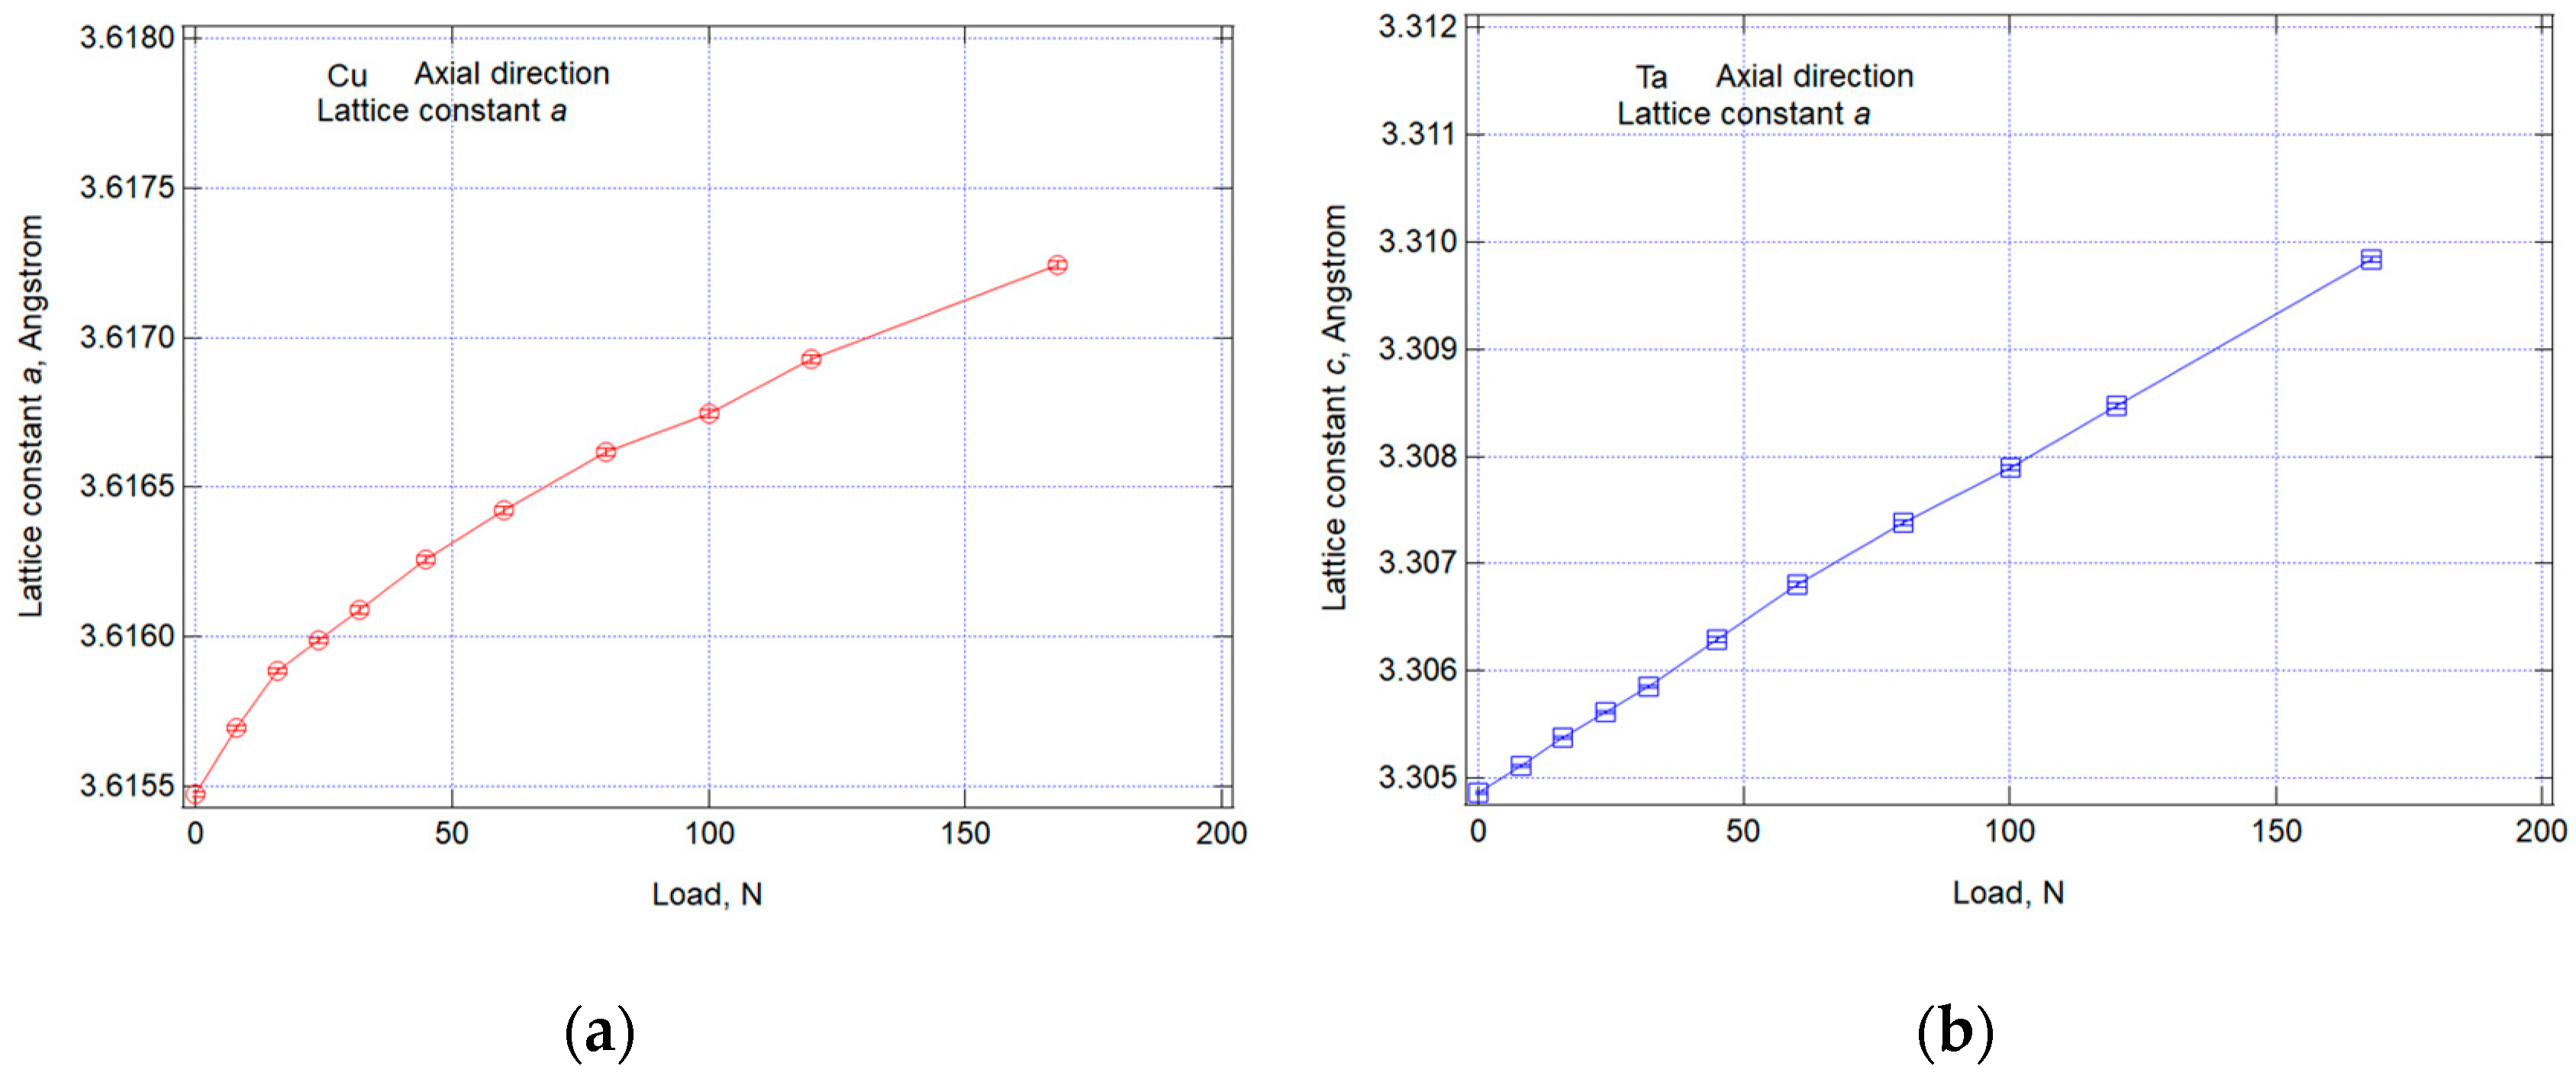
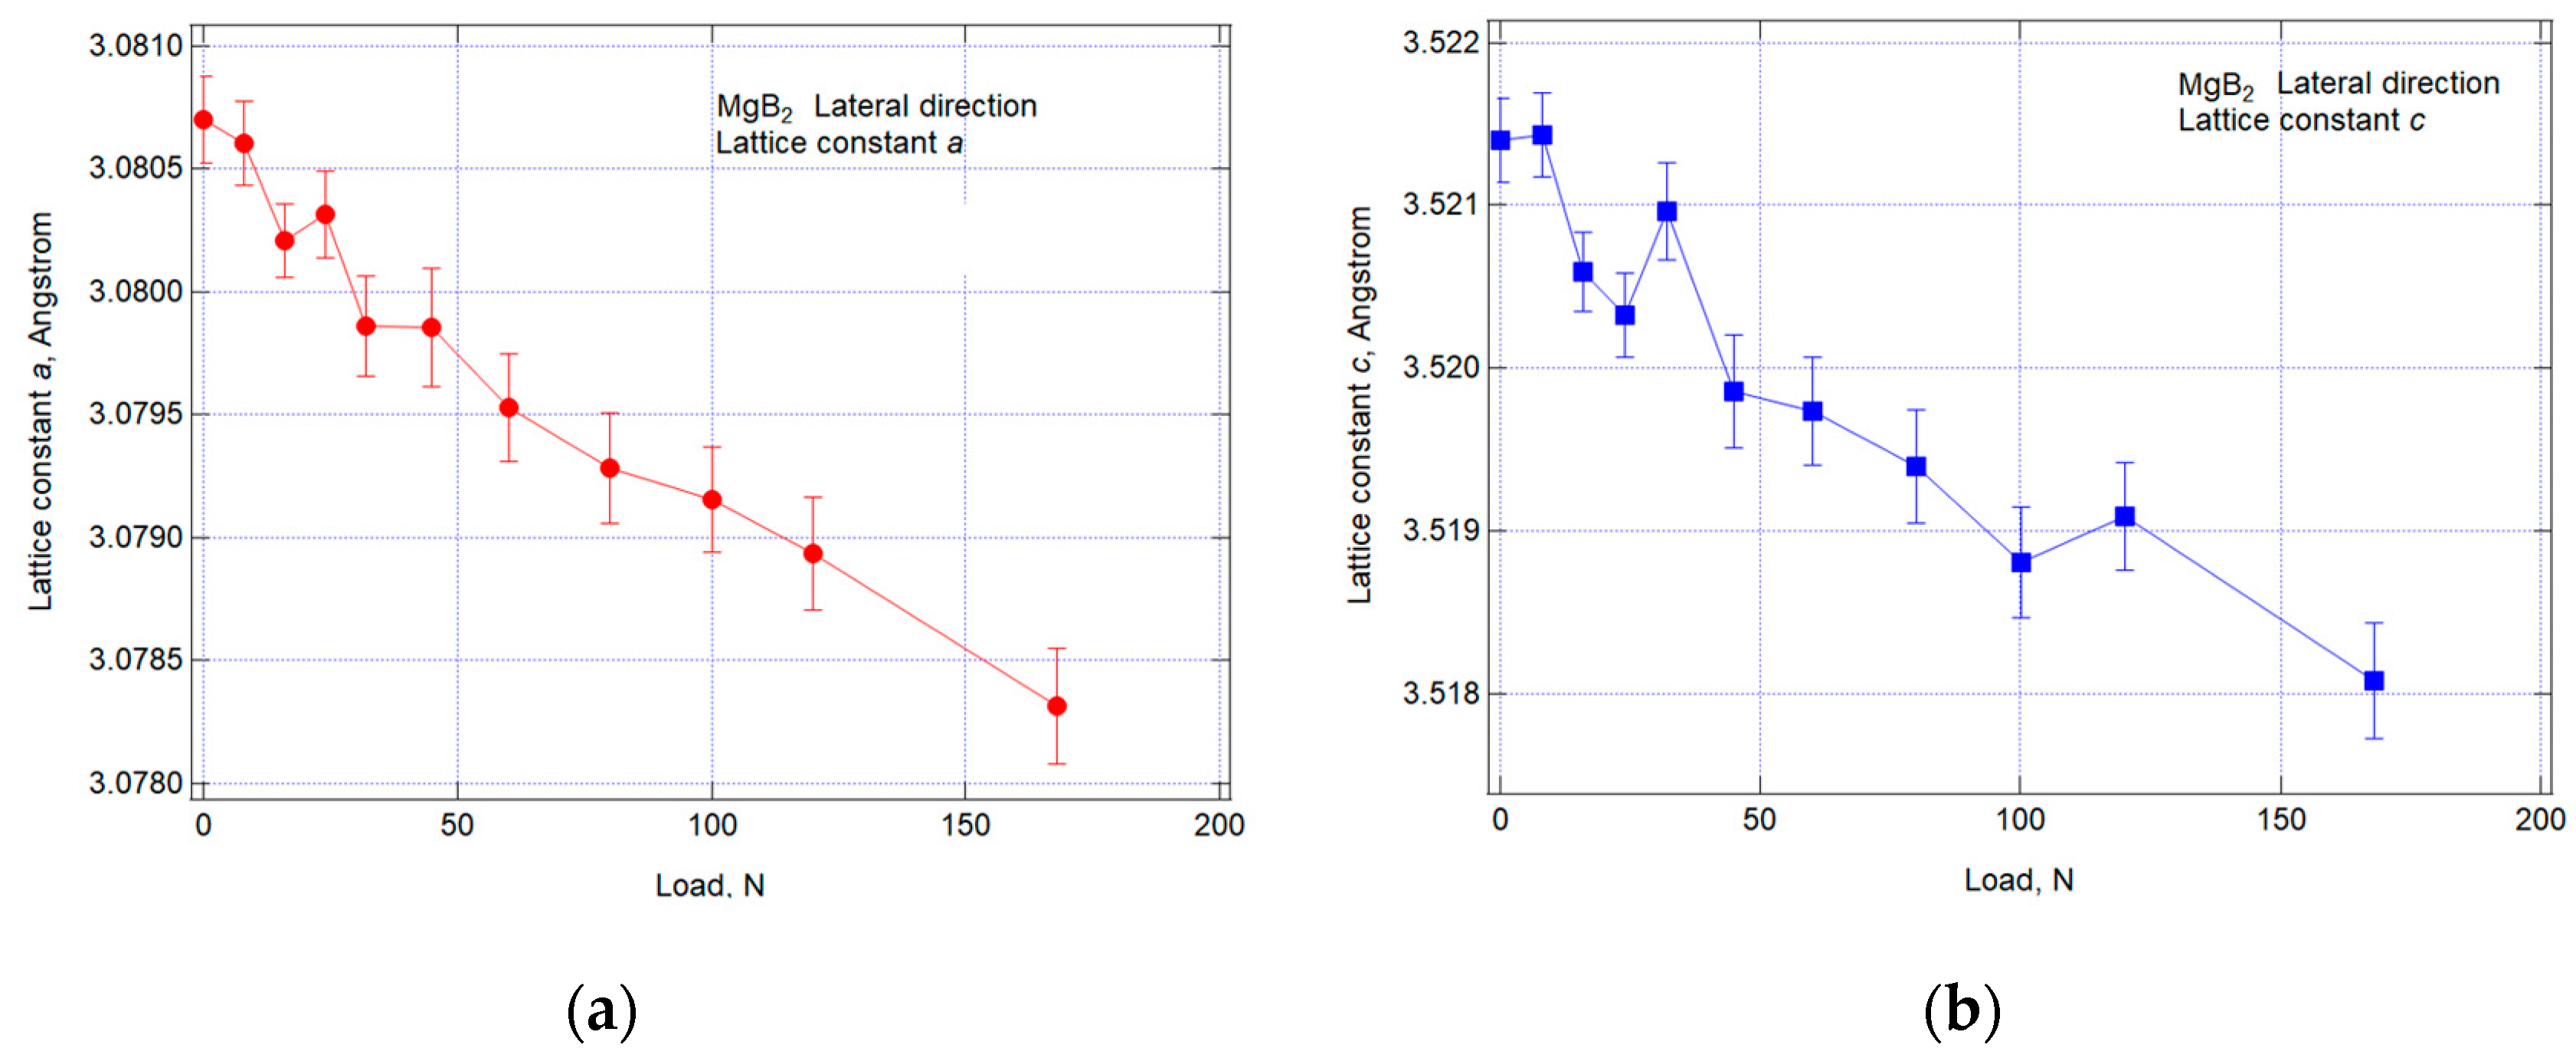
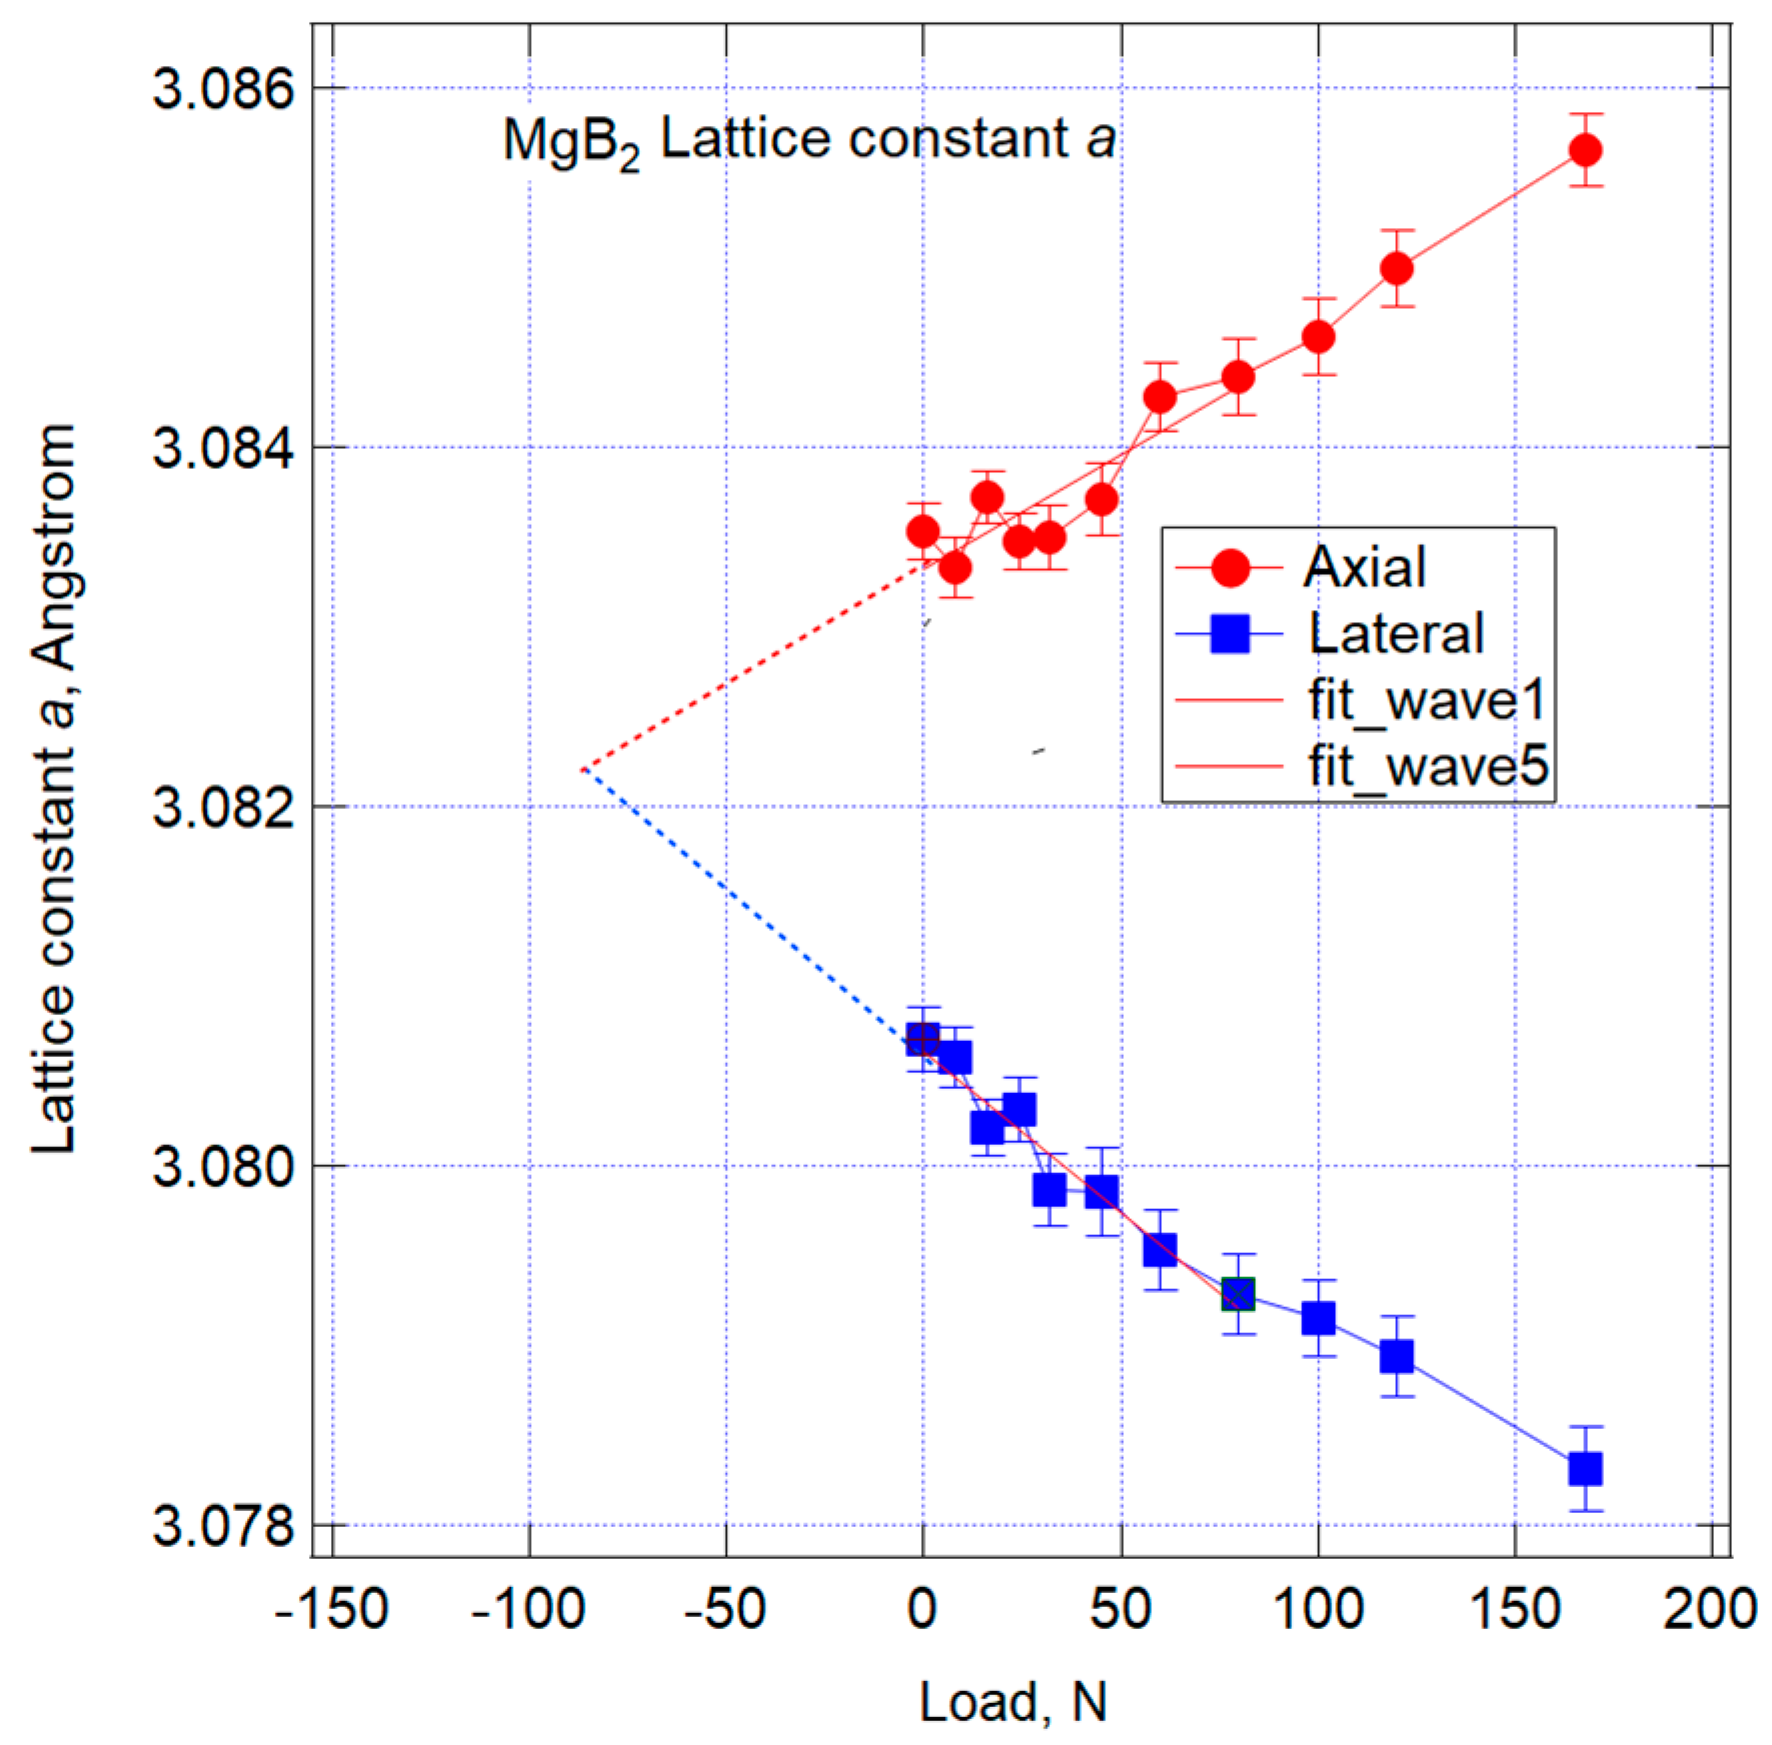
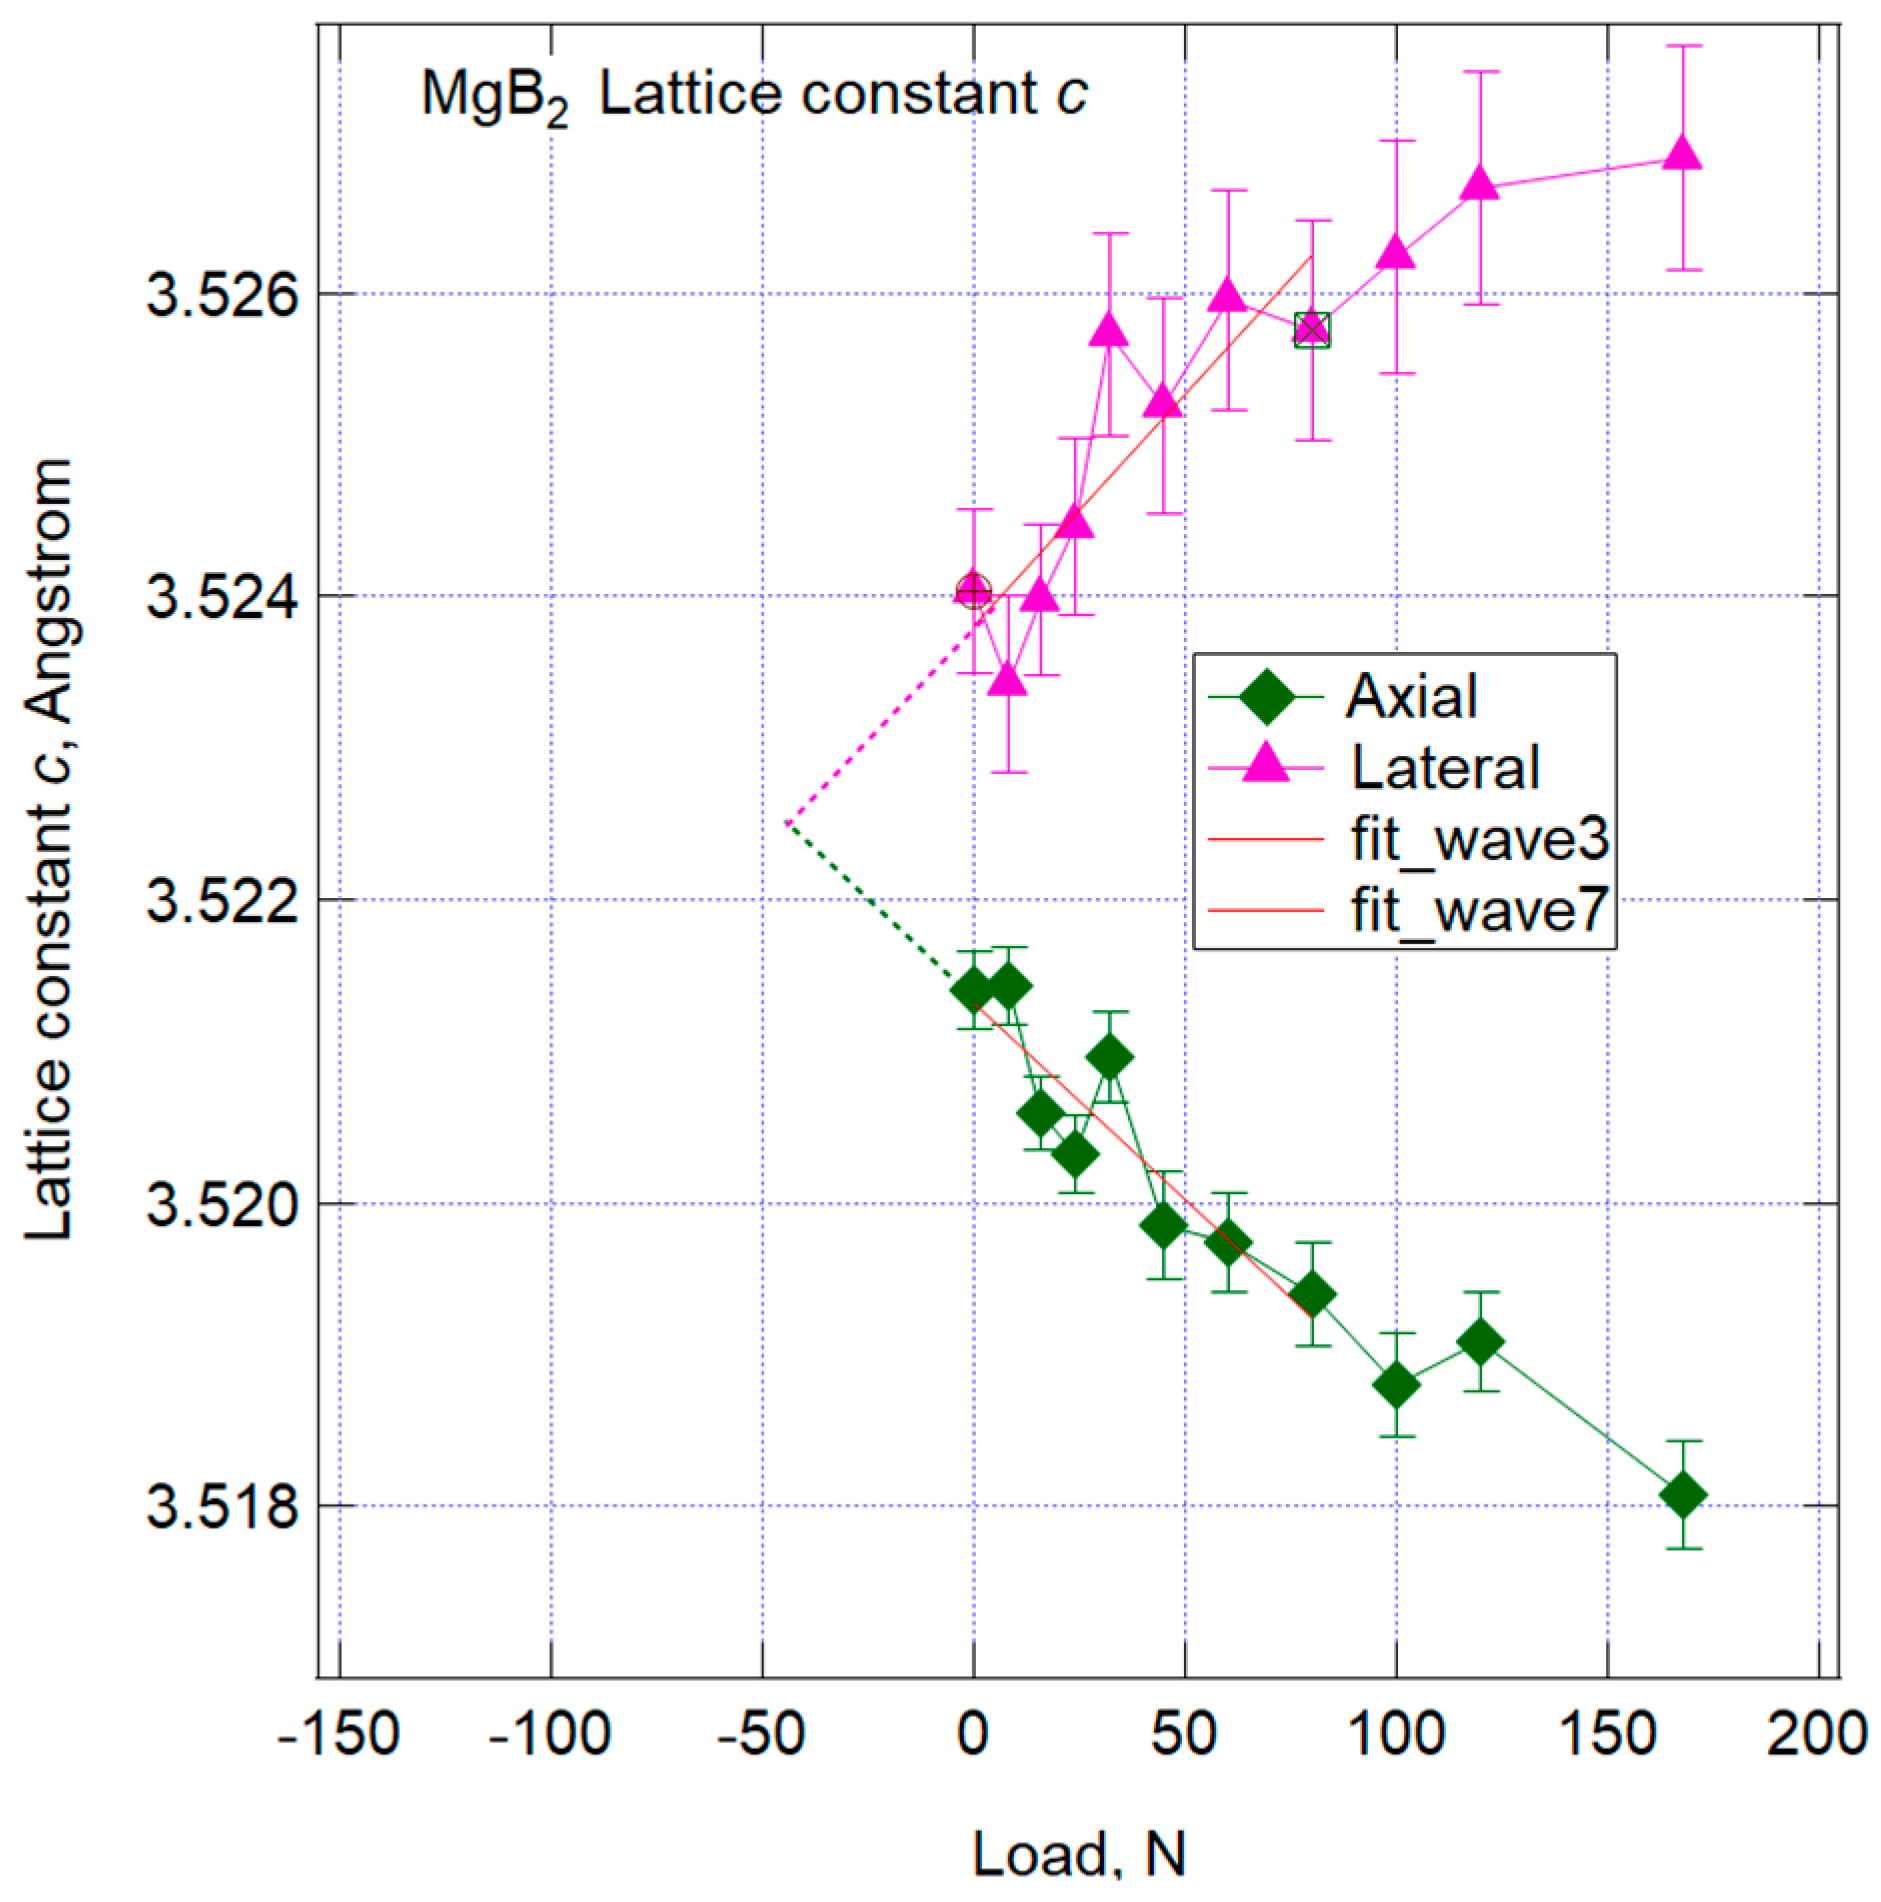
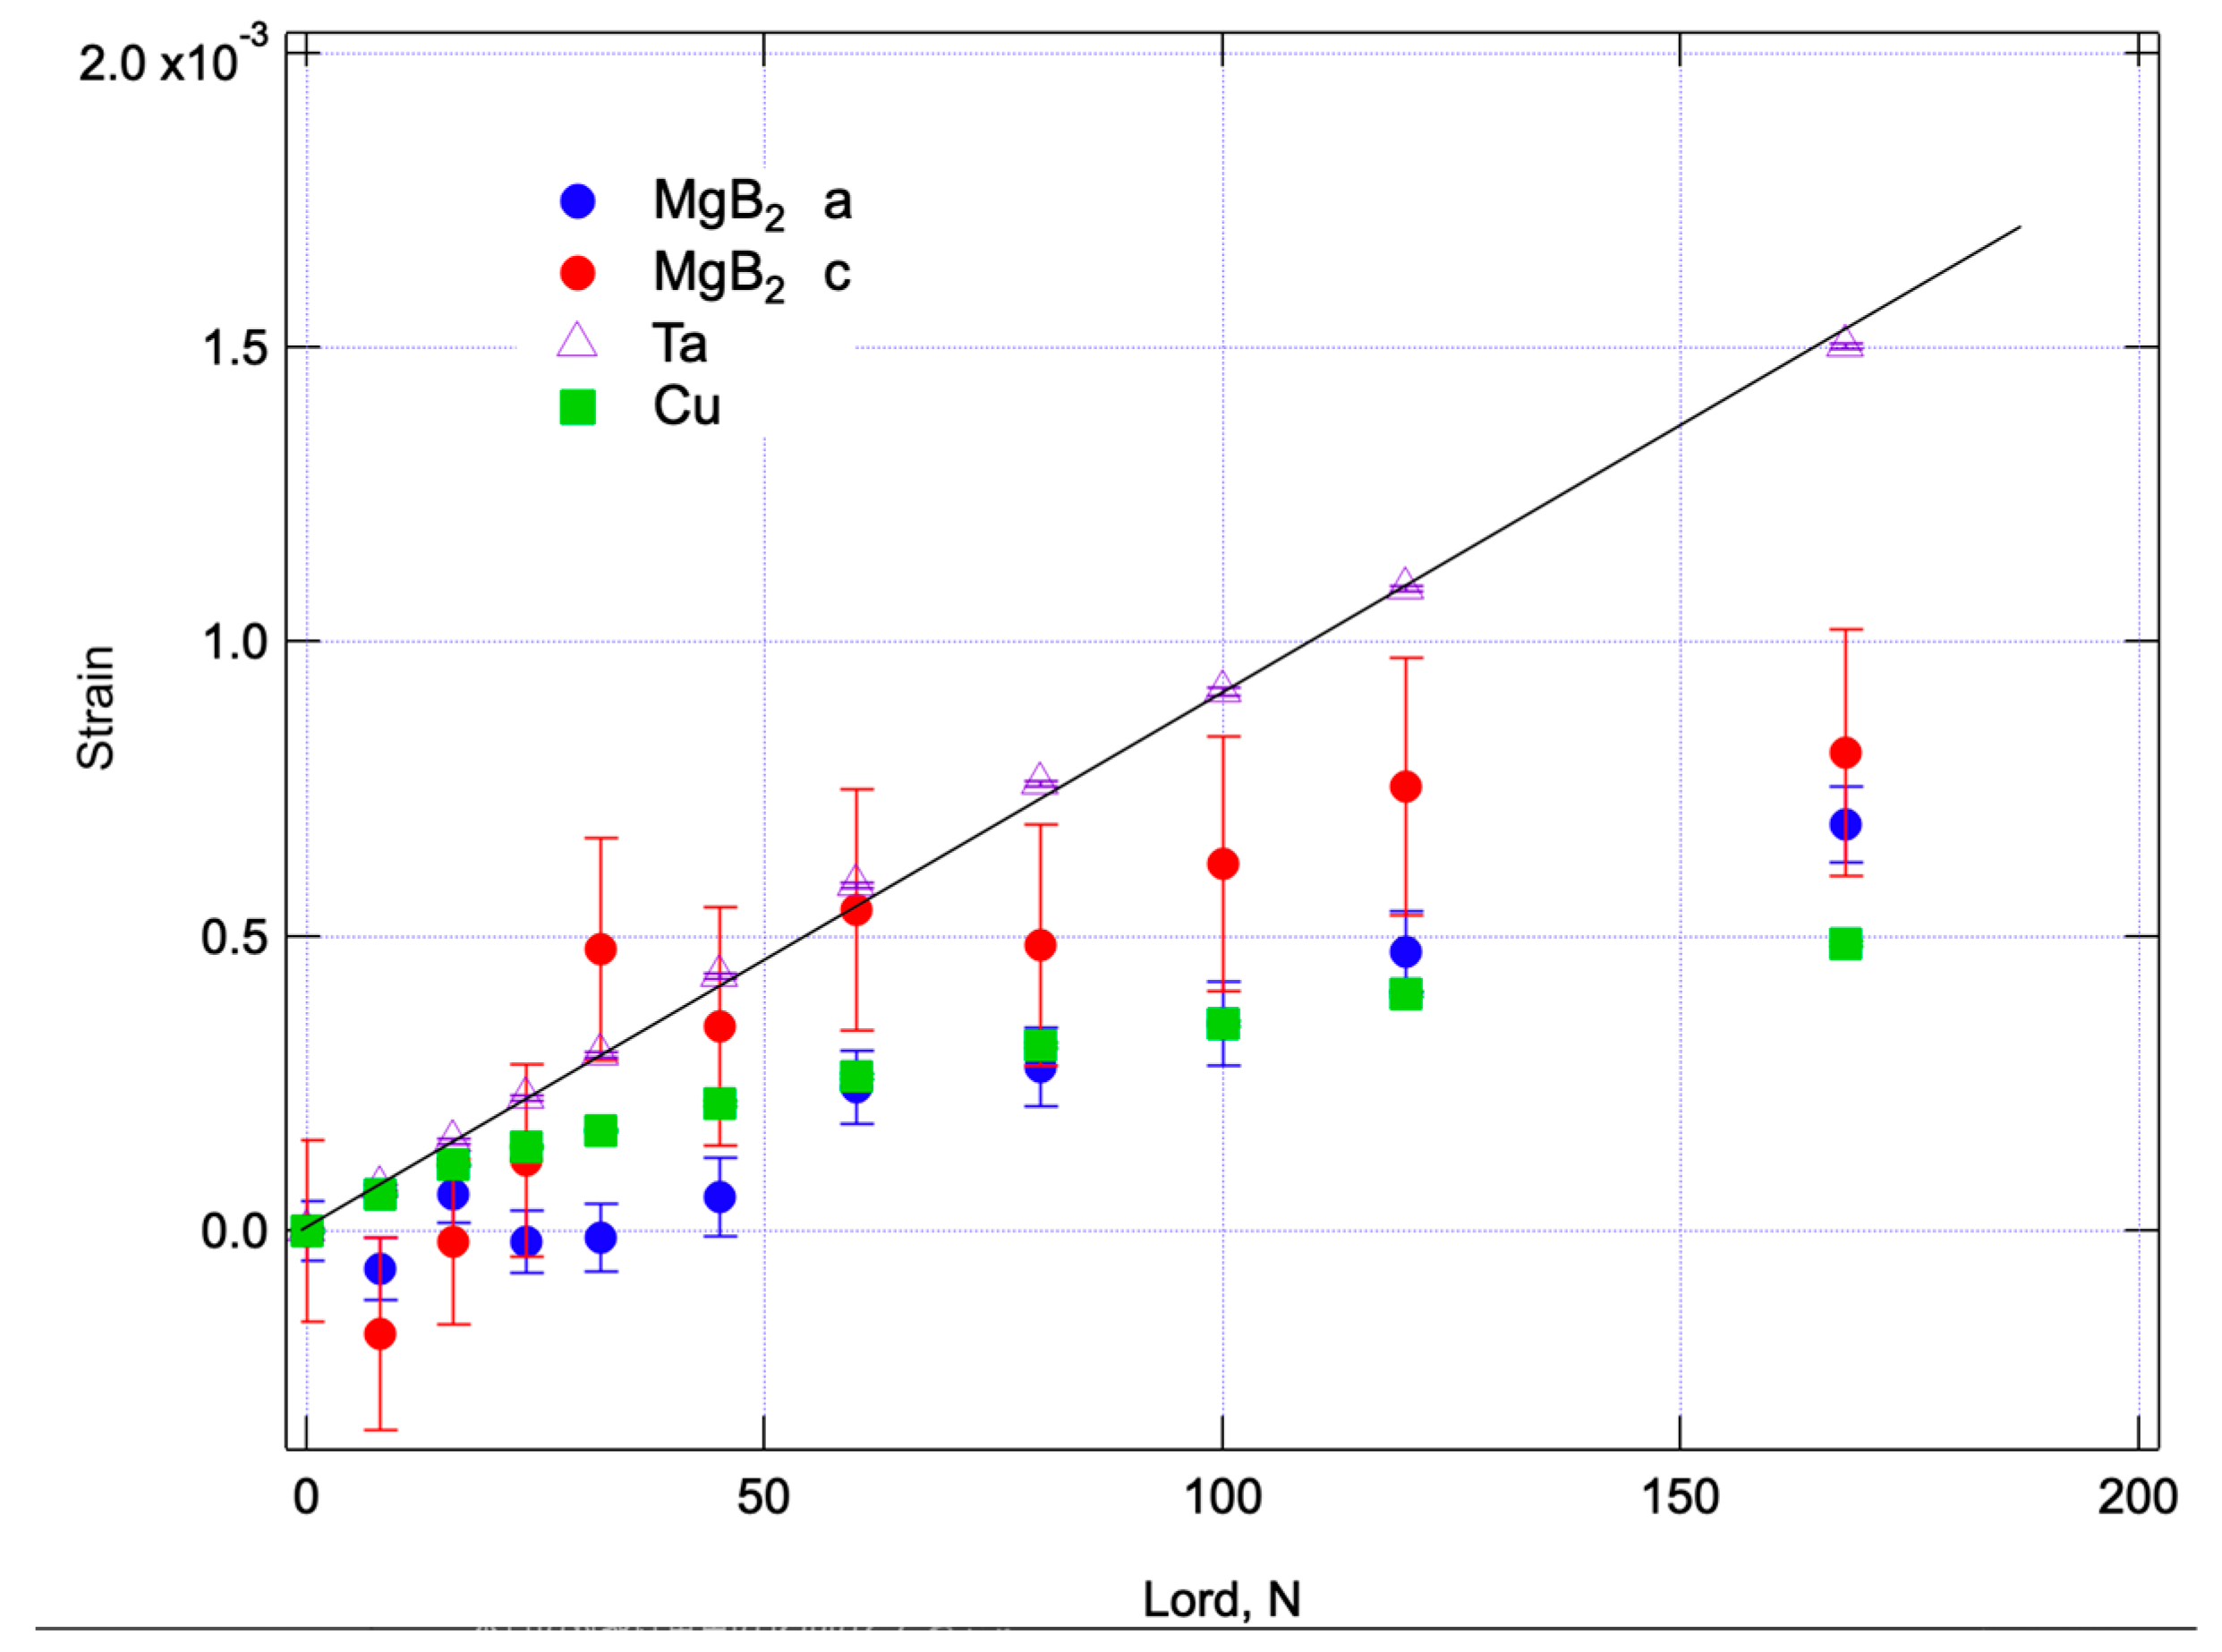
3.2. Strain Measurement under Tensile Loadings

Given that the crystal system of MgB2 is hexagonal, it is noteworthy that the lattice constants ‘a’ and ‘b’ are equivalent (a = c). However, the ‘c’ axis, representing the length of the hexagonal cross-section, remains an independent constant. Measurements were conducted at various load levels (0 N, 8 N, 16 N, 24 N, 32 N, 45 N, 60 N, 80 N, 100 N, 120 N, and 168 N), and the acquired data were subjected to Rietveld analysis for each load to derive the ‘a’ and ‘c’ values for MgB2.
As for the sheath materials, Ta and Cu, they exhibit cubic systems, and the lattice constant ‘a’ values were similarly determined for each load. Figure 15 depicts the relationship between the axial lattice constant of hexagonal MgB2 and the applied load. The horizontal axis in the figure represents the load in Newtons, obtained from the load cell, while the vertical axis displays the ‘a’ or ‘c’ axis length refined via Rietveld analysis in angstroms (Å). Each marker on the graph is accompanied by vertical lines representing error bars from the Rietveld analysis. It is worth noting that the error bars for the ‘c’ axis tend to be larger due to the relatively lower number of diffractions linked to ‘l’ across the numerous diffraction planes ‘h k l’ obtained.
From Figure 15a, we observe that the ‘a’ axis demonstrates a linear variation within the range from 80 N to 168 N. In contrast, Figure 15b reveals that the ‘c’ axis exhibits a linear change up to 32 N, after which the change becomes more gradual. This issue should be considered in conjunction with other strain-related factors after converting ‘d’ to lattice strain, a discussion which will be addressed in the subsequent section.
Figure 16 depicts the variations in the axial lattice constants of the sheath materials, tantalum (Ta) and copper (Cu). In this figure, the horizontal axis represents the load in Newtons, as measured by the load cell, while the vertical axis displays the axial lattice constant ‘a’ of cubic Cu or Ta, refined through Rietveld analysis, in angstroms (Å).
Figure 16a illustrates the results for Cu, where the curve maintains linearity up to the second data point, 16 N. Beyond this point, the curve exhibits typical plastic deformation. Cu is likely to have pre-existing tensile residual stresses due to its inherently low initial strength and CTE (coefficient of thermal expansion) mismatch, making it prone to yielding even under low stresses.
On the other hand, Ta, as shown in Figure 16b, boasts the highest strength among the constituent materials and exhibits a consistent linear behavior from the beginning to the end. This linear behavior of tantalum reaffirms that the loads and strains are acting upon the wire as expected.
Similarly, the changes in the lattice spacing in the lateral direction, obtained from the South detector, are summarized in Figure 17. Once again, the horizontal axis represents the load in Newtons, measured by the load cell, while the vertical axis displays the ‘a’ or ‘c’ axis length refined through Rietveld analysis in angstroms (Å). In this direction, the influence of Poisson’s ratio leads to a shrinkage deformation, causing the lattice spacing to decrease as the load increases. This behavior appears to follow a linear trend from 0 to approximately 80 N.
A summarized overview of the changes in axial and lateral lattice constants is presented in Figure 18 for lattice constant ‘a’ and Figure 19 for lattice constant ‘c’. In both of these figures, the horizontal axis represents the load in Newtons (N), as measured by the load cell, while the vertical axis displays the length of the ‘a’ or ‘c’ axis refined through Rietveld analysis, expressed in angstroms (Å).
During such tensile tests, it is common for Poisson’s ratio to be approximately 0.3, signifying that the lateral strain is about one-third of the axial strain. The slopes of the graphs in Figure 18 and Figure 19, corresponding to lattice constant ‘a’ and ‘c’, respectively, exhibit no significant difference in slope, although there are both positive and negative variations. This suggests that strain in the lateral direction is transmitted predominantly through compression, while strain in the tensile direction may experience relaxation through processes such as cracking, especially in the initial tensile phase.
It is important to take into account residual stresses. For this study, a filament d0 sample, which serves as the strain-free reference for residual strain or stress, was not prepared. This wire underwent heat treatment in the final stage of the manufacturing process, which likely resulted in residual strain or stress due to the effects of CTE (coefficient of thermal expansion) mismatch. While simplified, residual stresses can be estimated by comparing axial and lateral lattice constants. In the absence of residual strain, both lattice constants start from the same point, with axial values increasing and lateral values decreasing, leading to an increasing difference between them.
In both diagrams, lines of best-fit approximation derived from the initial eight loading points are displayed. In this case, both figures indicate that the axial lattice plane spacing is larger, and the lateral values are smaller when examining the 0 N points. This observation suggests that the MgB2 filament experiences residual tensile strain or stress at room temperature, albeit in a qualitative sense. By extending the previously mentioned straight line to the compression side, one can simply estimate the point where the lattice plane spacing coincides, representing minimal strain. The estimated loads for this point were approximately −85 N for the a-axis and −45 N for the c-axis.

4. Discussion

The Time-of-Flight (ToF) data were processed by applying conversion parameters to obtain the lattice spacing (d). Subsequently, we transformed these values into lattice strain for each crystal phase using Equation (2). When no load was applied (load = 0), the strain was set to d0. Figure 20 illustrates the correlation between the lattice strain results of each phase and the applied load using the ToF method of Takumi. The horizontal axis of this figure represents the load in Newtons obtained from the load cell, while the vertical axis represents the elastic strain of the crystal, expressed in dimensionless units, derived from the lattice constants of each phase (MgB2, Cu, and Ta). Each marker on the graph is accompanied by a vertical error bar, which represents the error from Rietveld analysis converted into strain. Notably, the results for Ta exhibited excellent linearity across all regions, allowing us to draw an approximate straight line using the least-squares method specifically for the Ta results. In the case of Ta, the diagram displays a consistently linear relationship between strain and load, with minimal error bars. The fact that such a strong linear relationship exists for a metallic element like tantalum indicates the accurate loading of the wire.
In strain measurements employing diffraction techniques, only elastic strain is ascertained, and plastic strain, as observed during yielding, remains undetected. Consequently, we observe that Cu begins to yield at approximately 16 N, and strain sharing increases with work hardening. The slope of Ta’s behavior is contrasted with that of MgB2, with the assumption that Ta’s slope equals the slope of linear elastic engineering strain. Given this assumption, it appears that all phases except Cu exhibit linear changes up to 60 N. While the ‘a’ axis of MgB2 generally displayed linear changes in the lattice constant data presented in Figure 15a, it is reasonable to infer that the lattice strain shows a decreasing gradient from 60 N when converted. A load of 60 N corresponds to a stress of 67 MPa on the stress–strain diagram in Figure 7, where the strain is approximately 0.09%. The disparity between the lattice parameters in Figure 18 and Figure 19 implies that the filaments in this wire may have already experienced tensile residual stress or strain, making them susceptible to failure at relatively low stress levels. Notably, the ‘c’ axis values of MgB2 at 168 N reveal distinct strain relaxation, suggesting that filament rupture may be occurring. Since diffraction only allows the observation of elastic strain, any cracking occurring at grain boundaries or within grains can be detected as such strain or stress relaxation.
We have conducted similar experiments with Nb3Sn [11], BSCCO [12], and REBCO [9,10,23] superconducting wires to determine the filament breakage strain. However, experiments with MgB2 have proven challenging, and this marks the first measurement of such strain experiments under load. If experiments involving tensile loading at low temperatures can be conducted, and strain-free standard d0 samples are obtained, we can gain insights into the residual strain at actual temperatures and the breakage strain of filaments. Since we have successfully conducted strain measurements at room temperature, future experiments at lower temperatures will be the focus of our research. The low-temperature tensile testing frame used in this study can be cooled down to approximately 10 K, and as cryogenic tensile frames are already available, we hope to employ the findings from this study to unravel the unresolved mystery of residual strain in MgB2 wire. Another significant objective of this research is to establish the relationship between tensile load, critical current, and actual strain on the filament at low temperatures. This will pave the way for guidelines on how to control residual strain through the optimization of sheath materials and the strengthening of the filaments themselves.

5. Conclusions

(1)
Neutron scattering experiments conducted on 11B-enriched MgB2 wire have successfully yielded abundant diffraction peaks specific to MgB2. The subsequent Rietveld analysis of each phase enabled the fine-tuning of lattice constants, incorporating nearly all available peaks. The ratio of the change in lattice constant to the load in the axial and lateral directions was close, indicating that the axial strain may be relaxing.
(2)
This groundbreaking analysis has unveiled previously unreported variations in the load and strain experienced by MgB2 wires subjected to tensile stress at room temperature. The discrepancy in lattice constants between the axial and lateral directions strongly implies the presence of tensile residual stress or strain at room temperature.
(3)
The proportionate change in lattice constant relative to the applied load in both axial and lateral directions exhibits remarkable similarity, suggesting the potential relaxation of axial strain.
(4)
Notably, in experiments involving two commercially available, conventional MgB2 wire types, neutron scattering experiments were conducted for a duration of 7200 s. However, no discernible MgB2 peaks suitable for analysis were obtained. This observation strongly indicates the formidable challenge of achieving MgB2 diffraction in neutron scattering experiments when dealing with boron-containing natural isotopes with their inherent ratios.

Author Contributions

Conceptualization, S.M., K.O. and Y.H.; formal analysis, S.M. S.H. H.T and T.K.; data curation, S.M. H.T and T.K.; writing—original draft preparation, S.M.; writing—review and editing, S.M., K.O. and Y.H. All authors have read and agreed to the published version of the manuscript.

Funding

This study was performed with the support and under the auspices of the NIFS Collaboration Re-search program (NIFS18KECF023, NIFS21KECF031).

Data Availability Statement

The data presented in this study are available on request from the corresponding author.

Acknowledgments

The neutron experiment at BL19 Takumi of the Materials and Life Science Experimental Facility of the J-PARC was performed under user program 2019A0178.

Conflicts of Interest

The authors declare no conflict of interest.

References

  1. Nagamatsu, J.; Nakagawa, N.; Muranaka, T.; Zenitani, Y.; Akimitsu, J. Superconductivity at 39 K in magnesium diboride. Nature 2001, 410, 63–64. [Google Scholar] [CrossRef] [PubMed]
  2. Ballarino, A.; Flükiger, R. Status of MgB2 wire and cable applications in Europe. J. Phys. Conf. Ser. 2017, 871, 012098. [Google Scholar] [CrossRef]
  3. Marino, I.; Pujana, A.; Sarmiento, G.; Sanz, S.; Merino, J.M.; Tropeano, M.; Sun, J.; Canosa, T. Lightweight MgB2 superconducting 10 MW wind generator. Supercond. Sci. Technol. 2016, 29, 024005. [Google Scholar] [CrossRef]
  4. Tanaka, H.; Suzuki, T.; Kodama, M.; Koga, T.; Watanabe, H.; Yamamoto, A.; Michizono, S. Performance of MgB2 superconductor developed for high-efficiency klystron applications. IEEE Trans. Appl. Supercond. 2020, 29, 6200105. [Google Scholar] [CrossRef]
  5. Choi, Y.; Park, D.; Li, Y.; Tanaka, H.; Lee, E.; Bascuñán, J.; Iwasa, Y. Persistent-mode operation and magnetization behavior of a solid nitrogen-cooled MgB2 small-scale test coil towards a tabletop 1.5-T osteoporosis MRI. Supercond. Sci. Technol. 2020, 33, 1018. [Google Scholar] [CrossRef]
  6. Sykes, A.; Costley, A.E.; Windsor, C.G.; Asunta, O.; Brittles, G.; Buxton, P.; Chuyanov, V.; Connor, J.W.; Gryaznevich, M.P.; Huang, B.; et al. Compact fusion energy based on the spherical tokamak. Nucl. Fusion 2018, 58, 016039. [Google Scholar] [CrossRef]
  7. Leslie, M.; Ito, T.; Aizawa, K.; Arima, H. Start-Ups Seek to Accelerate Path to Nuclear Fusion. Engineering 2021, 8, 6–8. [Google Scholar] [CrossRef]
  8. Ekin, W.J. Chapter “Strain Effects in Superconducting Compounds”. In Advances in Cryogenic Engineering Materials; Plenum Press: New York, NY, USA, 1984; Volume 30. [Google Scholar]
  9. Osamura, K.; Machiya, S.; Tsuchiya, Y.; Suzuki, H. Internal Strain and Mechanical Properties at Low Temperatures of Surround Cu Stabilized YBCO coated conductor. IEEE Trans. Appl. Supercond. 2010, 20, 1532–1536. [Google Scholar] [CrossRef]
  10. Osamura, K.; Machiya, S.; Tsuchiya, Y.; Suzuki, H. Force free strain exerted on a YBCO layer at 77 K in surround Cu stabilized YBCO coated conductors. Supercond. Sci. Technol. 2010, 23, 045020–045026. [Google Scholar] [CrossRef]
  11. Oguro, H.; Awaji, S.; Nishijima, G.; Takahashi, K.; Watanabe, K.; Machiya, S.; Suzuki, H.; Tsuchiya, Y.; Osamura, K. Residual strain measurement using neutron diffraction for practical Nb3Sn wires under a tensile load. Supercond. Sci. Technol. 2010, 23, 025034. [Google Scholar] [CrossRef]
  12. Osamura, K.; Machiya, S.; Ochiai, S.; Osabe, G.; Yamazaki, K.; Fujikami, J. High strength/high strain tolerance DI-BSCCO tapes by means of pre-tensioned lamination technique. IEEE Trans. Appl. Supercond. 2013, 23, 6400504. [Google Scholar] [CrossRef]
  13. Hishinuma, Y.; Kikuchi, A.; Shimada, Y.; Kashiwai, T.; Hata, S.; Yamada, S.; Muroga, T.; Sagara, A. Development of MgB2 superconducting wire for the low activation superconducting magnet system operated around core D-T plasma. Fusion Eng. Des. 2015, 98–99, 1076–1080. [Google Scholar] [CrossRef]
  14. Hishinuma, Y.; Shimada, Y.; Hata, S.; Tanaka, T.; Kikuchi, A. Superconducting Properties and Microstructure of In-situ Cu Addition Low Activation MgB2 Multifilamentary Wires Using Different Boron-11 Isotope Powders. Teion Kogaku 2022, 57, 32–38. (In Japanese) [Google Scholar]
  15. Cheng, F.; Liu, Y.; Ma, Z.; Li, H.; Shahriar, M.; Hossain, A. Superior critical current density obtained in Mg11B2 low activation superconductor by using reactive amorphous 11B and optimizing sintering temperature. J. Alloys Compd. 2015, 650, 508–513. [Google Scholar] [CrossRef]
  16. Mooring, F.P.; Monahan, J.E.; Huddleston, C.M. Neutron cross sections of the boron isotopes for energies between 10 and 500 keV. Nucl. Phys. 1966, 82, 16–32. [Google Scholar] [CrossRef]
  17. Harjo, S.; Ito, T.; Aizawa, K.; Arima, H. Current Status of Engineering Materials Diffractometer at J-PARC. Mater. Sci. Forum 2013, 681, 443–448. [Google Scholar] [CrossRef]
  18. Kikuchi, A.; Yoshida, Y.; Iijima, Y.; Banno, N.; Takeuchi, T.; Inoue, K. The synthesis of MgB2 superconductor using Mg2Cu as a starting material. Supercond. Sci. Technol. 2004, 17, 781–785. [Google Scholar] [CrossRef]
  19. Jin, X.; Nakamoto, T.; Harjo, S.; Hemmi, T.; Umeno, T.; Ogitsu, T.; Yamamoto, A.; Sugano, M.; Aizawa, K.; Abe, J.; et al. Development of a cryogenic load frame for the neutron diffractometer at Takumi in Japan Proton Accelerator Research Complex. Rev. Sci. Instrum. 2013, 84, 063106. [Google Scholar] [CrossRef]
  20. Nyilas, A. Strain sensing systems tailored for tensile measurement of fragile wires. Supercond. Sci. Technol. 2005, 18, S409. [Google Scholar] [CrossRef]
  21. IEC 61788-19: 2013; Mechanical properties measurement-Room temperature tensile test of reacted Nb3Sn composite superconductors.
  22. Oishi, R.; Yonemura, M.; Nishimaki, Y.; Torii, S.; Hoshikawa, A.; Ishigaki, T.; Morishima, T.; Mori, K.; Kamiyama, T. Rietveld analysis software for J-PARC. Nucl. Instrum. Methods Phys. Res. Sect. A 2009, 600, 94–96. [Google Scholar] [CrossRef]
  23. Sugano, M.; Machiya, S.; Osamura, K.; Adachi, H.; Sato, M.; Semerad, R.; Prussei, W. The direct evaluation of the internal strain of biaxially textured YBCO film in a coated conductor using synchrotron radiation. Supercond. Sci. Technol. 2009, 22, 015002. [Google Scholar] [CrossRef]
Figure 1. Cross-section SEM image of NIFS 11B-enriched MgB2 wire: (a) secondary electron image; (b) color map of EPMA results (chemical symbols: Mg, B, O and Ta).
Qubs 07 00034 g001
Figure 2. Cross-section SEM image of Samdong MgB2 wire.
Qubs 07 00034 g002
Figure 3. Cross-section SEM image of Hypertech MgB2 wire.
Qubs 07 00034 g003
Figure 4. Schematic of the Takumi diffractometer (MLF BL19).
Qubs 07 00034 g004
Figure 5. BL19 Takumi diffractometer of and sample.
Qubs 07 00034 g005
Figure 6. Sample with extensometer and load frame.
Qubs 07 00034 g006
Figure 7. Stress–strain diagram of NIFS 11B-enriched MgB2 wire.
Qubs 07 00034 g007
Figure 8. Stress–strain diagram of Hypertech MgB2 wire.
Qubs 07 00034 g008
Figure 9. Stress–strain diagram of Samdong MgB2 wire.
Qubs 07 00034 g009
Figure 10. Loading history of NIFS.
Qubs 07 00034 g010
Figure 11. Stress–strain diagram of NIFS during measurement.
Qubs 07 00034 g011
Figure 12. ToF histogram of NIFS 11B-enriched MgB2 wire.
Qubs 07 00034 g012
Figure 13. ToF histogram of Samdong MgB2 wire.
Qubs 07 00034 g013
Figure 14. ToF histogram of Hypertech MgB2 wire.
Qubs 07 00034 g014
Figure 15. Relation between the results of axial lattice constant changes of hexagonal MgB2 and applied load calculated by Rietveld analysis: (a) lattice constant a; (b) lattice constant c.
Qubs 07 00034 g015
Figure 16. Relation between the results of the axial lattice constant changes of sheath and applied load calculated by Rietveld analysis: (a) Cu phase a; (b) Ta phase a.
Qubs 07 00034 g016
Figure 17. Relation between the results of the lateral lattice constant changes of hexagonal MgB2 and applied load calculated by Rietveld analysis: (a) lattice constant a; (b) lattice constant c.
Qubs 07 00034 g017
Figure 18. Relation between the results of lattice constant changes of hexagonal MgB2a’ and applied load (axial and lateral).
Qubs 07 00034 g018
Figure 19. Relation between the results of lattice constant changes of hexagonal MgB2c’ and applied load (axial and lateral).
Qubs 07 00034 g019
Figure 20. Relation between the results of lattice strain of each phase and applied load.
Qubs 07 00034 g020
Table 1. Components of the commercial wires and their volume fraction.
ManufacturerFilamentFilament 2Inner SheathMatrixOuter Sheath
SamdongMgB2
(0.132)
Nb
(0.165)
Cu
(0.320)
Ni-Cu-Fe alloy
(0.382)
HypertechMgB2
(0.099)
Cu
(0.149)
Nb
(0.369)
Ni-Cu-Fe alloy
(0.382)
Disclaimer/Publisher’s Note: The statements, opinions and data contained in all publications are solely those of the individual author(s) and contributor(s) and not of MDPI and/or the editor(s). MDPI and/or the editor(s) disclaim responsibility for any injury to people or property resulting from any ideas, methods, instructions or products referred to in the content.

