Article

Stress Evaluation Method by Neutron Diffraction for HCP-Structured Magnesium Alloy

J-PARC Center, Japan Atomic Energy Agency, Tokai-mura, Naka-gun, Ibaraki 319-1195, Japan
*
Author to whom correspondence should be addressed.
Quantum Beam Sci. 2023, 7(4), 32; https://doi.org/10.3390/qubs7040032
Submission received: 15 June 2023 / Revised: 21 August 2023 / Accepted: 10 October 2023 / Published: 13 October 2023

Abstract

:
Tensile deformation in situ neutron diffraction of an extruded AZ31 alloy was performed to validate conventional procedures and to develop new procedures for stress evaluation from lattice strains by diffraction measurements of HCP-structured magnesium alloys. Increases in the lattice strains with respect to the applied true stress after yielding largely vary among [hk.l] grains. Some [hk.l] grains have little or no increase in lattice strain, making it difficult to use the conventional procedures to determine the average phase strain by using lattice constants or by averaging several lattice strains. The newly proposed procedure of stress evaluation from the lattice strains shows very high accuracy and reliability by weighting the volume fraction of [hk.l] grains and evaluating them in many [hk.l] orientations in addition to multiplication by the diffraction elastic constant. When multiple hk.l peaks cannot be obtained simultaneously, we recommend to use the 12.1 peak for stress evaluation. The lattice strain value evaluated from the 12.1 peak shows a good linear relationship with the applied true stress for the whole deformation region.

1. Introduction

Magnesium (Mg) and its alloys are the lightest structural metallic materials and have a great potential in various applications. They are already used for automotive applications [1,2] and are also candidate materials for aircraft applications. Residual stress measurements on the engineering parts made of Mg alloys are, therefore, very important to guarantee quality and safety. Recently, Mg alloys have become multi-phase [3,4,5] in order to achieve higher performances. For further developments, it has become necessary to understand the deformation behavior of each of the constituent phases, including phase stresses and intergranular stresses. One of the powerful probes to evaluate the residual stresses and the stresses in the constituent phases during a process is the diffraction method using a quantum beam (X-ray or neutron).
X-ray diffraction with the sin2ψ method [6] as well as the triaxial-stress method [6] are widely used to measure the residual stresses on the surface of engineering parts [7,8]. Neutron diffraction [9] is used to measure the residual stresses at the inside region of engineering parts [10] and also the evolutions of stresses in situ during deformation [11,12]. Diffraction occurs on multiple (hkl) lattice planes within the crystal, and the stress measurement is performed based on a change in the spacing of the (hkl) lattice plane from the stress-free state. The evaluated stress value varies depending on the hkl peak or (hkl) lattice plane [13], particularly in the engineering parts received plastic forming or in the samples deformed in the plastic region. Crystal grains have different deformabilities depending on their [hkl] orientations and share stresses differently after yielding. The selection of the hkl peak is, therefore, very important to estimate the stress value, representing the macroscopic one or the phase average one.
The structural metallic materials share stresses among the [hkl] orientations during deformation due to the elastic–plastic anisotropy of the [hkl] orientation. For materials having FCC or BCC structures, the change in [hkl] stress in response to external forces remains of the same sign even when stress sharing occurs among the [hkl] orientations [11,14]. In the FCC- or BCC-structured material, the 311 or 211 peak, respectively, is often used for the stress evaluation [13]. When multiple peaks are measured simultaneously using neutron diffraction with the time-of-flight method, the average lattice constants refined from the analyses using the Rietveld or Pawley methods [15,16] are also used for the stress evaluation. For Mg alloys having an HCP structure, the changes in the [hk.l] stress with respect to the external forces vary drastically when yielding occurs; some of their slopes changed to the opposite signs [12,17,18,19]. Therefore, we need to clarify whether the similar methods for FCC- and BCC-structured materials can be used or not. The lattice constants a and c, refined using the Rietveld method [20,21], and the spacing of the 10.1 or 10.3 lattice plane [20,22] are often used for the stress evaluation. In the X-ray diffraction sin2ψ method, the 12.3 peak has been recommended for stress measurement in HCP-structured materials [23] for over three decades. The reason for this 12.3 peak selection is, however, unclear. Moreover, the validation of the measured stress values by diffraction for HCP-structured materials has not been performed well.
In this study, hence, we perform tensile deformation in situ neutron diffraction of an AZ31 alloy, monitor the crystallographic evolutions as deformation progresses, evaluate the stress values according to the conventional procedures described above, and compare the evaluated stress values with the macroscopic stress values obtained mechanically. We also propose new procedures to evaluate the stress value that represents macroscopically or as the phase average value.

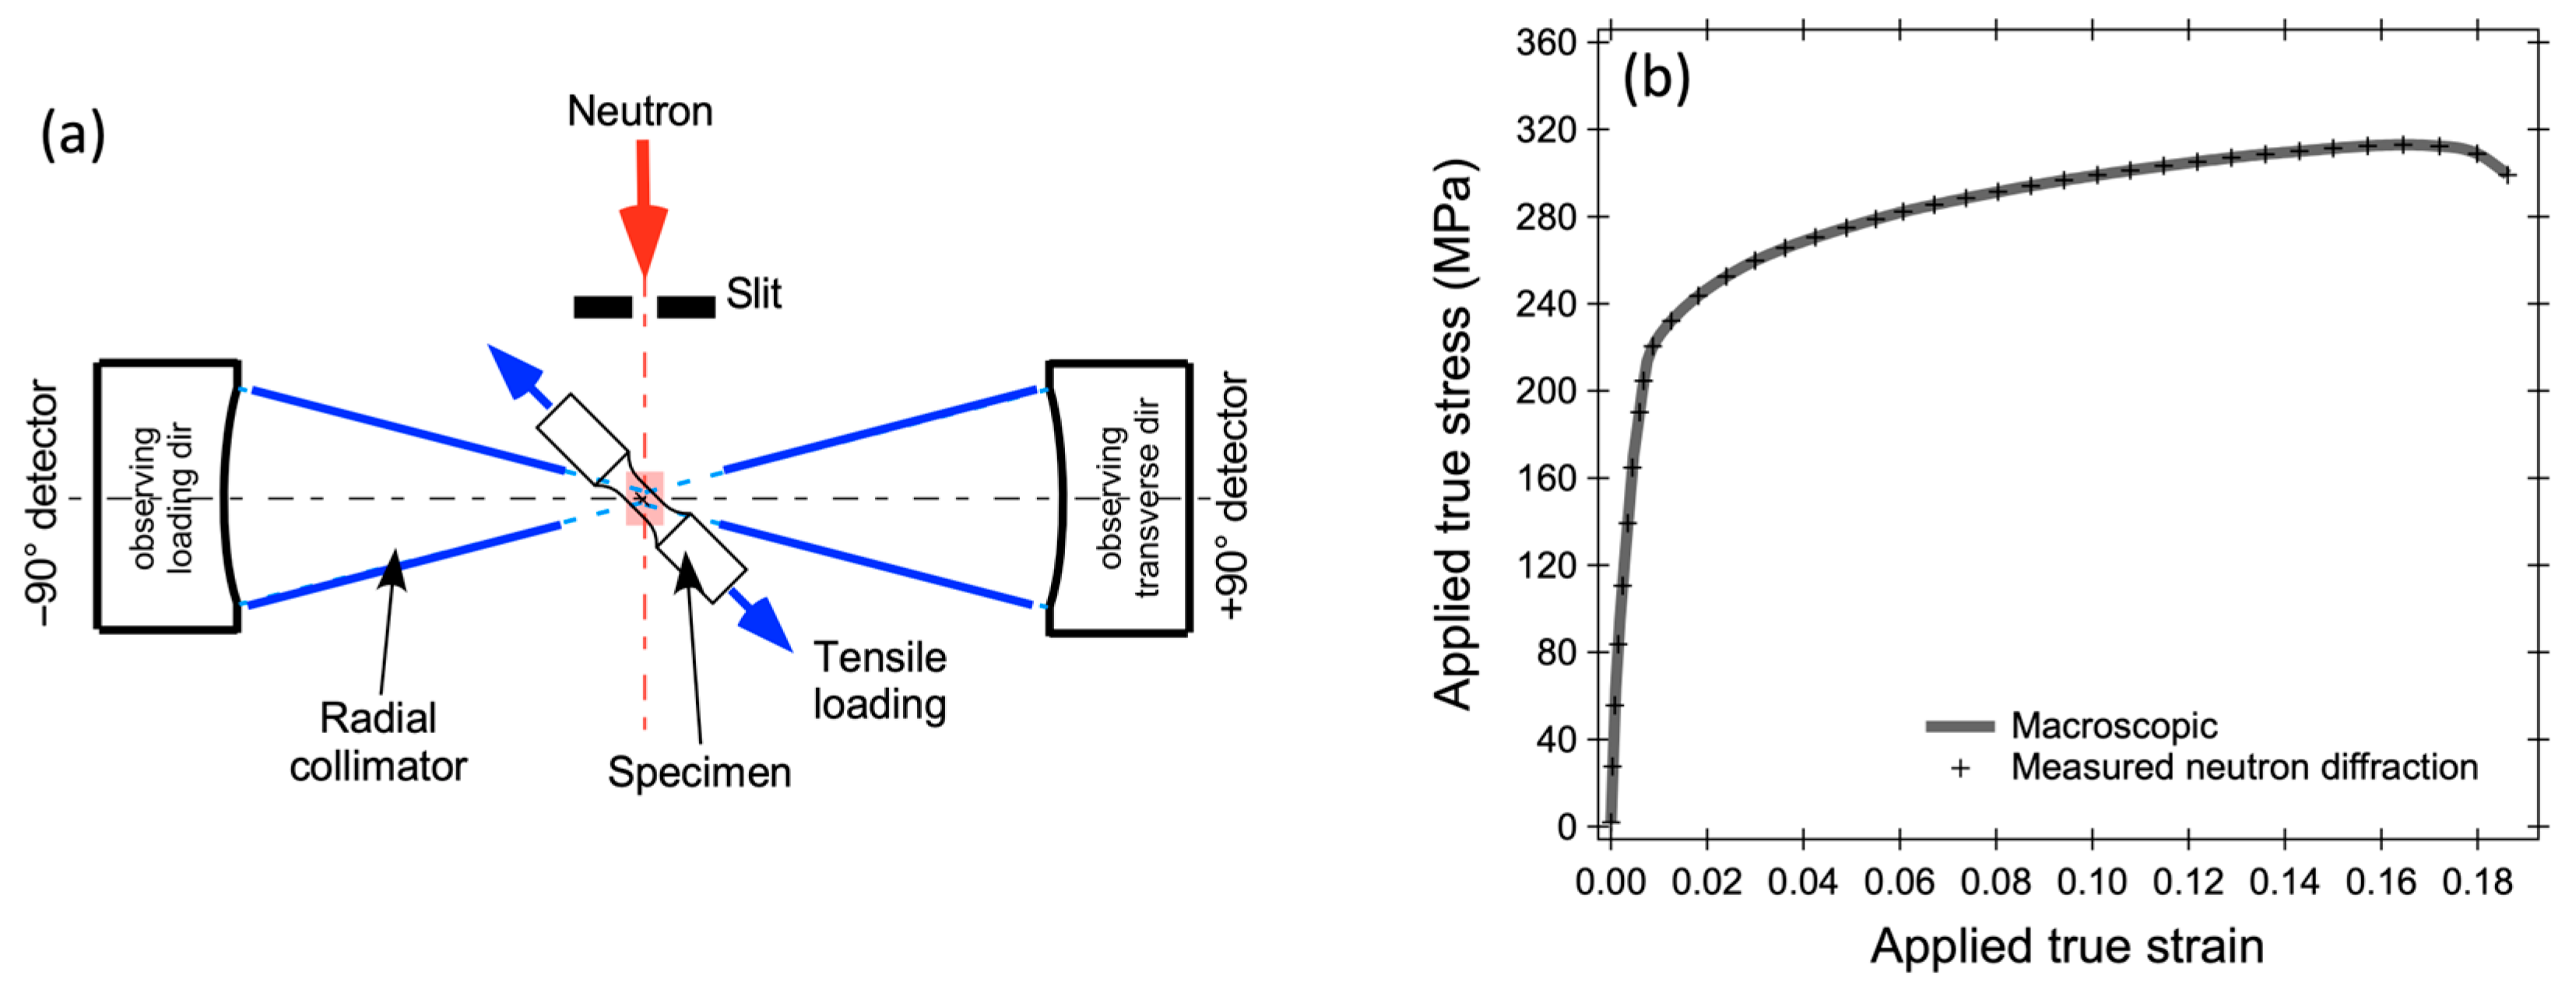
2. Materials and Methods

The sample used in this study is a commercial AZ31 alloy, which was extruded with the extrusion ratio of 10 at 623 K. A dog bone specimen with the active length and diameter of 15 mm and 4 mm, respectively, was prepared in such a way that the loading direction was parallel to the extrusion direction.
An in situ neutron diffraction experiment during a uniaxial tensile test at room temperature was performed using TAKUMI [24], the neutron diffractometer with the time-of-flight method for engineering materials at Materials and Life Science Experimental Facility [25] of Japan Proton Accelerator Research Complex. The loading axis was aligned 45° horizontal to the incident beam. The details on the alignment can be found elsewhere [11,14,19,26,27]. Using a pair of 90° scattering detector banks in TAKUMI, the diffraction pattern with the scattering vector parallel to the loading axis that, hereafter, is referred to as the loading direction (LD), and perpendicular to the loading axis that, hereafter, is referred to as the transverse direction (TD) was simultaneously collected. Figure 1a shows the geometric schematic view of the in situ neutron diffraction experiment during the tensile test.
The tensile test was performed as follows. In the elastic regime, the loads were applied in stages, and in the plastic regime, deformation was applied continuously at a constant displacement rate (strain rate of approximately 1 × 10⁻⁵ s−1). The neutron diffraction data were collected continuously during the tensile test by using an event data recording mode [28,29]. The strain was monitored with a digital image correlative method (DIC) on images of the specimens captured every 5 s [30]. The tensile test was performed until the specimen fractured. The applied true stress–true strain curve is shown in Figure 1b. Localized strains were not observed during the test up to the ultimate tensile strength, and the applied true stresses and true strains were calculated from the applied engineering stresses and engineering strains using the uniform deformation assumption. The neutron diffraction data were extracted corresponding to the load holding for the elastic regime and periodically at time intervals of 300 to 600 s for the plastic regime. A single peak fitting procedure to obtain peak integrated intensities and peak positions was performed using the Z-Rietveld software, v. 1.1.10 [31]. A Rietveld texture analysis [32,33] to evaluate the texture condition was also performed using the MAUD software, v. 2.78 [34].

3. Results and Discussion

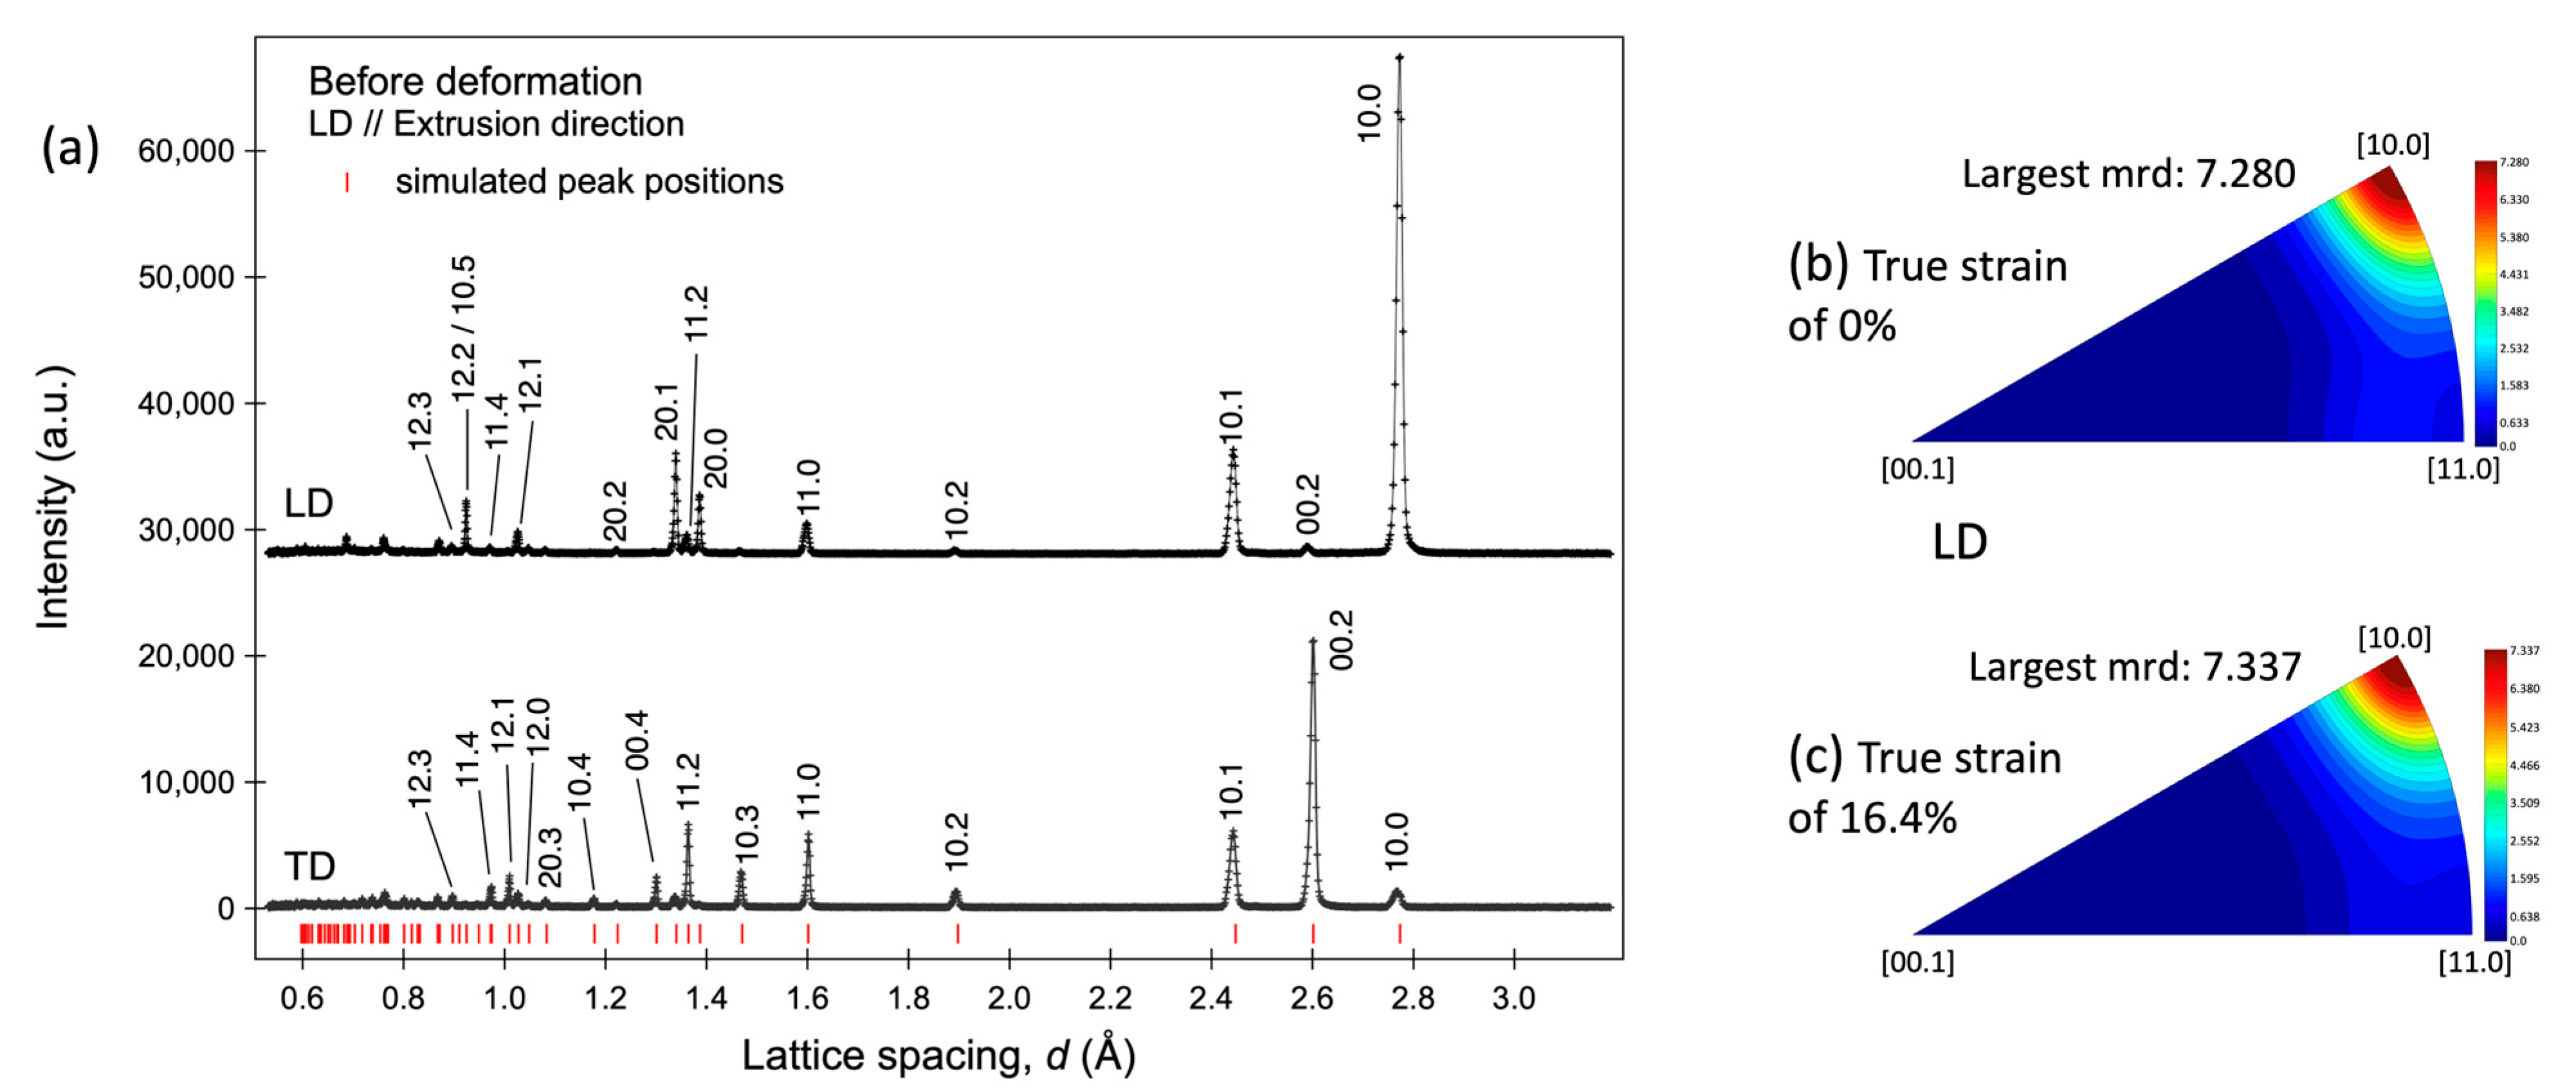
3.1. Responses of [hk.l] Orientations

Figure 2a shows the diffraction patterns before deformation in the LD and TD. A crystal model for Mg with the space group of P63/mmc and the lattice parameters of a = 0.320 nm and c = 0.518 nm was used to simulate the peak positions, which are shown as tick marks in Figure 2a. All peak positions are in good agreement with the tick marks, showing that the specimen is a single-phase, HCP-structured Mg alloy. The peak intensity ratio in the LD is different from that in the TD, exhibiting the presence of texture. Figure 2b shows the inverse pole figures (IPF) in the LD before deformation. The IPF were obtained from the Rietveld-texture analysis [32,33], assuming a fiber texture, using the twelfth-order spherical harmonic function implemented in the MAUD software, v. 2.78 [34]. The values of multiple random distributions (mrd) are large near the [10.0] pole, displaying that a typical basal texture with the c-axis orthogonal to the extrusion direction [12,19,26,35,36] was developed. The condition of the IPF, in which the mrd values are large near the [10.0] pole, is kept even at the applied true strain value of 16.4%, i.e., the change in texture is small.
Figure 3a,a’,b,b’ show the relative integrated intensities of several hk.l peaks. The relative integrated peak intensity was estimated by normalizing the hk.l integrated peak intensity measured during deformation to the hk.l integrated peak intensity before deformation, and it can be used to understand the evolution of texture by deformation. As can be observed in Figure 3a, in the LD, the relative integrated intensities of the 00.2 and 10.3 peaks decrease with the increase in the applied true stress above 210 MPa, accompanied by a slight increase in the integrated peak intensity of 10.0, and vice versa in the TD shown in Figure 3b. These integrated peak intensity changes with respect to the applied true stress may display the occurrence of twinning [37,38]. The integrated intensities of the 00.2 and 10.3 peaks in the LD before deformation are very small, as shown in Figure 2a; therefore, the relative integrated peak intensity changes of the 00.2 and 10.3 peaks in the LD are very sensitive.
Figure 3c,c’ show the lattice strains of several [hk.l] oriented grains ( ε h k . l ) in the LD. The lattice strain was estimated according to the following equation:
ε h k . l = d h k . l d 0 h k . l d 0 h k . l ,
where  d h k . l  and  d 0 h k . l  are the lattice spacings for [hk.l] oriented grains measured during deformation and before deformation, respectively. The occurrences of basal slips, twinning, and prismatic slips can be judged from the changes in the  ε h k . l  values with respect to the applied true stress. When basal slip occurs, the changes in the  ε h k . l  values with respect to the applied true stress of 10.1 and 10.2 become smaller [17,27,39]. The details about deformation modes in Mg alloys using in situ neutron diffraction, however, will not be discussed here because similar studies with detailed discussions have been reported elsewhere [17,35,37,40]. It is worth noting here that the linear relations between the applied true stress values and the  ε h k . l  value are difficult to be found in [10.0], [10.1], [11.0], and [20.1] oriented grains in the LD, having high peak intensities. The  ε h k . l  values for [12.3] oriented grains, which are recommended for the stress evaluation using X-ray diffraction [23], surprisingly show no linear relationship with the applied stress values throughout the deformation. The [12.3] oriented grains in the LD appear to yield due to basal slip and then bear stresses lower than the applied stress. Note also that the increases in the  ε h k . l  value with respect to the applied true stress for [10.2], [10.3], and [12.3] grains become very small after the initiation of basal slip; particularly, [10.2] grains have almost no increase in the slope.

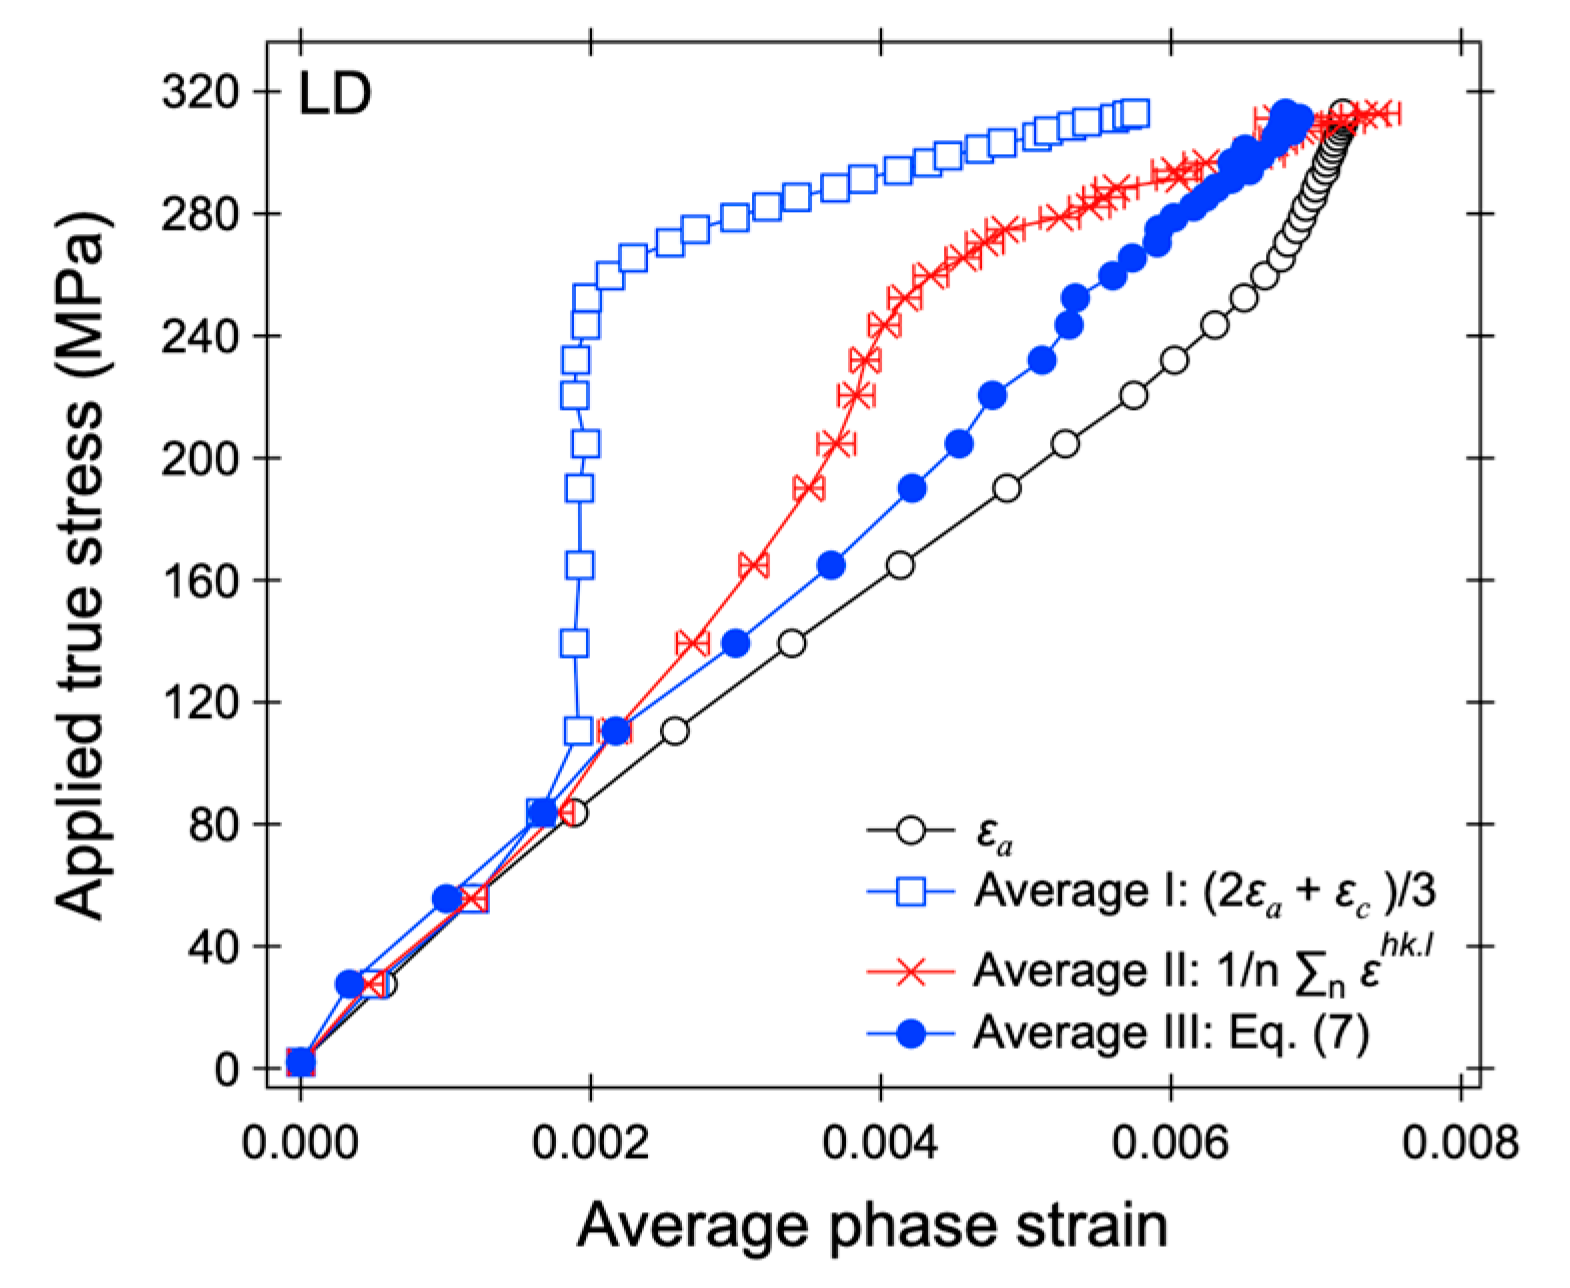
3.2. Conventional Procedures for Evaluations of Phase Strain and Phase Stress

In many cases, average phase strains in HCP-structured materials have been conventionally calculated using the following two methods. One is a lattice strain analysis using the averaged lattice constants refined with the Pawley [41] or Rietveld method [42] as [21]:
ε ave   I = ε HCP lat . const . = 2 a HCP a 0 HCP a 0 HCP + c HCP c 0 HCP c 0 HCP 3 = 2   ε a + ε c 3 ,
which is called the average I phase strain ( ε ave   I ). Here,  a HCP  and  c HCP  are the averaged lattice constants refined with the Pawley method using the Z-Rielveld software, v. 1.1.10 [31]. The other one is by simply averaging the  ε h k . l  values as [7,43]:
ε ave   II = ε HCP ave . = 1 n 0 n ε h k . l ,
which is called the average II phase strain ( ε ave   II ).
Figure 4 shows the values of  ε ave   I  and  ε ave   II  in the LD, evaluated using the above two methods. For the comparison, the value evaluated from only the lattice parameter a ( ε a ) is also plotted. None of them show a linear relation with the applied true stress for the whole deformation. Surprisingly, the value of  ε ave   I , which is often used in the residual stress measurements with multiple hkl peaks [16,21,44,45], shows the largest deviation from the linear relation to have a smaller value, though the number of grains oriented to the LD where basal slips easily occur (e.g., [10.2] or [10.3] grains) is small due to the extrusion texture (see Figure 2a). The occurrence of basal slip still seems to have a strong influence on the average lattice constants. The linear response of  ε ave   II  is kept up to the larger applied stress, but it corrupts when the applied stress value exceeds 160 MPa. The  ε a  value is basically very similar to the  ε h k . l  value for [10.0] grains.
Figure 5 shows the lattice stresses or phase stresses that were calculated conventionally from the  ε h k . l  values and the conventional average phase strain ( ε ave   I ε ave   II , or  ε a ) values by multiplying them with the related diffraction elastic constants, according to the following equations:
σ h k . l = ε h k . l   E h k . l ,
σ ave   I = ε ave   I   E ave   I ,
σ ave   II = ε ave   II   E ave   II ,
σ a = ε a   E a .
The value of the diffraction elastic constant was evaluated from the linear relation between the  ε h k . l ε ave   I ε ave   II , or  ε a  and the applied true stress in the elastic regime. The evaluated values of  E h k . l  are shown in Figure 6a, and  E ave   I  =  ε ave   II  =  E a  = 45.2 GPa. As shown in Figure 5a, the  σ h k . l  values evaluated for [hk.l] oriented grains, contributing to the large diffraction peak intensities in the LD, show good agreements only for the elastic region. The  σ h k . l  value for [10.1] grains deviates from the applied stress at a stress level much lower than the macroscopic yield stress due to the occurrence of basal slip. The  σ h k . l  value for [12.3] grains has been abbreviated here, but it is very close to the  σ h k . l  value for [10.1] grains, considering the results shown in Figure 3c. The other  σ h k . l  values for 10.0, 20.1, and 11.0 also receive influences differently when basal slips, twinning, or prismatic slips occur and deviate from the applied stress. The  σ ave   I  and  σ ave   II  values (Figure 5b) deviate also from the applied true stress at a very early deformation stage, which can be predicted also from Figure 4.

3.3. New Procedure for Phase Stress Evaluation

Here, we propose a new procedure to evaluate the stress value from the  ε h k . l  values by weighting the volume fraction of [hk.l] grains and evaluating them in many [hk.l] orientations in addition to multiplication by the diffraction elastic constants. The [hk.l] orientation with respect to the LD is replaced by an angle χ between the c-axis of the [hk.l] grains and the LD. The calculated stresses for the whole χ angles covering from 0° to 90° are then integrated. The equation for the phase stress evaluation is as follows:
σ = χ = 0 ° χ = 90 ° ε χ   E χ   V χ d χ ,
where ε(χ), E(χ), and V(χ) are the lattice strain, the diffraction elastic constant, and the volume fraction for χ angle, respectively.
Figure 6a shows the  E h k . l  values as a function of χ angle. The whole χ angle region is, however, not possible to be covered by the hk.l peaks possibly analyzed with high accuracy. To estimate the E(χ) for the whole χ angle region, a cubic spline interpolation with 91 destinations is then employed. The E(χ) values are in a range of approximately 45 GPa, very close to the values reported by Gong et al. [19] and the values calculated according to the Kroner model [46] using the elastic constants for pure Mg reported by Slutsky and Garland ( c 11  = 59.40 GPa,  c 12  = 25.61 GPa,  c 13  = 21.44 GPa,  c 33  = 61.60 GPa,  c 44  = 16.40 GPa, and c/a = 1.623) [47]. The anisotropy in the diffraction elastic constant is not very large, i.e., the values are almost similar for different [hk.l] oriented grains. Figure 6b shows the ε(χ) values for some steps of applied true strains. To estimate the ε(χ) values for the whole χ angle region, the cubic spline interpolation with 91 destinations is also employed. Figure 6c shows the intensity of the basal pole of HCP, which is a plot of the I(χ) value as a function of χ angle. This plot is often called an angle distribution function (ADF). The ADF is a cut through a line from the center to the perimeter in the pole figure [19,48,49], which was extracted from the orientation distribution function (ODF) using the MTEX program [50]. The ODF was determined in the Rietveld-texture analysis [32,33] of each diffraction pattern, assuming a fiber texture using the twelfth-order spherical harmonic function implemented in the MAUD software, v. 2.78 [34]. The V(χ) was then determined from the ADF with the following equation [49], and the results are shown in Figure 6d.
V χ = I χ   sin χ   Δ χ .
Figure 6. The parameters used in the newly proposed procedure for stress evaluation: (a) Diffraction elastic constants of the [hk.l] oriented grains versus χ (the angle between the c-axis and LD). (b) Lattice strains of the [hk.l] oriented grains versus χ for some applied true strain steps. (c) The axial distribution function (ADF) curves at some steps of applied true strains. (d) The volume fraction of [hk.l] grains versus χ for some applied true strain steps.
Qubs 07 00032 g006
The phase stress values evaluated using our new proposed method are shown in Figure 7, which are in very good agreement with the applied true stress values not only for the elastic regime but for the whole deformation. These results validate the high accuracy of our newly proposed procedure to evaluate stress values using multiple hk.l peaks. This result indicates also that the lattice strains for the LD are enough and reliable to evaluate the macroscopic stress in the uniaxial loading experiments. In uniaxial loading experiments, there are two principal stress tensors parallel to the LD and TD. However, the [hkl]//TD grains do not have the same [hkl] orientations with grains having the scattering vector parallel to the LD; instead, they include various [hkl] orientations. Moreover, the orthogonal directions of [hkl]//TD grains are not always parallel to the LD. This issue has already been mentioned in several papers [51,52,53]. Stress conversions using the lattice strains for the TD without careful consideration of the development of texture in the LD and TD are, therefore, messy and require caution. The use of a simulation using the EPSC modelling [17,35,37,40] could be useful to understand the lattice strain behavior in the TD but is very difficult if the specimen is multiphase or undergoes phase transformation during deformation like in TRIP steels. Our new proposed method will be helpful to understand the individual average stresses of the constituent phases in multiphase materials with or without phase transformation.
On the other hand, the engineering parts, such as welded and plastically formed parts, most of which are machined under multi-axial loading, require several lattice strain tensors to determine the residual stresses. When measuring the residual stresses in the engineering components made of Mg alloys, the following procedure is considered applicable, considering the isotropic diffraction elastic constant. For simplicity, a triaxial principal stress condition is assumed.
ε i i ave   III = χ = 0 ° χ = 90 ° ε i i χ   V i i χ d χ ,
where ii is the principal stress direction, 11, 22, or 33. Equation (7) is the integral of the lattice strains weighted by the [hk.l] grain volume fractions and, henceforth, referred to as the average III phase strain ( ε ave   III ). The residual stresses can then be evaluated from the  ε i i ave   III  values according to the following equation:
σ i i = E 1 + ν ε i i ave   III + ν 1 2 ν ε 11 ave   III + ε 22 ave   III + ε 33 ave   III .
Here, E is Young’s modulus, and  ν  is Poisson’s ratio. The  ε ave   III  values for the LD calculated with Equation (7) are plotted in Figure 4 and show a good linear relationship with the applied true stress.

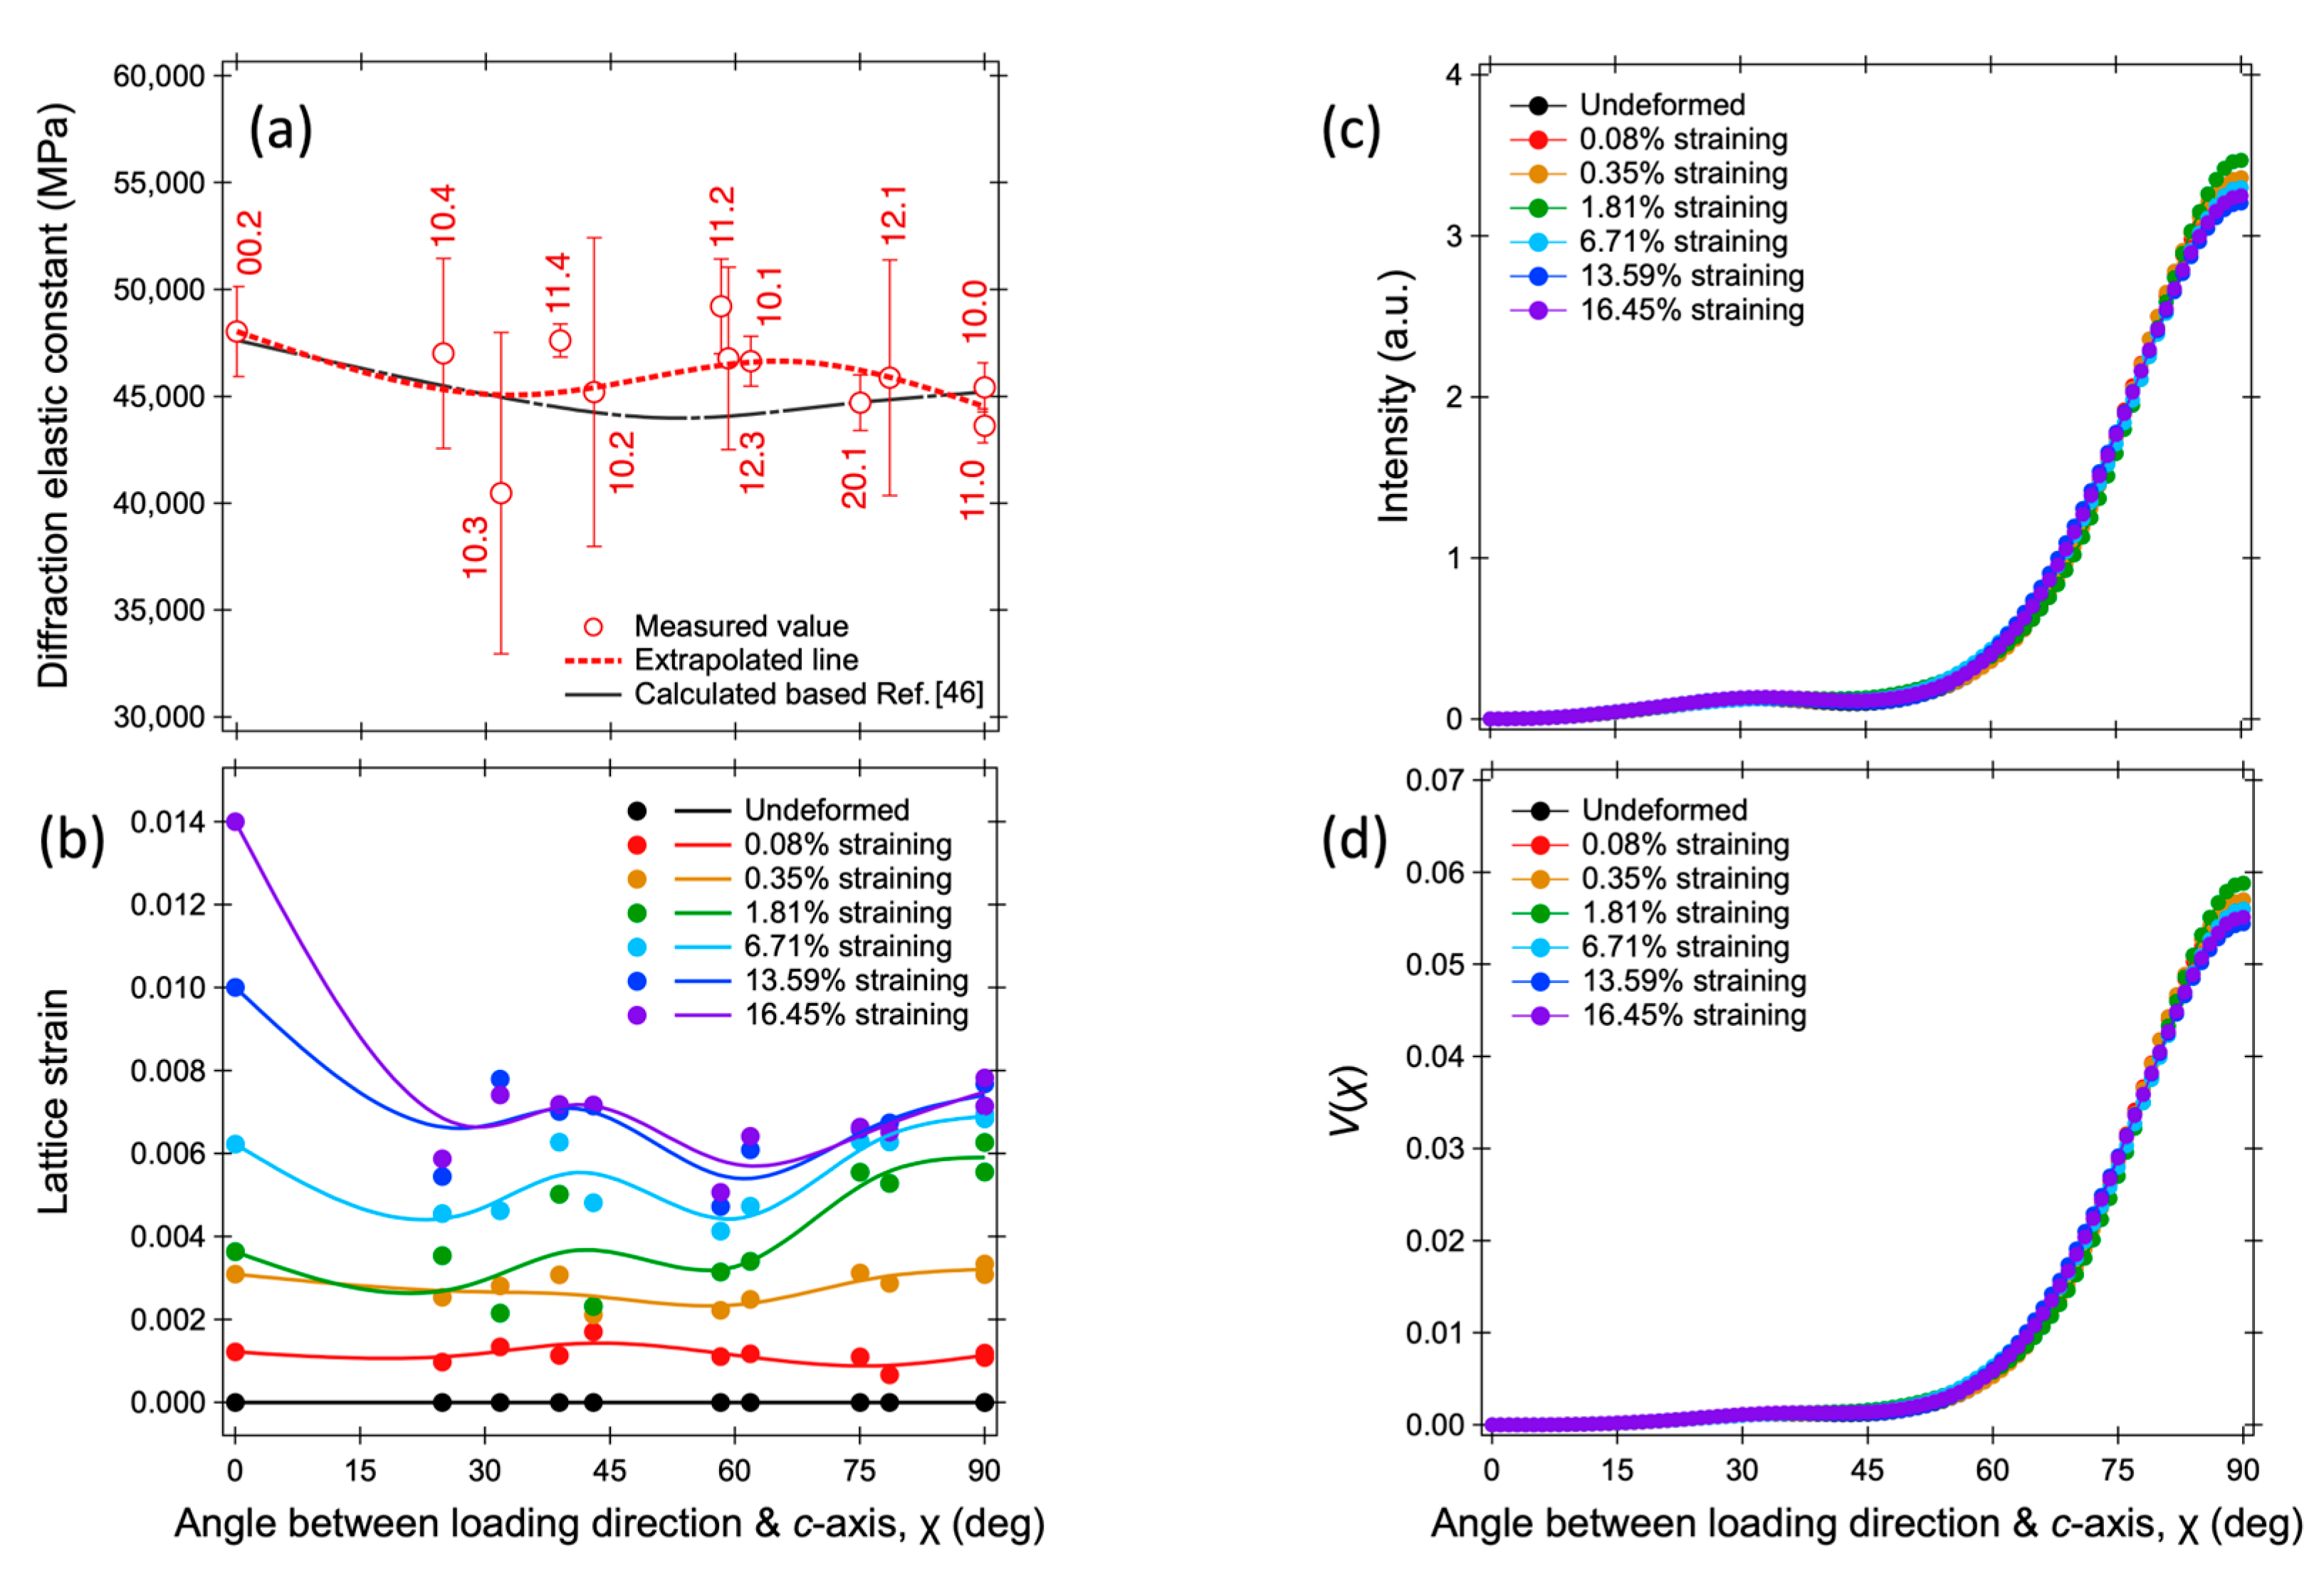
3.4. The Lattice Strain of Particular Grain for Phase Stress

Figure 8a shows two  ε h k . l  values having linear responses to the applied true stress for the whole deformation: the [12.1] and [11.4] oriented grains in the LD. The relative integrated peak intensity results for 12.1 and 11.4 (shown in Figure 3a’,b’) are replotted in Figure 8b,c. The relative integrated peak intensity of 11.4, though the scatter is large due to the low intensity before deformation, decreases with the plastic deformation in the LD (Figure 8b), while it shows little change in the TD (Figure 8c). The decrease in the relative integrated peak intensity of 11.4 in the LD may be because that peak became very broad, and the profile fitting was difficult to perform properly. However, it is very difficult to determine that the integrated peak intensity of 11.4 for both the LD and TD has hardly changed. Moreover, the integrated peak intensity of 11.4 in the LD before deformation is very low due to the strong extrusion texture (Figure 2a). On the contrary, the relative integrated intensities of 12.1 for the LD and TD are consistently showing slight changes during deformation. It can also be observed in Figure 2a that the integrated peak intensities of 12.1 for the LD and TD before deformation are close to each other, even though the sample was extruded. The [12.1] orientation may be insensitive to the texture development.
To understand the reason, the values of the Schmid factor for three deformation modes during tension, basal slip, extension twinning, and prismatic slip, were calculated. The calculations for basal slip or prismatic slip were conducted on three variants, and the maximum values were adopted. The calculations for extension twinning were conducted on six variants, and the maximum positive values were adopted. The variants used for the calculation refer to Ref. [19]. Figure 9 shows the distributions of the values of the Schmid factor as functions of χ angle. The value of the Schmid factor for basal slip is zero at the χ angle of zero, increases with increasing χ angle to reach a maximum value at approximately the χ angle of 45°, and then decreases toward zero at the χ angle of 90°. The value of the Schmid factor for extension twinning is maximum at the χ angle of zero and decreases toward zero at the χ angle of 90°, and it is vice versa for prismatic slip.
The [12.3] oriented grains show a large value of the Schmid factor for basal slip, explaining that the earlier deviation from the applied stress shown in Figure 3c is due to the basal slip. Therefore, the accuracy of stress measurement using the 12.3 peak should receive attention for the evaluation of residual stresses in the HCP-structured engineering parts after plastic deformation. The [11.4] oriented grains also have a very large value of the Schmid factor for basal slip, being larger than the values of the Schmid factor for extension twinning and prismatic slip. The linear relationship between the  ε h k . l  value for [11.4] grains and the applied true stress for the whole deformation shown in Figure 8 may, therefore, have been a contingent one. Meanwhile, the Schmid factor of [12.1] oriented grains shows a large value for prismatic slip, being larger than that for basal slip, and that for extension twinning is almost zero. The critical resolving shear stress (CRSS) value is also an important parameter for determining the activation of the deformation mode. The CRSS value is smallest for basal slip, increasing in order of extension twinning and then prismatic slip. The CRSS for prismatic slip is generally three times larger than that for basal slip [54]. Muransky et al. [17] performed a simulation using the EPSC modelling to describe the responses of  ε h k . l  values to the applied stress measured with neutron diffraction for an AZ31 alloy and found also that the CRSS value for prismatic slip (~90 MPa) is almost three times larger than that for basal slip (~30 MPa). Thus, we can expect that, in the [12.1] oriented grains, prismatic slip occurs at the later stage of deformation. Similar EPSC modelling could be performed to understand the detailed deformation modes, but since there have already been many reports on this topic [17,35,37,40], we omit it. However, based on these discussions, we newly recommend that the [12.1] orientation is suitable for stress evaluation for HCP-structured Mg alloys not only in the neutron diffraction stress measurement but also in the X-ray diffraction one when multiple [hk.l] orientations cannot be obtained simultaneously. We believe that the [12.1] orientation is also valid for other HCP-structured materials, but clarification is still needed to be performed in the future.

4. Conclusions

In this study, tensile deformation in situ neutron diffraction of an extruded AZ31 alloy was performed to monitor the crystallographic evolutions as deformation progresses. The conventional procedures to evaluate stress values from the lattice strain values for HCP-structured materials were reviewed and compared to the stress values obtained mechanically. We also propose a new procedure to evaluate the stress values that represent macroscopically or as the phase average value. The results are summarized as follows.
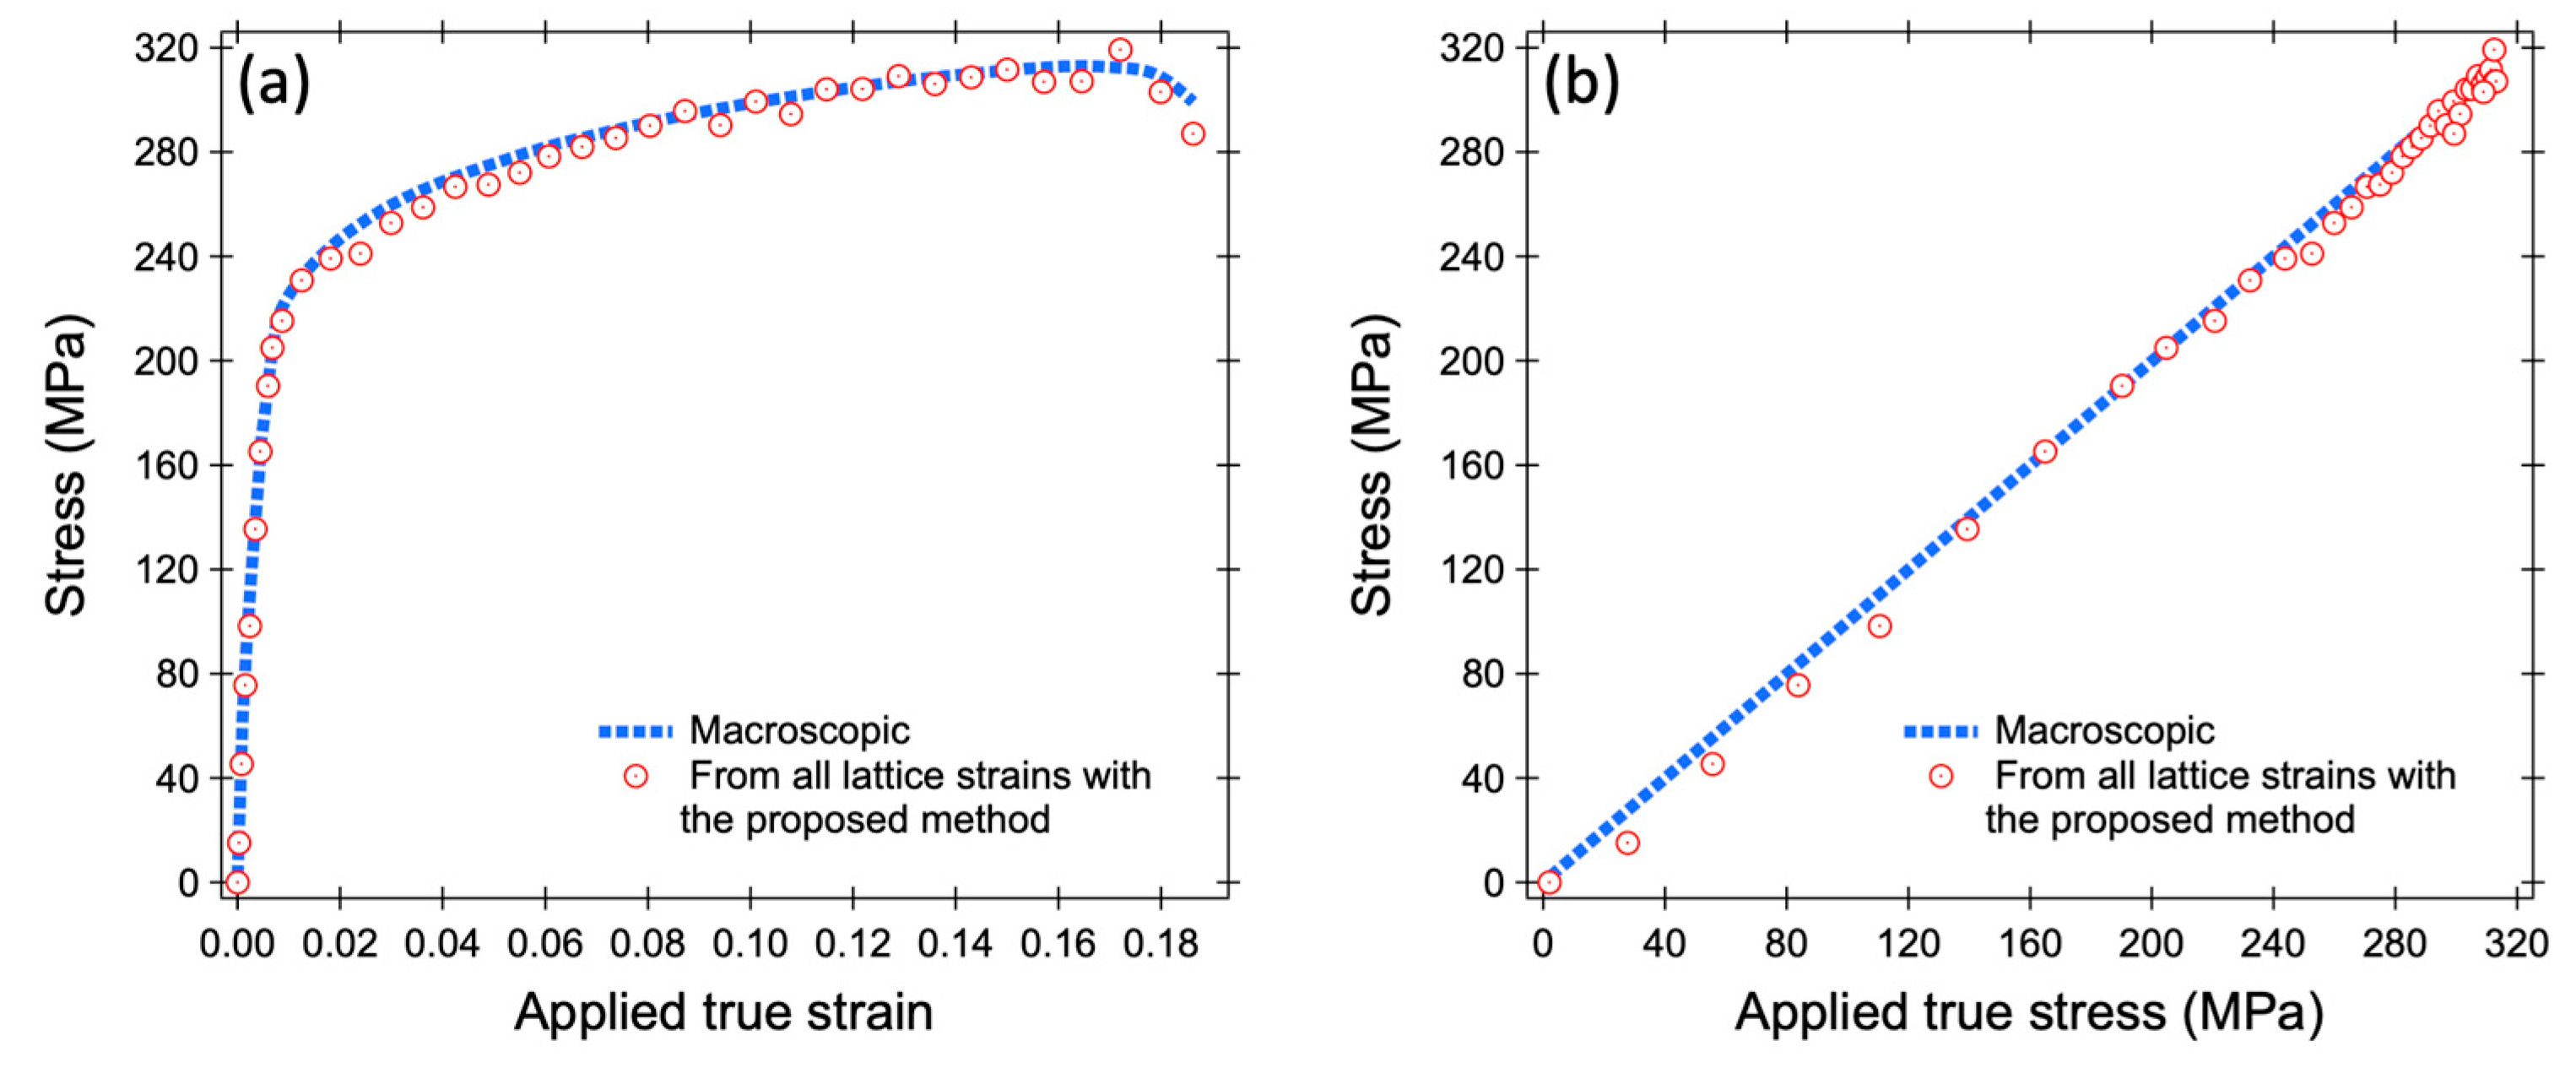
  • The increases in the lattice strains with respect to the applied true stress after yielding largely vary among [hk.l] grains. Some [hk.l] grains have little or no increase in lattice strain, making it difficult to use the conventional procedures for determining the average phase strain by using lattice constants or by averaging several lattice strains.
  • Our newly proposed procedure of stress evaluation from the lattice strains shows very high accuracy and reliability by weighting the volume fraction of [hk.l] grains and evaluating them in many [hk.l] orientations in addition to multiplication by the diffraction elastic constant.
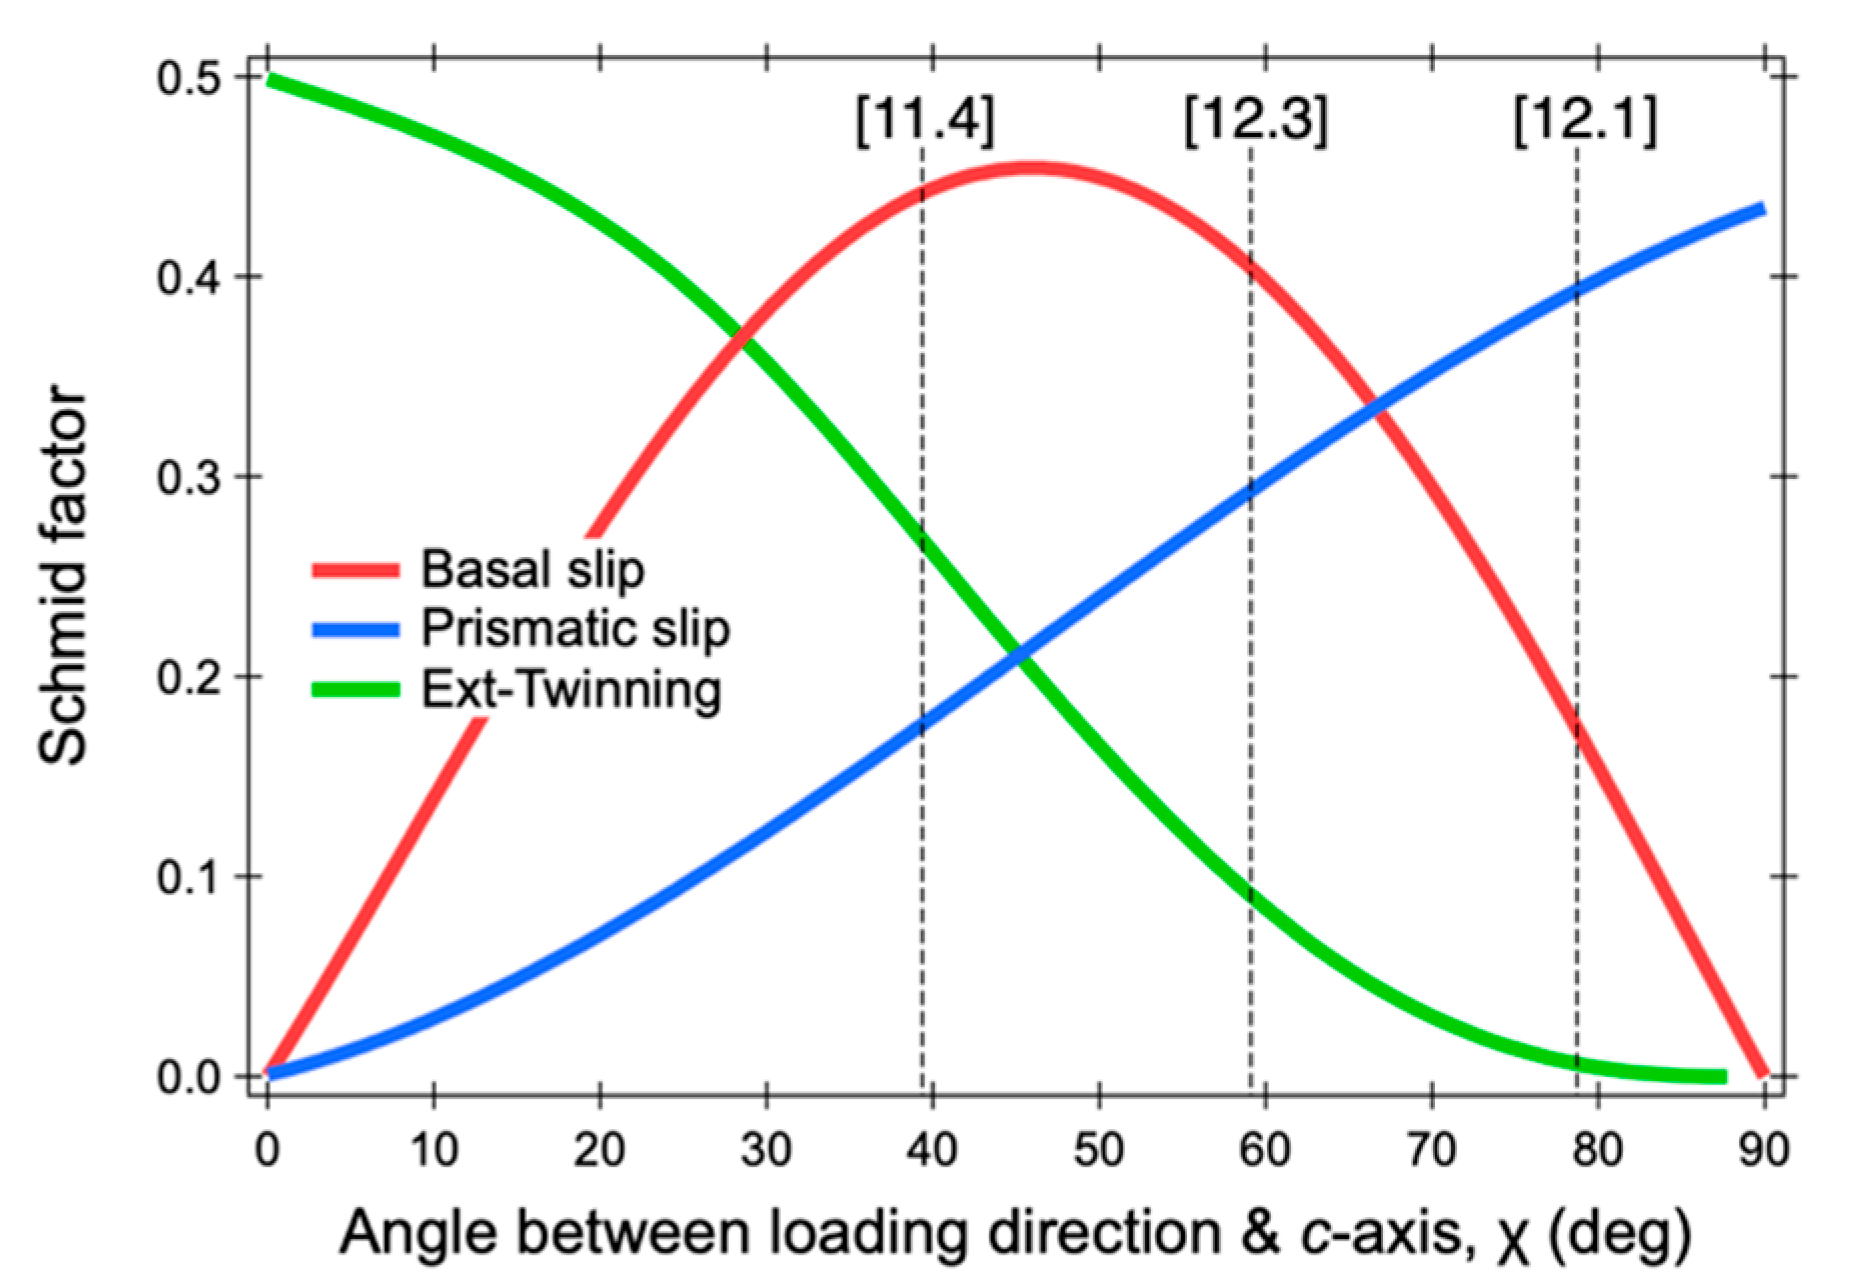
  • The conventionally recommended 12.3 peak for stress measurement of HCP-structured materials should be used with caution for the evaluation of stresses of HCP-structured engineering parts due to the huge stress relaxation in 12.3 oriented grains by basal slip.
  • We recommend to use the 12.1 peak for stress evaluation when multiple hk.l peaks cannot be obtained simultaneously. The lattice strain value evaluated from the 12.1 peak shows a good linear relationship with the applied true stress for the whole deformation region.

Author Contributions

Conceptualization, S.H., W.G. and T.K.; formal analysis, S.H.; data curation, S.H. and W.G.; writing—original draft preparation, S.H.; writing—review and editing, S.H., W.G. and T.K. All authors have read and agreed to the published version of the manuscript.

Funding

This study was financially supported by the KAKENHI (JP18H05479 and JP18H05476), JST-CREST (JPMJCR2094), and MEXT Program: Data Creation and Utilization Type Material Research and Development (JPMXP1122684766), all through the Ministry of Education, Culture, Sports, Science and Technology (MEXT), Japan.

Data Availability Statement

The data presented in this study are available on request from the corresponding author.

Acknowledgments

The authors acknowledge Michiaki Yamasaki for providing the sample used in this study. The neutron diffraction experiments were performed at TAKUMI in MLF of J-PARC with the proposals of 2021P0400 and 2021I0019.

Conflicts of Interest

The authors declare no conflict of interest.

References

  1. Joost, W.J.; Krajewski, P.E. Towards magnesium alloys for high-volume automotive applications. Scr. Mater. 2017, 128, 107–112. [Google Scholar] [CrossRef]
  2. Agnew, S.R. Wrought magnesium: A 21st century outlook. JOM 2004, 56, 20–21. [Google Scholar] [CrossRef]
  3. Kawamura, Y.; Hayashi, K.; Inoue, A.; Masumoto, T. Rapidly Solidified Powder Metallurgy Mg97Zn1Y2Alloys with Excellent Tensile Yield Strength above 600 MPa. Mater. Trans. 2001, 42, 1172–1176. [Google Scholar] [CrossRef]
  4. Blum, W.; Zhang, P.; Watzinger, B.; Grossmann, B.V.; Haldenwanger, H.G. Comparative study of creep of the die-cast Mg-alloys AZ91, AS21, AS41, AM60, and AE42. Mater. Sci. Eng. A 2001, 319–321, 735–740. [Google Scholar] [CrossRef]
  5. Itoi, T.; Inazawa, T.; Yamasaki, M.; Kawamura, Y.; Hirohashi, M. Microstructure and mechanical properties of Mg-Zn-Y alloy sheet prepared by hot-rolling. Mater. Sci. Eng. A 2013, 560, 216–223. [Google Scholar] [CrossRef]
  6. Noyan, I.C. Equilibrium Conditions for the Average Stresses Measured By X-rays. Metall. Trans. A Phys. Metall. Mater. Sci. 1983, 14, 1907–1914. [Google Scholar] [CrossRef]
  7. Harjo, S.; Tomota, Y.; Ono, M. Measurements of thermal residual elastic strains in ferrite–austenite Fe–Cr–Ni alloys by neutron and X-ray diffractions. Acta Mater. 1998, 47, 353–362. [Google Scholar] [CrossRef]
  8. Lin, L.; Liu, Z.; Zhuang, W.; Peng, H. Effects of pre-strain on the surface residual stress and corrosion behavior of an Al-Zn-Mg-Cu alloy plate. Mater. Charact. 2020, 160, 110129. [Google Scholar] [CrossRef]
  9. Hutchings, M.T. Neutron diffraction measurement of residual stress fields-the engineer’s dream come true? Neutron News 1992, 3, 14–19. [Google Scholar] [CrossRef]
  10. Nishida, S.; Nishino, S.; Sekine, M.; Oka, Y.; Harjo, S.; Kawasaki, T.; Suzuki, H.; Morii, Y.; Ishii, Y. Analysis of Residual Stress in Steel Bar Processed by Cold Drawing and Straightening. Mater. Trans. 2021, 62, 667–674. [Google Scholar] [CrossRef]
  11. Harjo, S.; Tsuchida, N.; Abe, J.; Gong, W. Martensite phase stress and the strengthening mechanism in TRIP steel by neutron diffraction. Sci. Rep. 2017, 7, 15149. [Google Scholar] [CrossRef]
  12. Harjo, S.; Gong, W.; Aizawa, K.; Kawasaki, T.; Yamasaki, M. Strengthening of αMg and long-period stacking ordered phases in a Mg-Zn-Y alloy by hot-extrusion with low extrusion ratio. Acta Mater. 2023, 255, 119029. [Google Scholar] [CrossRef]
  13. Withers, P.J.; Bhadeshia, H.K.D.H. Residual stress. Part 1—Measurement techniques. Mater. Sci. Technol. 2001, 17, 355–365. [Google Scholar] [CrossRef]
  14. Koyanagi, Y.; Ueta, S.; Kawasaki, T.; Harjo, S.; Cho, K.; Yasuda, H.Y.H.Y. Investigation of strengthening mechanism in Ni–38Cr-3.8Al alloy with fine lamellar structure by in situ neutron diffraction analysis. Mater. Sci. Eng. A 2020, 773, 138822. [Google Scholar] [CrossRef]
  15. Daymond, M.R.; Bourke, M.A.M.; Von Dreele, R.B.; Clausen, B.; Lorentzen, T. Use of Rietveld refinement for elastic macrostrain determination and for evaluation of plastic strain history from diffraction spectra. J. Appl. Phys. 1997, 82, 1554–1562. [Google Scholar] [CrossRef]
  16. Harjo, S.; Kawasaki, T.; Grazzi, F.; Shinohara, T.; Tanaka, M. Neutron diffraction study on full-shape Japanese sword. Materialia 2019, 7, 100377. [Google Scholar] [CrossRef]
  17. Muránsky, O.; Carr, D.G.; Barnett, M.R.; Oliver, E.C.; Šittner, P. Investigation of deformation mechanisms involved in the plasticity of AZ31 Mg alloy: In situ neutron diffraction and EPSC modelling. Mater. Sci. Eng. A 2008, 496, 14–24. [Google Scholar] [CrossRef]
  18. Muránsky, O.; Barnett, M.R.; Carr, D.G.; Vogel, S.C.; Oliver, E.C. Investigation of deformation twinning in a fine-grained and coarse-grained ZM20 Mg alloy: Combined in situ neutron diffraction and acoustic emission. Acta Mater. 2010, 58, 1503–1517. [Google Scholar] [CrossRef]
  19. Gong, W.; Aizawa, K.; Harjo, S.; Zheng, R.; Kawasaki, T.; Abe, J.; Kamiyama, T.; Tsuji, N. Deformation behavior of as-cast and as-extruded Mg97Zn1Y2 alloys during compression, as tracked by in situ neutron diffraction. Int. J. Plast. 2018, 111, 288–306. [Google Scholar] [CrossRef]
  20. Woo, W.; Choo, H.; Prime, M.B.; Feng, Z.; Clausen, B. Microstructure, texture and residual stress in a friction-stir-processed AZ31B magnesium alloy. Acta Mater. 2008, 56, 1701–1711. [Google Scholar] [CrossRef]
  21. Turski, M.; Paradowska, A.; Zhang, S.Y.; Mortensen, D.; Fjaer, H.; Grandfield, J.; Davis, B.; Delorme, R. Validation of predicted residual stresses within direct chill cast magnesium alloy slab. Metall. Mater. Trans. A Phys. Metall. Mater. Sci. 2012, 43, 1547–1557. [Google Scholar] [CrossRef]
  22. Brown, D.W.; Agnew, S.R.; Bourke, M.A.M.; Holden, T.M.; Vogel, S.C.; Tomé, C.N. Internal strain and texture evolution during deformation twinning in magnesium. Mater. Sci. Eng. A 2005, 399, 1–12. [Google Scholar] [CrossRef]
  23. Prevey, P.S. X-Ray Diffraction Residual Stress Techniques. In Materials Characterization; ASM International: Almere, The Netherlands, 1986; pp. 380–392. [Google Scholar] [CrossRef]
  24. Harjo, S.; Ito, T.; Aizawa, K.; Arima, H.; Abe, J.; Moriai, A.; Iwahashi, T.; Kamiyama, T. Current Status of Engineering Materials Diffractometer at J-PARC. Mater. Sci. Forum. 2011, 681, 443–448. [Google Scholar] [CrossRef]
  25. Nakajima, K.; Kawakita, Y.; Itoh, S.; Abe, J.; Aizawa, K.; Aoki, H.; Endo, H.; Fujita, M.; Funakoshi, K.; Gong, W.; et al. Materials and Life Science Experimental Facility (MLF) at the Japan Proton Accelerator Research Complex II: Neutron Scattering Instruments. Quantum Beam Sci. 2017, 1, 9. [Google Scholar] [CrossRef]
  26. Máthis, K.; Drozdenko, D.; Németh, G.; Harjo, S.; Gong, W.; Aizawa, K.; Yamasaki, M.; Kawamura, Y. In-situ Investigation of the Microstructure Evolution in Long-Period-Stacking-Ordered (LPSO) Magnesium Alloys as a Function of the Temperature. Front. Mater. 2019, 6, 270. [Google Scholar] [CrossRef]
  27. Harjo, S.; Aizawa, K.; Gong, W.; Kawasaki, T. Neutron diffraction monitoring of as-cast Mg97Zn1Y2 during compression and tension. Mater. Trans. 2020, 61, 828–832. [Google Scholar] [CrossRef]
  28. Ito, T.; Nakatani, T.; Harjo, S.; Arima, H.; Abe, J.; Aizawa, K.; Moriai, A. Application Software Development for the Engineering Materials Diffractometer, TAKUMI. Mater. Sci. Forum. 2010, 652, 238–242. [Google Scholar] [CrossRef]
  29. Kawasaki, T.; Nakamura, T.; Gong, W.; Oikawa, K. Testing of time-of-flight neutron diffraction imaging using a high-resolution scintillator detector with wavelength-shifting fibers. Phys. B Condens. Matter 2018, 551, 460–463. [Google Scholar] [CrossRef]
  30. Mao, W.; Gong, W.; Kawasaki, T.; Harjo, S. Effect of deformation-induced martensitic transformation on nonuniform deformation of metastable austenitic steel. Mater. Sci. Eng. A 2022, 837, 142758. [Google Scholar] [CrossRef]
  31. Oishi-Tomiyasu, R.; Yonemura, M.; Morishima, T.; Hoshikawa, A.; Torii, S.; Ishigaki, T.; Kamiyama, T. Application of matrix decomposition algorithms for singular matrices to the Pawley method in Z-Rietveld. J. Appl. Crystallogr. 2012, 45, 299–308. [Google Scholar] [CrossRef]
  32. Xu, P.; Harjo, S.; Ojima, M.; Suzuki, H.; Ito, T.; Gong, W.W.; Vogel, S.C.; Inoue, J.; Tomota, Y.Y.; Aizawa, K.; et al. High stereographic resolution texture and residual stress evaluation using time-of-flight neutron diffraction. J. Appl. Crystallogr. 2018, 51, 746–760. [Google Scholar] [CrossRef]
  33. Wenk, H.-R.; Lutterotti, L.; Vogel, S.C. Rietveld texture analysis from TOF neutron diffraction data. Powder Diffr. 2010, 25, 283–296. [Google Scholar] [CrossRef]
  34. Lutterotti, L.; Matthies, S.; Wenk, H.-R.; Schultz, A.S.; Richardson, J.W. Combined texture and structure analysis of deformed limestone from time-of-flight neutron diffraction spectra. J. Appl. Phys. 1997, 81, 594–600. [Google Scholar] [CrossRef]
  35. Gong, W.; Zheng, R.; Harjo, S.; Kawasaki, T.; Aizawa, K.; Tsuji, N. In-situ observation of twinning and detwinning in AZ31 alloy. J. Magnes. Alloy. 2022, 10, 3418–3432. [Google Scholar] [CrossRef]
  36. Harjo, S.; Gong, W.; Aizawa, K.; Kawasaki, T.; Yamasaki, M.; Mayama, T.; Kawamura, Y. Effect of Extrusion Ratio in Hot-Extrusion on Kink Deformation during Compressive Deformation in an αMg/LPSO Dual-Phase Magnesium Alloy Monitored by In Situ Neutron Diffraction. Mater. Trans. 2023, 64, 766–773. [Google Scholar] [CrossRef]
  37. Čapek, J.; Máthis, K.; Clausen, B.; Stráská, J.; Beran, P.; Lukáš, P. Study of the loading mode dependence of the twinning in random textured cast magnesium by acoustic emission and neutron diffraction methods. Mater. Sci. Eng. A 2014, 602, 25–32. [Google Scholar] [CrossRef]
  38. Agnew, S.R. Deformation Mechanisms of Magnesium Alloys; Woodhead Publishing Limited: Thorston, UK, 2012. [Google Scholar] [CrossRef]
  39. Liu, M.; Diercks, P.; Manzoni, A.; Čížek, J.; Ramamurty, U.; Banhart, J. Positron annihilation investigation of thermal cycling induced martensitic transformation in NiTi shape memory alloy. Acta Mater. 2021, 220, 117298. [Google Scholar] [CrossRef]
  40. Barnett, M.R. Twinning and the ductility of magnesium alloys. Part I: “Tension” twins. Mater. Sci. Eng. A 2007, 464, 1–7. [Google Scholar] [CrossRef]
  41. Pawley, G.S. Unit-cell refinement from powder diffraction scans. J. Appl. Crystallogr. 1981, 14, 357–361. [Google Scholar] [CrossRef]
  42. Rietveld, H.M. Line profiles of neutron powder-diffraction peaks for structure refinement. Acta Crystallogr. 1967, 22, 151–152. [Google Scholar] [CrossRef]
  43. Asoo, K.; Tomota, Y.Y.; Harjo, S.; Okitsu, Y. Tensile behavior of a trip-aided ultra-fine grained steel studied by neutron diffraction. ISIJ Int. 2011, 51, 145–150. [Google Scholar] [CrossRef]
  44. Fukuda, K.; Tomota, Y.; Harjo, S.; Gong, W.; Woo, W.; Seong, B.S.S.; Kuwahara, Y.; Ikuta, F. Residual stresses in steel rod with collar formed by partial diameter-enlarging technique. Mater. Sci. Technol. 2017, 33, 172–180. [Google Scholar] [CrossRef]
  45. Paddea, S.; Francis, J.A.; Paradowska, A.M.; Bouchard, P.J.; Shibli, I.A. Residual stress distributions in a P91 steel-pipe girth weld before and after post weld heat treatment. Mater. Sci. Eng. A 2012, 534, 663–672. [Google Scholar] [CrossRef]
  46. Kröner, E. Berechnung der elastischen Konstanten des Vielkristalls aus den Konstanten des Einkristalls. Z. Phys. 1958, 151, 504–518. [Google Scholar] [CrossRef]
  47. Slutsky, L.J.; Garland, C.W. Elastic constants of magnesium from 4.2°K to 300°K. Phys. Rev. 1957, 107, 972–976. [Google Scholar] [CrossRef]
  48. Clausen, B.; Tomé, C.N.; Brown, D.W.; Agnew, S.R. Reorientation and stress relaxation due to twinning: Modeling and experimental characterization for Mg. Acta Mater. 2008, 56, 2456–2468. [Google Scholar] [CrossRef]
  49. Agnew, S.R.; Mulay, R.P.; Polesak, F.J.; Calhoun, C.A.; Bhattacharyya, J.J.; Clausen, B. In situ neutron diffraction and polycrystal plasticity modeling of a Mg-Y-Nd-Zr alloy: Effects of precipitation on individual deformation mechanisms. Acta Mater. 2013, 61, 3769–3780. [Google Scholar] [CrossRef]
  50. Hielscher, R.; Schaeben, H. A novel pole figure inversion method: Specification of the MTEX algorithm. J. Appl. Crystallogr. 2008, 41, 1024–1037. [Google Scholar] [CrossRef]
  51. Ungár, T.; Stoica, A.D.; Tichy, G.; Wang, X.L. Orientation-dependent evolution of the dislocation density in grain populations with different crystallographic orientations relative to the tensile axis in a polycrystalline aggregate of stainless steel. Acta Mater. 2014, 66, 251–261. [Google Scholar] [CrossRef]
  52. Xie, Q.; Yan, Z.; Yu, D.; An, K.; Yan, X.; Yin, S.; Gillham, B.; Wu, X.; Yang, P.; Zhao, Z.; et al. Crystallographic orientation and spatially resolved damage for polycrystalline deformation of a high manganese steel. Acta Mater. 2022, 226, 117628. [Google Scholar] [CrossRef]
  53. Tomota, Y.; Ojima, M.; Harjo, S.; Gong, W.; Sato, S.; Ungár, T. Dislocation densities and intergranular stresses of plastically deformed austenitic steels. Mater. Sci. Eng. A 2019, 743, 32–39. [Google Scholar] [CrossRef]
  54. Yu, M.; Cui, Y.; Wang, J.; Chen, Y.; Ding, Z.; Ying, T.; Llorca, J.; Zeng, X. Critical resolved shear stresses for slip and twinning in Mg-Y-Ca alloys and their effect on the ductility. Int. J. Plast. 2023, 162, 103525. [Google Scholar] [CrossRef]
Figure 1. (a) Geometric schematic view of the in situ neutron diffraction measurement during the tensile test. (b) Applied true stress–true strain curve of extruded AZ31 with the tensile test.
Qubs 07 00032 g001
Figure 2. (a) Diffraction patterns of extruded AZ31 before deformation in the loading direction and the transverse direction. The extrusion direction is parallel to the loading direction. (b) Inverse pole figure in the loading direction before deformation and (c) that at the applied true strain value of 16.4%.
Qubs 07 00032 g002
Figure 3. Relative integrated intensities of several hk.l peaks in (a,a’) the loading direction and (b,b’) the transverse direction. (c,c’) Lattice strains of several [hk.l] oriented grains in the loading direction.
Qubs 07 00032 g003
Figure 4. Average phase strain values evaluated using the conventional methods and the new proposed method of Equation (7).
Qubs 07 00032 g004
Figure 5. (a) Lattice stress values of several [hk.l] oriented grains and (b) average phase stress values estimated conventionally versus the applied true strains.
Qubs 07 00032 g005
Figure 7. Average phase stress values evaluated using the newly proposed procedure versus (a) the applied true strains and (b) the applied true stresses.
Qubs 07 00032 g007
Figure 8. (a) Lattice strains of the [12.1] and [11.4] oriented grains in the loading direction. Relative integrated intensities of the 12.1 and 11.4 peaks in (b) the loading direction and (c) the transverse direction.
Qubs 07 00032 g008
Figure 9. Distributions of values of the Schmid factor for basal slip, extension twinning, and prismatic slip as functions of χ angle.
Qubs 07 00032 g009
Disclaimer/Publisher’s Note: The statements, opinions and data contained in all publications are solely those of the individual author(s) and contributor(s) and not of MDPI and/or the editor(s). MDPI and/or the editor(s) disclaim responsibility for any injury to people or property resulting from any ideas, methods, instructions or products referred to in the content.

