Article

Scanning Three-Dimensional X-ray Diffraction Microscopy for Carbon Steels

Toyota Central R&D Labs., Inc., 41-1, Yokomichi, Nagakute 480-1192, Japan
*
Author to whom correspondence should be addressed.
Current address: RIKEN SPring-8 Center, 1-1-1 Kouto, Sayo-cho, Sayo-gun 679-5148, Japan.
Quantum Beam Sci. 2023, 7(3), 23; https://doi.org/10.3390/qubs7030023
Submission received: 27 February 2023 / Revised: 7 July 2023 / Accepted: 11 July 2023 / Published: 14 July 2023

Abstract

:
Plastically deformed low-carbon steel has been analyzed by nondestructive three-dimensional orientation and strain mapping using scanning three-dimensional X-ray diffraction microscopy (S3DXRD). However, the application of S3DXRD is limited to single-phase alloys. In this study, we propose a modified S3DXRD analysis for dual-phase alloys, such as ferrite–pearlite carbon steel, which is composed of grains detectable as diffraction spots and a phase undetectable as diffraction spots. We performed validation experiments for ferrite–pearlite carbon steel with different pearlite fractions, in which the ferrite grains and the pearlite corresponded to the detectable grains and an undetectable phase, respectively. The regions of pearlite appeared more remarkably in orientation maps of the ferrite grains obtained from the carbon steel samples than that of the single-phase low-carbon steel and increased with the increase in the carbon concentration. The fractions of the detectable grains and the undetectable phase were determined with an uncertainty of 15%–20%. These results indicate that the proposed modified analysis is qualitatively valid for dual-phase alloys comprising detectable grains and an undetectable phase.

1. Introduction

Predicting damage and failure in polycrystalline alloys, which are widely used in various industries, is challenging due to not only the difficulty in modeling the dynamics of numerous dislocations in hierarchical microstructures with a length scale ranging from nanometers to millimeters or more but also the lack of suitable geometric models of three-dimensional (3D) microstructures and validation data for the mechanical responses. Three-dimensional polycrystalline microstructures can be reconstructed by fully automated serial sectioning [1,2] with the aid of 3D orientation microscopy (OM) based on electron backscatter diffraction (EBSD) [3]. The distribution of geometrically necessary dislocations can also be determined by postprocessing the EBSD OM data. In addition, high-angular resolution EBSD (HR-EBSD) can detect local elastic strains [4]. However, mechanical responses, such as plastic deformation, creep, fatigue, and fracture, cannot be tracked by destructive serial-sectioning microscopy.
In the past two decades, nondestructive 3D OM and strain mapping for polycrystalline alloys have been achieved using synchrotron-based X-ray diffraction (XRD) and imaging methods, such as differential aperture X-ray microscopy (DAXM) [5,6,7,8,9,10,11,12,13], diffraction contrast tomography (DCT) [14,15,16,17,18,19,20], 3D XRD microscopy (3DXRD) [21,22,23,24,25,26,27,28,29,30,31,32,33,34,35,36,37,38,39,40,41,42,43], high-energy diffraction microscopy (HEDM) [44,45,46,47,48,49,50,51,52,53,54,55,56,57,58,59,60,61,62,63,64,65,66], and scanning 3DXRD [67,68,69,70,71,72,73,74,75,76,77]. DAXM uses a focused polychromatic X-ray beam and a far-field area detector to obtain Laue diffraction patterns from multiple grains. Three-dimensional OM can be performed without serial sectioning by scanning a platinum wire near the sample surface and applying indexing for multiple grains (multigrain indexing) to the Laue diffraction patterns. Although, in DAXM, sample rotation is unnecessary, and the spatial resolution is determined by the incident beam size, nondestructive OM is limited to subsurface grains because polychromatic X-ray illumination of numerous grains causes a considerable overlap of diffraction spots on the detector.
In DCT, 3DXRD, HEDM, and scanning 3DXRD with high-energy monochromatic X-ray beams, 3D OM is performed by detecting diffracted beams from multiple grains deeply embedded in a sample. These XRD and imaging methods differ in terms of the shape of the incident X-ray beam and the spatial resolution of the detector. In DCT, a box beam illuminates a polycrystalline sample, and diffracted beams from grains are detected using a near-field area detector with high spatial resolution. A 3D grain map can be obtained by applying a forward projection model to the diffraction patterns obtained from a single rotation scan. Although, in DCT, a 3D grain map can be obtained from a single rotation scan, its application is limited to lightly deformed samples with slight intragranular misorientation. This is because it is difficult to achieve a 3D reconstruction for heavily-deformed samples owing to the overlap of diffraction spots and the peak broadening caused by intragranular misorientation.
In 3DXRD and HEDM, a line-focused beam illuminates a sample, and the diffraction patterns are obtained by a layer-by-layer scan (with sample rotations) using near- and far-field area detectors. A 3D orientation map can be obtained from 3DXRD scan data by applying layer-by-layer multigrain indexing on diffraction spots from the far-field detector and then layer-by-layer reconstruction of the grain positions and shapes with or without intragranular misorientation by applying ray tracing, an algebraic reconstruction technique, or forward modeling to the diffraction patterns from the near-field detector. Compared with DCT, 3DXRD can obtain orientation maps with intragranular misorientation caused by plastic deformation. Thus, 3DXRD and HEDM have enabled 3D orientation mapping with mechanical responses such as slip and twin deformation, shock deformation, creep, fatigue, and fracture. However, 3DXRD and HEDM have been performed on small samples such as matchstick-like samples, wire materials, or miniature test pieces to suppress the overlap of broadened diffraction spots.
In scanning 3DXRD, a point-focused (or pencil) beam is irradiated on a sample, far-filed diffraction patterns are obtained from 3D scans with sample rotations and translations, and a 3D orientation map with intragranular misorientation can be obtained by applying voxel-by-voxel multigrain indexing to the scanning 3DXRD data. In scanning 3DXRD, the number of illuminated grains is reduced using the point-focused beam, thus suppressing the overlap of diffraction spots. In addition, the measurement using a far-field detector can be combined with a conical slit [78]. The conical slit can considerably reduce the overlap of the diffraction spots by shielding the detector from the diffracted beams of many grains except for those from grains inside the region of interest called the gauge volume. Therefore, scanning 3DXRD with a conical slit is most suitable for samples with numerous strained grains at the expense of the scanning time.
One of next key steps of scanning 3DXRD is its application to dual-phase alloys. Ferrite–pearlite carbon steel hardenable by quenching has wide applications due to its low cost, and the ferrite–martensite dual-phase steel is used in the automotive industry owing to its balance between ductility and strength. In most XRD OM experiments, diffraction spots from nondeformed ferrite grains are detectable, and boundaries between the ferrite grains can be reconstructed. Therefore, nondestructive 3D orientation and strain mapping of single-phase low-carbon steel consisting of ferrite grains have been achieved [73]. Hereafter, we refer to ferrite grains as visible grains. Pearlite and martensite correspond to invisible phases because the diffraction spots cannot be detected from pearlite and martensite in XRD OM. In nondestructive tomographic XRD OM techniques (DCT, 3DXRD, HEDM, and scanning 3DXRD), invisible phases cause reconstruction errors, visible grains may abnormally grow into the regions of invisible phases, and in the worst case, the regions of invisible phases can disappear.
In this study, we propose a modified scanning 3DXRD analysis that can be applied to dual-phase alloys containing an invisible phase, such as ferrite–pearlite carbon steel. In this analysis, we introduced the threshold of completeness as a reconstruction parameter, where completeness represents the probability of the existence of visible grains. Herein, we performed qualitative validation using ferrite–pearlite carbon steel with different pearlite fractions by comparing the fractions of visible grains in the obtained orientation maps.

2. Materials and Methods
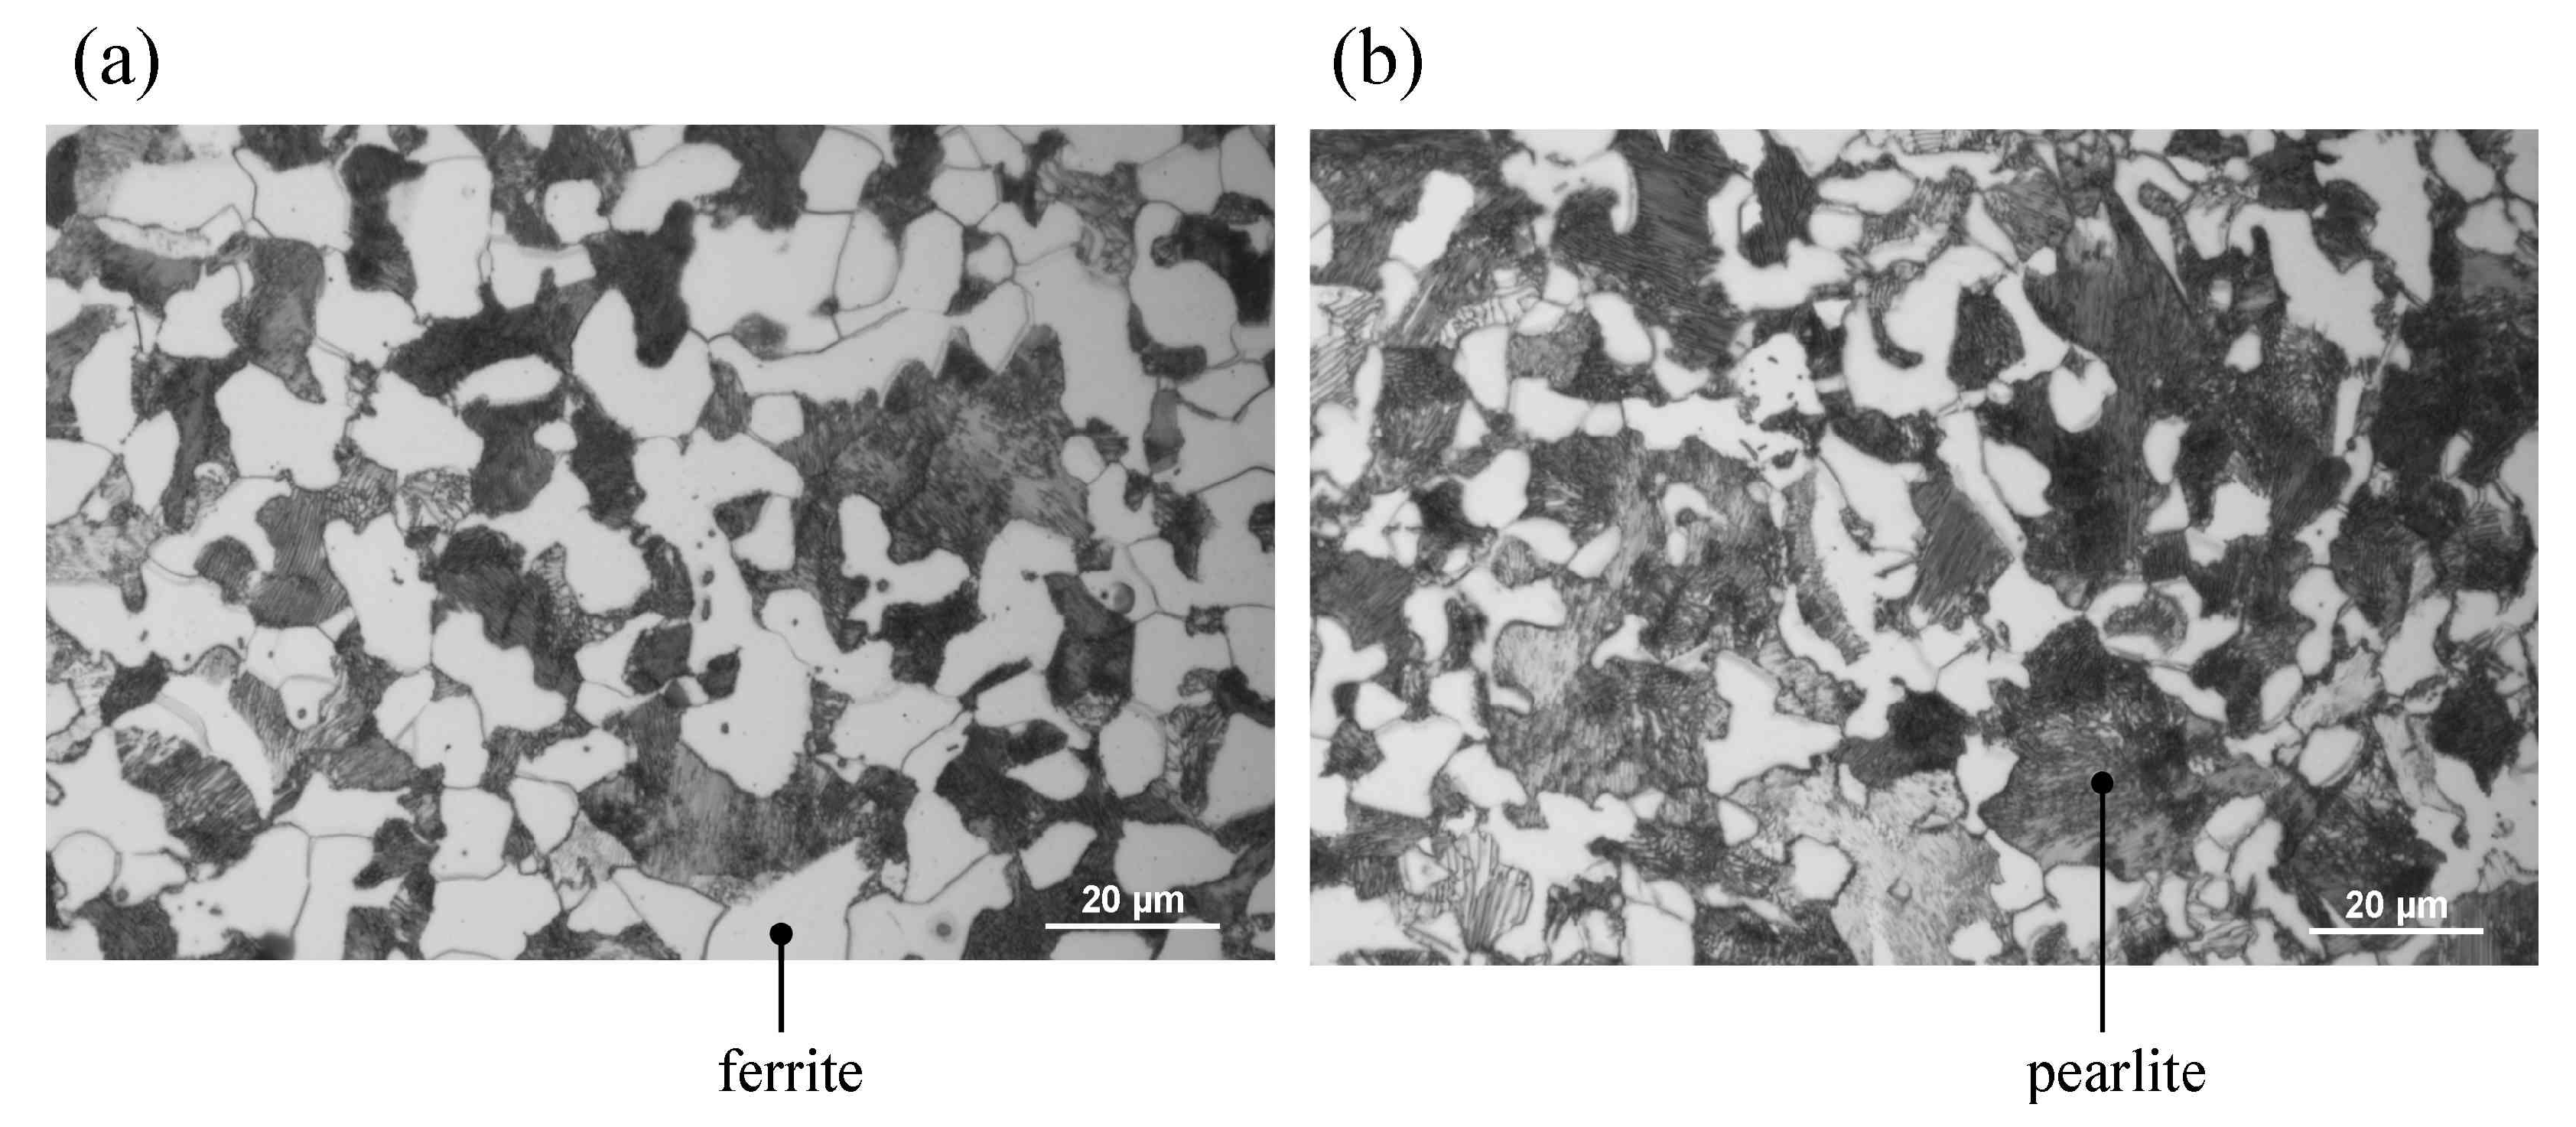
2.1. Materials

A ferrite single-phase low-carbon steel sample was obtained from a commercial cold-rolled steel sheet defined by Japanese industrial standards (JIS) G3141. A uniaxial sheet tensile-test piece with a width of 1 mm at the gauge section was cut from a 1 mm thick cold-rolled steel sheet using a wire cutter. The sheet tensile-test piece was used as a ferrite single-phase low-carbon steel sample because the fine spheroidal cementite particles in ferrite grains can be neglected.
Ferrite–pearlite carbon steel samples were obtained from commercial round bar-shaped carbon steel defined as S15C, S25C, S35C, and S45C by JIS G4051 to apply the proposed analysis to commercially available alloys. The carbon contents of S15C, S25C, S35C, and S45C are defined as 0.13–0.18, 0.22–0.28, 0.32–0.38, and 0.42–0.48 wt%, respectively. The carbon contents indicate that the pearlite fraction of S45C is higher than that of S35C, as shown in Figure 1. From the carbon contents defined by JIS G4051, the pearlite fraction of S35C is higher than that of S25C, which is higher than that of S15C. The round bars were cut into uniaxial round-bar tensile-test pieces with a 1 mm diameter at the gauge section using a wire cutter. The S15C, S25C, S35C, and S45C samples were used as ferrite–pearlite carbon steel samples with different pearlite fractions.

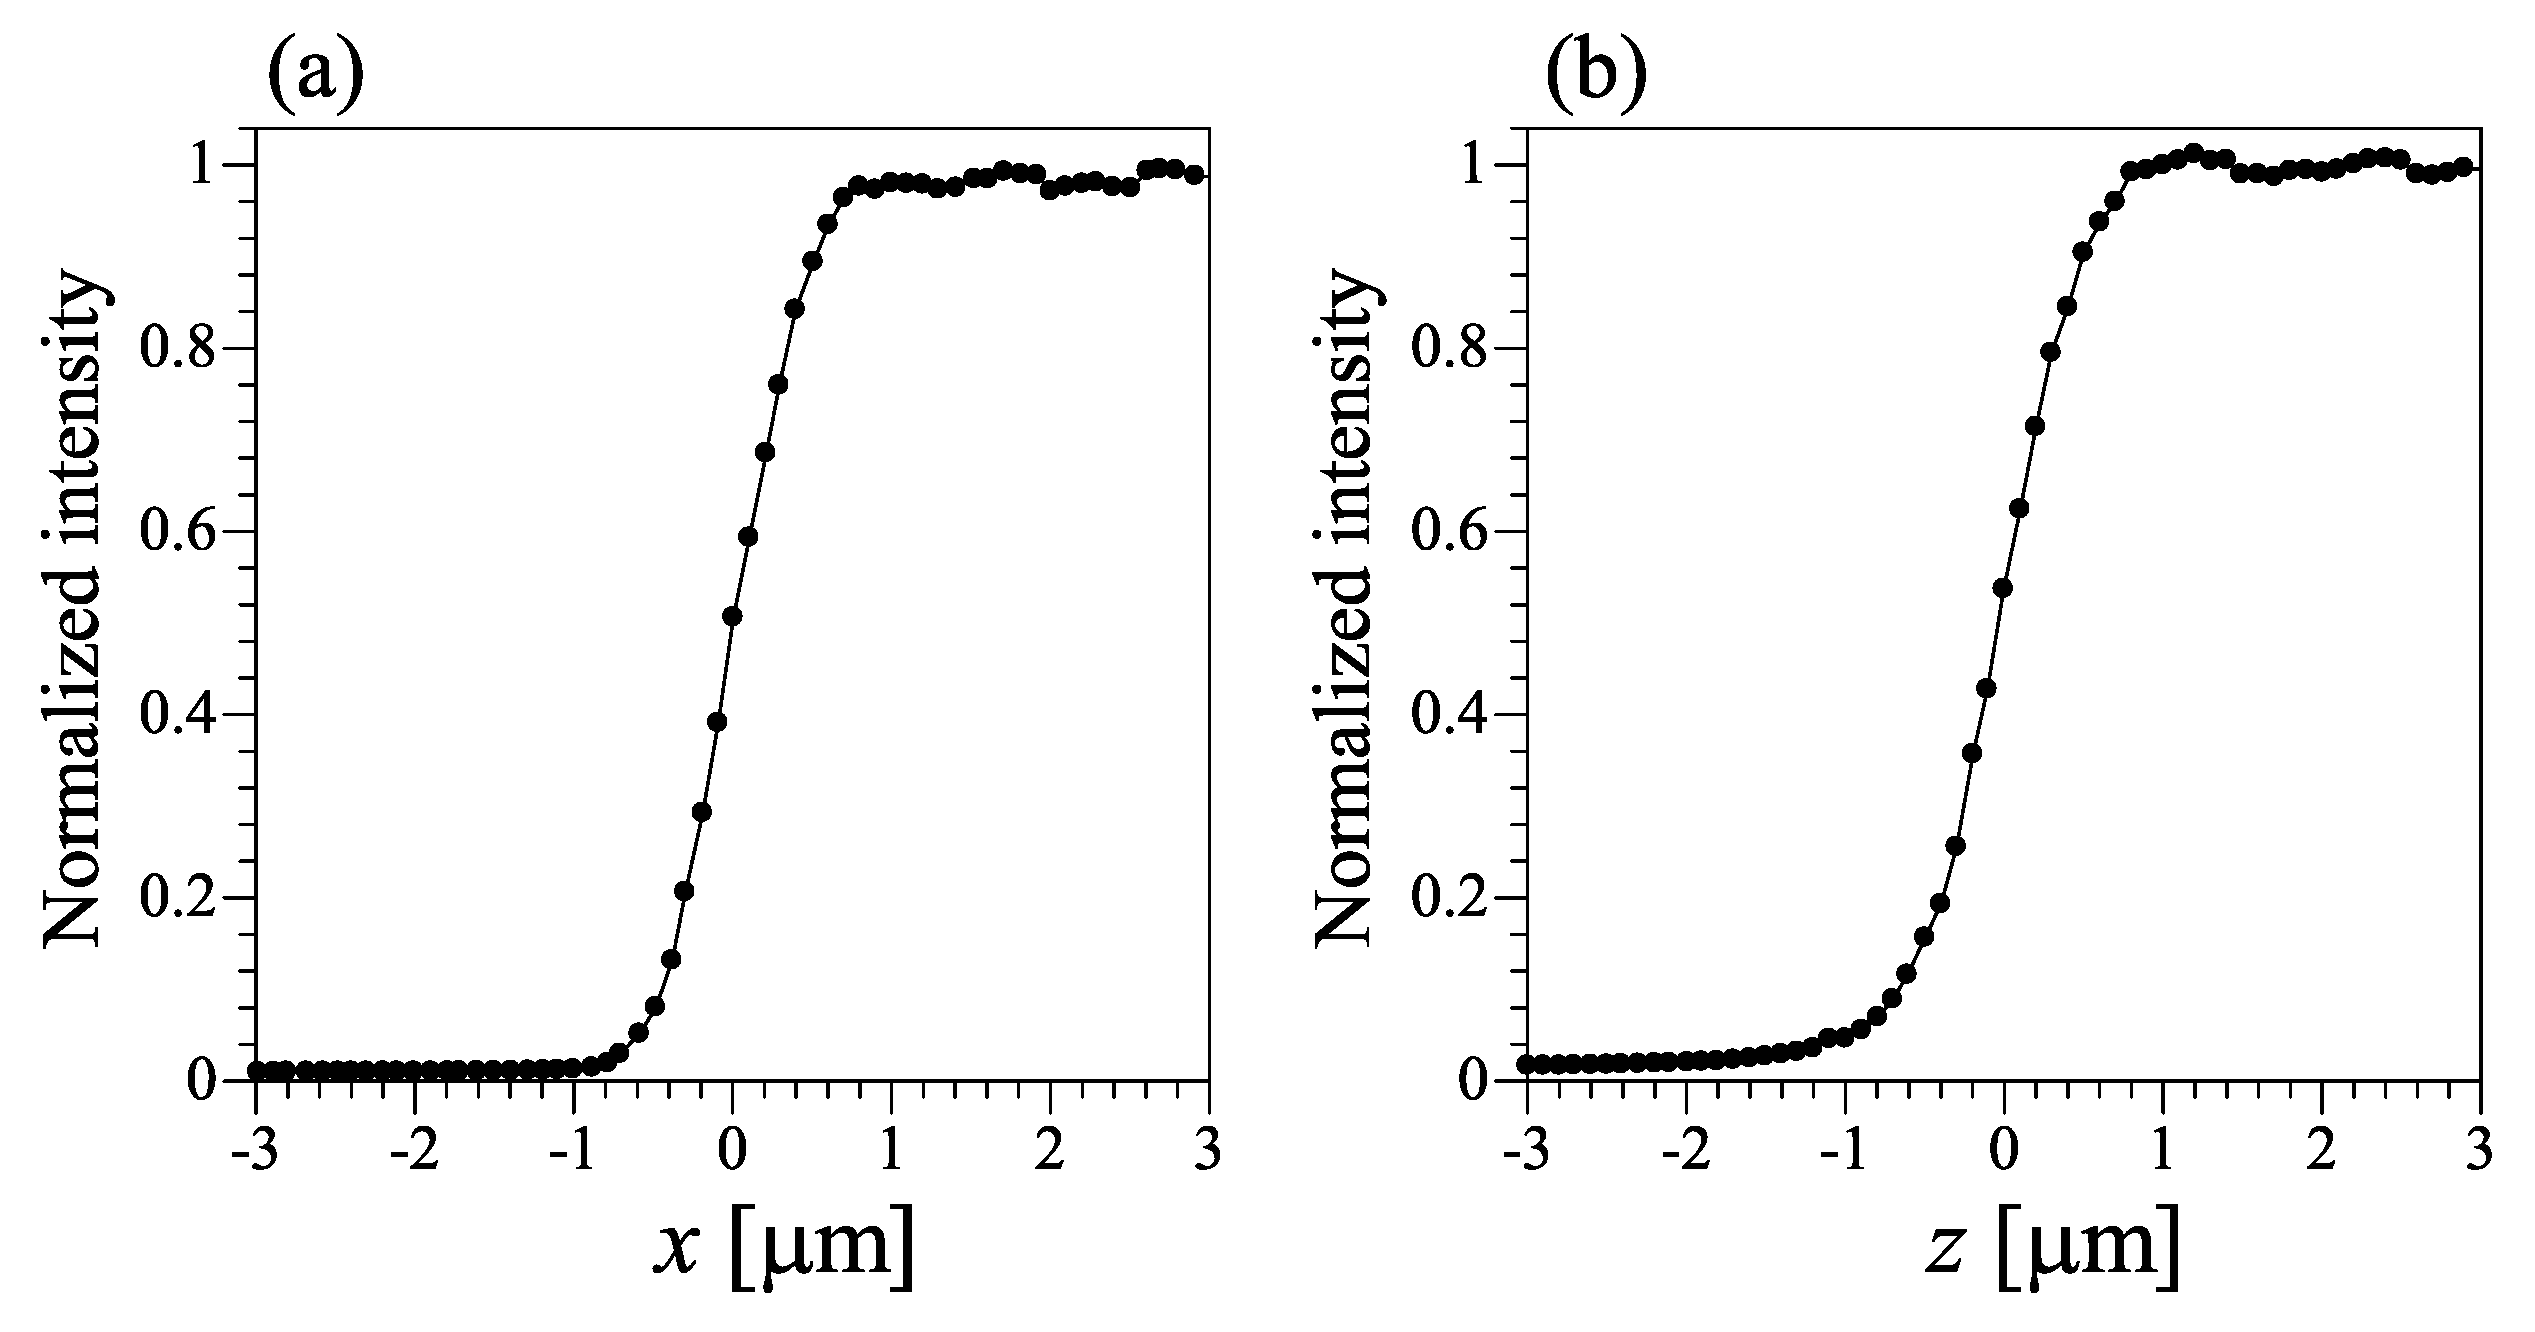
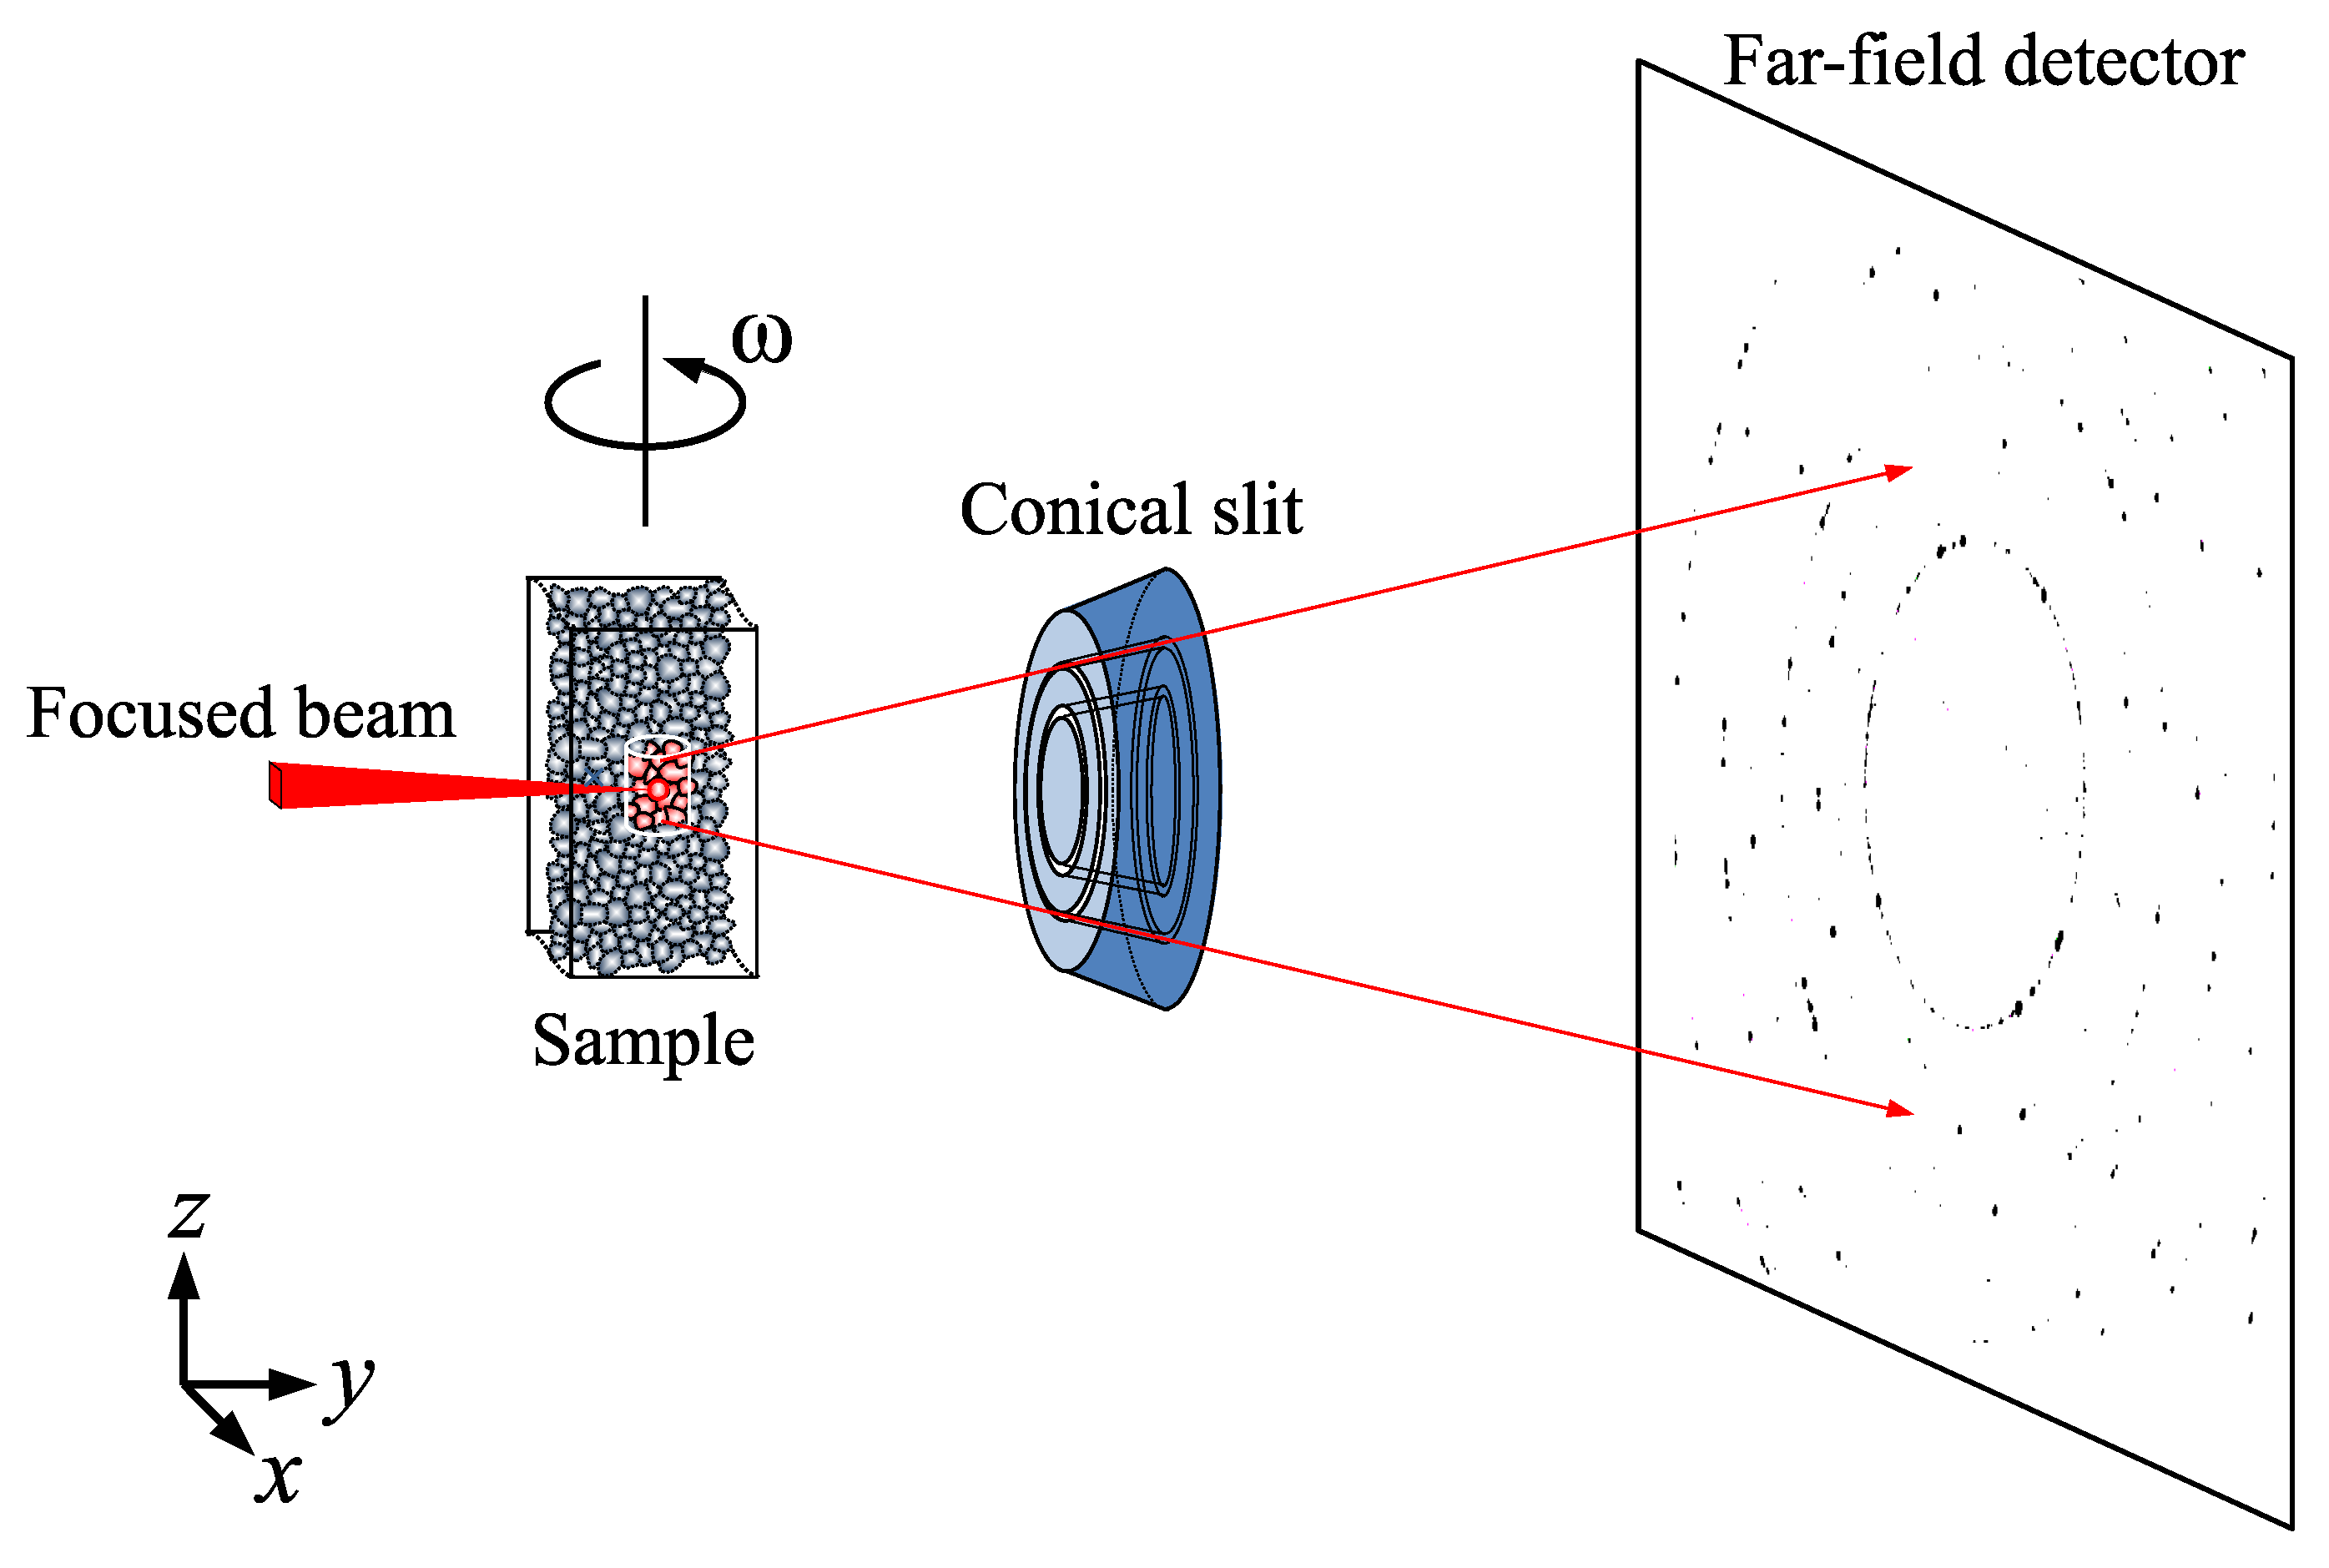
2.2. Data Acquisition

We conducted experiments using a scanning 3DXRD apparatus equipped with X-ray-focusing mirrors at BL33XU of SPring-8. Radiation from an in-vacuum undulator was monochromatized with a Si(311) double crystal monochromator to a monochromatic X-ray beam with 50 keV of photon energy. The monochromatic beam was focused with 400 mm long Pt-coated Kirkpatrick-Baez mirrors into a beam size of ∼ 1 × 1 μ m 2 , as shown in Figure 2. The X-ray microbeam was irradiated on the gauge section of the sample mounted on the rotation stage with the longitudinal direction of the sample parallel to the z axis and the incoming microbeam parallel to the y axis (Figure 3). A conical slit [78] was placed 50 mm away from the sample to prevent the detection of diffracted beams from grains outside the gauge volume. The aperture of the conical slit was 30–110 μ m, depending on the Bragg angles. The Bragg angles of the conical slit were 3.506°, 4.958°, 6.074°, 7.014°, 7.844°, 8.594°, and 9.284° for the 110, 200, 211, 220, 310, 222, and 321 reflections of α -Fe and 50 keV. The designed lengths of the gauge volume in the y axis were 330–360 μ m. An X-ray flat-panel detector (2923NDT, Dexela) with an active image area of 291 × 230 mm 2 and a pixel size of 150 × 150 μ m 2 at a 2 × 2 binning mode was placed downstream of the conical slit as the far-field detector. The sample was rotated at a constant speed along the z axis. The rotation speed was 16 s 1 for the S45C sample and 20 s 1 for the other samples. Images from the detector were recorded every 0.6 during the sample rotation of ω = 0 –180 . The exposure time per image was 38 and 30 ms for the S45C and the other samples, respectively. The diffracted beams that passed through the conical slit were recorded as diffraction spots on the images. When ω reached 180 , the sample was translated by 1 μ m in the x direction using the translation stage located below the ω rotation stage. This procedure was repeated for an x range of x m x x m , where x m is 150 μ m for the low-carbon steel sample and 100 μ m for the carbon steel samples. Thus, diffraction images containing diffraction spots from ferrite grains were recorded as a function of ω and x. From the two-dimensional (2D) ω x scan data, a 2D orientation map with a voxel size of 1 μ m and a field of view (FoV) of 2 x m in diameter in the x y plane was obtained. On the orientation map, ferrite grains and pearlite correspond to the visible grains and the invisible phase, respectively (Optionally, a 3D orientation map can be obtained by stacking the 2D orientation maps.)

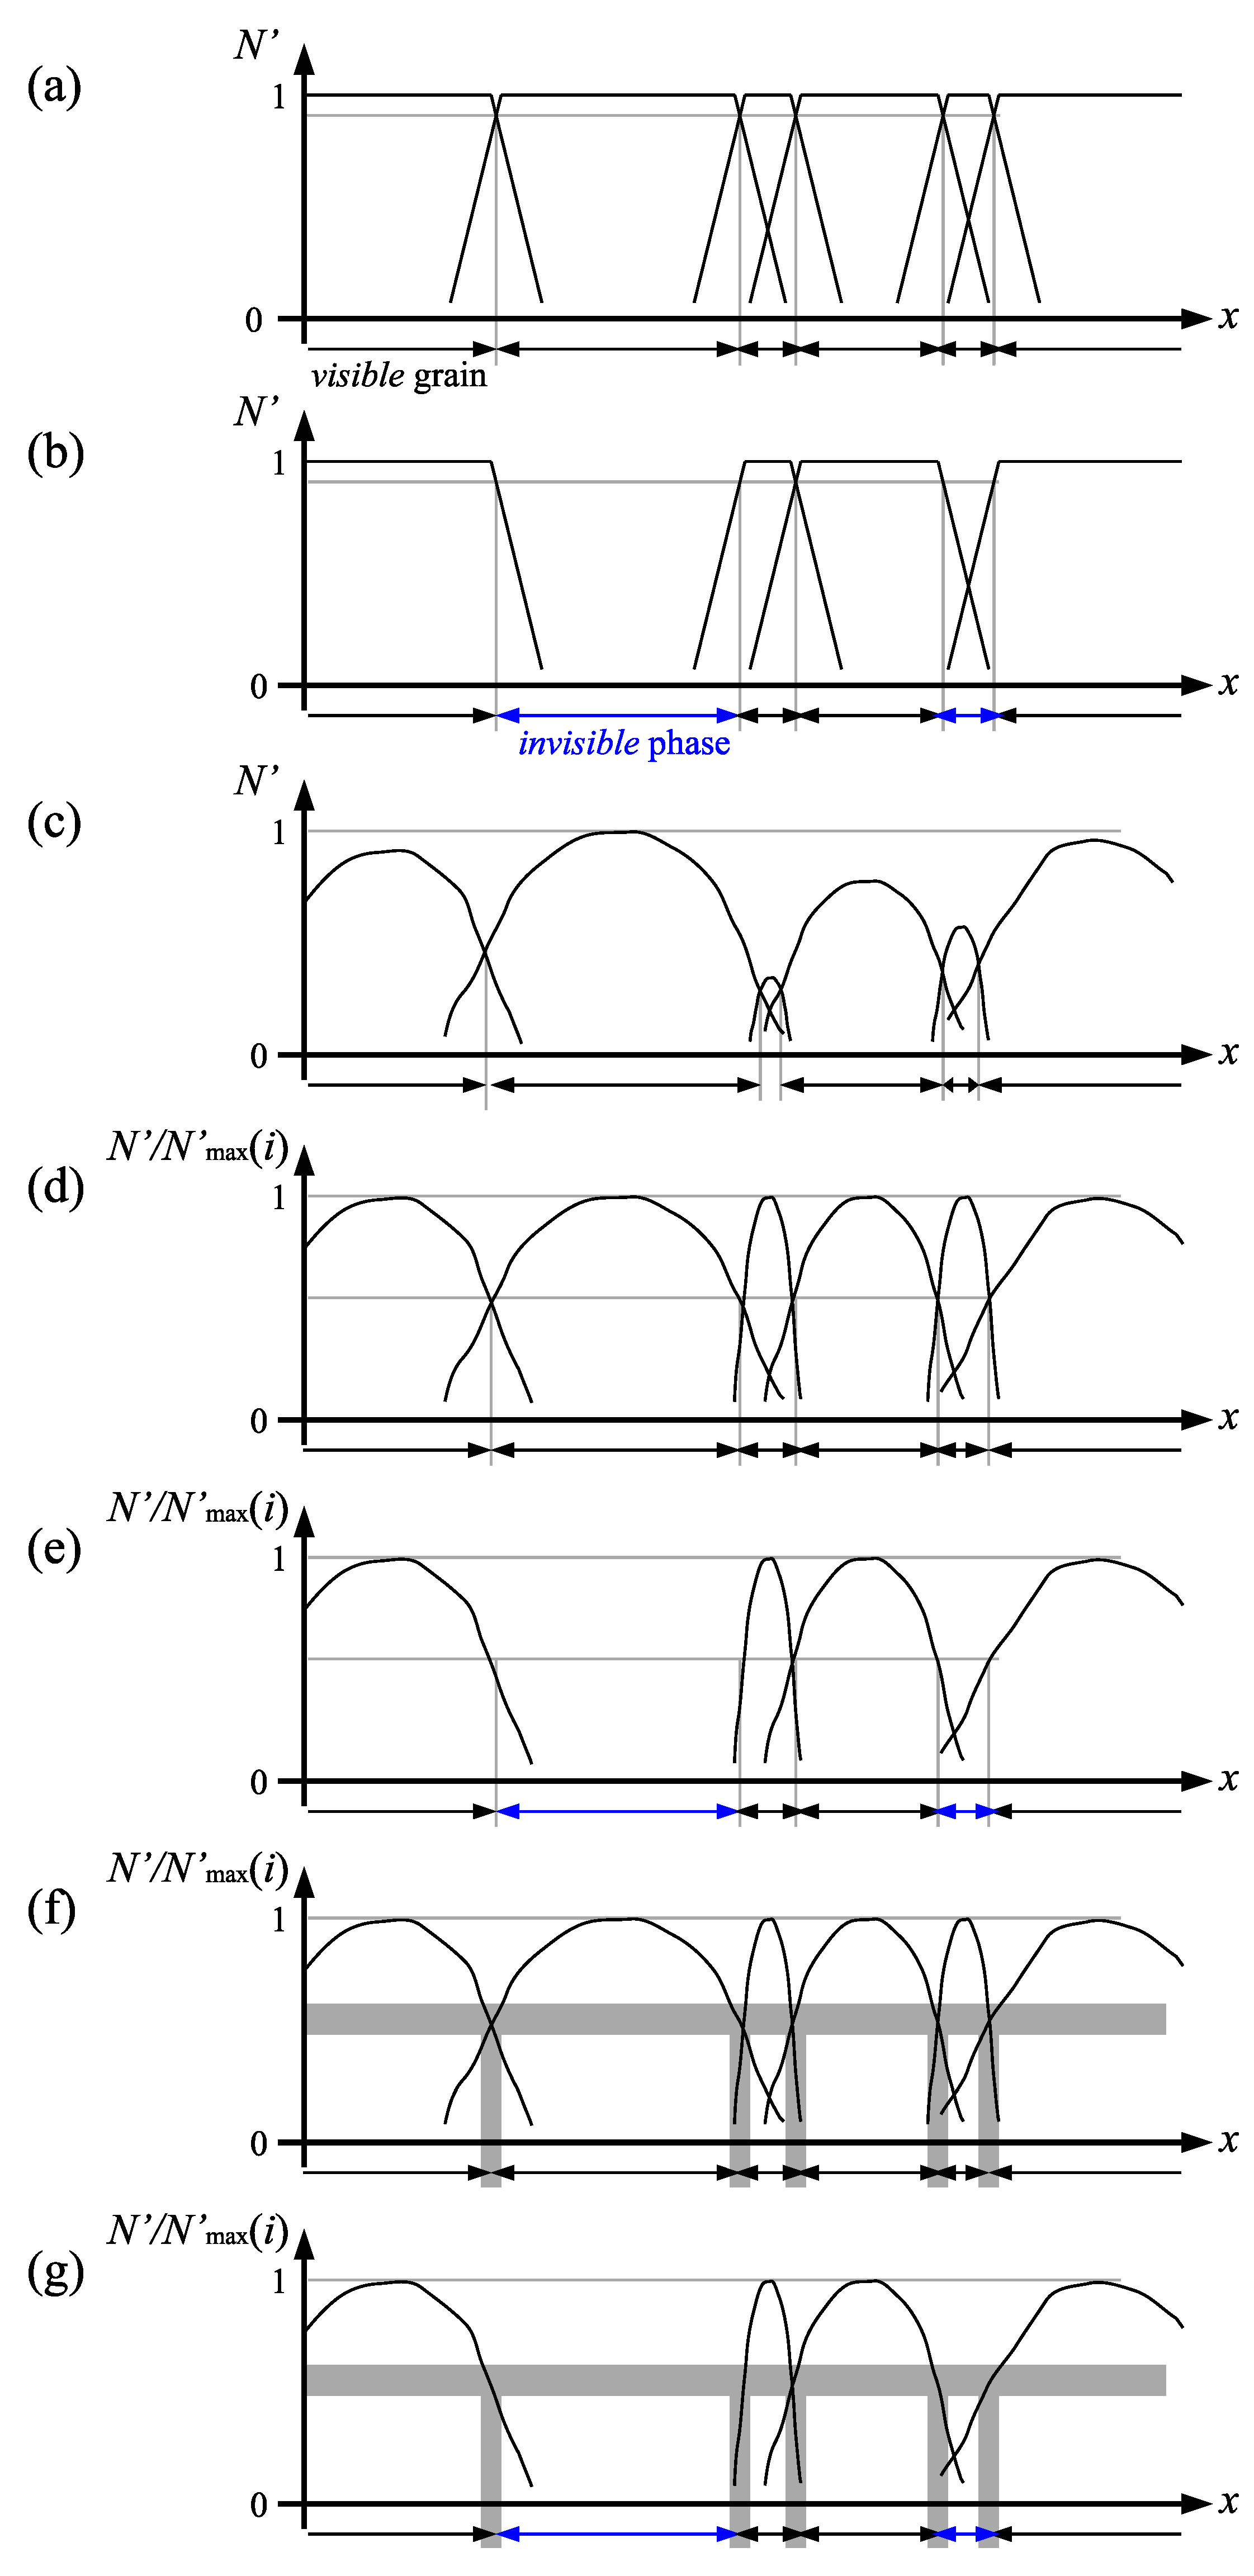
2.3. Concept of Modified Completeness

The modified completeness is based on the completeness N/ M = N of the conventional scanning 3DXRD [69], where N is the number of detected diffraction spots for a visible grain, and M is the theoretically expected maximum of N. The completeness represents the probability of the existence of visible grains. Generally, the completeness curves of individual grains are continuously distributed from the inside to the outside of the grains. The grain boundaries between the visible grains appear where neighboring completeness curves cross each other. In ideal cases, without experimental errors, N is almost 1 inside the visible grains and sharply drops outside the grains (Figure 4a). Then, the grain boundaries can be determined even for a sample containing an invisible phase (Figure 4b). In real cases, however, N may not be up to 1 and gradually decreases from the center of grains to the outside of the grains owing to the insufficient diffraction intensities, the insufficient quantum efficiency, and the noise of the detector, as well as the short exposure time (Figure 4c). These experimental limitations result in orientation maps with reconstruction errors or artifacts, in which small grains close to large grains shrink or disappear, large grains close to small grains grow, and the concave and convex shapes of grains disappear. As artifacts exist more in samples containing an invisible phase, we propose N / N max ( i ) as the modified completeness, where the denominator N max (i) is the maximum of N of each grain, and i indicates that N max depends on the i-th grain. Using the modified completeness, the artifacts can be reduced (Figure 4d). Thus, we introduce the threshold of completeness N th , which allows the reconstruction of grain boundaries between the visible grains and the invisible phase (Figure 4e). In real cases with experimental errors, the completeness threshold may not be determined for all the visible grains in the FoV, resulting in uncertainties in the completeness threshold and the positions of the grain boundaries between the visible grains (Figure 4f), as well as the boundaries between the visible grains and the invisible phase (Figure 4g).

2.4. Data Analysis

From the obtained ω x scan data, the conventional completeness N / M = N was evaluated for each voxel and the visible grains using the conventional scanning 3DXRD method [69]. N and M were calculated with I m a g e D 11 [79] and P o l y X S i m [80] software, respectively. Thereafter, each visible grain was extracted using the map of N as follows. First, a voxel was randomly selected from the map. Among the candidate grains at the selected voxel, the grain with the highest N was selected. Next, the misorientation between the grain at the selected voxel and those at the first neighboring voxels was calculated. If the misorientation was less than 2 as intragranular misorientation, the grain at the selected voxel and those at the first neighboring voxels were considered the same. This was also applied to the misorientation between the first and second neighboring voxels. The above steps were repeated until there was no new neighboring voxel. If the number of voxels regarded as voxels in the same grain was greater than the threshold of a grain size, the voxels were extracted as a single grain existing in the x y plane illuminated by the focused X-ray microbeam because a large neighboring grain in the z direction may appear as a minute grain due to the tail of the microbeam in the z direction (Figure 2b). Then, the extracted grain was deleted from the original map. The normalization factor N max was evaluated for the extracted single grain, and the distribution of completeness N (x, y) / N max for the grain was determined. Next, a voxel was randomly selected from the map from which a single grain was deleted, and then another single grain was extracted. The extractions of single grains were repeated until no new grains were found. Thus, an orientation map with information about the completeness of each grain was obtained.

3. Results

Figure 5 shows the orientation maps of the single-phase low-carbon steel sample with different completeness thresholds ( N th ). The orientation is represented by the z direction in the basic triangle of the pole figure of α -Fe. The colored pixels with orientation information and the uncolored white pixels indicate the regions above and below the completeness thresholds, respectively. On the maps with N th = 0.98–0.99, the centers of the visible grains appeared, but the grain boundaries could not be observed. On the maps with N th = 0.94–0.96, the grain boundaries were visible, except for the grain-boundary triple points. On the maps with N th = 0.89–0.92, the grain-boundary triple points were visible. These results showed that the optimal completeness threshold for most grain boundaries ranged from 0.90 to 0.95, and there was an uncertainty of about 0.05 for the optimal completeness threshold. On the map with N th = 0.85 , the grain-boundary triple points were clear, and the fraction of visible grains was more than 99% (Figure 5g). On the map with N th = 0.85 , the ferrite grains are indicated by regions enclosed by the same orientation (or the same color), and the grain boundaries are indicated by the boundaries between the different orientations (or different colors). Polygonal grains and clear grain boundaries, which are common for annealed single-phase polycrystalline metals and alloys, were observed. The regions of less than 1% at some grain boundaries and particularly the grain-boundary triple points are indicated by the uncolored regions below the threshold, suggesting reconstruction errors rather than an invisible phase owing to insufficient diffraction intensities.
Figure 6, Figure 7, Figure 8 and Figure 9 show orientation maps with completeness thresholds obtained from the S15C, S25C, S35C, and S45C carbon steel samples, respectively. The samples showed a similar relationship between the formation of the grain boundaries and N th , except for the fractions of the visible grains. For the same threshold, the fraction of the visible grains decreased in the order of S15C, S25C, S35C, and S45C. At N th = 0.85 , the fractions of the visible grains were 94%, 91%, 82%, and 58% for the S15C, S25C, S35C, and S45C samples, respectively, which were much smaller than that of the low-carbon steel sample. Therefore, the uncolored regions below N th = 0.85 in the carbon steel samples were attributed to pearlite.
Figure 10 shows the variation in the fraction of the visible grains with the completeness threshold. In the N th range of 0.85–0.95, the fraction of the visible grains decreased with the carbon concentration in the order of S15C, S25C, S35C, and S45C. This result qualitatively validates the concept of modified completeness and its threshold. The uncertainty of 0.05 for the optimal completeness threshold corresponded to an uncertainty of 15%–20% for the fraction of visible grains at an optimal N th range of 0.90–0.95. The fractions of the ferrite grains determined from the optical photographs (55% and 33% for the S35C and S45C carbon steel samples) corresponded to an N th of 0.93–0.94. The fraction of the visible grains in the low-carbon steel sample exceeded 85% at N th = 0.93–0.94. These results were consistent with the uncertainties in the fractions of the visible grains and the optimal completeness threshold.
When N th was reduced from 0.99 to 0.94, the fraction of the visible grains in the low-carbon steel sample increased sharply, reaching a plateau in the N th range of 0.89–0.94. This saturation point of the fraction curve at N th = 0.94 corresponded to N th , at which most of the visible grain boundaries were formed, except for the grain-boundary triple points. Although the saturation point became unclear in the order of S15C, S25C, S35C, and S45C samples, it was obvious at the same threshold of N th = 0.94 for the low-carbon steel sample and the S15C and S25C carbon steel samples.

4. Discussion

The concept of modified completeness and its threshold were quantitatively validated. However, there were two major discrepancies between the expected and obtained results: (1) the fractions and (2) the shapes of the visible grains. The reconstruction of the former was limited due to the uncertainty of 0.05 for the completeness threshold, which corresponds to the uncertainty of 15–20% for the fractions of the visible grains. This is the main limitation of using a simple definition of completeness and a single threshold value for all grain boundaries. For more quantitative reconstruction, there is a need for more sophisticated methods, such as forward modeling, which demands much higher computational costs compared with the proposed analysis method based on multigrain indexing using a simple definition of completeness and a single threshold value for all grain boundaries.
In the optimal N th range of 0.90–0.95, the fraction of the visible grains was 80–90% for the single-phase low-carbon steel sample. The uncolored regions below N th = 0.95 were mostly located at the grain-boundary triple points, indicating that the grain shapes at the optimal threshold were limited to round shapes compared with the polygonal shapes of the visible grains. The discrepancy in the grain shapes was also observed in the optical photograph and the obtained orientation map for the S45C carbon steel sample. The reproducibility of the shapes of the visible grains follows the performance of conventional scanning 3DXRD, in which concave and convex grain shapes disappear even for the single-phase low-carbon sample. These artifacts yield round visible grains.
The artifacts in the shapes of the visible grains can also be attributed to experimental errors. In ideal cases, without experimental errors, N is 1 in the visible grains and drops sharply outside the grains. In real cases, insufficient diffraction intensities result in blurred grain boundaries, which cause coarsening (or shrinking) of grains and more uncertainty in the optimal completeness threshold.
We infer that these limitations caused an uncertainty of 0.05 for the optimal threshold and 15–20% for the fractions of the visible grains. Considering the uncertainty, the optimal threshold can be defined by the threshold at the saturation point of the visible-grain fraction curve at the expense of the polygonal grain shapes because most visible grain boundaries are formed at the saturation point, except for the grain-boundary triple points. Although the saturation point was unclear for the carbon steel samples with large pearlite fractions, it was obvious for the carbon steel samples with small pearlite fractions. Thus, the optimal threshold can be determined using not only single-phase alloys but also alloys with small fractions of invisible phases as reference samples even for alloys with large fractions of invisible phases.

5. Conclusions

We propose a modified scanning 3DXRD as a nondestructive OM method applicable to dual-phase alloys, such as ferrite–pearlite carbon steel, in which ferrite grains and pearlite correspond to the visible grains and an invisible phase because the diffraction spots from ferrite grains are detectable, whereas those from the pearlite are not. We defined N / N max ( i ) as the modified completeness and introduced its threshold N th for the visible grains, where the number of detected diffraction spots from each visible grain, N , was normalized by the maximum value of N of the i-th grain ( N max ( i ) ). In the proposed modified analysis, N th was determined as the completeness at the boundaries between the visible grains and applied to all the visible grains close to the invisible phase, which allowed the reconstruction of the boundaries between the visible grains and the invisible phase. The concept of modified completeness and its threshold was validated with an uncertainty of 15%–20% for the fraction of visible grains from the orientation maps of ferrite single-phase and ferrite–pearlite carbon steel with different pearlite fractions. The main limitations for more quantitative reconstruction are attributed to the uncertainty for the determination of N th for all the visible grains and the artifacts resulting in round visible grains.

Author Contributions

Y.H. designed the research and performed the experiments and analysis. H.K. managed the research. All authors discussed the results and wrote the manuscript. All authors have read and agreed to the published version of the manuscript.

Funding

This research received no external funding.

Data Availability Statement

The data presented in this manuscript are available on request from the corresponding author. The data are not publicly available due to the policy of the authors’ affiliation (an incorporated company).

Acknowledgments

Synchrotron radiation experiments were performed at the BL33XU beamline of SPring-8 with the approval of the Japan Synchrotron Radiation Institute (Proposal Nos. 2016A7002 and 2016B7002.

Conflicts of Interest

The authors declare no conflict of interest.

References

  1. MacSleyne, J.; Uchic, M.D.; Simmons, J.P.; De Graef, M. Three-dimensional analysis of secondary γγ′ precipitates in René-88 DT and UMF-20 superalloys. Acta Mater. 2009, 57, 6251–6267. [Google Scholar] [CrossRef]
  2. Rowenhorst, D.J.; Lewis, A.C.; Spanos, G. Three-dimensional analysis of grain topology and interface curvature in a β-titanium alloy. Acta Mater. 2010, 58, 5511–5519. [Google Scholar] [CrossRef]
  3. Adams, B.L. Orientation imaging microscopy: Emerging and future applications. Ultramicroscopy 1997, 67, 11–17. [Google Scholar] [CrossRef]
  4. Vermeij, T.; De Graef, M.; Hoefnagels, J. Demonstrating the potential of accurate absolute cross-grain stress and orientation correlation using electron backscatter diffraction. Scr. Mater. 2019, 162, 266–271. [Google Scholar] [CrossRef] [Green Version]
  5. Larson, B.C.; Yang, W.; Ice, G.E.; Budai, J.D.; Tischler, J.Z. Three-dimensional X-ray structural microscopy with submicrometre resolution. Nature 2002, 415, 887–890. [Google Scholar] [CrossRef] [PubMed]
  6. Ice, G.E.; Larson, B.C.; Yang, W.; Budai, J.D.; Tischler, J.Z.; Pang, J.W.L.; Barabash, R.I.; Liu, W. Polychromatic X-ray microdiffraction studies of mesoscale structure and dynamics. J. Synchrotron Rad. 2005, 12, 155–162. [Google Scholar] [CrossRef]
  7. Levine, L.E.; Larson, B.C.; Yang, W.; Kassner, M.E.; Tischler, J.Z.; Delos-Reyes, M.A.; Fields, R.J.; Liu, W. X-ray microbeam measurements of individual dislocation cell elastic strains in deformed single-crystal copper. Nat. Mater. 2006, 5, 619–622. [Google Scholar] [CrossRef]
  8. Barabash, R.I.; Ice, G.E.; Liu, W.; Barabash, O.M. Polychromatic microdiffraction characterization of defect gradients in severely deformed materials. Micron 2009, 40, 28–36. [Google Scholar] [CrossRef]
  9. Larson, B.C.; Levine, L.E. Submicrometre-resolution polychromatic three-dimensional X-ray microscopy. J. Appl. Crystallogr. 2013, 46, 153–164. [Google Scholar] [CrossRef]
  10. Guo, Y.; Collins, D.M.; Tarleton, E.; Hofmann, F.; Tischler, J.; Liu, W.; Xu, R.; Wilkinson, A.J.; Britton, T.B. Measurements of stress fields near a grain boundary: Exploring blocked arrays of dislocations in 3D. Acta Mater. 2015, 96, 229–236. [Google Scholar] [CrossRef] [Green Version]
  11. Zhang, C.; Li, H.; Eisenlohr, P.; Liu, W.; Boehlert, C.J.; Crimp, M.A.; Bieler, T.R. Effect of realistic 3D microstructure in crystal plasticity finite element analysis of polycrystalline Ti-5Al-2.5Sn. Int. J. Plast. 2015, 69, 21–35. [Google Scholar] [CrossRef] [Green Version]
  12. Yu, T.; Du, Y.; Fan, G.; Barabash, R.; Juul Jensen, D.; Zhang, Y. In Situ synchrotron X-ray micro-diffraction investigation of elastic strains in laminated Ti-Al composites. Metals 2021, 11, 668. [Google Scholar] [CrossRef]
  13. Zhang, Y.; Yu, T.; Xu, R.; Thorborg, J.; Liu, W.; Tischler, J.; Godfrey, A.; Juul Jensen, D. Local residual stresses and microstructure within recrystallizing grains in iron. Mater. Charact. 2022, 191, 112113. [Google Scholar] [CrossRef]
  14. King, A.; Johnson, G.; Engelberg, D.; Ludwig, W.; Marrow, J. Observations of intergranular stress corrosion cracking in a grain-mapped polycrystal. Science 2008, 321, 382–385. [Google Scholar] [CrossRef]
  15. Ludwig, W.; Schmidt, S.; Lauridsen, E.M.; Poulsen, H.F. X-ray diffraction contrast tomography: A novel technique for three-dimensional grain mapping of polycrystals. I. Direct beam case. J. Appl. Crystallogr. 2008, 41, 302–309. [Google Scholar] [CrossRef]
  16. Johnson, G.; King, A.; Honnicke, M.G.; Marrow, J.; Ludwig, W. X-ray diffraction contrast tomography: A novel technique for three-dimensional grain mapping of polycrystals. II. The combined case. J. Appl. Crystallogr. 2008, 41, 310–318. [Google Scholar] [CrossRef]
  17. Ludwig, W.; Reischig, P.; King, A.; Herbig, M.; Lauridsen, E.M.; Johnson, G.; Marrow, T.J.; Buffiere, J.Y. Three-dimensional grain mapping by x-ray diffraction contrast tomography and the use of Friedel pairs in diffraction data analysis. Rev. Sci. Instrum. 2009, 80, 033905. [Google Scholar] [CrossRef] [Green Version]
  18. Reischig, P.; King, A.; Nervo, L.; Viganó, N.; Guilhem, Y.; Palenstijn, W.J.; Batenburg, K.J.; Preuss, M.; Ludwig, W. Advances in X-ray diffraction contrast tomography: Flexibility in the setup geometry and application to multiphase materials. J. Appl. Crystallogr. 2013, 46, 297–311. [Google Scholar] [CrossRef]
  19. Nervo, L.; King, A.; Fitzner, A.; Ludwig, W.; Preuss, M. A study of deformation twinning in a titanium alloy by X-ray diffraction contrast tomography. Acta Mater. 2016, 105, 417–428. [Google Scholar] [CrossRef] [Green Version]
  20. Reischig, P.; Ludwig, W. Three-dimensional reconstruction of intragranular strain and orientation in polycrystals by near-field X-ray diffraction. Curr. Opin. Solid State Mater. Sci. 2020, 24, 100851. [Google Scholar] [CrossRef]
  21. Margulies, L.; Winther, G.; Poulsen, H.F. In-situ measurement of grain rotation during deformation of polycrystals. Science 2001, 291, 2392–2394. [Google Scholar] [CrossRef] [PubMed]
  22. Poulsen, H.F.; Nielsen, S.F.; Lauridsen, E.M.; Schmidt, S.; Suter, R.M.; Lienert, U.; Margulies, L.; Lorentzen, T.; Juul Jensen, D. Three-dimensional maps of grain boundaries and the stress state of individual grains in polycrystals and powders. J. Appl. Crystallogr. 2001, 34, 751–756. [Google Scholar] [CrossRef]
  23. Lauridsen, E.M.; Schmidt, S.; Suter, R.M.; Poulsen, H.F. Tracking: A method for structural characterization of grains in powders or polycrystals. J. Appl. Crystallogr. 2001, 34, 744–750. [Google Scholar] [CrossRef] [Green Version]
  24. Nielsen, S.F.; Lauridsen, E.M.; Juul Jensen, D.; Poulsen, H.F. A three-dimensional X-ray diffraction microscope for deformation studies of polycrystals. Mater. Sci. Eng. A 2001, 319–321, 179–181. [Google Scholar] [CrossRef]
  25. Offerman, S.E.; van Dijk, N.H.; Sietsma, J.; Grigull, S.; Lauridsen, E.M.; Margulies, L.; Poulsen, H.F.; Rekveldt, M.T.; van der Zwaag, S. Grain nucleation and growth during phase transformations. Science 2002, 298, 1003–1005. [Google Scholar] [CrossRef] [PubMed] [Green Version]
  26. Margulies, L.; Lorentzen, T.; Poulsen, H.F.; Leffers, T. Strain tensor development in a single grain in the bulk of a polycrystal under loading. Acta Mater. 2002, 50, 1771–1779. [Google Scholar] [CrossRef]
  27. Poulsen, H.F.; Fu, X. Generation of grain maps by an algebraic reconstruction technique. J. Appl. Crystallogr. 2003, 36, 1062–1068. [Google Scholar] [CrossRef]
  28. Poulsen, H.F.; Margulies, L.; Schmidt, S.; Winther, G. Lattice rotations of individual bulk grains: Part I: 3D X-ray characterization. Acta Mater. 2003, 51, 3821–3830. [Google Scholar] [CrossRef]
  29. Fu, X.; Poulsen, H.F.; Schmidt, S.; Nielsen, S.F.; Lauridsen, E.M.; Juul Jensen, D. Non-destructive mapping of grains in three dimensions. Scr. Mater. 2003, 49, 1093–1096. [Google Scholar] [CrossRef]
  30. Schmidt, S.; Nielsen, S.F.; Gundlach, C.; Margulies, L.; Huang, X.; Juul Jensen, D. Watching the growth of bulk grains during recrystallization of deformed metals. Science 2004, 305, 229–232. [Google Scholar] [CrossRef]
  31. Lauridsen, E.M.; Schmidt, S.; Nielsen, S.F.; Margulies, L.; Poulsen, H.F.; Juul Jensen, D. Non-destructive characterization of recrystallization kinetics using three-dimensional X-ray diffraction microscopy. Scr. Mater. 2006, 55, 51–56. [Google Scholar] [CrossRef]
  32. Fu, X.; Knudsen, E.; Poulsen, H.F.; Herman, G.T.; Carvalho, B.M.; Liao, H.Y. Optimized algebraic reconstruction technique for generation of grain maps based on three-dimensional x-ray diffraction (3DXRD). Opt. Eng. 2006, 45, 1–9. [Google Scholar] [CrossRef]
  33. Alpers, A.; Poulsen, H.F.; Knudsen, E.; Herman, G.T. A discrete tomography algorithm for improving the quality of three-dimensional X-ray diffraction grain maps. J. Appl. Crystallogr. 2006, 39, 582–588. [Google Scholar] [CrossRef]
  34. Offerman, S.E.; van Dijk, N.H.; Sietsma, J.; Lauridsen, E.M.; Margulies, L.; Grigull, S.; Poulsen, H.F.; van der Zwaag, S. Phase transformations in steel studied by 3DXRD microscopy. Nucl. Instrum. Methods Phys. Res. Sect. B 2006, 246, 194–200. [Google Scholar] [CrossRef]
  35. Rodek, L.; Poulsen, H.F.; Knudsen, E.; Herman, G.T. A stochastic algorithm for reconstruction of grain maps of moderately deformed specimens based on X-ray diffraction. J. Appl. Crystallogr. 2007, 40, 313–321. [Google Scholar] [CrossRef]
  36. Jimenez-Melero, E.; van Dijk, N.H.; Zhao, L.; Sietsma, J.; Offerman, S.E.; Wright, J.P.; van der Zwaag, S. Characterization of individual retained austenite grains and their stability in low-alloyed TRIP steels. Acta Mater. 2007, 55, 6713–6723. [Google Scholar] [CrossRef]
  37. Schmidt, S.; Olsen, U.L.; Poulsen, H.F.; Sørensen, H.O.; Lauridsen, E.M.; Margulies, L.; Maurice, C.; Juul Jensen, D. Direct observation of 3-D grain growth in Al–0.1% Mn. Scr. Mater. 2008, 59, 491–494. [Google Scholar] [CrossRef]
  38. Oddershede, J.; Schmidt, S.; Poulsen, H.F.; Sørensen, H.O.; Wright, J.; Reimers, W. Determining grain resolved stresses in polycrystalline materials using three-dimensional X-ray diffraction. J. Appl. Crystallogr. 2010, 43, 539–549. [Google Scholar] [CrossRef]
  39. Juul, N.Y.; Winther, G.; Dale, D.; Koker, M.K.A.; Shade, P.; Oddershede, J. Elastic interaction between twins during tensile deformation of austenitic stainless steel. Scr. Mater. 2016, 120, 1–4. [Google Scholar] [CrossRef] [Green Version]
  40. Renversade, L.; Borbély, A. Evaluation of grain-average stress tensor in a tensile-deformed Al–Mn polycrystal by high-energy X-ray diffraction. J. Appl. Crystallogr. 2017, 50, 1144–1157. [Google Scholar] [CrossRef]
  41. Abdolvand, H.; Wright, J.; Wilkinson, A.J. Strong grain neighbour effects in polycrystals. Nat. Commun. 2018, 9, 171. [Google Scholar] [CrossRef] [PubMed] [Green Version]
  42. Oddershede, J.; Camin, B.; Schmidt, S.; Mikkelsen, L.P.; Sørensen, H.O.; Lienert, U.; Poulsen, H.F.; Reimers, W. Measuring the stress field around an evolving crack in tensile deformed Mg AZ31 using three-dimensional X-ray diffraction. Acta Mater. 2012, 60, 3570–3580. [Google Scholar] [CrossRef] [Green Version]
  43. Sedmák, P.; Pilch, J.; Heller, L.; Kopeček, J.; Wright, J.; Sedlák, P.; Frost, M.; Šittner, P. Grain-resolved analysis of localized deformation in nickel-titanium wire under tensile load. Science 2016, 353, 559–562. [Google Scholar] [CrossRef]
  44. Suter, R.M.; Hennessy, D.; Xiao, C.; Lienert, U. Forward modeling method for microstructure reconstruction using X-ray diffraction microscopy: Single-crystal verification. Rev. Sci. Instrum. 2006, 77, 123905. [Google Scholar] [CrossRef] [Green Version]
  45. Hefferan, C.; Li, S.F.; Lind, J.; Lienert, U.; Rollett, A.D.; Wynblatt, P.; Suter, R. Statistics of high purity nickel microstructure from high energy X-ray diffraction microscopy. Comput. Mater. Contin. 2009, 14, 209–219. [Google Scholar]
  46. Aydıner, C.C.; Bernier, J.V.; Clausen, B.; Lienert, U.; Tomé, C.N.; Brown, D.W. Evolution of stress in individual grains and twins in a magnesium alloy aggregate. Phys. Rev. B 2009, 80, 024113. [Google Scholar] [CrossRef] [Green Version]
  47. Bernier, J.V.; Barton, N.R.; Lienert, U.; Miller, M.P. Far-field high-energy diffraction microscopy: A tool for intergranular orientation and strain analysis. J. Strain Anal. Eng. Des. 2011, 46, 527–547. [Google Scholar] [CrossRef]
  48. Lienert, U.; Li, S.F.; Hefferan, C.M.; Lind, J.; Suter, R.M.; Bernier, J.V.; Barton, N.R.; Brandes, M.C.; Mills, M.J.; Miller, M.P.; et al. High-energy diffraction microscopy at the advanced photon source. JOM 2011, 46, 527–547. [Google Scholar] [CrossRef]
  49. Li, S.F.; Lind, J.; Hefferan, C.M.; Pokharel, R.; Lienert, U.; Rollett, A.D.; Suter, R.M. Three-dimensional plastic response in polycrystalline copper Via Near-Field High-Energy X-ray Diffr. Microscopy. J. Appl. Crystallogr. 2012, 45, 1098–1108. [Google Scholar] [CrossRef]
  50. Hefferan, C.M.; Lind, J.; Li, S.F.; Lienert, U.; Rollett, A.D.; Suter, R.M. Observation of recovery and recrystallization in high-purity aluminum measured with forward modeling analysis of high-energy diffraction microscopy. Acta Mater. 2012, 60, 4311–4318. [Google Scholar] [CrossRef]
  51. Li, S.F.; Suter, R.M. Adaptive reconstruction method for three-dimensional orientation imaging. J. Appl. Crystallogr. 2013, 46, 512–524. [Google Scholar] [CrossRef]
  52. Pokharel, R.; Lind, J.; Kanjarla, A.K.; Lebensohn, R.A.; Li, S.F.; Kenesei, P.; Suter, R.M.; Rollett, A.D. Polycrystal plasticity: Comparison between grain-scale observations of deformation and simulations. Annu. Rev. Condens. Matter Phys. 2014, 5, 317–346. [Google Scholar] [CrossRef]
  53. Wang, L.; Lind, J.; Phukan, H.; Kenesei, P.; Park, J.-S.; Suter, R.M.; Beaudoin, A.J.; Bieler, T.R. Mechanical twinning and detwinning in pure Ti during loading and unloading—An in situ high-energy X-ray diffraction microscopy study. Scr. Mater. 2014, 92, 35–38. [Google Scholar] [CrossRef] [Green Version]
  54. Lind, J.; Li, S.F.; Pokharel, R.; Lienert, U.; Rollett, A.D.; Suter, R.M. Tensile twin nucleation events coupled to neighboring slip observed in three dimensions. Acta Mater. 2014, 76, 213–220. [Google Scholar] [CrossRef]
  55. Spear, A.D.; Li, S.F.; Lind, J.f.; Suter, R.M.; Ingraffea, A.R. Three-dimensional characterization of microstructurally small fatigue-crack evolution using quantitative fractography combined with post-mortem X-ray tomography and high-energy X-ray diffraction microscopy. Acta Mater. 2014, 76, 413–424. [Google Scholar] [CrossRef]
  56. Miller, M.P.; Dawson, P.R. Understanding local deformation in metallic polycrystals using high energy X-rays and finite elements. Curr. Opin. Solid State Mater. Sci. 2014, 18, 286–299. [Google Scholar] [CrossRef] [Green Version]
  57. Shade, P.A.; Blank, B.; Schuren, J.C.; Turner, T.J.; Kenesei, P.; Goetze, K.; Suter, R.M.; Bernier, J.V.; Li, S.F.; Lind, J.; et al. A rotational and axial motion system load frame insert for in situ high energy X-ray studies. Rev. Sci. Instrum. 2015, 86, 093902. [Google Scholar] [CrossRef] [Green Version]
  58. Schuren, J.C.; Shade, P.A.; Bernier, J.V.; Li, S.F.; Blank, B.; Lind, J.; Kenesei, P.; Lienert, U.; Suter, R.M.; Turner, T.J.; et al. New opportunities for quantitative tracking of polycrystal responses in three dimensions. Curr. Opin. Solid State Mater. Sci. 2015, 19, 235–244. [Google Scholar] [CrossRef] [Green Version]
  59. Wong, S.L.; Obstalecki, M.; Miller, M.P.; Dawson, P.R. Stress and deformation heterogeneity in individual grains within polycrystals subjected to fully reversed cyclic loading. J. Mech. Phys. Solids. 2015, 79, 157–185. [Google Scholar] [CrossRef] [Green Version]
  60. Turner, T.; Shade, P.; Bernier, J.; Li, S.F.; Schuren, J.; Kenesei, P.; Suter, R.; Almer, J. Crystal plasticity model validation using combined high-energy diffraction microscopy data for a Ti-7Al specimen. Metall. Mater. Trans. A Phys. Metall. Mater. Sci. 2016, 48, 627–647. [Google Scholar] [CrossRef]
  61. Pagan, D.C.; Shade, P.A.; Barton, N.R.; Park, J.-S.; Kenesei, P.; Menasche, D.B.; Bernier, J.V. Modeling slip system strength evolution in Ti-7Al informed by in-situ grain stress measurements. Acta Mater. 2017, 128, 406–417. [Google Scholar] [CrossRef] [Green Version]
  62. Guillen, D.P.; Pagan, D.C.; Getto, E.M.; Wharry, J.P. In situ tensile study of PM-HIP and wrought 316L stainless steel and Inconel 625 alloys with high energy diffraction microscopy. Mater. Sci. Eng. A 2018, 738, 380–388. [Google Scholar] [CrossRef]
  63. Naragani, D.; Sangid, M.D.; Shade, P.A.; Schuren, J.C.; Sharma, H.; Park, J.-S.; Kenesei, P.; Bernier, J.V.; Turner, T.J.; Parr, I. Investigation of fatigue crack initiation from a non-metallic inclusion via high energy X-ray diffraction microscopy. Acta Mater. 2017, 137, 71–84. [Google Scholar] [CrossRef]
  64. Pagan, D.C.; Beaudoin, A.J. Utilizing a novel lattice orientation based stress characterization method to study stress fields of shear bands. J. Mech. Phys. Solids. 2019, 128, 105–116. [Google Scholar] [CrossRef] [Green Version]
  65. Shen, Y.-F.; Liu, H.; Suter, R.M. Voxel-based strain tensors from near-field high energy diffraction microscopy. Curr. Opin. Solid State Mater. Sci. 2020, 24, 100852. [Google Scholar] [CrossRef]
  66. Naragani, D.; Shade, P.; Musinski, W.; Boyce, D.; Obstalecki, M.; Pagan, D.; Bernier, J.; Beaudoin, A. Interpretation of intragranular strain fields in high-energy synchrotron X-ray experiments via finite element simulations and analysis of incompatible deformation. Mater. Des. 2021, 210, 110053. [Google Scholar] [CrossRef]
  67. Hayashi, Y.; Hirose, Y.; Setoyama, D. In situ three-dimensional orientation mapping in plastically-deformed polycrystalline iron by three-dimensional X-ray diffraction. Mater. Sci. Forum 2014, 777, 118–123. [Google Scholar] [CrossRef]
  68. Bonnin, A.; Wright, J.P.; Tucoulou, R.; Palancher, H. Impurity precipitation in atomized particles evidenced by nano X-ray diffraction computed tomography. Appl. Phys. Lett. 2014, 105, 084103. [Google Scholar] [CrossRef]
  69. Hayashi, Y.; Hirose, Y.; Seno, Y. Polycrystal orientation mapping using scanning three-dimensional X-ray diffraction microscopy. J. Appl. Crystallogr. 2015, 48, 1094–1101. [Google Scholar] [CrossRef]
  70. Hayashi, Y.; Hirose, Y.; Seno, Y. Scanning three-dimensional X-ray diffraction microscopy using a high-energy microbeam. AIP Conf. Proc. 2016, 1741, 050024. [Google Scholar]
  71. Hayashi, Y.; Setoyama, D.; Seno, Y. Scanning three-dimensional X-ray diffraction microscopy with a high-energy microbeam at SPring-8. Mater. Sci. Forum 2017, 905, 157–164. [Google Scholar] [CrossRef]
  72. Hektor, J.; Hall, S.; Henningsson, N.; Engqvist, J.; Ristinmaa, M.; Lenrick, F.; Wright, J. Scanning 3DXRD measurement of grain growth, stress, and formation of Cu6Sn5 around a tin whisker during heat treatment. Materials 2019, 12, 446. [Google Scholar] [CrossRef] [PubMed] [Green Version]
  73. Hayashi, Y.; Setoyama, D.; Hirose, Y.; Yoshida, T.; Kimura, H. Intragranular three-dimensional stress tensor fields in plastically deformed polycrystals. Science 2019, 366, 1492–1496. [Google Scholar] [CrossRef] [PubMed]
  74. Henningsson, N.A.; Hall, S.A.; Wright, J.P.; Hektor, J. Reconstructing intragranular strain fields in polycrystalline materials from scanning 3DXRD data. J. Appl. Crystallogr. 2020, 53, 314–325. [Google Scholar] [CrossRef] [PubMed] [Green Version]
  75. Wright, J.P.; Giacobbe, C.; Majkut, M. New opportunities at the materials science beamline at ESRF to exploit high energy nano-focus X-ray beams. Curr. Opin. Solid State Mater. Sci. 2020, 24, 100818. [Google Scholar] [CrossRef]
  76. Henningsson, A.; Hendriks, J. Intragranular strain estimation in far-field scanning X-ray diffraction using a Gaussian process. J. Appl. Crystallogr. 2021, 54, 1057–1070. [Google Scholar] [CrossRef]
  77. Li, W.; Sharma, H.; Peter, K.; Ravi, S.; Sehitoglu, H.; Bucsek, A. Resolving intragranular stress fields in plastically deformed titanium using point-focused high-energy diffraction microscopy. J. Mater. Res. 2023, 38, 165–178. [Google Scholar] [CrossRef]
  78. Nielsen, S.F.; Wolf, A.; Poulsen, H.F.; Ohler, M.; Lienert, U.; Owen, R.A. A conical slit for three-dimensional XRD mapping. J. Synchrotron Rad. 2000, 7, 103–109. [Google Scholar] [CrossRef]
  79. Wright, J. ImageD11. 2021. Available online: https://github.com/FABLE-3DXRD/ImageD11/ (accessed on 7 July 2023).
  80. Wright, J. PolyXSim. 2019. Available online: https://github.com/FABLE-3DXRD/PolyXSim (accessed on 7 July 2023).
Figure 1. Optical images of the (a) S35C and (b) S45C samples. The white and black regions indicate ferrite grains and pearlite, respectively. The fractions of ferrite grains in the S35C and S45C samples were 55% and 33%, respectively.
Qubs 07 00023 g001
Figure 2. (a) Horizontal and (b) vertical knife-edge scan profiles of a focused X-ray beam with 50 keV of photon energy.
Qubs 07 00023 g002
Figure 3. Schematic of the experimental setup. The focused X-ray microbeam parallel to the y axis is irradiated on a polycrystalline sample rotated around the z axis. The sample rotation angle is defined as ω . Diffracted beams from multiple ferrite grains in the sample pass through the conical slit for α -Fe and are detected as diffraction spots in the far-field detector. In this scanning 3DXRD setup, ferrite grains and pearlite correspond to the visible grains and the invisible phase, respectively.
Qubs 07 00023 g003
Figure 4. Schematic of the completeness curves of visible grains for ideal cases (a) without and (b) with an invisible phase, (c) a real case without the invisible phase using conventional completeness N , expected cases (d) without and (e) with an invisible phase using the modified completeness N / N max ( i ) and its threshold, and real cases (f) without and (g) with the invisible phase owing to experimental errors. In the cases of (a,b), the completeness of the visible grains represents almost 1, and the boundaries between the visible grains and the invisible phase are observed. In the case of (c), the completeness depends on the grain size. In the cases of (d,e), the maximum completeness of each grain is 1, and the boundaries between the visible grains and the invisible phase can be determined using the threshold of completeness. In the case of (f,g), there are nonnegligible uncertainties for the threshold and the positions of the boundaries.
Qubs 07 00023 g004
Figure 5. Orientation maps obtained from the single-phase low-carbon steel sample with completeness thresholds N th = (a) 0.99, (b) 0.98, (c) 0.96, (d) 0.94, (e) 0.92, (f) 0.89, and (g) 0.85 and (h) the completeness map. The FoV diameter and pixel size are 300 μ m and 1 × 1 μ m 2 , respectively. The orientation of the visible grains is represented by the z axis in the basic triangle of the pole figure of α -Fe. The uncolored white pixels indicate the regions below the completeness thresholds.
Qubs 07 00023 g005
Figure 6. Orientation maps obtained from the S15C carbon steel sample with completeness thresholds N th of (a) 0.99, (b) 0.98, (c) 0.96, (d) 0.94, (e) 0.92, (f) 0.89, and (g) 0.85 and (h) the completeness map. The FoV diameter and pixel size are 200 μ m and 1 × 1 μ m 2 , respectively. The orientations of the visible grains are represented by the z axis in the basic triangle of the pole figure of α -Fe, and the uncolored white pixels indicate the regions below the completeness thresholds.
Qubs 07 00023 g006
Figure 7. Orientation maps obtained from the S25C carbon steel sample with completeness thresholds N th of (a) 0.99, (b) 0.98, (c) 0.96, (d) 0.94, (e) 0.92, (f) 0.89, and (g) 0.85 and (h) the completeness map. The FoV diameter and pixel size are 200 μ m and 1 × 1 μ m 2 , respectively. The orientations of the visible grains are represented by the z axis in the basic triangle of the pole figure of α -Fe, and the uncolored white pixels indicate the regions below the completeness thresholds.
Qubs 07 00023 g007
Figure 8. Orientation maps obtained from the S35C carbon steel sample with completeness thresholds N th of (a) 0.99, (b) 0.98, (c) 0.96, (d) 0.94, (e) 0.92, (f) 0.89, and (g) 0.85 and (h) the completeness map. The FoV diameter and pixel size are 200 μ m and 1 × 1 μ m 2 , respectively. The orientations of the visible grains are represented by the z axis in the basic triangle of the pole figure of α -Fe, and the uncolored white pixels indicate the regions below the completeness thresholds.
Qubs 07 00023 g008
Figure 9. Orientation maps obtained from the S45C carbon steel sample with completeness thresholds N th of (a) 0.99, (b) 0.98, (c) 0.96, (d) 0.94, (e) 0.92, (B) 0.89, and (g) 0.85 and (h) the completeness map. The FoV diameter and pixel size are 200 μ m and 1 × 1 μ m 2 , respectively. The orientations of the visible grains are represented by the z axis in the basic triangle of the pole figure of α -Fe, and the uncolored white pixels indicate the regions below the completeness thresholds.
Qubs 07 00023 g009
Figure 10. Dependence of the fraction of the visible grains on the completeness threshold for the single-phase low-carbon steel sample and the S15C, S25C, S35C, and S45C carbon steel samples.
Qubs 07 00023 g010
Disclaimer/Publisher’s Note: The statements, opinions and data contained in all publications are solely those of the individual author(s) and contributor(s) and not of MDPI and/or the editor(s). MDPI and/or the editor(s) disclaim responsibility for any injury to people or property resulting from any ideas, methods, instructions or products referred to in the content.

