Article

Shear Behavior of Recycled Coarse Aggregates Concrete Dry Joints Keys Using Digital Image Correlation Technique

by
Jedson Batista Sousa
1,
Sergio Luis Gonzalez Garcia
1 and
Rodrigo Moulin Ribeiro Pierott
2,*
1
Department of Civil Engineering, Universidade Estadual do Norte Fluminense, Av. Alberto Lamego, 2000, Campos dos Goytacazes, Rio de Janeiro 28013-602, Brazil
2
Department of Environmental Engineering, Federal University of Rio de Janeiro, Rio de Janeiro 22290-140, Brazil
*
Author to whom correspondence should be addressed.
Infrastructures 2023, 8(3), 60; https://doi.org/10.3390/infrastructures8030060
Submission received: 5 January 2023 / Revised: 13 March 2023 / Accepted: 14 March 2023 / Published: 20 March 2023
(This article belongs to the Special Issue Smart, Sustainable and Resilient Infrastructures, 2nd Edition)

Abstract

:
In this work, twenty-seven dry joint specimens of prestressed segmental bridges produced using recycled coarse aggregate concrete (RAC) were subjected to push-off tests. The substitution rate of coarse aggregate for recycled aggregate was 100%. The variables observed were the number of keys, including flat, single-keyed, and three-keyed, and the magnitude of the confining stress, varying at 1.0, 2.0, and 3.0 MPa. The slippage between both parts of the joint and the cracking of the specimens were analyzed using the digital image correlation technique (DIC). Equations from the literature were used to predict the shear strength of dry joints with recycled coarse aggregate concrete. The experimental results obtained from the present research were compared to those of other conventional concrete researchers. The results showed that the dry joints produced with recycled coarse aggregate concrete presented a crack formation in conventional concrete joints following a similar mechanism of failure; however, they presented lower strength. Some equations in the literature predicted the strength of dry joints with recycled coarse aggregate concrete. Based on the analysis performed, adopting a reduction coefficient of 0.7 in the AASHTO normative equation was recommended for predicting the shear strength of dry joints when produced with recycled coarse aggregates concrete.

1. Introduction

The concern with the environment and the scarcity of natural resources has driven, in recent years, research on reusable and sustainable materials. On a global scale, the construction industry has demonstrated a tremendous environmental impact due to the extraction of a large number of rocks necessary to obtain concrete, implying the destruction of natural environments and atmospheric pollution due to the generation of dust [1].
Among the solutions found to reduce this impact, the reuse of construction and demolition waste to produce aggregates that will be used to produce new concrete [2], known as recycled aggregate concrete (RAC), was highlighted.
The recycled aggregates derived from this waste present high heterogeneity due to the immense variation in materials present. One of those with the highest concentration is mortar.
The main properties influenced by the presence of mortar in the recycled aggregates are water absorption, specific mass, abrasion, and surface texture of the grains [3]. The high porosity of the mortar attributes to the recycled aggregate high rates of water absorption and reduction of its specific mass. Due to the irregular texture, the mortar also attributes a better surface texture to the grain and, consequently, a more significant physical wear.
Mortar adhered to recycled aggregates represents a weak link in concrete. The bond region between the natural aggregate and the adhered mortar corresponds to a low-strength region known as the transition zone, causing an increase in the water content on the aggregate surface, increasing the water/cement ratio (w/c) in that region. When recycled aggregates are used to produce new concrete, a second transition zone appears, now between the cementitious matrix and the recycled aggregate, attributing to this type of concrete a lower condition of mechanical strength [4,5].
Incorporating recycled aggregates into concrete reduces its mechanical strength and durability [6]. The percentage of substitution of natural aggregates for recycled ones is directly related to the decrease in the mechanical resistance of concrete. According to Chen et al. [7], the modulus of elasticity of recycled aggregate concrete can decrease by about 20% compared to ordinary concrete. Khatab et al. [8] showed that for a replacement rate of 50% of natural aggregates by recycled ones, there was a decrease of 12% in the compressive strength of concrete, reaching 23% strength reduction when the replacement content was 100%. Meddah et al. [9] verified that the splitting tensile strength of recycled concrete decreases about 9% compared to normal strength concrete. Naouaoui et al. [3] cite that recycled aggregates can increase the water absorption of concrete by up to 50%. Lavado et al. [10] showed that for concrete made from recycled aggregates, the results of the slump test were reduced by about 38% when compared to concrete made from natural aggregates. Feng et al. [11] showed that the Poisson ratio of concrete decreased by 10% when replacing natural aggregates with recycled ones. It was also verified that when fine aggregates were replaced by sea sand and when sea water was used in the mixture composition, the Poisson coefficient of recycled coarse aggregate concrete increased by 20%.
With the advent and growth in the use of RAC in structural elements, this paper discusses the use of recycled coarse aggregates in dry joints with shear keys, which allow the connection of prestressed segmental bridge staves. In this type of structure, the bridge superstructure is divided into segments, called staves, and in the region where these staves are connected, there are shear keys. These joints present concrete protuberances along the cross-section of the dowels, called shear keys, and their resistance to shear stresses is given by the mechanical locking of these keys (Figure 1).
The sum of two strength portions gives the shear strength of dry joints: the portion due to the flat region of the joint (Figure 1c) and the shear keyed region (Figure 1d).
The flat region of the joint behaves similarly to two concrete interfaces sliding against each other, with no reinforcement crossing the shear plane (Figure 1b). The shear- friction theory proposed by P. Birkeland and H. Birkeland [12] establishes that the stress transfer mechanism between these two parts depends on the friction generated. The theory shows that the resistance portion of this region is directly related to the surface roughness because protuberances on the surface of the sliding interface generate mechanical locking that contributes to shear resistance. The coefficient of friction (μ) can be determined by calculating the ratio between the shear stress and confinement stress, as proposed by Buyukozturk et al. [13]. This parameter is used to quantify the frictional component of a system.
On the other hand, the keyed region corresponds to the behavior of a monolithic concrete piece, and its strength is directly related to the properties of the concrete used.
If the part is subjected to confinement action, both the flat region and the keyed region benefit from strength gains. The confinement contributes to a better mechanical interlock between the protuberances on the flat surface of the joint and provides the concrete with a state of confinement.
The behavior of concrete, when submitted to shear, depends on the strength of its aggregates in relation to the strength of the cement matrix. If the aggregates have lower strength than the cementitious matrix, the cracks tend to cut them [14,15,16,17]. The opposite occurs in concrete with aggregates having superior strength to the cementitious matrix, where cracks tend to bypass them, as shown in Figure 2.
When the cracks bypass the aggregates, an irregular and rough surface appears at the shear interface due to the exposed aggregates. This surface plays a mechanical interlocking mechanism between the aggregates, contributing to the shear strength of this concrete.
However, when the cracks cut the aggregates, surfaces with slight roughness appear at the shear interface, decreasing the interlocking effect of the aggregates and thus reducing the shear strength portion of this concrete.
Several kinds of research have been conducted in recent years on the mechanical behavior of dry joints of prestressed segmental bridges using conventional concrete. Ahmed and Aziz in 2019 [18] conducted state-of-the-art research on the topic and gathered those performed between 1959 and 2019. To date, no study using recycled aggregate concrete in dry joints has been carried out.
As a result of much research, equations for predicting the strength of these joints have been proposed.
Of the studies proposing equations, Buyukozturk et al. [13] verified the behavior of flat joints and single-keyed joints, whether they contain epoxy resin or not. The authors produced specimens for push-off rupture tests submitted to confining stresses of 0.69, 2.07, and 3.45 MPa. They concluded that the confining stress is a fundamental parameter for the strength of the joints, both flat and keyed, with the strength being higher as the confining stress increases, and the presence of epoxy resin is another factor that positively influences the strength of the joints. Rombach and Specker [19] studied dry joints’ behavior by using a numerical simulation of finite elements. The authors proposed an equation for predicting the shear strength of dry joints, which had the keyed configuration as a variable. Turmo et al. [20] evaluated the shear strength of dry joints according to equations found in the literature and proposed to adopt the one that most closely matched the experimental results to the Eurocode 2 guidelines. The chosen equation was used by AASHTO [21] because it presented the lowest standard deviation in the relationship between experimental and predicted results. The authors proposed an equation for predicting the shear strength of dry joints with concrete of compressive strength less than 50 MPa. Alcade et al. [22] developed a finite element study for four different types of joints varying the confining stress in 1.0, 2.0, and 3.0 MPa. The authors concluded that the average shear stress decreases as the number of keys increases, but this behavior changes at high confining stresses. The authors comment that this behavior results from high confining stresses providing the joints with a more plastic behavior to the keys. Therefore, they can develop their maximum resistant capacity. The authors proposed an equation for predicting the shear strength of dry joints with concrete of 50 MPa and confining stresses of less than 3.0 MPa. Ahmed and Aziz [18] performed state-of-the-art research of dry joints. The authors commented on the significant variability of parameters that hinder a good correlation between experimental and predicted results for dry joint strength, such as the small database, structural differences, and geometric modeling of specimens. Through statistical analysis, the authors proposed equations for predicting the shear strength of dry joints.
The equations used for predicting dry joint strength are gathered in Table 1. The designations and notation used in the equations are shown in Table 2.
All the proposed equations were formulated for conventional concrete; no specific equations exist in the literature for joints produced with concrete made from recycled coarse aggregates.
The fact that recycled coarse aggregates are less resistant than conventional ones influences the shear strength of the concrete produced with them. Fonteboa et al. [25] analyzed the shear behavior of concrete with recycled coarse aggregates with 50% replacement content. The results showed a reduction of about 20% in the shear strength of these types of concrete compared to conventional concrete. Xiao et al. [26] investigated the influence of the replacement content of natural coarse aggregates by recycled ones on the shear strength of concrete. The results showed that the substitution level significantly influenced the ultimate load of specimens with the same compressive strength as concrete, with a similar load for substitution levels below 30%. However, they observed a reduction in load for substitution levels of 30% to 50%. Rahal [27] performing push-off tests, concluding that for replacement contents of 20% and 50% of natural aggregates by recycled aggregates, a decrease in shear strength of 7% was obtained when the replacement rate increased to 100% and when the shear strength decreased by 28%. Liu et al. [4] studied three different types of recycled aggregate concrete and verified the influence of the type of recycled aggregate on the strength of concrete when produced by them. The experimental results showed a decrease of up to 26% in the shear strength of concrete when compared to concrete produced with natural aggregates. Trindade et al. [28] studied the influence of the percentage of replacement of natural aggregates by recycled ones with different levels of compressive strength of the original concrete. The results showed that increasing the replacement content of aggregates directly influenced the loss of shear strength of concrete, and this loss was more significant in concrete with recycled aggregates with lower compressive strengths of the original concrete. The results showed losses of 18%, 33%, and 38% in the shear strength of the concrete for the replacement levels of 30, 50, and 100%, respectively, in the recycled aggregate concrete with low strength of the original concrete. For recycled aggregate concrete with high strength of the original concrete, the researchers comment that there was no statistically significant difference. Trindade et al. [29] studied the influence of the addition of steel fibers in the shear behavior of recycled coarse aggregate concrete, having different strengths from the original concrete. The results showed that the concrete from the group of aggregates with low strength of the original concrete presented about a 33% loss in shear strength, while for those from the high strength group, the results were statistically equal. The addition of steel fiber in the recycled coarse aggregate concrete provided an increase in shear strength of about 23.8% for the concrete from the group of aggregates with low strength of the original concrete and about 17% for those from the high strength group.
Global industry is increasingly facing a future scenario of applications of unconventional materials in civil construction due to the growing demand and scarcity of natural resources, as well as the pollution caused by the obtaining of materials. The studies regarding concrete produced with recycled aggregates show that this material has characteristics and properties that resemble conventional concrete, although its main disadvantage is its reduced resistance. Therefore, further research is needed to expand the applicability of this material in the future.
Due to the lack of research on the use of recycled coarse aggregate concrete (RAC) in dry joints and aiming to provide support for structural elements, this paper studies the behavior of dry joints of prestressed segmented bridges when produced with RAC. Twenty-seven dry joint specimens were produced with RAC with 100% coarse aggregate content. The variables analyzed were the number of keys (flat, single-keyed, and three-keyed) and the magnitude of the confining stress (varying in 1.0, 2.0, and 3.0 MPa). The maximum normalized shear stress of the joints produced with concrete from recycled coarse aggregates was compared to those of Jiang et al. [30] due to the similarity of the specimens, the concrete strength, and the variables used in this research, produced using conventional concrete. The cracking load and the failure mode of the joints were also analyzed. Then, the maximum normalized shear stress of the results obtained in this research was compared with those of other researchers. Finally, the viability of using the proposed equations was verified for calculating the ultimate capacity of dry joints of conventional concrete when used in RAC dry joints.

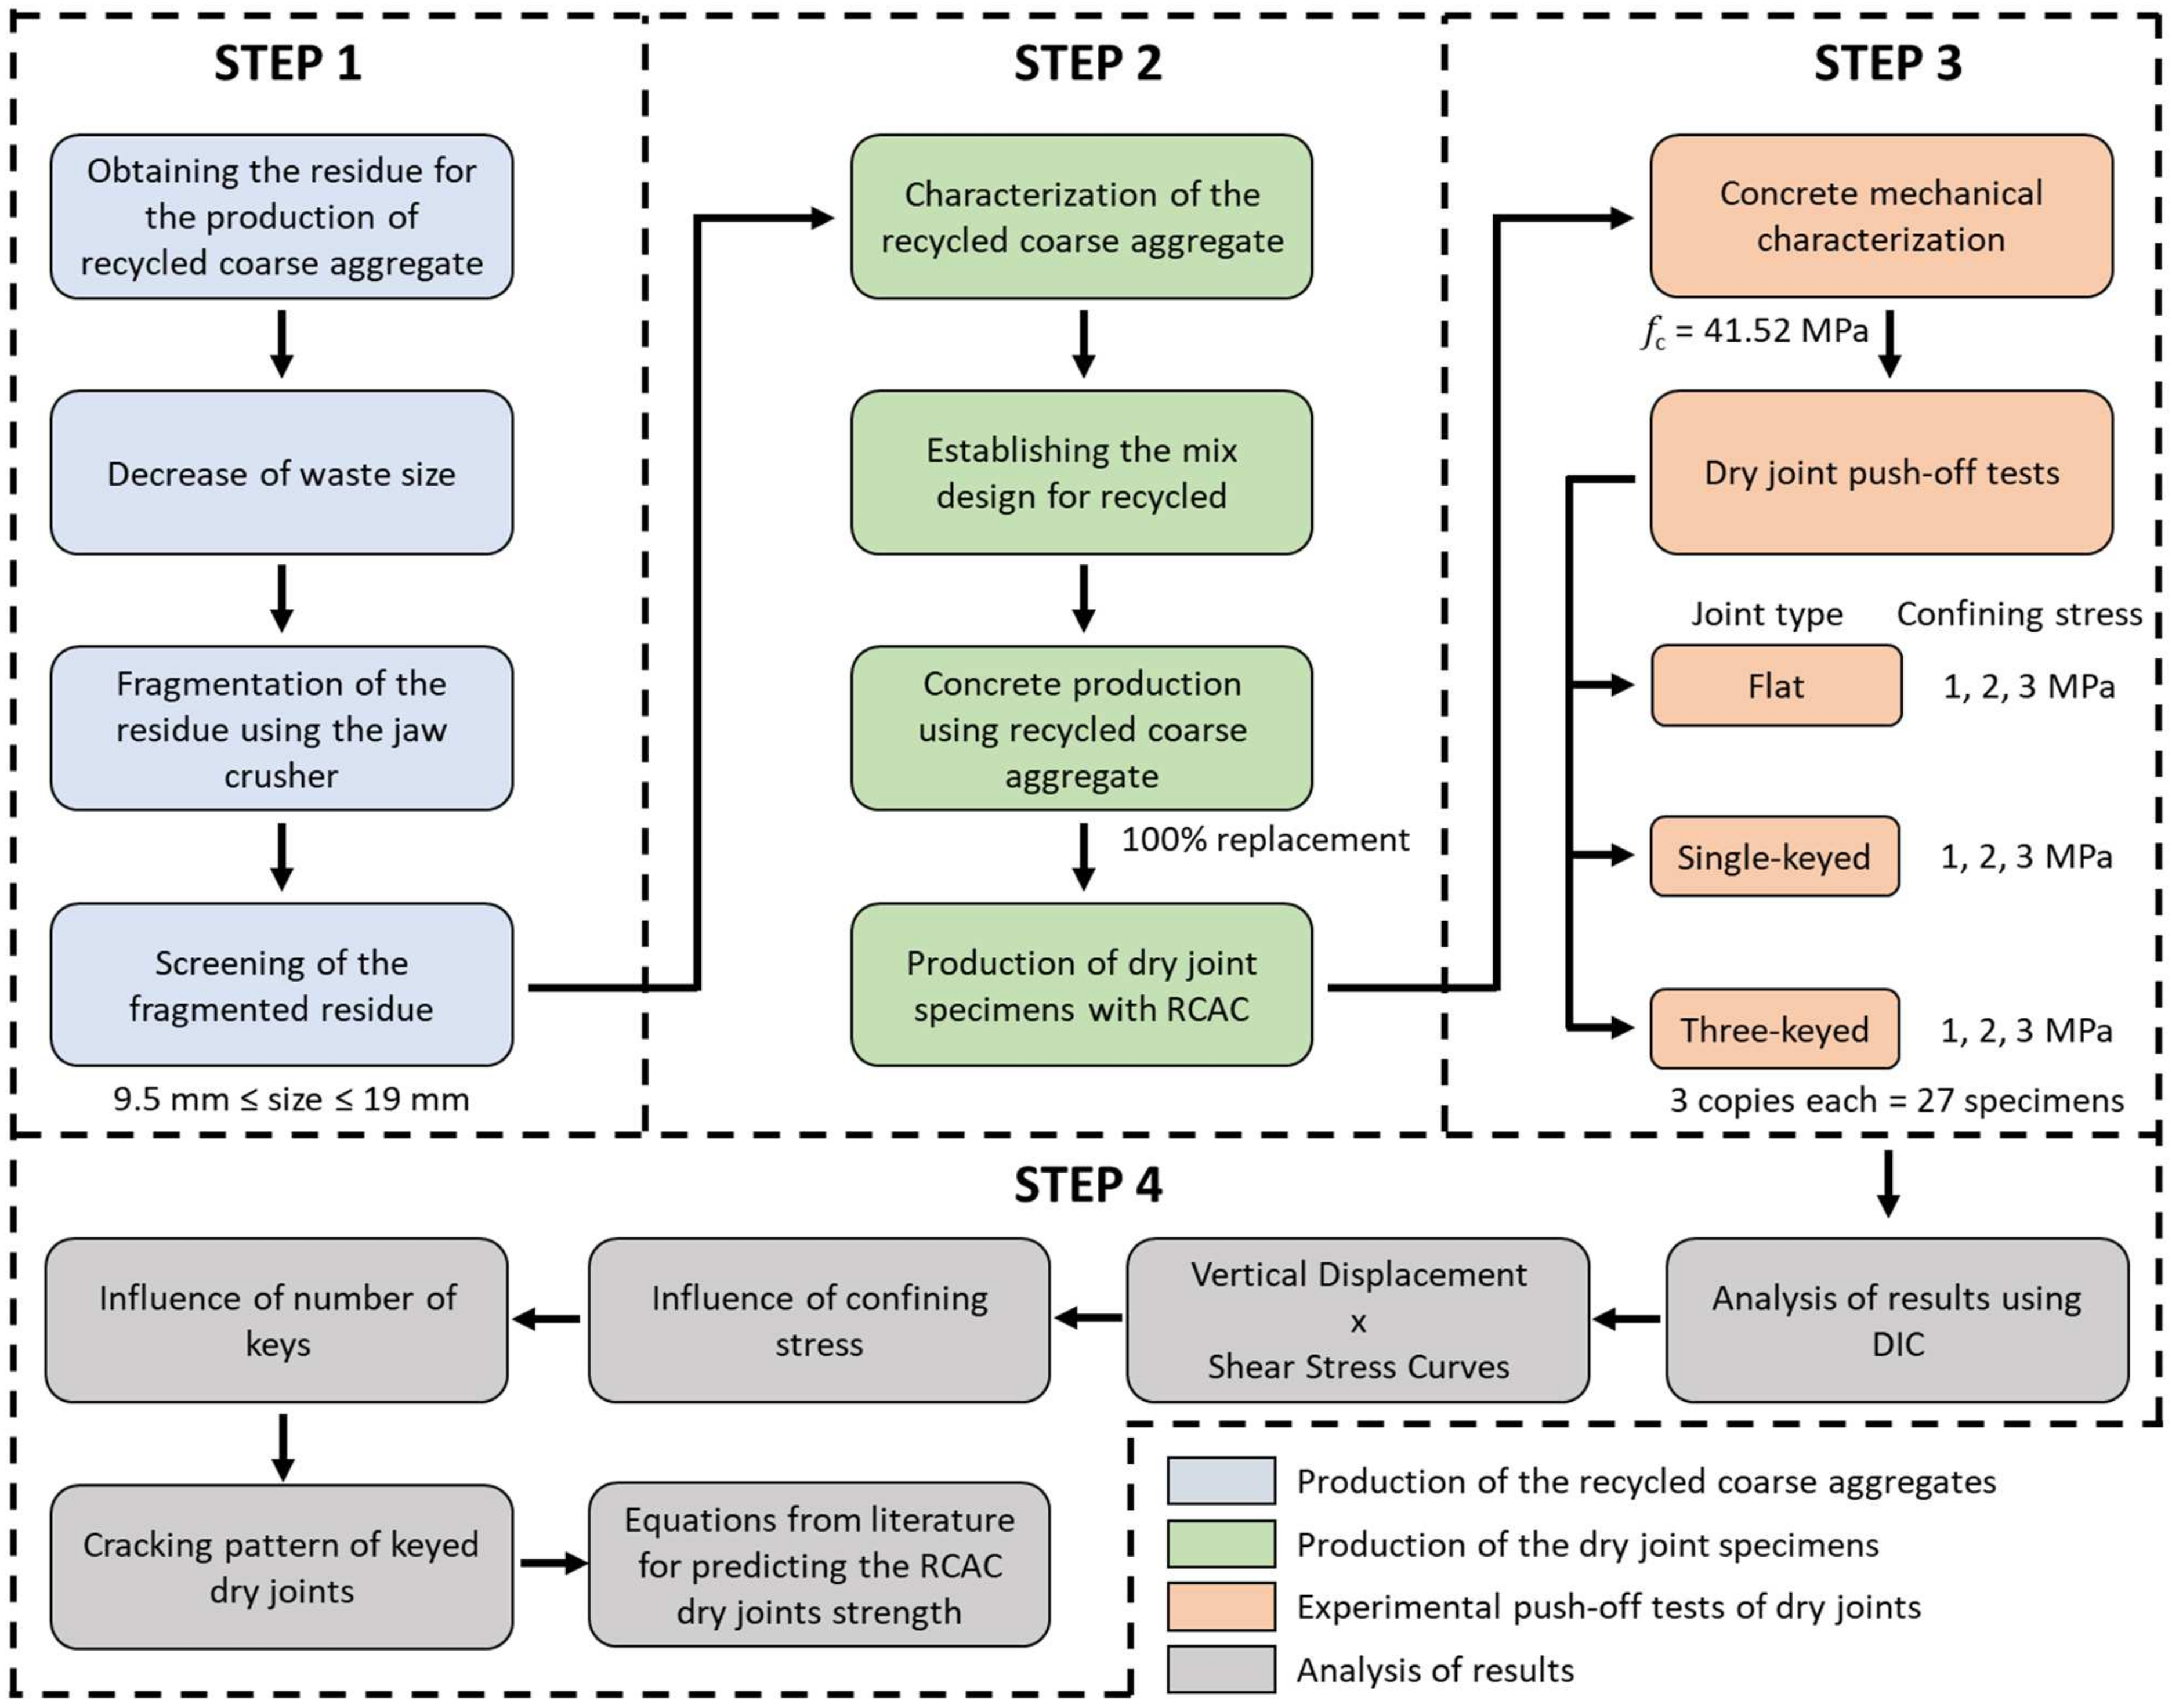
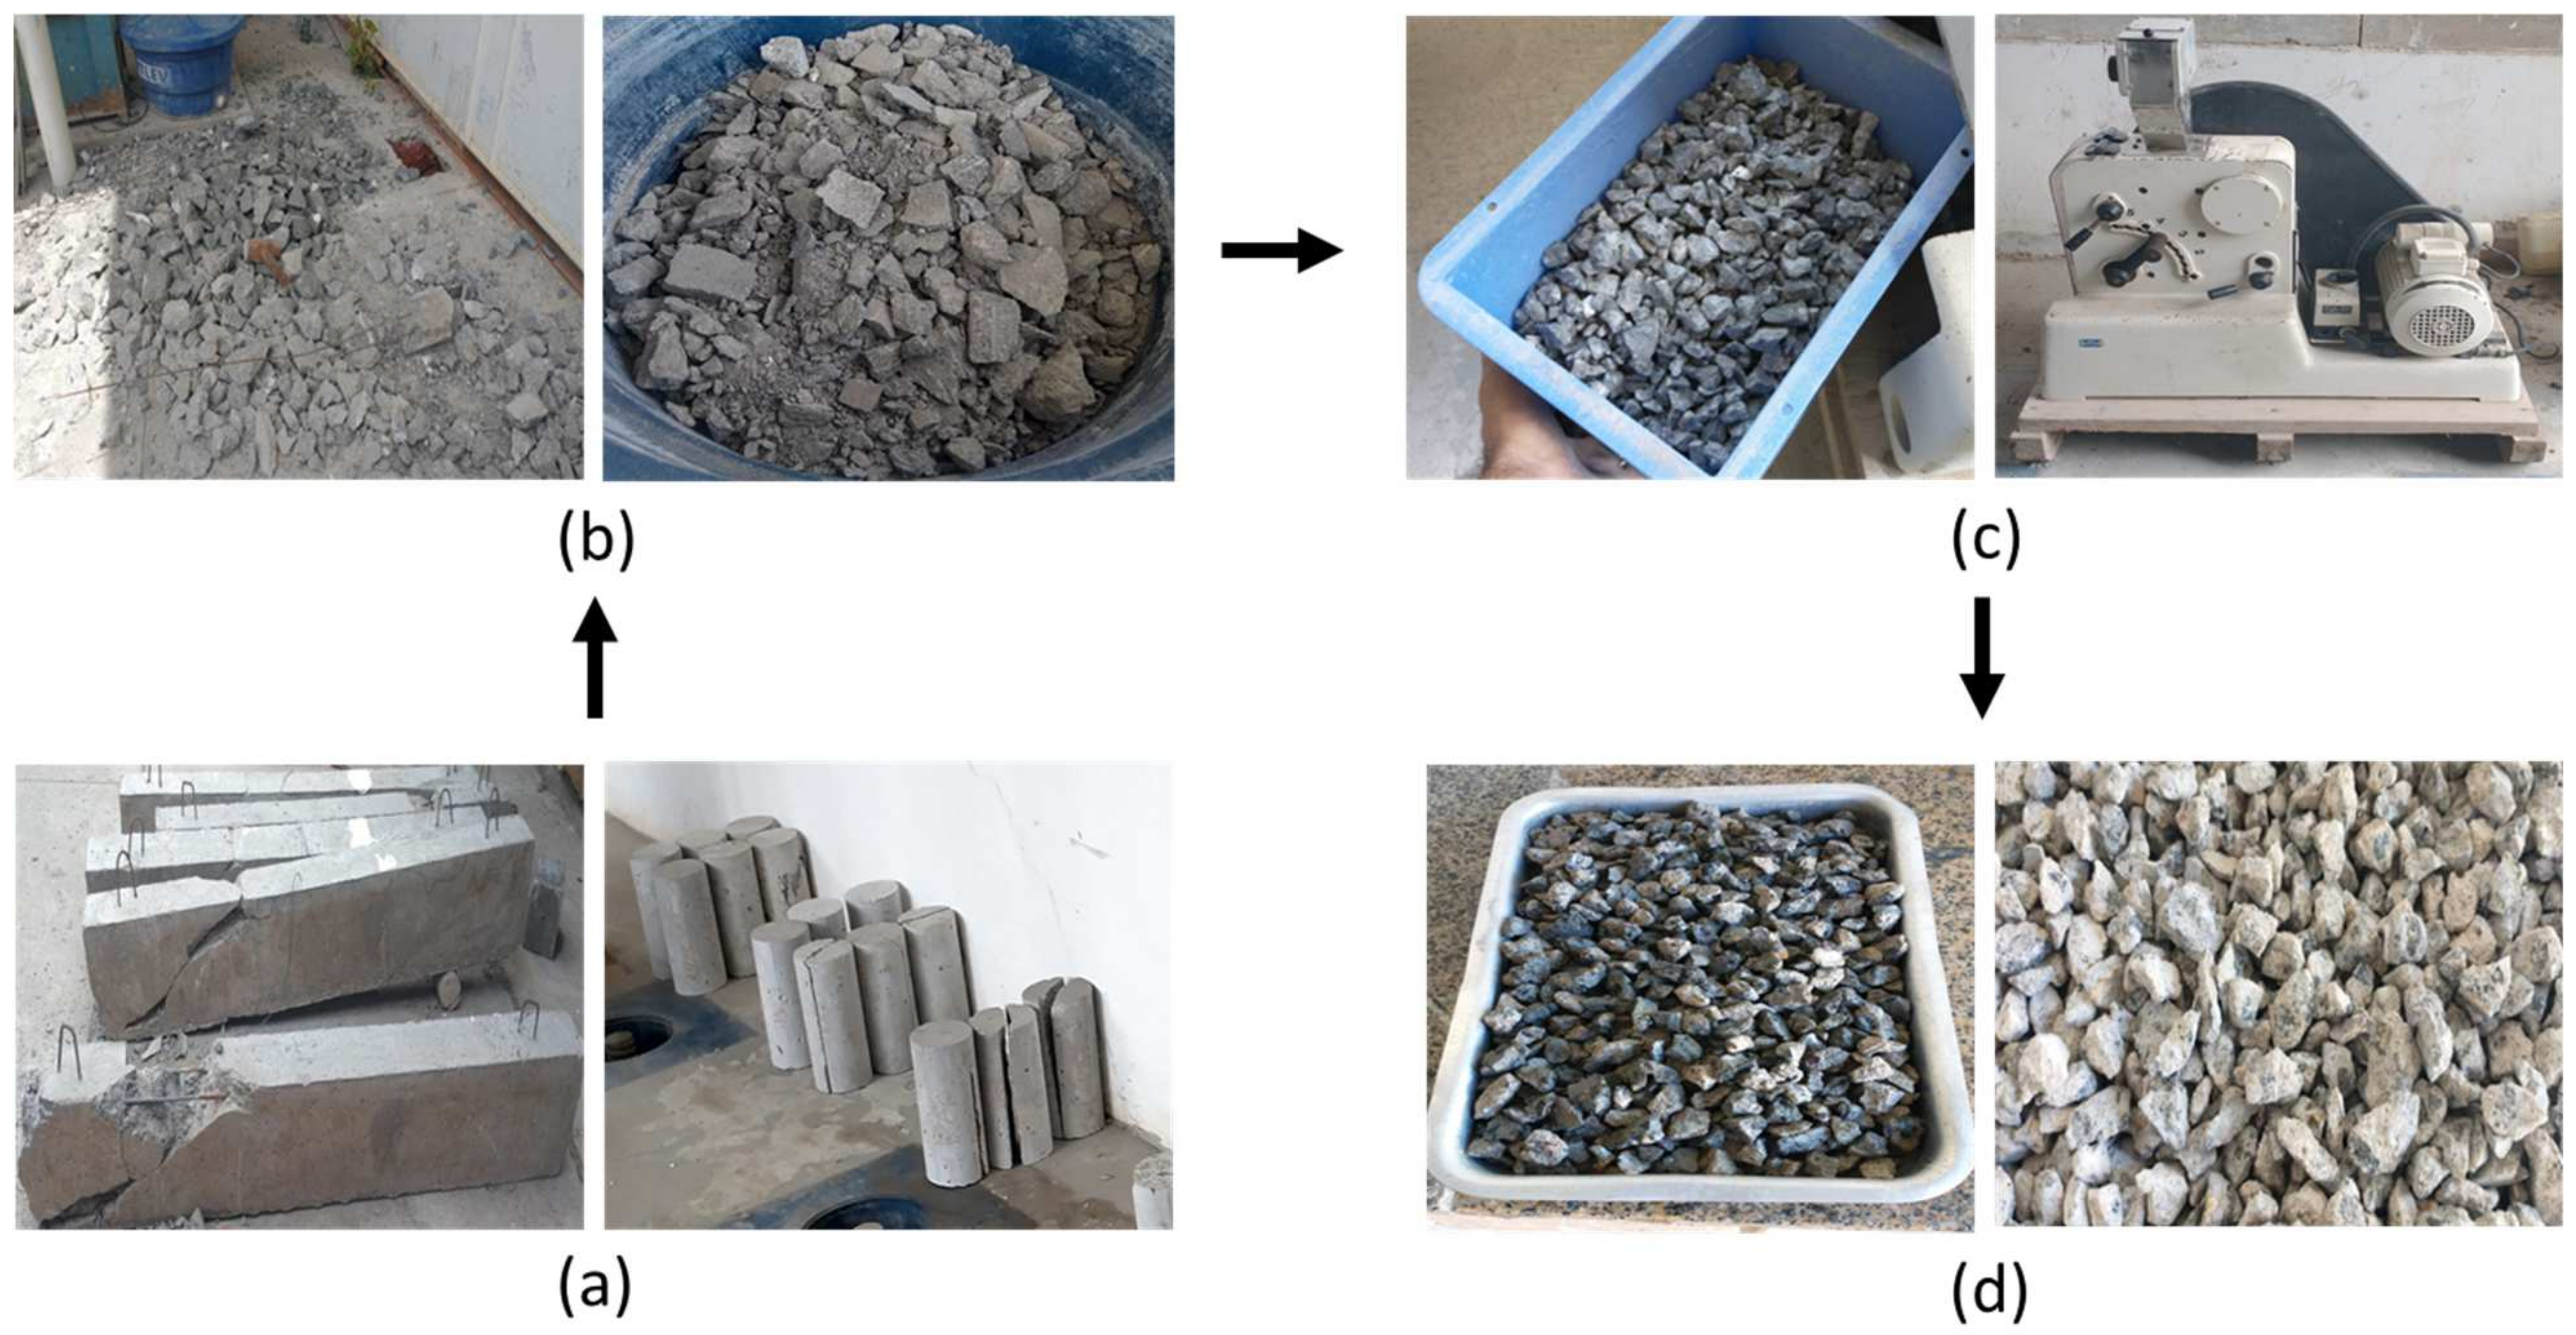
2. Materials and Methods
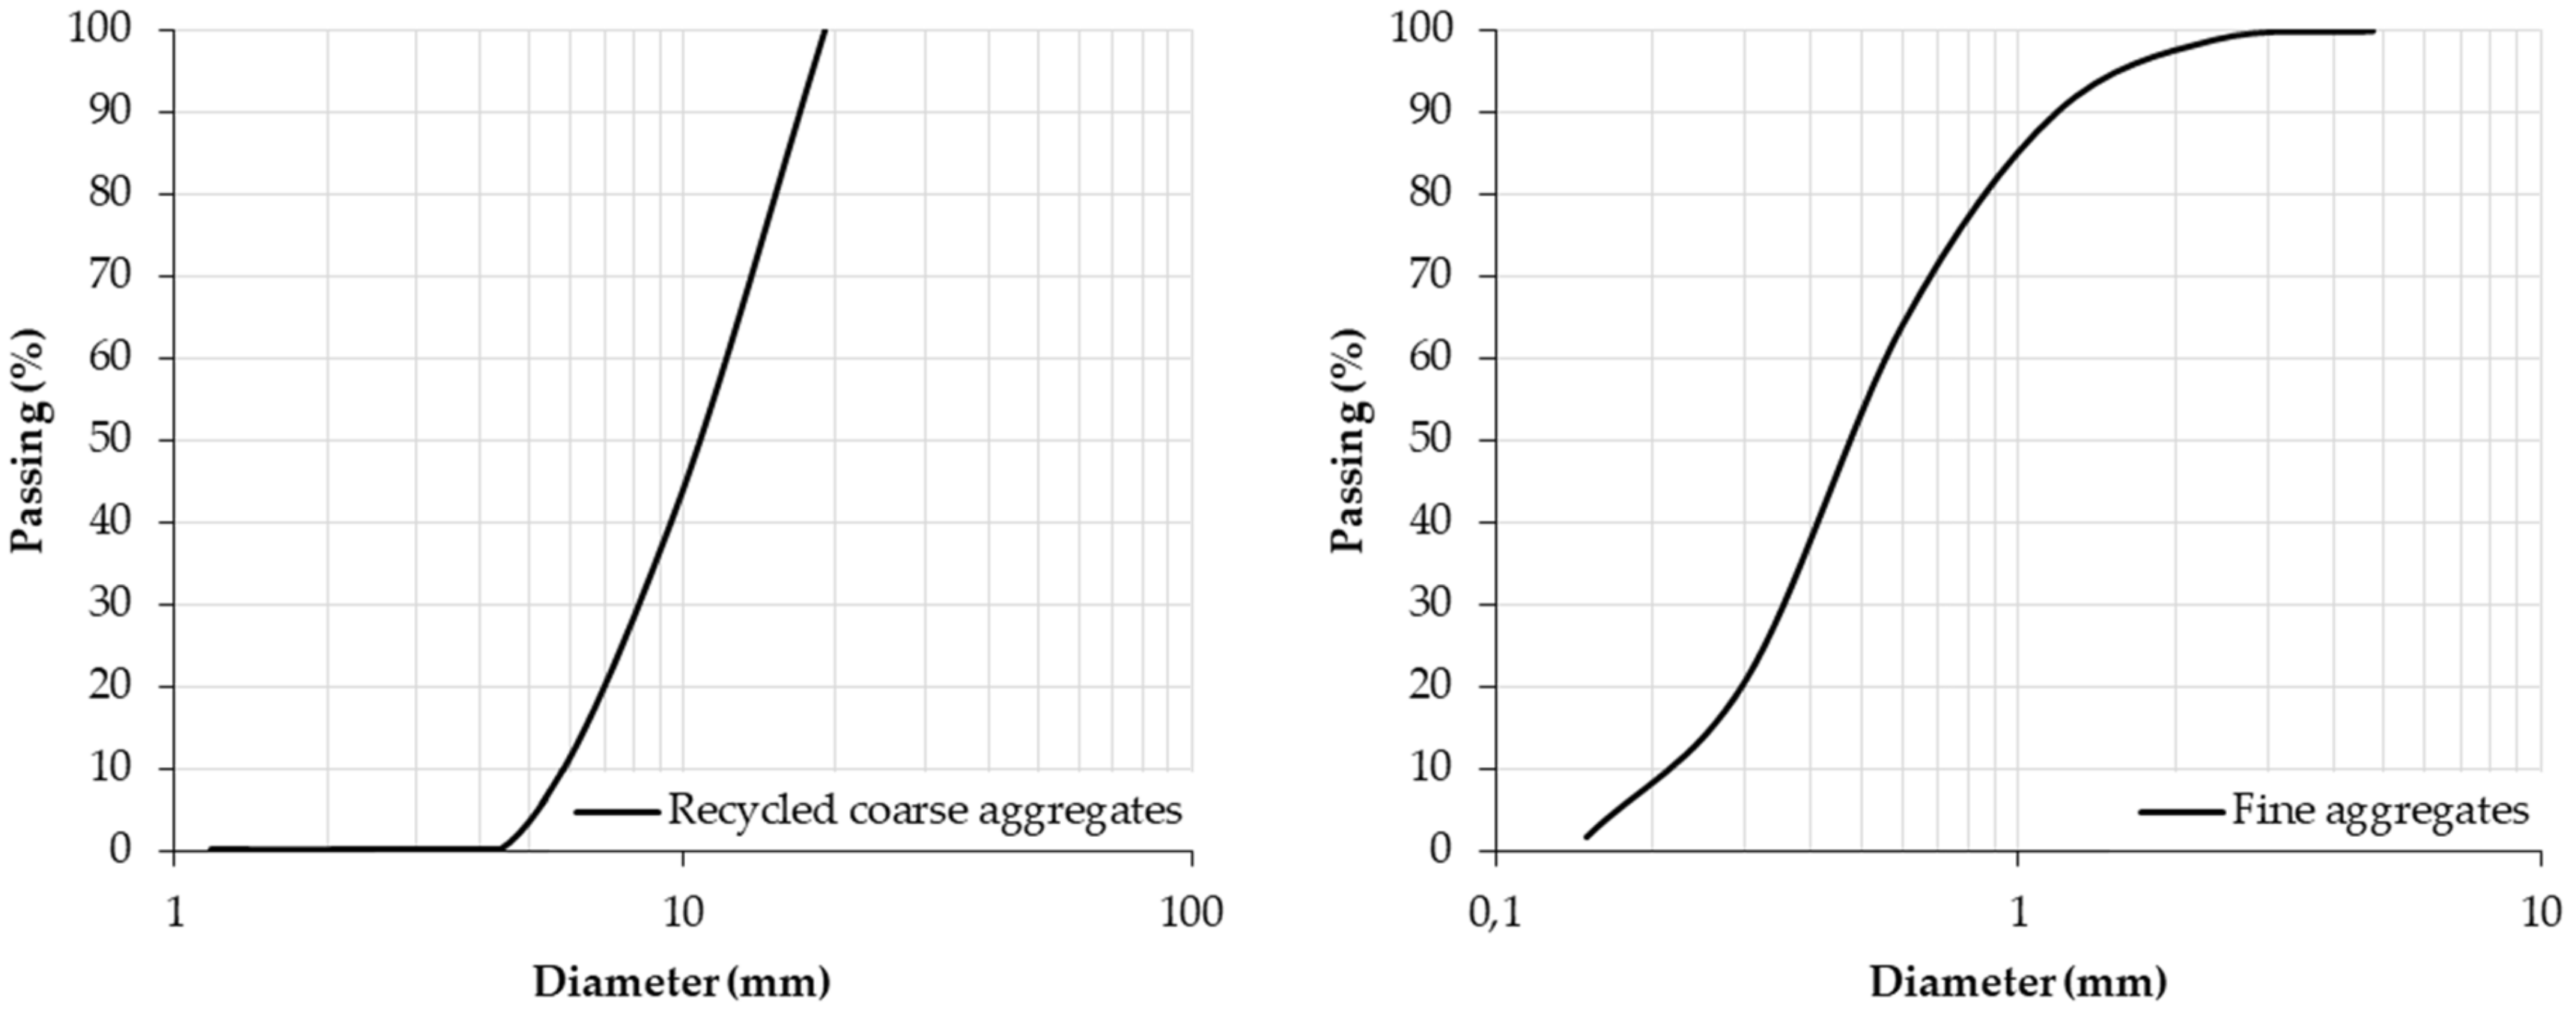
The methodology of this work is presented in the flowchart of Figure 3.

2.1. Materials

A Brazilian cement type CPII-E-32 [31] (Portland cement with the addition of granulated blast furnace slag and a minimum 28-day compressive strength of 32 MPa) was used as the main binder in the concrete production.
The conventional fine aggregate was natural quartz sand from the Paraíba do Sul River, in the city of Campos dos Goytacazes–RJ, with a specific mass equal to 2.63 g/cm3 [32] and a unit mass in the loose and dry state equal to 1.54 g/cm3 [32].
The recycled coarse aggregates were produced by crushing waste materials from specimens used in previous research, from which the concrete had a compressive strength of 50 to 70 MPa. Figure 4 shows the manufacturing process of the recycled coarse aggregates, and Table 3 shows information about the recycled coarse aggregates.
Figure 5 shows the granulometry of the recycled coarse aggregates and the fine aggregates used in concrete.

2.2. Concrete Proportioning

The concrete dosage was performed to obtain a compressive strength of 30 MPa at 28 days. Table 4 shows the quantities of the materials in the dosage.
The compressive strength at 28 days was determined on cylindrical samples with a diameter of 100 mm and a height of 200 mm.
The concrete was produced with a 100% substitution content of conventional aggregates by recycled aggregates. Table 5 shows the properties of RAC used in producing the dry joint specimens.

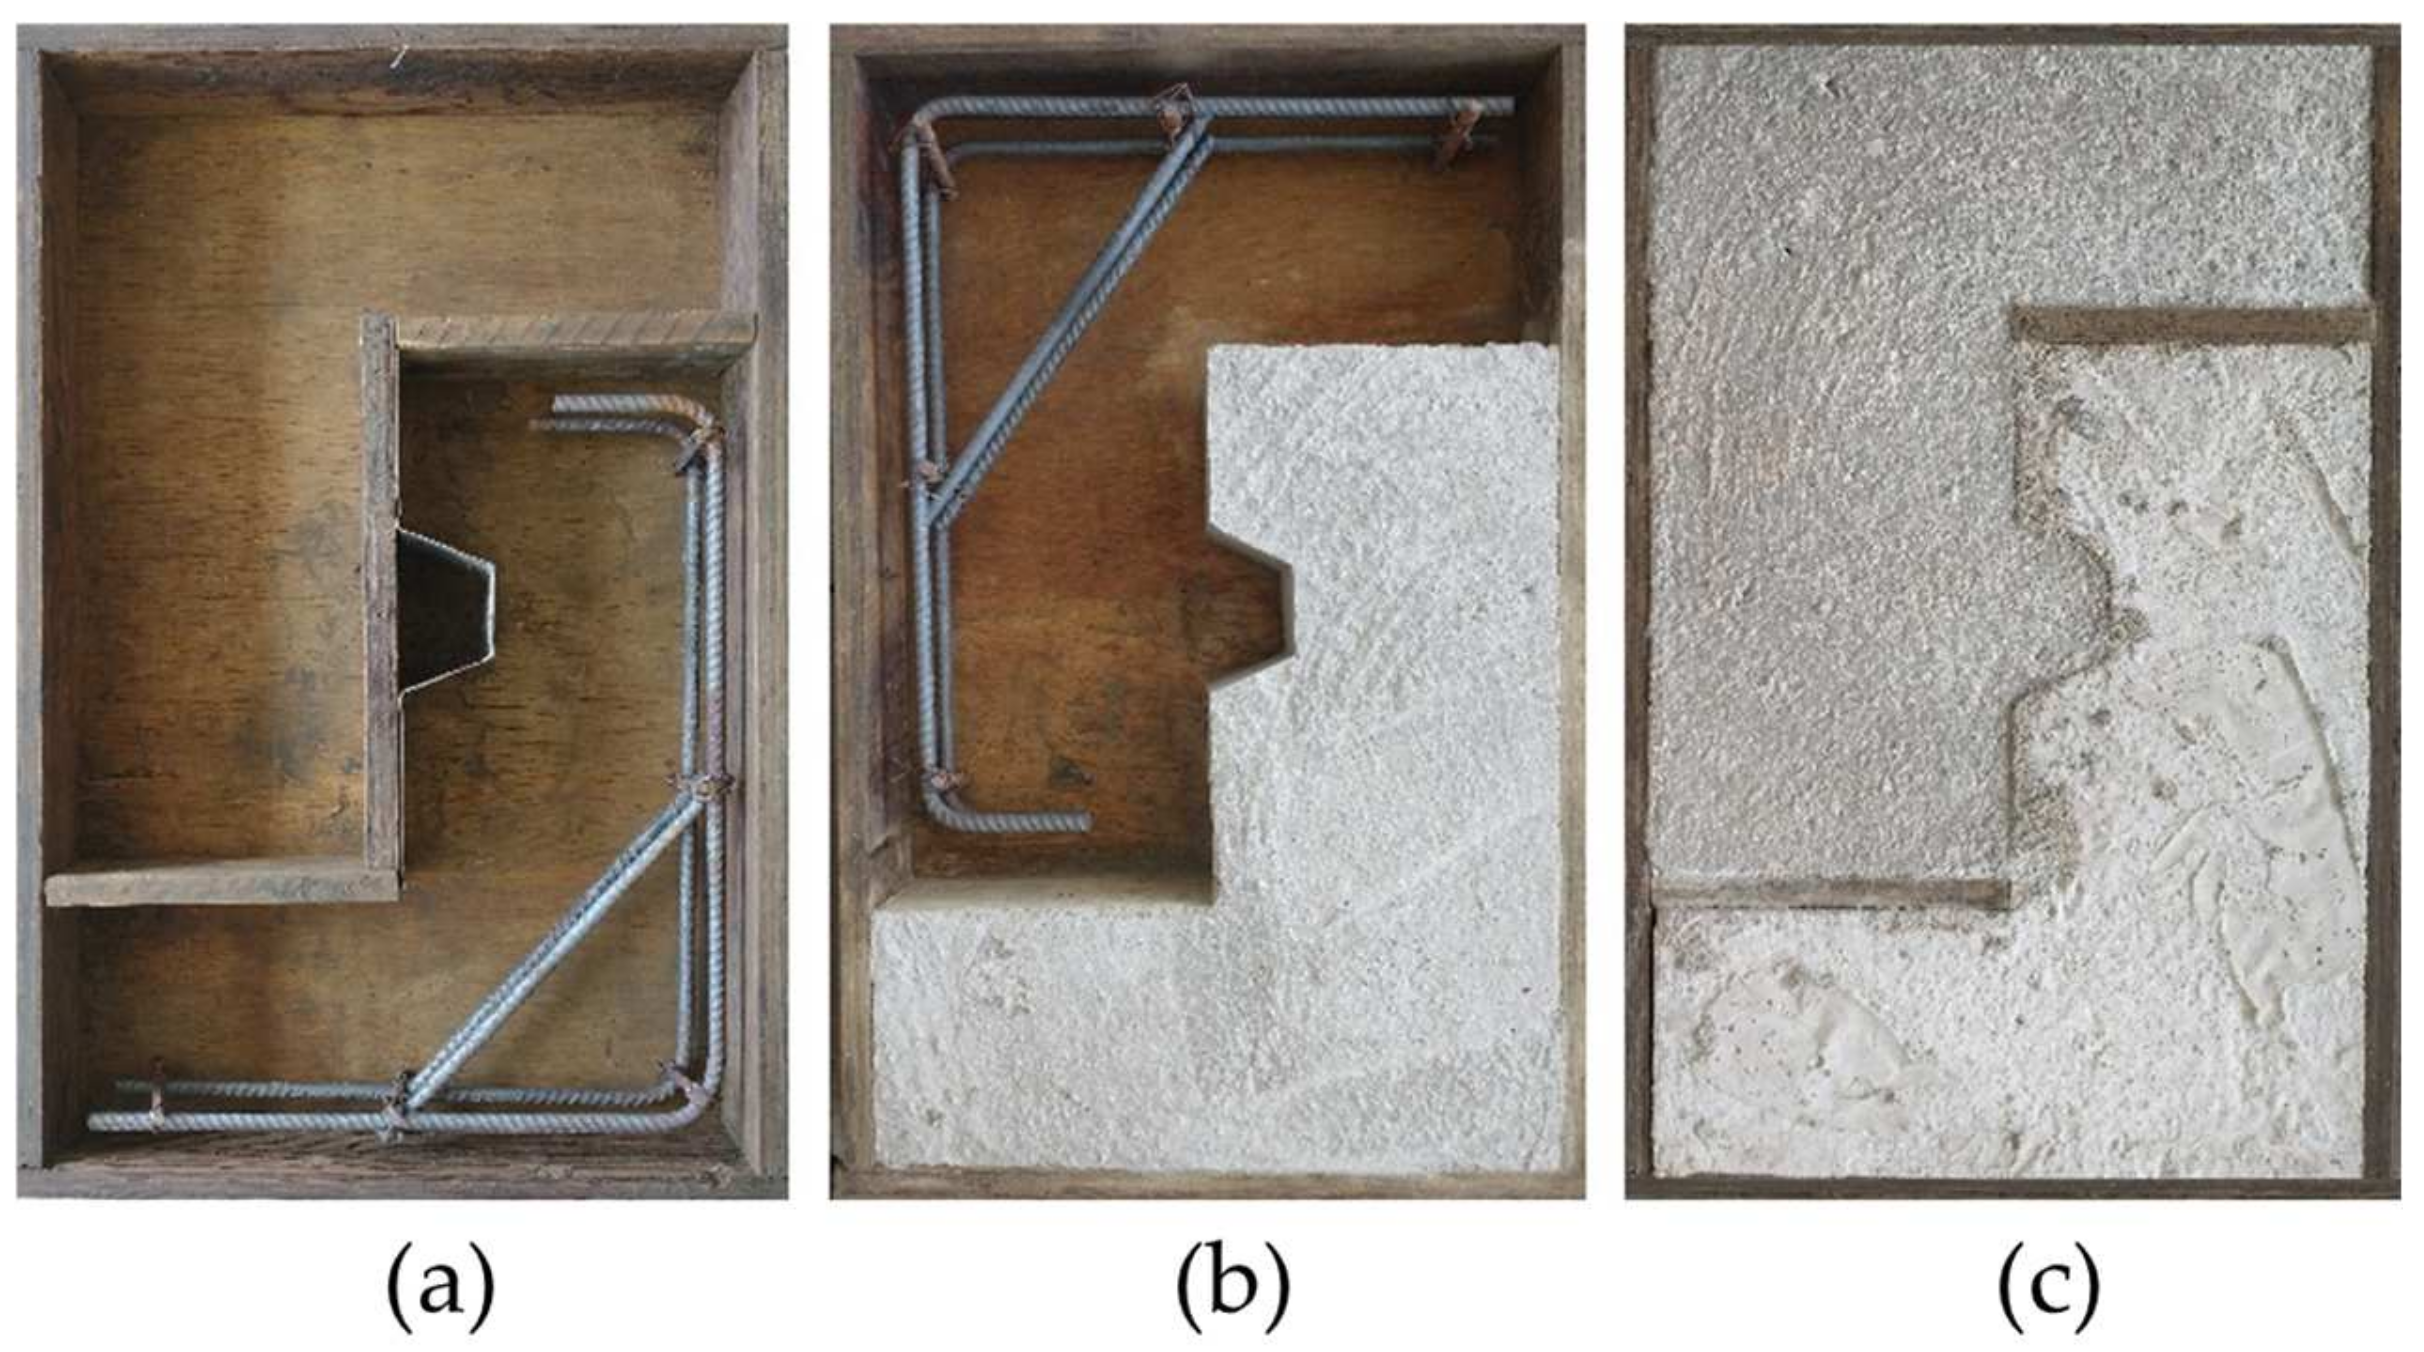
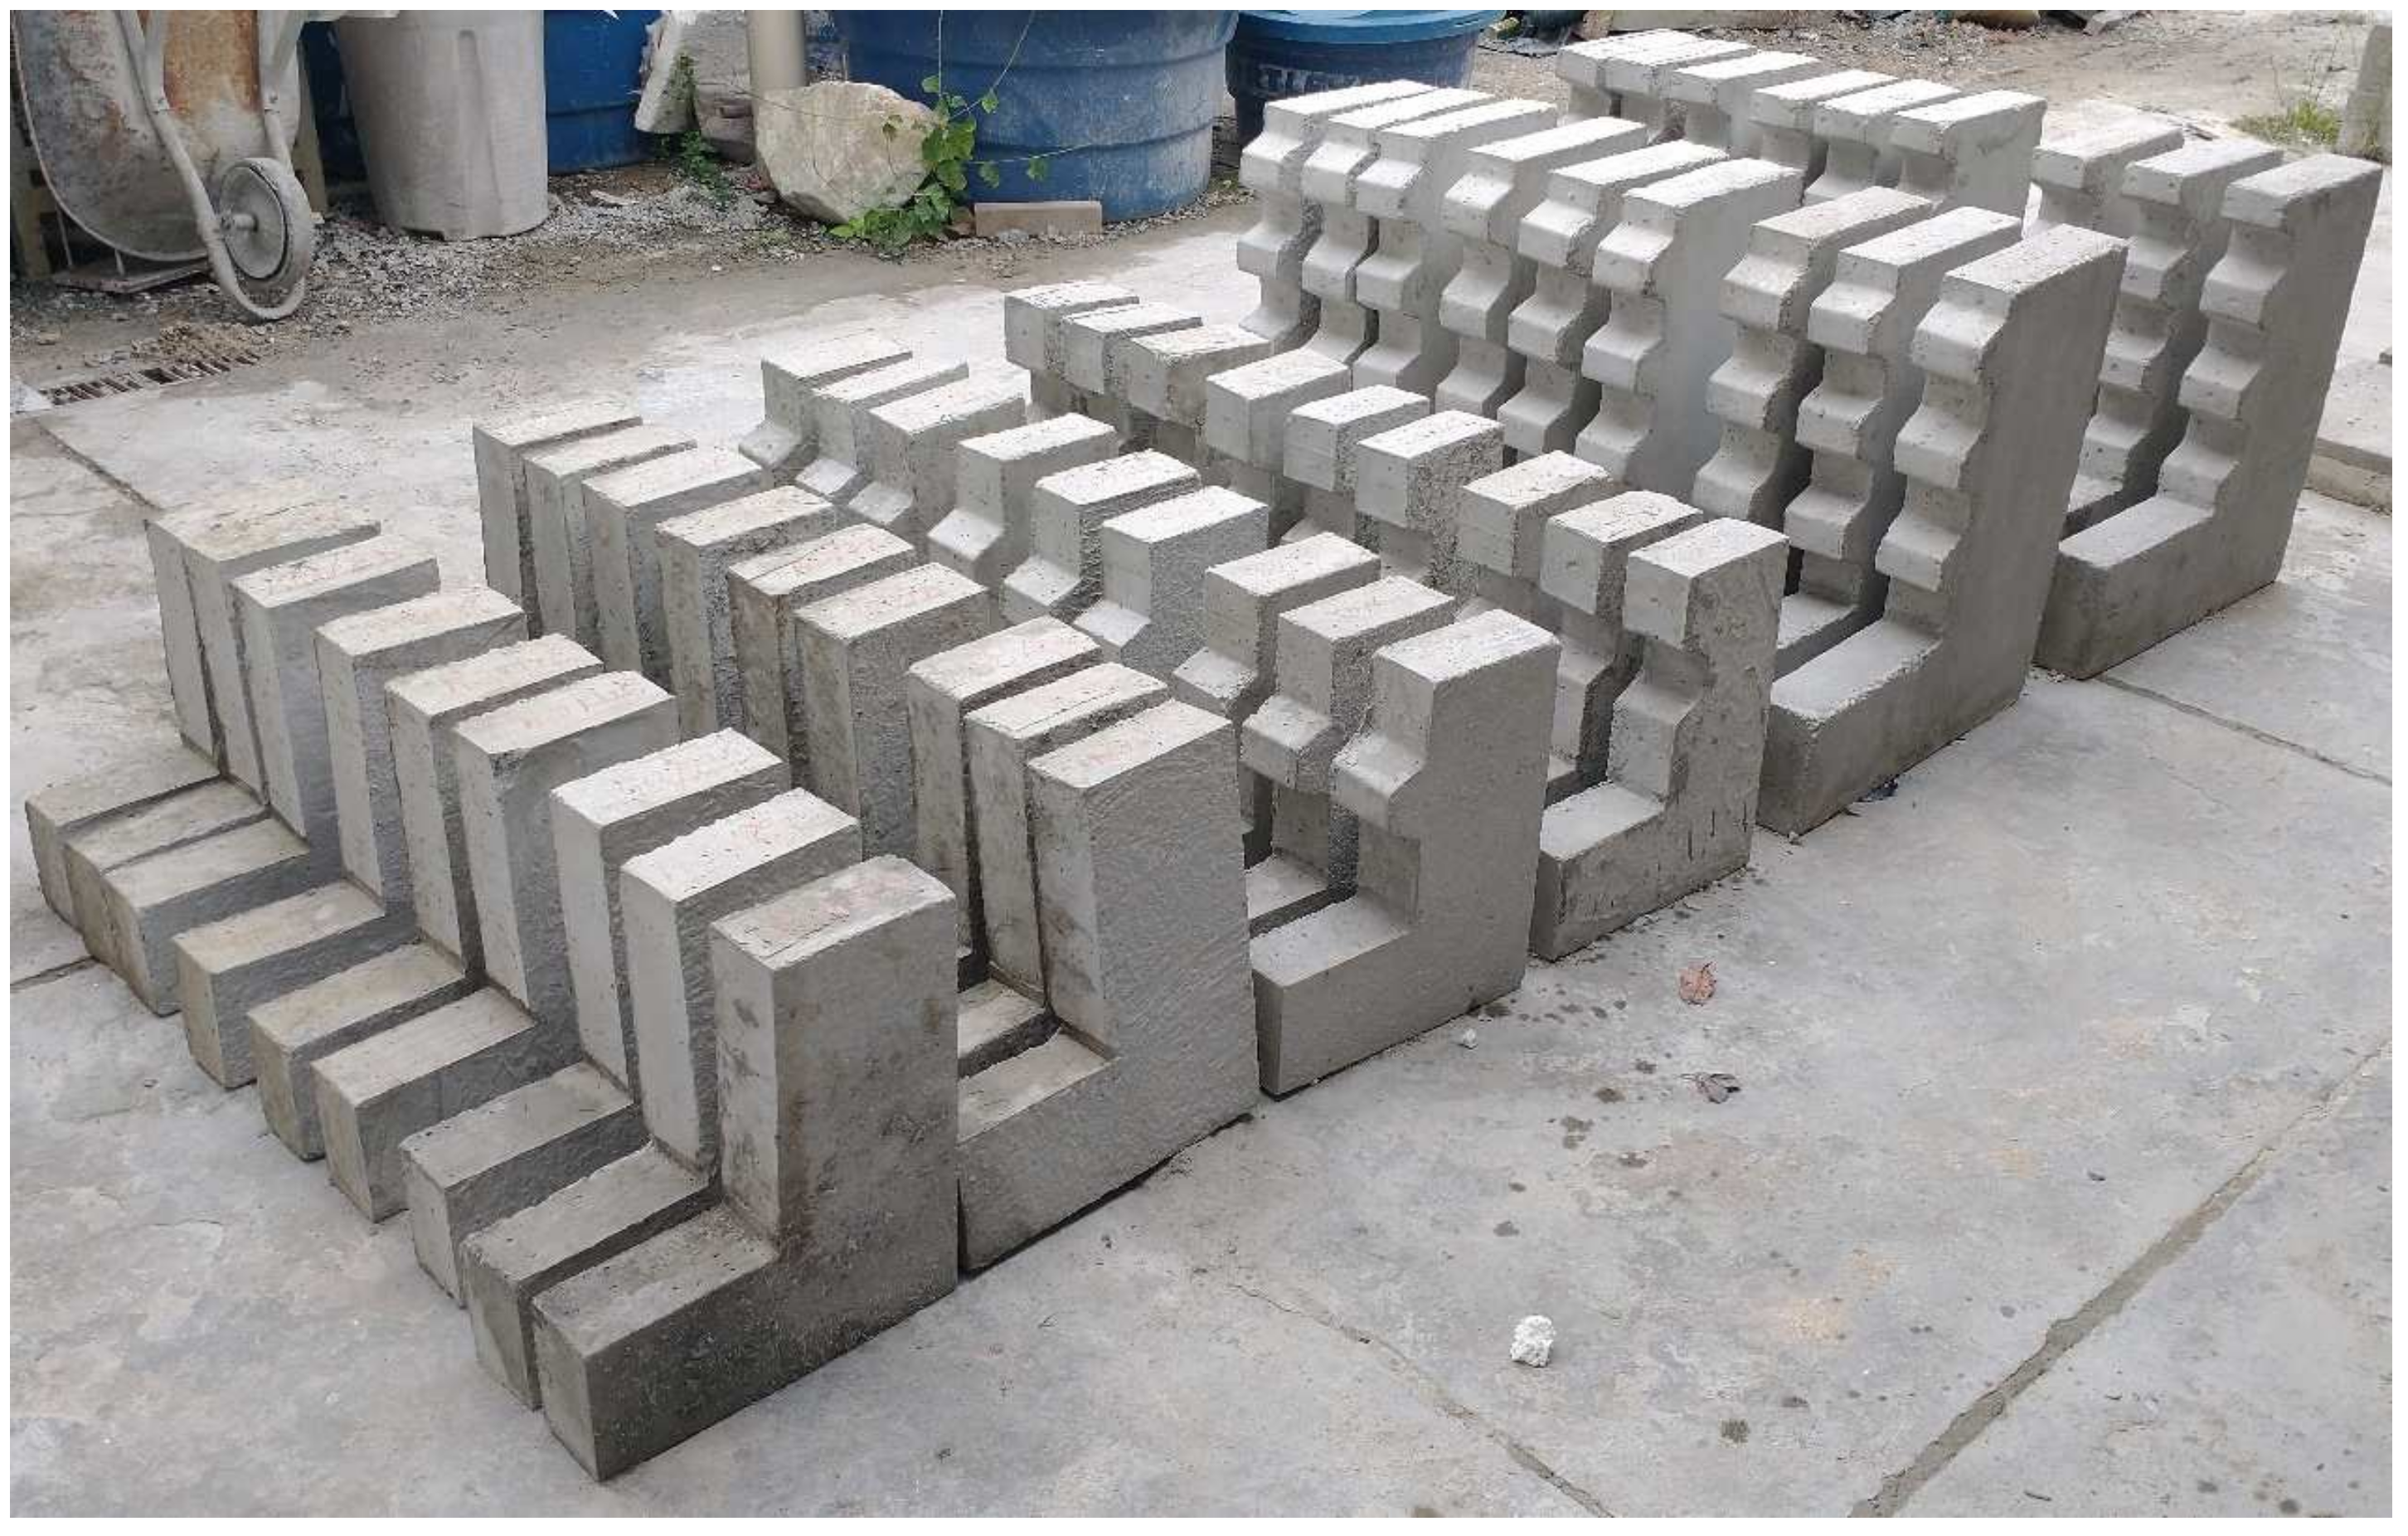
2.3. Details of Specimens

Push-off test specimens were produced similar to those used by other researchers [13,30,40,41,42,43,44] to study the shear behavior of dry joints with recycled coarse aggregate concrete.
The dimensions and configurations of the specimens used in the experiments of the flat, single-keyed, and three-keyed dry joints are shown in Figure 6.
Twenty-seven dry joint specimens were produced, and the results were obtained using the average of three specimens. All specimens were 100 mm wide. Reinforcements with a diameter of 12 mm were used in the specimens to ensure that the failed occurs by shear-controlled failure in the keys. The flat and single-keyed dry joints specimens had a shear plane area of 30,000 mm2, and the three-keyed dry joints specimens had 50,000 mm2.
Table 6 shows information about the dry joint specimens. The following nomenclature was chosen: CPRX–J–T, where CPR means dry joint specimen with recycled coarse aggregates concrete; the X is the specimen number, varying from 1 to 3; the J is the joint type: (L) Flat, (1) single-keyed, and (3) three-keyed; and T is the applied confining stress (1.0, 2.0, or 3.0 MPa). For example, specimen CPR2-1-3.0 is the second specimen of the dry joint specimen with one key subjected to the 3.0 MPa confining stress.

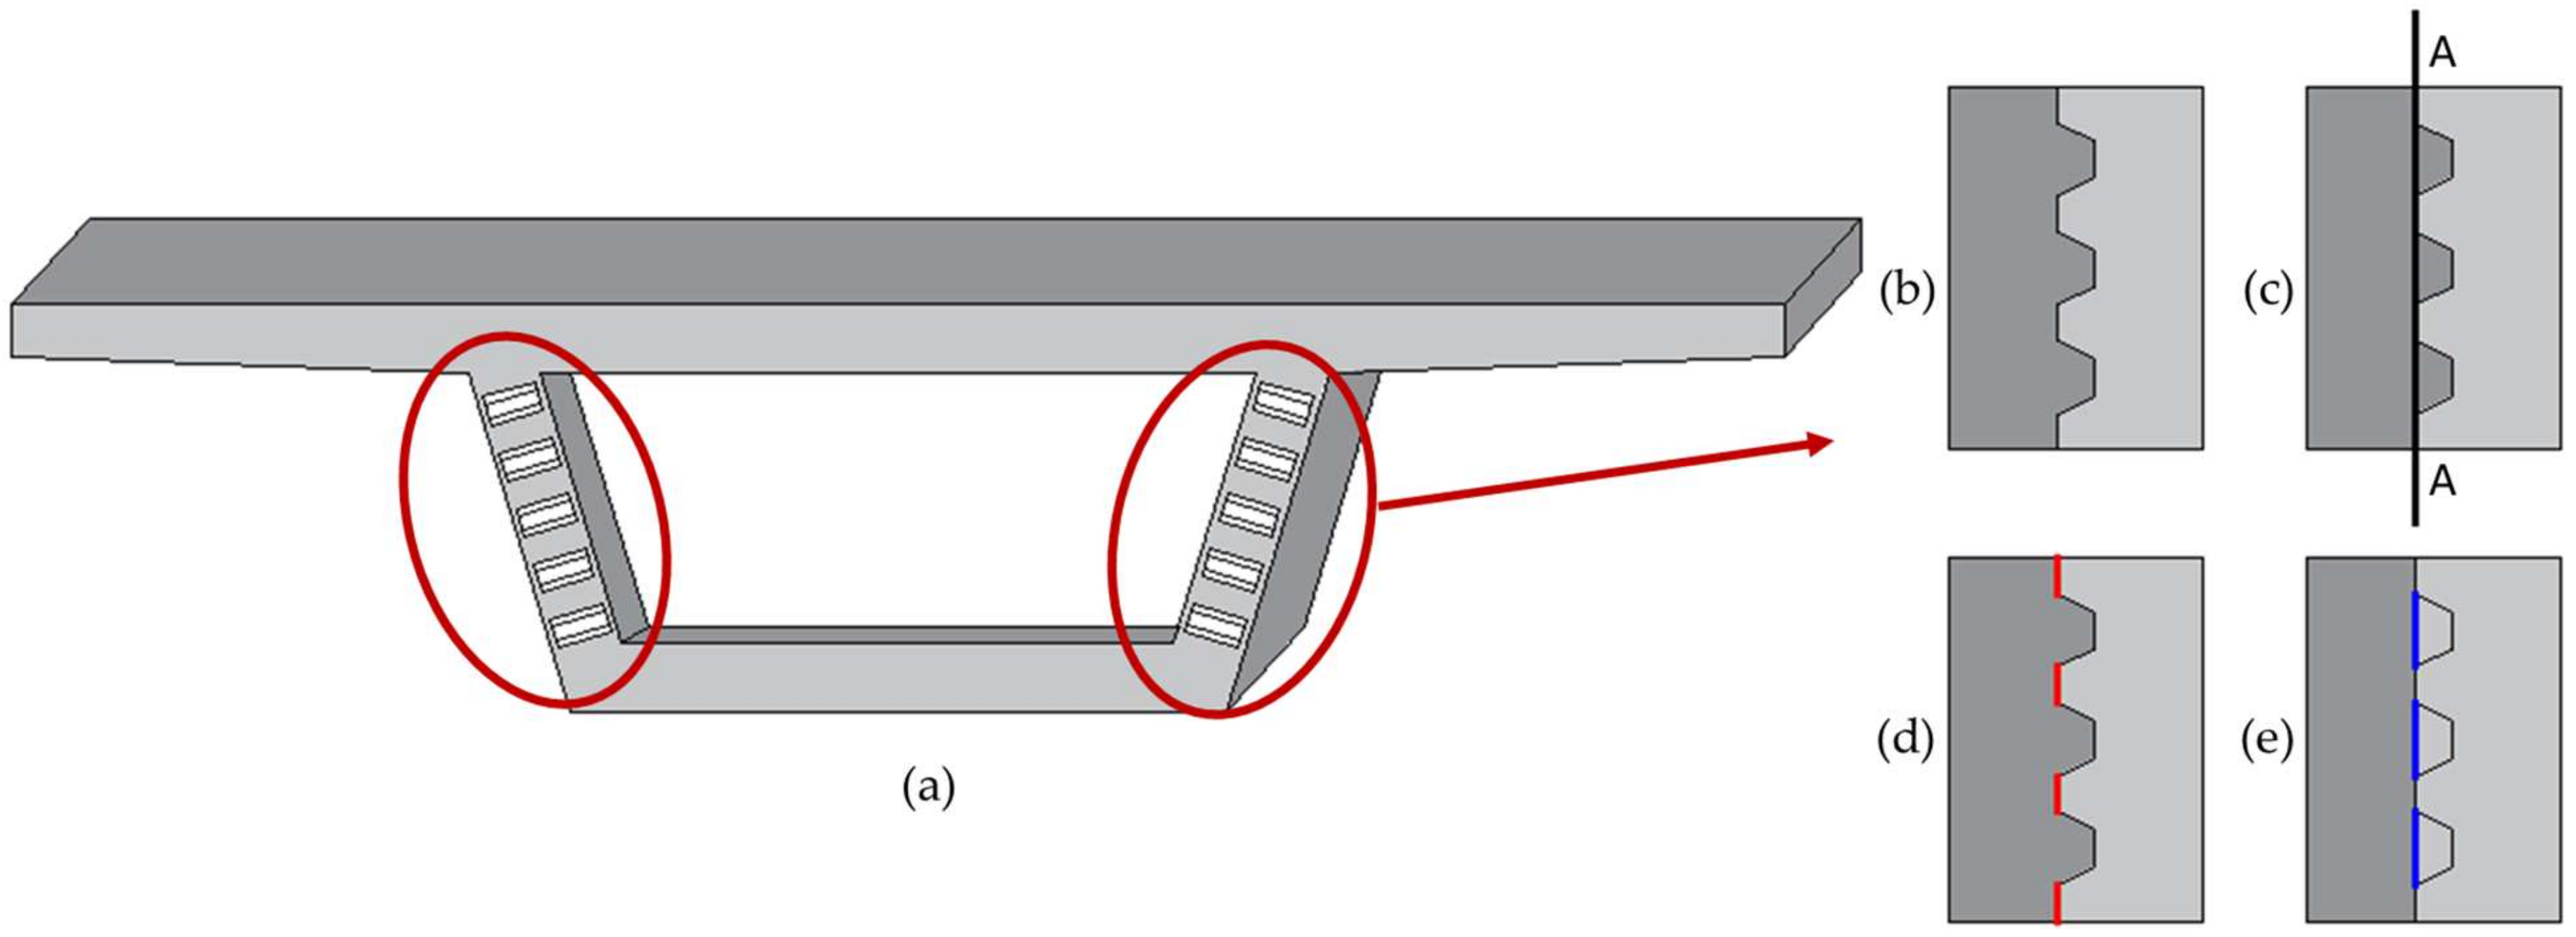
2.4. Details of Specimens

The specimens were produced in wooden forms (Figure 7a). To produce the shear key specimens, the part that receives the key was produced first (Figure 7b). Then, the wooden parts were removed from the formwork in the shear plane, and the key part was cast using the previously part as a mold (Figure 7c). The flat joint specimens were produced similarly. The specimens are shown in Figure 8.

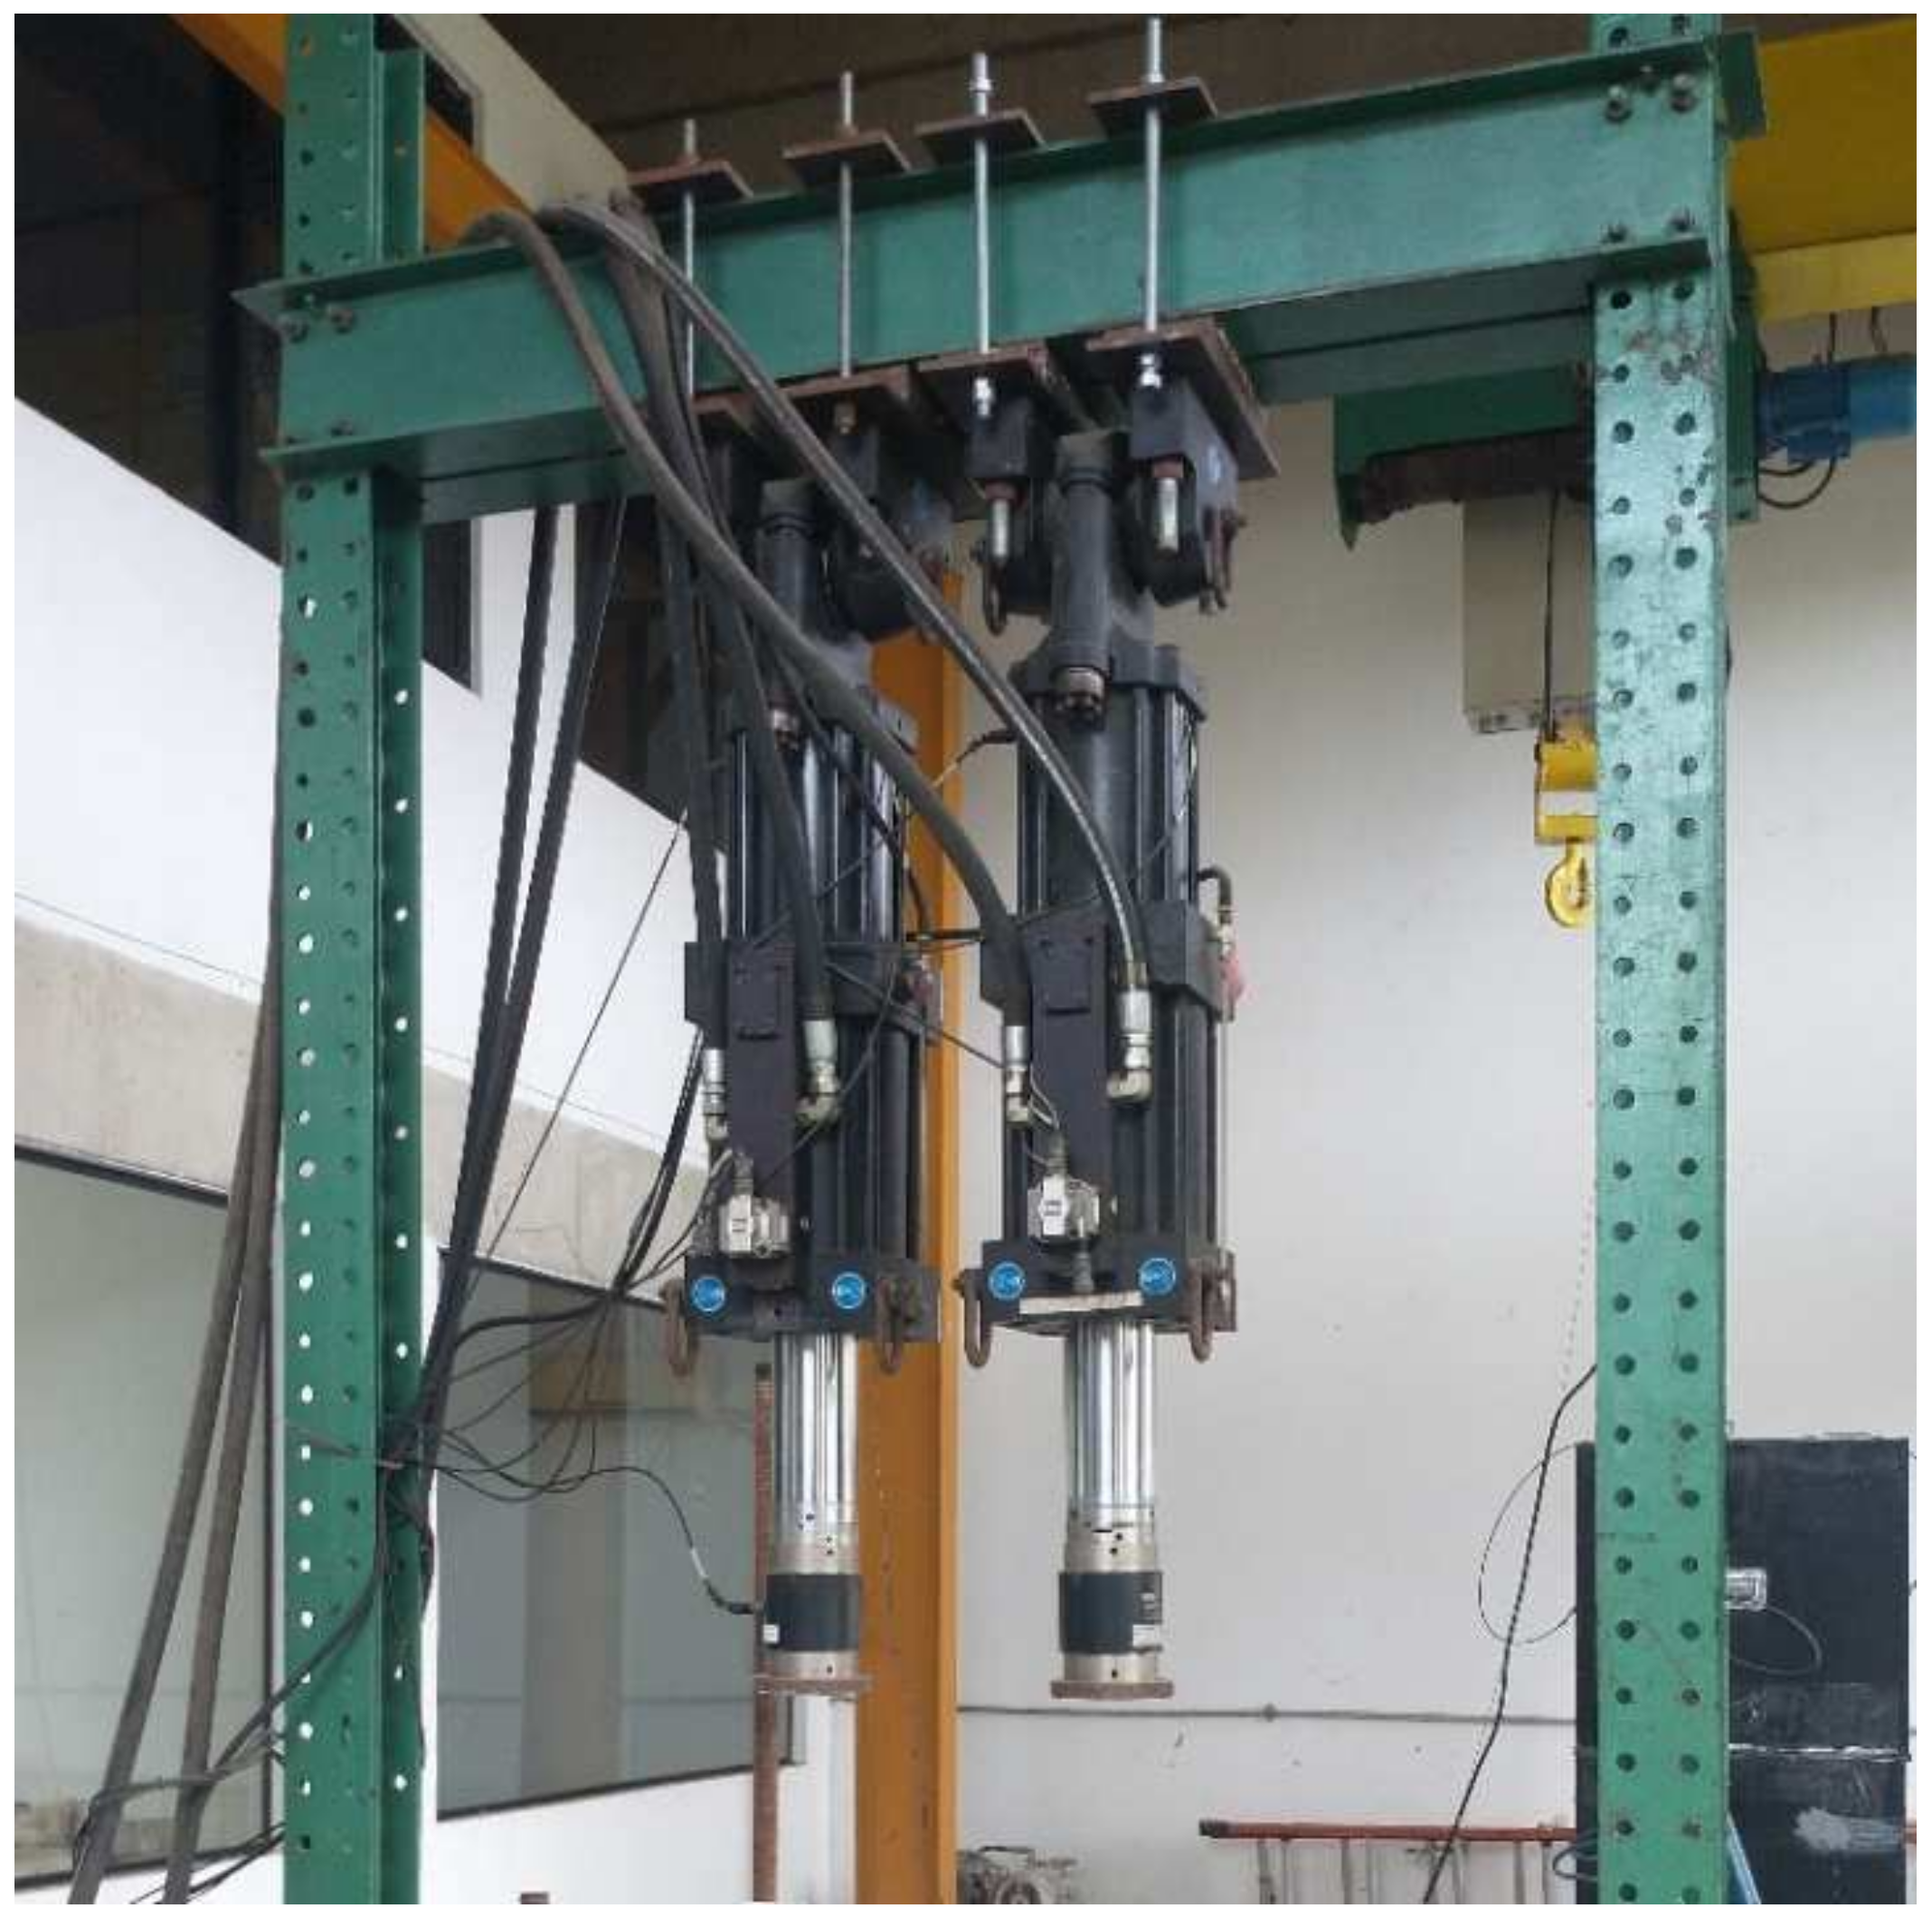
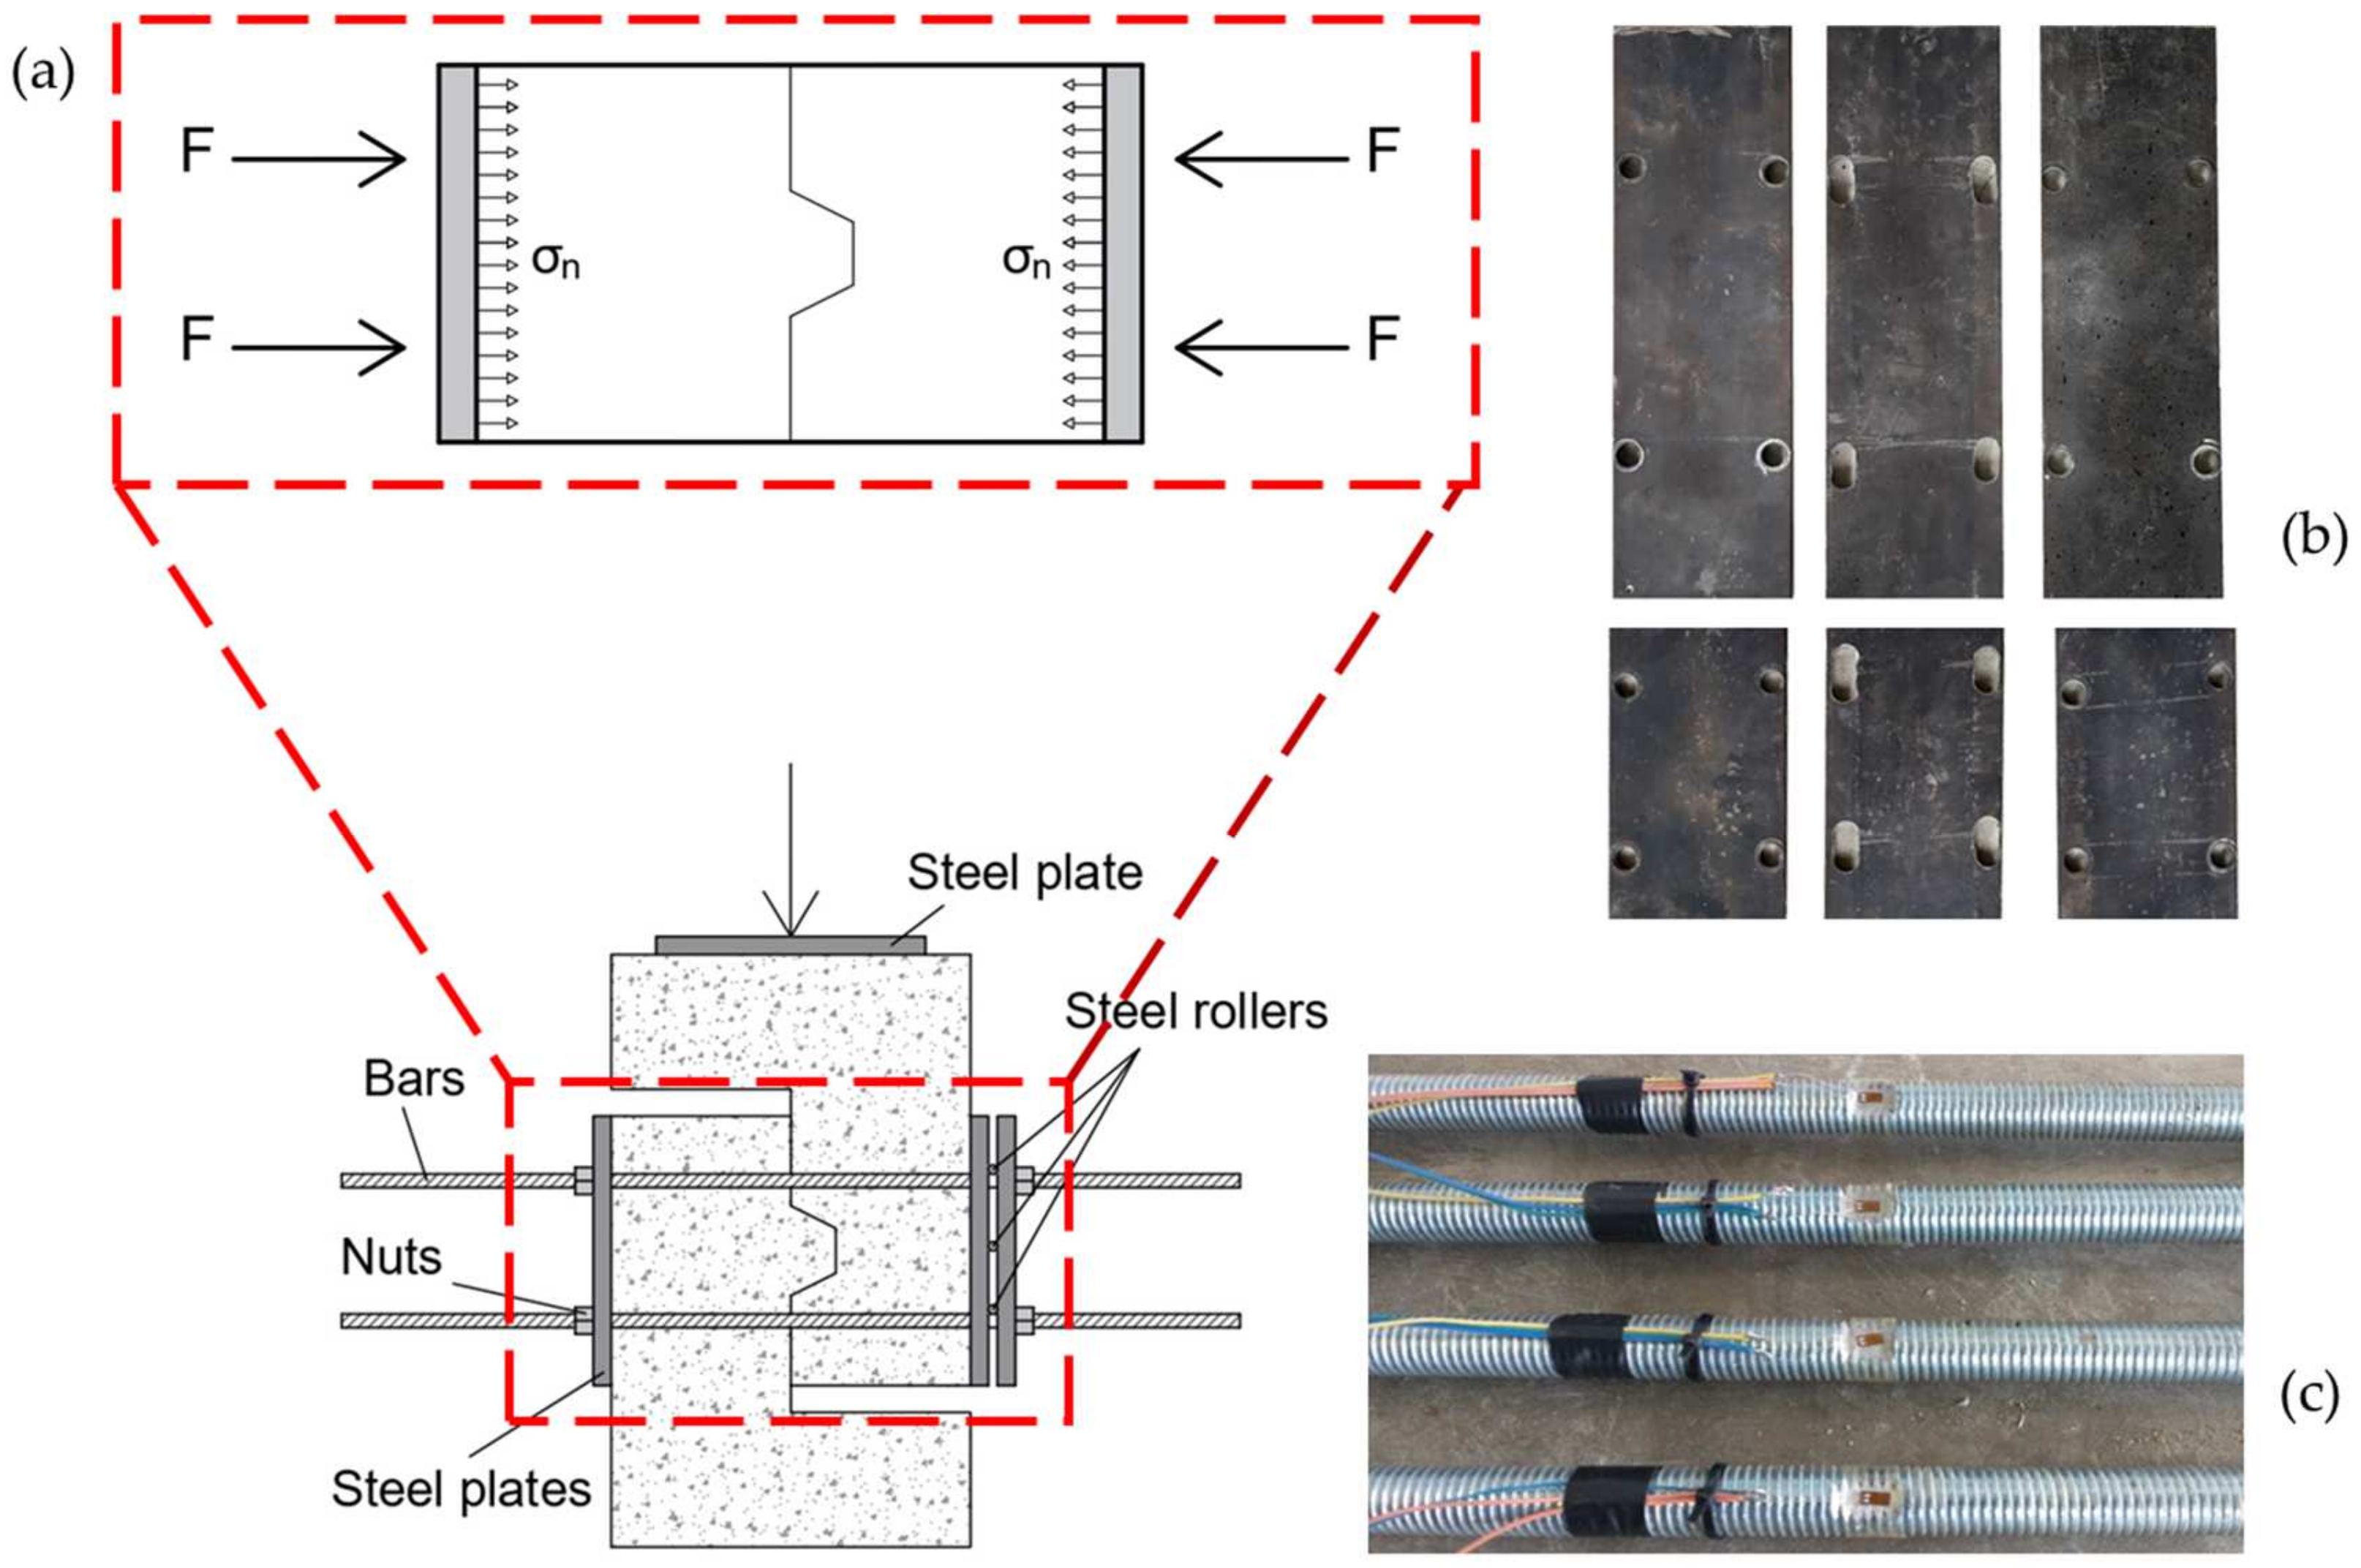
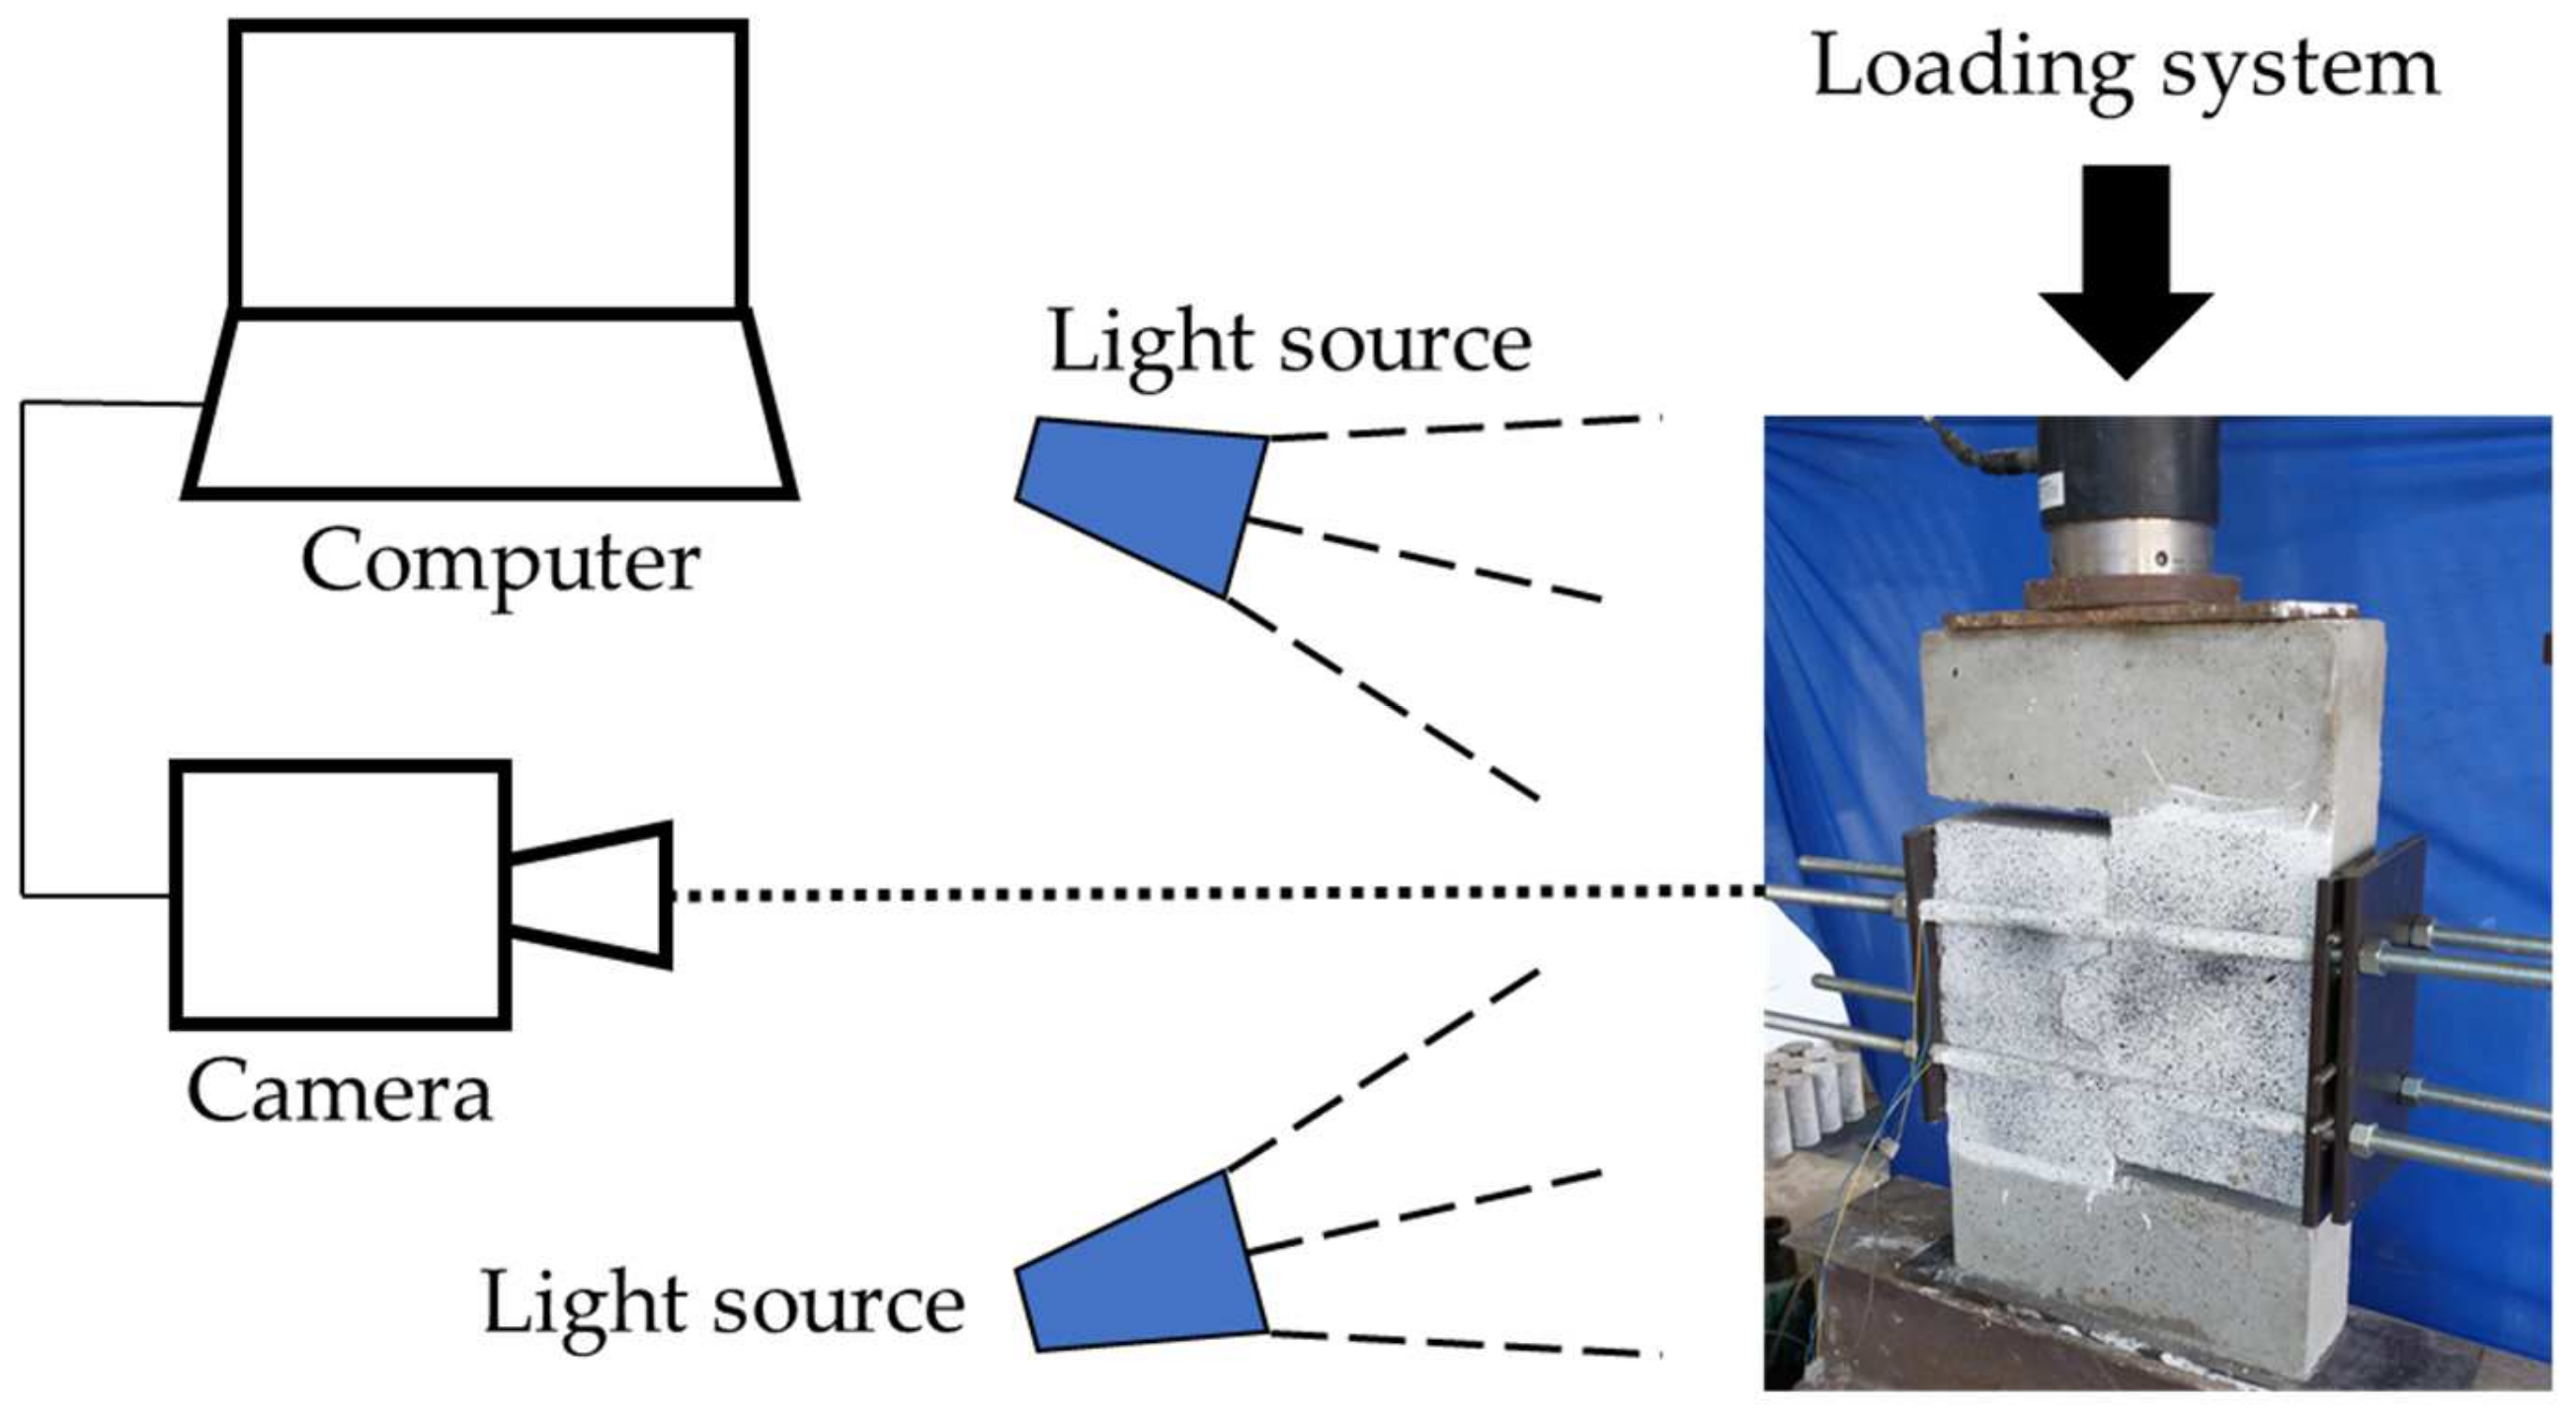
2.5. Setup and Instrumentation

For the push-off type rupture tests, a metallic gantry and a model 244.41 hydraulic actuator were used, coupled to a load cell with a capacity of 500 kN from MTS®. The tests were carried out with controlled deformation, with a speed of 1 mm/min, commanded by the hydraulic unit that recorded the applied load in real time, as shown in Figure 9.
The specimens’ confining stress (σn) was applied by a system of bars, nuts, and steel plates. The plates had dimensions of 200 × 300 × 20 mm and 200 × 500 × 20 mm. Applied compressive forces due to reaction forces were derived from the bars (F). Figure 10a presents the scheme for applying forces and generating the confining stress in the confinement system.
The reaction forces were generated due to the application of deformations in the steel bars. The rebars were instrumented with strain gauge model BX120-3AA (Figure 10c) and monitored in real-time as the nuts were tightened.
The plates were drilled for the passage of the bars to provide a uniform application of stresses in the specimens (Figure 10b). In addition, steel rollers were used between the glued plates on the side that slides vertically, enabling their vertical displacement.
Figure 11 shows the single-keyed dry joint specimen with installed the confining system.
The stresses applied were 1.0, 2.0, and 3.0 MPa. Table 7 shows the strains required in the bars for the reaction of the forces on the plates in specimens with shear areas of 30,000 mm2 and 50,000 mm2.

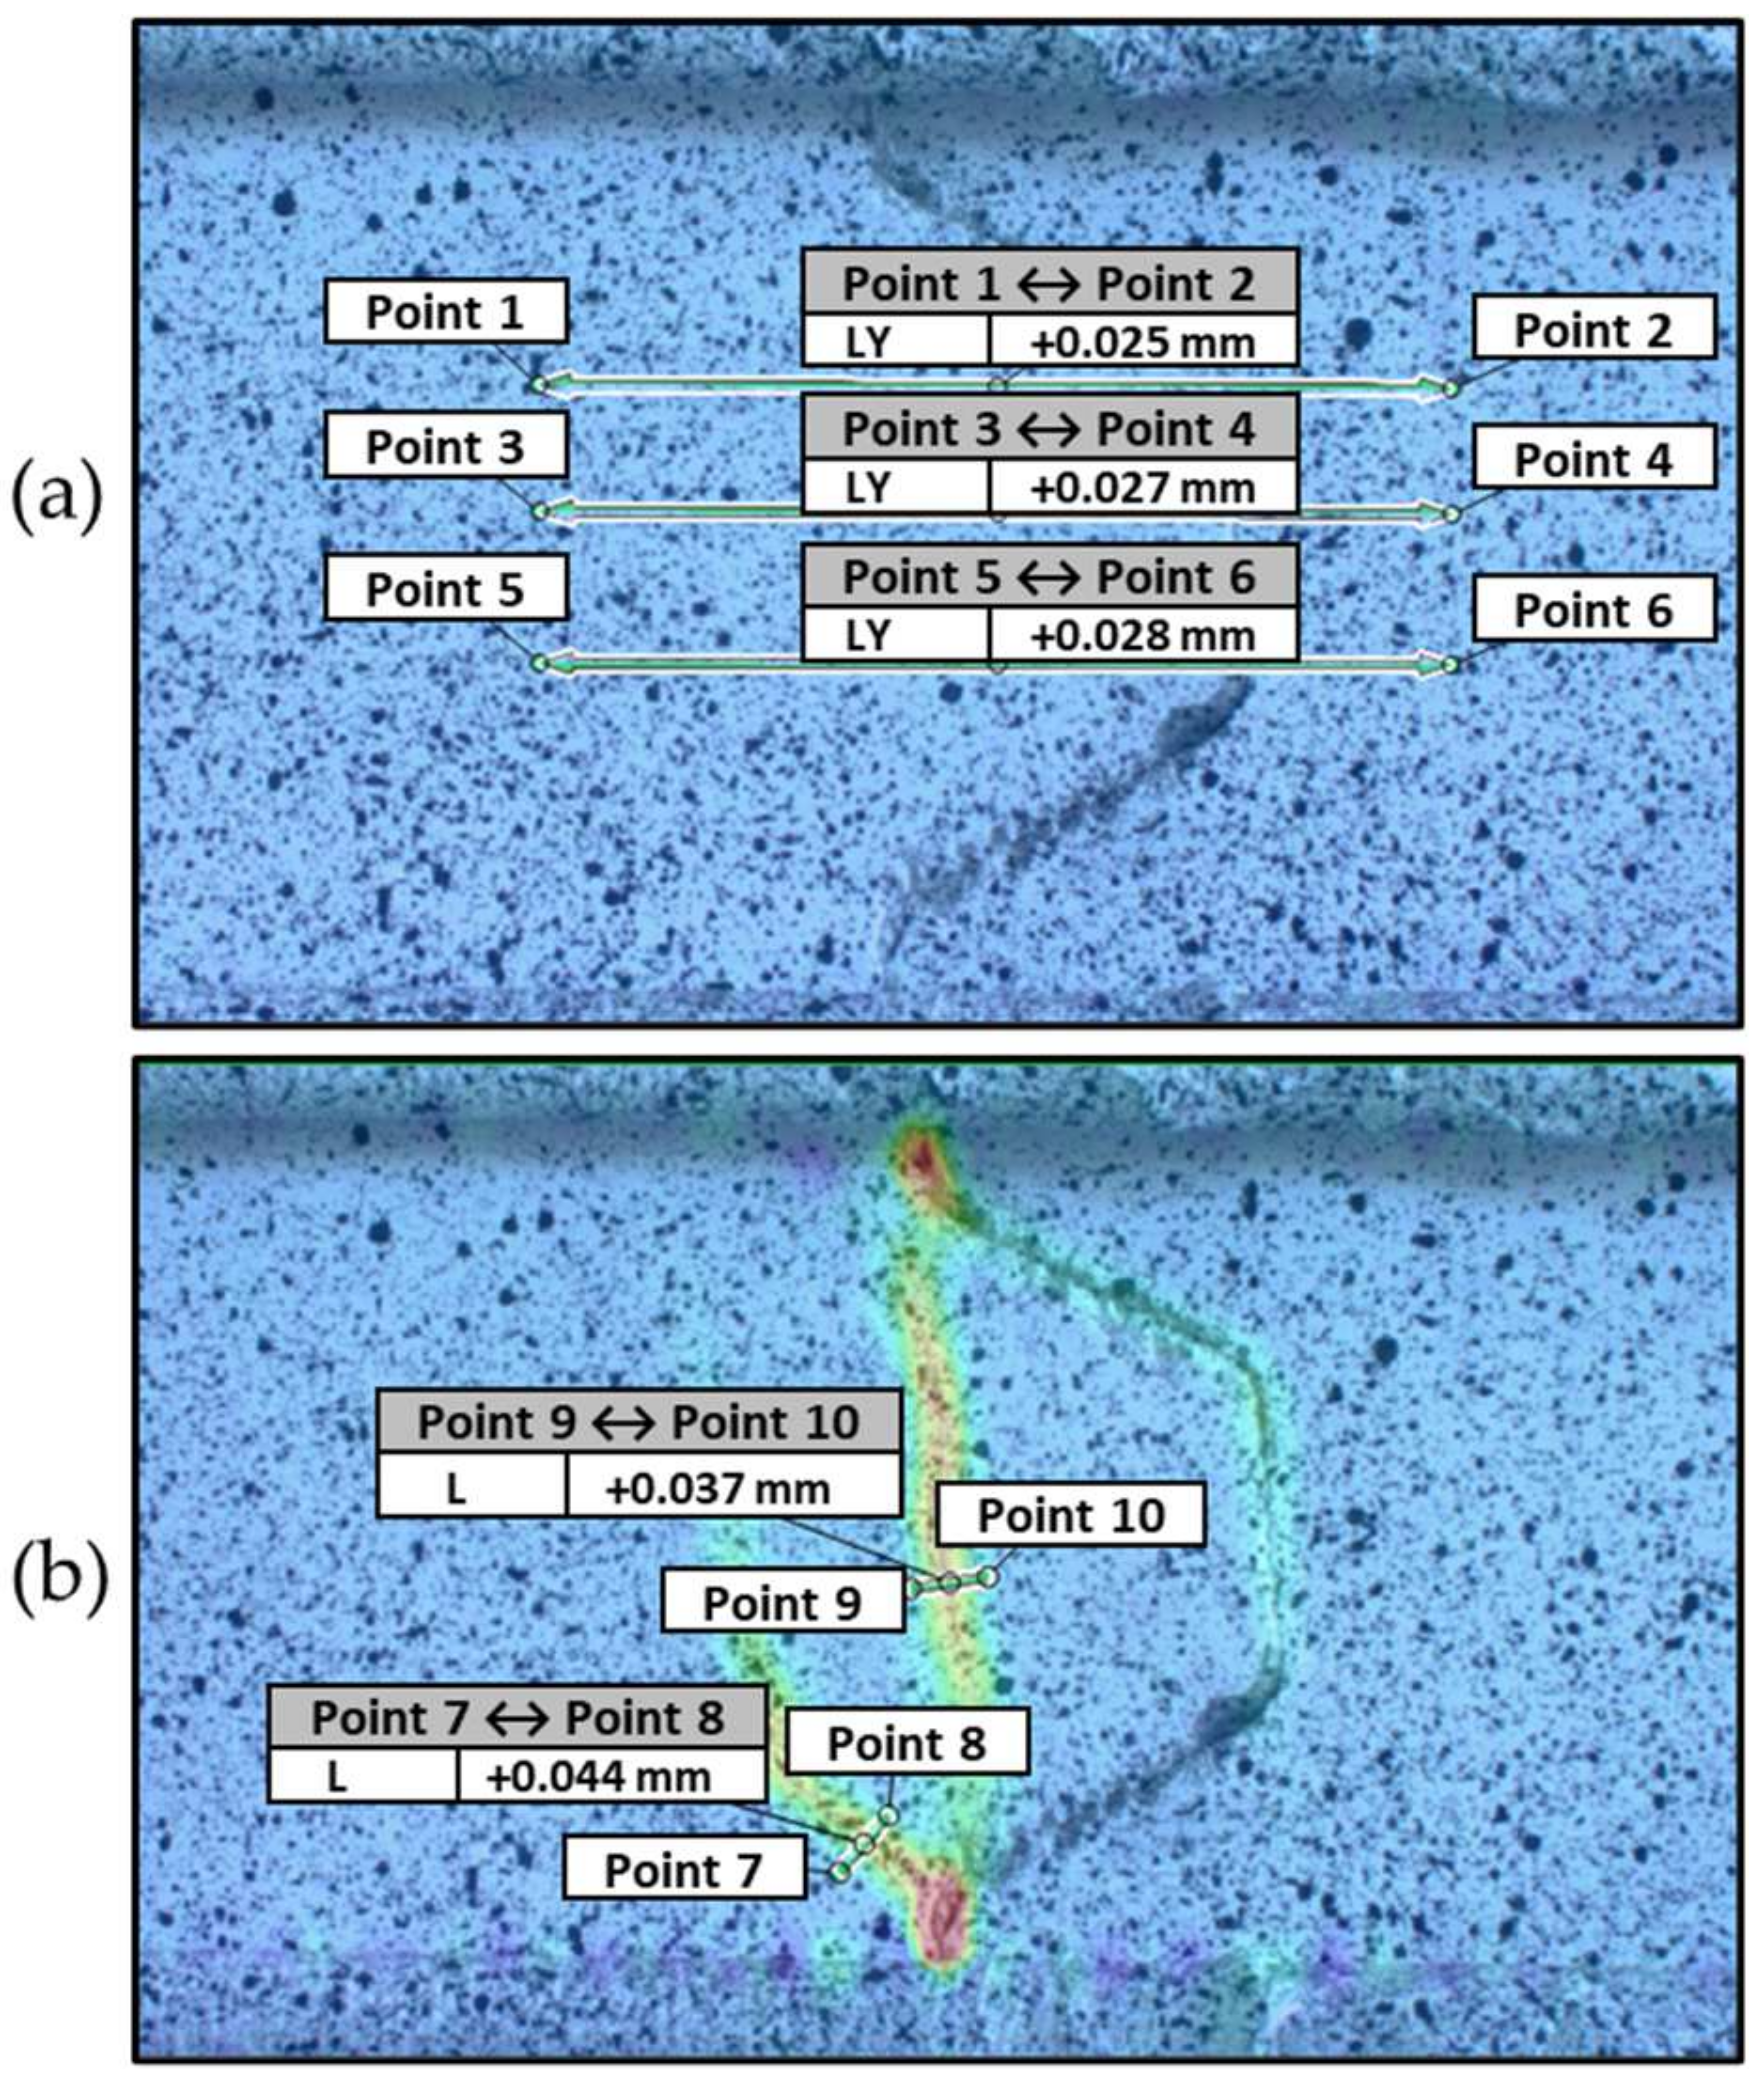
2.6. Digital Image Correlation Technique

In this research, the installation of the test sample surface deformation measurement system by the image processing method (DIC) was performed by a Canon EOS REBEL T1i camera, configured with a maximum resolution of 2352 × 1568 pixels, placed on a tripod stand, 1000 mm from the object (FOV), which was attached. The setup included a Canon Lens Canon EF lens with a minimum focus distance of 0.023 m and a maximum focus distance of 0.35 m, which is illuminated by four LED lamps of 18 watts with a brightness of 1800 lux to control the brightness level of the sample surface plane to be consistent throughout the test.
To create the pattern on the monitored surface of the specimens, white paint was used to cover the entire region of interest to obtain an opaque base surface. Subsequently, a black spray was randomly sprayed over the base of the initial white paint. To capture each specimen’s sequence of shots, the Windows application called digiCamControl was used. With this, it was possible to control the camera’s shooting parameters; besides transferring images directly to the computer that allowed visualization of the resulting images displayed on the computer screen, the machine was configured for an acquisition frequency of 1 image every 2 s.
The images were obtained in a consistent way for all test samples, to prevent any interference that could be caused by external agents, such as lighting or capture angle. The camera was positioned 1 m away from the test samples, with a leveled horizontal orientation, and a blue background was placed behind the test sample. The focus of the camera was adjusted manually, and the environment was properly lit. A pre-capture was performed and analyzed, and the analysis software indicated if the quality of the captured image was compatible with that of the other tests by means of an analysis grid. If not, adjustments to the setup were made. The GOM Correlate Windows application [45] was used for Digital Image Correlation analysis. The analysis was based on the insertion of points on the mesh projected on the specimens and their respective displacements. With this, it was possible to calculate the deformations and displacements of these points concerning the applied load.
The GOM Correlate [45] software function “Distance” was used to analyze the sliding of both joint parts. The images were scaled based on the width of the test body, ensuring accurate measurements. Figure 12a shows the arrangement of points and distances in a single-keyed dry joint.
In recent years, crack analysis has been improved through new technologies and methods [46,47]. In this study, the cracking analysis was conducted by monitoring the deformation in the horizontal axis (εx) Through a mesh created in each figure in the GOM Correlate software, the strain history (εx) showed the displacement zones that triggered the appearance of the cracks. With this, it was possible to measure the opening of these cracks with the “Distance” tool of GOM Correlate [45]. Figure 12b shows the zones of high strain (εx) and the arrangement of virtual extensometers.
The utilization of this technique enabled the monitoring of deformations across the test specimen as the load increased, thereby enabling the visual examination of the stress and deformation fields of the material. Furthermore, the analysis of the data conducted using the software facilitated greater accuracy and optimization of the results. Moreover, the ease of assembling the testing setup and the simplicity with which the data were obtained gave this technique a considerable advantage in the research setting.
The results of the push-off tests were expressed in normalized shear stress versus sliding curves. The normalized shear stress was obtained by dividing the stress in the shear plane by the square root of the concrete compressive strength obtained in each specimen.
The curves were obtained by the average between the curves of the three samples of each specimen. It is observed that the maximum normalized stress in the average curves does not match the value of the average of the maximum normalized shear stress of the specimens because the curves of the samples presented different slopes for the maximum normalized stress.

3. Results and Discussion

3.1. Shear Strength of RAC Dry Joints

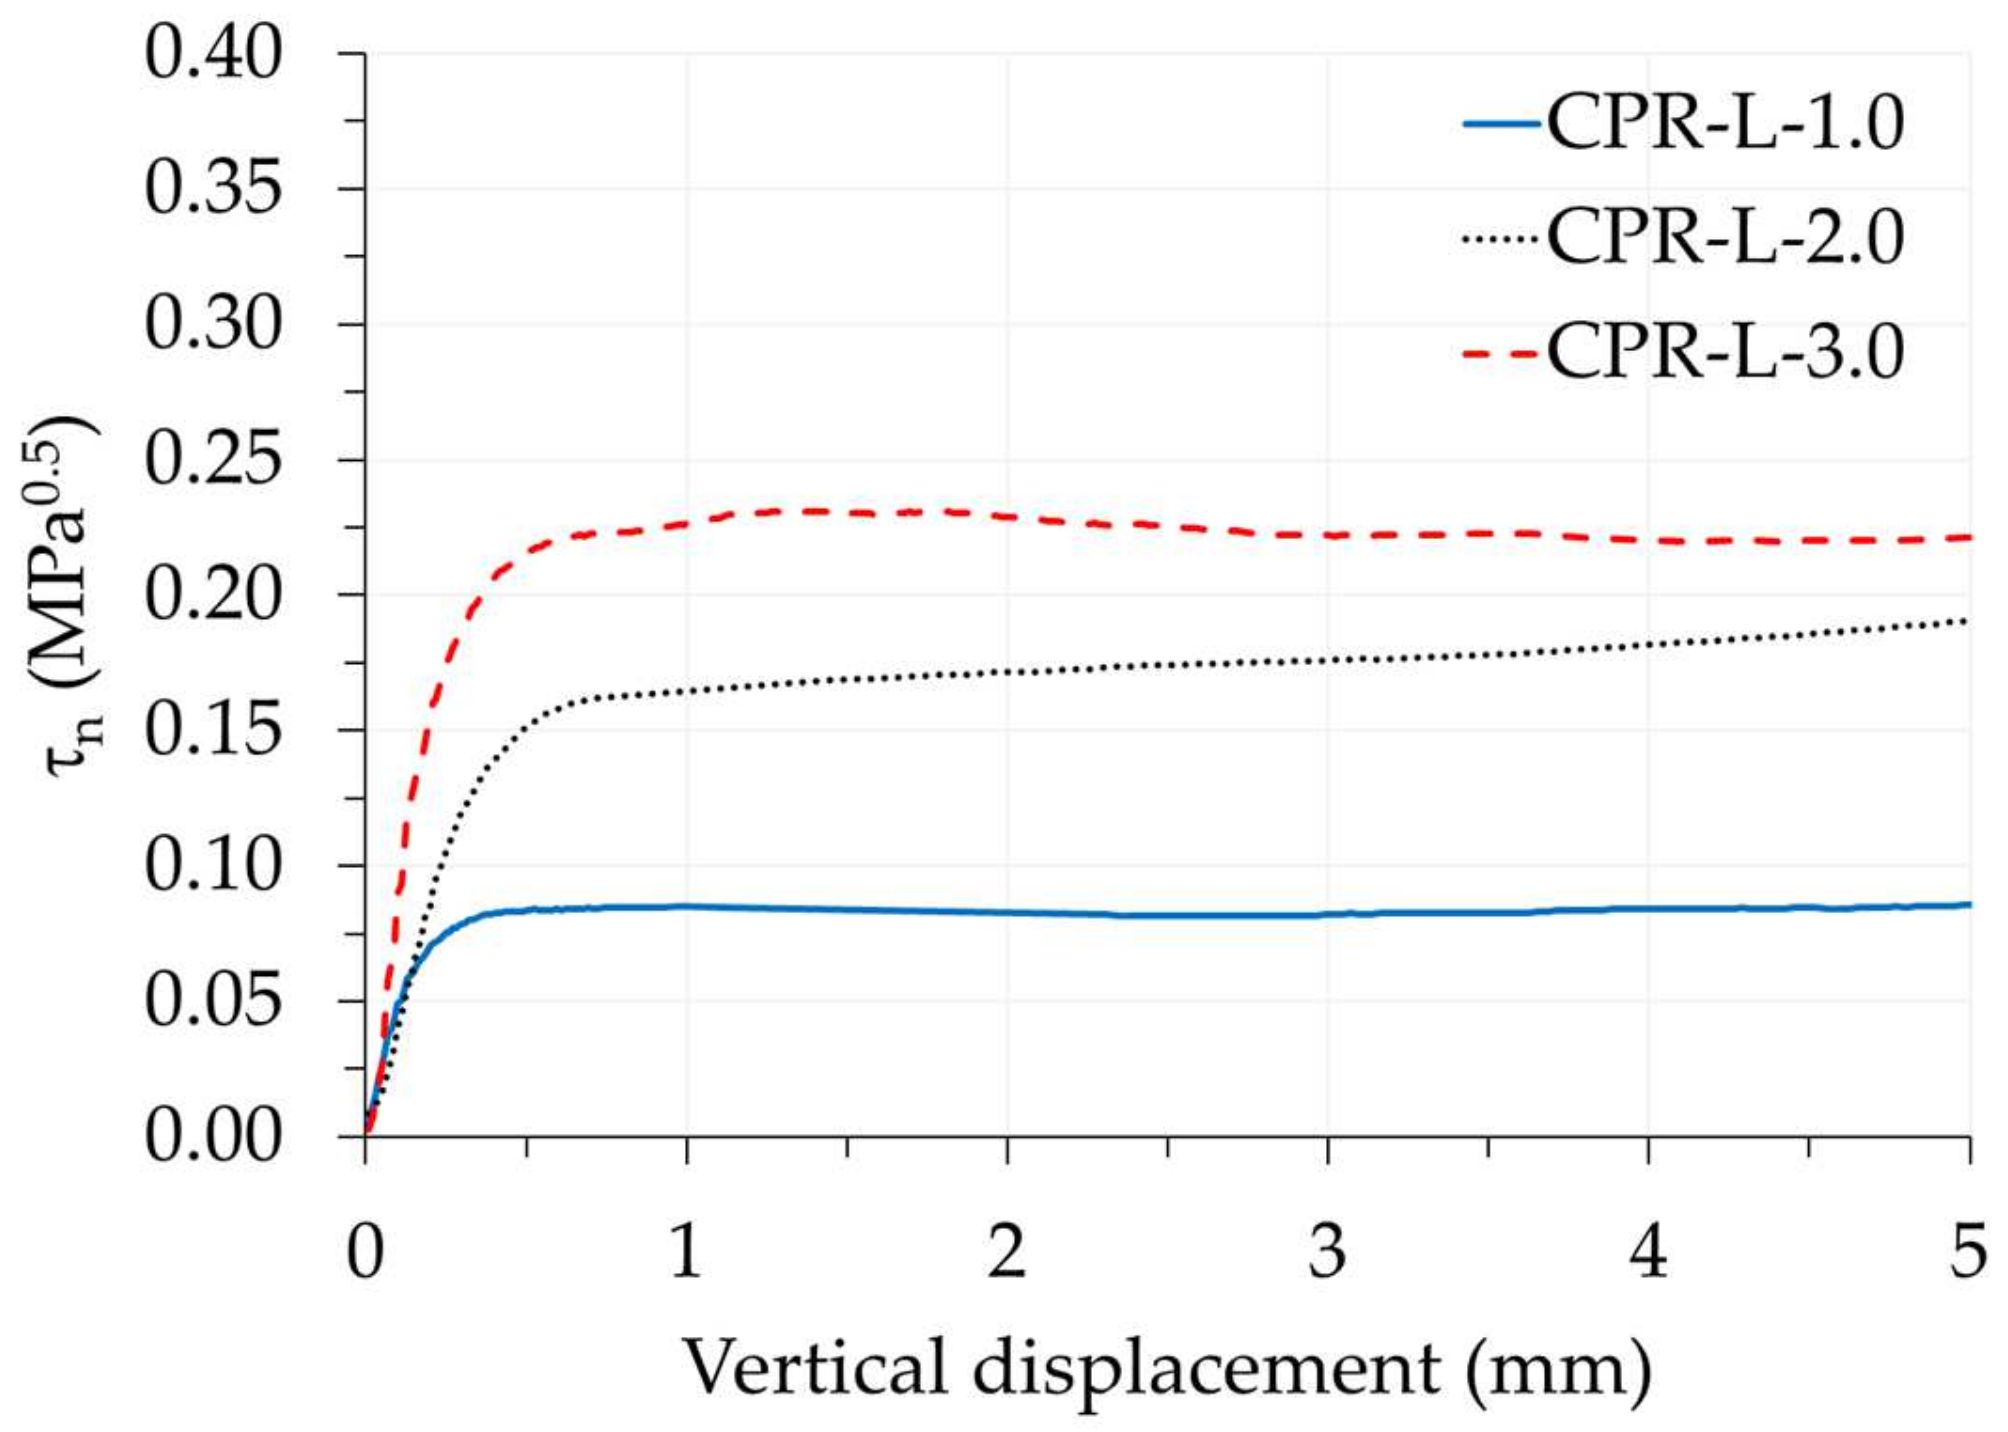
3.1.1. Flat Dry Joints

Three flat dry joint specimens were subjected to confining stresses of 1.0, 2.0, and 3.0 MPa. Figure 13 shows the average normalized shear stress curves (τn) versus relative vertical displacement for the three confining stresses. An approximately linear increase can be seen up to the point where the joint surfaces start to slip. The slip increases gradually after the flat joint ruptures, and the load remains constant. The coefficients of friction ( μ ) of the flat joints with 1.0, 2.0, and 3.0 MPa of confining stress obtained through the Buyukozturk et al. [13] resulted in 0.566, 0.534, and 0.503, respectively, values close to those used by other researchers [20,30,41,42] for conventional concrete. No cracks were observed during the test, and the shear plane surface was not damaged; only a thin layer of dust was observed due to friction between both parts. The results showed that the confining stress contributed to the increased normalized shear stress of the flat RAC dry joints.

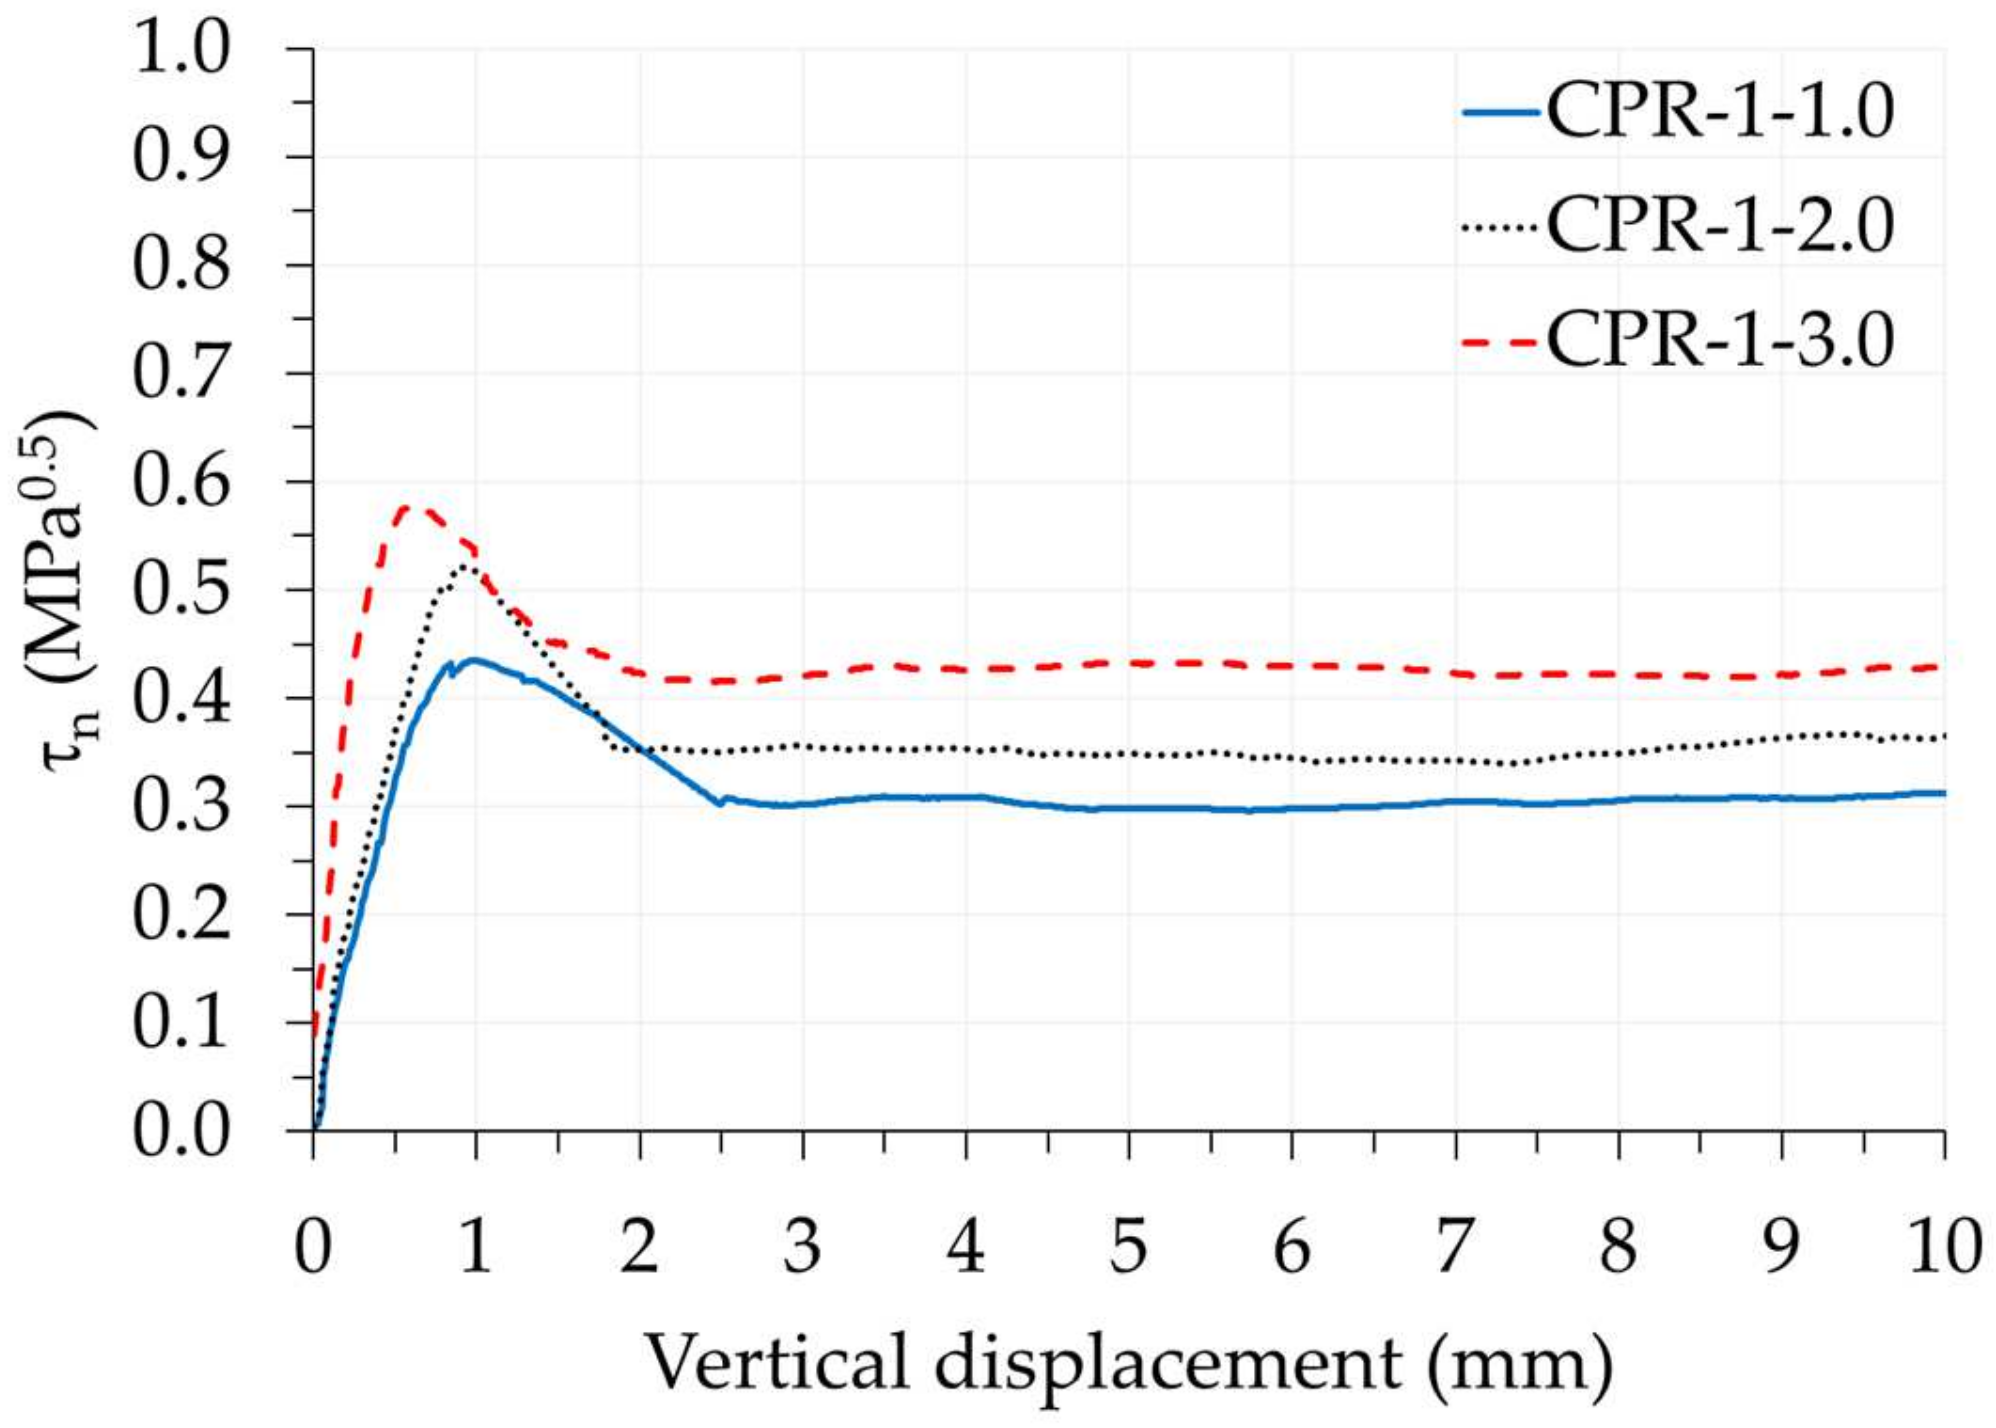
3.1.2. Single-Keyed Dry Joints

Three single-keyed dry joints were tested at confining stresses of 1.0, 2.0, and 3.0 MPa. The results showed that increasing the confining stress increased the normalized shear stress of single-keyed RAC dry joints. The normalized shear stress versus relative vertical displacement curves is shown in Figure 14. It is observed that the normalized shear stress increases approximately linearly until reaching the strength limit of the key, and then high slip occurs in conjunction with the decrease in load.

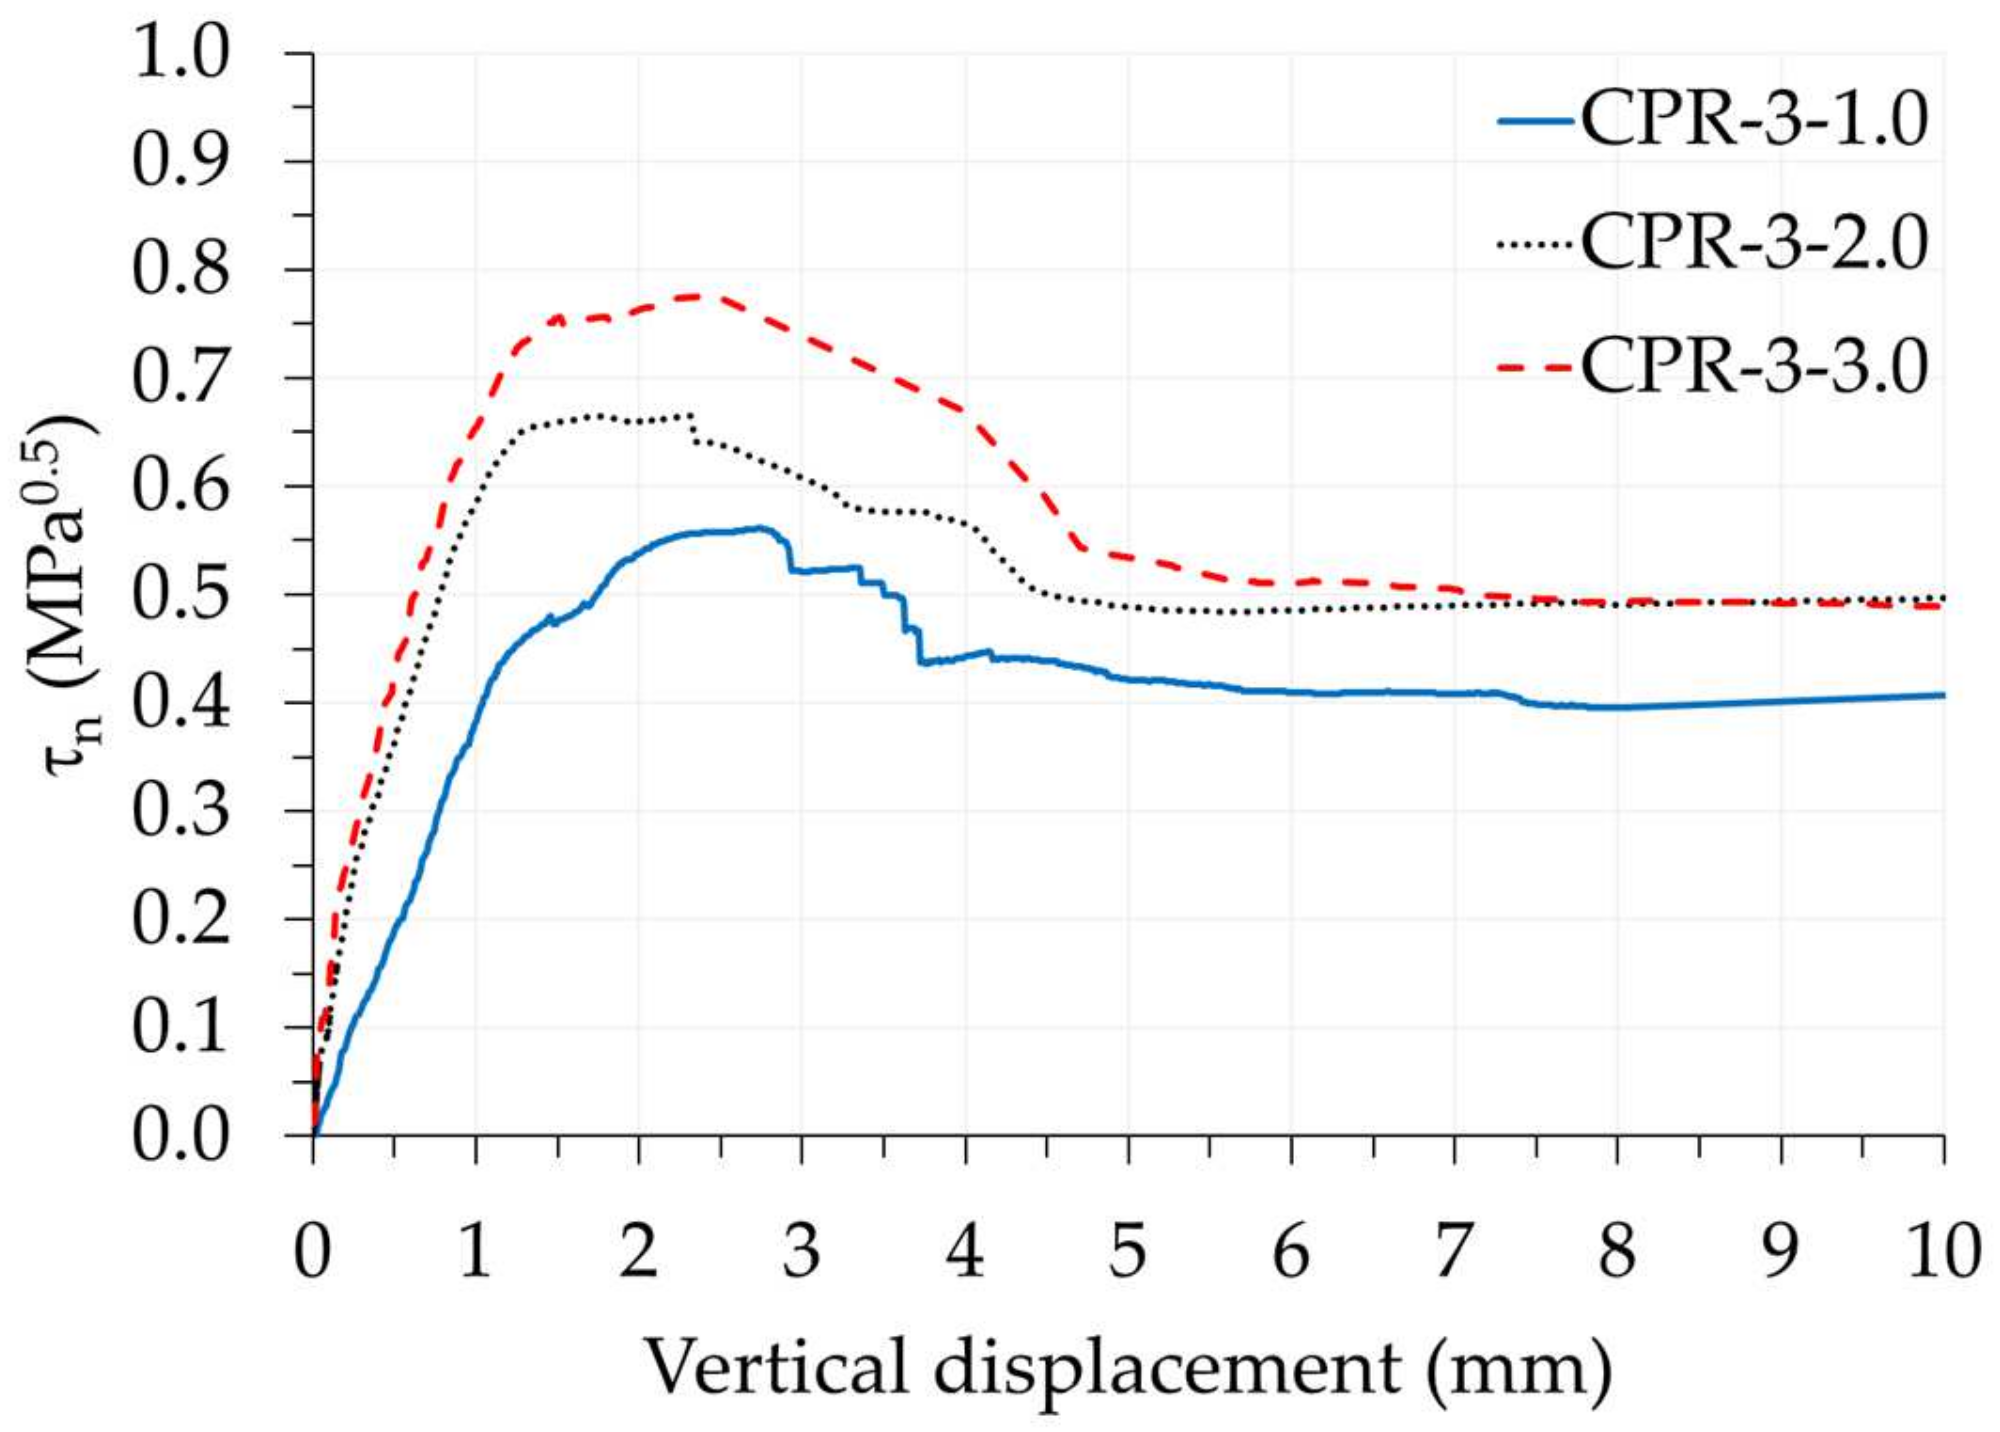
3.1.3. Three-Keyed Dry Joints

Three three-keyed dry joints were tested at confining stresses of 1.0, 2.0, and 3.0 MPa. Figure 15 shows the normalized shear stress versus relative vertical displacement curves; it is noticed an increase in the shear stress initially in a linear way; however, different from the curves of the single-keyed dry joints, when the load is close to the rupture, the curves tend to incline until reaching the rupture of the keys; this behavior shows higher ductility in the rupture of the three-keyed dry joints. This occurred due to the rupture in a sequence of the keys, where the first lower key is the first to rupture, followed sequentially by the others. This behavior has been seen by other researchers [22,30,40,42]. Again, it was observed that increasing the confining stress contributed positively to the increase in strength of three-keyed RAC dry joints.
The failure load, maximum shear stress, normalized cracking shear stress, and maximum normalized shear stress at failure of the flat dry joints and single-keyed and three-keyed dry joints are presented in Table 8, along with the results of the maximum shear stress of Jiang et al. [30].
Table 9 compares the experimental results of this research with those obtained by Jiang et al. [30].
The results showed that the dry joints of concrete with recycled coarse aggregates presented reduced shear strength values compared to conventional concrete (except the three-keyed joint submitted to confining stress of 1.0 MPa). This shows the brittle characteristic of this material to shear.
The lower resistance of RAC occurs because the recycled coarse aggregates have lower resistance than the conventional ones due to the percentage of adhered mortar. This characteristic contributes to the cracks to cut the recycled aggregates, reducing the mechanical interlock due to the reduction of roughness in the sliding surface, thus interfering with the shear strength of the joint [14].
The results obtained from experiments on smooth and three-keys RAC concrete joints showed values comparable to those of conventional concrete joints by Jiang et al. [30], while the one-key joints showed significantly lower values. This is likely due to the lower resistance of the RAC concrete compared to the conventional concrete, resulting in the one-key joints not reaching the full multiple resistance of the keys before breaking. However, the multiple keys joints of both types of concrete presented values of normalized shear stress that were similar in magnitude, which can be attributed to the progressive rupture effect of the keys.

3.2. Influence of the Confining Stress

Figure 16 shows the influence of the confining stress on the maximum normalized shear stress of dry joints with RAC and the results of Jiang et al. [30].
The results showed that maximum normalized shear stress increases as the confining stress increases for all dry joints with recycled coarse aggregate concrete, showing its importance as a resistant mechanism.
For flat joints, the strength gain when the confining stress increased from 1.0 to 2.0 MPa was 88.89%, and when it increased from 2.0 to 3.0 MPa, it was 35.29%.
For the joints with shear keys, the strength gain when the confining stress increased from 1.0 to 2.0 MPa was 15.56% for single-keyed joints and 21.43% for three-keyed joints. When the confining stress increased from 2.0 to 3.0 MPa, the strength gain was 15.38% for single-keyed joints and was 17.65% for three-keyed joints.
The experimental results of Jiang et al. [30] showed that the strength gain when the confining stress increased from 1.0 to 2.0 was 80% for flat joints, 25.71% for single-keyed joints, and 30.36% for three-keyed joints.
Comparing the flat joints, the increase in the confining stress was more effective in the strength gain of the dry joints produced with RAC. However, in joints with single- and three-keyed joints, the strength gain was more effective in joints produced with conventional concrete.
These results show that confinement in concrete with recycled coarse aggregates is less effective than in conventional concrete. As seen, the portion of resistance provided by the shear keyed is due to the monolithic region of concrete in the keyed that cuts the shear plane. Thus, this portion of resistance is directly related to the strength of the concrete used in the key. Therefore, the strength gain in concrete due to confinement is less effective in concrete with recycled coarse aggregates.

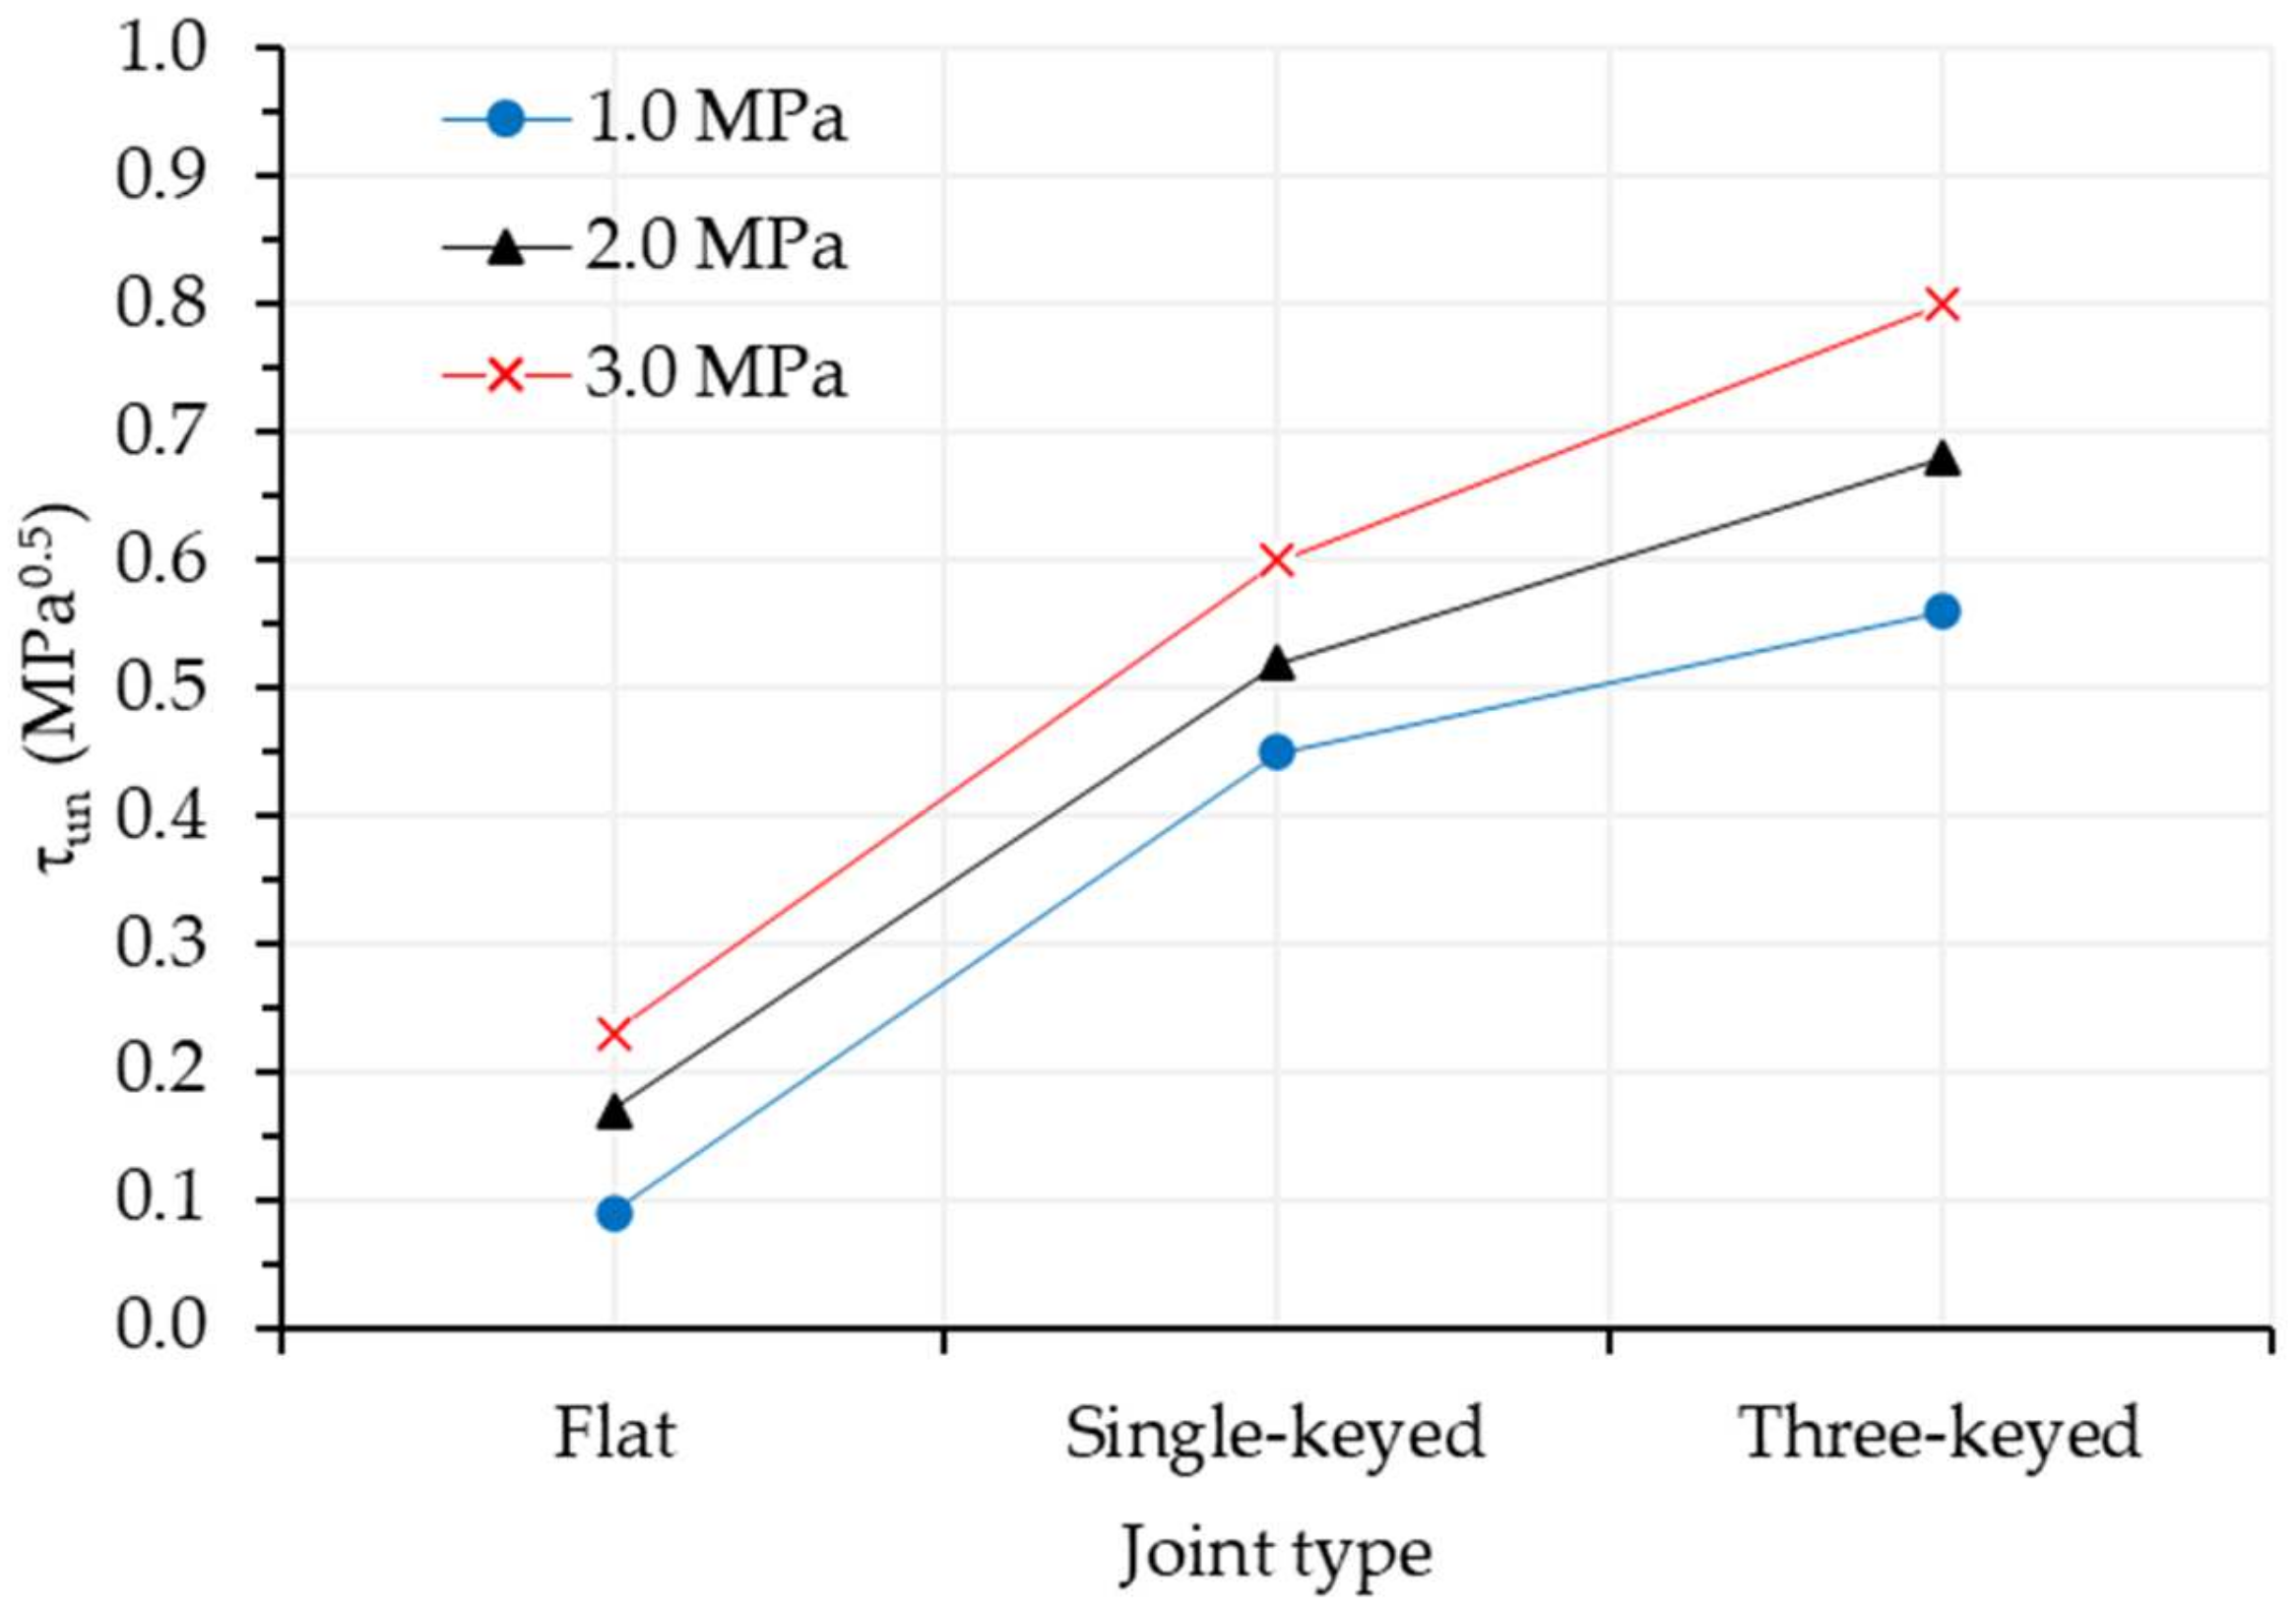
3.3. Influence of the Number of Keys

Figure 17 shows the influence of the number of keys on the maximum normalized shear stress for different confinement stresses in the dry joint with RAC.
It is observed that the maximum normalized shear stress increased when the number of keys was increased, and this gain was more effective when it was increased from none to single-keyed.
When the number of keys increased from none to one, the strength gain was 400%, 205.88%, and 160.87% for the confining stresses of 1.0, 2.0, and 3.0 MPa, respectively. When the number of keys increased from one to three, the strength gain was 24.44%, 30.77%, and 33.33% for the confining stresses of 1.0, 2.0, and 3.0 MPa, respectively.
This shows the typical behavior of multiple-keyed joints in not having a proportional gain in strength with the increasing number of keys due to the increase in imperfections and stress concentrations [22,30,40,42,47].

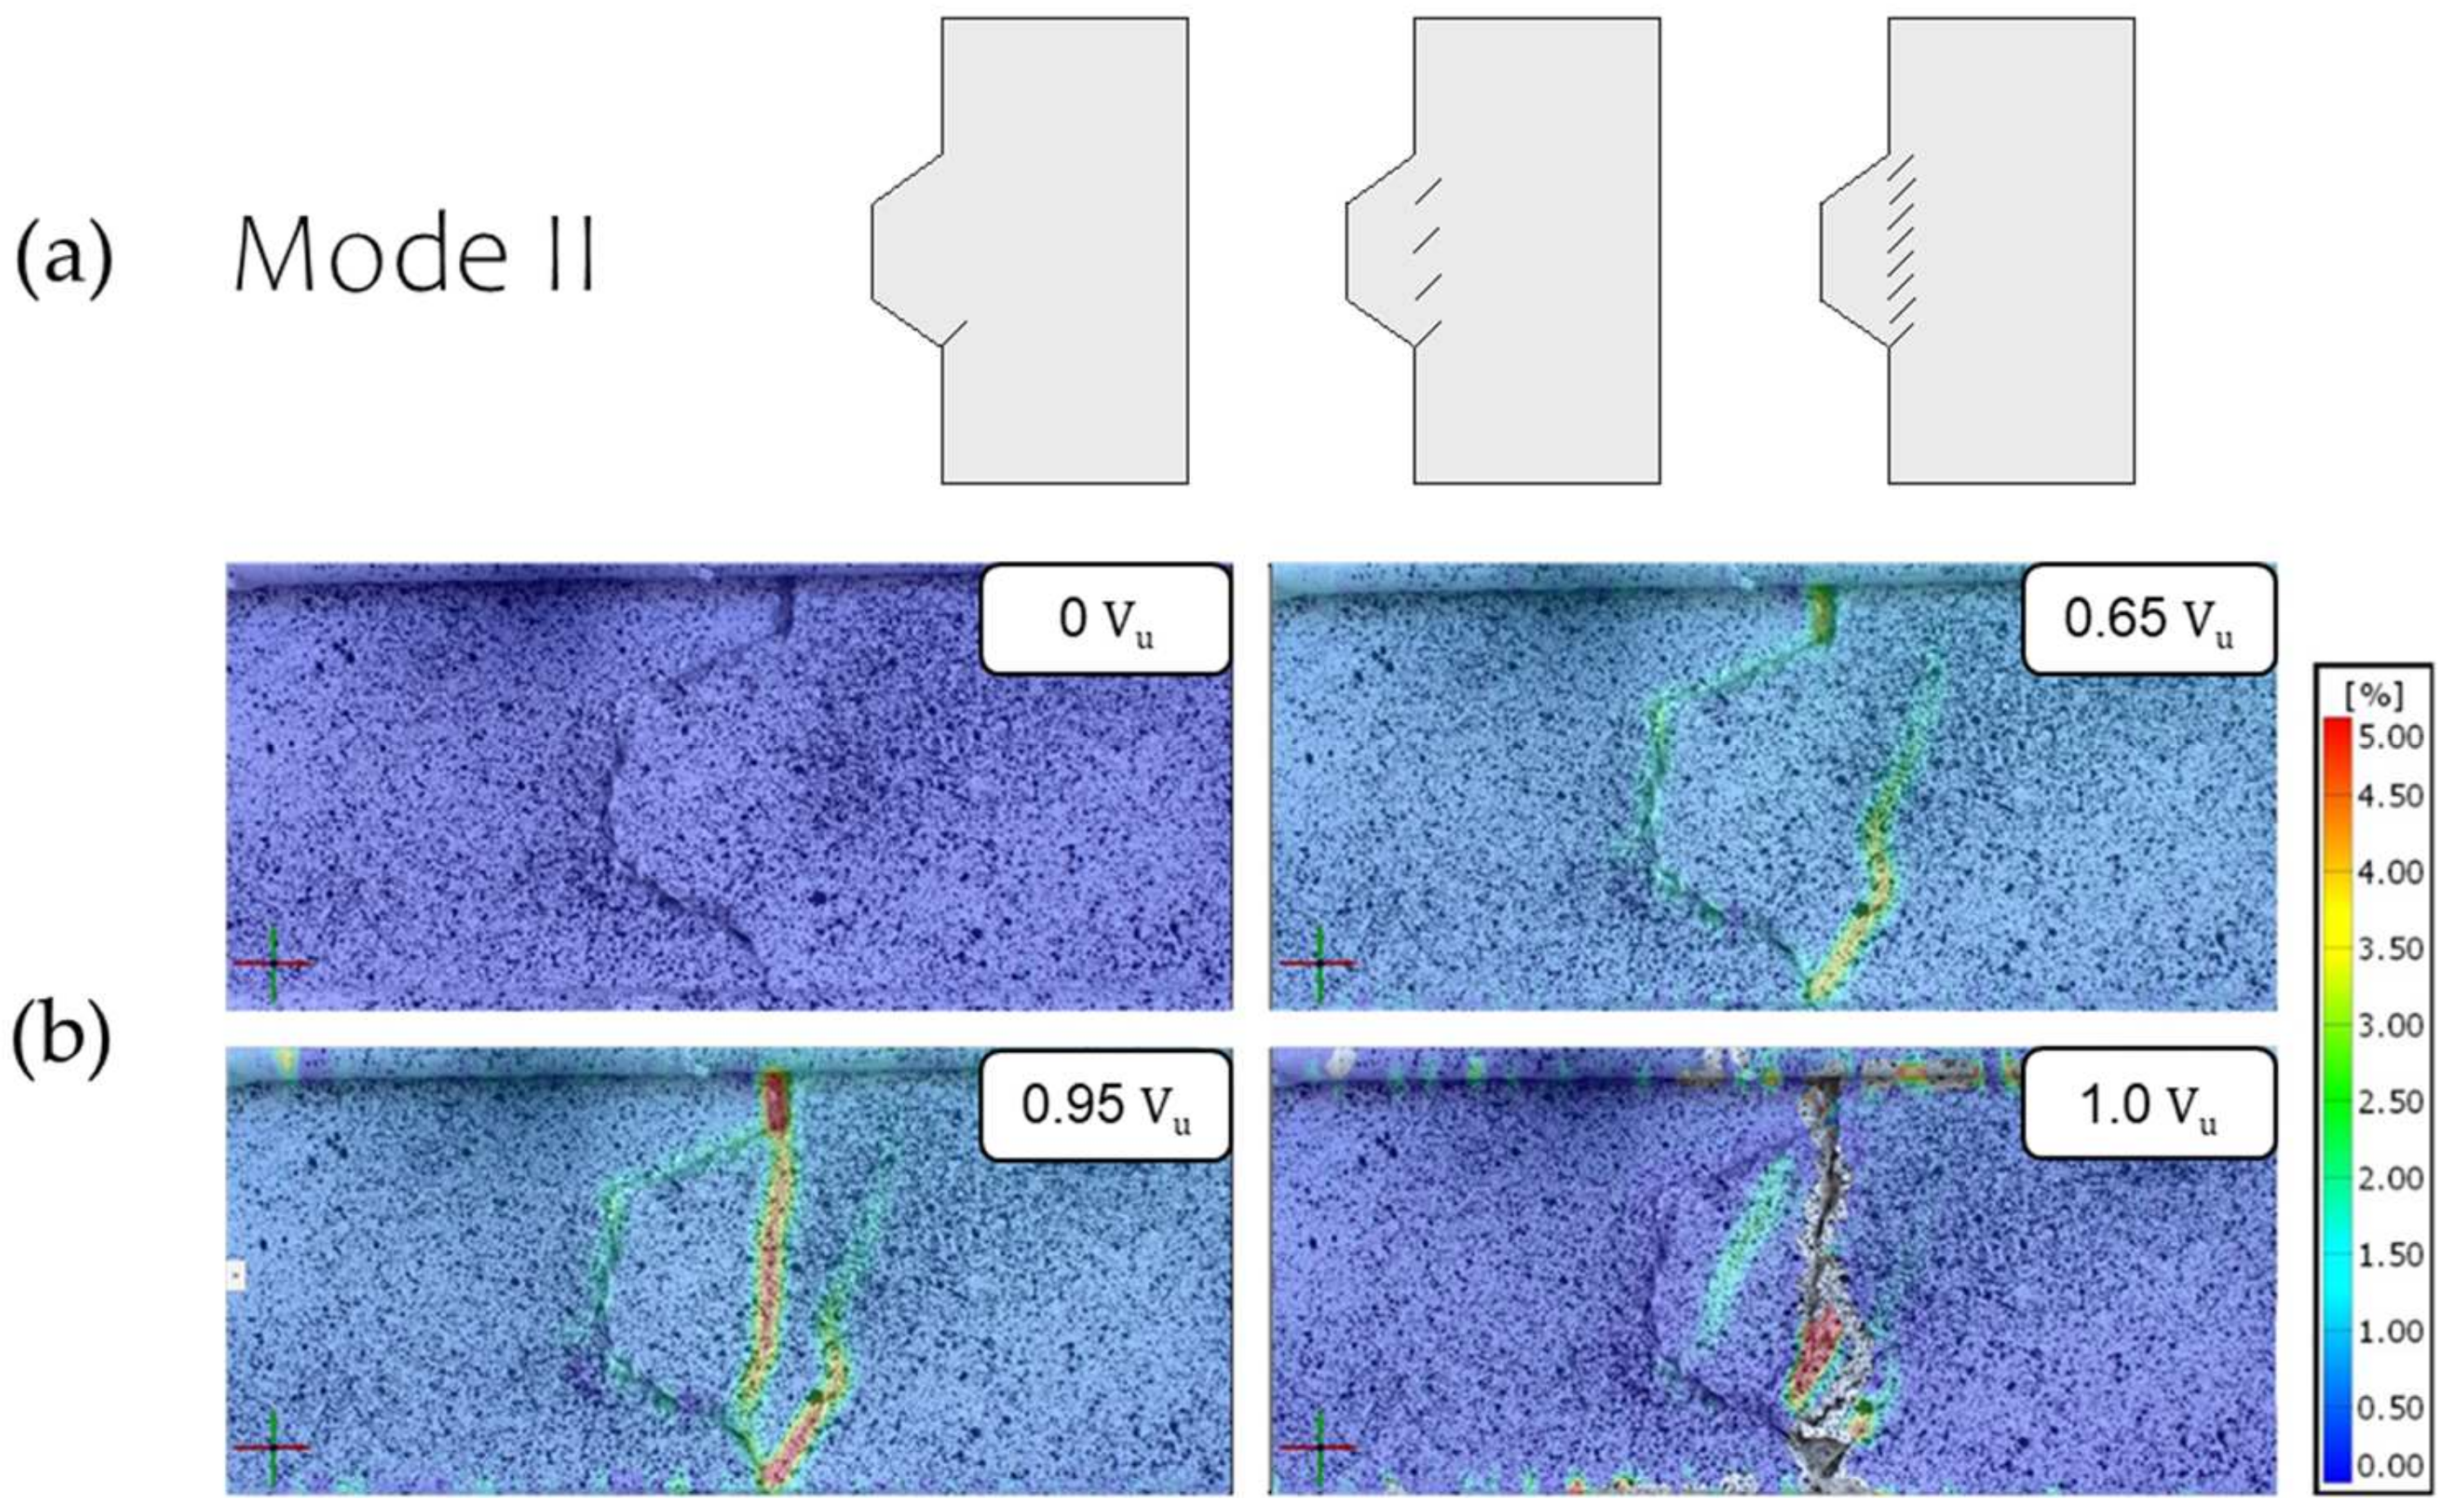
3.4. Cracking Pattern of Keyed Dry Joints Specimens

The single-keyed dry joints showed Jiang’s type 2 cracking model [30]. In this model, an inclined crack at approximately 45° appears at the base of the shear key. As the load increases, several other small cracks appear in the shear plane at approximately 90°. Rupture occurs when all these little cracks cut through the entire shear key. Figure 18 shows the type 2 cracking model and the cracking kinetics of the specimen CPR1-1-1.0 with their load ratios with respect to the ultimate load (Vu).
In the three-keyed specimens, cracking occurred sequentially in the keys. The lower key was the first to crack and break, causing the other keys to break in sequence. Figure 19 shows the formation of cracks in the specimen CPR2-3-1.0, with their load proportions about the failure load (Vu) and those presented by Jiang et al. [30] for the three-keyed dry joints.

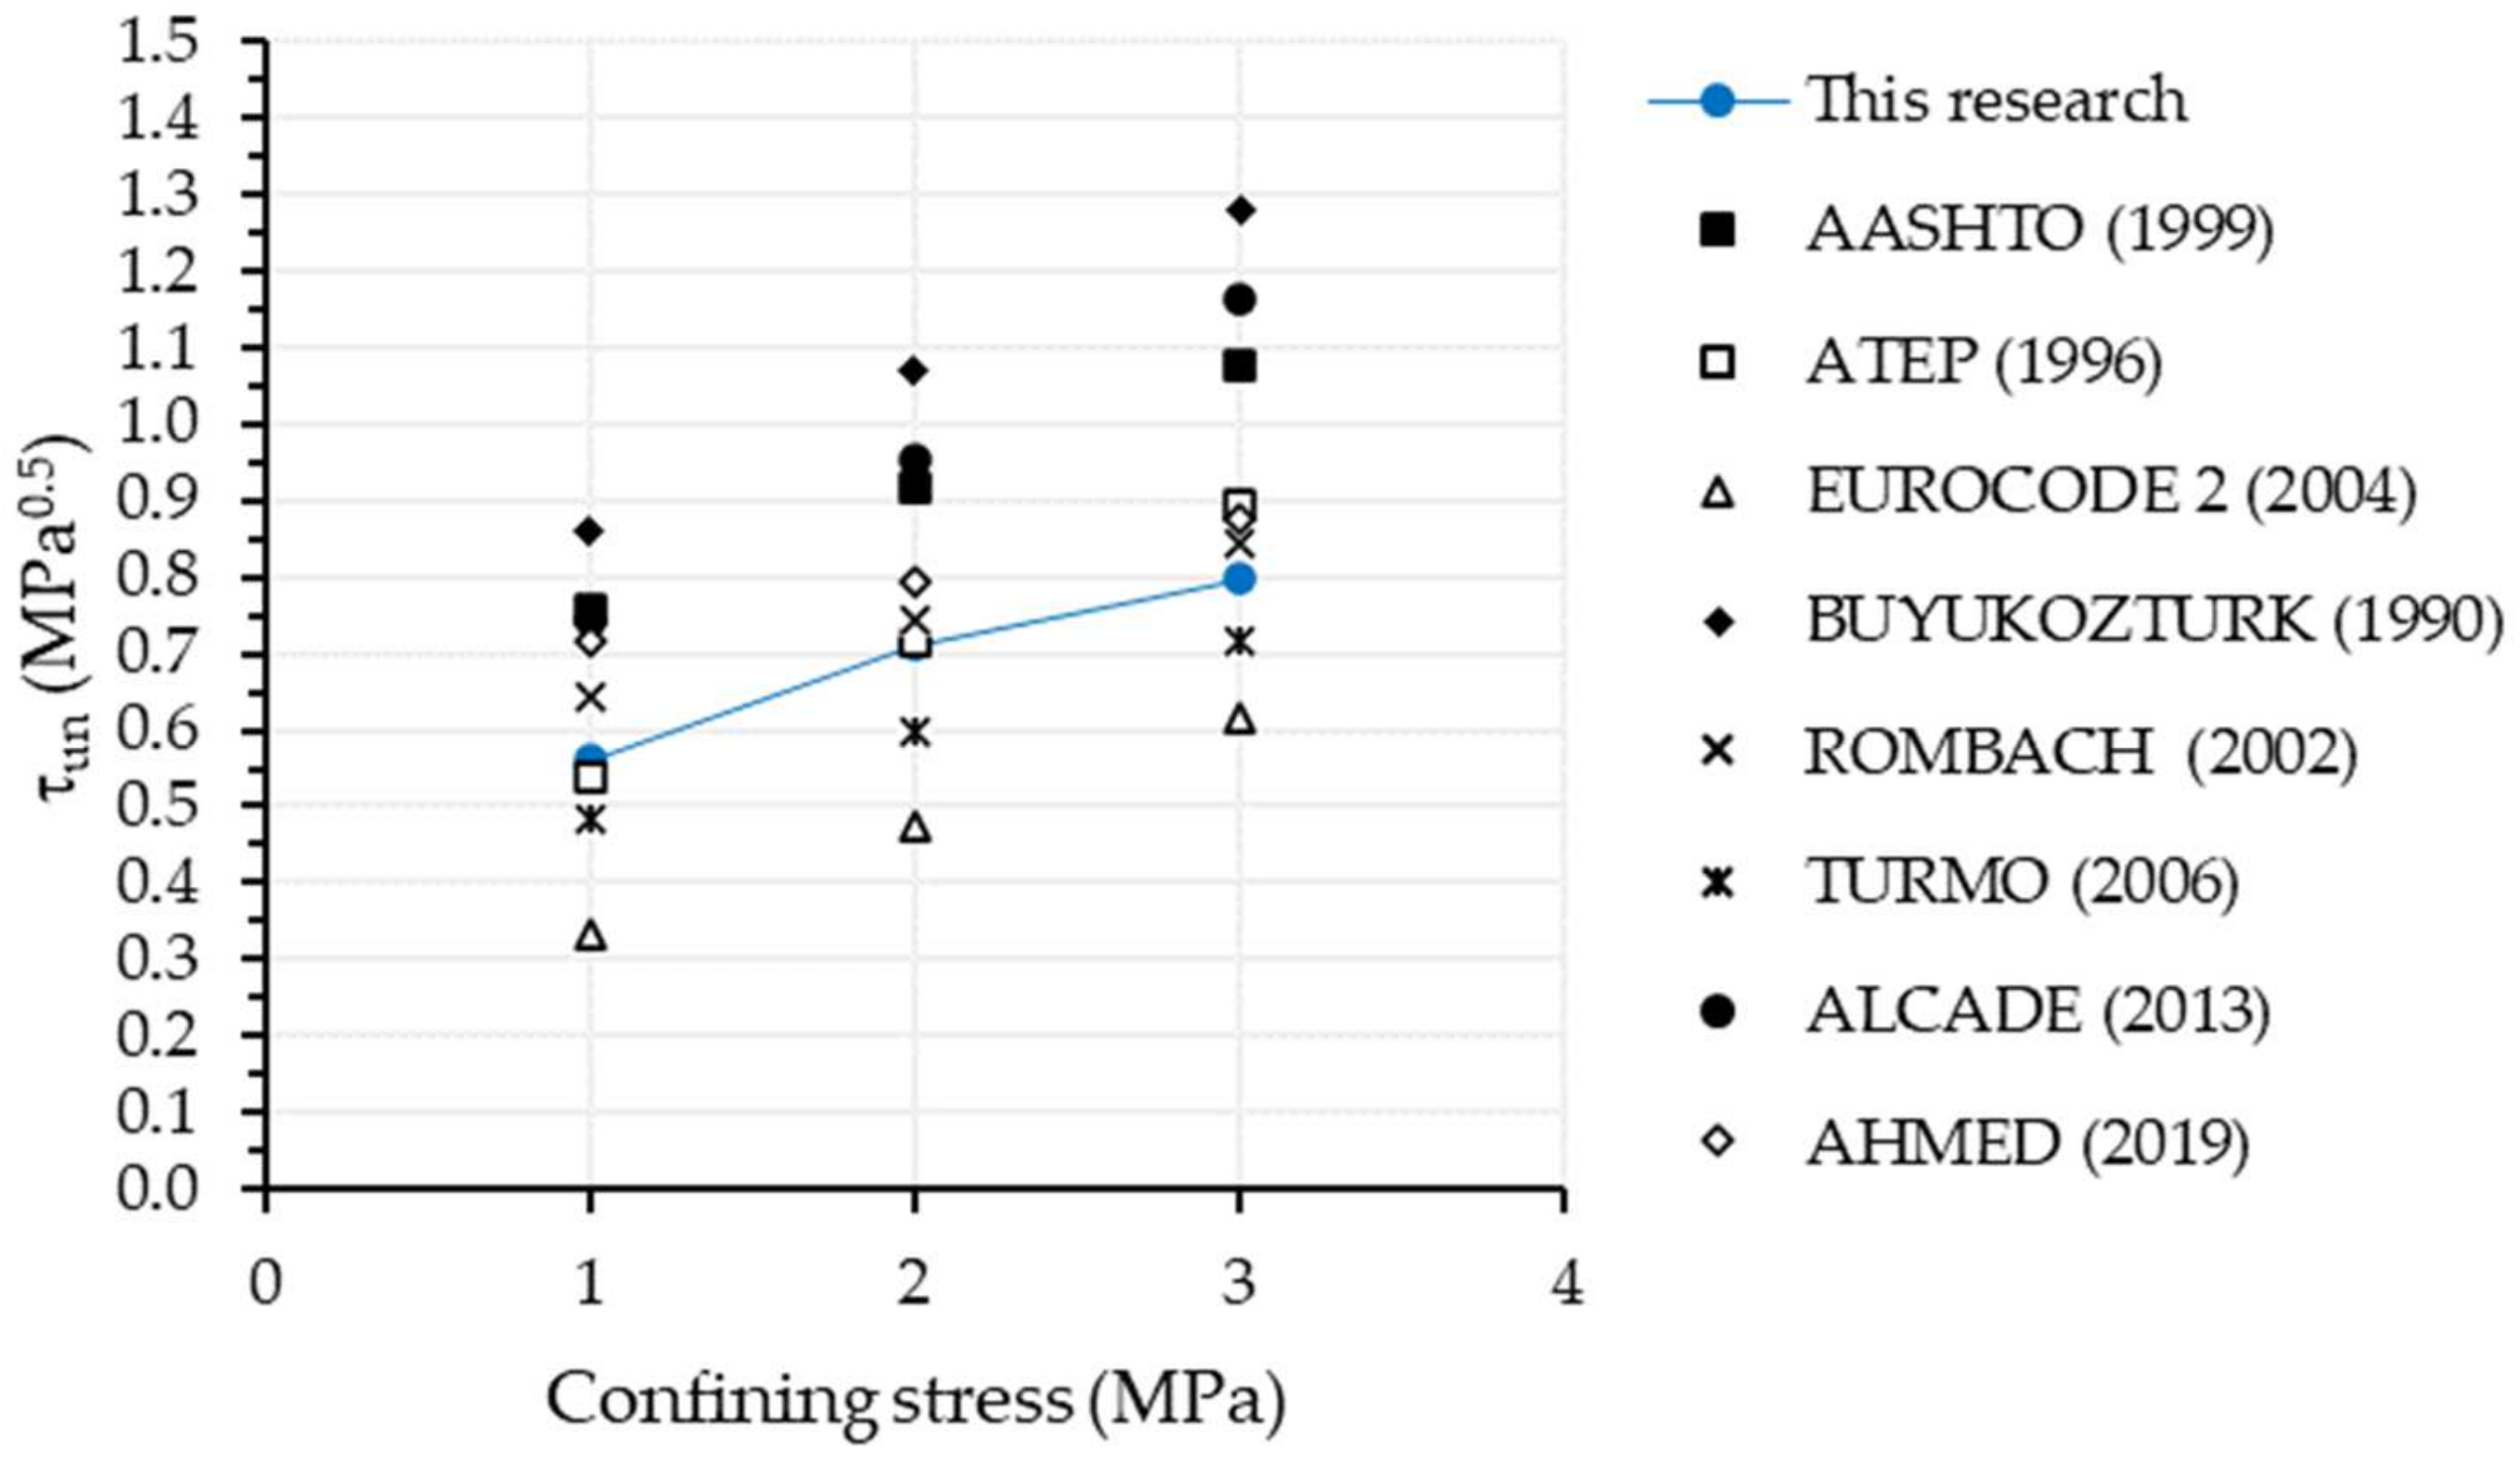
3.5. Comparison between the Results of This Research with Those of Other Researchers

Much research about the shear resistance of conventional or high strength dry concrete joints has been studied in recent years. Table 10 gathers information about the research.
Figure 20, Figure 21 and Figure 22 compare the maximum normalized shear stress versus confining stress obtained by other researchers and the experimental results of this research for flat, single-keyed, and three-keyed dry joints with recycled coarse aggregate concrete.
For flat joints, the results showed that dry joints of concrete with recycled coarse aggregates showed strengths close to those of conventional concrete. The shear plane area of smooth joints has been observed to vary between studies; however, Figure 20 reveals that this has had minimal effect on the comparison of results, as values have remained consistent between both types of concrete. This can be attributed to the similar friction coefficient of RAC and conventional concrete.
The results showed that the single-keyed dry joints with recycled coarse aggregate concrete presented the lowest maximum normalized shear stress values. The comparison of the results obtained from the key joints with those of the smooth joints, as seen in Figure 21, demonstrates a greater difference. This implies that the monolithic region of the key exhibits an increased contribution to the shear resistance of the joints, with the RAC concrete joints exhibiting the lowest values due to their lower resistance. In the three-keyed joints, the difference between the results was minor compared to the single-keyed joints; presenting even similar values, studies have found that in multi-key joints, the rupture sequence of the keys does not allow for the full resistance of all of the keys together, which results in values obtained from a break that are not equal to three times the values of single-key joints. This rupture sequence of the keys, however, does allow for RAC joints to reach values close to those of conventional concrete joints.

3.6. Equations for Predicting the Strength of RAC Dry Joints

Using Equations (1)–(8) for predicting the strength of RAC dry joints in terms of (τun), it can be seen in Figure 23 and Figure 24 that the most suitable equations for predicting single-keyed RAC dry joints were those of Turmo et al. [20], Rombach and Specker [19], and EUROCODE 2 [24]. The three-keyed RAC dry joints were Turmo et al. [20] and EUROCODE 2 [24].
The EUROCODE 2 equation has been formulated for calculating the shear resistance between concrete surfaces produced at different times. The coefficients proposed by the standard for indented interfaces (c = 0.50 and μ = 0.9) were adopted for predicting the resistance of dry joints. Nevertheless, the equation has been observed to present conservative values in contrast to the equations of Turmo et al. [20] and Rombach and Specker [19], which were specifically developed for calculating the resistance of dry joints.
Table 11 shows the relationship between the (τun) predicted by the equations in the literature and the experimental one.
The normative equation of AASHTO [21] predicts with good approximation the strength of single-keyed RAC dry joint for low confining stresses; however, as the confining stress increases, the experimental results diverge from the prediction, as can be seen in Figure 25. The experimental results showed significantly different values for predicting RAC dry joints with three keys of the prediction of the normative equation.
Therefore, the authors recommend using a reduction coefficient of 0.7 for the equation of AASHTO in predicting the shear strength of recycled coarse aggregate concrete dry joints.

4. Conclusions

In this research, twenty-seven dry joint specimens produced with concrete from recycled coarse aggregates were subjected to push-off tests to study their shear strength. The variable parameters were the number of keys (flat, single-keyed, and three-keyed) and the magnitude of the confining stress (1.0, 2.0, and 3.0 MPa). The analysis of the results was performed using the digital image correlation method. It was possible to verify the relative vertical displacement between both parts of the joint and the cracking kinetics. Finally, the prediction of the literature equations for dry joints produced with recycled coarse aggregates concrete was verified. The results enabled the following conclusions:
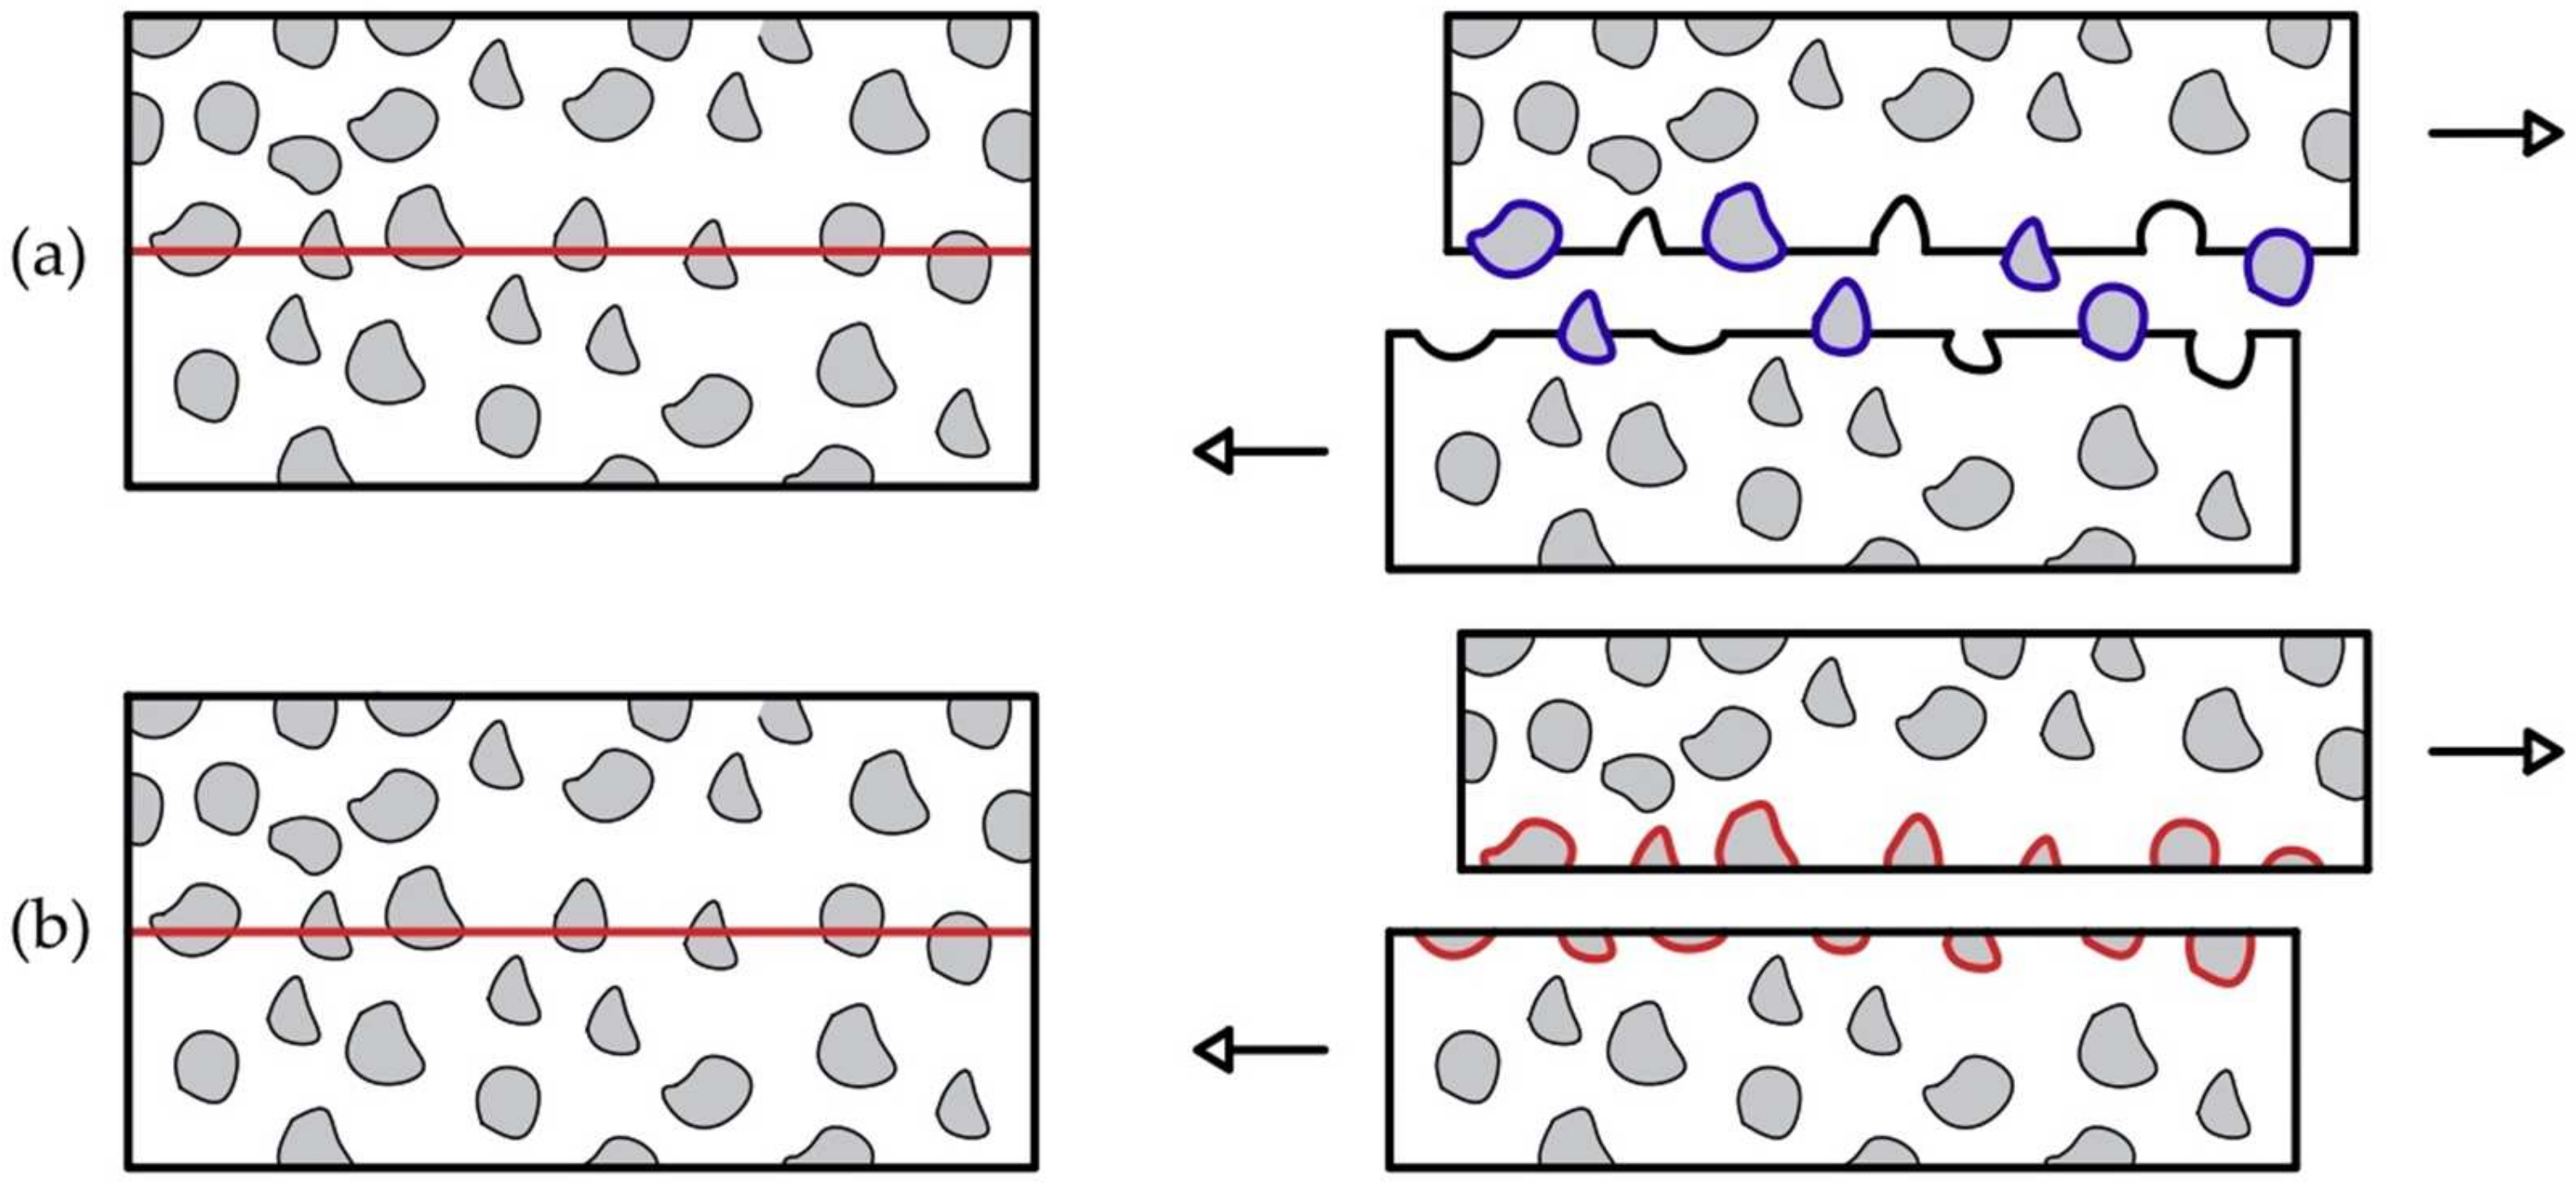
  • The dry joints produced with recycled coarse aggregates concrete showed similar behavior during the push-off test as those produced with conventional concrete. The failure of RAC joints was caused by the formation of a crack at the base of the shear keys, at an angle of approximately 45 degrees to the horizontal plane. With increasing load, additional cracks appeared in the shear plane of the keys, leading to the ultimate rupture when the cracks cut through the key. The cracking of single-keyed dry joint specimens with recycled coarse aggregates concrete followed model 2 as presented by Jiang et al. [30]. The cracking of the three-keyed dry joint specimens with recycled coarse aggregates concrete showed the cracking pattern in a sequence of the shear keys, as seen in previous work;
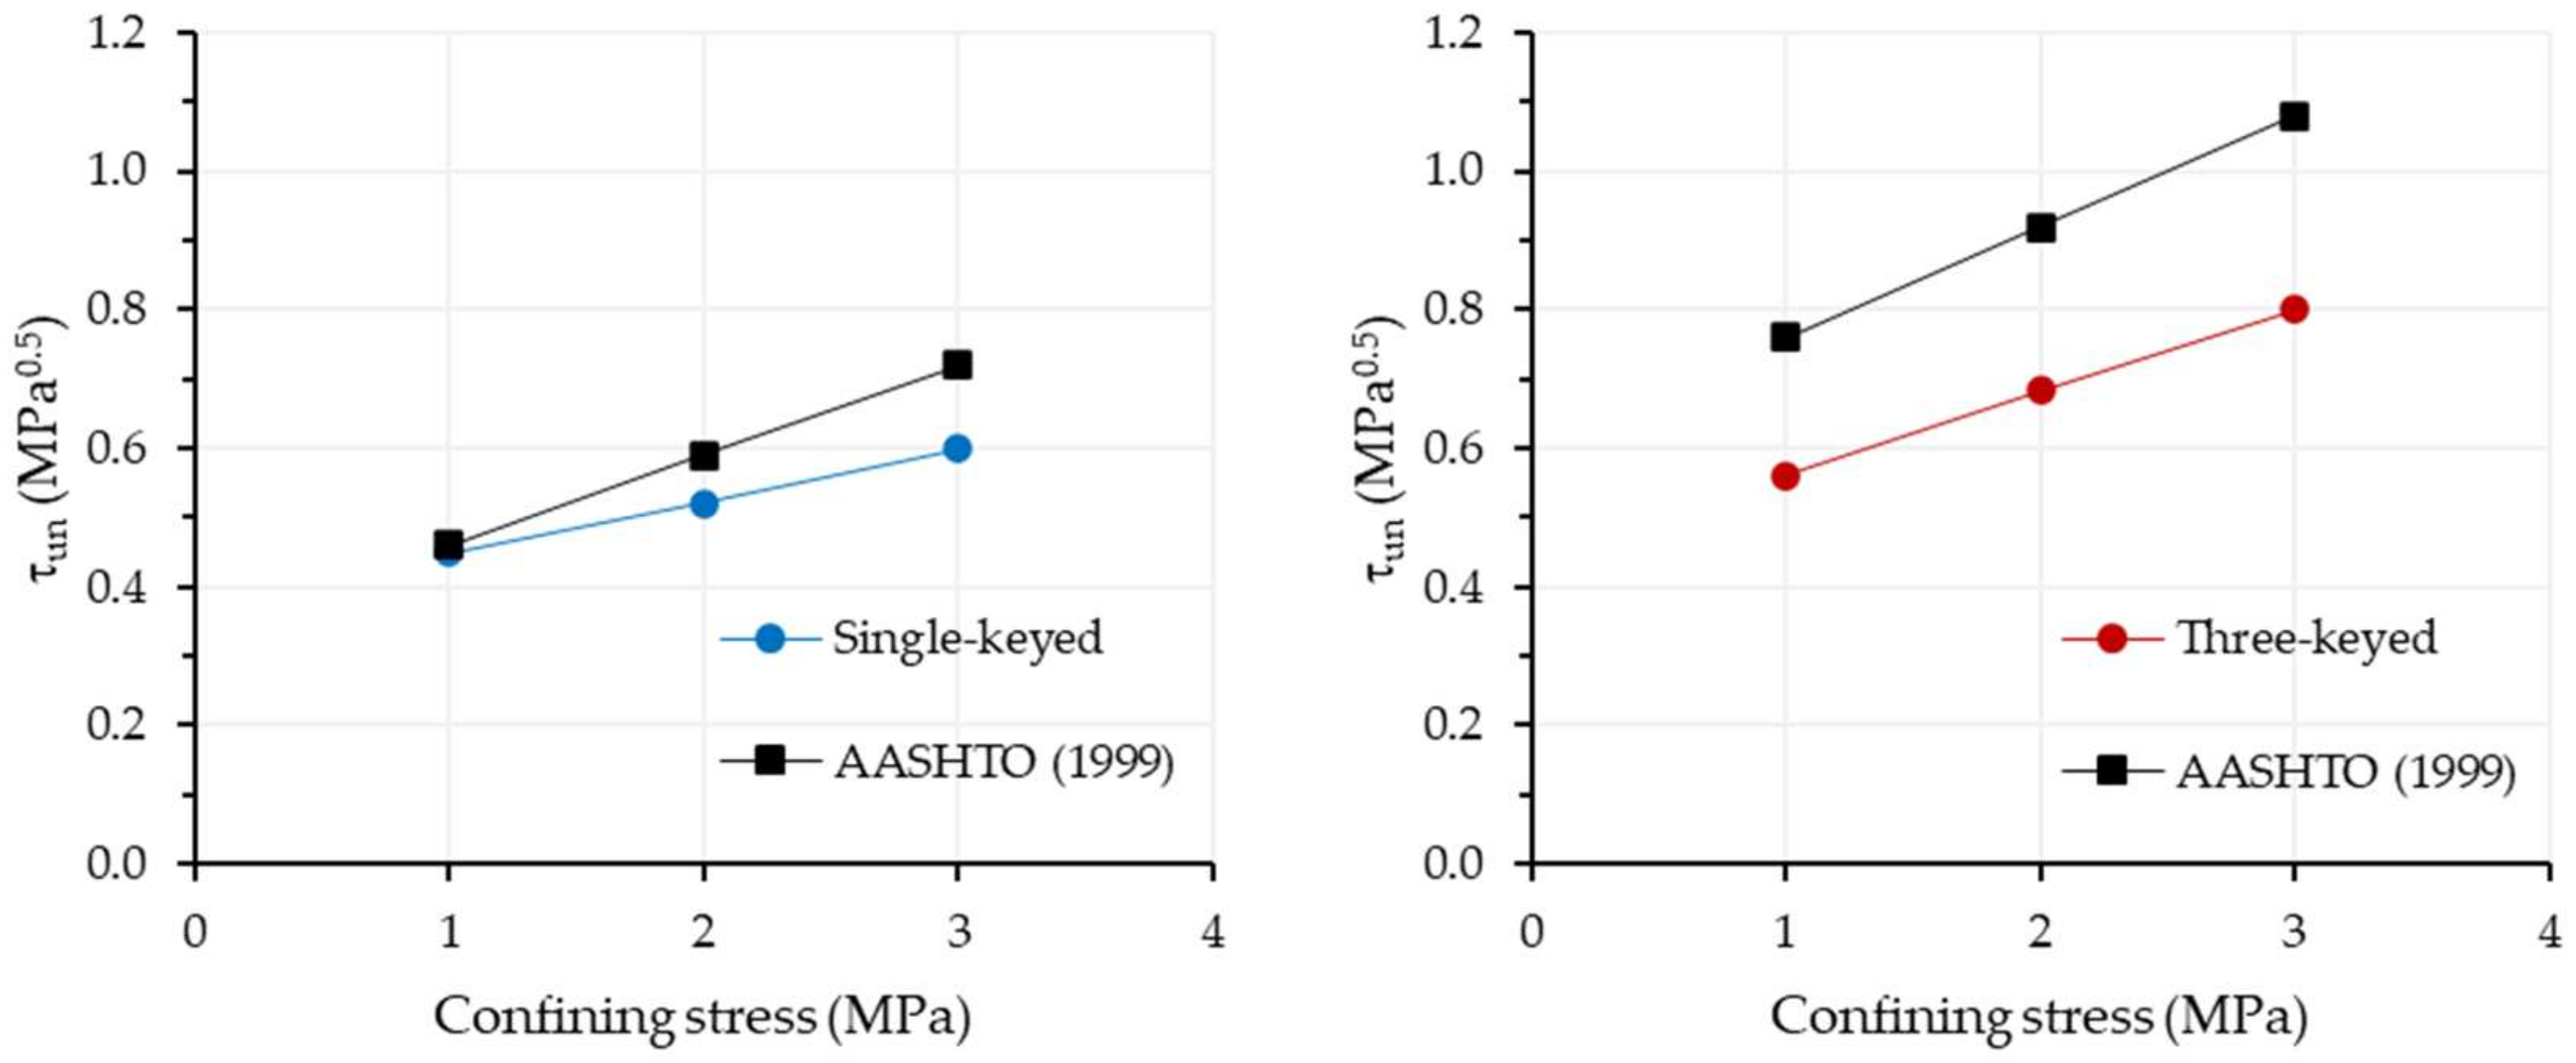
  • The normalized shear strength of dry joints with recycled coarse aggregates concrete was lower when compared to the results of other researchers obtained with conventional concrete. The results of this study indicate that, although RAC concrete is less resistant than conventional concrete, its load versus vertical slip curves display similar trends. Furthermore, a reduction in the normalized shear stress was observed for smooth joints, with decreases of 10%, 18%, and 22% for the confining stresses of 1.0, 2.0, and 3.0 MPa, respectively. Single-key joints exhibited a greater reduction, with decreases of 38%, 49%, and 44%. The three-keys joints showed the least difference between results, with reductions of 6% and 8% for the confining stresses of 1.0 and 2.0 MPa, respectively. This is likely due to the rupture effect in sequence of the keys, which does not permit the full strength of the keys in the joint;
  • The confining stress proved an essential resistance mechanism for dry joints with recycled coarse aggregate concrete. When the confinement stress of the smooth joints was increased from 1.0 MPa to 2.0 MPa, the strength gain was 88.89%, and from 2.0 MPa to 3.0 MPa, it was 35.29%. For the joint with keys, when the confinement stress was increased from 1.0 MPa to 2.0 MPa, the strength gain was 15.56% for one key and 21.43% for three keys. Furthermore, when the confinement stress increased from 2.0 MPa to 3.0 MPa, the strength gain was 15.38% for one key and 17.65% for three keys;
  • The number of keys influenced the resistance of the dry joints, and its increase was beneficial for the final resistance of the joint. When the number of keys increased from none to single-keyed, the strength gain was 400%, 205.88%, and 160.87% for the confining stresses of 1.0, 2.0, and 3.0 MPa, respectively. When the number of keys increased from single-keyed to three-keyed, the strength gain was 24.44%, 30.77%, and 33.33% for the confining stresses of 1.0, 2.0, and 3.0 MPa, respectively;
  • Equations of the literature used to predict the maximum load on dry joints with recycled coarse aggregates concrete showed safe values. The results showed that for single-keyed RAC dry joints, the equations of Turmo et al. [20], Rombach and Specker [19], and EUROCODE 2 [24] provided conservative values, while for the three-keyed RAC dry joints were those of Turmo et al. [20] and EUROCODE 2 [24];
  • The normative equation of AASHTO [21] satisfactorily predicted the strength of the single-keyed dry joint with recycled coarse aggregates concrete for the confining stress of 1.0 MPa; however, as the confining stress increased, the experimental results deviated from the forecast. For joints with three keys, the experimental results showed values far from the normative prediction;
  • The authors recommend the consideration of a minimization coefficient in the AASHTO [21] normative equation in the value of 0.7 for the prediction of recycled coarse aggregates concrete dry joints.
In this study, the behavior of dry joints produced with recycled coarse aggregate concrete was found to be comparable to that of conventional concrete joints in terms of rupture and cracking mode. The application of this material in dry joints of prestressed segmental bridges was further reinforced through the use of a reduction coefficient in the AASHTO normative equation (0.7). Further studies are required, including an analysis of the bending effort exerted on dry joints due to moments in the bridge abutment, an evaluation of the mechanical behavior of RAC concrete dry joints with varying percentages of aggregate substitution, and an investigation into the behavior of the joints with increased shear keys.

Author Contributions

Conceptualization, J.B.S. and S.L.G.G.; methodology, J.B.S. and S.L.G.G.; validation, J.B.S. and S.L.G.G.; formal analysis, J.B.S. and S.L.G.G.; investigation, J.B.S. and S.L.G.G.; resources, J.B.S. and S.L.G.G.; data curation, J.B.S. and S.L.G.G.; writing—original draft preparation, J.B.S., S.L.G.G. and R.M.R.P.; writing—review and editing, J.B.S., S.L.G.G. and R.M.R.P.; visualization, J.B.S.; supervision, R.M.R.P. and S.L.G.G.; project administration, S.L.G.G. All authors have read and agreed to the published version of the manuscript.

Funding

This research was funded by Carlos Chagas Filho Foundation for Research Support of the State of Rio de Janeiro (FAPERJ).

Data Availability Statement

The data presented in this study are available on request from the corresponding author.

Conflicts of Interest

The authors declare no conflict of interest.

References

  1. Cantero, B.; Bravo, M.; Brito, J.; Sáez del Bosque, I.F.; Medina, C. Mechanical Behaviour of Structural Concrete with Ground Recycled Concrete Cement and Mixed Recycled Aggregate. J. Clean. Prod. 2020, 275, 122913. [Google Scholar] [CrossRef]
  2. Pani, L.; Francesconi, L.; Rombi, J.; Mistretta, F.; Sassu, M.; Stochino, F. Effect of Parent Concrete on the Performance of Recycled Aggregate Concrete. Sustainability 2020, 12, 9399. [Google Scholar] [CrossRef]
  3. Naouaoui, K.; Bouyahyaoui, A.; Cherradi, T. Experimental Characterization of Recycled Aggregate Concrete. MATEC Web Conf. 2019, 303, 05004. [Google Scholar] [CrossRef] [Green Version]
  4. Liu, B.; Feng, C.; Deng, Z. Shear Behavior of Three Types of Recycled Aggregate Concrete. Constr. Build. Mater. 2019, 217, 557–572. [Google Scholar] [CrossRef]
  5. Patil, S.V.; Rao, K.B.; Nayak, G. Influence of Silica Fume on Mechanical Properties and Microhardness of Interfacial Transition Zone of Different Recycled Aggregate Concretes. Adv. Civ. Eng. Mater. 2021, 10, 412–426. [Google Scholar] [CrossRef]
  6. Silva, R.V.; Brito, J. Reinforced Recycled Aggregate Concrete Slabs: Structural Design Based on Eurocode 2. Eng. Struct. 2020, 204, 110047. [Google Scholar] [CrossRef]
  7. Chen, J.; Zhou, Y.; Yin, F. A Practical Equation for the Elastic Modulus of Recycled Aggregate Concrete. Buildings 2022, 12, 187. [Google Scholar] [CrossRef]
  8. Khatab, M.A.T.; Altmami, M. Correlation between Different Properties of Recycled Aggregate and Recycled Aggregate Concrete. AIP Conf. Proc. 2019, 2146, 020005. [Google Scholar] [CrossRef]
  9. Meddah, M.S.; Al-Harthy, A.; Ismail, M.A. Recycled Concrete Aggregates and Their Influences on Performances of Low and Normal Strength Concretes. Buildings 2020, 10, 167. [Google Scholar] [CrossRef]
  10. Lavado, J.; Bogas, J.; de Brito, J.; Hawreen, A. Fresh Properties of Recycled Aggregate Concrete. Constr. Build. Mater. 2020, 233, 117322. [Google Scholar] [CrossRef]
  11. Feng, W.; Tang, Y.; Yang, Y.; Cheng, Y.; Qiu, J.; Zhang, H.; Isleem, H.F.; Tayeh, B.A.; Namdar, A. Mechanical Behavior and Constitutive Model of Sustainable Concrete: Seawater and Sea-Sand Recycled Aggregate Concrete. Constr. Build. Mater. 2023, 364, 130010. [Google Scholar] [CrossRef]
  12. Birkeland, P.W.; Birkeland, H.W. Connections in Precast Concrete Construction. ACI J. Proc. 1966, 63, 345–368. [Google Scholar] [CrossRef]
  13. Buyukozturk, O.; Bakhoum, M.M.; Beattie, S.M. Shear Behavior of Joints in Precast Concrete Segmental Bridfes. J. Struct. Eng. 1990, 116, 3380–3401. [Google Scholar] [CrossRef]
  14. Xiao, J.; Sun, C.; Lange, D.A. Effect of Joint Interface Conditions on Shear Transfer Behavior of Recycled Aggregate Concrete. Constr. Build. Mater. 2016, 105, 343–355. [Google Scholar] [CrossRef]
  15. ACI 213R–03; Guide for Structural Lightweight-Aggregate Concrete. ACI Concrete Institute: Farmington Hills, MI, USA, 2014.
  16. Greene, G.; Graybeal, B. Lightweight Concrete: Mechanical Properties; Report No. Federal Highway Administration-HRT-13-062; McLean: Washington, DC, USA, 2013. [Google Scholar]
  17. Greene, G.; Graybeal, B. Lightweight Concrete: Shear Performance; Report No. Federal Highway Administration-HRT-15-022; McLean: Washington, DC, USA, 2015. [Google Scholar]
  18. Ahmed, G.H.; Aziz, O.Q. Shear Strength of Joints in Precast Posttensioned Segmental Bridges during 1959–2019, Review and Analysis. Structures 2019, 20, 527–542. [Google Scholar] [CrossRef]
  19. Rombach, G.; Specker, A. Design of Joints in Segmental Hollow Box Girder Bridges. In Proceedings of the 1st FIB Kongress, Osaka, Japan, 13–19 October 2002; pp. 1–6. [Google Scholar]
  20. Turmo, J.; Ramos, G.; Aparicio, A.C. Resistencia de Juntas Secas Conjugadas de Puentes de Dovelas Prefabricadas de Hormigón: Propuesta Para El Eurocódigo 2. Mater. Constr. 2006, 56, 45–52. [Google Scholar] [CrossRef]
  21. AASHTO. Guide Specifications for Design and Construction of Segmental Concrete Bridges; AASHTO GSCB: Washington, DC, USA, 1999. [Google Scholar]
  22. Alcalde, M.; Cifuentes, H.; Medina, F. Influencia Del Número de Llaves En La Resistencia a Cortante de Juntas Secas Postensadas. Mater. Constr. 2013, 63, 297–307. [Google Scholar] [CrossRef] [Green Version]
  23. ATEP Proyecto y Construcción de Puentes y Estructuras Con Pretensado Exterior. Col. Ing. Caminos, Canales y Puertos, Madrid. 1996. H.P.10-96 vol E-6. Available online: https://books.google.co.jp/books/about/Proyecto_y_construcci%C3%B3n_de_puentes_y_es.html?id=l_QDPgAACAAJ&redir_esc=y (accessed on 1 March 2023).
  24. EN 1992-1-1:2004; EUROCODE 2 Design of Concrete Structures—Part 1-1: General Rules and Rules for Buildings. European Commission: Brussels, Belgium, 2004.
  25. Fonteboa, G.; Martínez, F.; Carro, D.; Eiras, J. Cortante-Fricción de Los Hormigones Reciclados. Mater. Constr. 2010, 60, 53–67. [Google Scholar] [CrossRef] [Green Version]
  26. Xiao, J.; Xie, H.; Yang, Z. Shear Transfer across a Crack in Recycled Aggregate Concrete. Cem. Concr. Res. 2012, 42, 700–709. [Google Scholar] [CrossRef]
  27. Rahal, K. Shear Strength of Recycled Aggregates Concrete. Procedia Eng. 2017, 210, 105–108. [Google Scholar] [CrossRef]
  28. Trindade, J.; Garcia, S.; Fonseca, G. Experimental Study of Direct Shear in Concrete with Recycled Aggregate. ACI Struct. J. 2020, 17, 233–243. [Google Scholar]
  29. Trindade, J.; Garcia, S.L.; Torres, H. Shear Strength of Concrete with Recycled Aggregates Reinforced with Steel Fibers. ACI Mater. J. 2021, 118, 185–198. [Google Scholar] [CrossRef]
  30. Jiang, H.; Chen, L.; Ma, Z.J.; Feng, W. Shear Behavior of Dry Joints with Castellated Keys in Precast Concrete Segmental Bridges. J. Bridg. Eng. 2015, 20, 1–12. [Google Scholar] [CrossRef]
  31. ABNT NBR 11578:1991; Cimento Portland Composto. ABNT: São Paulo, Brazil, 1991.
  32. ABNT NBR NM 52; Agregado Miúdo—Determinação Da Massa Específica e Massa Específica Aparente. ABNT: São Paulo, Brazil, 2003.
  33. ABNT NBR NM 53; Agregado Graúdo—Determinação de Massa Específica, Massa Específica Aparente e Absorção de Água. ABNT: São Paulo, Brazil, 2002.
  34. EN 1097-1:2011; Ensayos Para Determinar Las Propriedades Mecánicas y Físicas de Los Áridos. Asociación Española de Normalización y Certificación: Madrid, Spain, 2011.
  35. Bazuco, R.S. Utilização de Agregados Reciclados de Concreto Para a Produção de Novos Concretos. Master’s Thesis, Universidade Federal de Santa Catarina, Florianópolis, Brazil, 1999. [Google Scholar]
  36. ABNT NBR 5739; Concreto—Ensaio de Compressão de Corpos de Prova Cilíndricos. ABNT: São Paulo, Brazil, 2018.
  37. ABNT NBR 7222; Concreto e Argamassa—Determinação Da Resistência à Tração Por Compressão Diametral de Corpos de Prova Cilíndricos. ABNT: São Paulo, Brazil, 2011.
  38. ABNT NBR 8522; Concreto—Determinação Dos Módulos Estáticos de Elasticidade e de Deformação à Compressão. ABNT: São Paulo, Brazil, 2017.
  39. ABNT NBR 9778; Argamassa e Concreto Endurecidos—Determinação Da Absorção de Água, Índice de Vazios e Massa Específica. ABNT: São Paulo, Brazil, 2009.
  40. Zhou, X.; Mickleborough, N.; Li, Z. Shear Strength of Joints in Precast Concrete Segmental Bridges. ACI Struct. J. 2005, 102, 901–904. [Google Scholar]
  41. Yang, I.H.; Kim, K.C.; Kim, Y.J. Shear Strength of Dry Joints in Precast Concrete Modules. In Proceedings of the 13th East Asia-Pacific Conference on Structural Engineering and Construction, EASEC-13, Sapporo, Japan, 11–13 September 2013. [Google Scholar]
  42. Liu, T.; Wang, Z.; Guo, J.; Wang, J. Shear Strength of Dry Joints in Precast UHPC Segmental Bridges: Experimental and Theoretical Research. J. Bridg. Eng. 2019, 24, 04018100. [Google Scholar] [CrossRef]
  43. Feng, J.; Liang, W.; Jiang, H.; Huang, C.; Zhang, J. Shear Performance of Single-Keyed Dry Joints between Reactive Power Concrete and High Strength Concrete in Push-off Tests. Sci. Prog. 2020, 103, 1–27. [Google Scholar] [CrossRef]
  44. Jiang, H.; Feng, J.; Liu, A.; Liang, W.; Tan, Y.; Liang, H. Effect of Specimen Thickness and Coarse Aggregate Size on Shear Strength of Single-Keyed Dry Joints in Precast Concrete Segmental Bridges. Struct. Concr. 2019, 20, 955–970. [Google Scholar] [CrossRef]
  45. 3D Metrology GOM Correlate 2020; Precise Industrial: Rockwood, TN, USA, 2020.
  46. Tang, Y.; Huang, Z.; Chen, Z.; Chen, M.; Zhou, H.; Zhang, H.; Sun, J. Novel Visual Crack Width Measurement Based on Backbone Double-Scale Features for Improved Detection Automation. Eng. Struct. 2023, 274, 115158. [Google Scholar] [CrossRef]
  47. Que, Y.; Dai, Y.; Ji, X.; Kwan Leung, A.; Chen, Z.; Tang, Y.; Jiang, Z. Automatic Classification of Asphalt Pavement Cracks Using a Novel Integrated Generative Adversarial Networks and Improved VGG Model. Eng. Struct. 2023, 277, 115406. [Google Scholar] [CrossRef]
Figure 1. (a) Representation of a segmental post-tensioned bridge arch, (b) detail of the region of the dry joint of shear key, (c) representation of the shear plane, (d) representation of the smooth region of the joint and (e) representation of the key region.
Infrastructures 08 00060 g001
Figure 2. Crack propagation in concrete with aggregates (a) more and (b) less resistant than the cementitious matrix.
Infrastructures 08 00060 g002
Figure 3. Flowchart of the adopted methodology.
Infrastructures 08 00060 g003
Figure 4. Scheme for the production of recycled coarse aggregates; (a) specimens from previous tests with concrete having a compressive strength between 50 MPa and 70 MPa were collected; (b) the specimens were fragmented for size reduction and stored; (c) a jaw crusher was then used to reduce their size to the size of coarse aggregate for concrete; (d) the fragments were washed, sieved to a particle size between 19 and 9.5 mm and then stored in a dry place.
Infrastructures 08 00060 g004
Figure 5. Granulometry of aggregates.
Infrastructures 08 00060 g005
Figure 6. Dimensions and geometry of the dry joint specimens (units in cm).
Infrastructures 08 00060 g006
Figure 7. Stages of casting the specimens: (a) wooden forms; (b) casting the part that receives the key; (c) concreting the key part.
Infrastructures 08 00060 g007
Figure 8. Dry joint specimens with recycled coarse aggregates concrete.
Infrastructures 08 00060 g008
Figure 9. Hydraulic press for applying the load.
Infrastructures 08 00060 g009
Figure 10. (a) schematic of the confinement system, (b) metal plates used to apply the confinement stress, and (c) steel bars instrumented to generate the reaction force on the plates.
Infrastructures 08 00060 g010
Figure 11. Single-keyed specimen with installed the confining system and DIC setup.
Infrastructures 08 00060 g011
Figure 12. Application of the GOM Correlate: (a) analysis of the vertical displacement of the specimen and (b) analysis of the crack opening in the shear key.
Infrastructures 08 00060 g012
Figure 13. Normalized shear stress versus relative vertical displacement curves for the flat RAC dry joint specimens.
Infrastructures 08 00060 g013
Figure 14. Normalized shear stress versus relative vertical displacement curves for the single-keyed RAC dry joint specimens.
Infrastructures 08 00060 g014
Figure 15. Normalized shear stress versus relative vertical displacement curves for the three-keyed RAC dry joint specimens.
Infrastructures 08 00060 g015
Figure 16. Influence of confining stress on increasing the maximum normalized shear stress of the RAC dry joints and the results of Jiang et al. [30].
Infrastructures 08 00060 g016
Figure 17. Influence of the number of keys on the maximum normalized shear stress of the RAC dry joints.
Infrastructures 08 00060 g017
Figure 18. (a) Crack model 2 of the single-keyed dry joints of Jiang et al. [30] and (b) crack pattern of the specimen CPR1-1-1.0.
Infrastructures 08 00060 g018
Figure 19. (a) Crack model of the three-keyed dry joints of Jiang et al. [30] and (b) crack pattern of the specimen CPR2-3-1.0.
Infrastructures 08 00060 g019
Figure 20. Maximum normalized shear stress in flat dry joints obtained for specimens from ordinary (black lines) [13,30,40] and RAC (blue line).
Infrastructures 08 00060 g020
Figure 21. Maximum normalized shear stress in single-keyed dry joints obtained for specimens from ordinary (black lines) [13,30,40,41,43,44] and RAC (blue line).
Infrastructures 08 00060 g021
Figure 22. Maximum normalized shear stress in three-keyed dry joints obtained for specimens from ordinary (black lines) [30,40,42] and RAC (blue line).
Infrastructures 08 00060 g022
Figure 23. Experimental results and prediction of maximum normalized shear stress of the single-keyed RAC dry joints using the equations in the literature [13,18,19,20,21,22,23,24].
Infrastructures 08 00060 g023
Figure 24. Experimental results and prediction of maximum normalized shear stress of the three-keyed RAC dry joints using the equations in the literature [13,18,19,20,21,22,23,24].
Infrastructures 08 00060 g024
Figure 25. Experimental results and prediction of maximum normalized shear stress by AASHTO [21].
Infrastructures 08 00060 g025
Table 1. Main equations for predicting the shear strength of dry joints.
Author/StandardEquation
AASHTO (1999) [21] V u = A k f c 0.9961 + 0.2048 σ n + 0.6 A s m σ n (1)
ATEP (1996) [23] V u = A j 1.14 σ n + 0.0564 f c d (2)
EUROCODE 2 [24] V u = A j 0.5 f c t d + 0.9 σ n (3)
Buyukozturk et al. (1990) [13] V u = A j 0.647 f c + 1.36 σ n (4)
Rombach and Specker (2002) [19] V u = 0.65 σ n A j + f f c k A k (5)
Turmo et al. (2006) [20] V u = A k 0.01 f c k 2 3 7 σ n + 33 + 0.6 A s m σ n (6)
Alcade et al. (2013) [22] V u = 7.118 A k 1 0.064 N k + 2.436 A s m σ n 1 + 0.127 N k (7)
Ahmed and Aziz (2019) [18] V u = 0.6 σ n A s m + 1.06 A k + 2100 σ n f c (8)
Table 2. Notation used in the equations in Table 1.
VariableNotationDescription
Design Parameters V u Maximum shear force (kN)
σ n Confining Stress (MPa)
f c k Characteristic compressive strength of concrete (MPa)
f c Concrete compressive strength (MPa)
f c d Design concrete compressive strength (MPa)
f c t d Concrete tensile strength (MPa)
Geometric characteristics A j Total joint area (mm2)
A k Area relative to the joint keys (mm2)
A s m Area related to the flat part of the joint (mm2)
N k Number of keys
f The factor relating to the key’s cutout equal to 0.14
Table 3. Physical characteristics of recycled coarse aggregates.
Specific Mass (g/cm3) [33]Water Absorption (%) [33]Abrasion Micro-Deval (%) [34]Adhered Mortar
(%) (Adapted from [35])
2.315.5513.9740.0
Table 4. Concrete mixing ratios.
MaterialQuantities/m3
Portland Cement CP2-E-32513.59 kg
Fine aggregate735.85 kg
Recycled coarse aggregate904 kg
Water236.25 L
w/c0.46
Table 5. Physics and mechanical characteristics of recycled coarse aggregate concrete.
RAC PropertiesValuesStandard DeviationCoefficient of Variation (%)
Compressive strength [36]41.52 MPa6.00 MPa14.45
Tensile strength [37]2.71 MPa0.21 MPa7.75
Modulus of Elasticity [38]34.65 GPa5.34 GPa15.41
Density [39]2450 kg/m320 kg/m30.82
Water absorption [39]7.38%0.63%8.54
Table 6. Summary of the experimental program.
SpecimenJoint TypeShear Area (mm2)Confining Stress (MPa)
CPR-L-1.0Flat30,0001.0
CPR-L-2.02.0
CPR-L-3.03.0
CPR-1-1.0Single-keyed30,0001.0
CPR-1-2.02.0
CPR-1-3.03.0
CPR-3-1.0Three-keyed50,0001.0
CPR-3-2.02.0
CPR-3-3.03.0
Table 7. Deformations required in the threaded bars.
Confinement Stress
(MPa)
Deformation in the Bar (με)Reaction Force
(kN)
1.0114.71/191.187.50/12.5
2.0229.41/382.3515.0/25.0
3.0344.12/573.5322.5/37.5
Table 8. Summary of experimental results of the RAC dry joints and the results presented by Jiang et al. [30].
SpecimensFailure Load Vu
(kN)
Maximum Shear Stress τu
(MPa)
Normalized Cracking Shear Stress τnf
(MPa0.5)
Maximum Normalized Shear Stress τun
(MPa0.5)
Standard Deviation
(MPa)
Maximum Normalized Shear Stress τun,J
(MPa0.5)
CPR-L-1.016.980.57-0.090.010.10
CPR-L-2.032.011.07-0.170.020.18
CPR-L-3.045.311.51-0.230.02-
CPR-1-1.086.182.870.200.450.030.70
CPR-1-2.0104.893.500.280.520.010.88
CPR-1-3.0115.113.840.350.600.01-
CPR-3-1.0180.343.610.450.560.030.56
CPR-3-2.0228.894.580.620.680.040.73
CPR-3-3.0256.605.130.720.800.07-
Table 9. Relationship between the experimental results of this research and those from Jiang et al. [30].
Jointσn (MPa)τunun,J
Flat10.90
20.94
Single-keyed10.64
20.59
Three-keyed11.00
20.93
Table 10. Information about dry joints specimens from previous papers.
PaperJoint TypeConcrete Strength Resistance (MPa)Joint Width (mm)Total Smooth Joint Area (mm2)Total Monolithic Joint Area (mm2)Total Joint Area (mm2)
Buyukozturk [13]Flat47.3776.25806.44-5806.44
Single-keyed47.3776.23992.9762011,612.9
Zhou [40]Flat52.2–52.825050,000-50,000
Single-keyed37.1–56.225025,00025,00050,000
Three-keyed30.2–63.725050,00075,000125,000
Yang [41]Single-keyed6010010,000700017,000
Jiang [30]Flat40.4910020,000-20,000
Single-keyed41.5110010,00010,00020,000
Three-keyed41.8210020,00030,00050,000
Jiang [44]Single-keyed41.0310010,00010,00020,000
Liu [42]Flat123.9–125.5915045,000-45,000
Single-keyed123.9–125.5915030,00015,00045,000
Three-keyed123.6–124.6615030,00045,00075,000
Feng [43]Single-keyed64.2110010,00010,00020,000
Table 11. Relationship between maximum normalized shear stress predicted by the literature equations and experimental results.
SpecimensAASHTO 1ATEP 2EUR 3BUYU 4ROMB 5TURM 6ALCA 7AHMD 8
CPR-1-1.01.041.210.751.920.900.701.411.09
CPR-1-2.01.091.320.881.970.930.771.681.14
CPR-1-3.01.211.501.032.151.010.882.011.26
CPR-3-1.01.350.970.601.531.150.861.331.28
CPR-3-2.01.291.010.671.501.050.841.341.12
CPR-3-3.01.351.120.771.611.060.901.461.10
1 AASHTO [21]; 2 ATEP [23]; 3 EUROCODE 2 [24]; 4 Buyukozturk et al. [13]; 5 Rombach and Specker [19]; 6 Turmo et al. [20]; 7 Alcade et al. [22]; 8 Ahmed and Aziz [18].
Disclaimer/Publisher’s Note: The statements, opinions and data contained in all publications are solely those of the individual author(s) and contributor(s) and not of MDPI and/or the editor(s). MDPI and/or the editor(s) disclaim responsibility for any injury to people or property resulting from any ideas, methods, instructions or products referred to in the content.

