
Practical Aspects of Correlation Analysis of Compressive Strength from Destructive and Non-Destructive Methods in Different Directions


Abstract
:1. Introduction
2. Materials and Methods
2.1. Mixtures and Samples
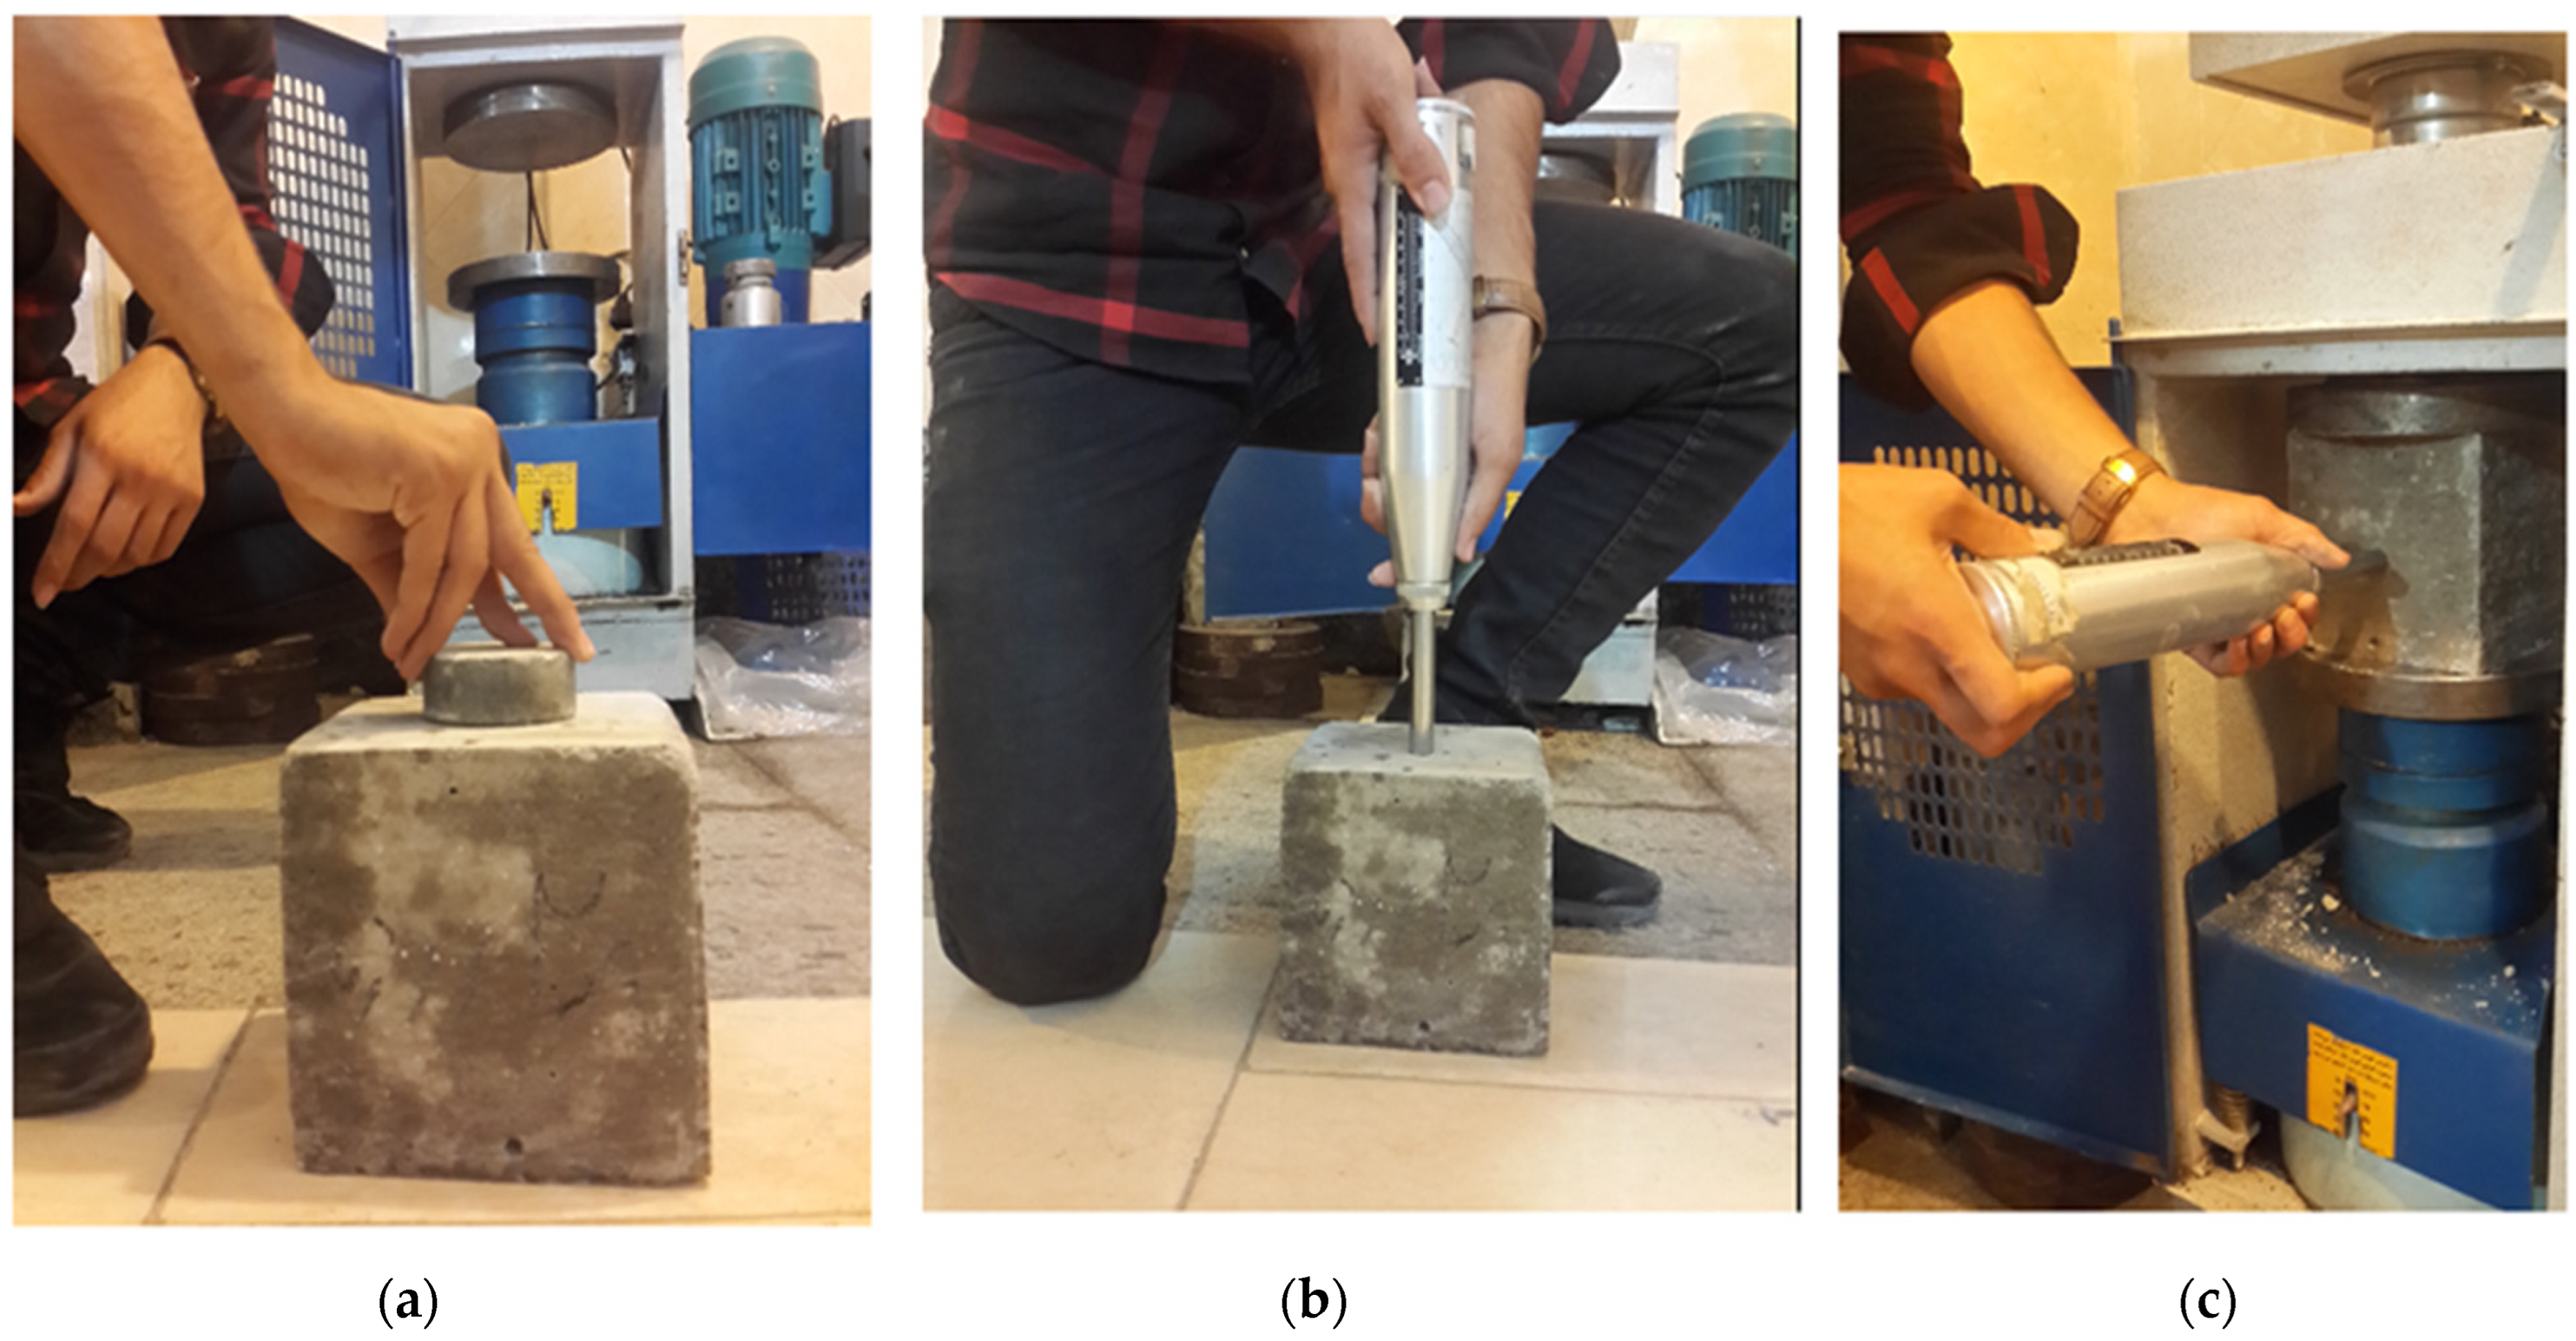
2.2. Experimental Program
2.3. Statistics
3. Results and Discussion
4. Conclusions
Author Contributions
Funding
Institutional Review Board Statement
Informed Consent Statement
Data Availability Statement
Acknowledgments
Conflicts of Interest
References
- Hrabová, K.; Teplý, B.; Hájek, P. Concrete, Sustainability and Limit States. IOP Conf. Ser. Earth Environ. Sci. 2019, 290, 12049. [Google Scholar] [CrossRef]
- Assi, L.; Carter, K.; Deaver, E.; Anay, R.; Ziehl, P. Sustainable Concrete: Building a Greener Future. J. Clean Prod. 2018, 198, 1641–1651. [Google Scholar] [CrossRef]
- Lehner, P.; Hrabová, K. Relationship of Time-Dependent Parameters from Destructive and Non-Destructive Tests of Structural Concrete. Mathematics 2022, 10, 460. [Google Scholar] [CrossRef]
- Schabowicz, K. Non-Destructive Testing of Materials in Civil Engineering. Materials 2019, 12, 3237. [Google Scholar] [CrossRef] [PubMed]
- Malkin, R.E.; Franklin, A.C.; Bevan, R.L.T.; Kikura, H.; Drinkwater, B.W. Surface Reconstruction Accuracy Using Ultrasonic Arrays: Application to Non-Destructive Testing. NDT E Int. 2018, 96, 26–34. [Google Scholar] [CrossRef]
- Trykoz, L.; Kamchatnaya, S.; Lyuty, V.; Borodin, D.; Atynian, A. Non-Destructive Control Method of the State of Objects Operating Long Time. Diagnostyka 2018, 19, 11–17. [Google Scholar] [CrossRef]
- Frappa, G.; Miceli, M.; Pauletta, M. Destructive and Non-Destructive Tests on Columns and Cube Specimens Made with the Same Concrete Mix. Constr. Build. Mater. 2022, 349, 128807. [Google Scholar] [CrossRef]
- Aydin, F.; Saribiyik, M. Correlation between Schmidt Hammer and Destructive Compressions Testing for Concretes in Existing Buildings. Sci. Res. Essays 2010, 5, 1644–1648. [Google Scholar]
- Shang, H.S.; Yi, T.H.; Yang, L.S. Experimental Study on the Compressive Strength of Big Mobility Concrete with Nondestructive Testing Method. Adv. Mater. Sci. Eng. 2012, 2012, 345214. [Google Scholar] [CrossRef]
- Frappa, G.; Pauletta, M. Seismic Retrofitting of a Reinforced Concrete Building with Strongly Different Stiffness in the Main Directions. In Proceedings of the 14th Fib International PhD Symposium in Civil Engineering, Rome, Italy, 5–7 September 2022. [Google Scholar]
- Hannachi, S.; Guetteche, M.N. Review of the Rebound Hammer Method Estimating Concrete Compressive Strength on Site. In Proceedings of the 2014 3rd International Conference on Civil Engineering and Architecture (ICCEA 2014), Campinas City, Brazil, 30 July–1 August 2014. [Google Scholar]
- Brencich, A.; Cassini, G.; Pera, D.; Riotto, G. Calibration and Reliability of the Rebound (Schmidt) Hammer Test. Civ. Eng. Archit. 2013, 1, 66–78. [Google Scholar] [CrossRef]
- Mohammed, D.A.; Alshkane, Y.M.; Hamaamin, Y.A.; Mahmood, A.O. Tensile Strength of Different Types of Limestone Rocks in North of Iraq. Innov. Infrastruct. Solut. 2022, 7, 25. [Google Scholar] [CrossRef]
- Garrido, M.E.; Petnga, F.B.; Martínez-Ibáñez, V.; Serón, J.B.; Hidalgo-Signes, C.; Tomás, R. Predicting the Uniaxial Compressive Strength of a Limestone Exposed to High Temperatures by Point Load and Leeb Rebound Hardness Testing. Rock Mech. Rock Eng. 2022, 55, 1–17. [Google Scholar] [CrossRef]
- Mujahadah, N.; Hariyadi; Kencanawati, N.N.; Ngudiyono. Analysis the Effect of Moisture Content of Normal Concrete Using Hammer Test. Aip Conf. Proc. 2023, 2609, 50006. [Google Scholar] [CrossRef]
- Yurdakul, M.; Ceylan, H.; Akdas, H. A Predictive Model for Uniaxial Compressive Strength of Carbonate Rocks from Schmidt Hardness. In Proceedings of the 45th US Rock Mechanics/Geomechanics Symposium, San Francisco, CA, USA, 26–29 June 2011. [Google Scholar]
- Umar, T.; Yousaf, M.; Akbar, M.; Abbas, N.; Hussain, Z.; Ansari, W.S. An Experimental Study on Non-Destructive Evaluation of the Mechanical Characteristics of a Sustainable Concrete Incorporating Industrial Waste. Materials 2022, 15, 7346. [Google Scholar] [CrossRef]
- Sanchez, K.; Tarranza, N. Reliability of Rebound Hammer Test in Concrete Compressive Strength Estimation. Int. J. Adv. Agric. Environ. Eng. 2015, 1, 198–202. [Google Scholar] [CrossRef]
- Revilla-Cuesta, V.; Ortega-López, V.; Faleschini, F.; Santamaría, A.; Skaf, M. Compressive-Strength Evaluation of Recycled Aggregate Self-Compacting Concrete Through Hammer Rebound Index. In International Conference of the European Association on Quality Control of Bridges and Structures; Springer International Publishing: Cham, Switzerland, 2022; Volume 200. [Google Scholar]
- Parsajoo, M.; Armaghani, D.J.; Asteris, P.G. A Precise Neuro-Fuzzy Model Enhanced by Artificial Bee Colony Techniques for Assessment of Rock Brittleness Index. Neural. Comput. Appl. 2022, 34, 3263–3281. [Google Scholar] [CrossRef]
- Mohamad, E.T.; Latifi, N.; Arefnia, A.; Isa, M.F. Effects of Moisture Content on the Strength of Tropically Weathered Granite from Malaysia. Bull. Eng. Geol. Environ. 2016, 75, 369–390. [Google Scholar] [CrossRef]
- Odimegwu, T.C.; Amrul Kaish, A.B.M.; Zakaria, I.; Abood, M.M.; Jamil, M.; Ngozi, K.-O. Nondestructive Determination of Strength of Concrete Incorporating Industrial Wastes as Partial Replacement for Fine Aggregate. Sensors 2021, 21, 8256. [Google Scholar] [CrossRef]
- Alshaikh, I.M.H.; Zeyad, A.M. Reliability of the Tests’ Results of Schmidt Hammer and Core Cutting for Assessing Actual Compressive Strength of Concrete. J. Build. Pathol. Rehabil. 2022, 7, 70. [Google Scholar] [CrossRef]
- Long, X.; Mao, M.-H.; Su, T.-X.; Su, Y.-T.; Tian, M.-K. Machine Learning Method to Predict Dynamic Compressive Response of Concrete-like Material at High Strain Rates. Def. Technol. 2023, 23, 100–111. [Google Scholar] [CrossRef]
- ASTM D1067-06; Standard Test Methods for Acidity or Alkalinity of Water. Annual Book of ASTM Standards. ASTM International: West Conshohocken, PA, USA, 2006.
- Dixon, D.E.; Prestrera, J.R.; Burg, G.R.; Chairman, S.A.; Abdun-Nur, E.A.; Barton, S.G.; Bell, L.W.; Blas, S.J., Jr.; Carrasquillo, R.L.; Carrasquillo, P.M.; et al. Standard Practice for Selecting Proportions for Normal, Heavyweight, and Mass Concrete (ACI 211.1-91); ACI: Farmington Hills, MI, USA, 1991. [Google Scholar]
- BS 1881-108; Testing Concrete Part 108. Method for Making Test Cubes from Fresh Concrete. British Standards Institution: London, UK, 1983.
- ASTM C 805-02; Standard Test Method for Rebound Number of Hardened Concrete. American Society for Testing and Material: West Conshohocken, PA, USA, 2002.
- Schober, P.; Boer, C.; Schwarte, L.A. Correlation Coefficients. Anesth. Analg. 2018, 126, 1763–1768. [Google Scholar] [CrossRef] [PubMed]
- Zou, K.H.; Tuncali, K.; Silverman, S.G. Correlation and Simple Linear Regression. Radiology 2003, 227, 617–628. [Google Scholar] [CrossRef] [PubMed]
- Nagelkerke, N.J.D. A Note on a General Definition of the Coefficient of Determination. Biometrika 1991, 78, 691–692. [Google Scholar] [CrossRef]
- Hrabová, K.; Láník, J.; Lehner, P. Statistical and Practical Evaluation of the Mechanical and Fracture Properties of Steel Fibre Reinforced Concrete. Buildings 2022, 12, 1082. [Google Scholar] [CrossRef]


| Concrete | Sand (kg) | Gravel (kg) | Cement (kg) | Water (lit) | Slump | Water/Cement |
|---|---|---|---|---|---|---|
| C30 | 950 | 852 | 400 | 228 | 7.5–10 | 0.57 |
| C35 | 950 | 852 | 450 | 234 | 7.5–10 | 0.52 |
| C40 | 950 | 852 | 500 | 240 | 7.5–10 | 0.48 |
| Age | Class | Test | Mean | STD |
|---|---|---|---|---|
| 7 days | C30 | Compressive Strength | 31.7 MPa | 3.19 |
| Rebound number (horizontal) | 28.5 | 2.81 | ||
| Rebound number (vertical) | 23.1 | 1.22 | ||
| C35 | Compressive Strength | 37.5 MPa | 2.74 | |
| Rebound number (horizontal) | 30.1 | 2.48 | ||
| Rebound number (vertical) | 24.5 | 2.25 | ||
| C40 | Compressive Strength | 38.9 MPa | 4.22 | |
| Rebound number (horizontal) | 33.2 | 2.14 | ||
| Rebound number (vertical) | 26 | 1.75 |
| Age | Class | Test | Mean | STD |
|---|---|---|---|---|
| 28 days | C30 | Compressive Strength | 42.9 MPa | 4.82 |
| Rebound number (horizontal) | 34.1 | 2.19 | ||
| Rebound number (vertical) | 25.9 | 1.73 | ||
| C35 | Compressive Strength | 47.1 MPa | 4.36 | |
| Rebound number (horizontal) | 35.5 | 1.19 | ||
| Rebound number (vertical) | 28.6 | 2.36 | ||
| C40 | Compressive Strength | 51.1 MPa | 3.68 | |
| Rebound number (horizontal) | 36.1 | 1.55 | ||
| Rebound number (vertical) | 30.7 | 3.15 |
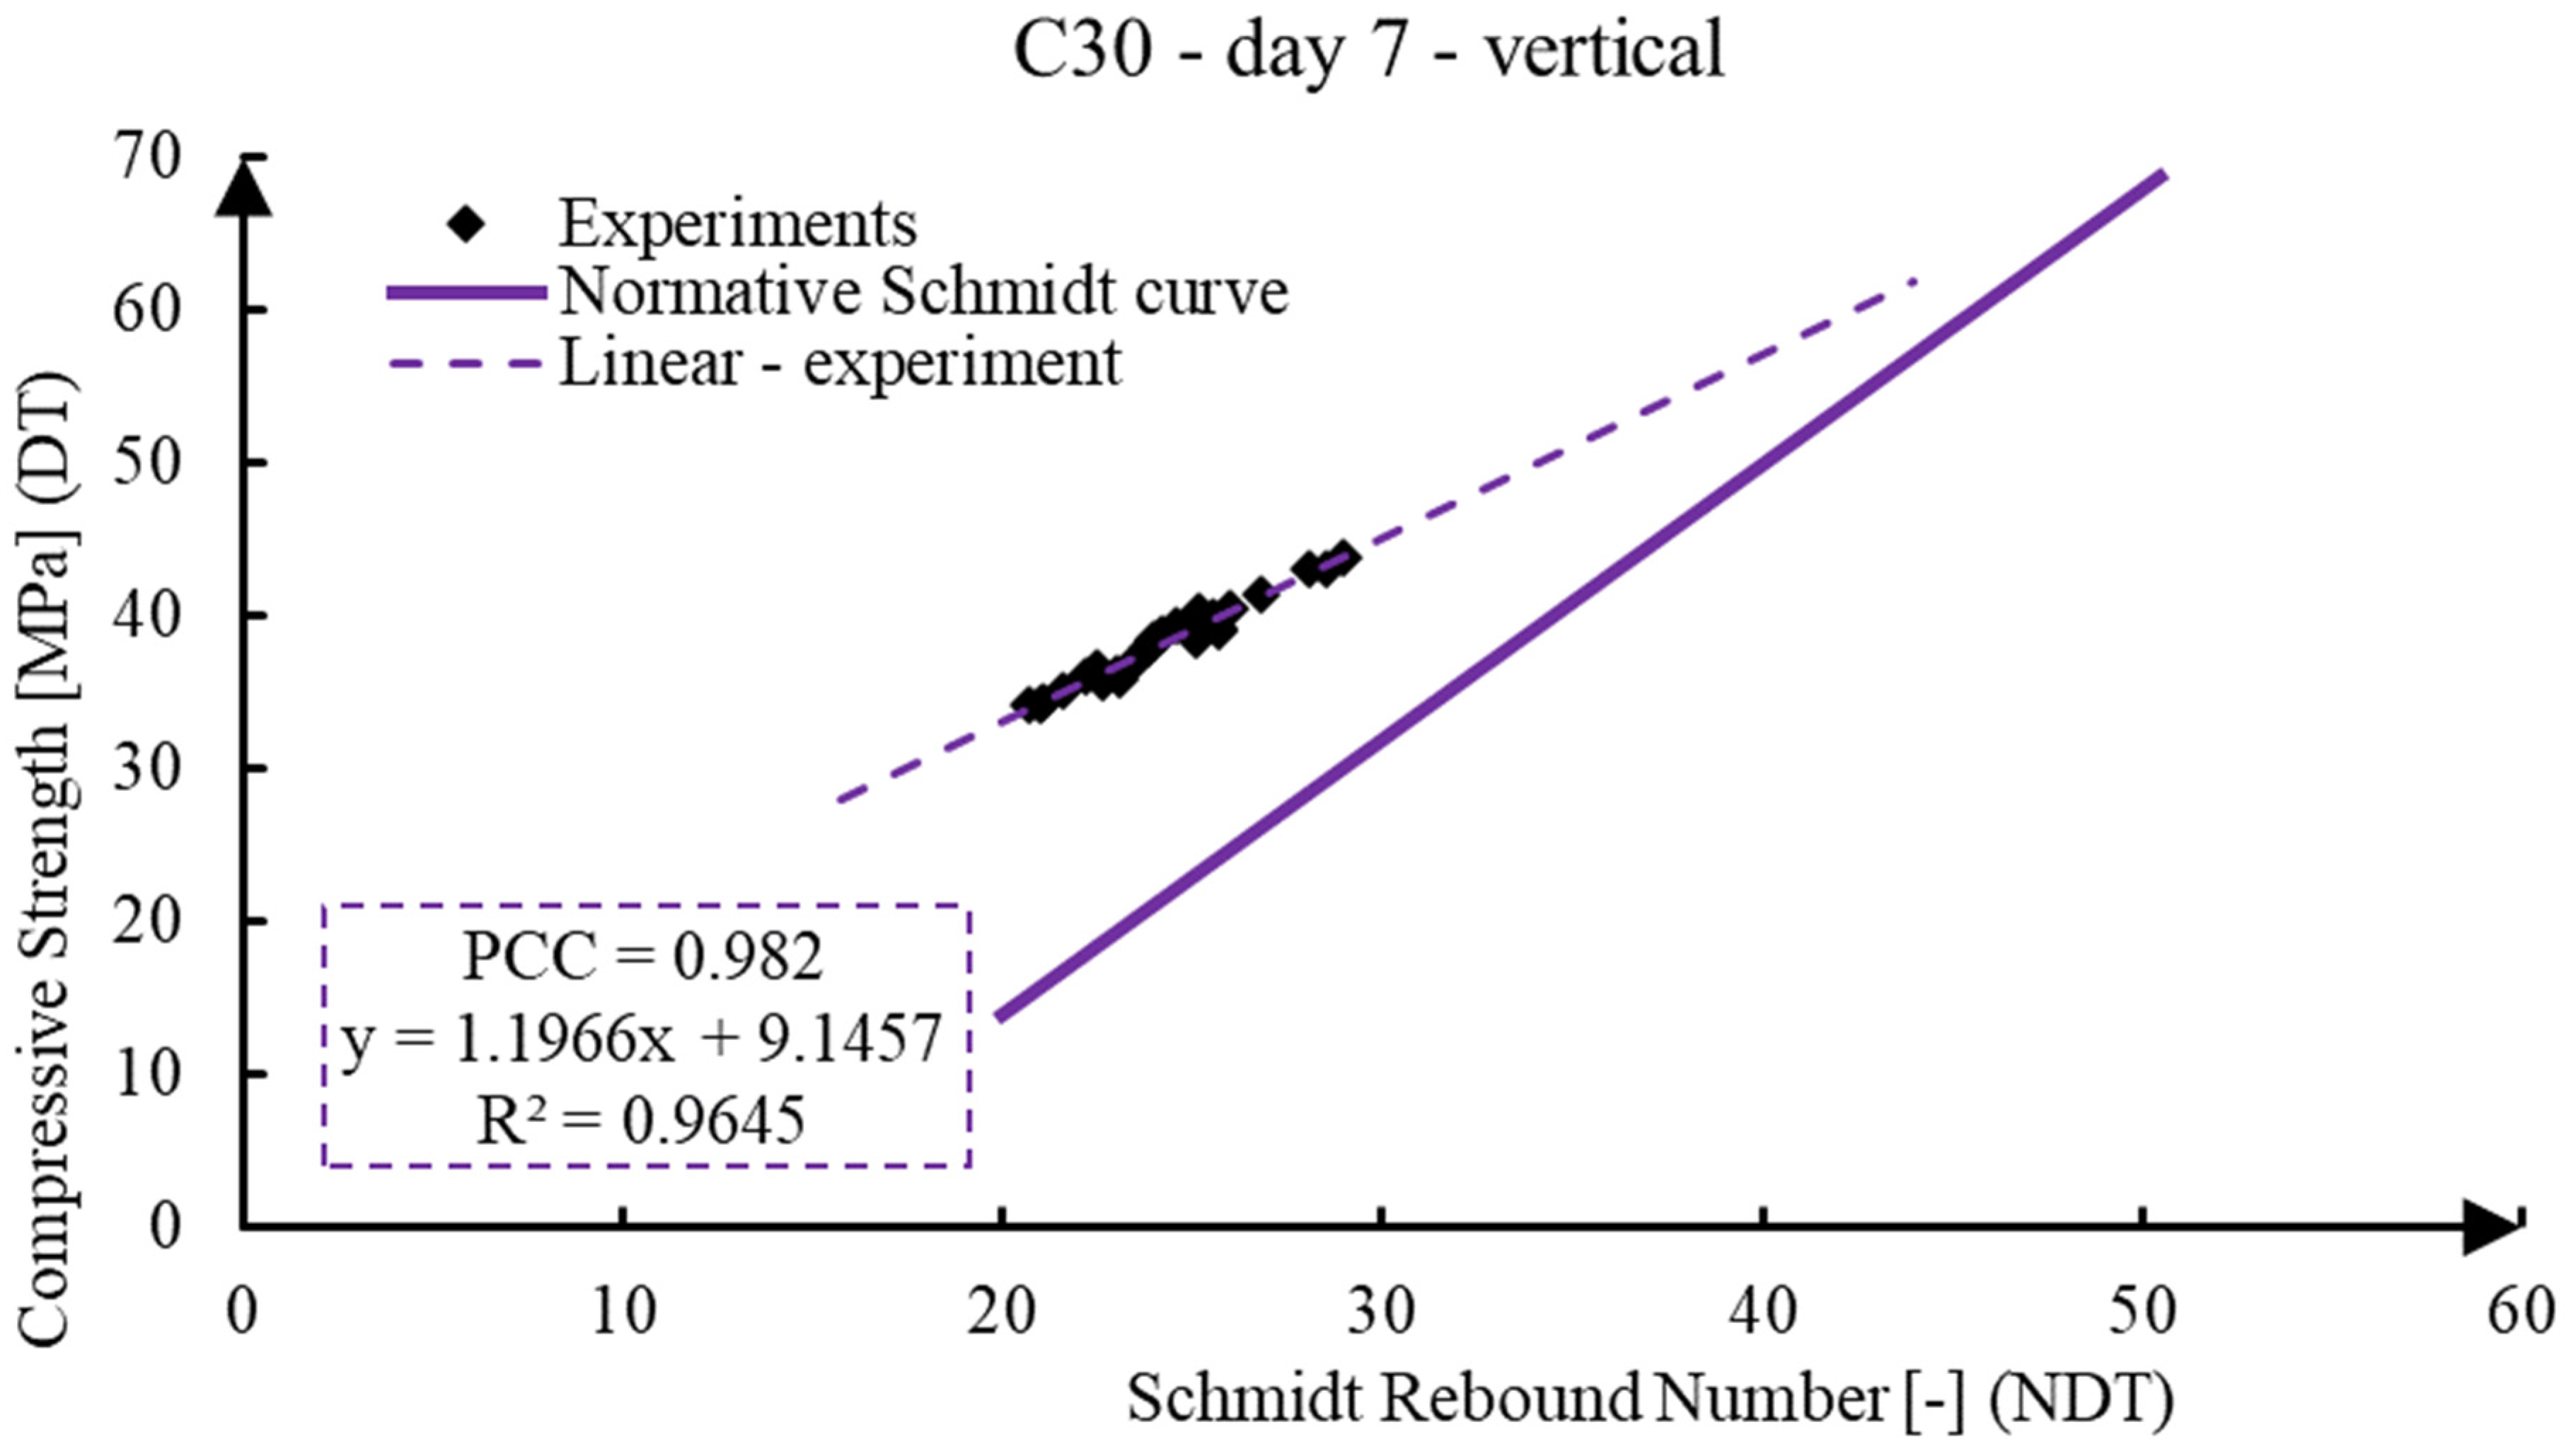
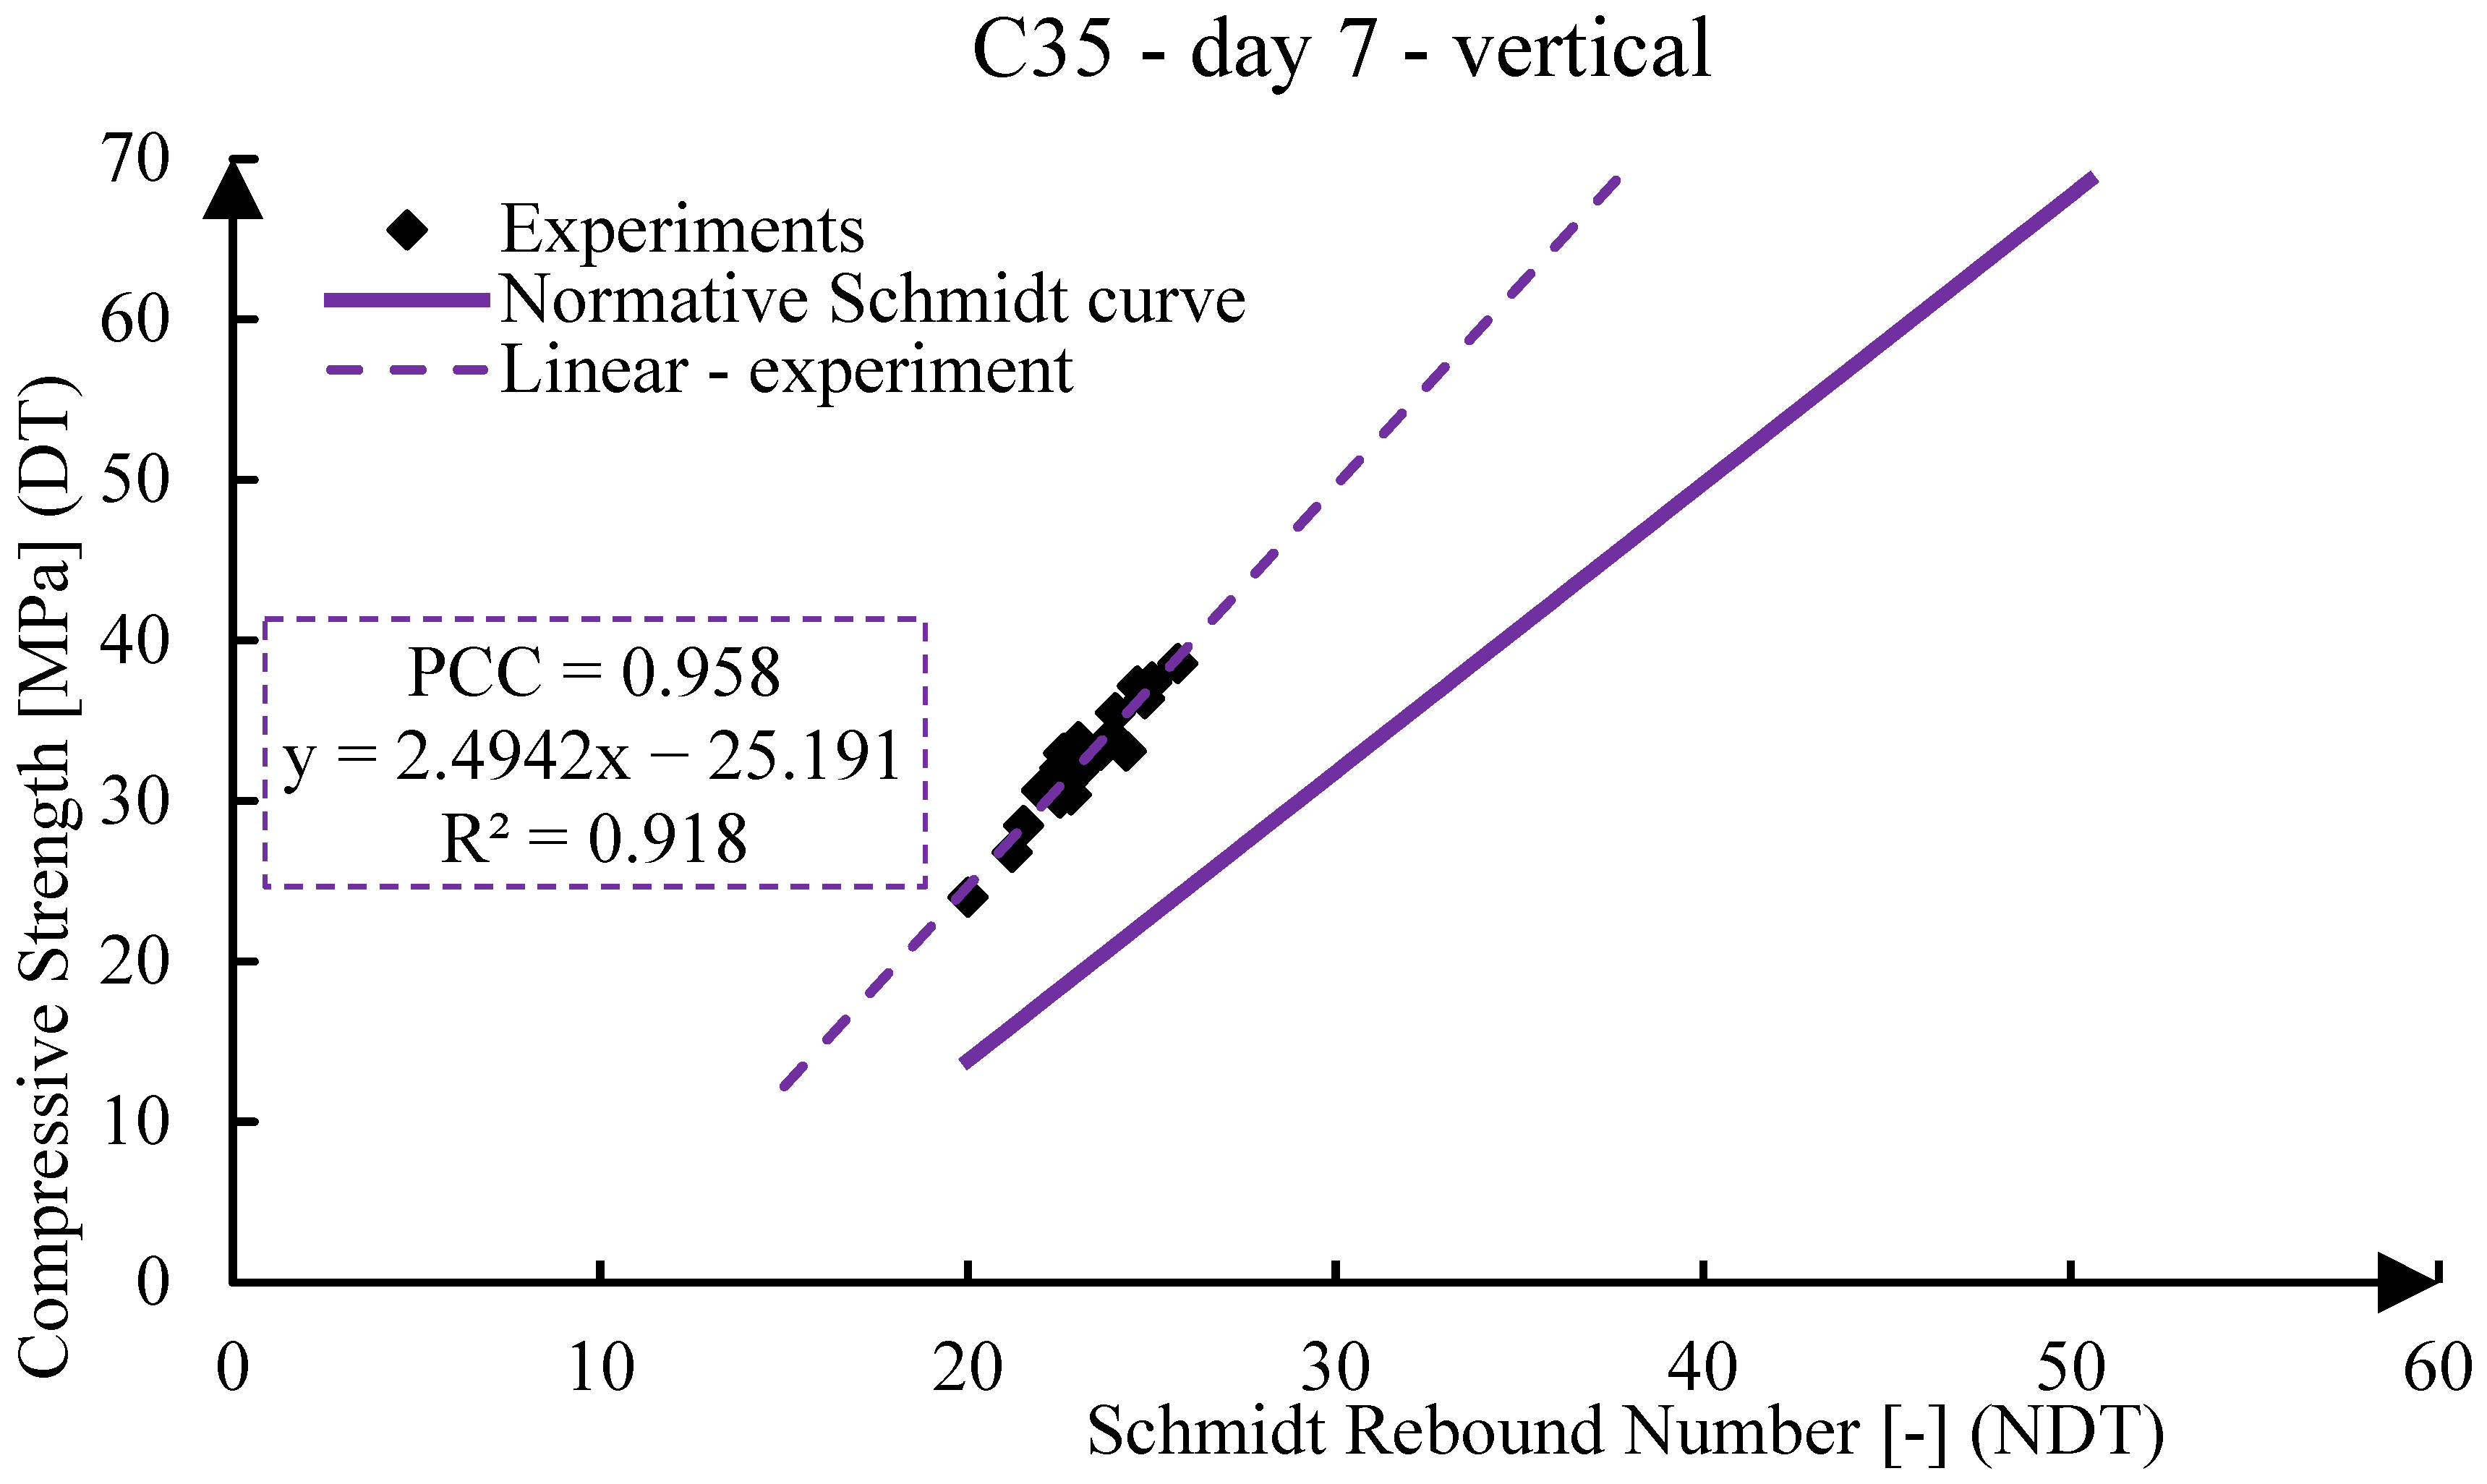
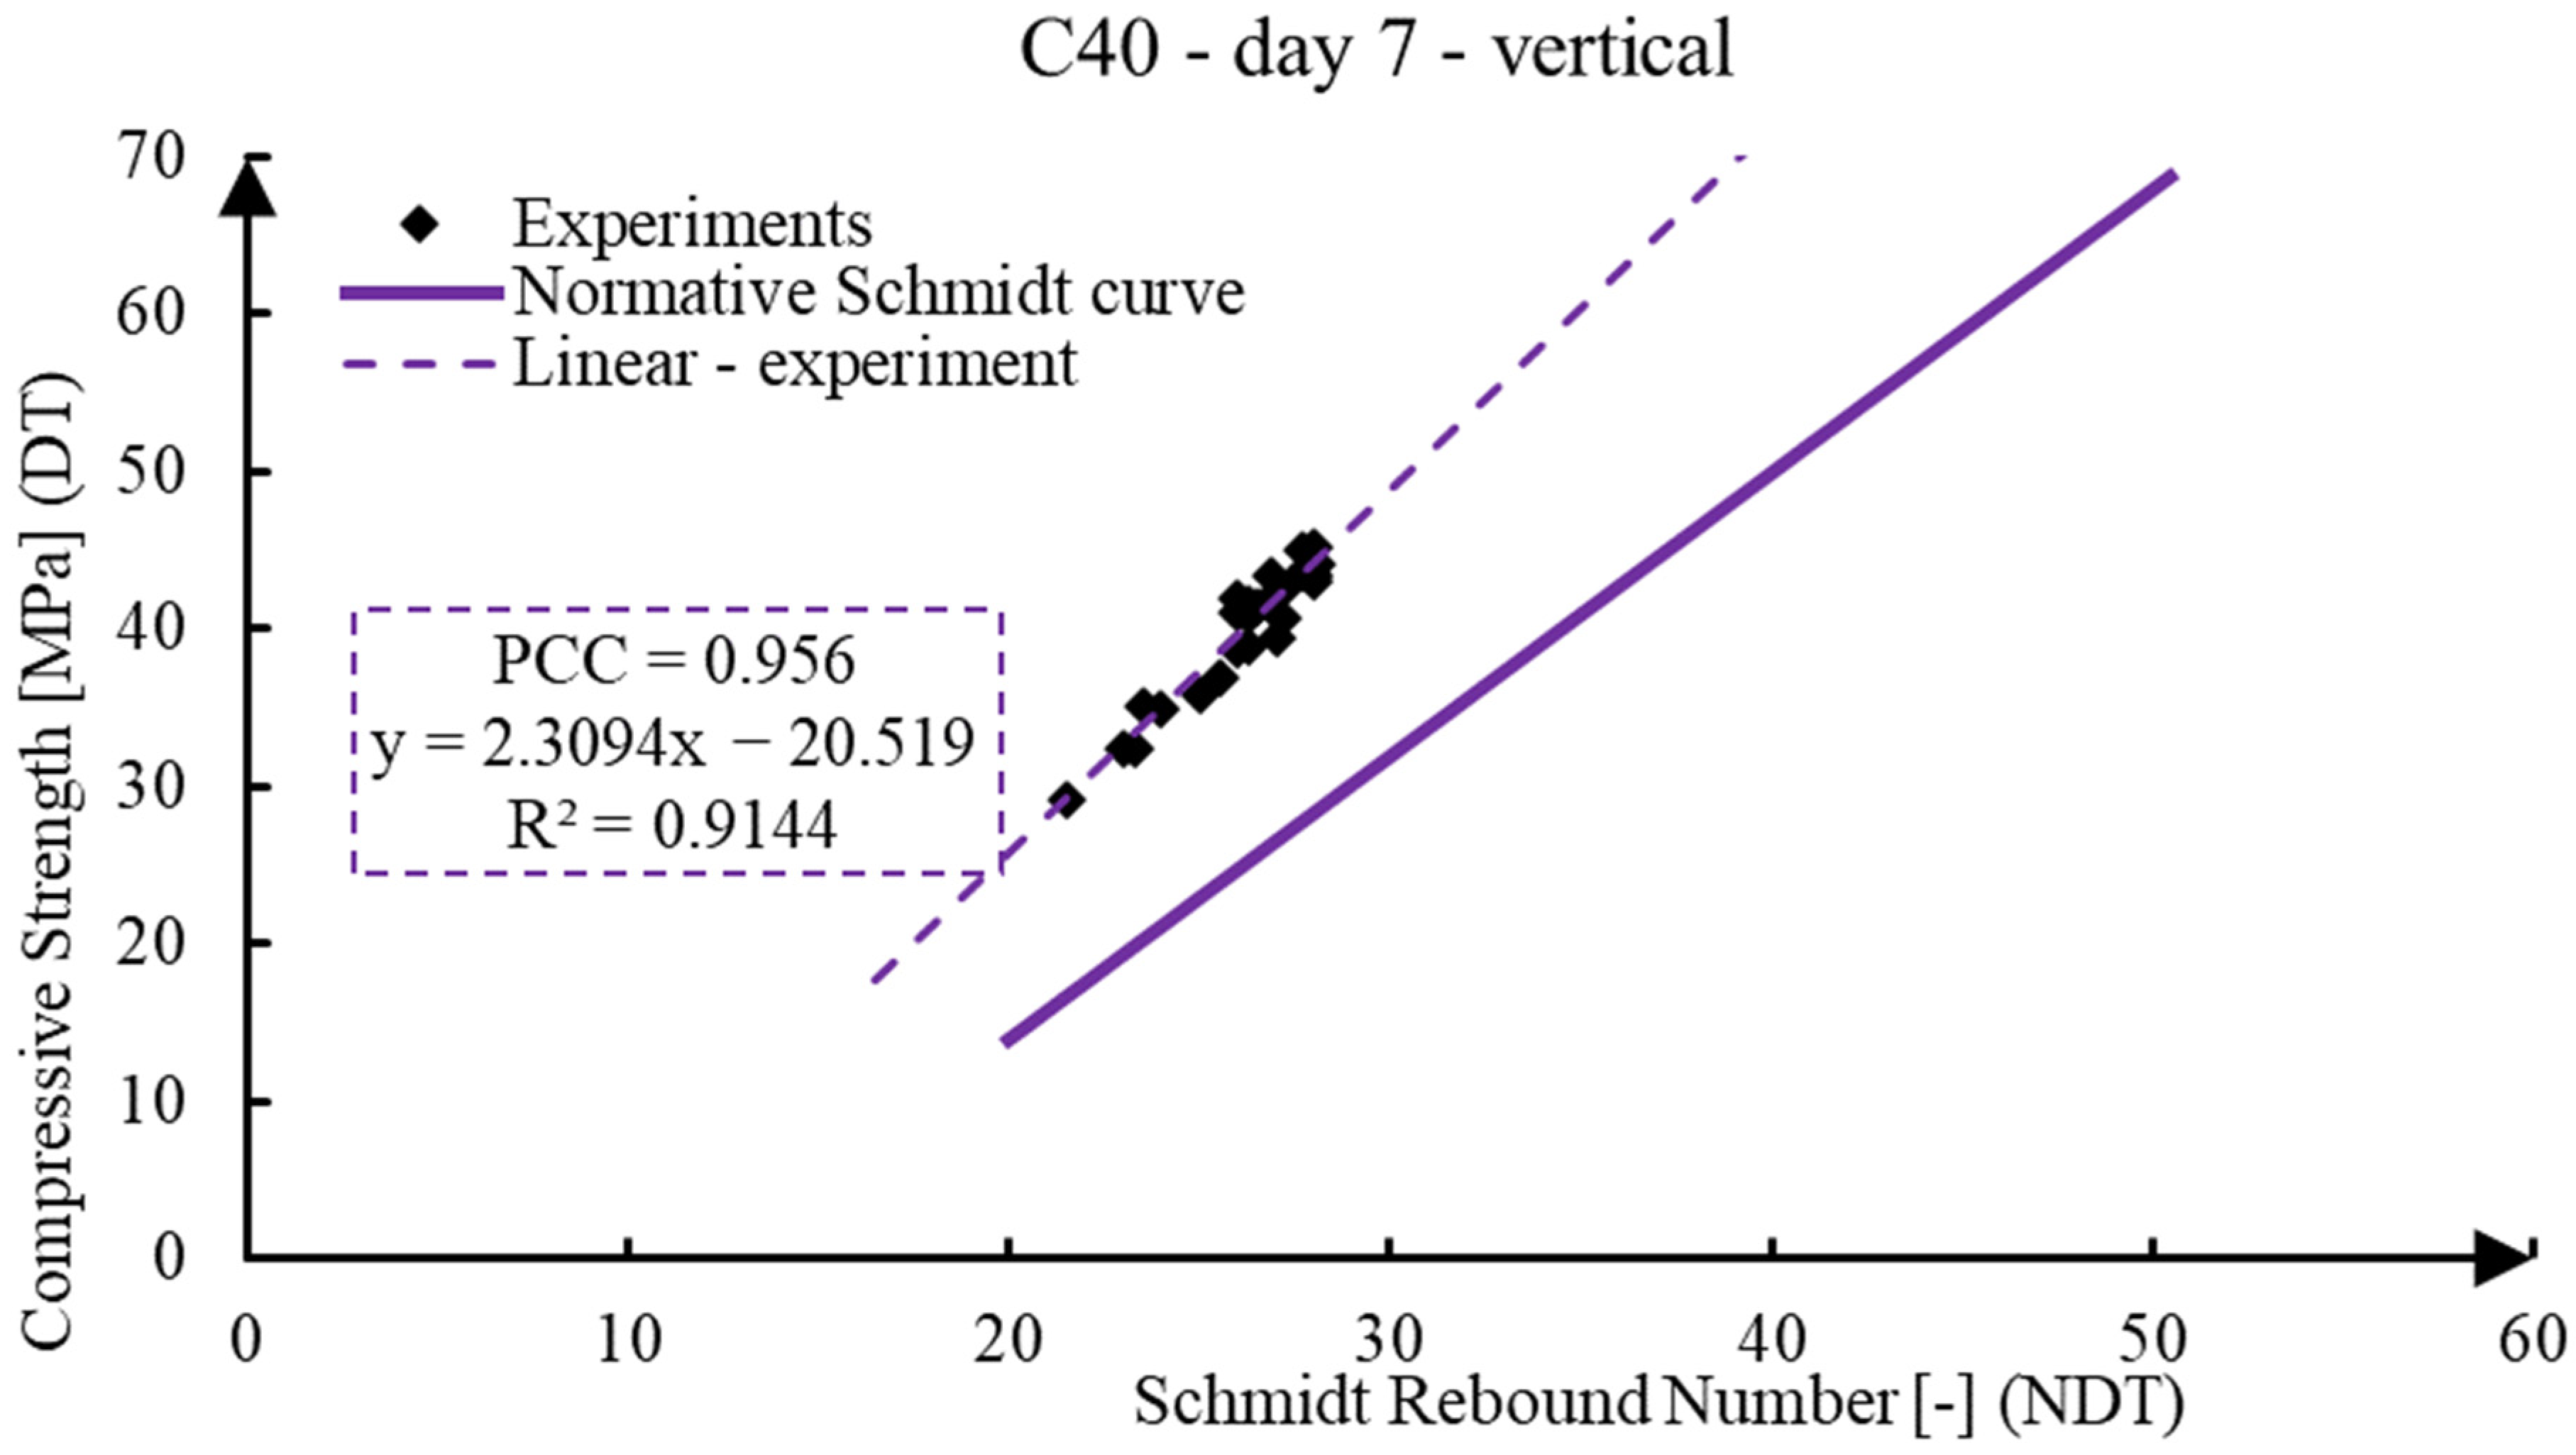
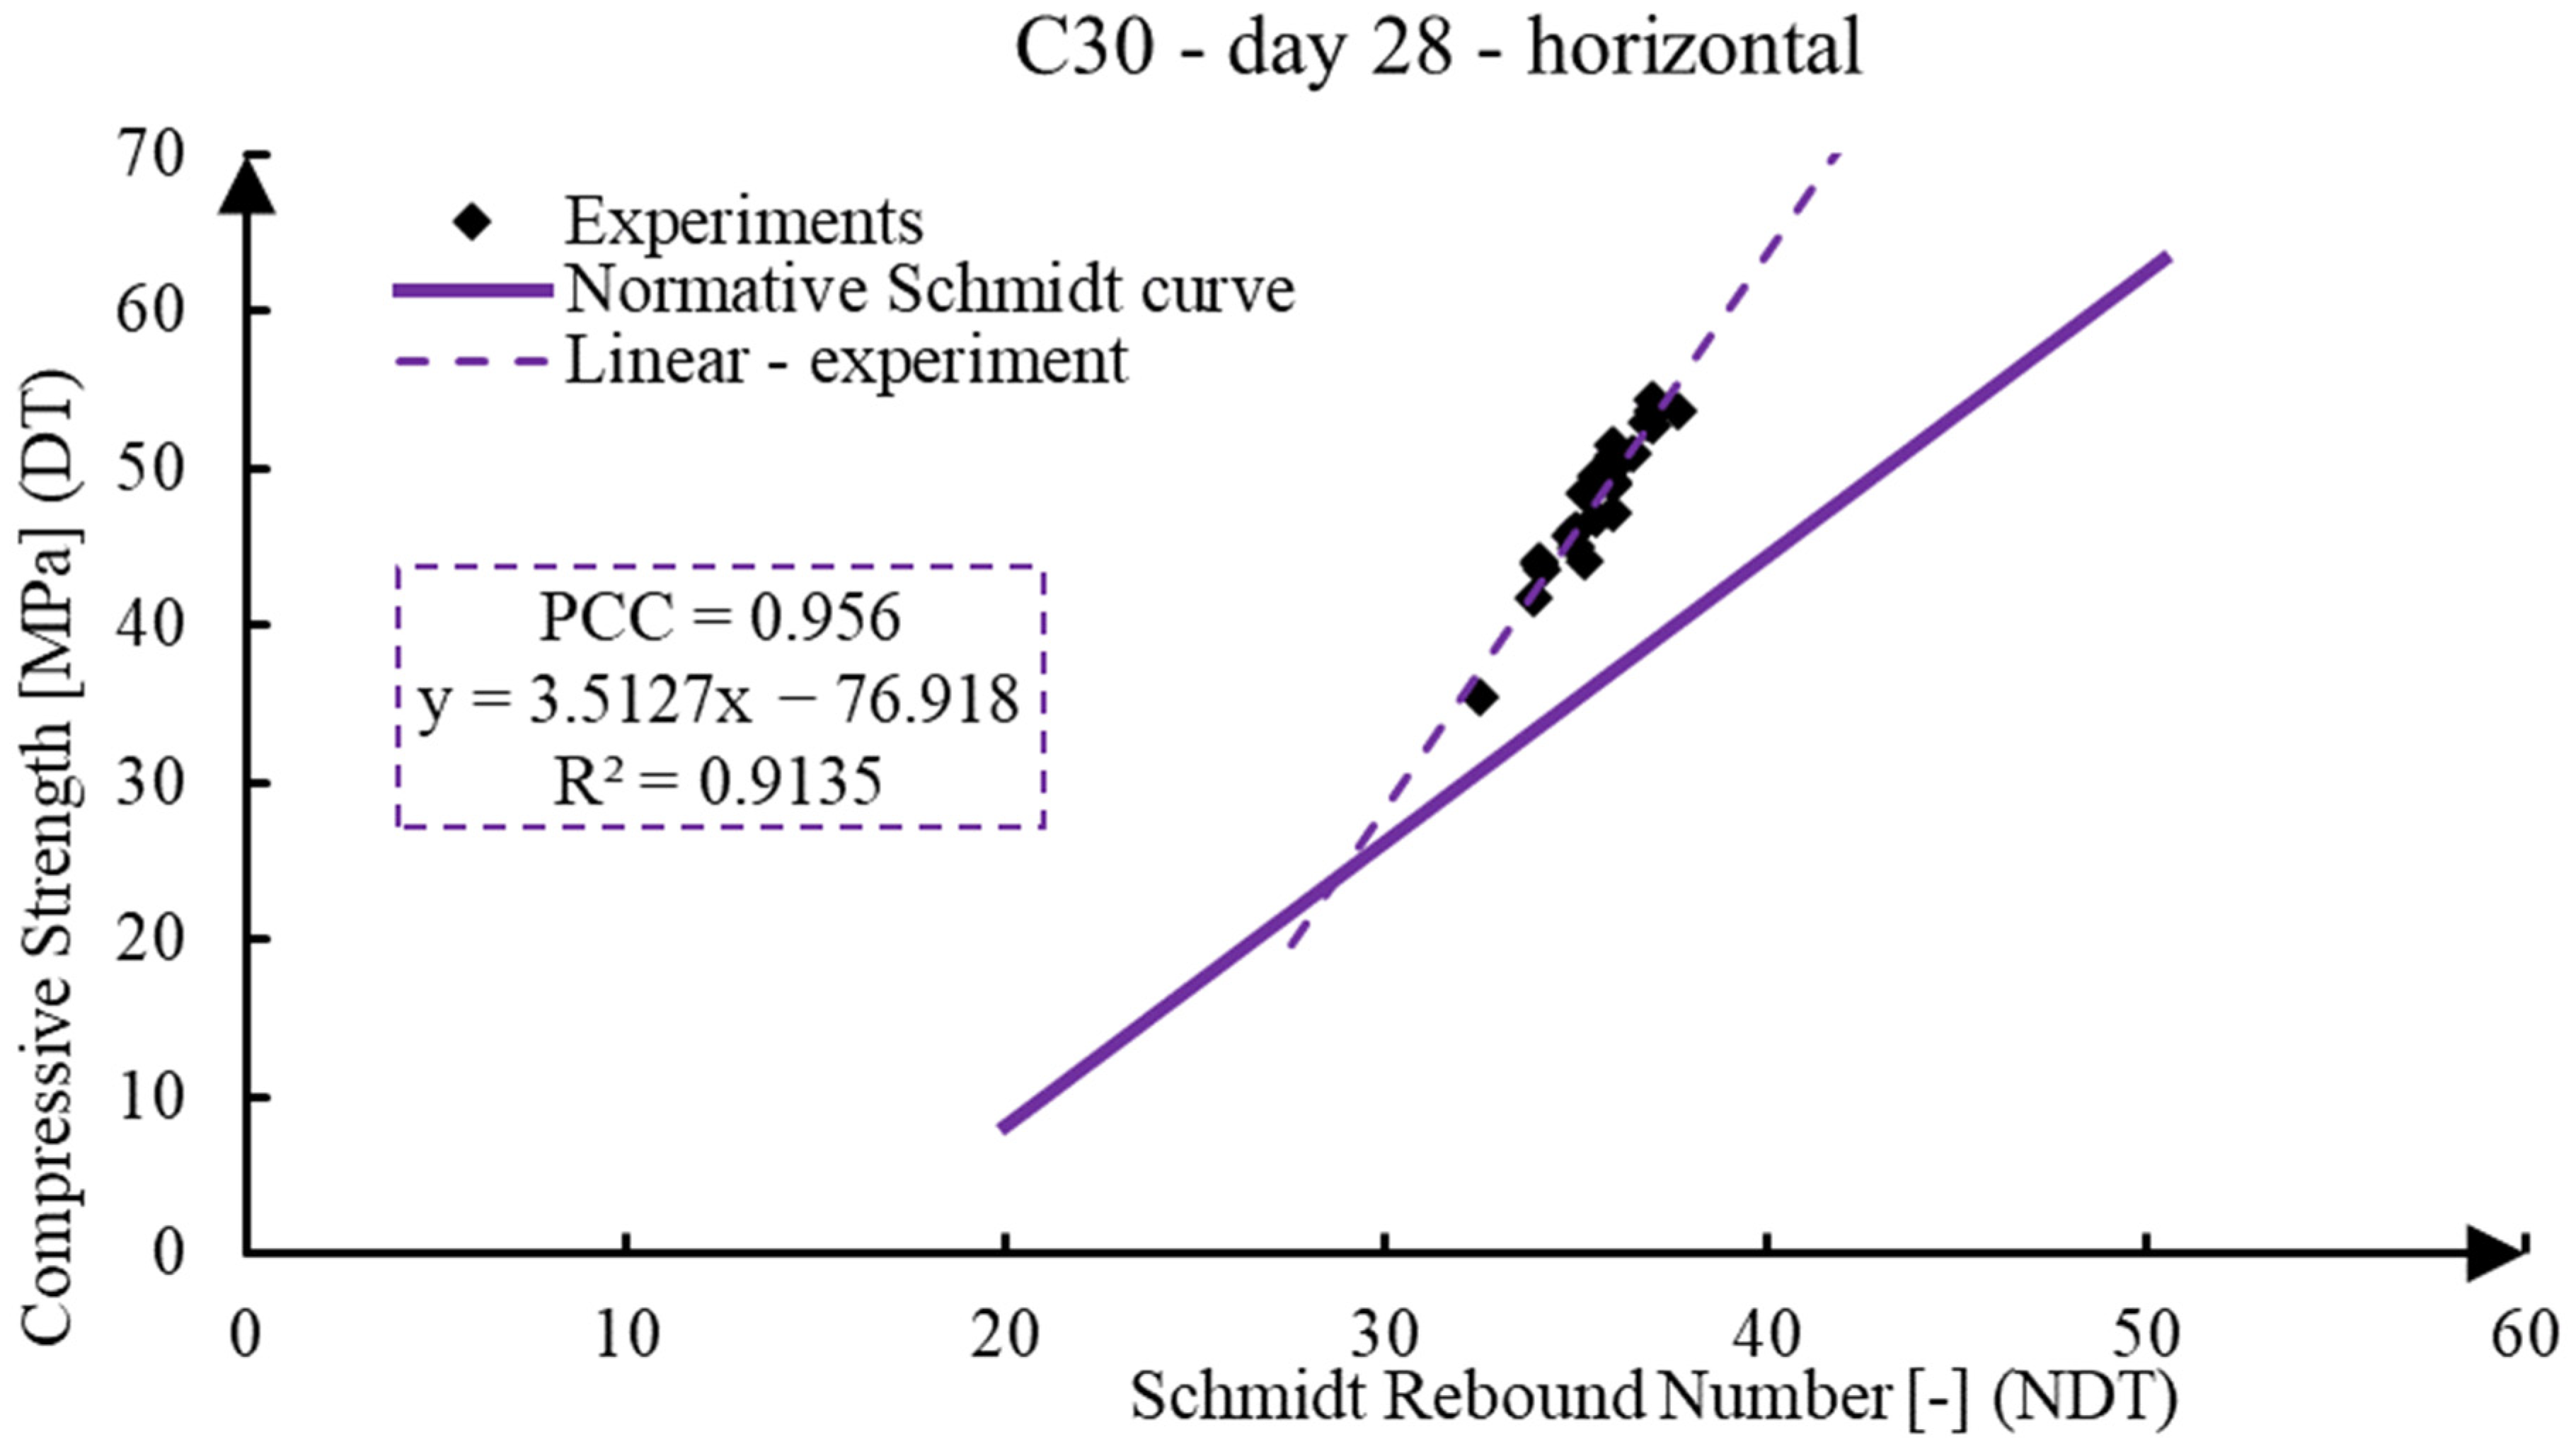
| Age | Class | Type of Schmidt Test | PCC | Linear Equation | R2 |
|---|---|---|---|---|---|
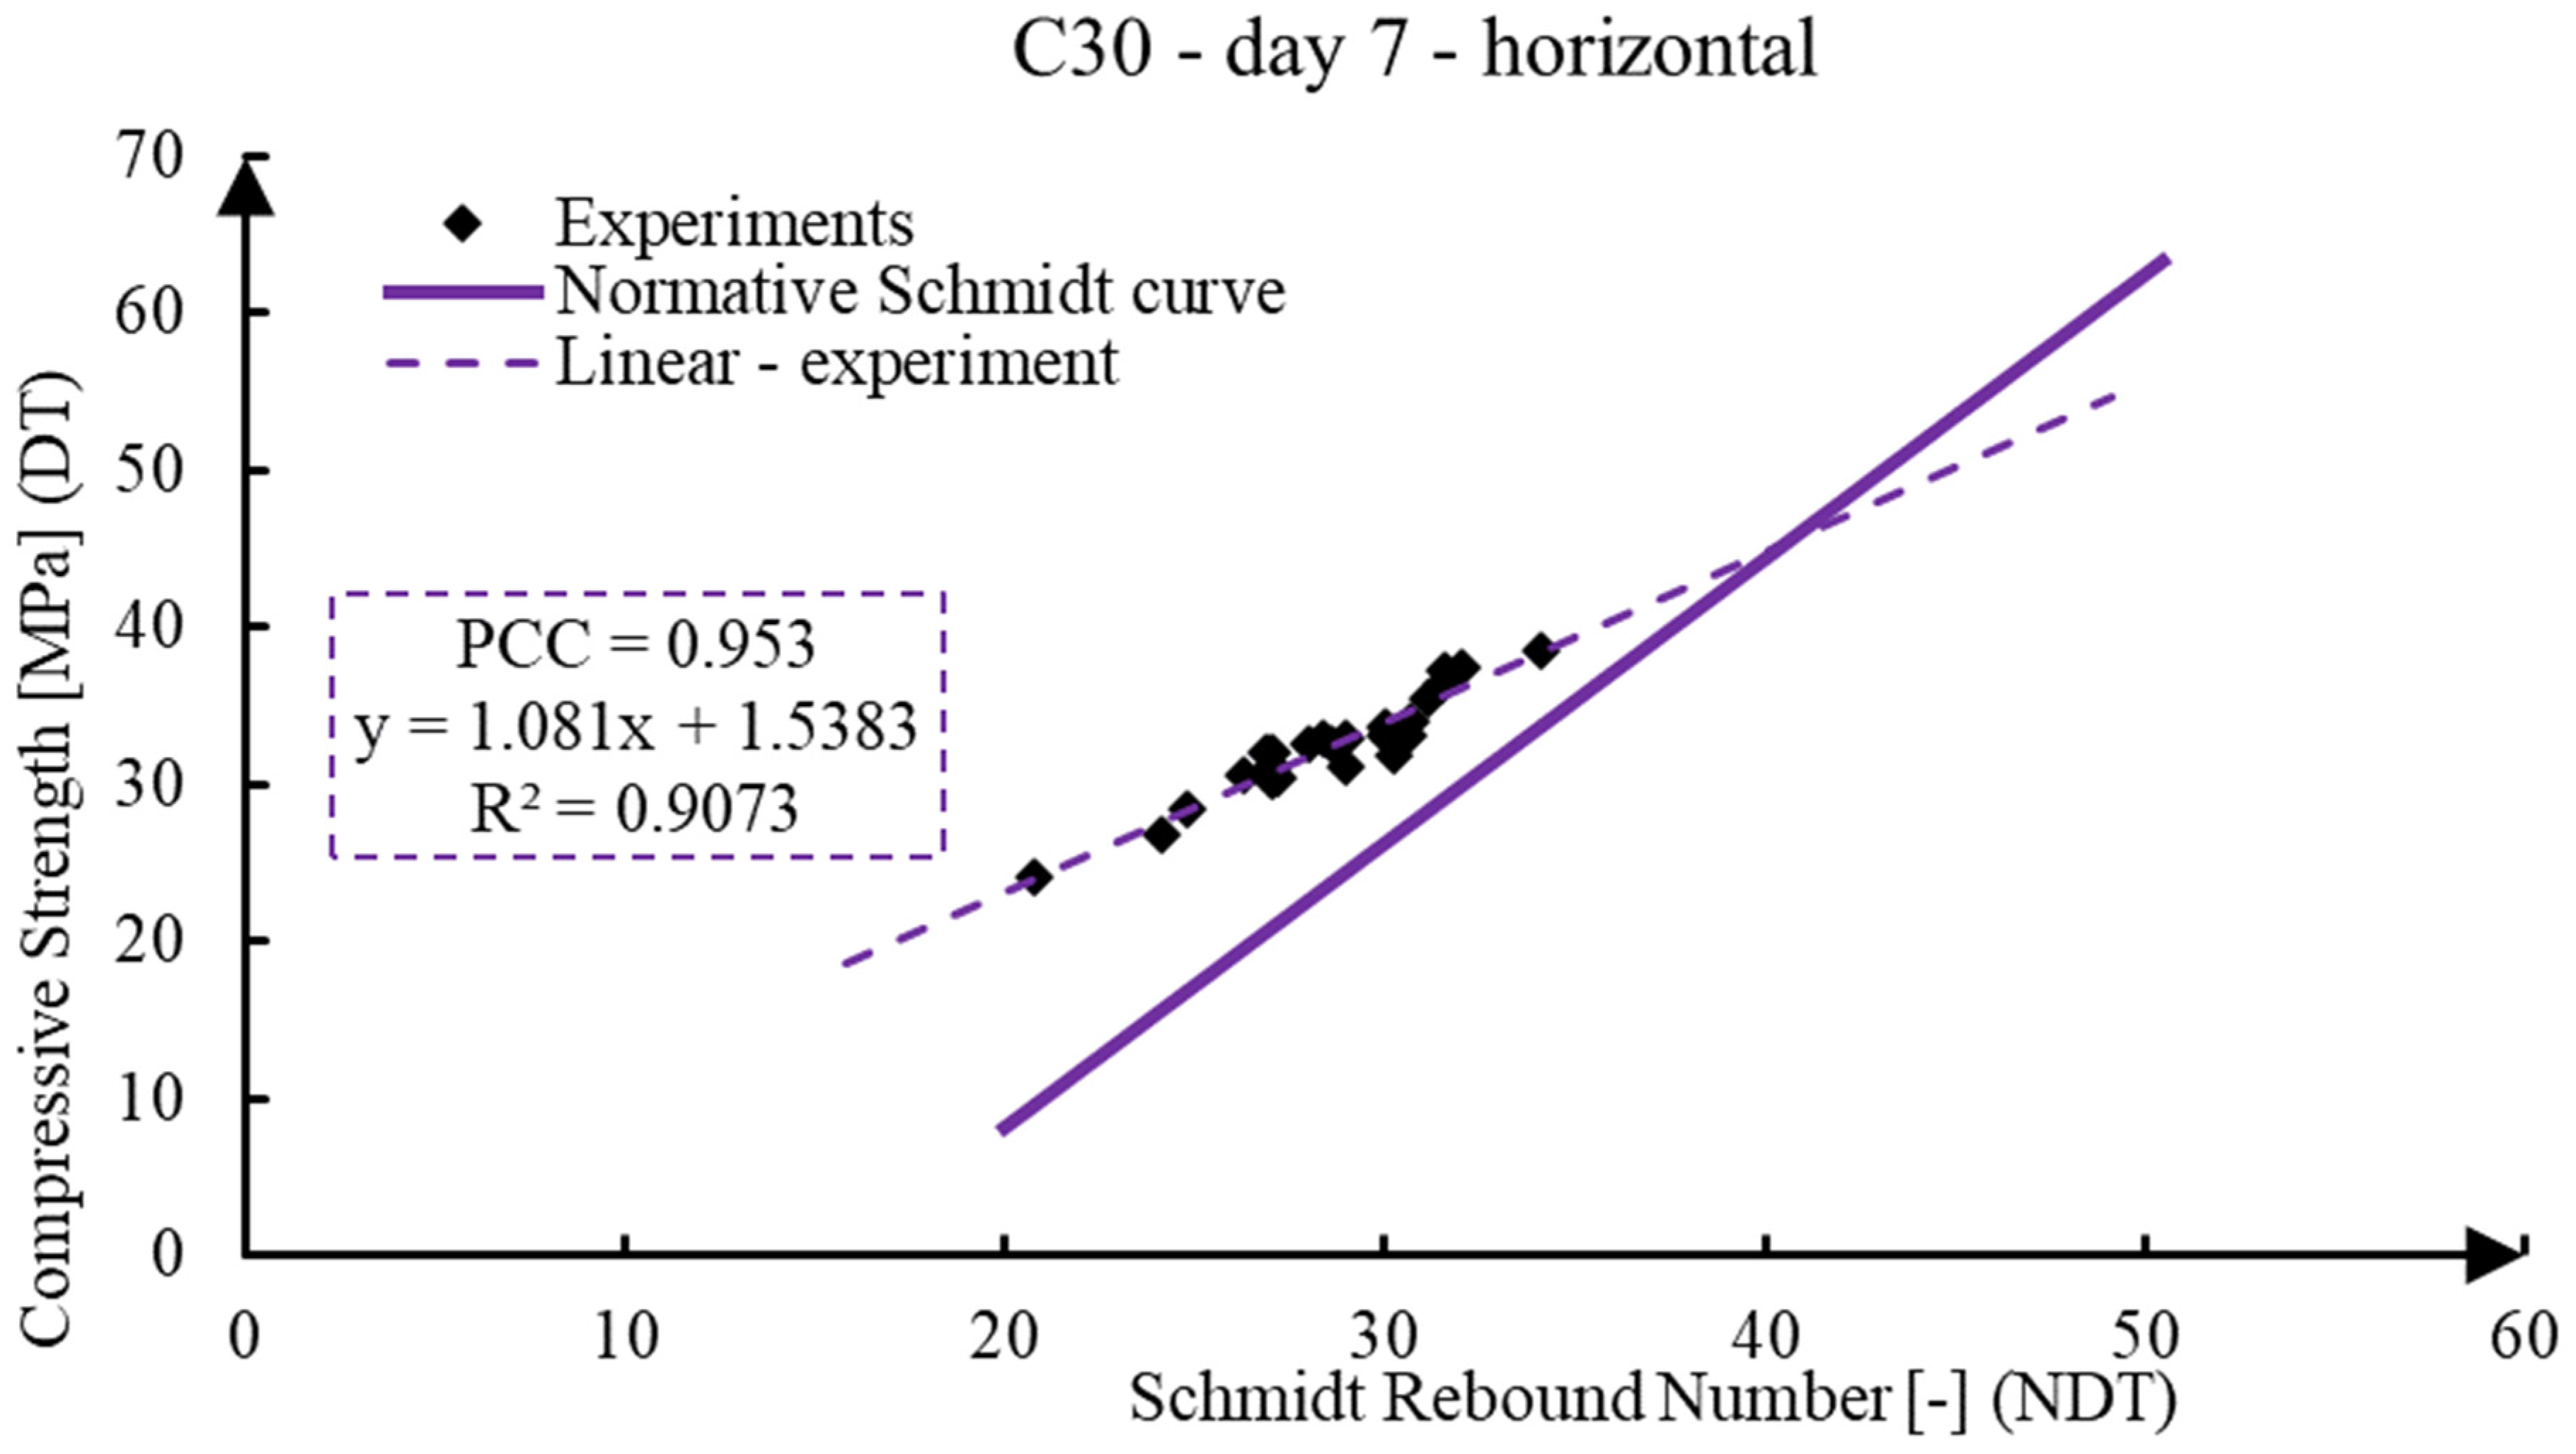
| 7 days | C30 | horizontal | 0.953 | y = 1.081x + 1.5383 | 0.9073 |
| vertical | 0.982 | y = 1.1966x + 9.1457 | 0.9645 | ||
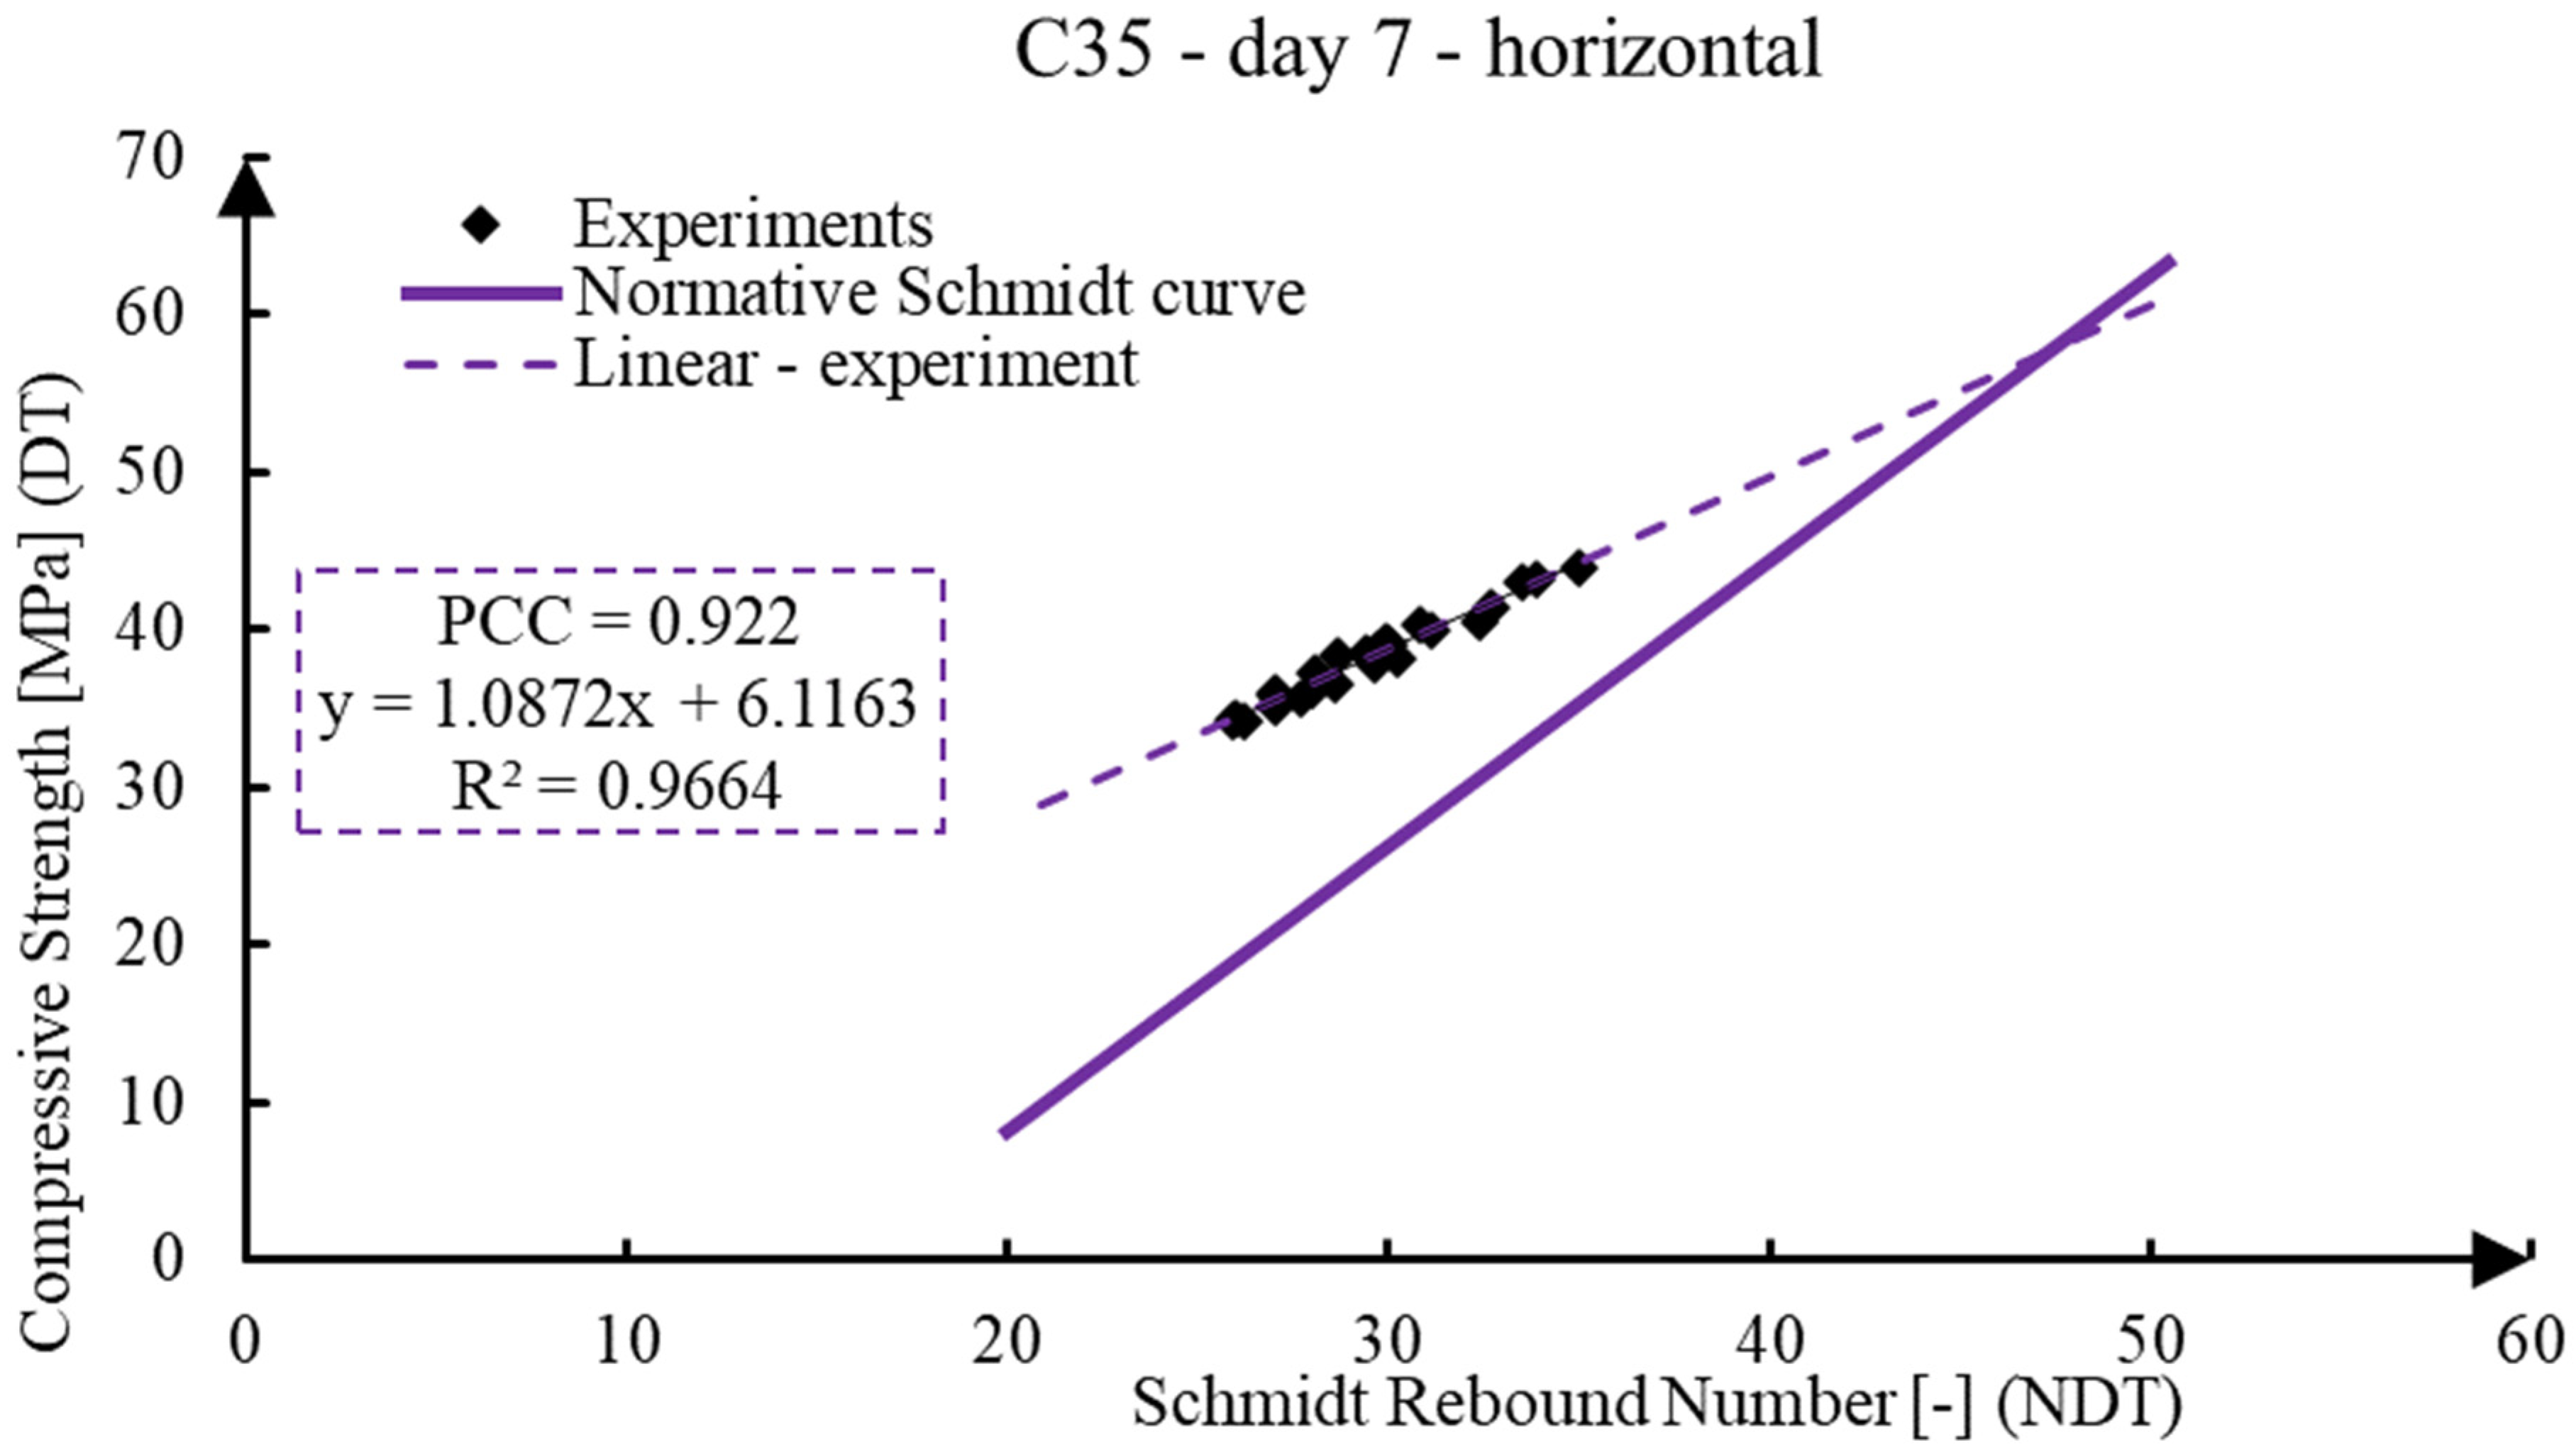
| C35 | horizontal | 0.922 | y = 1.0872x + 6.1163 | 0.9664 | |
| vertical | 0.958 | y = 2.4942x − 25.191 | 0.918 | ||
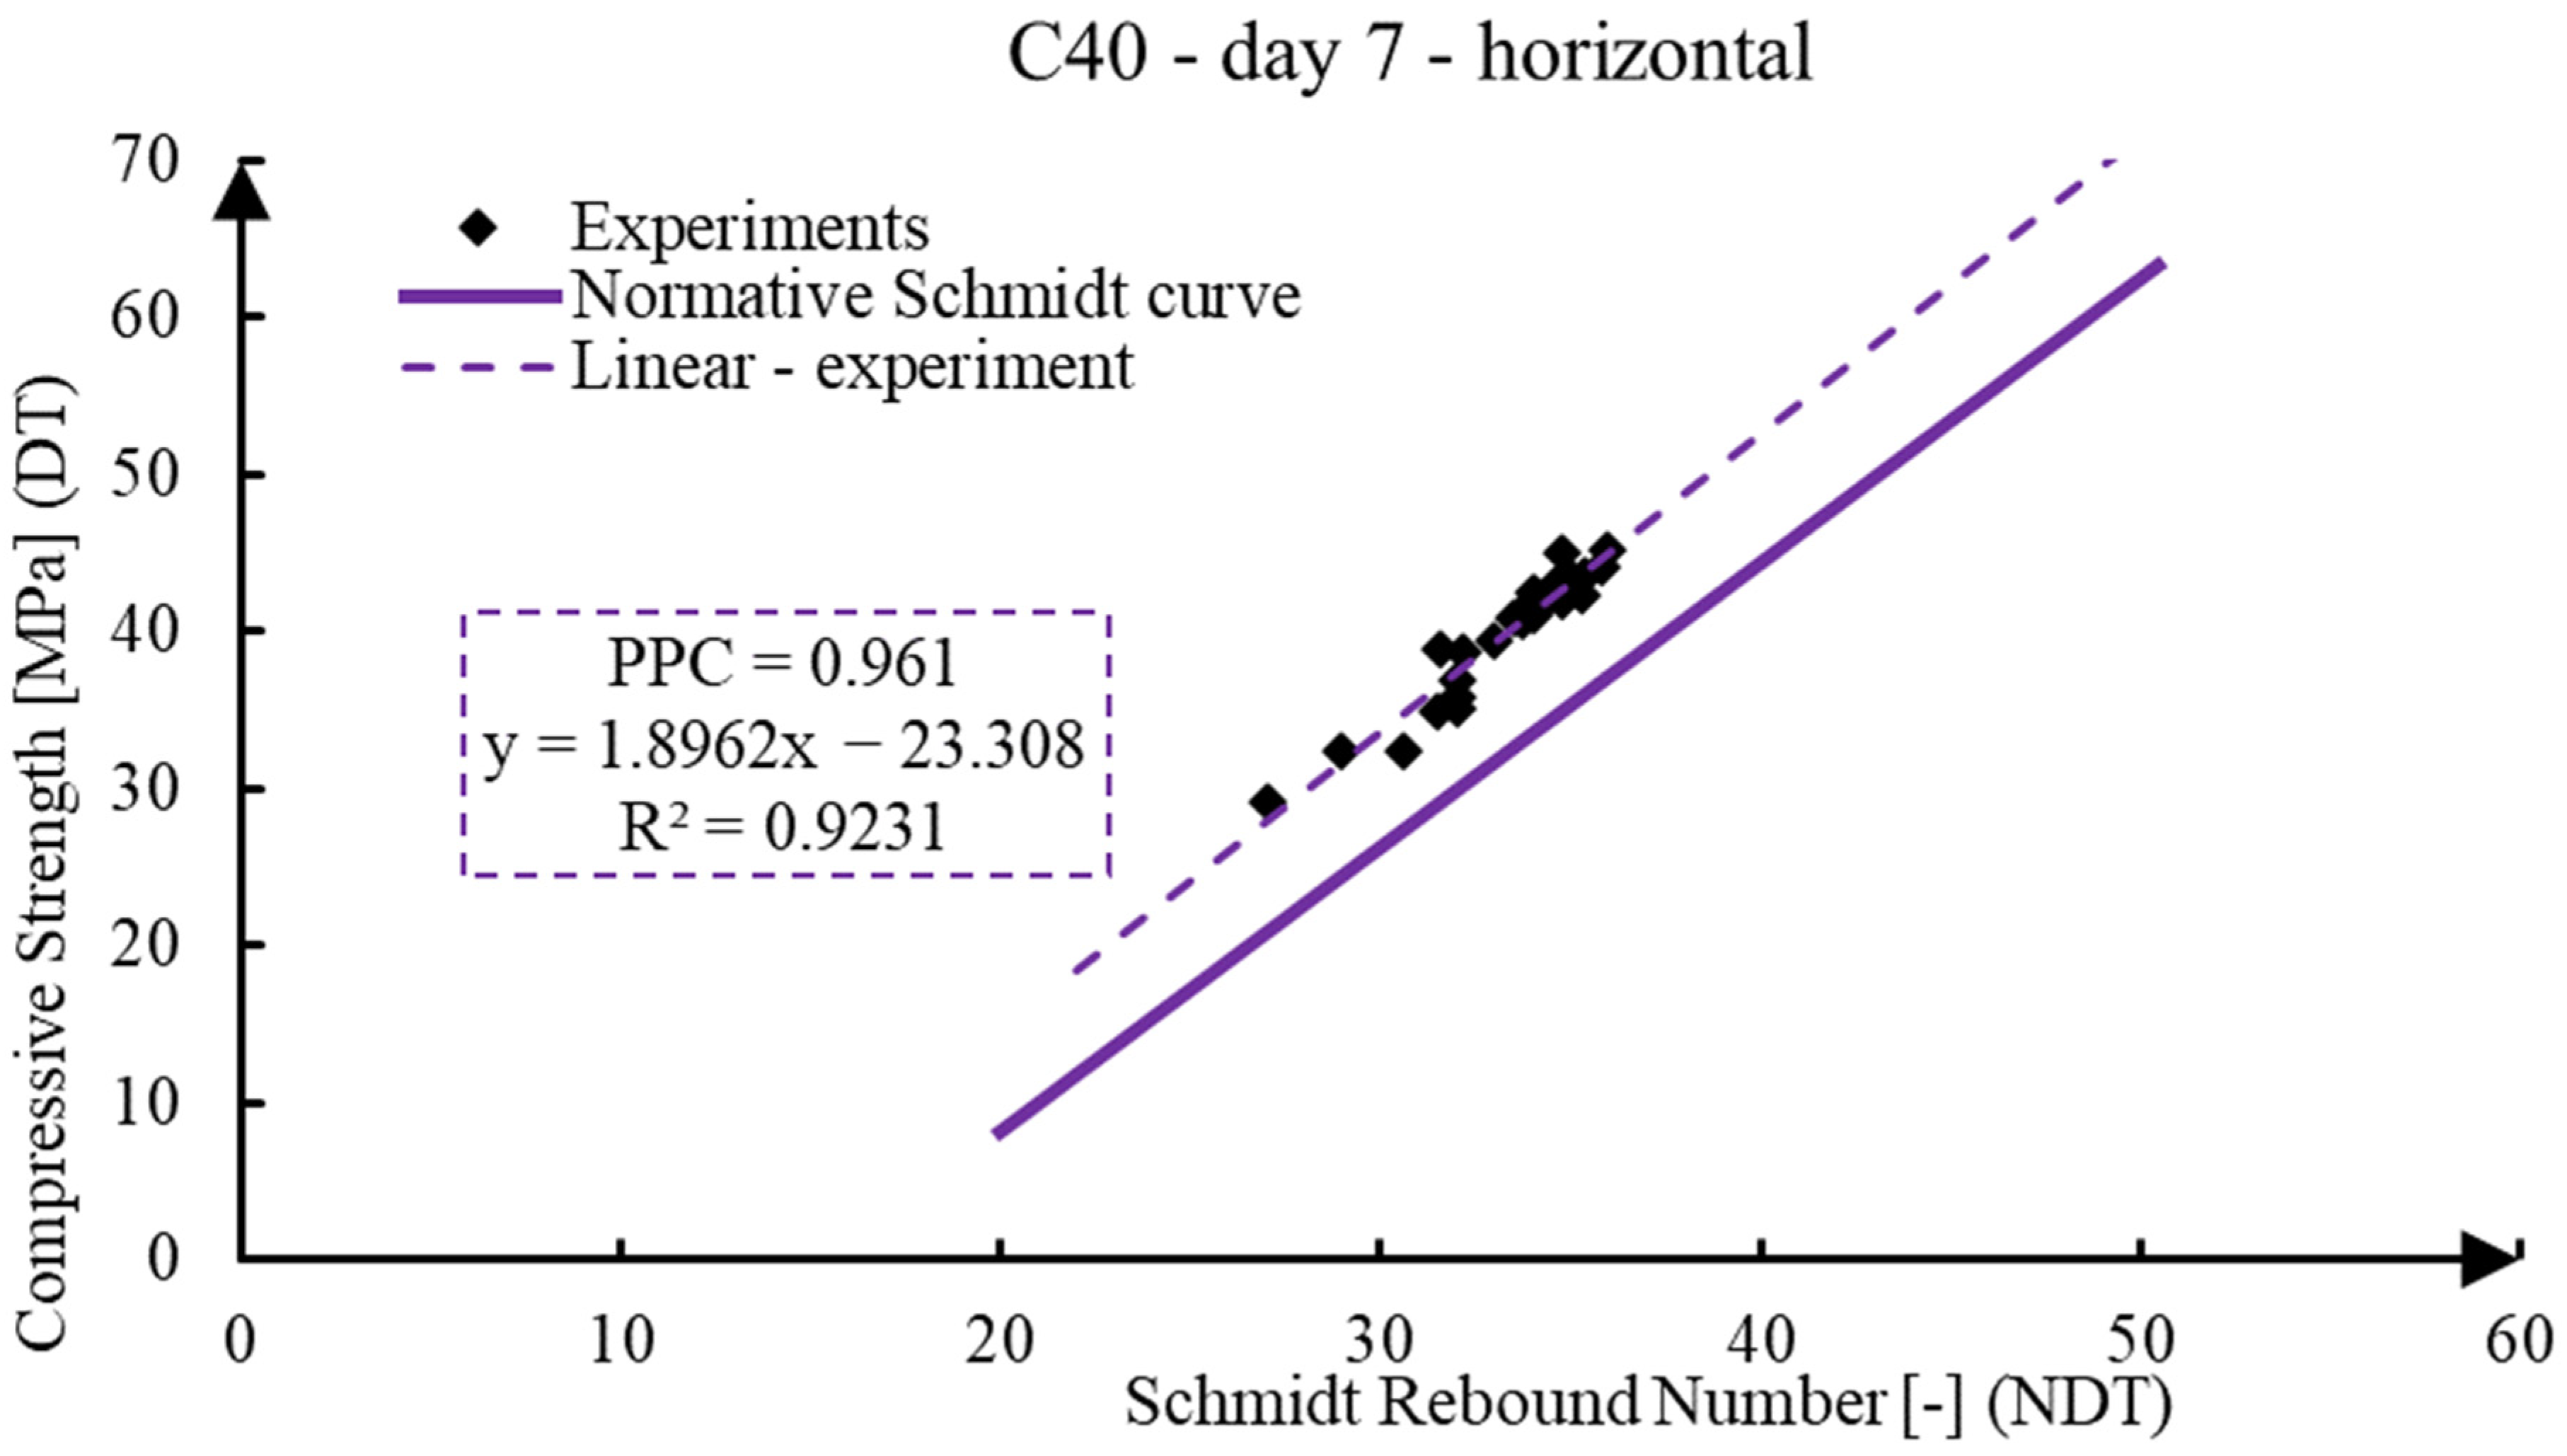
| C40 | horizontal | 0.961 | y = 1.8962x − 23.308 | 0.9231 | |
| vertical | 0.956 | y = 2.3094x − 20.519 | 0.9144 | ||
| 28 days | C30 | horizontal | 0.956 | y = 3.5127x − 76.918 | 0.9135 |
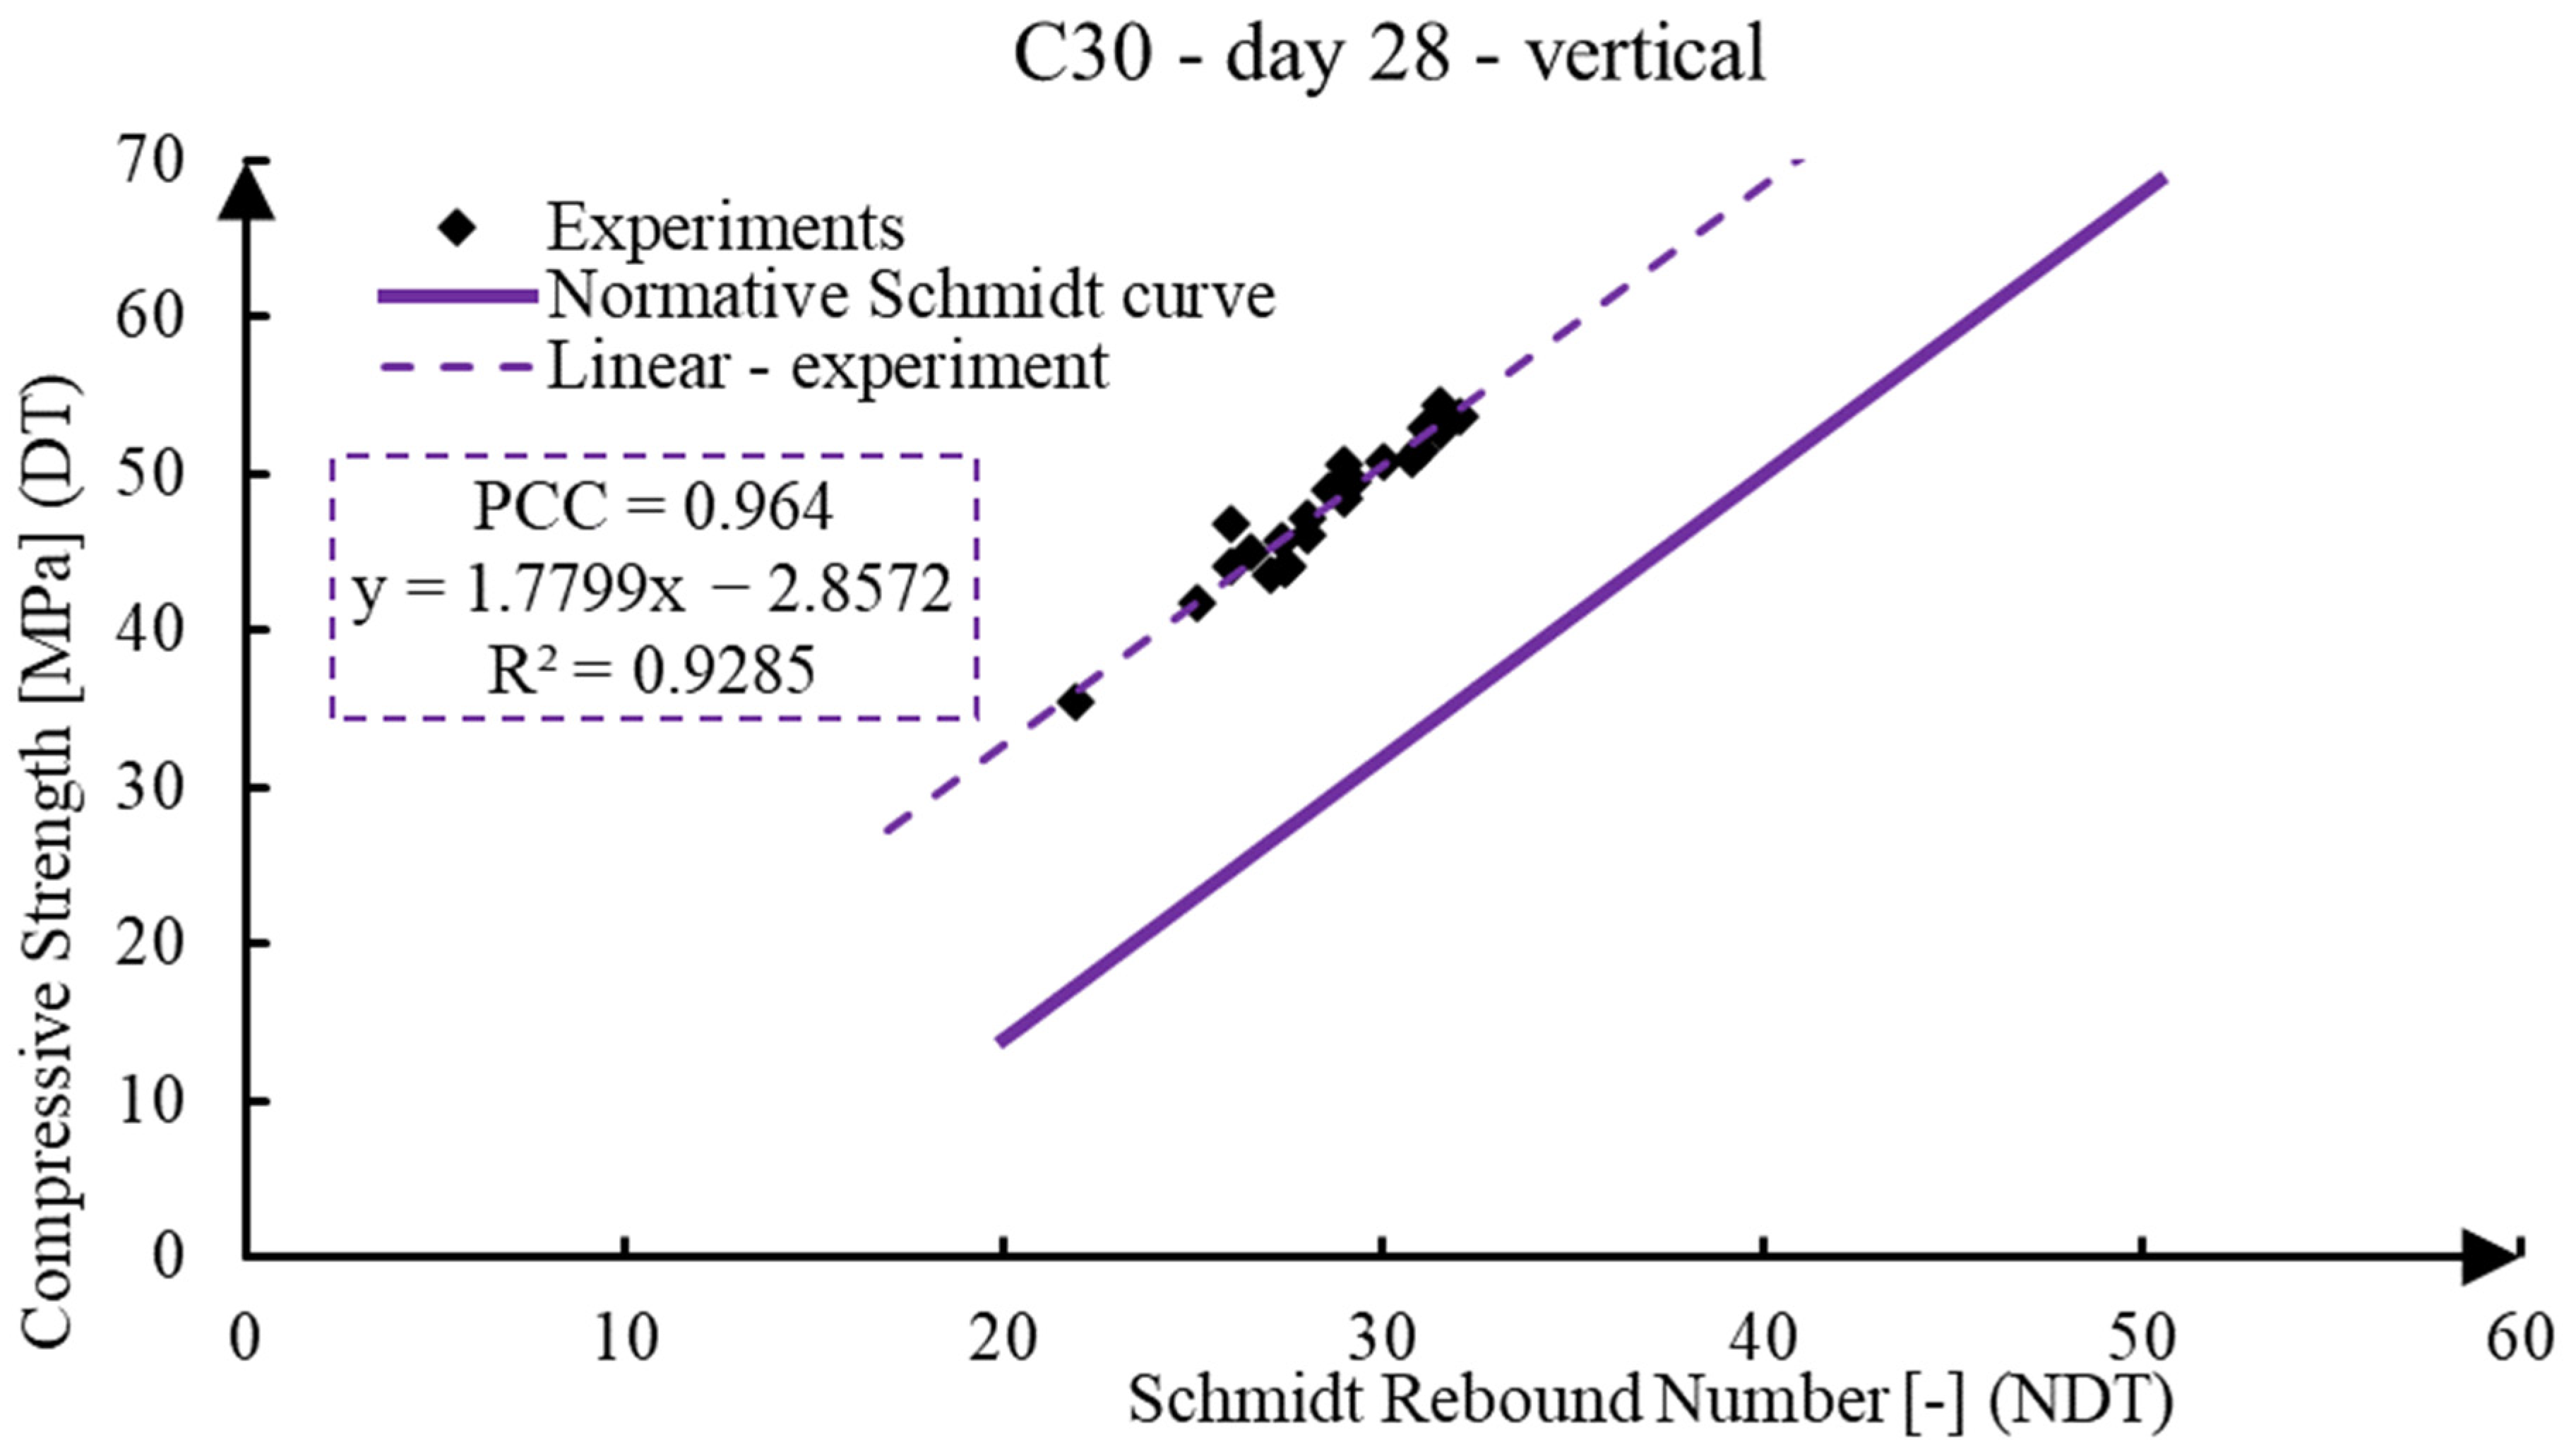
| vertical | 0.964 | y = 1.7799x − 2.8572 | 0.9285 | ||
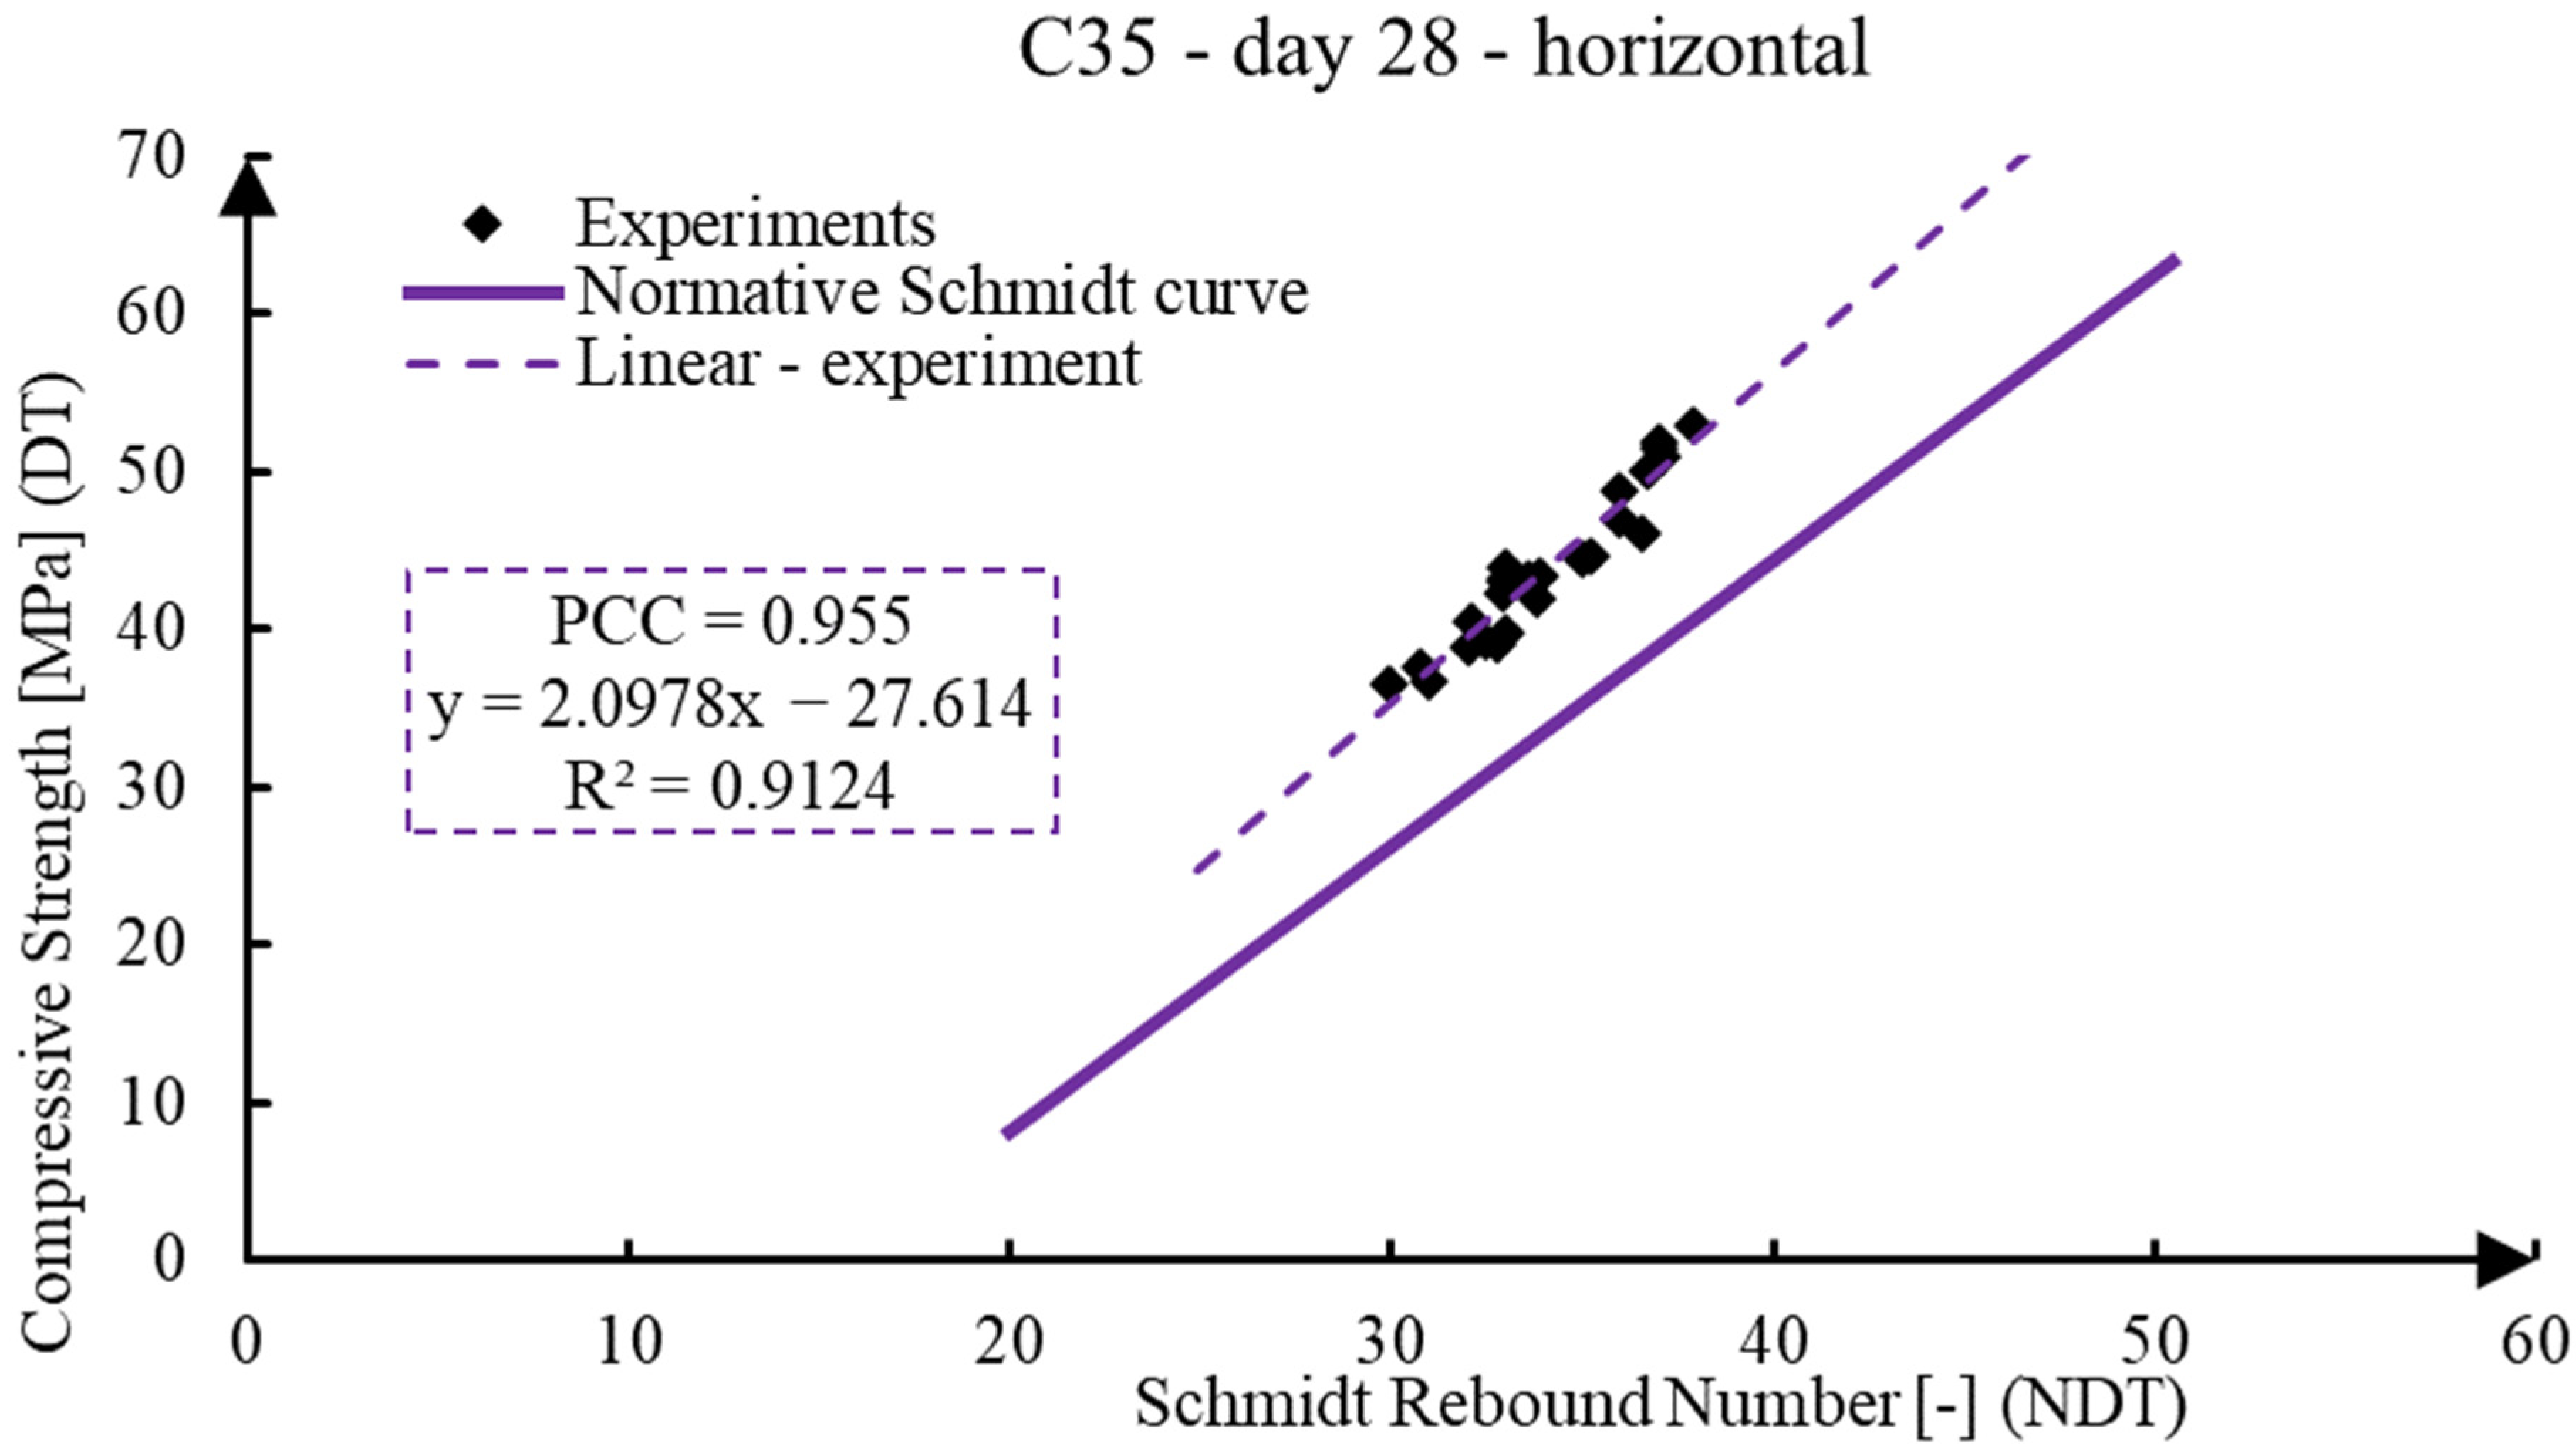
| C35 | horizontal | 0.955 | y = 2.0978x − 27.614 | 0.9124 | |
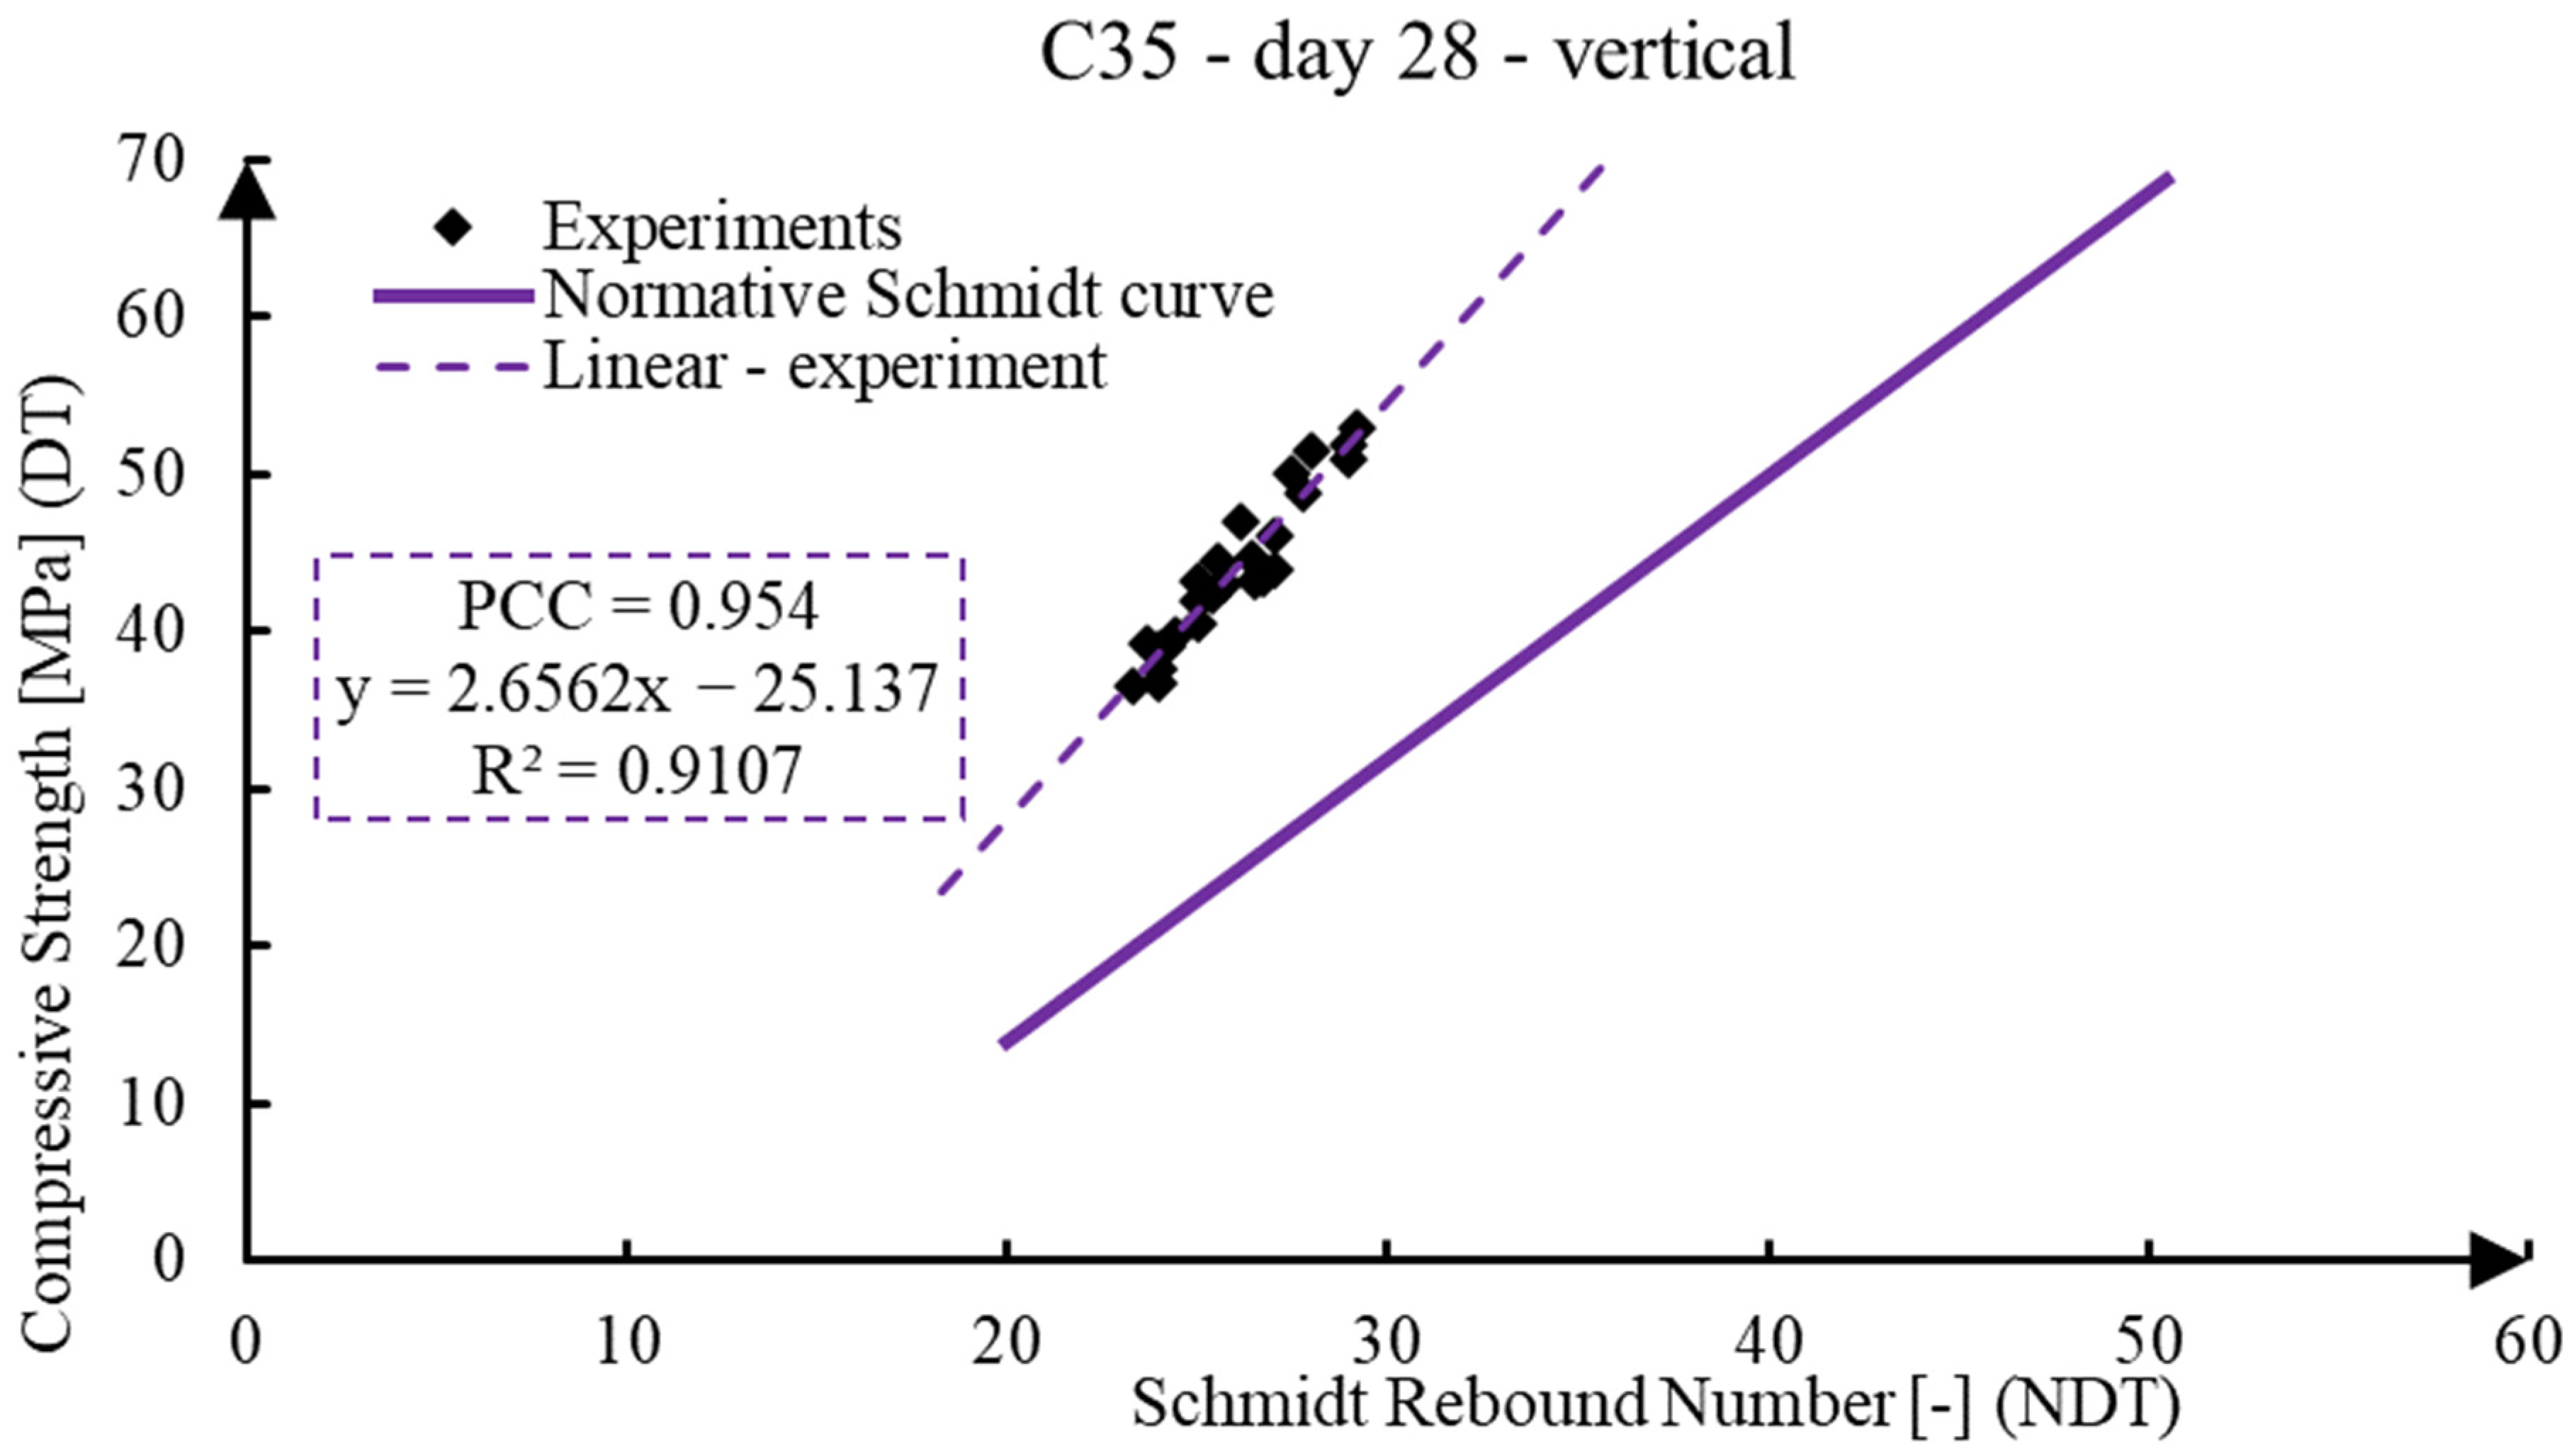
| vertical | 0.954 | y = 2.6562x − 25.137 | 0.9107 | ||
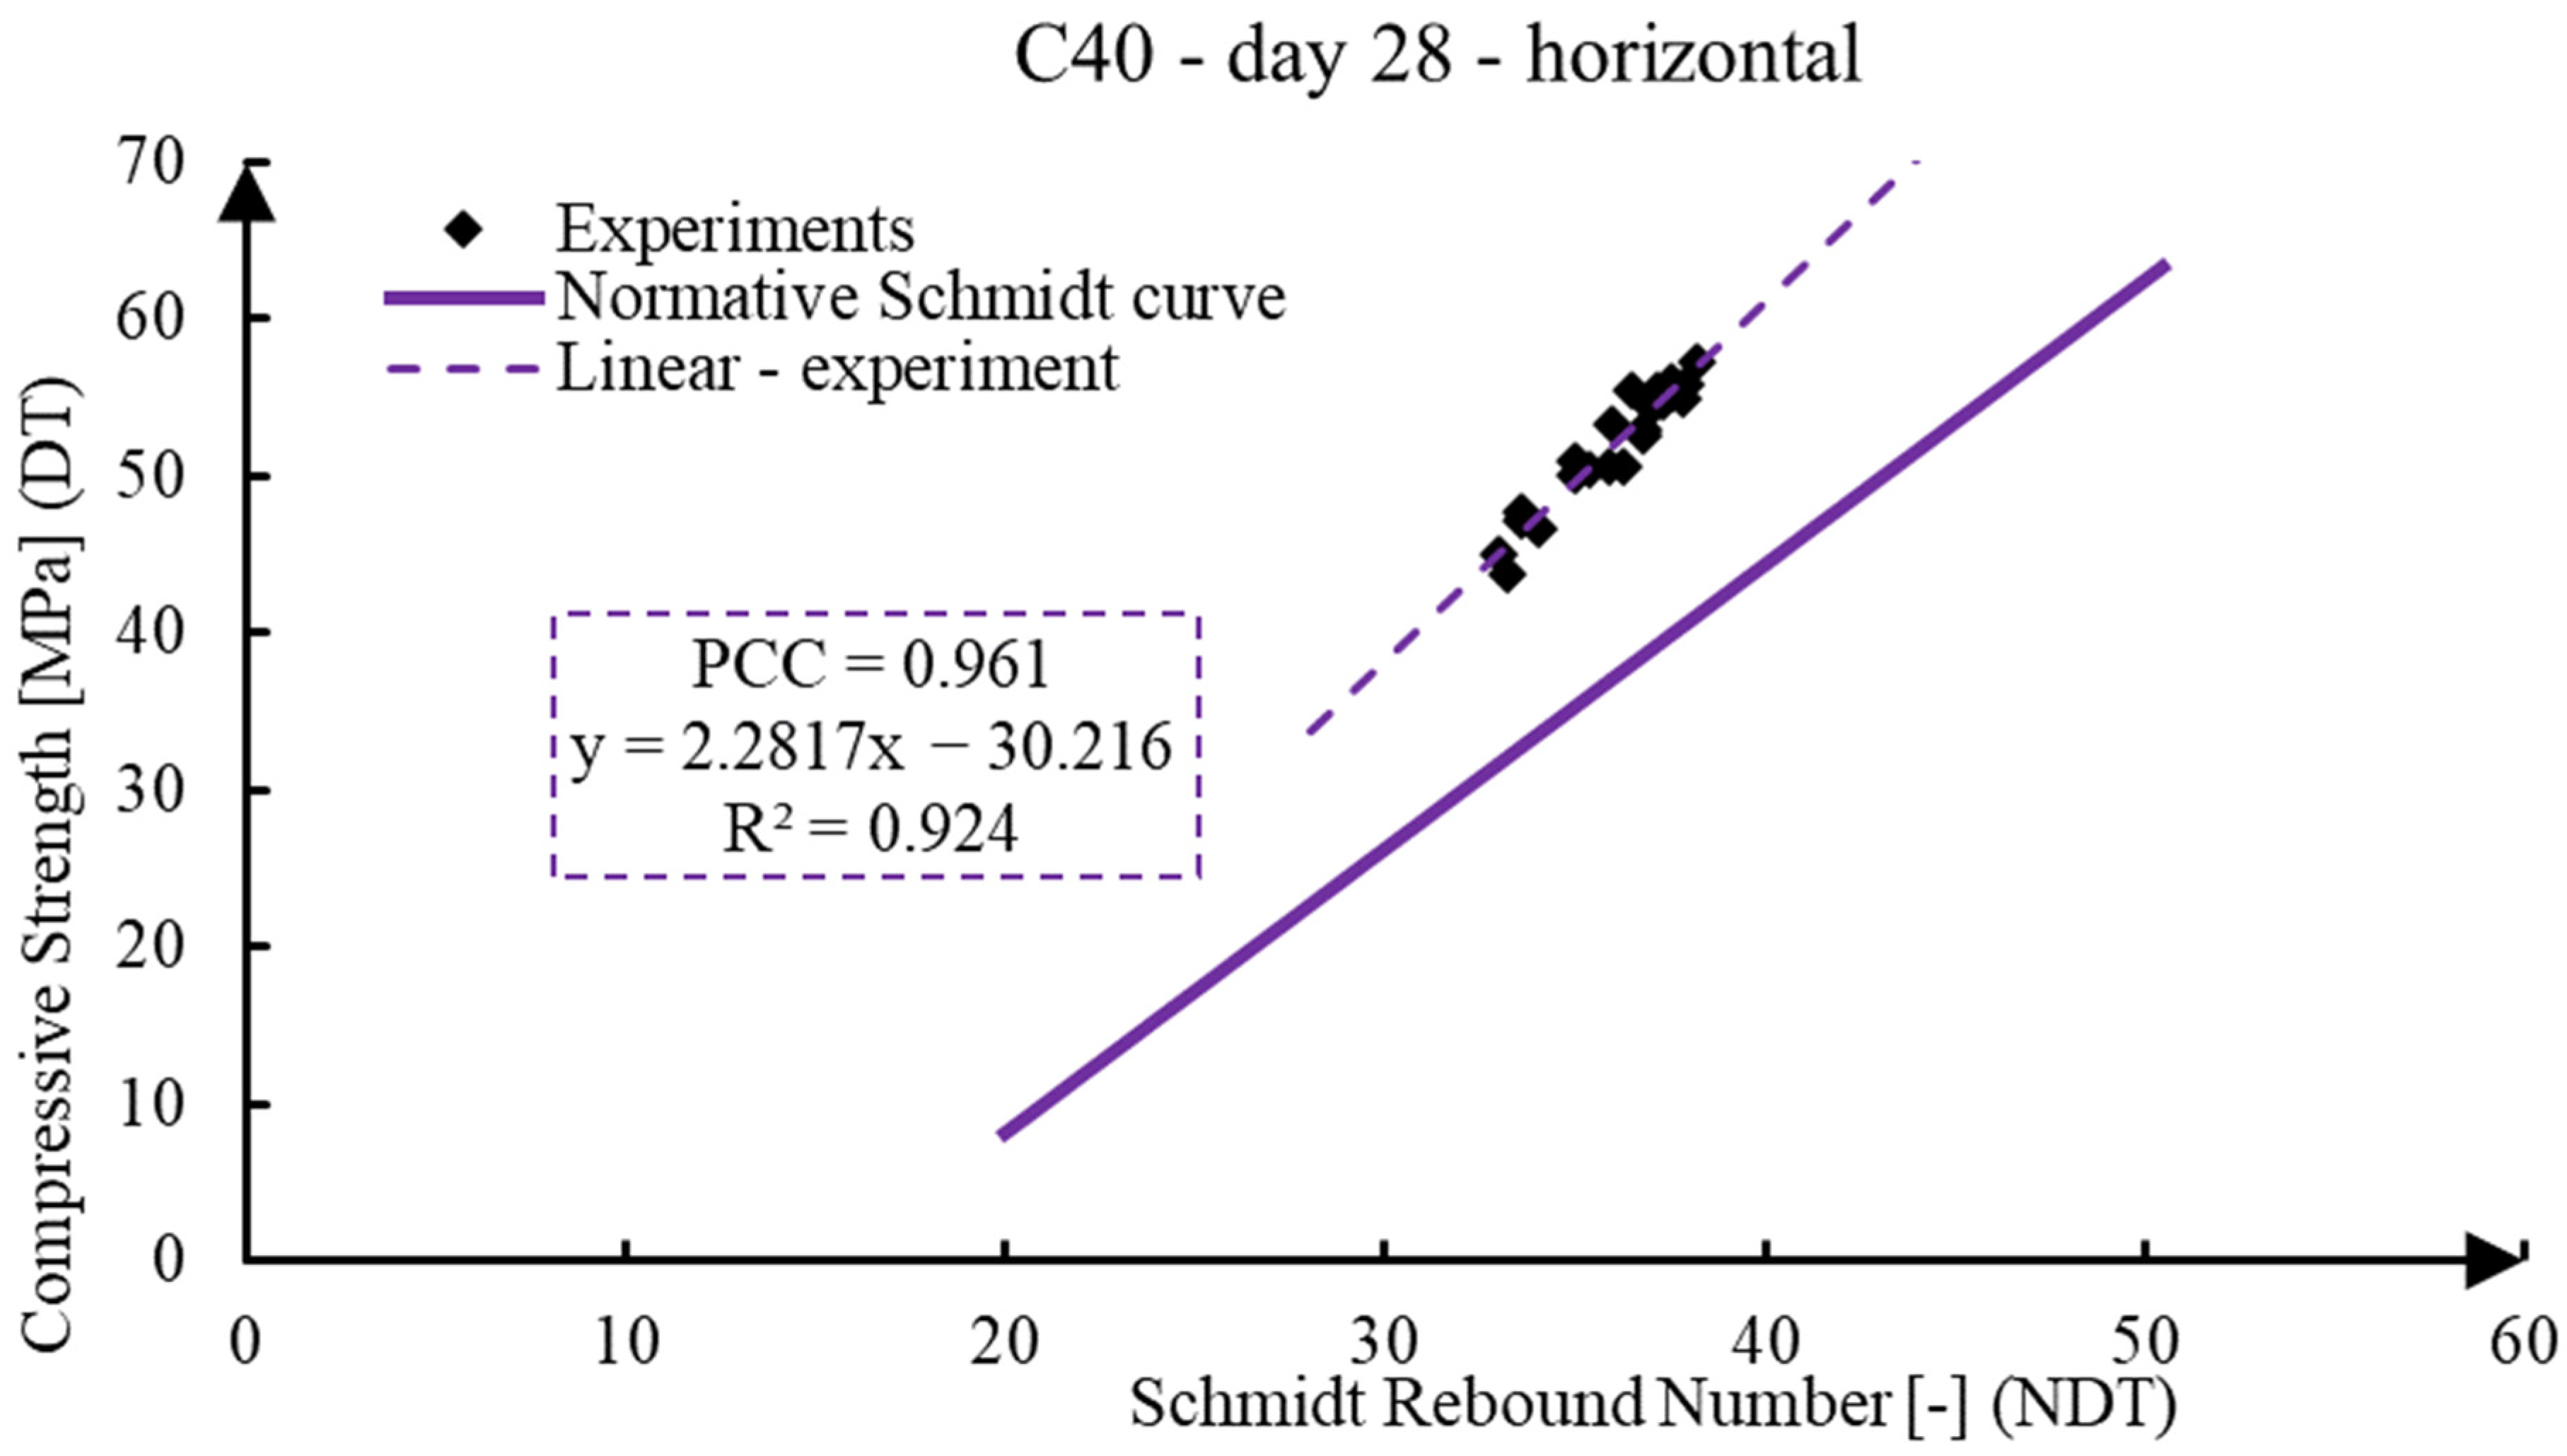
| C40 | horizontal | 0.961 | y = 2.2817x − 30.216 | 0.924 | |
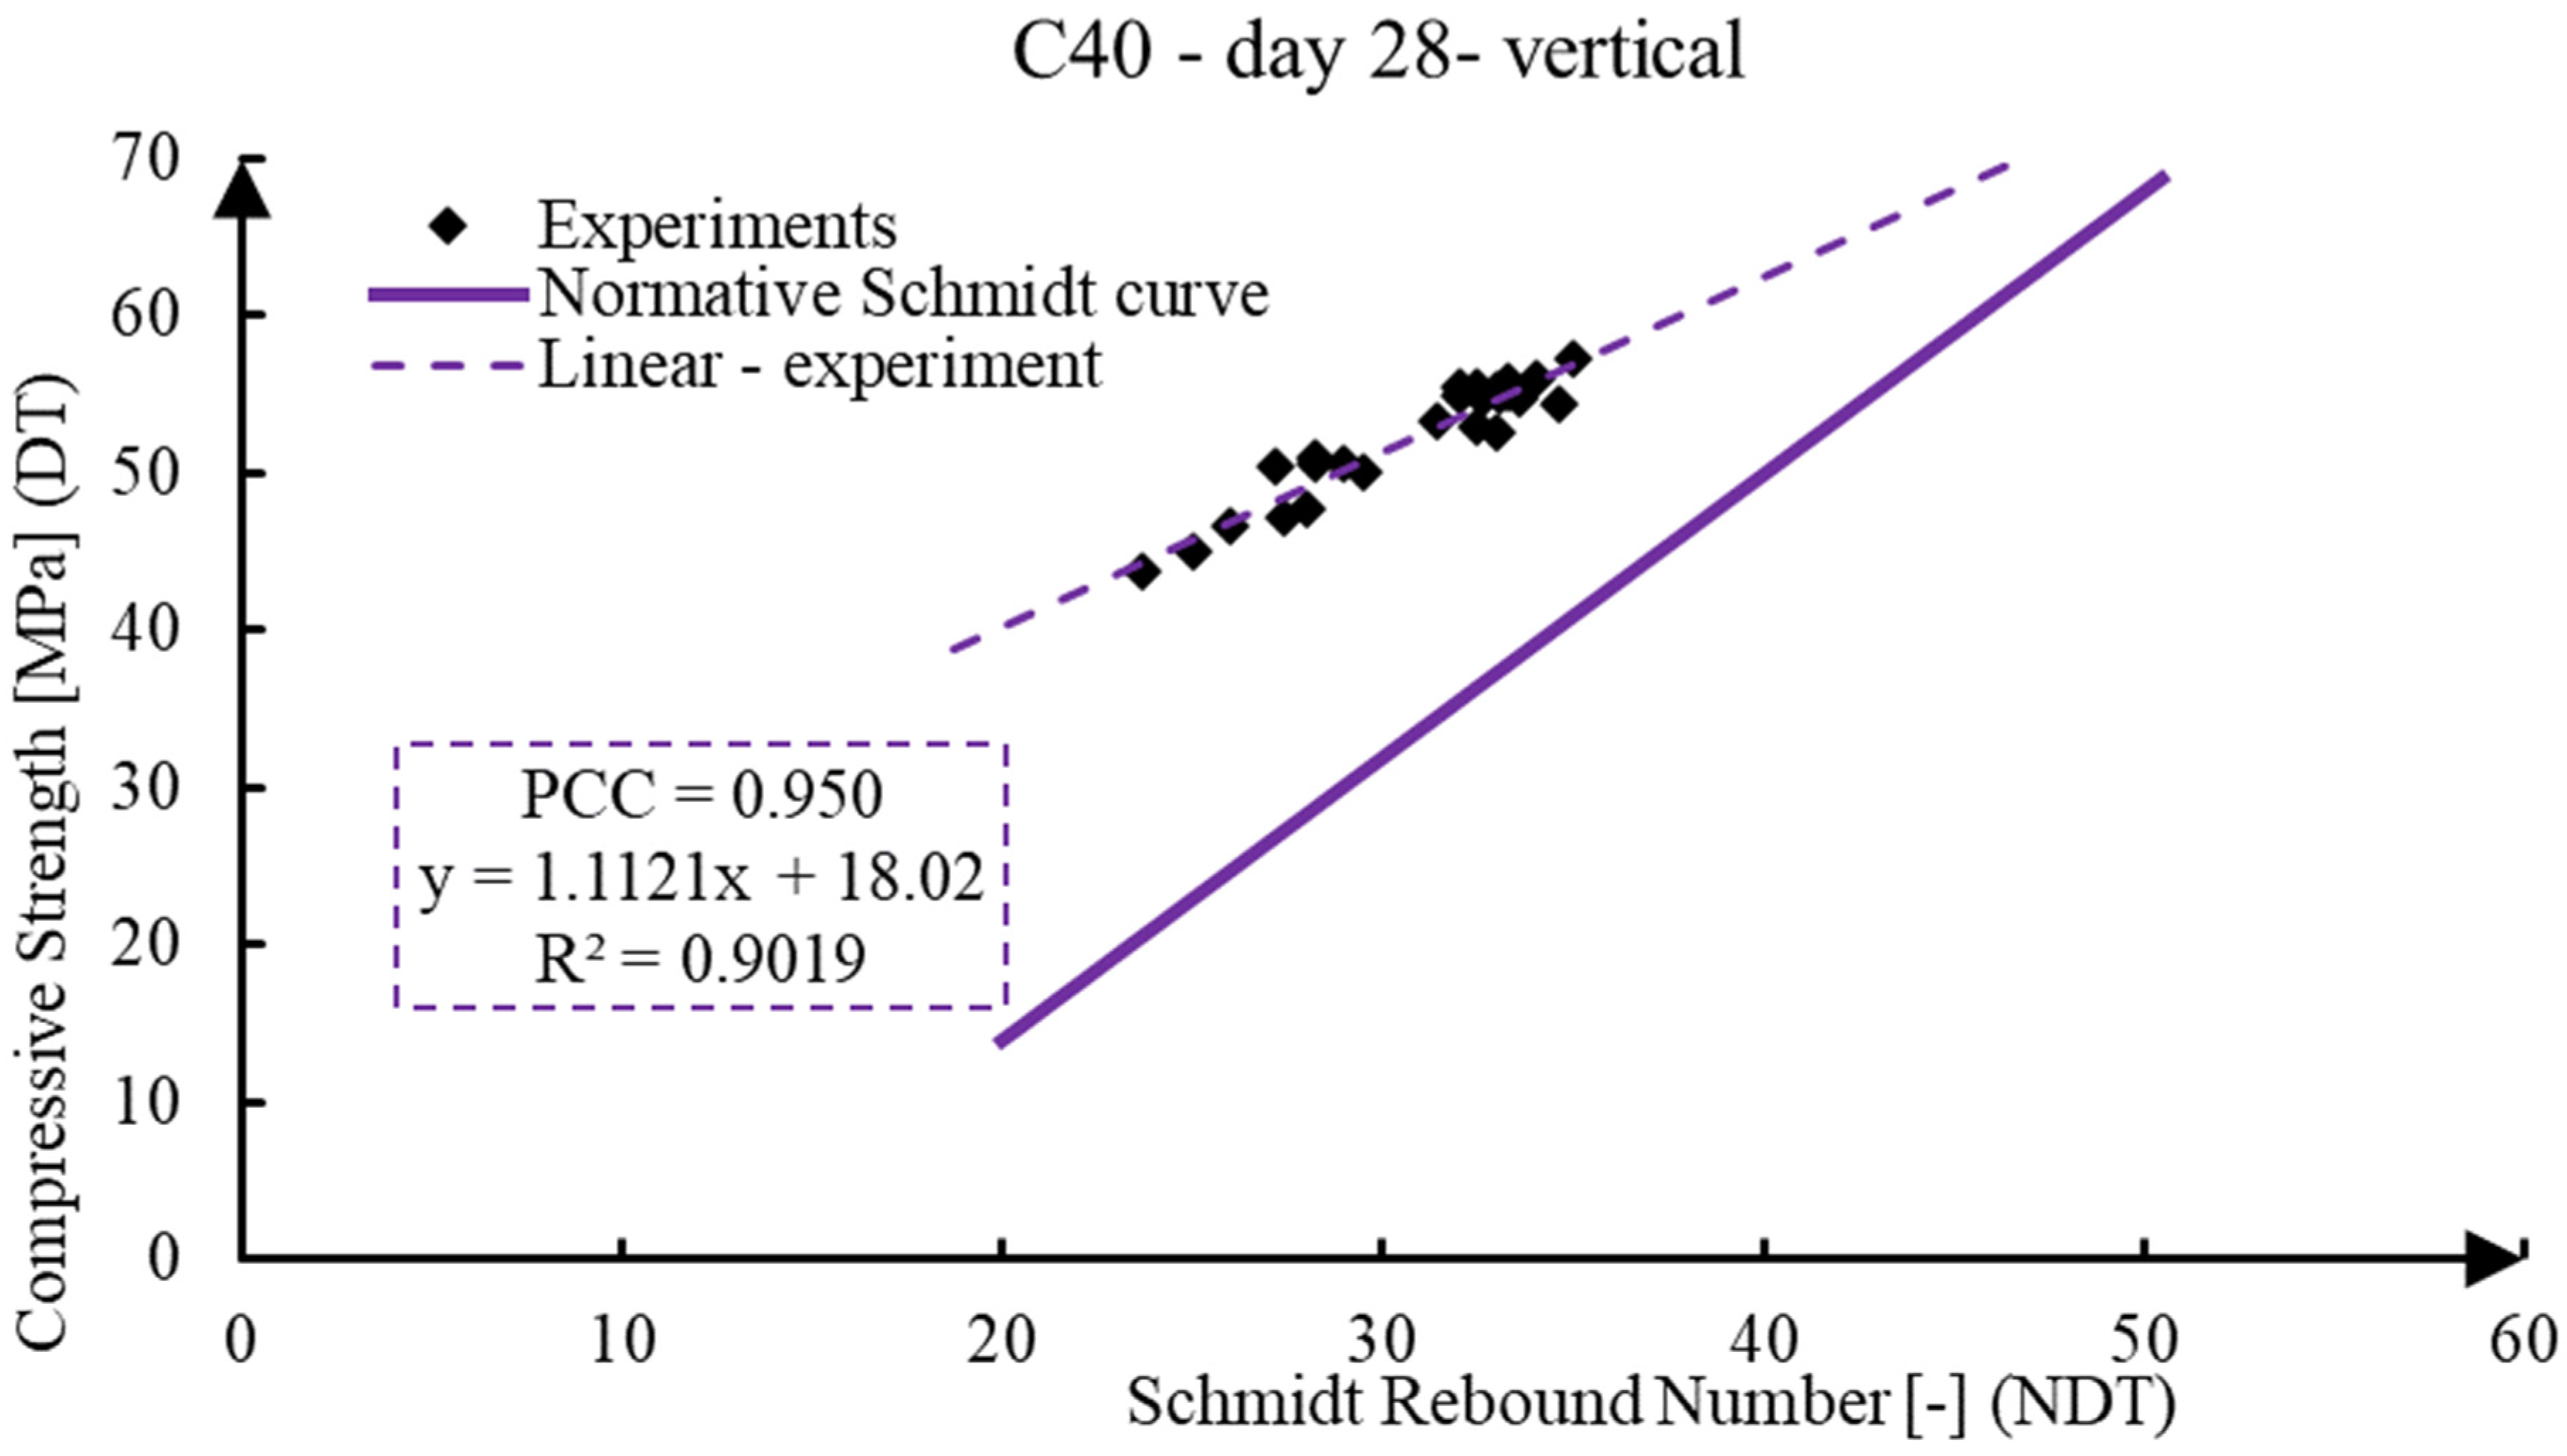
| vertical | 0.950 | y = 1.1121x + 18.02 | 0.9019 |
Disclaimer/Publisher’s Note: The statements, opinions and data contained in all publications are solely those of the individual author(s) and contributor(s) and not of MDPI and/or the editor(s). MDPI and/or the editor(s) disclaim responsibility for any injury to people or property resulting from any ideas, methods, instructions or products referred to in the content. |
© 2023 by the authors. Licensee MDPI, Basel, Switzerland. This article is an open access article distributed under the terms and conditions of the Creative Commons Attribution (CC BY) license (https://creativecommons.org/licenses/by/4.0/).
Share and Cite
Badarloo, B.; Lehner, P. Practical Aspects of Correlation Analysis of Compressive Strength from Destructive and Non-Destructive Methods in Different Directions. Infrastructures 2023, 8, 155. https://doi.org/10.3390/infrastructures8110155
Badarloo B, Lehner P. Practical Aspects of Correlation Analysis of Compressive Strength from Destructive and Non-Destructive Methods in Different Directions. Infrastructures. 2023; 8(11):155. https://doi.org/10.3390/infrastructures8110155
Chicago/Turabian StyleBadarloo, Baitollah, and Petr Lehner. 2023. "Practical Aspects of Correlation Analysis of Compressive Strength from Destructive and Non-Destructive Methods in Different Directions" Infrastructures 8, no. 11: 155. https://doi.org/10.3390/infrastructures8110155