

Impact of Sex and Velocity on Plantar Pressure Distribution during Gait: A Cross-Sectional Study Using an Instrumented Pressure-Sensitive Walkway

Abstract
:1. Introduction
2. Materials and Methods
2.1. Participants
2.2. Protocol
2.3. Statistical Analysis
3. Results
3.1. Impact of Sex
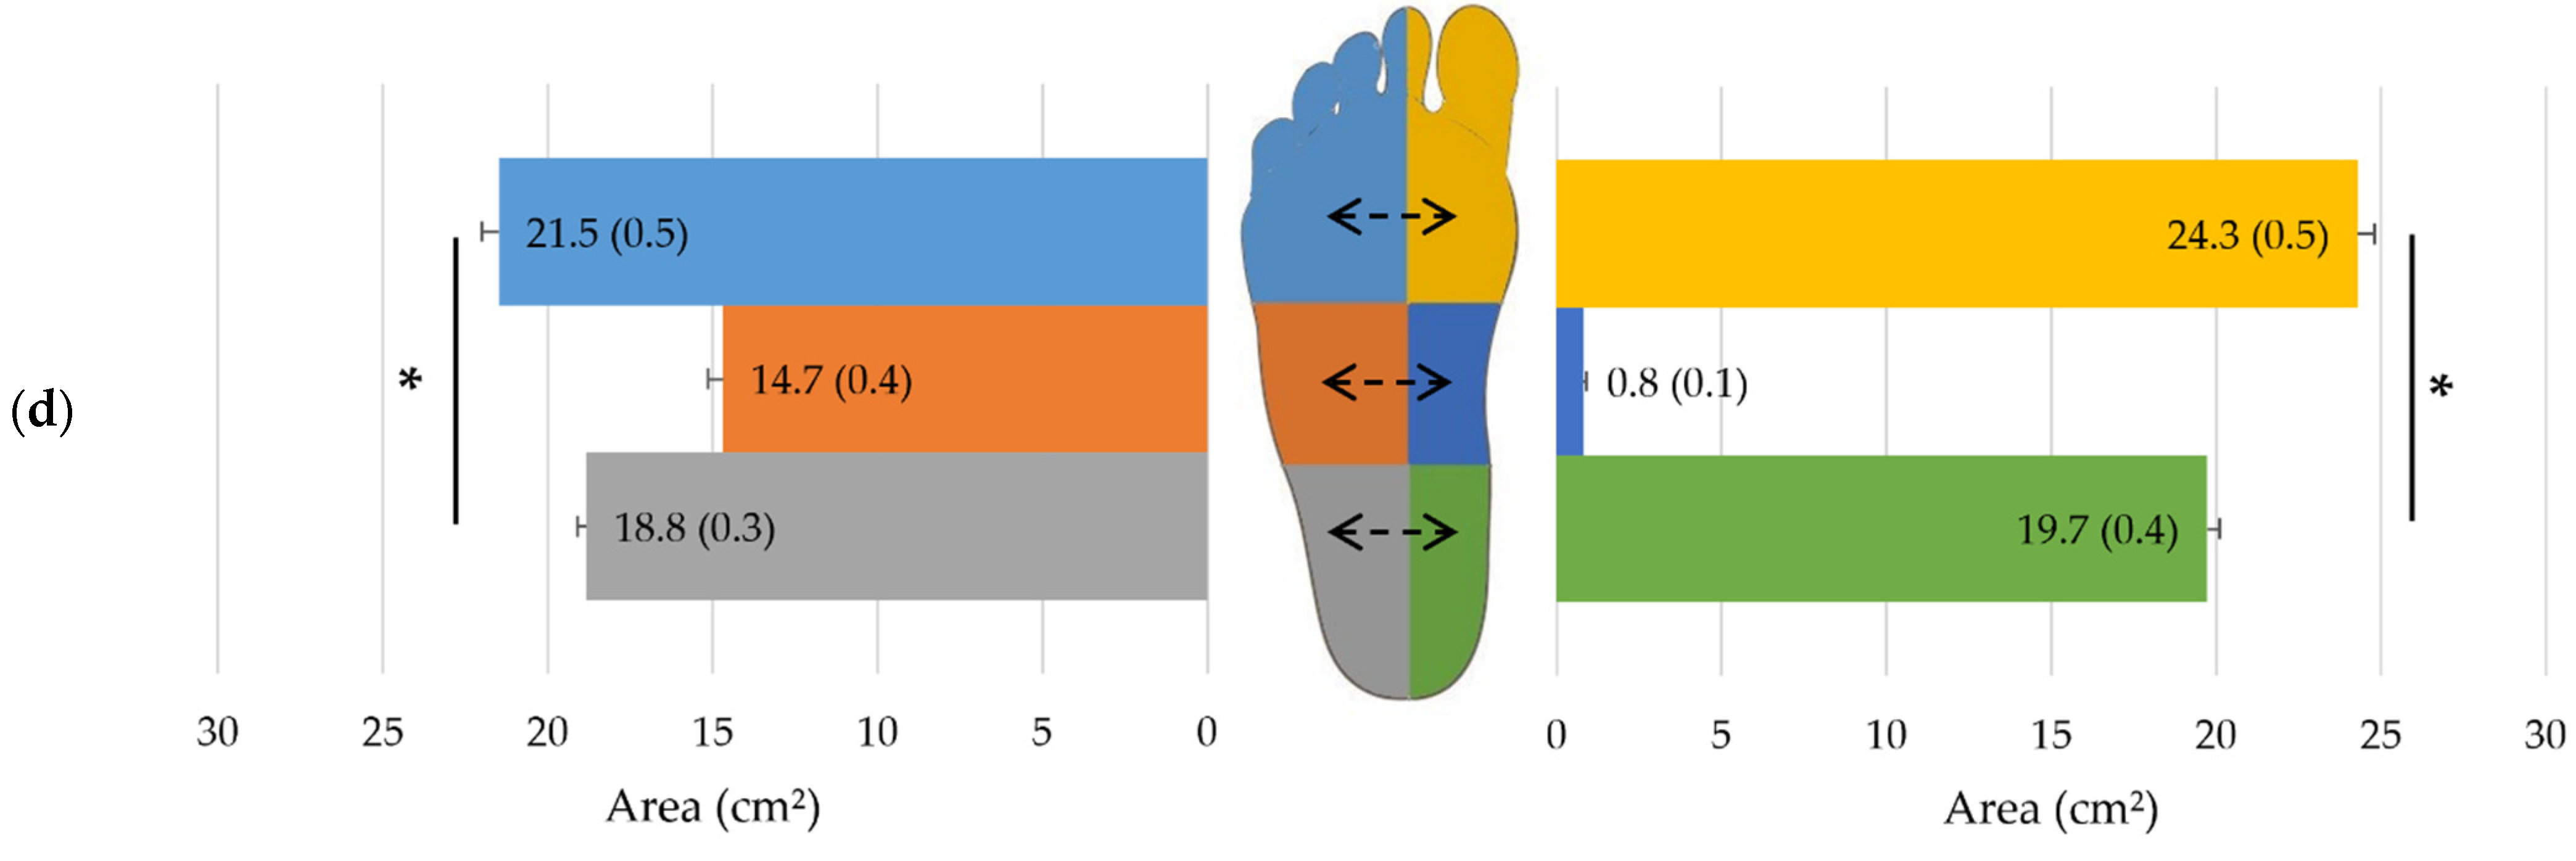
3.2. Impact of Side
3.3. Impact of Velocity
3.4. Sex, Side and Velocity Interactions on Overall Plantar Pressure Data
3.5. Pressure Zones and Interactions with Velocity
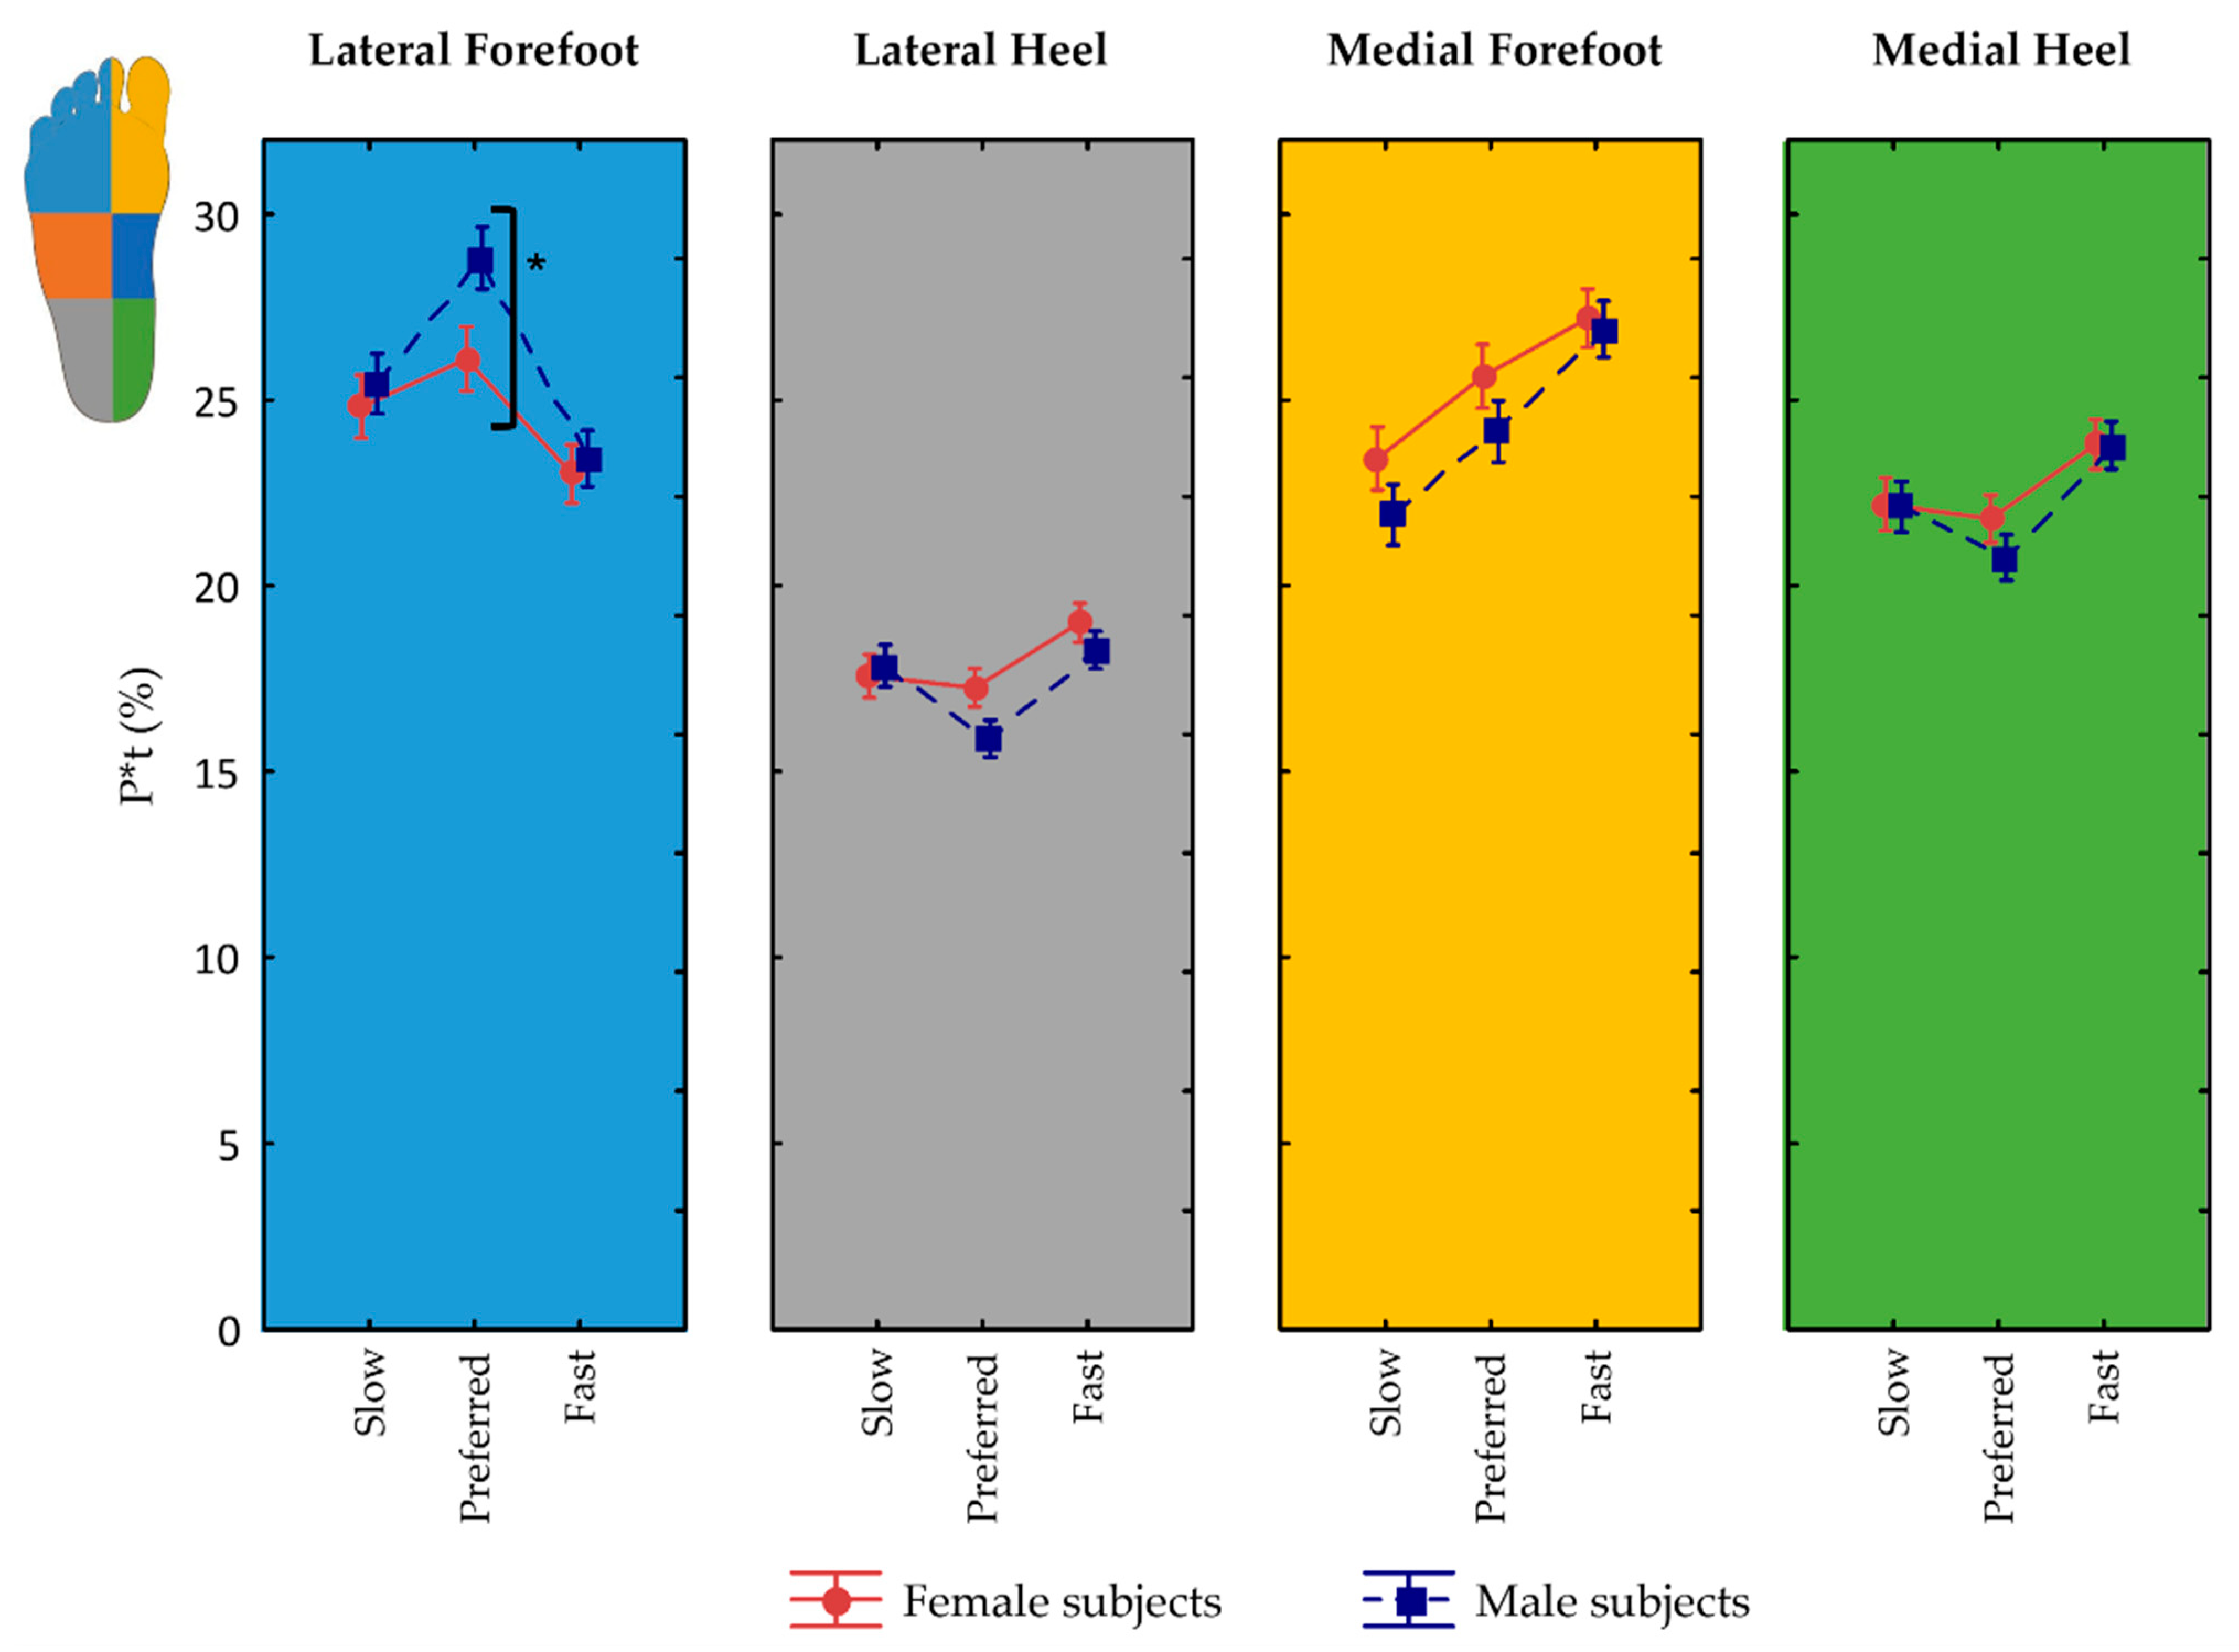
3.6. Influence of Sex on Pressure Zones and Interactions
4. Discussion
5. Conclusions
Supplementary Materials
Author Contributions
Funding
Institutional Review Board Statement
Informed Consent Statement
Data Availability Statement
Acknowledgments
Conflicts of Interest
References
- Zulkifli, S.S.; Loh, W.P. A State-of-the-Art Review of Foot Pressure. Foot Ankle Surg. 2020, 26, 25–32. [Google Scholar] [CrossRef] [PubMed]
- Zhang, B.; Lu, Q. A Current Review of Foot Disorder and Plantar Pressure Alternation in the Elderly. Phys. Act. Health 2020, 4, 95–106. [Google Scholar] [CrossRef]
- Rodgers, M.M.; Cavanagh, P.R. Pressure Distribution in Morton’s Foot Structure. Med. Sci. Sports Exerc. 1989, 21, 23–28. [Google Scholar] [CrossRef]
- Palanisami, D.R.; Rajasekaran, R.B.; Reddy, P.K.; Natesan, R.; Sethuraman, A.; Rajasekaran, S. Foot Loading Pattern and Hind Foot Alignment Are Corrected in Varus Knees Following Total Knee Arthroplasty: A Pedobarographic Analysis. Knee Surg. Sports Traumatol. Arthrosc. 2020, 28, 1861–1867. [Google Scholar] [CrossRef] [PubMed]
- Ebina, K.; Hirao, M.; Takagi, K.; Ueno, S.; Morimoto, T.; Matsuoka, H.; Kitaguchi, K.; Iwahashi, T.; Hashimoto, J.; Yoshikawa, H. Comparison of the Effects of Forefoot Joint-Preserving Arthroplasty and Resection-Replacement Arthroplasty on Walking Plantar Pressure Distribution and Patient-Based Outcomes in Patients with Rheumatoid Arthritis. PLoS ONE 2017, 12, e0183805. [Google Scholar] [CrossRef] [Green Version]
- Kamenaga, T.; Nakano, N.; Takayama, K.; Tsubosaka, M.; Takashima, Y.; Kikuchi, K.; Fujita, M.; Kuroda, Y.; Hashimoto, S.; Hayashi, S.; et al. Comparison of Plantar Pressure Distribution during Walking and Lower Limb Alignment between Modified Kinematically and Mechanically Aligned Total Knee Arthroplasty. J. Biomech. 2021, 120, 110379. [Google Scholar] [CrossRef]
- Fernando, M.; Crowther, R.; Lazzarini, P.; Sangla, K.; Cunningham, M.; Buttner, P.; Golledge, J. Biomechanical Characteristics of Peripheral Diabetic Neuropathy: A Systematic Review and Meta-Analysis of Findings from the Gait Cycle, Muscle Activity and Dynamic Barefoot Plantar Pressure. Clin. Biomech. 2013, 28, 831–845. [Google Scholar] [CrossRef]
- Nurse, M.A.; Nigg, B.M. The Effect of Changes in Foot Sensation on Plantar Pressure and Muscle Activity. Clin. Biomech. 2001, 16, 719–727. [Google Scholar] [CrossRef]
- Nurse, M.A.; Nigg, B.M. Quantifying a Relationship between Tactile and Vibration Sensitivity of the Human Foot with Plantar Pressure Distributions during Gait. Clin. Biomech. 1999, 14, 667–672. [Google Scholar] [CrossRef]
- Lee, K.B.; Kim, B.R.; Lee, K.S. Effects of Toe Spreader on Plantar Pressure and Gait in Chronic Stroke Patients. Technol. Health Care 2018, 26, 957–962. [Google Scholar] [CrossRef]
- Stewart, S.; Dalbeth, N.; Vandal, A.C.; Rome, K. Spatiotemporal Gait Parameters and Plantar Pressure Distribution during Barefoot Walking in People with Gout and Asymptomatic Hyperuricemia: Comparison with Healthy Individuals with Normal Serum Urate Concentrations. J. Foot Ankle Res. 2016, 9, 15. [Google Scholar] [CrossRef] [PubMed] [Green Version]
- McKay, M.J.; Baldwin, J.N.; Ferreira, P.; Simic, M.; Burns, J.; Vanicek, N.; Wojciechowski, E.; Mudge, A. Spatiotemporal and Plantar Pressure Patterns of 1000 Healthy Individuals Aged 3–101 Years. Gait Posture 2017, 58, 78–87. [Google Scholar] [CrossRef] [PubMed]
- Titianova, E.B.; Mateev, P.S.; Tarkka, I.M. Footprint Analysis of Gait Using a Pressure Sensor System. J. Electromyogr. Kinesiol. 2004, 14, 275–281. [Google Scholar] [CrossRef] [PubMed]
- Lim, B.-O.; O’Sullivan, D.; Choi, B.-G.; Kim, M.-Y. Comparative Gait Analysis between Children with Autism and Age-Matched Controls: Analysis with Temporal-Spatial and Foot Pressure Variables. J. Phys. Ther. Sci. 2016, 28, 286–292. [Google Scholar] [CrossRef] [Green Version]
- Kärki, S.; Lekkala, J.; Kaistila, T.; Laine, H.-J.; Mäenpää, H.; Kuokkanen, H. Plantar Pressure Distribution Measurements: An Approach to Different Methods to Compute a Pressure Map. Age 2009, 23, 19–30. [Google Scholar]
- Deepashini, H.; Omar, B.; Paungmali, A.; Amaramalar, N.; Ohnmar, H.; Leonard, J. An Insight into the Plantar Pressure Distribution of the Foot in Clinical Practice: Narrative Review. Pol. Ann. Med. 2014, 21, 51–56. [Google Scholar] [CrossRef]
- Rosenbaum, D.; Hautmann, S.; Gold, M.; Claes, L. Effects of Walking Speed on Plantar Pressure Patterns and Hindfoot Angular Motion. Gait Posture 1994, 2, 191–197. [Google Scholar] [CrossRef]
- Segal, A.; Rohr, E.; Orendurff, M.; Shofer, J.; O’Brien, M.; Sangeorzan, B. The Effect of Walking Speed on Peak Plantar Pressure. Foot Ankle Int. 2004, 25, 926–933. [Google Scholar] [CrossRef]
- Taylor, A.J.; Menz, H.B.; Keenan, A.M. The Influence of Walking Speed on Plantar Pressure Measurements Using the Two-Step Gait Initiation Protocol. Foot 2004, 14, 49–55. [Google Scholar] [CrossRef]
- Zhu, H.; Wertsch, J.J.; Harris, G.F.; Alba, H.M. Walking Cadence Effect on Plantar Pressures. Arch. Phys. Med. Rehabil. 1995, 76, 1000–1005. [Google Scholar] [CrossRef]
- Allet, L.; IJzerman, H.; Meijer, K.; Willems, P.; Savelberg, H. The Influence of Stride-Length on Plantar Foot-Pressures and Joint Moments. Gait Posture 2011, 34, 300–306. [Google Scholar] [CrossRef] [PubMed]
- Menz, H.B.; Morris, M.E. Clinical Determinants of Plantar Forces and Pressures during Walking in Older People. Gait Posture 2006, 24, 229–236. [Google Scholar] [CrossRef] [PubMed]
- Anukoolkarn, K.; Vongsirinavarat, M.; Bovonsunthonchai, S.; Vachalathiti, R. Plantar Pressure Distribution Pattern during Mid-Stance Phase of the Gait in Patients with Chronic Non-Specific Low Back Pain. J. Med. Assoc. Thai 2015, 98, 896–901. [Google Scholar] [PubMed]
- Sinha, A.; Kulkarni, D.; Mehendale, P. Plantar Pressure Analysis and Customized Insoles in Diabetic Foot Ulcer Management: Case Series. J. Diabetol. 2020, 11, 204. [Google Scholar] [CrossRef]
- Bertuit, J.; Leyh, C.; Feipel, V. Plantar Pressure during Gait in Pregnancy-Related Pelvic Girdle Pain and the Influence of Pelvic Belts. JPO J. Prosthet. Orthot. 2019, 31, 199–206. [Google Scholar] [CrossRef]
- Bertuit, J.; Leyh, C.; Rooze, M.; Feipel, V. Plantar Pressure during Gait in Pregnant Women. J. Am. Podiatr. Med. Assoc. 2016, 106, 398–405. [Google Scholar] [CrossRef] [PubMed] [Green Version]
- Özkal, Ö.; Erdem, M.M.; Kısmet, K.; Topuz, S. Comparison of Upper Limb Burn Injury versus Simulated Pathology in Terms of Gait and Footprint Parameters. Gait Posture 2020, 75, 137–141. [Google Scholar] [CrossRef] [PubMed]
- Rosenthal, R. Meta-Analytic Procedures for Social Research (Applied Social Research Methods); SAGE Publications: Thousand Oaks, CA, USA, 1991; ISBN 9780803942462. [Google Scholar]
- Kressig, R.W.; Beauchet, O.; Anders, J.; Beauchet, O.; Feipel, V.; Freiberger, E.; Fruehwald, T.; Geser, C.; Helbostad, J.; Holm, I.; et al. Guidelines for Clinical Applications of Spatio-Temporal Gait Analysis in Older Adults. Aging Clin. Exp. Res. 2006, 18, 174–176. [Google Scholar] [CrossRef] [PubMed]
- Field, A. Discovering Statistics Using IBM SPSS Statistics; Introducing Statistical Methods; SAGE Publications: Thousand Oaks, CA, USA, 2013; ISBN 9781446249178. [Google Scholar]
- Öberg, T.; Karsznia, A.; Öberg, K. Basic Gait Parameters: Reference Data for Normal Subjects, 10–79 Years of Age. J. Rehabil. Res. Dev. 1993, 30, 210. [Google Scholar] [PubMed]
- Frimenko, R.; Goodyear, C.; Bruening, D. Interactions of Sex and Aging on Spatiotemporal Metrics in Non-Pathological Gait: A Descriptive Meta-Analysis. Physiotherapy 2015, 101, 266–272. [Google Scholar] [CrossRef]
- Horiuchi, M.; Endo, J.; Horiuchi, Y.; Abe, D. Comparisons of Energy Cost and Economical Walking Speed at Various Gradients in Healthy, Active Younger and Older Adults. J. Exerc. Sci. Fit. 2015, 13, 79–85. [Google Scholar] [CrossRef] [PubMed]
- Bastien, G.J.; Willems, P.A.; Schepens, B.; Heglund, N.C. Effect of Load and Speed on the Energetic Cost of Human Walking. Eur. J. Appl. Physiol. 2005, 94, 76–83. [Google Scholar] [CrossRef] [PubMed]
- Dingwell, J.B.; Marin, L.C. Kinematic Variability and Local Dynamic Stability of Upper Body Motions When Walking at Different Speeds. J. Biomech. 2006, 39, 444–452. [Google Scholar] [CrossRef] [PubMed]
- Jordan, K.; Newell, K.M. The Structure of Variability in Human Walking and Running Is Speed-Dependent. Exerc. Sport Sci. Rev. 2008, 36, 200–204. [Google Scholar] [CrossRef] [PubMed]
- Cavagna, G.A.; Willems, P.A.; Heglund, N.C. The Role of Gravity in Human Walking: Pendular Energy Exchange, External Work and Optimal Speed. J. Physiol. 2000, 528, 657. [Google Scholar] [CrossRef] [PubMed]
- Chiu, M.C.; Wang, M.J. The Effect of Gait Speed and Gender on Perceived Exertion, Muscle Activity, Joint Motion of Lower Extremity, Ground Reaction Force and Heart Rate during Normal Walking. Gait Posture 2007, 25, 385–392. [Google Scholar] [CrossRef] [PubMed]
- White, S.C.; Tucker, C.A.; Brangaccio, J.A.; Lin, H.Y. Relation of Vertical Ground Reaction Forces to Walking Speed. Gait Posture 1996, 2, 206. [Google Scholar] [CrossRef]
- Voloshin, A. The Influence of Walking Speed on Dynamic Loading on the Human Musculoskeletal System. Med. Sci. Sports Exerc. 2000, 32, 1156–1159. [Google Scholar] [CrossRef] [Green Version]
- Liu, M.Q.; Anderson, F.C.; Pandy, M.G.; Delp, S.L. Muscles That Support the Body Also Modulate Forward Progression during Walking. J. Biomech. 2006, 39, 2623–2630. [Google Scholar] [CrossRef] [PubMed]
- Liu, M.Q.; Anderson, F.C.; Schwartz, M.H.; Delp, S.L. Muscle Contributions to Support and Progression over a Range of Walking Speeds. J. Biomech. 2008, 41, 3243–3252. [Google Scholar] [CrossRef] [Green Version]
- Doke, J.; Donelan, J.M.; Kuo, A.D. Mechanics and Energetics of Swinging the Human Leg. J. Exp. Biol. 2005, 208, 439–445. [Google Scholar] [CrossRef] [PubMed]
- Hicks, J.H. The Mechanics of the Foot. II. The Plantar Aponeurosis and the Arch. J. Anat. 1954, 88, 25–30. [Google Scholar] [PubMed]
- Erdemir, A.; Hamel, A.J.; Fauth, A.R.; Piazza, S.J.; Sharkey, N.A. Dynamic Loading of the Plantar Aponeurosis in Walking. J. Bone Jt. Surg. 2004, 86, 546–552. [Google Scholar] [CrossRef] [PubMed]
- Carlson, R.E.; Fleming, L.L.; Hutton, W.C. The Biomechanical Relationship between the Tendoachilles, Plantar Fascia and Metatarsophalangeal Joint Dorsiflexion Angle. Foot Ankle Int. 2000, 21, 18–25. [Google Scholar] [CrossRef] [PubMed]
- Pataky, T.C.; Caravaggi, P.; Savage, R.; Parker, D.; Goulermas, J.Y.; Sellers, W.I.; Crompton, R.H. New Insights into the Plantar Pressure Correlates of Walking Speed Using Pedobarographic Statistical Parametric Mapping (PSPM). J. Biomech. 2008, 41, 1987–1994. [Google Scholar] [CrossRef] [PubMed]
- Farris, D.J.; Sawicki, G.S. The Mechanics and Energetics of Human Walking and Running: A Joint Level Perspective. J. R. Soc. Interface 2012, 9, 110–118. [Google Scholar] [CrossRef] [PubMed] [Green Version]
- Pataky, T.C.; Robinson, M.A.; Vanrenterghem, J.; Savage, R.; Bates, K.T.; Crompton, R.H. Vector Field Statistics for Objective Center-of-Pressure Trajectory Analysis during Gait, with Evidence of Scalar Sensitivity to Small Coordinate System Rotations. Gait Posture 2014, 40, 255–258. [Google Scholar] [CrossRef] [PubMed] [Green Version]
- Chiu, M.C.; Wu, H.C.; Chang, L.Y. Gait Speed and Gender Effects on Center of Pressure Progression during Normal Walking. Gait Posture 2013, 37, 43–48. [Google Scholar] [CrossRef] [PubMed]
- Neptune, R.R.; Sasaki, K.; Kautz, S.A. The Effect of Walking Speed on Muscle Function and Mechanical Energetics. Gait Posture 2008, 28, 135–143. [Google Scholar] [CrossRef] [PubMed] [Green Version]
- Putti, A.B.; Arnold, G.P.; Abboud, R.J. Foot Pressure Differences in Men and Women. Foot Ankle Surg. 2010, 16, 21–24. [Google Scholar] [CrossRef]
- Chung, M.-J.; Wang, M.-J. Gender and Walking Speed Effects on Plantar Pressure Distribution for Adults Aged 20–60 Years. Ergonomics 2012, 55, 194–200. [Google Scholar] [CrossRef]
- Wunderlich, R.E.; Cavanagh, P.R. Gender Differences in Adult Foot Shape: Implications for Shoe Design. Med. Sci. Sports Exerc. 2001, 33, 605–611. [Google Scholar] [CrossRef]
- Smith, L.K.; Lelas, J.L.; Kerrigan, D.C. Gender Differences in Pelvic Motions and Center of Mass Displacement during Walking: Stereotypes Quantified. J. Womens Health Gend. Based Med. 2002, 11, 453–458. [Google Scholar] [CrossRef] [PubMed]
- Wilkerson, R.D.; Mason, M.A. Differences in Men’s and Women’s Mean Ankle Ligamentous Laxity. Iowa Orthop. J. 2000, 20, 46. [Google Scholar]
- Zifchock, R.A.; Davis, I.; Hillstrom, H.; Song, J. The Effect of Gender, Age, and Lateral Dominance on Arch Height and Arch Stiffness. Foot Ankle Int. 2006, 27, 367–372. [Google Scholar] [CrossRef]
- Ferrari, J.; Watkinson, D. Foot Pressure Measurement Differences between Boys and Girls with Reference to Hallux Valgus Deformity and Hypermobility. Foot Ankle Int. 2005, 26, 739–747. [Google Scholar] [CrossRef]
- Pol, F.; Baharlouei, H.; Taheri, A.; Menz, H.B.; Forghany, S. Foot and Ankle Biomechanics during Walking in Older Adults: A Systematic Review and Meta-Analysis of Observational Studies. Gait Posture 2021, 89, 14–24. [Google Scholar] [CrossRef]
- Kernozek, T.W.; LaMott, E.E. Comparisons of Plantar Pressures between the Elderly and Young Adults. Gait Posture 1995, 3, 143–148. [Google Scholar] [CrossRef]
- Bosch, K.; Nagel, A.; Weigend, L.; Rosenbaum, D. From “First” to “Last” Steps in Life–Pressure Patterns of Three Generations. Clin. Biomech. 2009, 24, 676–681. [Google Scholar] [CrossRef] [PubMed] [Green Version]
- Scott, G.; Menz, H.B.; Newcombe, L. Age-Related Differences in Foot Structure and Function. Gait Posture 2007, 26, 68–75. [Google Scholar] [CrossRef]
- Hessert, M.J.; Vyas, M.; Leach, J.; Hu, K.; Lipsitz, L.A.; Novak, V. Foot Pressure Distribution during Walking in Young and Old Adults. BMC Geriatr. 2005, 5, 8. [Google Scholar] [CrossRef] [PubMed] [Green Version]
- Wonsetler, E.C.; Bowden, M.G. A Systematic Review of Mechanisms of Gait Speed Change Post-Stroke. Part 1: Spatiotemporal Parameters and Asymmetry Ratios. Top Stroke Rehabil. 2017, 24, 435–446. [Google Scholar] [CrossRef]
- McClymont, J.; Pataky, T.C.; Crompton, R.H.; Savage, R.; Bates, K.T. The Nature of Functional Variability in Plantar Pressure during a Range of Controlled Walking Speeds. R. Soc. Open Sci. 2016, 3, 160369. [Google Scholar] [CrossRef] [Green Version]
- McClymont, J.; Savage, R.; Pataky, T.C.; Crompton, R.; Charles, J.; Bates, K.T. Intra-Subject Sample Size Effects in Plantar Pressure Analyses. PeerJ 2021, 9, e11660. [Google Scholar] [CrossRef] [PubMed]
- Murphy, D.F.; Beynnon, B.D.; Michelson, J.D.; Vacek, P.M. Efficacy of Plantar Loading Parameters during Gait in Terms of Reliability, Variability, Effect of Gender and Relationship between Contact Area and Plantar Pressure. Foot Ankle Int. 2005, 26, 171–179. [Google Scholar] [CrossRef] [PubMed]
- Kernozek, T.W.; LaMott, E.E.; Dancisak, M.J. Reliability of an In-Shoe Pressure Measurement System during Treadmill Walking. Foot Ankle Int. 1996, 17, 204–209. [Google Scholar] [CrossRef]
- Keijsers, N.L.W.; Stolwijk, N.M.; Nienhuis, B.; Duysens, J. A New Method to Normalize Plantar Pressure Measurements for Foot Size and Foot Progression Angle. J. Biomech. 2009, 42, 87–90. [Google Scholar] [CrossRef]
- Jeon, E.; Cho, H. A Novel Method for Gait Analysis on Center of Pressure Excursion Based on a Pressure-Sensitive Mat. Int. J. Environ. Res. Public Health 2020, 17, 7845. [Google Scholar] [CrossRef]
- Giacomozzi, C.; Keijsers, N.; Pataky, T.; Rosenbaum, D. International Scientific Consensus on Medical Plantar Pressure Measurement Devices: Technical Requirements and Performance. Ann. Ist. Super Sanita 2012, 48, 259–271. [Google Scholar] [CrossRef]
- Mahieu, C.; Salvia, P.; Beyer, B.; Rooze, M.; Feipel, V.; van Sint Jan, S. Metatarsal Arch Deformation and Forefoot Kinematics during Gait in Asymptomatic Subjects. Int. Biomech. 2019, 6, 75–84. [Google Scholar] [CrossRef] [PubMed]


| All Subjects n = 170 | Women n = 83 | Men n = 87 | p-Value | r | |
|---|---|---|---|---|---|
| Age (years) | 43 ± 16 | 43 ± 16 | 42 ± 15 | 0.73 | |
| Height (m) | 1.72 ± 0.10 | 1.64 ± 0.07 | 1.79 ± 0.07 | <0.001 | −0.73 |
| Weight (kg) | 73 ± 15 | 66 ± 12 | 81 ± 13 | <0.001 | −0.58 |
| BMI (kg/m2) | 24.8 ± 4.2 | 24.4 ± 4.5 | 25.3 ± 3.7 | 0.04 | −0.16 |
| Leg length (cm) | 91.3 ± 6.6 | 87.2 ± 5.5 | 95.3 ± 4.9 | <0.001 | 0.65 |
| Foot Length (cm) | 25.2 ± 2.1 | 23.5 ± 1.1 | 26.7 ± 1.6 | <0.001 | −0.79 |
| All Subjects | Women | Men | p-Value (Part. η2) | |||
|---|---|---|---|---|---|---|
| n = 170 | n = 83 | n = 87 | S | V | V × S | |
| Velocity (m/s) | ||||||
| MEAN | 1.29 ± 0.50 | 1.27 ± 0.47 | 1.30 ± 0.52 | 0.59 | 0.002 a (0.04) | |
| Slow | 0.79 ± 0.20 | 0.80 ± 0.20 | 0.76 ± 0.20 | <0.001 a (0.90) | 0.93 | |
| Preferred | 1.25 ± 0.19 | 1.24 ± 0.20 | 1.24 ± 0.19 | >0.99 | ||
| Fast | 1.86 ± 0.32 | 1.78 ± 0.31 | 1.89 ± 0.31 | 0.02 (0.03) | ||
| Cadence (step/s) | ||||||
| MEAN | 1.87 ± 0.42 | 1.92 ± 0.41 | 1.82 ± 0.43 | <0.001 (0.09) | 0.40 a | |
| Slow | 1.43 ± 0.21 | 1.48 ± 0.21 | 1.38 ± 0.21 | <0.001 a (0.86) | ||
| Preferred | 1.86 ± 0.16 | 1.92 ± 0.15 | 1.80 ± 0.16 | |||
| Fast | 2.33 ± 0.27 | 2.35 ± 0.25 | 2.28 ± 0.29 | |||
| Step Length (m) | ||||||
| MEAN | 0.67 ± 0.13 | 0.64 ± 0.13 | 0.69 ± 0.14 | <0.001 (0.07) | <0.001 a (0.10) | |
| Slow | 0.54 ± 0.08 | 0.53 ± 0.08 | 0.54 ± 0.08 | <0.001 a (0.89) | 0.82 | |
| Preferred | 0.67 ± 0.07 | 0.65 ± 0.08 | 0.68 ± 0.07 | 0.03 (0.05) | ||
| Fast | 0.80 ± 0.09 | 0.76 ± 0.10 | 0.83 ± 0.07 | <0.001 (0.15) | ||
| Contact Time (s) | ||||||
| MEAN | 0.68 ± 0.19 | 0.66 ± 0.18 | 0.70 ± 0.20 | <0.001 (0.08) | 0.15 b | |
| Slow | 0.89 ± 0.15 | 0.86 ± 0.15 | 0.92 ± 0.15 | <0.001 b (0.82) | ||
| Preferred | 0.62 ± 0.07 | 0.62 ± 0.06 | 0.67 ± 0.07 | |||
| Fast | 0.50 ± 0.07 | 0.50 ± 0.06 | 0.51 ± 0.07 | |||
| Slow | Preferred | Fast | p-Value (Effect Size) | |||
|---|---|---|---|---|---|---|
| V | Z | V × Z | ||||
| Peak Pressure (%) | ||||||
| Forefoot | 21.5 ± 4.4 | 23.6 ± 4.3 | 23.0 ± 3.8 | <0.001 a (0.30) | <0.02 b (0.03) | <0.001 b (0.05) |
| Rearfoot | 23.7 ± 4.3 | 22.4 ± 4.1 | 23.9 ± 3.7 | |||
| Mid-foot | 3.6 [0.8–8.1] | 3.3 [0.4–6.6] | 2.2 [0.4–5.0] | <0.001 (0.46) | ||
| P*t (%) | ||||||
| Forefoot | 47.7 ± 8.9 | 52.6 ±7.6 | 50.3 ± 5.9 | <0.001 a (0.28) | <0.001 b (0.11) | <0.001 b (0.11) |
| Rearfoot | 40.2 ± 8.5 | 37.9 ±7.4 | 42.6 ±7.2 | |||
| Mid-foot | 10.9 [7.0–15.8] | 8.0 [5.0–12.2] | 5.9 [3.2–9.6] | <0.001 (0.58) | ||
| Peak Time (s) | ||||||
| Forefoot | 0.71 ± 0.13 | 0.53 ± 0.08 | 0.42 ± 0.06 | <0.001 b (0.30) | <0.001 b (0.86) | <0.001 b (0.14) |
| Rearfoot | 0.34 ± 0.10 | 0.20 ± 0.05 | 0.15 ± 0.03 | |||
| Mid-foot | 0.25 [0.06–0.43] | 0.15 [0.03–0.28] | 0.09 [0.02–0.17] | <0.001 (0.95) | ||
| Contact Area (cm2) | ||||||
| Forefoot | 44.7 ± 5.7 | 45.9 ± 5.4 | 46.8 ±5.2 | <0.001 a (0.26) | <0.001 b (0.18) | <0.001 a (0.03) |
| Rearfoot | 37.6 ± 3.4 | 38.7 ± 3.7 | 39.9 ± 4.0 | |||
| Mid-foot | 17.4 [12.9–22.9] | 14.9 [10.1–20.4] | 12.4 [8.1–18.2] | <0.001 (0.48) | ||
Publisher’s Note: MDPI stays neutral with regard to jurisdictional claims in published maps and institutional affiliations. |
© 2022 by the authors. Licensee MDPI, Basel, Switzerland. This article is an open access article distributed under the terms and conditions of the Creative Commons Attribution (CC BY) license (https://creativecommons.org/licenses/by/4.0/).
Share and Cite
Leyh, C.; Feipel, V. Impact of Sex and Velocity on Plantar Pressure Distribution during Gait: A Cross-Sectional Study Using an Instrumented Pressure-Sensitive Walkway. J. Funct. Morphol. Kinesiol. 2022, 7, 106. https://doi.org/10.3390/jfmk7040106
Leyh C, Feipel V. Impact of Sex and Velocity on Plantar Pressure Distribution during Gait: A Cross-Sectional Study Using an Instrumented Pressure-Sensitive Walkway. Journal of Functional Morphology and Kinesiology. 2022; 7(4):106. https://doi.org/10.3390/jfmk7040106
Chicago/Turabian StyleLeyh, Clara, and Véronique Feipel. 2022. "Impact of Sex and Velocity on Plantar Pressure Distribution during Gait: A Cross-Sectional Study Using an Instrumented Pressure-Sensitive Walkway" Journal of Functional Morphology and Kinesiology 7, no. 4: 106. https://doi.org/10.3390/jfmk7040106