1. Introduction
In the field of electronics manufacturing, inkjet printing technology has become a key innovation that is reshaping the way electronic components are made [
1,
2]. This technology involves the accurate deposition of various materials onto a substrate according to a well defined pattern. The versatility of inkjet printing is evident in its ability to handle a wide range of materials and substrates, tailored to the application of interest. This flexibility and customization represent a significant advancement over traditional manufacturing methods and, thus, they make inkjet printing a key driver in the modern electronics industry. A major advantage of inkjet printing is its cost effectiveness. Traditional methods often require expensive equipment and a lot of materials, resulting in higher costs. On the other hand, inkjet printing uses materials more efficiently and eliminates the need for expensive hardware. Therefore, this results in lower production costs, less material waste and, in turn, a greater environmental benefit. In addition, inkjet printing enables the creation of detailed and sophisticated designs that are difficult to achieve with conventional methods. This is especially useful for custom or small-scale electronic parts production, as design changes can be made quickly without extensive modifications to the production chain.
Inkjet printing technology has revolutionized many fields, particularly the manufacture of electronic devices, sensors, and radio frequency (RF) applications [
3,
4,
5,
6]. Its ability to work with high accuracy and adapt to different requirements has led to innovative and effective solutions in these application fields. From flexible electronics to advanced RF systems and advanced sensors, inkjet printing has been demonstrated to be a powerful technology that is rapidly and profoundly expanding the boundaries of electronics, offering both design flexibility and cost-effective production.
In the field of electronic device development, Pimpolari et al. [
3] proposed the development of fully printed and flexible Schottky diodes using carbon nanomaterials. Operating up to 5 MHz, these diodes demonstrate the effectiveness of inkjet printing in producing basic electronic components that are both cost-effective and mechanically stable, essential features for flexible and wearable electronics.
In terms of sensing applications, inkjet printing technology has enabled the development of advanced measurement systems; notably, in [
4], an inkjet-printed ultra high frequency (UHF) radio frequency identification (RFID) label for fruit traceability and spoilage sensing was presented. This application demonstrates the technological ability to overcome specific challenges, such as high dielectric surfaces, and provide a robust performance in a variety of conditions. In addition, in [
5], the fabrication of flexible dry electrocardiogram (ECG) electrodes using inkjet printing opens new avenues for personalized wearable health monitoring devices. These electrodes demonstrate a comparable performance to clinical standard gel electrodes such as those used for ECG, electroencephalogram (EEG), and electromyogram (EMG) acquisition [
7,
8,
9,
10,
11], thereby highlighting the effectiveness of the inkjet printing solution for meeting the needs of biomedical applications. Moreover, in [
6], the use of inkjet-printed microwave resonators for the dielectric characterization of biological samples illustrates the role of this technology in the development of non-invasive and accurate sensors for the dielectric characterization of biological materials. In the field of sensor development, inkjet printing technology is also finding significant applications in the deposition of sensing materials [
12]. This approach provides a viable alternative to more conventional and costly techniques such as plasma sputtering, spin coating, or screen printing, thus providing a more efficient and affordable method for sensor fabrication [
13,
14,
15].
Inkjet printing technology has seen significant advances in recent years, particularly in the field of RF and microwave electronics [
16,
17,
18,
19,
20]. This technology has been used to develop various microwave components such as sensors, filters, and antennas, which play a critical role in a broad range of applications, including automotive, telecommunications, and Internet of Things (IoT) devices [
21]. A remarkable achievement is the development of an all-printed 90 GHz beamforming array [
22], which represents a significant advancement in the capabilities of additive manufacturing into the W band (i.e., from 75 GHz to 110 GHz). This advance overcomes the challenges of ink spreading and RF circuit detuning, thereby enabling the production of high-performance arrays on flexible substrates. Another significant contribution is the development of a fully inkjet-printed three-dimensional (3D) band pass filter on a liquid crystal polymer substrate [
23]. Here, the authors underscore the accuracy and flexibility of inkjet printing in the manufacture of complex and miniaturized RF components, which are essential to modern communications systems.
This wide range of applications involving electronic devices, RF technology, and sensors highlights the flexibility, reliability, and cost-effectiveness of the inkjet printing technology. This advanced technology not only enables rapid prototyping, but also provides innovative solutions in various areas of electronics, leading to further progress of the industrial field.
The goal of the present work is the investigation of a methodology for quantitatively assessing the influence of fabrication tolerances on the performance of inkjet-printed microwave structures. Specifically, the proposed methodology is applied to an inkjet-printed hairpin band pass filter. The proposed filter, which takes advantage of microstrip technology, has been fabricated by printing a silver-based ink on a commercial Rogers RO4003C substrate. Specifically designed to operate in the portion of the L band from 1.4 GHz to 1.7 GHz, this filter has a wide range of potential applications. In particular, the L band is critical in telecommunications, satellite communications, and radar systems, where accurate and reliable signal filtering is of critical importance. The filter performance in this frequency range makes it particularly suitable for applications in the global positioning system (GPS) systems, mobile communications, and certain types of radar operations, where efficient signal processing and minimal interference are required. It is worth noting that the filter design presented in this study was not specifically optimized for a particular industrial application. This is because the main goal was to demonstrate the applicability and effectiveness of the proposed method in a general context, thereby providing a basic tool that can be adapted and refined for more specific applications, depending on the constraints and requirements imposed by the given application.
Despite the promising advances and opportunities of inkjet printing technology in electronics, there is still a lack of literature discussing its use in the fabrication of microwave filters, particularly those employing the microstrip hairpin structure; in fact, so far there are only a few studies in the literature addressing this topic [
24,
25]. Such a gap is noteworthy in light of the inherent challenges of the inkjet printing process. Common issues involve ink viscosity, ink spreading behavior, printer resolution limitations, and substrate planarity, among others. These factors can have a significant impact on the accuracy and quality of printed electronic components, thereby affecting their operational efficiency. This paper aims to address these challenges by providing a comprehensive discussion. We propose an approach based on Monte Carlo simulations to investigate the influence of these fabrication-related variables. This approach provides a systematic way to estimate and control the potential impact of these challenges on the manufacturing process, with the aim to contribute to the optimization of inkjet printing technology for the fabrication of high-performance electronic components, particularly in the area of the microwave technology.
Recently, various computational techniques have been proposed to assess the impact of manufacturing tolerances. In [
26], the polynomial chaos has been used to optimize the design of microwave filters by efficiently approximating the effects of manufacturing tolerances on filter performance. This method allows the prediction of system responses under different uncertainty parameters with reduced computational complexity compared to traditional methods. In [
27], an innovative yield optimization technique has been proposed for electromagnetic design with a focus on microwave filters. It integrates neurotransfer function surrogates with adaptively weighted yield-driven optimization. By assigning adaptive weights to different frequency points based on their potential to violate design specifications, this method improves model accuracy and yield estimation. Furthermore, in [
28], a fast, tolerance-aware design optimization method has been developed by coupling variable-fidelity electromagnetic simulations with response characteristics, providing a pragmatic solution for minimizing the computational complexity of yield optimization in microwave microstrip devices.
In contrast to the above techniques, the Monte Carlo method provides a more generalizable framework that does not rely on surrogate models or specific optimization strategies. While Monte Carlo simulations may be less computationally efficient than the other methods, they provide a high level of accuracy and reliability in estimating statistical properties without requiring assumptions about the underlying probability distributions of input parameters. This makes Monte Carlo particularly valuable for analyzing complex systems with a wide range of uncertainty contributions, such as inkjet-printed devices, where numerous variables (including ink electrical and mechanical properties, printer resolution and settings, and substrate planarity and dielectric properties) can affect the performance of the final devices.
The remainder of the paper is organized as follows:
Section 2 is devoted to the design, analysis, and fabrication of the hairpin structure band pass filter, providing a comprehensive overview of the methods and materials employed. Next,
Section 3 is focused on the evaluation of the device performance in the L band range. Finally, the article closes with
Section 4, where concluding remarks are presented, summarizing the key findings and outlining potential future directions in the field of advanced filter design using inkjet printing technology.
2. Materials and Methods for Filter Development
This section describes the specific methods used in the development of the hairpin filter, detailing the entire process from initial design to the final fabrication of the inkjet-printed prototype. The section is organized into three subsections, each of which focuses on a specific stage in the development of the filter. The first subsection, “Filter Design”, outlines the theoretical framework and techniques used to design the geometry of the filter. This includes a discussion of design parameters, substrate selection, and the use of specific software tools for simulation and optimization. The next subsection, “Monte Carlo Analysis”, discusses the probabilistic methods used to assess the robustness and reliability of the fabrication process. This analysis is critical to understanding the effects of manufacturing tolerances and variations on filter performance, and Monte Carlo simulations are used to quantify these effects. The final subsection, “Filter Fabrication”, describes the practical aspects of fabricating the filter. It focuses on the inkjet printing process, detailing the steps from printer calibration to material deposition and ink curing.
2.1. Filter Design
Hairpin filter geometry is characterized by a series of parallel coupled lines, resembling the shape of hairpins, which can be configured in various ways to achieve the desired filter properties [
29]. This design allows for compactness, making these filters ideal for applications where the available space is limited. The working principle of hairpin filters is based on the coupling of resonant elements, with each “hairpin” acting as a resonator [
29]. The coupling between these elements determines the bandwidth and selectivity of the filter, and by tuning the spacing and length of the hairpins, these parameters can be controlled with high accuracy. The main advantage of microstrip hairpin filters over other typologies, such as lumped element or cavity filters, is related to their physical compactness [
30]. Moreover, they can be easily integrated into printed circuit boards, which represent a significant advantage in modern electronics where integration and miniaturization are key factors.
The applications for hairpin filters are large and varied. They are commonly used in communication systems such as mobile and satellite communications [
30,
31]. For example, in radar systems, hairpin filters are used to process received signals, filtering out unwanted frequencies to improve the accuracy and reliability of the radar [
32,
33,
34]. They are also widely employed in RF and microwave applications, where they contribute to the efficient operation of transmitters and receivers [
35,
36].
The hairpin filter discussed in this article was carefully designed for operation in the L-band frequency range, specifically from 1.4 to 1.7 GHz. The design process was performed using the AWR Microwave Office V17 CAD software, in particular the integrated iFilter tool. This software tool supports the design of various filter typologies, including microstrip, stripline, and lumped element technologies. For our design, microstrip technology was selected based on the material properties provided in the Rogers RO4003C substrate data sheet. These properties include a dielectric constant
, a dissipation factor
, and a thickness of (1.52 ± 0.10) mm [
37].
The initial design phase in the iFilter GUI involved setting up the hairpin filter with the following nominal specifications:
Degree: 4;
Central Frequency (): 1550 MHz;
Bandwidth (BW): 300 MHz;
Characteristic Impedance (): 50 ;
Source Impedance (): 50 .
The iFilter tool provides preliminary geometric dimensions for the hairpin filter based on the selected specifications and the performed numerical calculations. Additionally, it offers the ideal filter response in terms of return loss (RL) and insertion loss (IL). The former is a measure of the power fraction that a source fails to deliver to a load, while the latter indicates the ratio of input power to transmitted power. These are typically expressed in decibels (dB) and are directly associated with the Scattering (
) parameters of the microwave network under study (e.g., a filter) [
38]:
When the magnitudes of the parameters are expressed in dB, and .
To further fine-tune the geometry of the filter, electromagnetic (EM) simulations were performed on the initial design. These simulations allowed a more accurate determination of the filter return loss and insertion loss, which deviated from the nominal values. As a result, an optimization process was required to fine-tune the filter geometry to meet the desired specifications.
Optimization was performed using the AWR Microwave Office Optimizer tool. This tool allows the user to set specific goals and perform multiple simulations on the microstrip structure to achieve those goals. For this project, the targets were as follows:
Return loss higher than 15 dB in the frequency range from 1.45 GHz to 1.65 GHz;
Insertion loss higher than 20 dB for frequencies lower than 1.30 GHz and higher than 1.80 GHz;
Insertion loss lower than 3 dB in the frequency range from 1.42 GHz to 1.68 GHz.
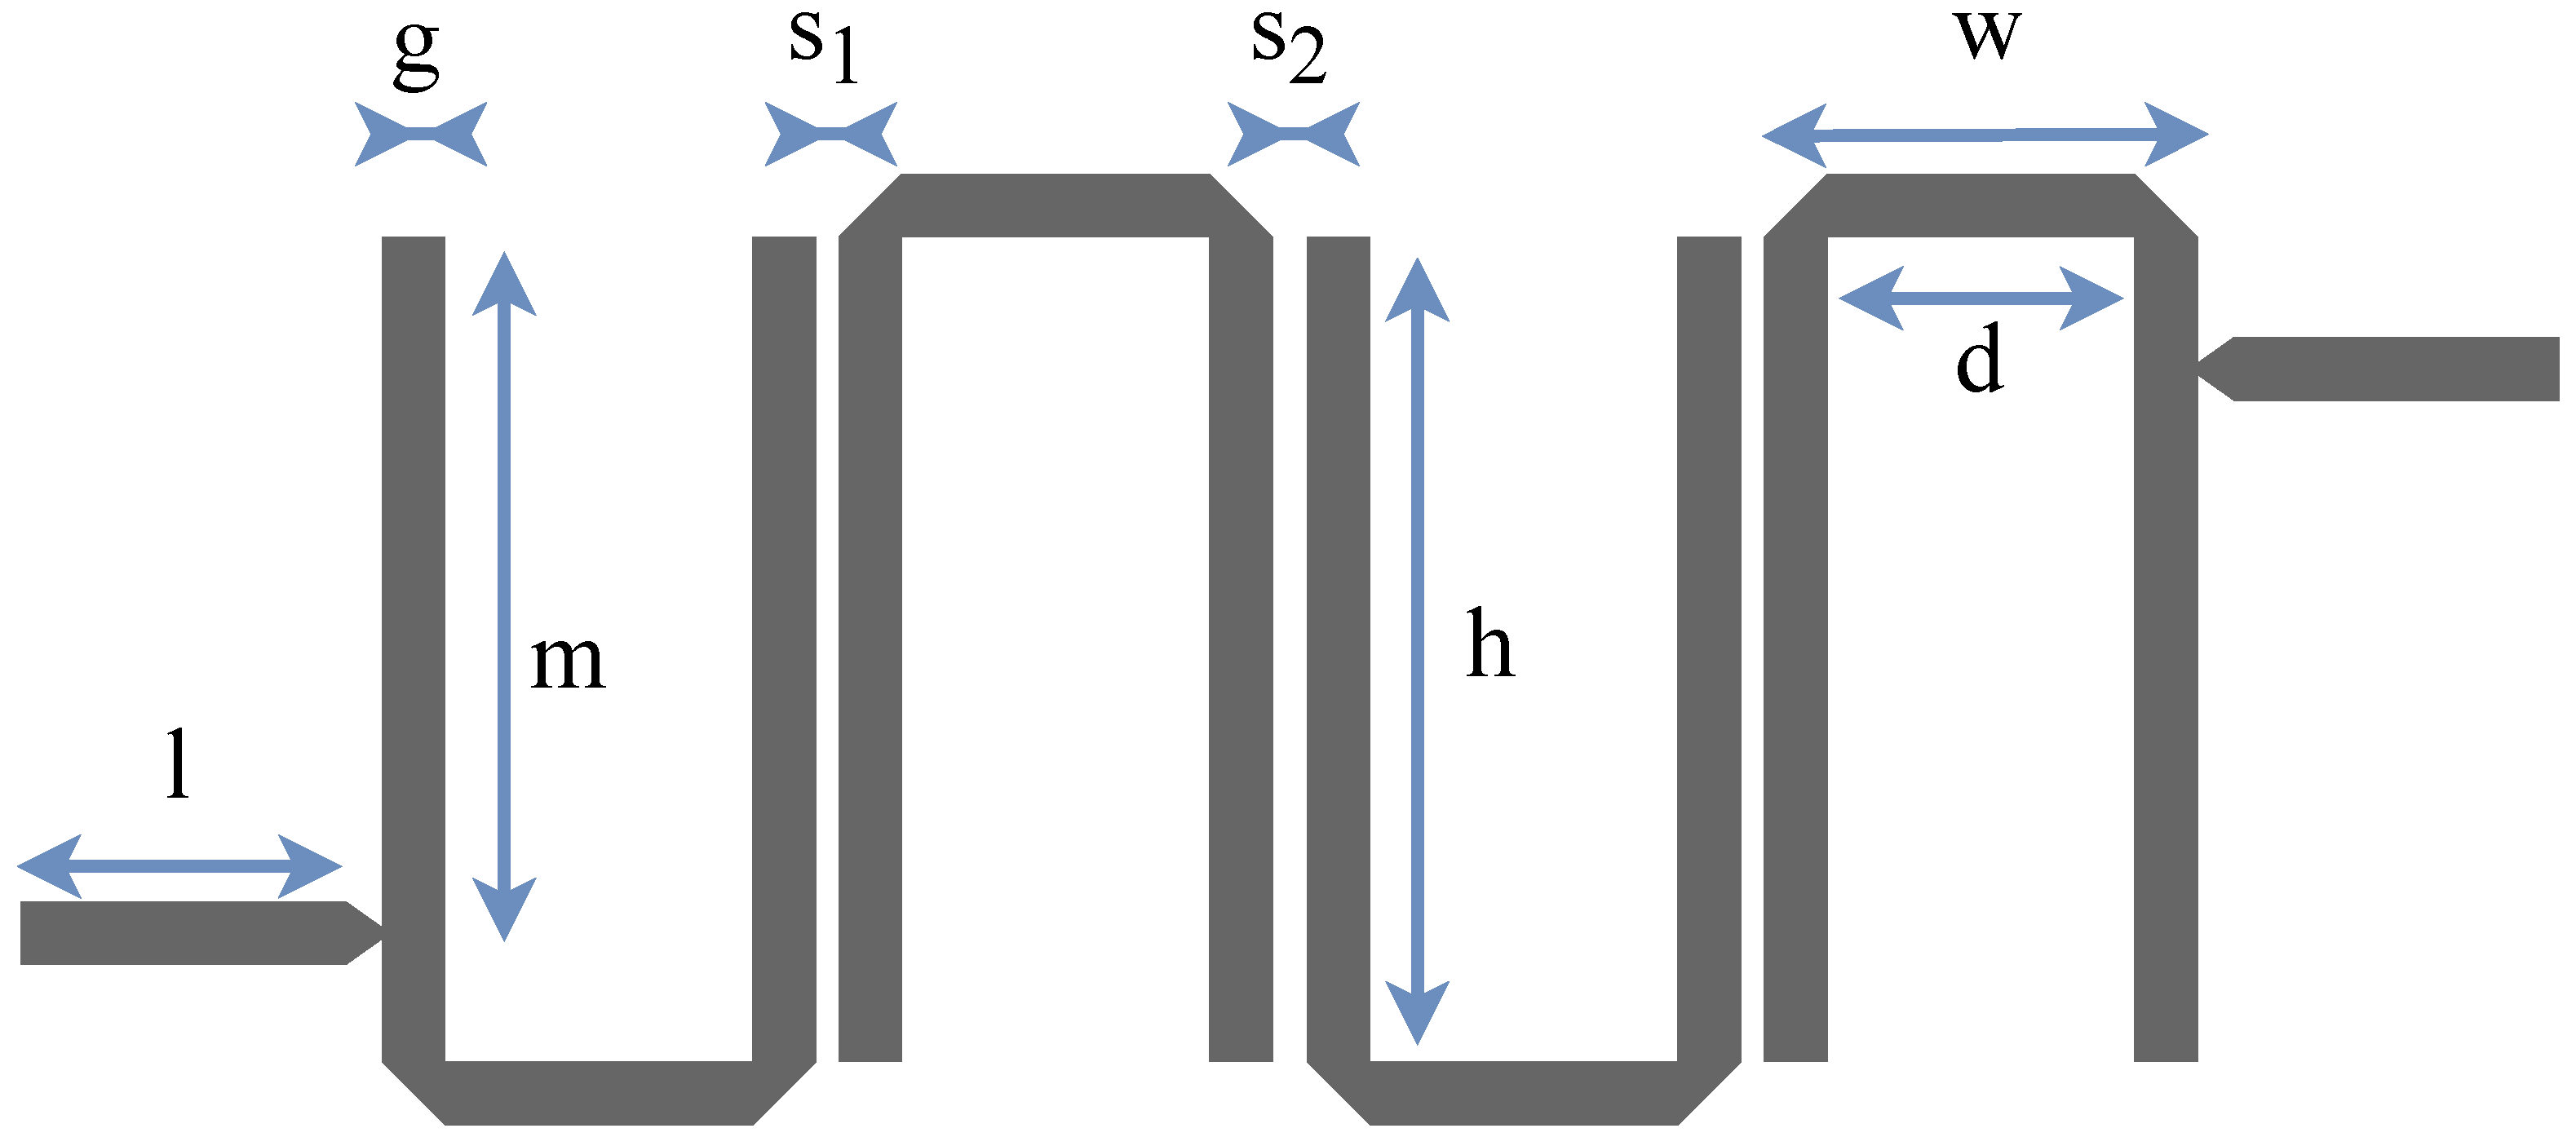
Starting with the initial geometric dimensions from iFilter, the optimizer ran approximately 10,000 simulations. Each simulation involved slight adjustments to the geometric parameters, with the results of each iteration recorded. The final selected configuration of the hairpin filter, optimized through computer simulations, is illustrated in
Figure 1. The figure includes dimensional labels for a comprehensive description of the filter structure. Each labeled dimension is detailed in
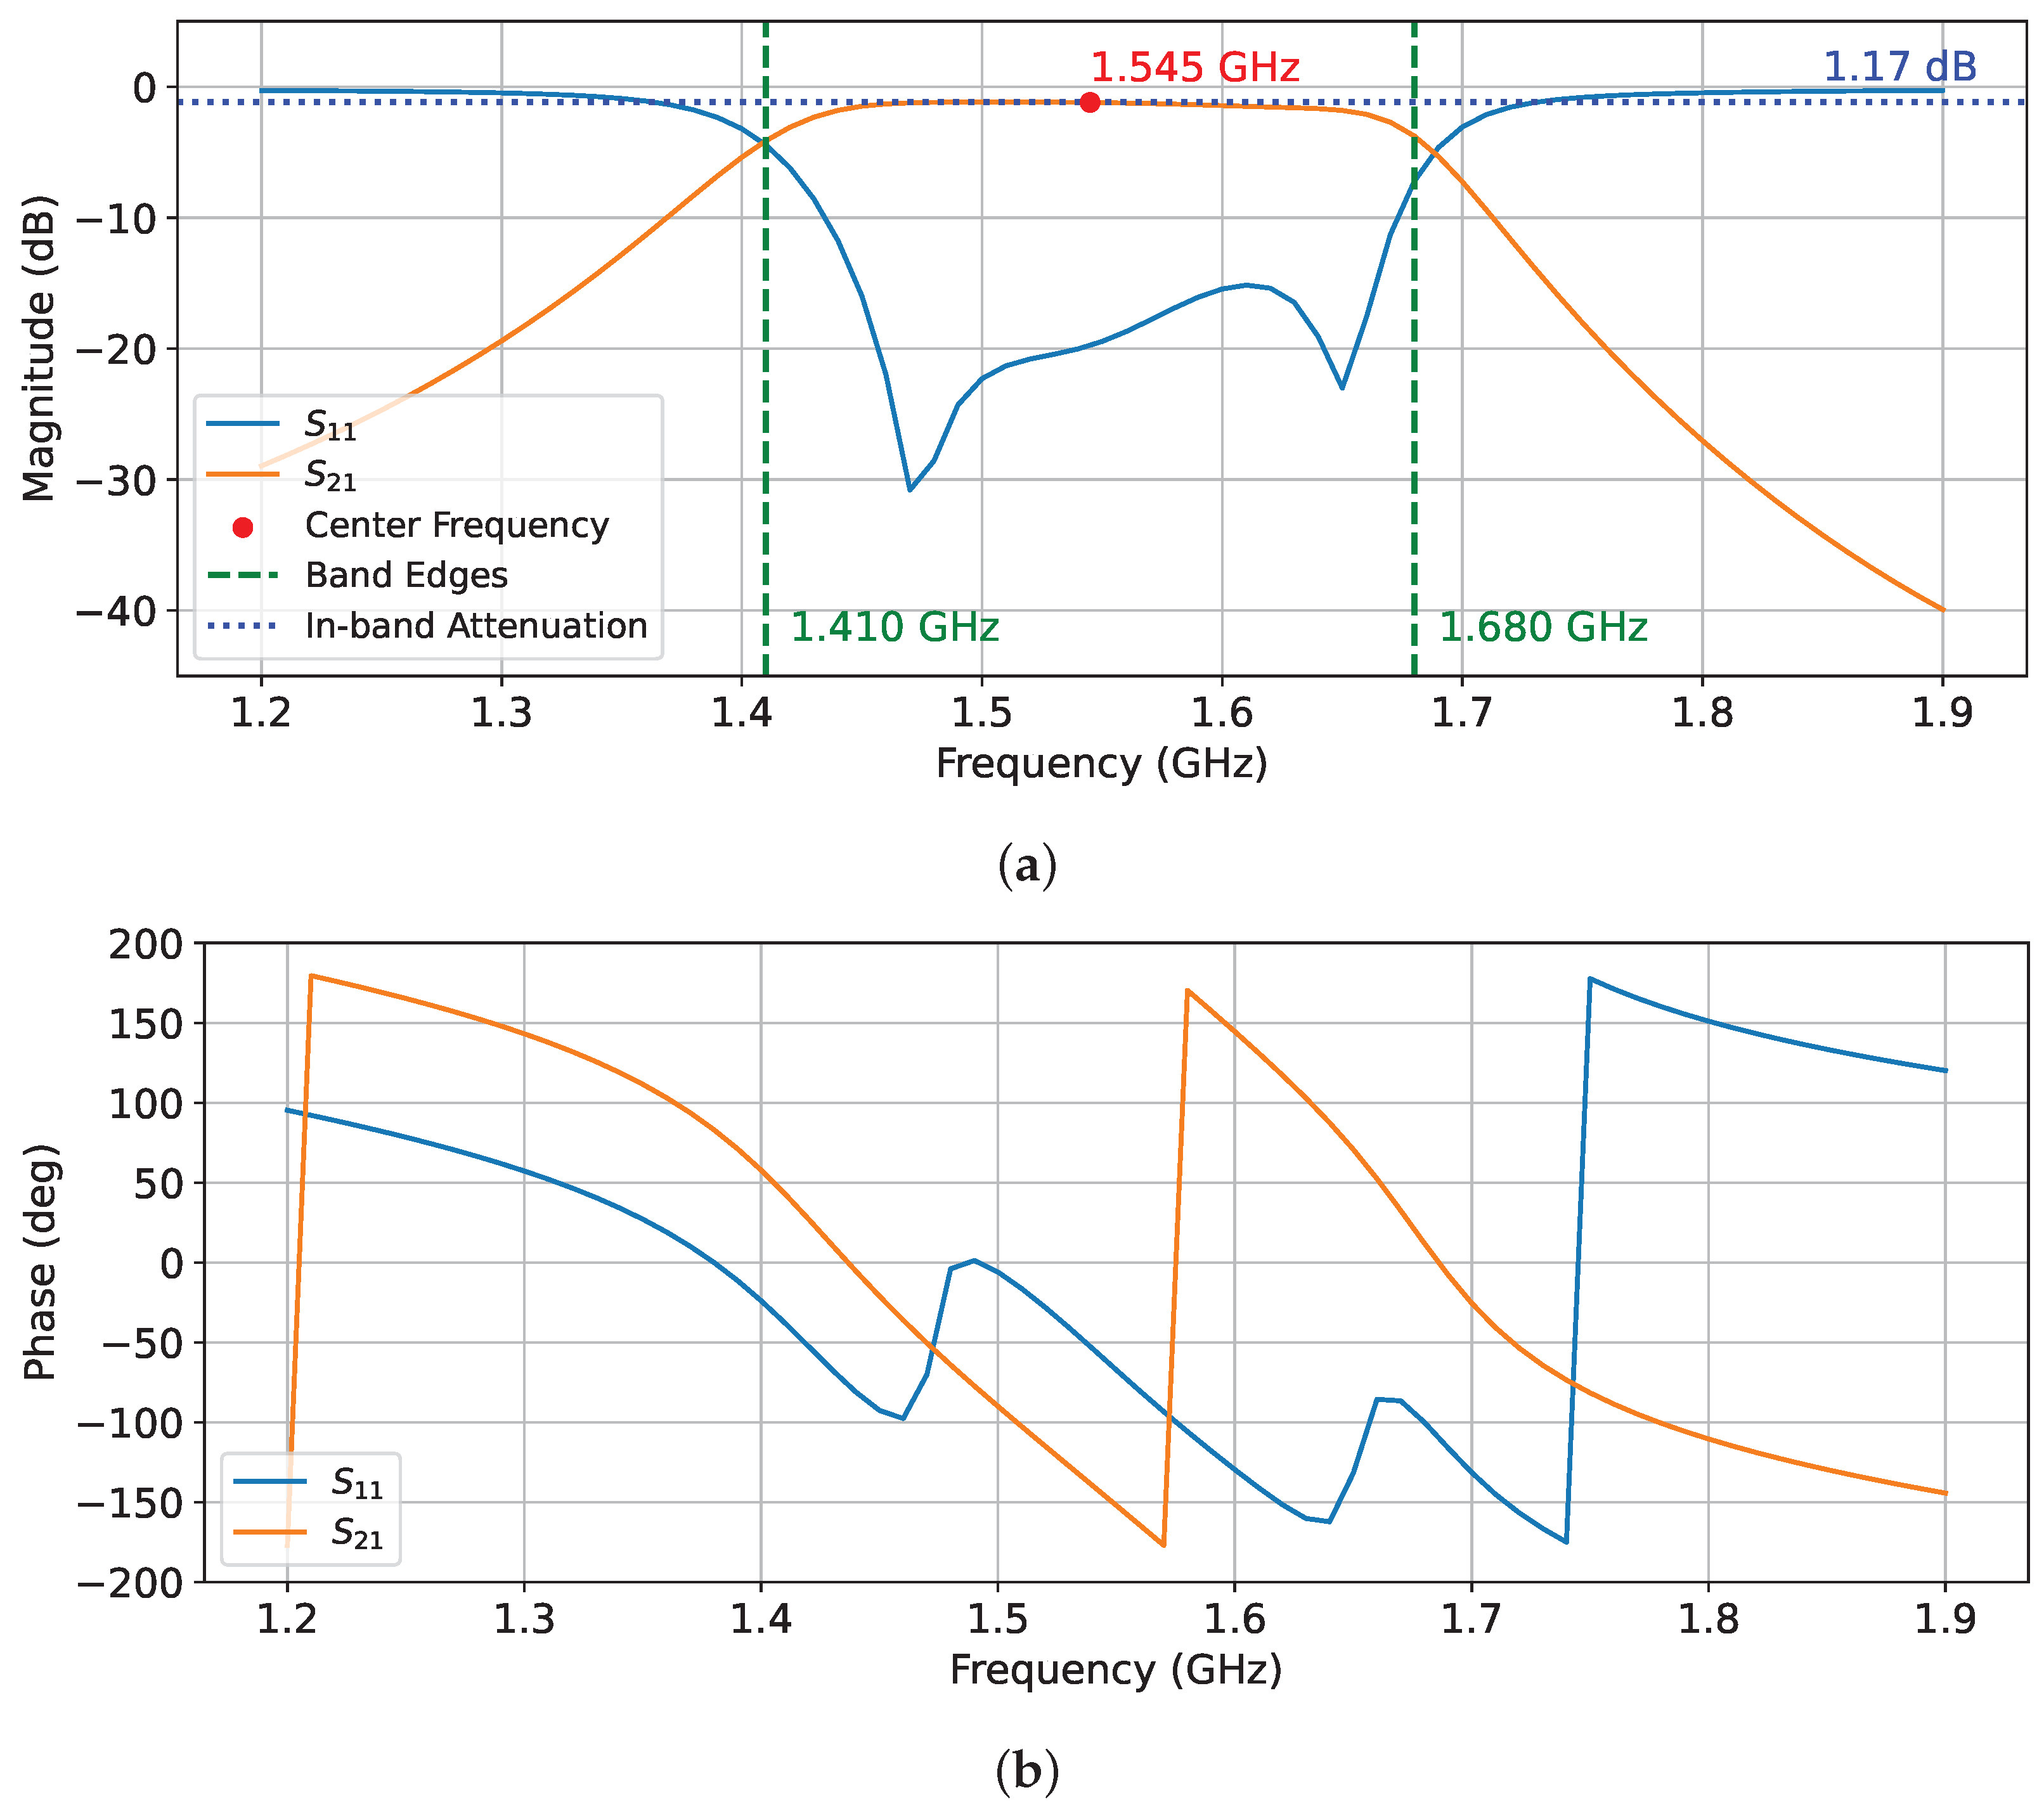
Table 1. The simulated filter response is shown in
Figure 2 in terms of
and
parameters.
2.2. Monte Carlo Analysis
Simulations played a crucial role in fine-tuning the geometric dimensions of the filter to meet the defined specifications. However, the inherent limitations of the inkjet printing system, particularly its resolution capability, may cause deviations in the actual dimensions of the fabricated device from the nominal values, with consequent alteration of the filter performance. Considering this, we used Monte Carlo analysis to evaluate the impact of such deviations and to estimate the variability in filter parameters resulting from manufacturing process tolerances. This approach is essential for understanding the propagation of measurement uncertainties through the design. The Voltera printer used in the fabrication process has a resolution of 10 µm in the x and y axes and 1 µm in the z axis. To perform the Monte Carlo analysis, the AWR Microwave Office software was used, which includes a feature called “Yield Analysis”. This analysis involves assigning uncertainties to all reported schematic parameters, such as geometric dimensions and material properties, along with their probability distributions. The software then executes multiple simulations varying these parameters within their defined ranges and according to their distributions. This process generates a range of possible filter responses in the frequency domain. By analyzing these responses, it is possible to establish a probability distribution for each parameter (e.g., center frequency, bandwidth, and attenuations) and estimate the corresponding uncertainties. This is accomplished by propagating the initial uncertainties of each parameter through the mathematical model of the filter.
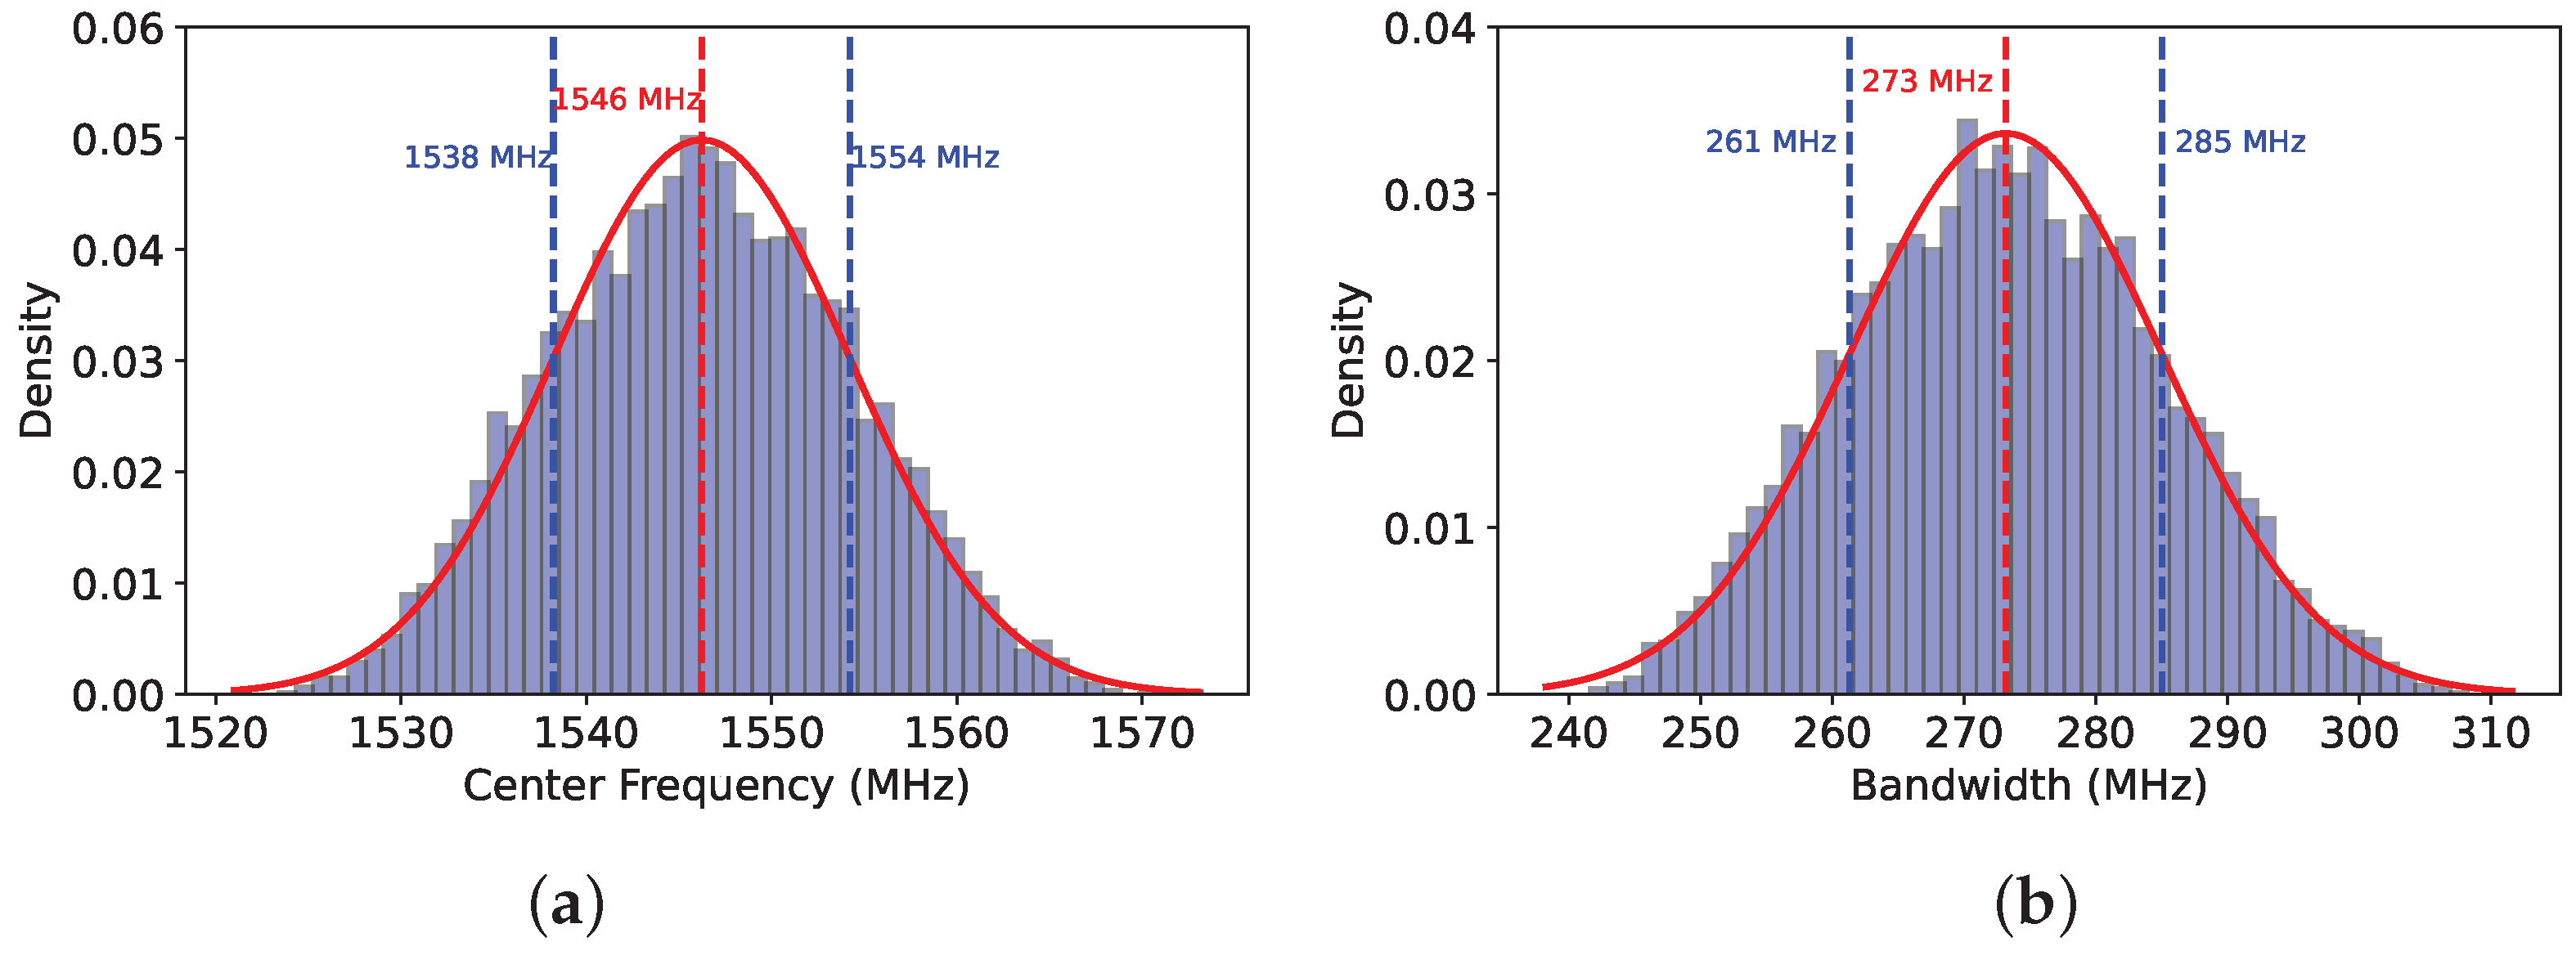
A total of 10,000 computer simulations were conducted, taking into account the random variation of 14 initial parameters within their tolerances, including both geometrical dimensions and material properties. A uniform distribution was assumed for each input parameter, and at the end of each simulation, the filter frequency response was analyzed. This analysis aimed to estimate the center frequency, the lower and upper cutoff frequencies, the bandwidth, the in-band attenuation, and the return loss. These output parameters were characterized by their own probability distribution, a mean value, and a standard deviation. It has been observed that such distributions are close to Gaussian. As evidence of this,
Figure 3 illustrates the histograms for the center frequency and bandwidth. These histograms closely align with the red Gaussian curve, representing the Gaussian function with the same mean and standard deviation as the data.
This analysis brings a more complete understanding of how manufacturing process tolerances might affect the final performance of the hairpin filter, thereby allowing the achievement of valuable insights for both design optimization and quality control.
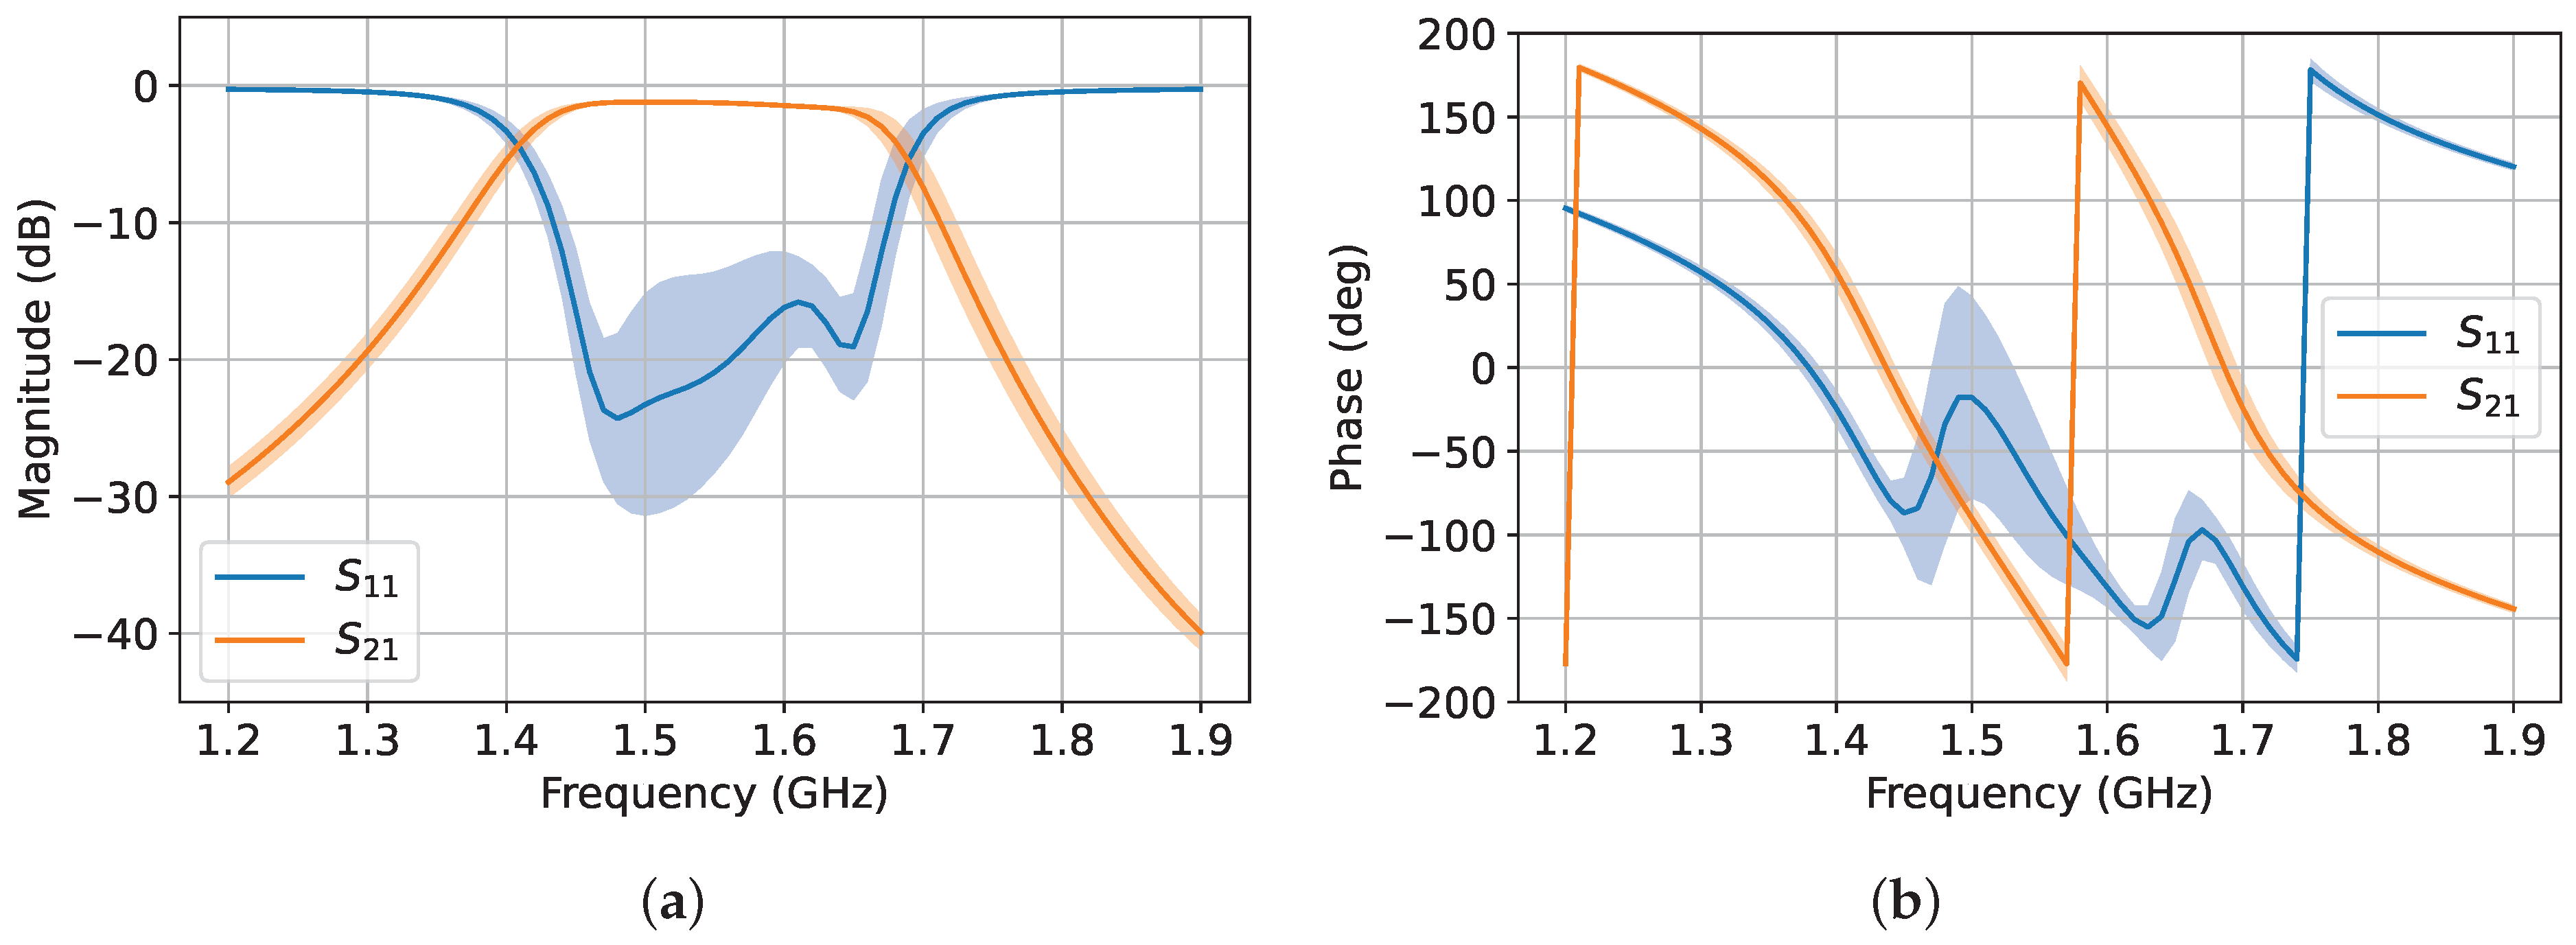
Figure 4 shows the average response (solid-colored lines) derived from 10,000 Monte Carlo simulations alongside the standard deviation (light-colored areas).
Table 2 displays the estimated filter parameters along with their corresponding uncertainties.
2.3. Filter Fabrication
Once the design was finalized, Gerber files were generated for the fabrication of the filter. Fabrication was performed by employing the V-One inkjet printer, produced by the Voltera company. The Voltera V-One is a desktop PCB printer designed for prototyping and assembling printed circuit boards and offers four key functions: printing conductive ink, drilling holes, dispensing solder paste, and reflow soldering components. It has been used in a wide range of applications, such as flexible electronics [
39] and sensor development [
40,
41,
42]. It has also been successfully used in microwave engineering for prototyping microwave devices, including microwave transducers [
6,
43] and antennas with operating frequencies up to 10 GHz [
44,
45,
46]. In the present work, the Voltera V-One inkjet printer was employed for the fabrication of the hairpin filter.
The printing process involved the use of a silver-based ink, a commercial ink distributed by the Voltera company [
47] that is characterized by a sheet resistance of 2.05 m (measured per square unit area), a 4-point-probe resistivity of
· m, and a density of 3.35 g/mL. The typical cured film thickness is 50 µm [
47]. The ink was deposited onto the commercial Rogers RO4003C substrate described above. It is worth noting that this substrate was already equipped with an electrodeposited copper foil on both sides, each with a thickness of 35 µm. One layer was removed, while the other served as the ground plane for the microstrip structure.
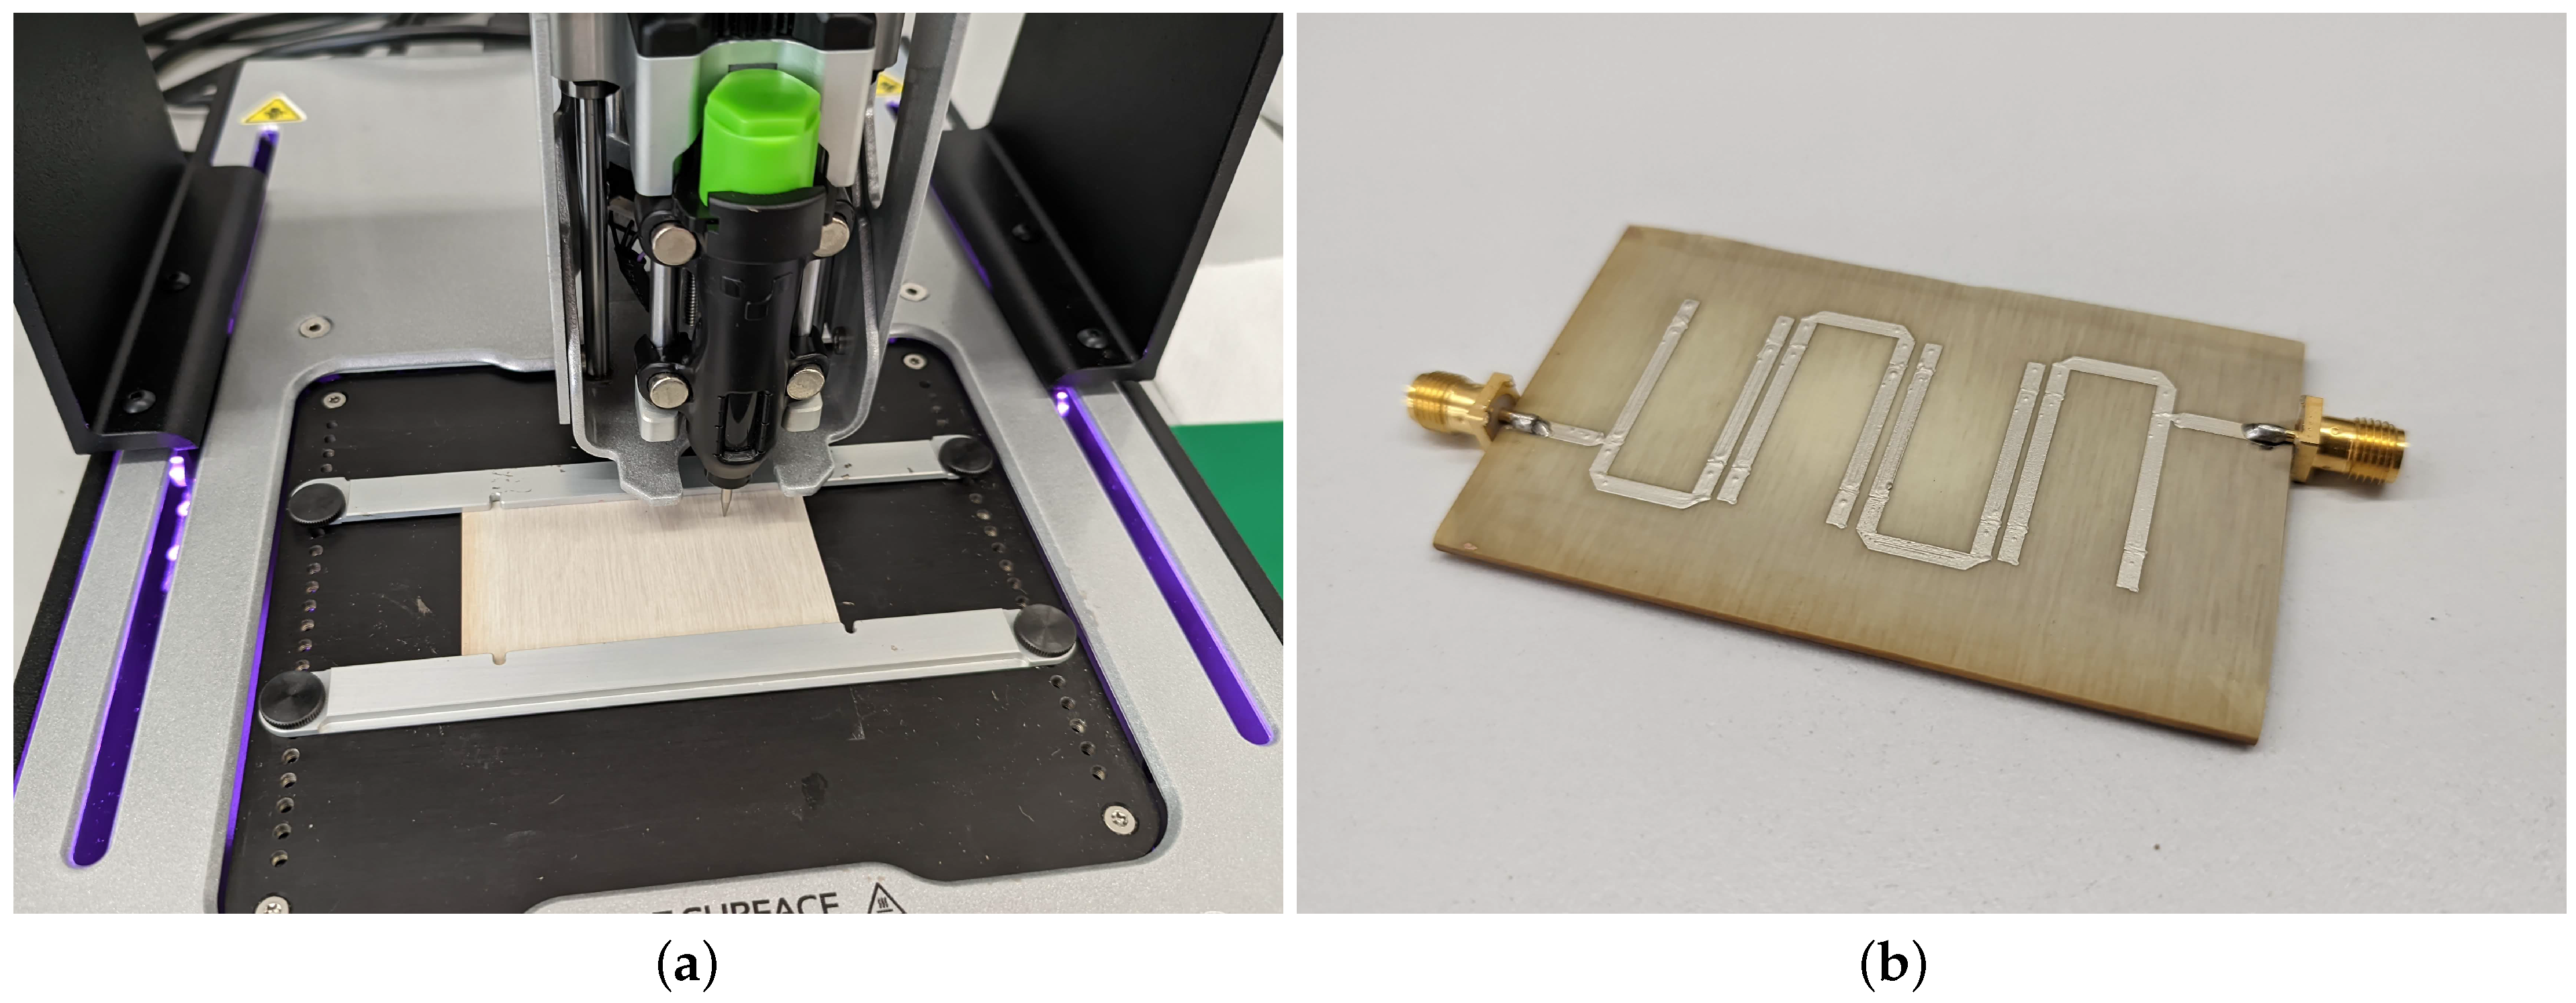
When manufacturing the inkjet-printed sensor, the uniformity and the accurate reproduction of the device geometry are of paramount importance. Given the geometry of the microstrip filter, any non-uniformity or imperfection in the printed structure can have a significant impact on its performance. The inkjet printing process, while versatile and cost effective, presents certain challenges in this regard. Imperfections can occur if printer settings are not optimally configured, which can be influenced by a variety of factors, including the specific resonator geometry, printer nozzle dimensions, the type of conductive ink used, and the characteristics of the substrate. To mitigate these potential inconsistencies, a thorough calibration procedure is performed prior to the start of the printing process. This calibration is performed using the RO4003C substrate, which is the same substrate employed for filter fabrication. In fact, it is critical to account for the inherent imperfect planarity of the substrate, which can introduce additional variability into the printing process. The calibration process involves adjusting several parameters of the inkjet printer to meet the specific requirements of the sensor design. This includes calibrating the printer for optimal deposition of the chosen conductive ink, ensuring that the nozzle height is set appropriately to accommodate the surface irregularities of the substrate, and adjusting the print speed and pattern to match the detailed resonator geometry. In addition, the quality of the print can be significantly affected by factors such as the condition of the ink and the environmental conditions during printing. For example, the viscosity of the ink can vary with temperature and humidity, affecting the uniformity of deposition. Therefore, careful monitoring and control of the printing environment are also essential parts of the calibration process. The goal of implementing this calibration procedure is to achieve the highest quality print results possible. In fact, minimizing non-uniformity in the resonator geometry is critical to ensuring that the fabricated sensor meets the desired specifications and exhibits a consistent performance. This calibration step is not just a preparatory measure, but is an integral part of the printing process that plays a critical role in the overall success of the inkjet printing process in producing reliable and repeatable electronic components.
After calibration, the conductive ink was applied to the top of the dielectric substrate by employing a polypropylene nozzle with an inner diameter of 0.23 mm. After the ink deposition, the board was subjected to a curing treatment. This involved heating the board in an oven at approximately 200 °C for 30 min. The curing process is essential to evaporate the solvent and start the chemical reactions necessary to convert the silver nanoparticles into a conductive matrix. According to Voltera, after curing, the ink exhibits copper-like properties up to frequencies of 5 GHz [
48]. Once cured, the board was polished and cleaned with isopropyl alcohol. Finally, to make possible the connection with the measurement instruments, two sub-miniature A (SMA) connectors were soldered to the board to act as input and output ports. This allowed subsequent connection to a vector network analyzer (VNA) for measuring the scattering parameters of the developed prototype. The photos of the printer during the calibration process and the prototype after curing are reported in
Figure 5.
3. Experimental Results and Discussion
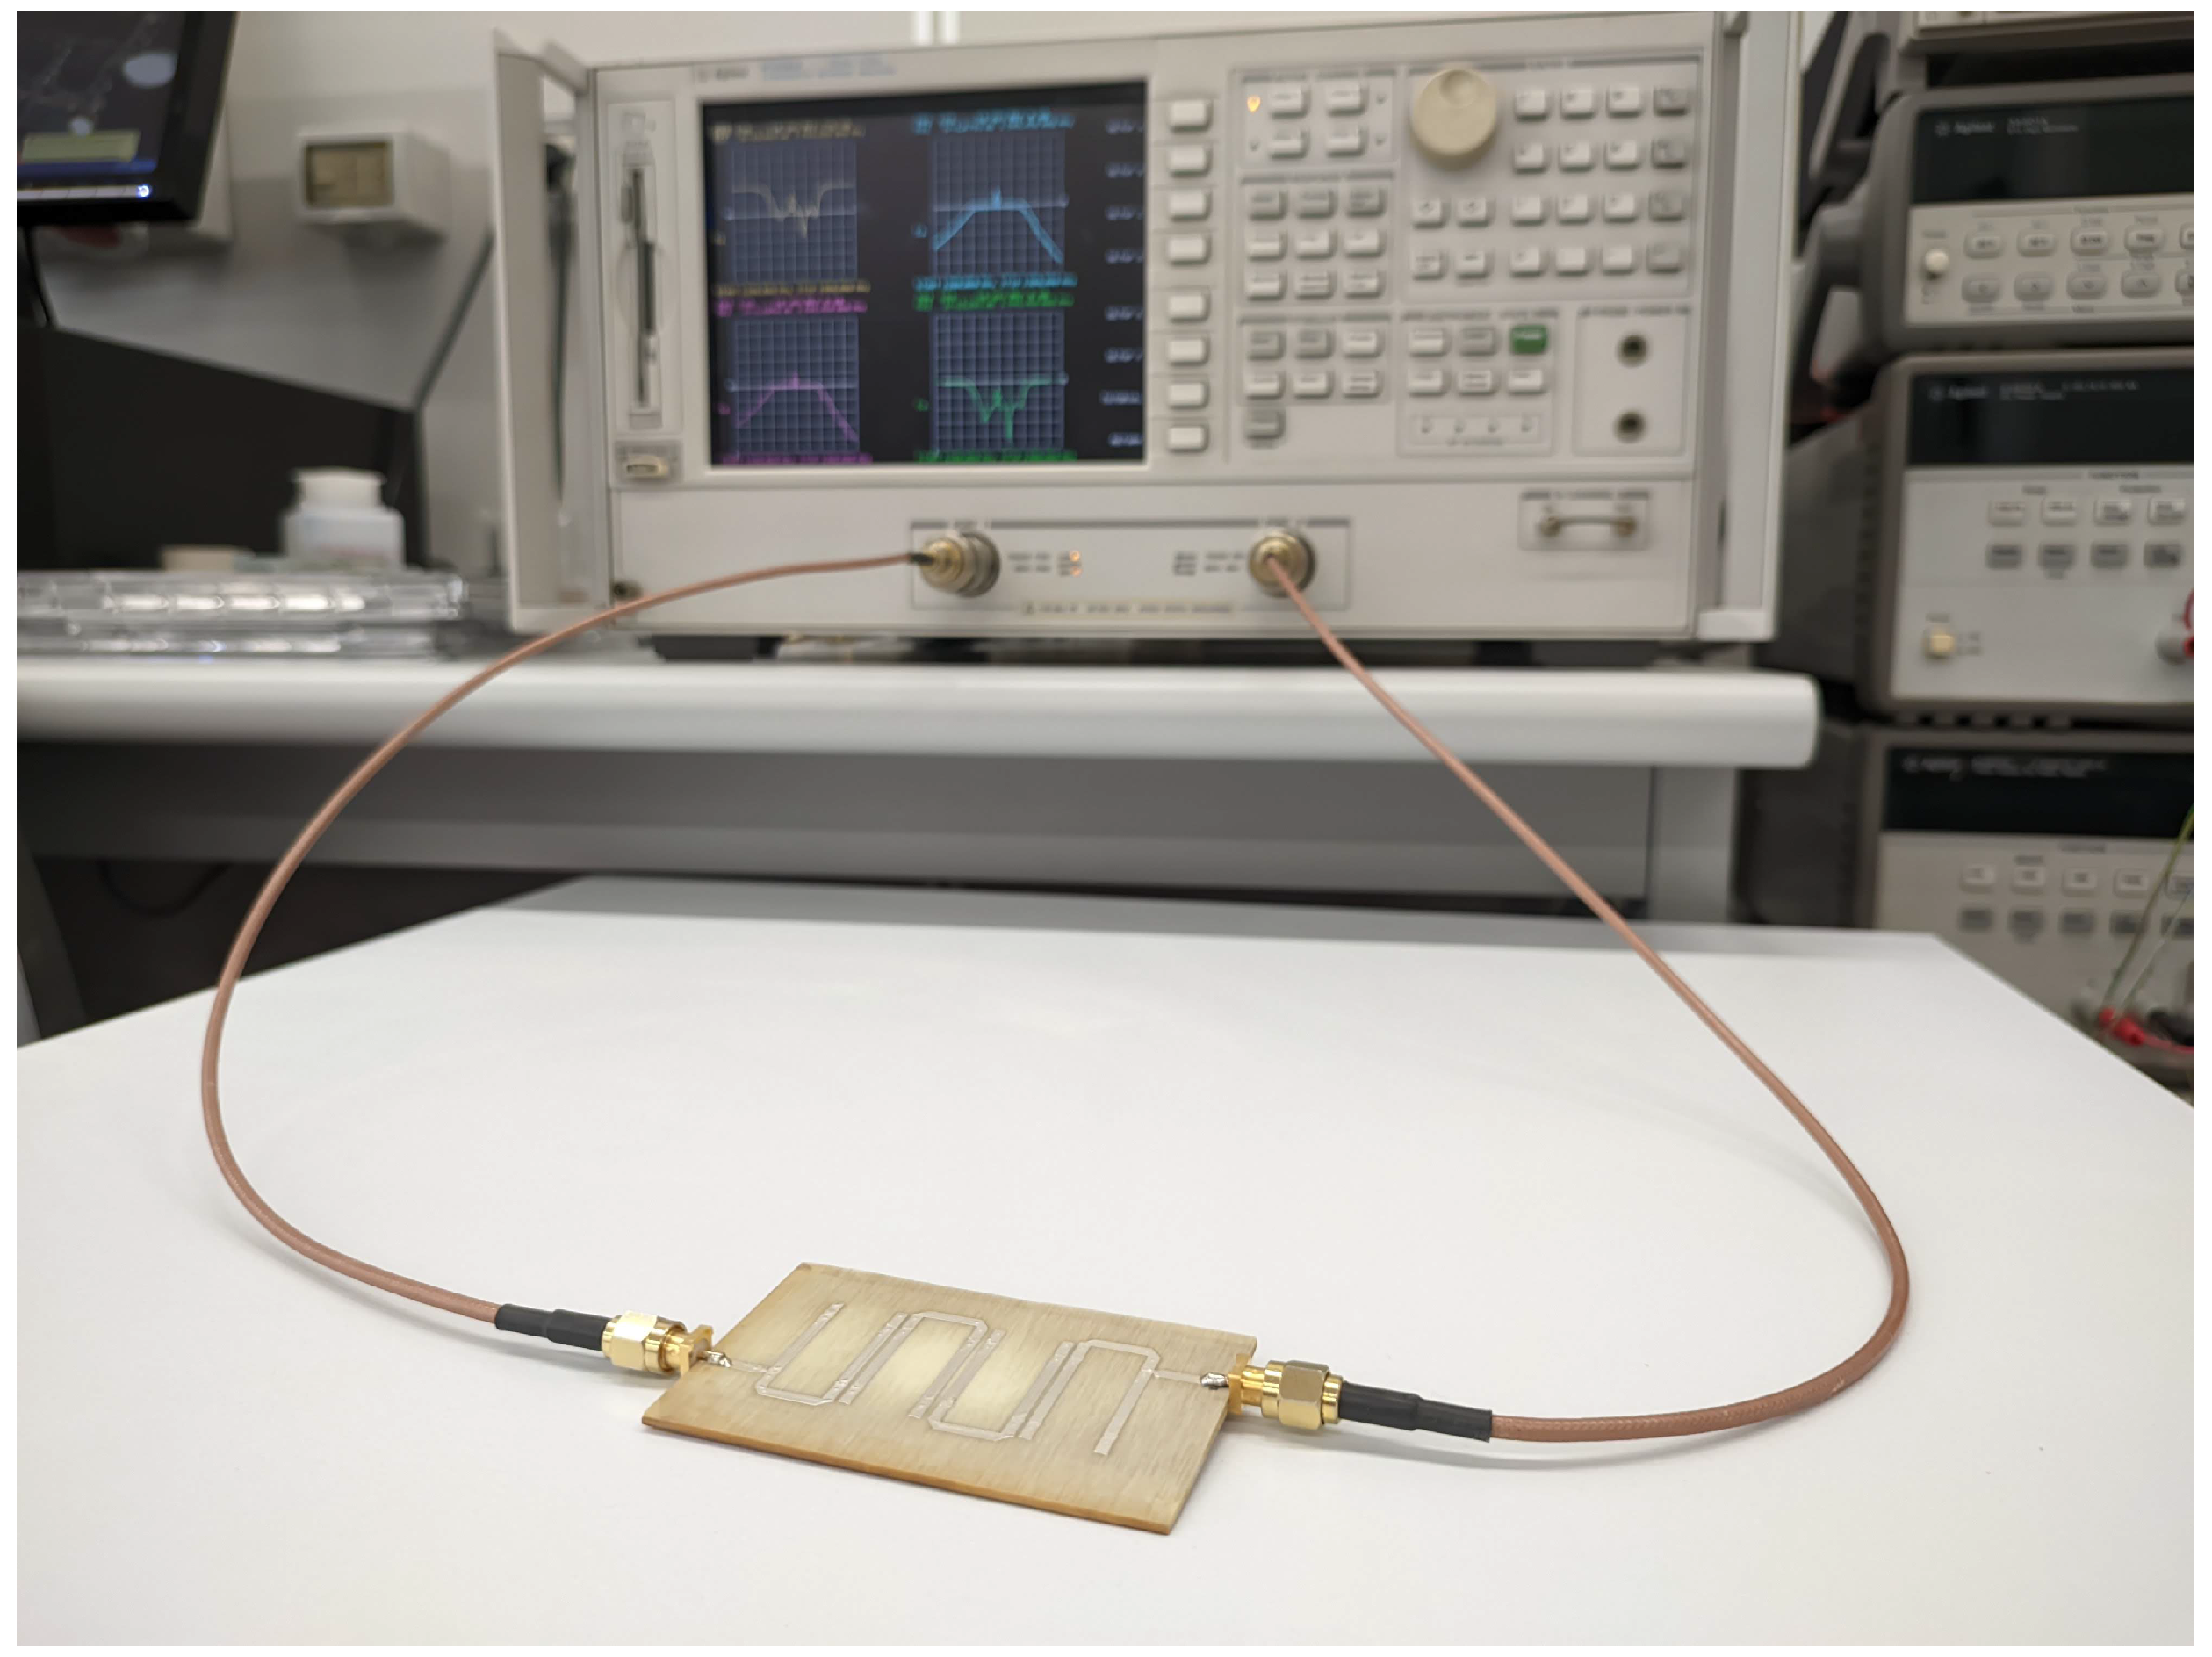
The performance of the fabricated hairpin filter was evaluated using the Agilent 8753ES VNA. The instrument was first calibrated using commercial coaxial short open load thru (SOLT) standards to shift the measurement planes at the edges of the device under testing and compensate for the cable contribution. The prototype was then connected to the VNA using two 50-
coaxial cables, as shown in
Figure 6, and the
parameters were acquired. The VNA was set to acquire 1601 points in a frequency range from 1.20 GHz to 1.90 GHz, the same band considered for simulations during the design process. The intermediate frequency (IF) was set to 1000 Hz and the source power of the VNA was set to 0 dBm.
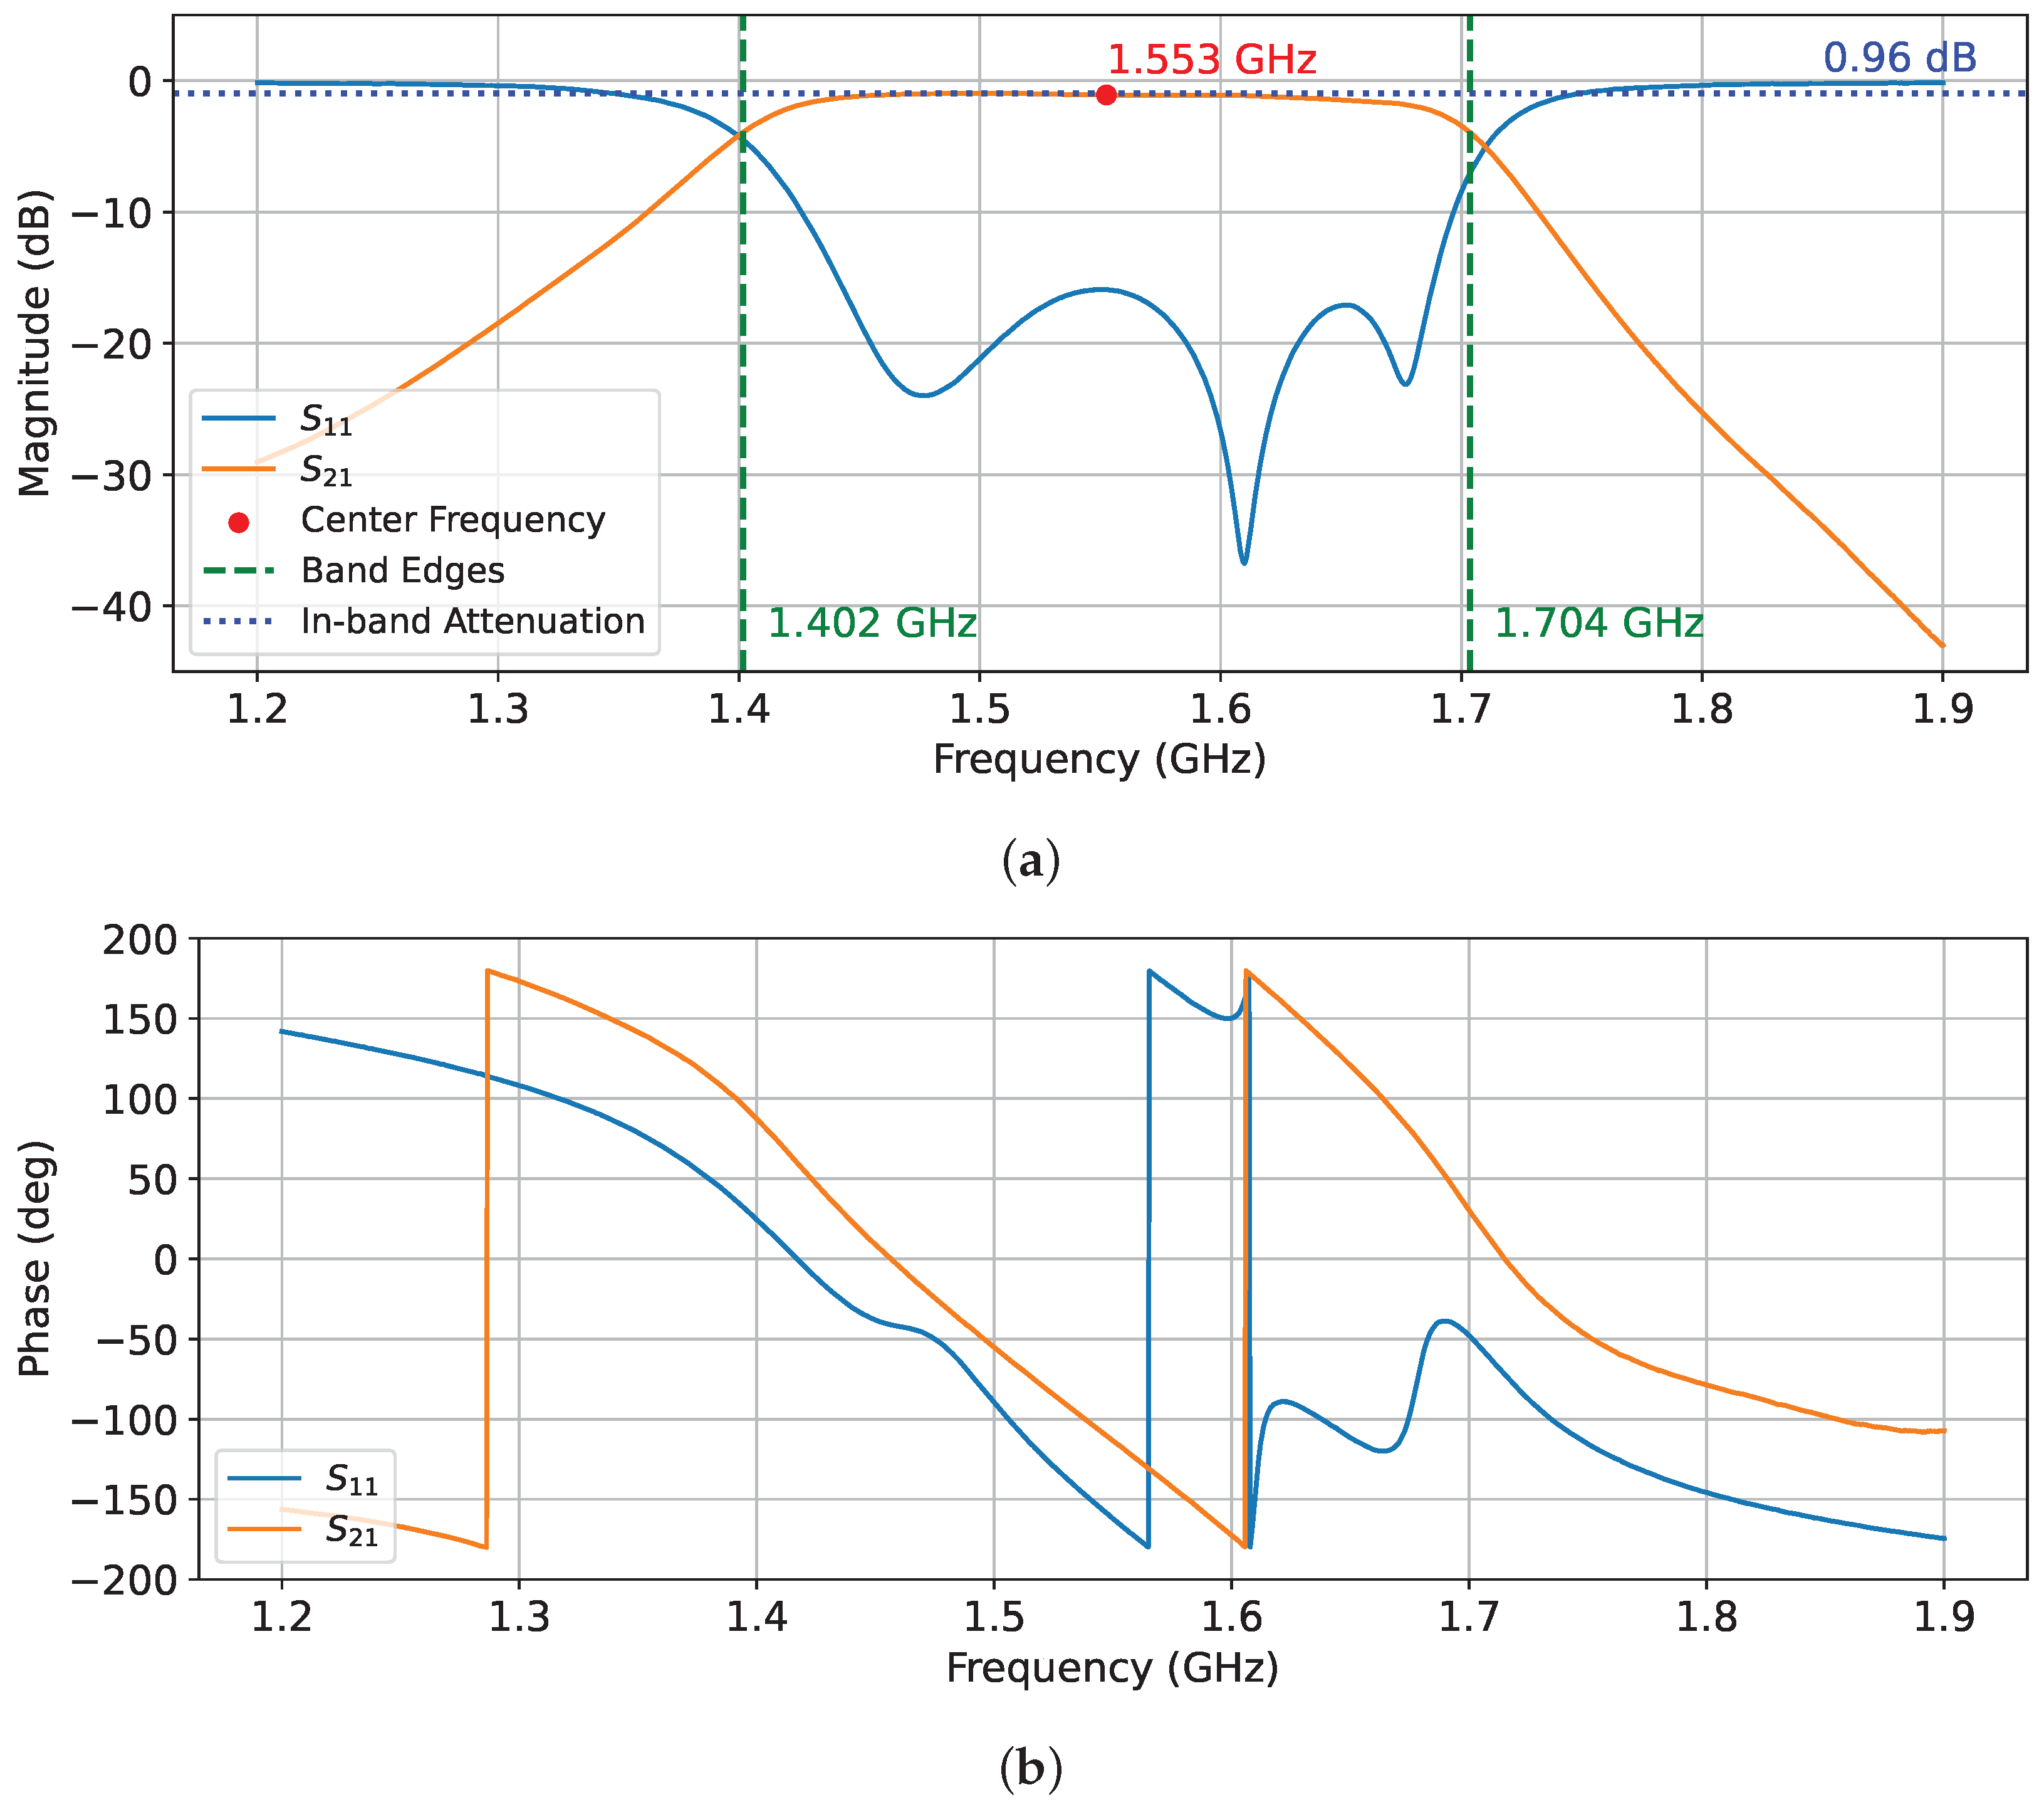
Figure 7 shows the response of the hairpin filter in terms of
and
. The filter parameters (e.g., center frequency, bandwidth, in-band attenuation, and in-band return loss) were measured from the acquired
parameters along with their measurement uncertainties. It should be noted that only the uncertainty contribution from the VNA was considered here (i.e., Type B uncertainty,
). The developed filter is characterized by a center frequency of (
) MHz and a bandwidth of (
) MHz. In the passband, the insertion loss was evaluated to be (
) dB with a return loss better than (
) dB over the entire frequency band of interest. All measured parameter values are given in
Table 3. These values appear to be in good agreement with the parameter values estimated from computer simulations (see
Table 2).
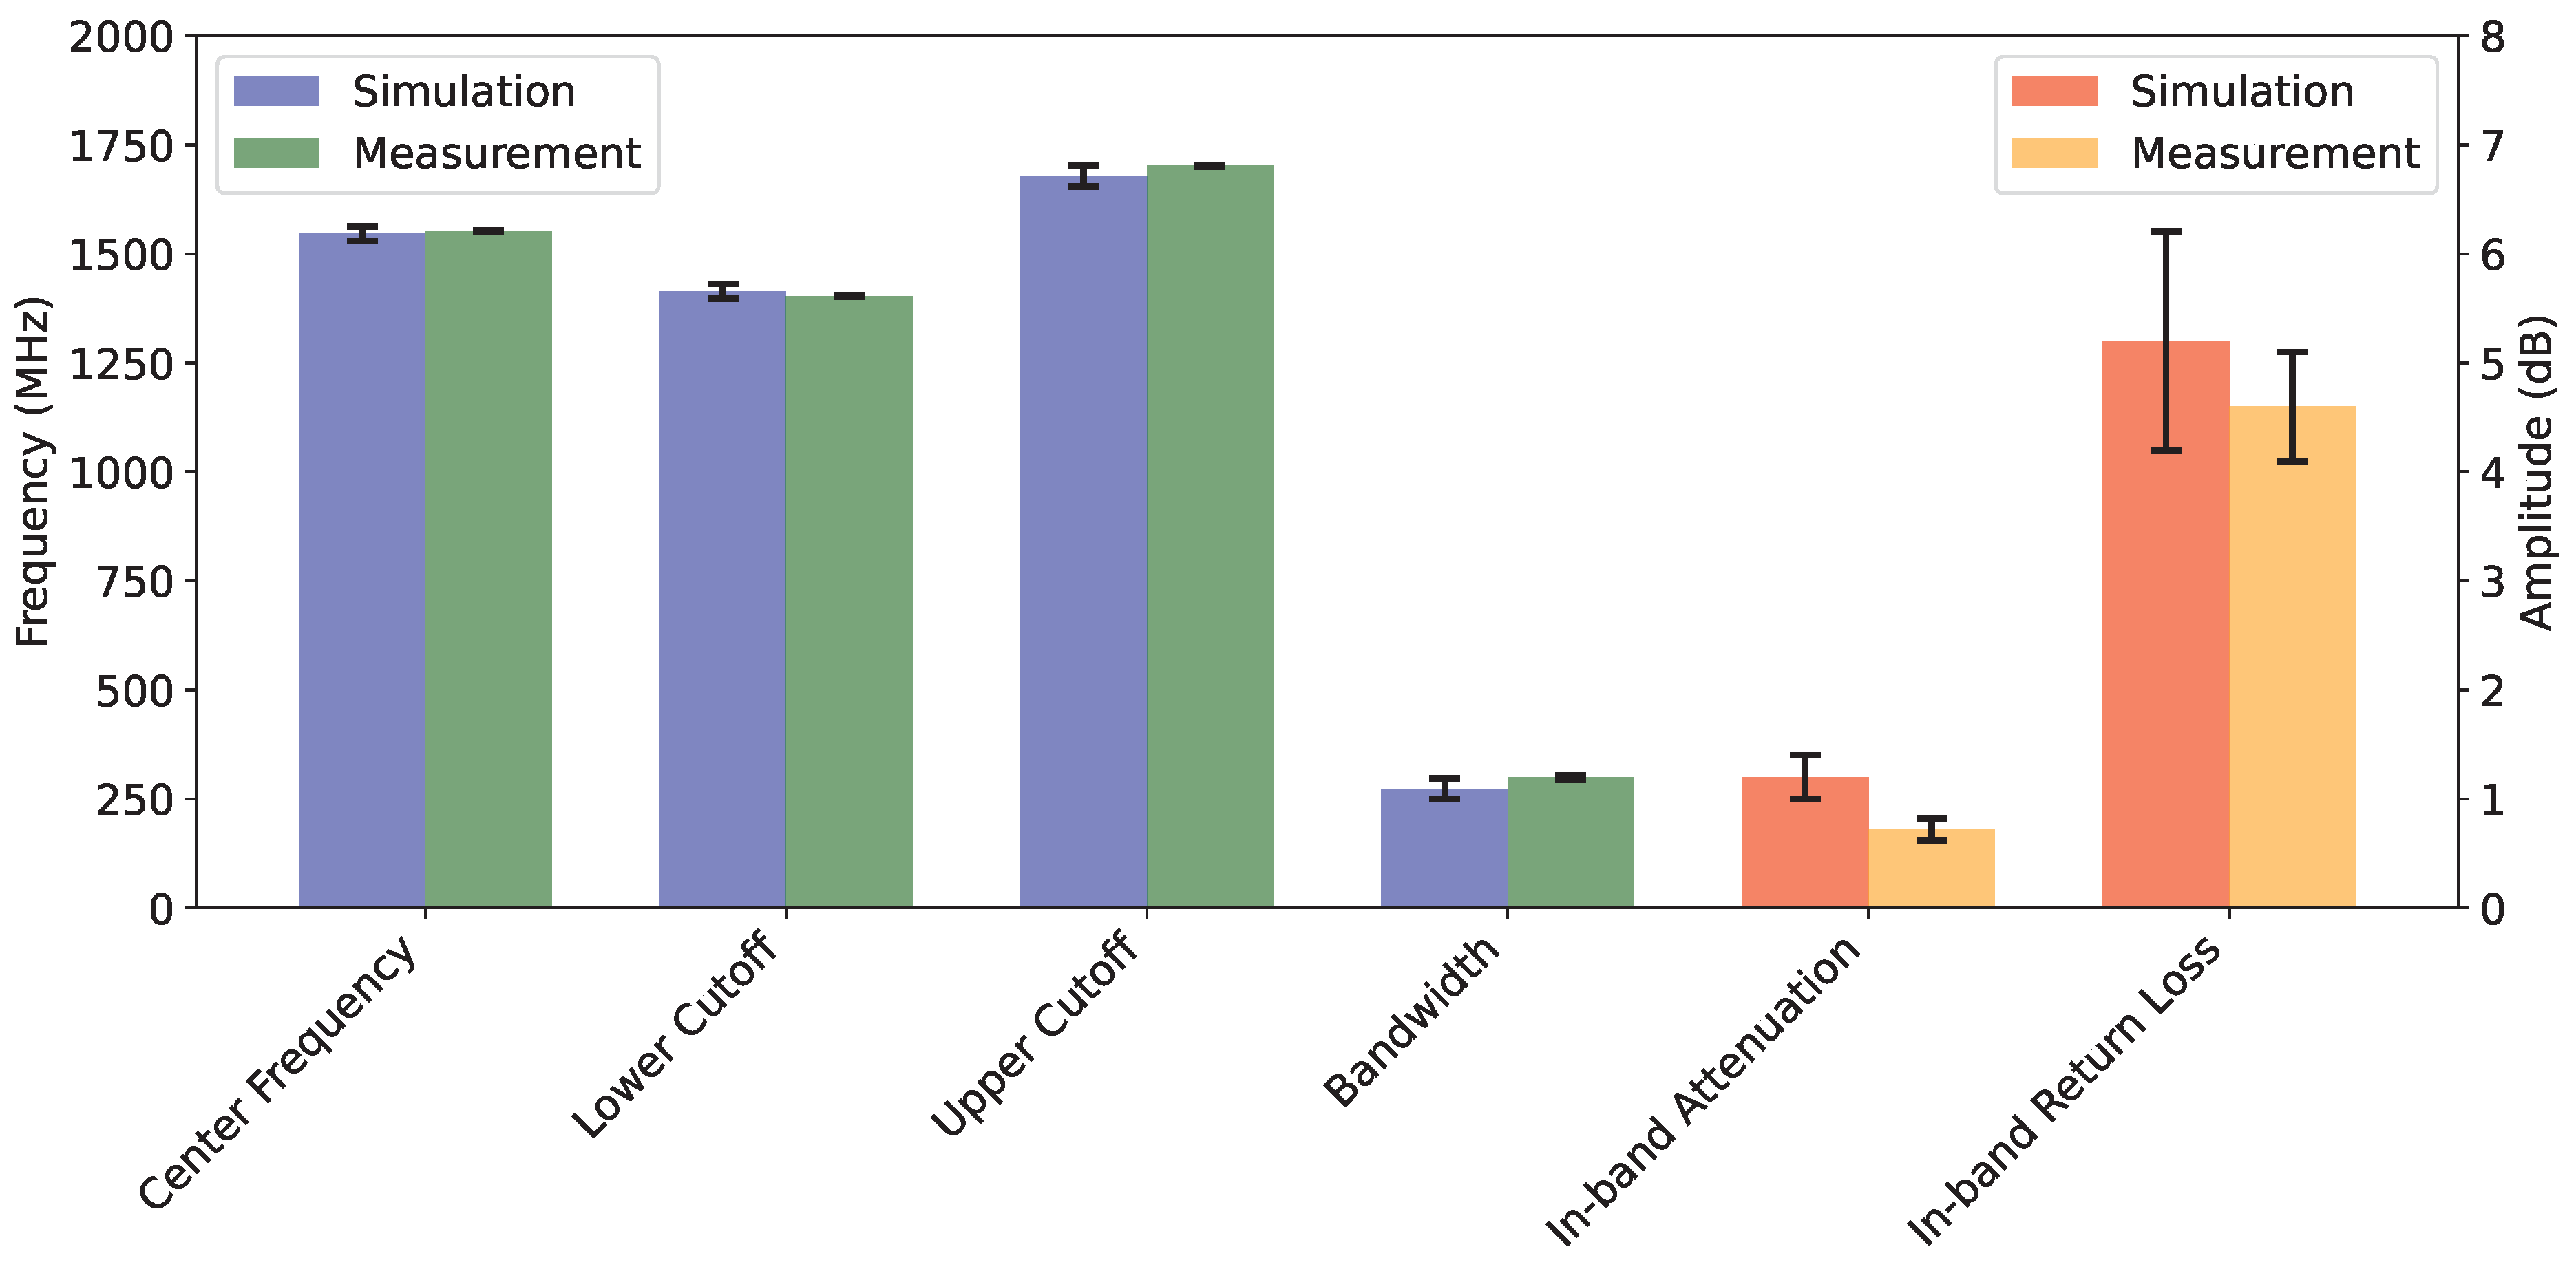
In examining the performance of the fabricated hairpin filter, a comparison between the simulation results and the actual measurements can provide interesting insights. In particular, while the center frequency of the fabricated filter, measured at (1552.7 ± 1.0) MHz, closely matched the simulated value (i.e., (1546 ± 17) MHz), a small deviation was observed in the bandwidth. The measured bandwidth of (299 ± 5) MHz slightly exceeded the simulated prediction of (273 ± 24) MHz. This discrepancy might be attributed to additional uncertainty contributions in the fabrication process, beyond printer resolution and tolerances in material properties (e.g., dielectric properties of the substrate and electrical properties of the ink). These include post-print trace spread, which is highly dependent on ink conditions, and printer setup, making it difficult to evaluate accurately. This factor was not investigated in the present study. It is worth noting that the employed ink data sheet reports a maximum trace spread after printing of 20 % [
47], which is a rather large value.
In addition, the return loss in the passband, evaluated at (4.6 ± 0.5) dB, showed good agreement with the simulated data (i.e., (5 ± 1) dB), underscoring the effectiveness of the design approach. However, the in-band attenuation (i.e., the insertion loss) showed a slight discrepancy (i.e., () dB in simulations and () dB in measurements) that suggests potential areas for refinement in both the simulation model and the manufacturing process.
These differences between the simulated and measured data underscore the complexities involved in translating theoretical designs into physical prototypes, particularly in the area of high-frequency filter design. The results highlight the need for iterative design processes in which simulation models are continually refined based on empirical data to achieve the optimal filter performance. The graphical representation in
Figure 8 provides a visual comparison of these parameters, illustrating the overlap and deviation between simulated and actual performance metrics.
4. Conclusions
This study has investigated the design, simulation, and fabrication of a band pass hairpin filter using inkjet printing technology, with a particular focus on the effect of fabrication tolerances on the final prototype performances. Through a Monte Carlo-based analysis and experimental measurements, the study has provided some insights into the capabilities and limitations of inkjet printing in the field of microstrip filter fabrication. In particular, the research demonstrated the potential of using inkjet printing for the design and development of microstrip bandpass hairpin filters. Computational tools were used for design and simulation, achieving a good degree of accuracy in matching theoretical evaluations with measurement results. However, the investigation also revealed several challenges inherent to the inkjet printing process. Limitations in print resolution and inconsistencies in material properties resulted in deviations from the simulated filter performance. These discrepancies highlight the need for further refinement of both the printing process and the simulation methods to improve the reliability and repeatability of this fabrication technique.
Future research will focus on performing a comprehensive statistical analysis to assess the impact of each fabrication-related variable on the performance of printed filters. This will involve a new Monte Carlo analysis aimed at accurately quantifying their effects and understanding the complex relationship between fabrication processes and device performance. Considering the rapid shift of the electronics industry towards printed organic technologies for the fabrication of various devices, ranging from transistors to sensors [
49,
50], the proposed methodology could be employed for a more comprehensive study of manufacturing tolerances and their impact on device performance. This would enable the optimization of the manufacturing process, resulting in devices with enhanced performance and reliability.
Moreover, a promising direction in filter fabrication is to explore alternative substrate materials such as alumina, which has a higher dielectric constant. Alumina is a material of great interest to the microwave industry, valued for its extremely low loss tangent, high electrical resistivity, exceptional heat resistance, and good thermal conductivity [
51]. The use of alumina could potentially lead to further miniaturization of the filter structure due to its ability to more effectively confine electromagnetic fields. However, this approach would also present new challenges; for instance, the compatibility of alumina with inkjet printing processes, particularly in terms of ink adhesion and resolution, requires thorough investigation.


 ,
, 


