

Production and Processing of the Radionuclide 76Br

Abstract
:1. Introduction
1.1. Motivation
1.2. 76Br
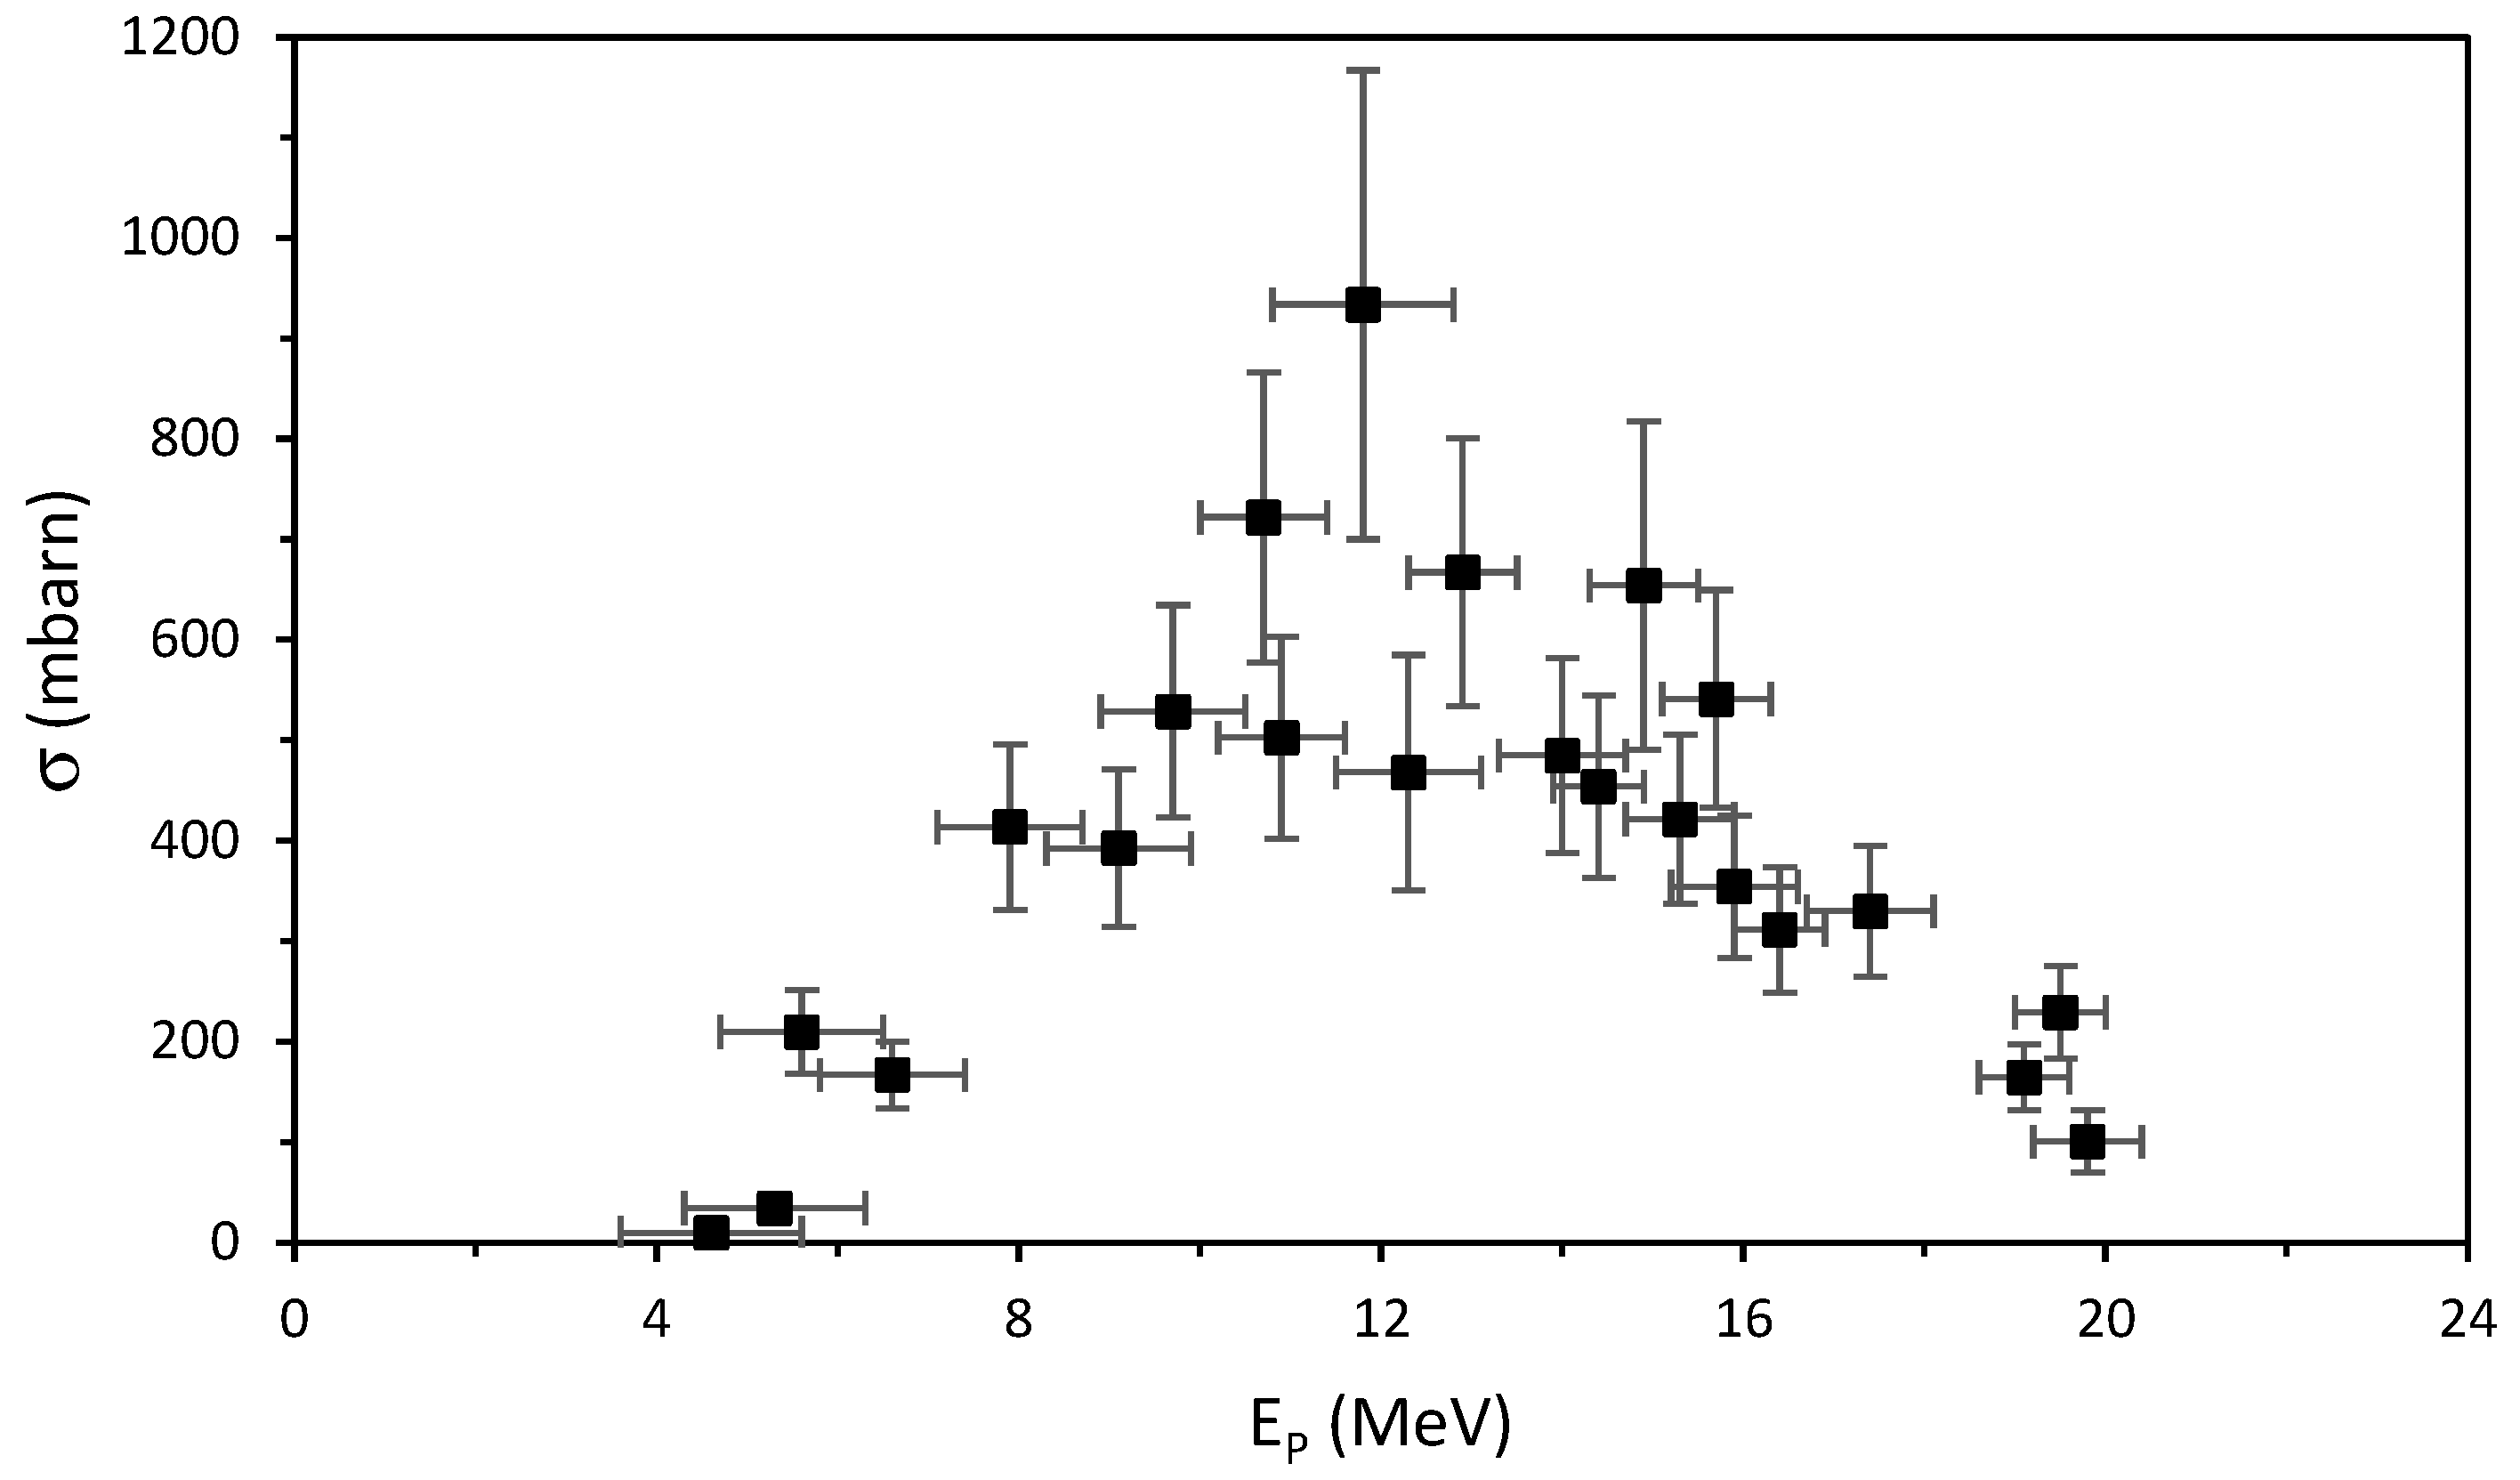
1.3. Cross Section and Targetry
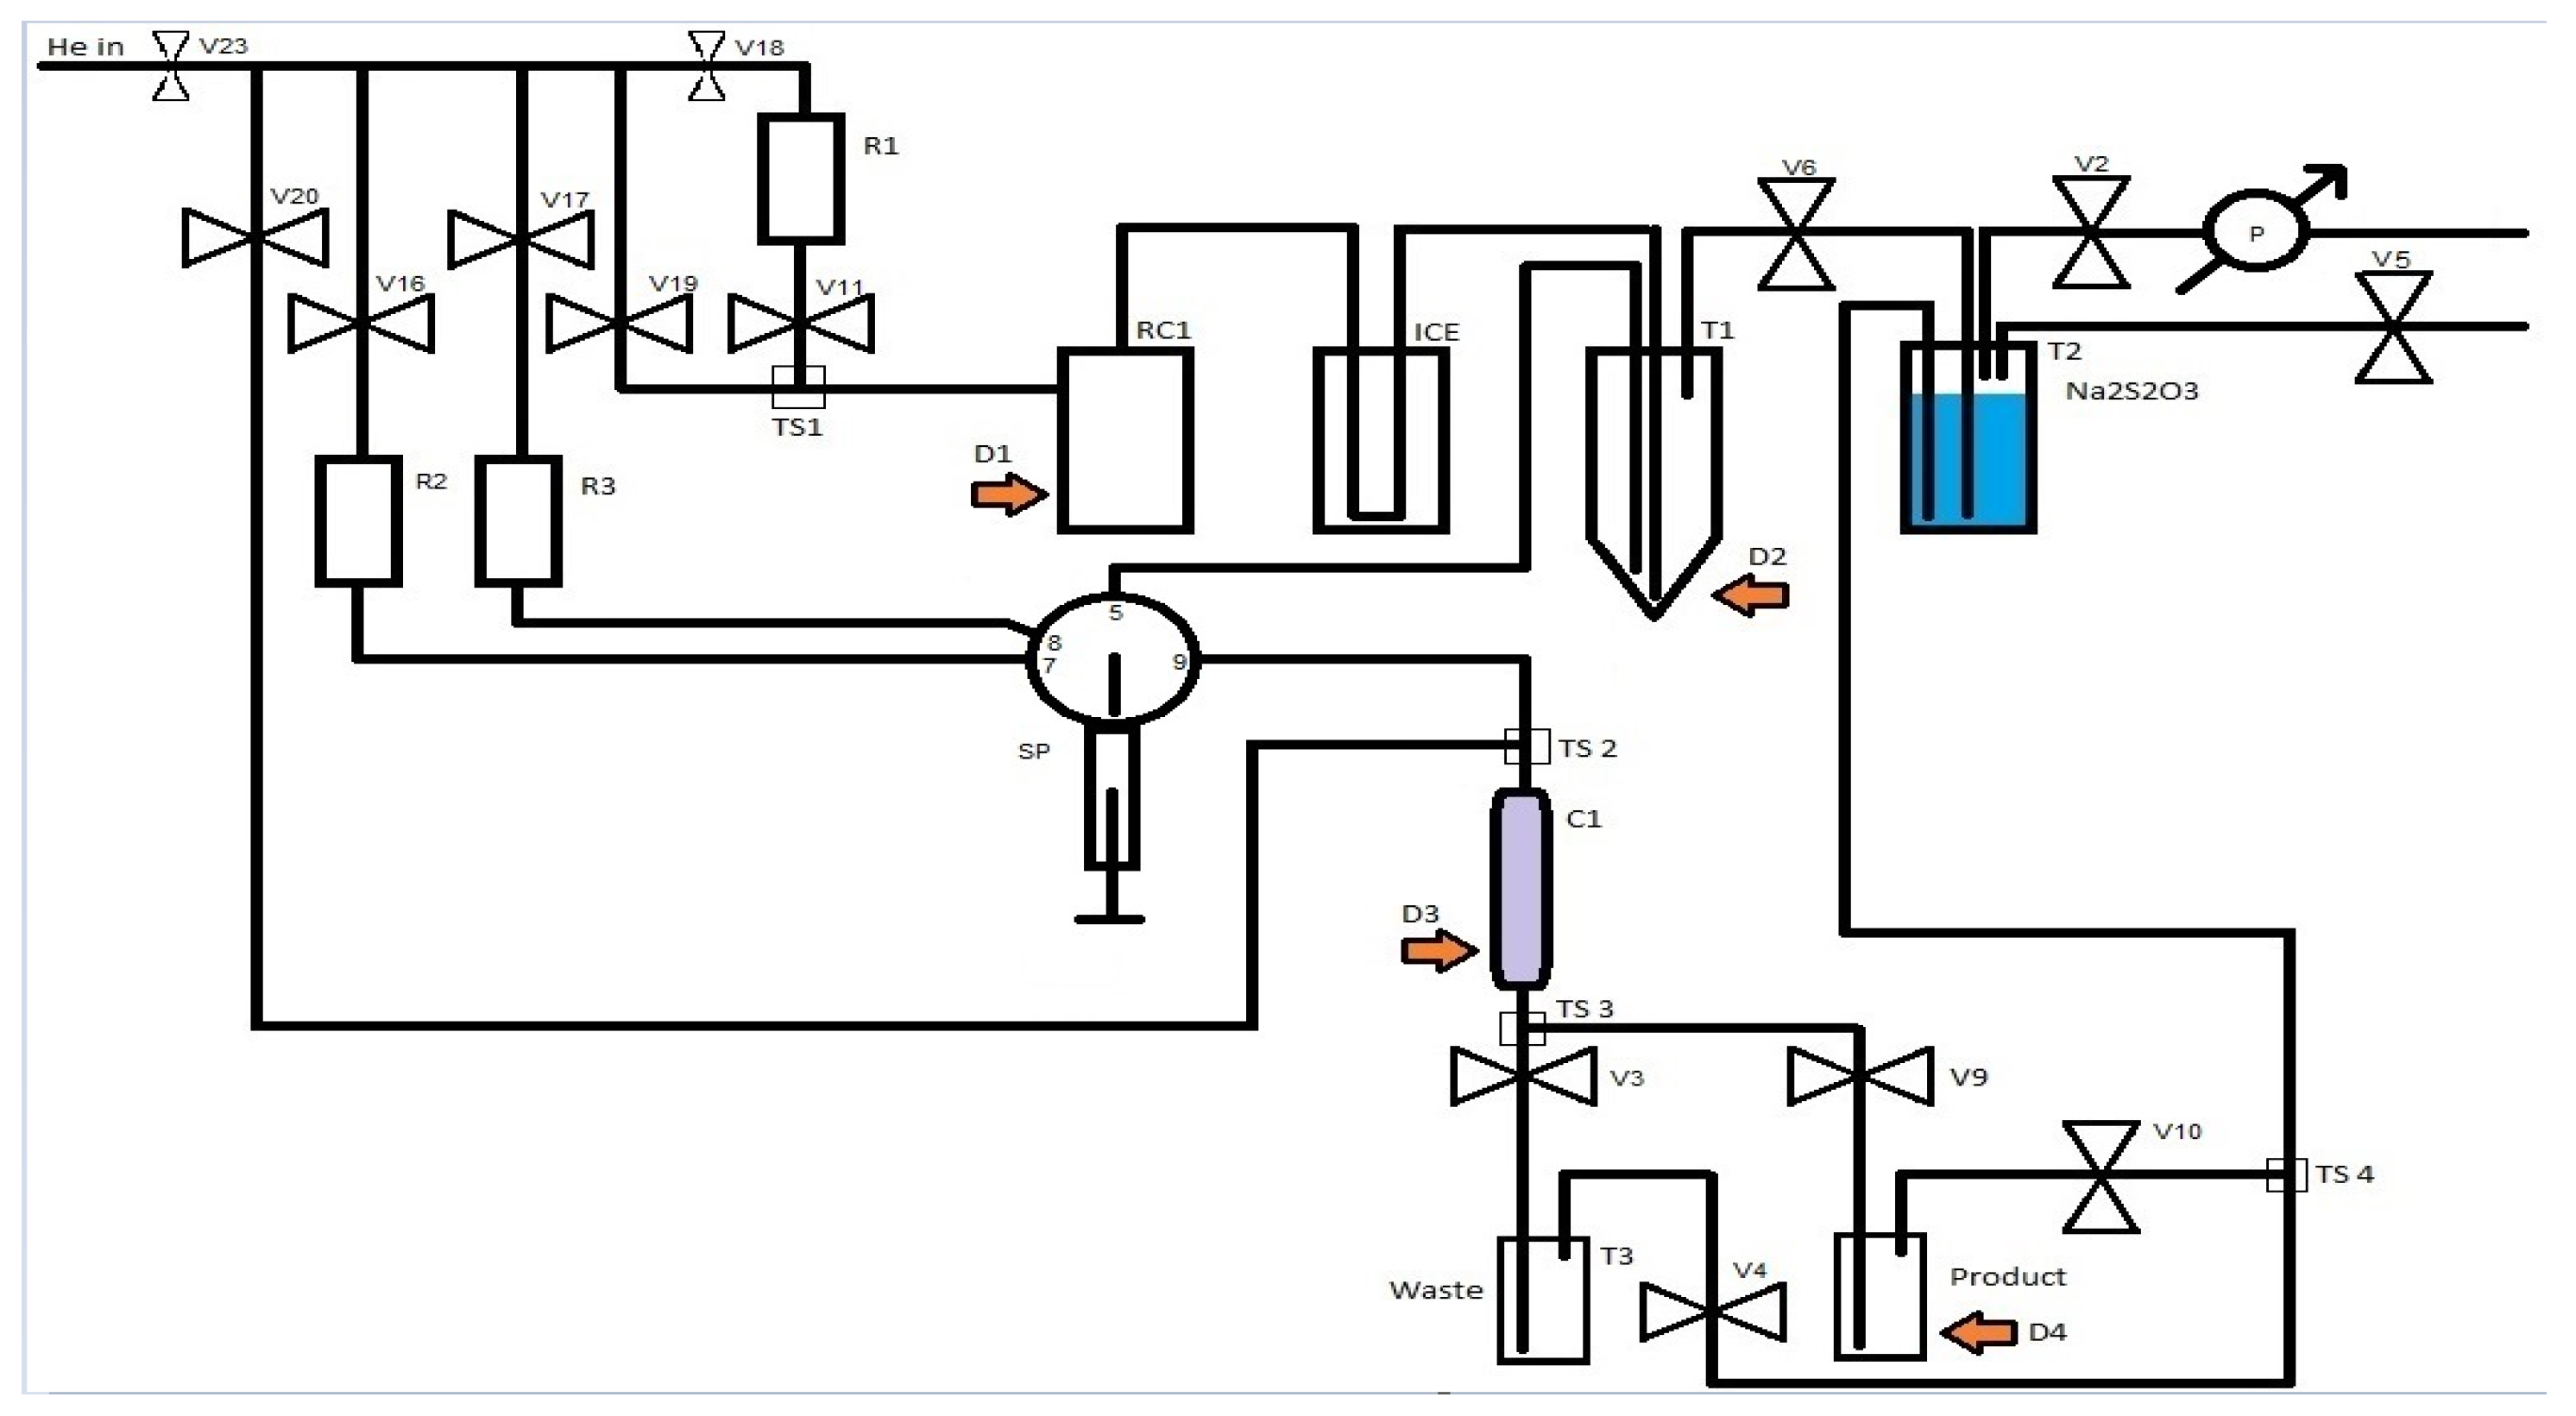
2. Materials and Methods
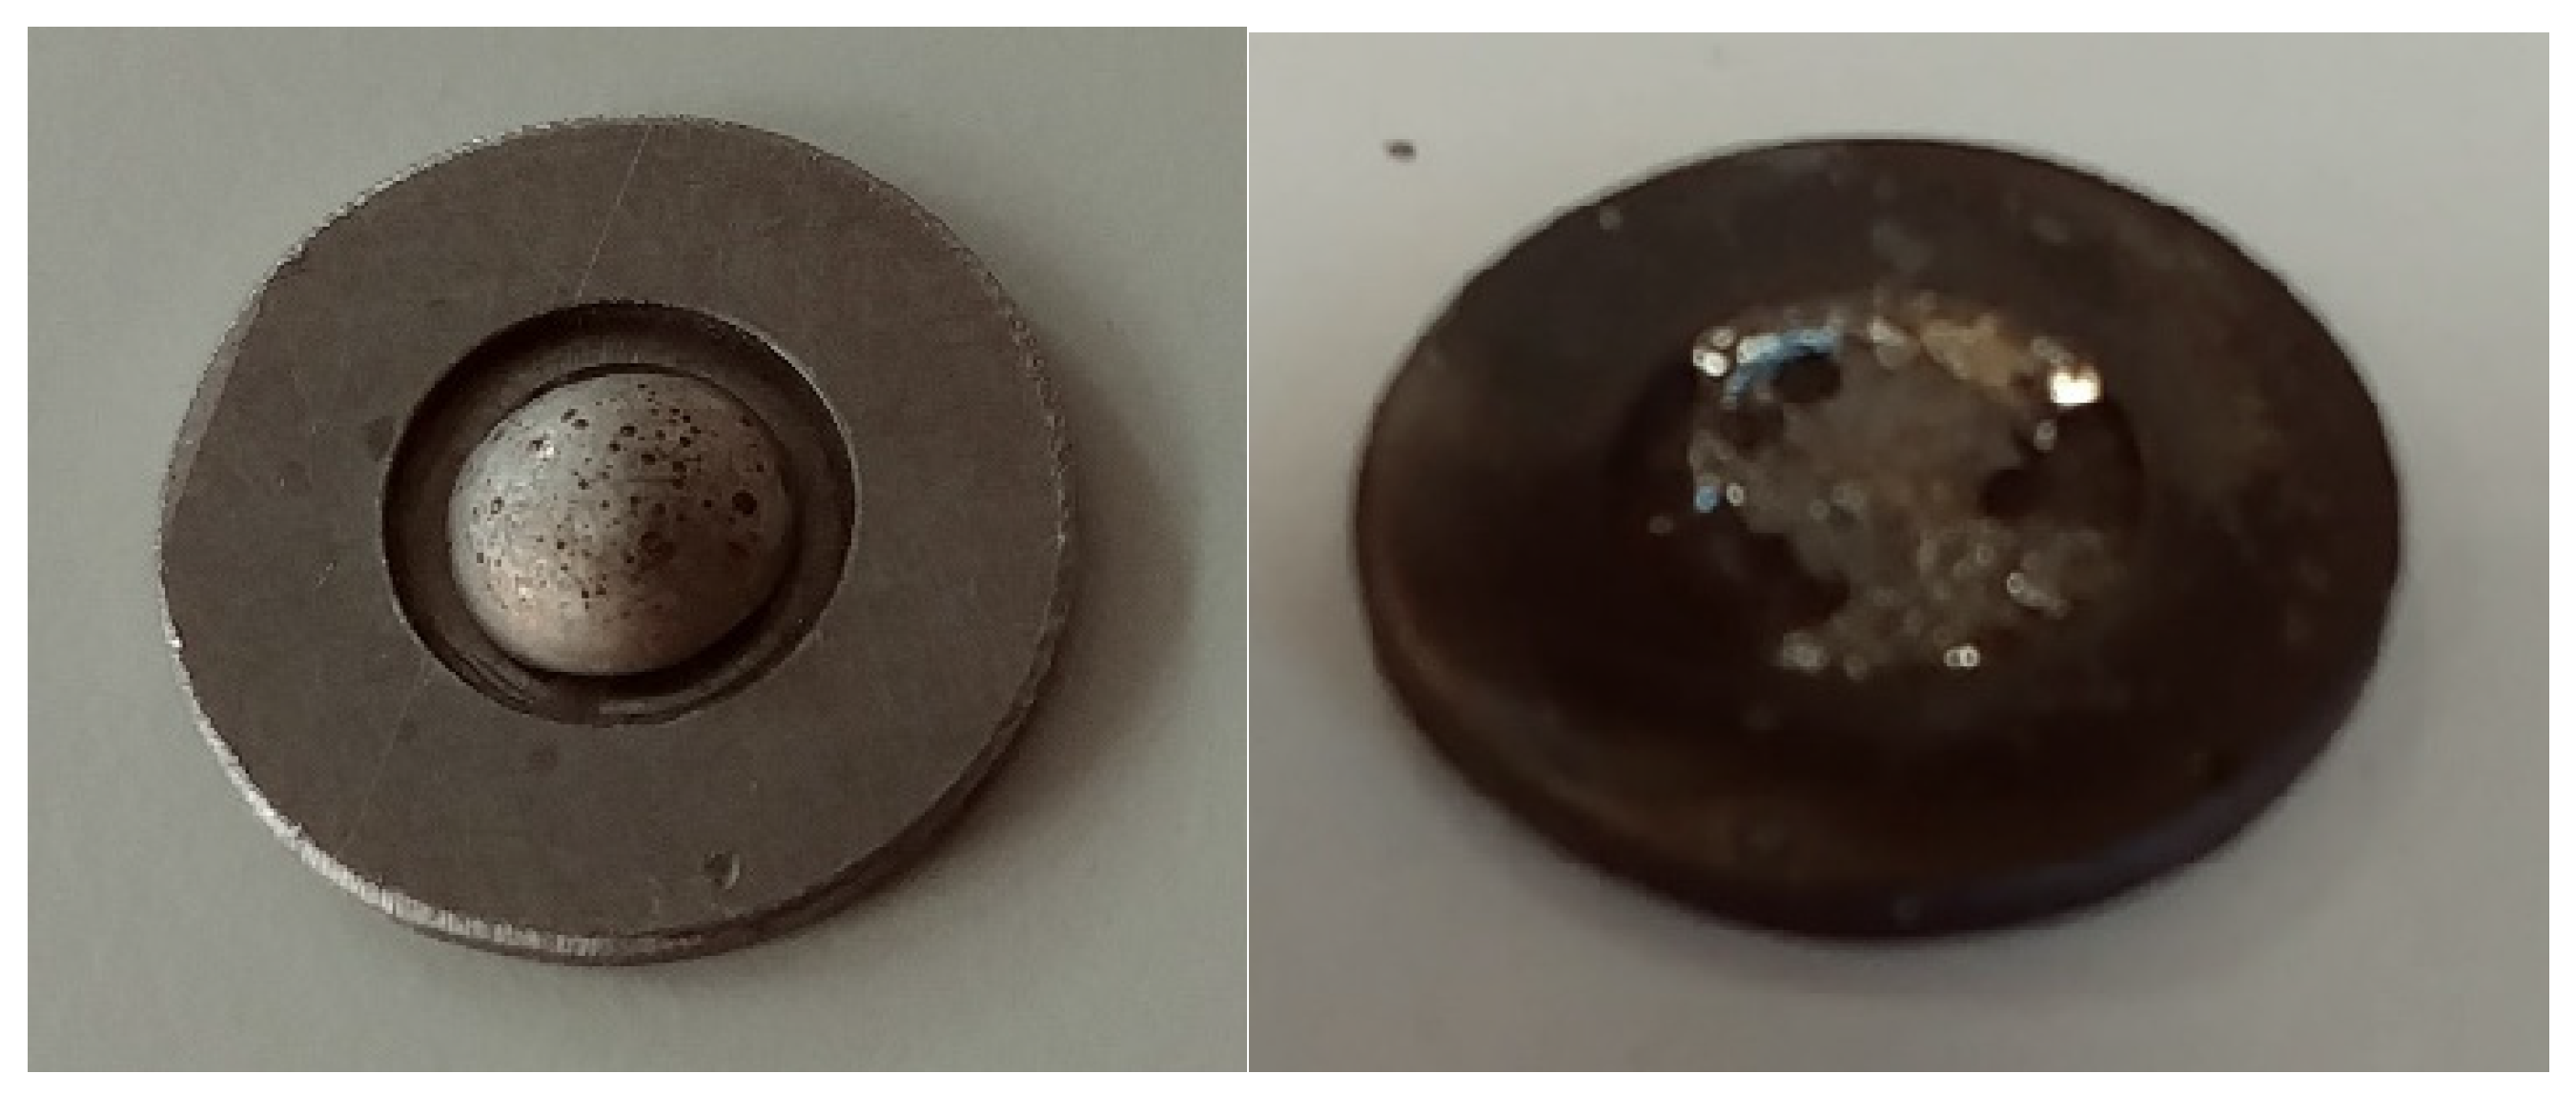
2.1. Target Material
2.2. Target Irradiation
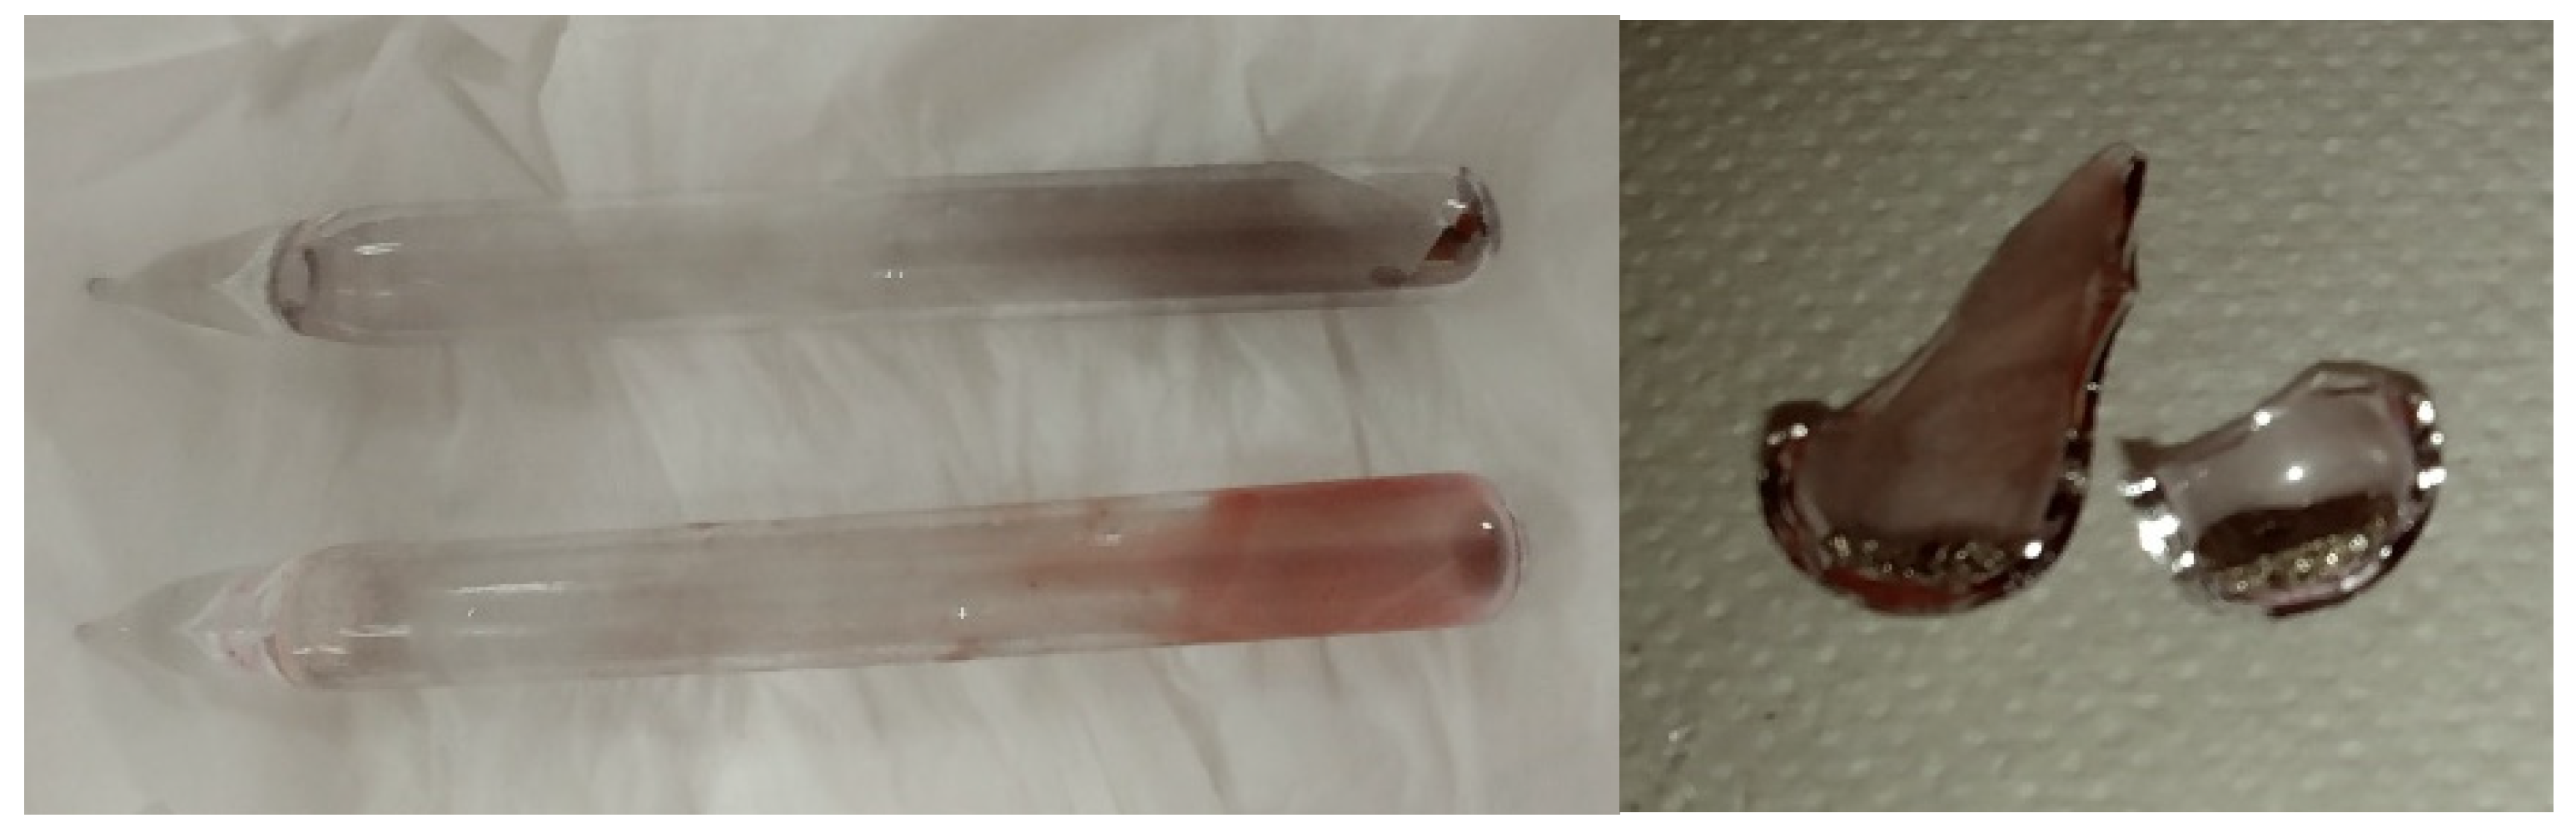
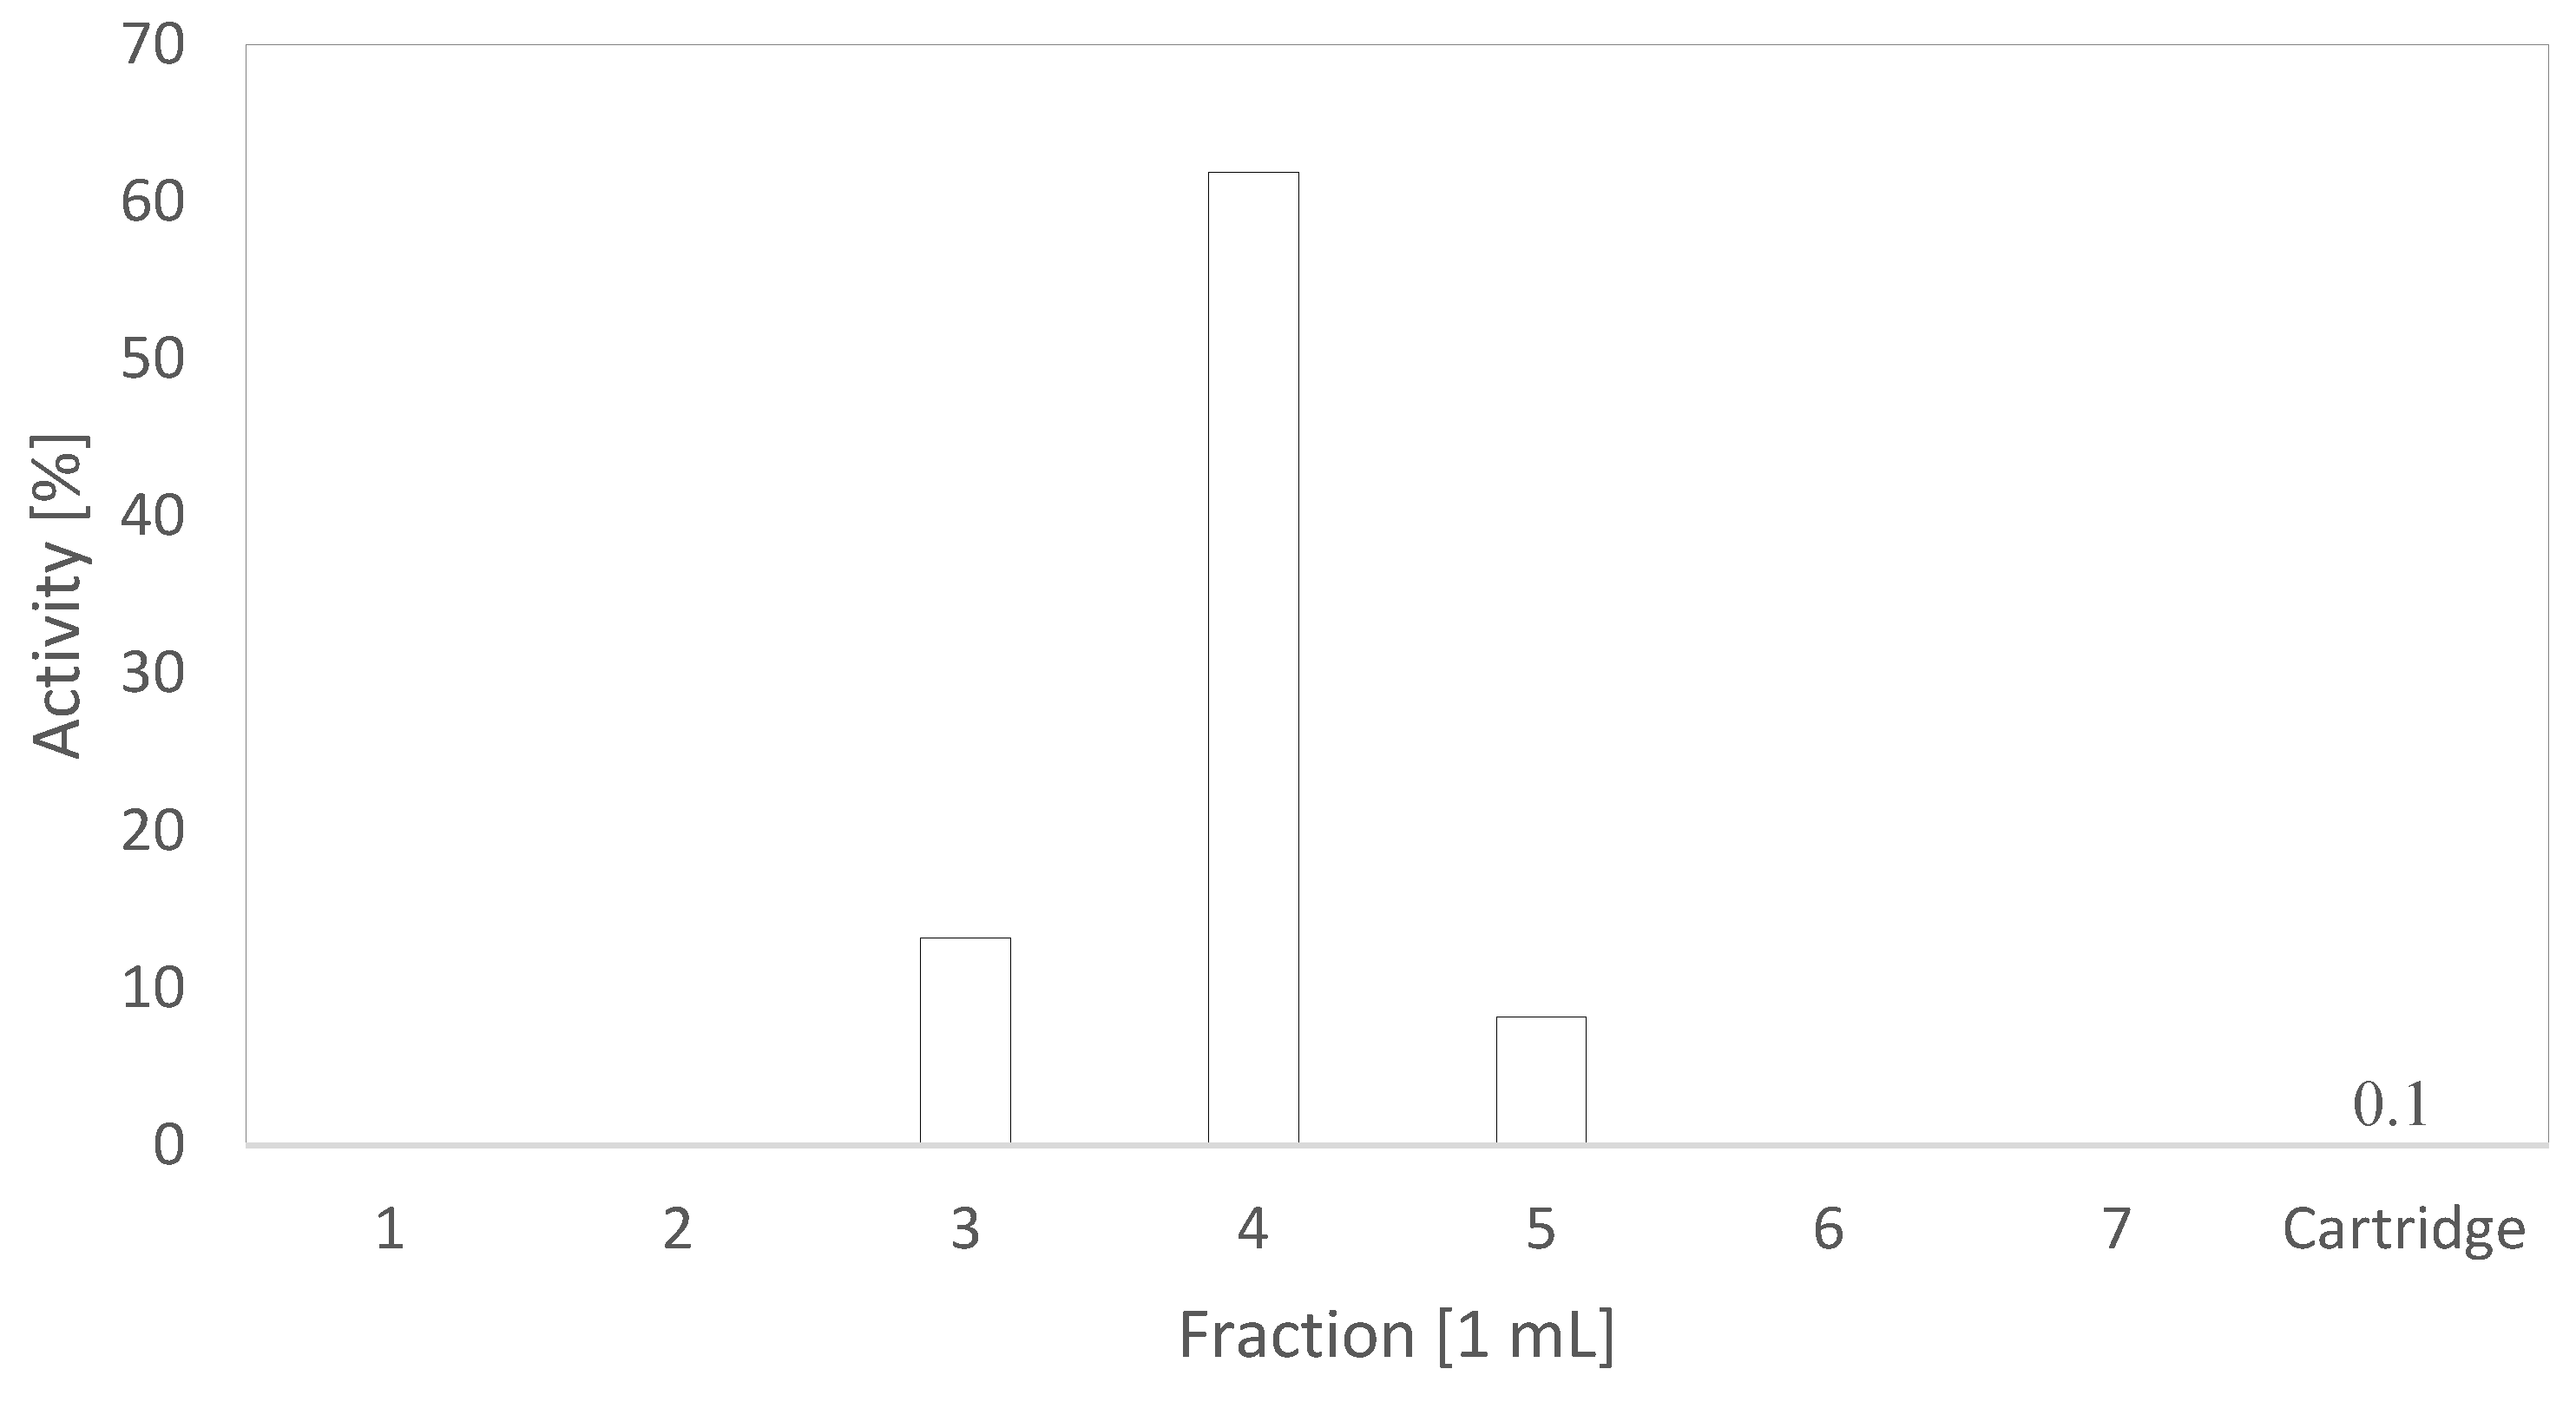
2.3. Target Processing
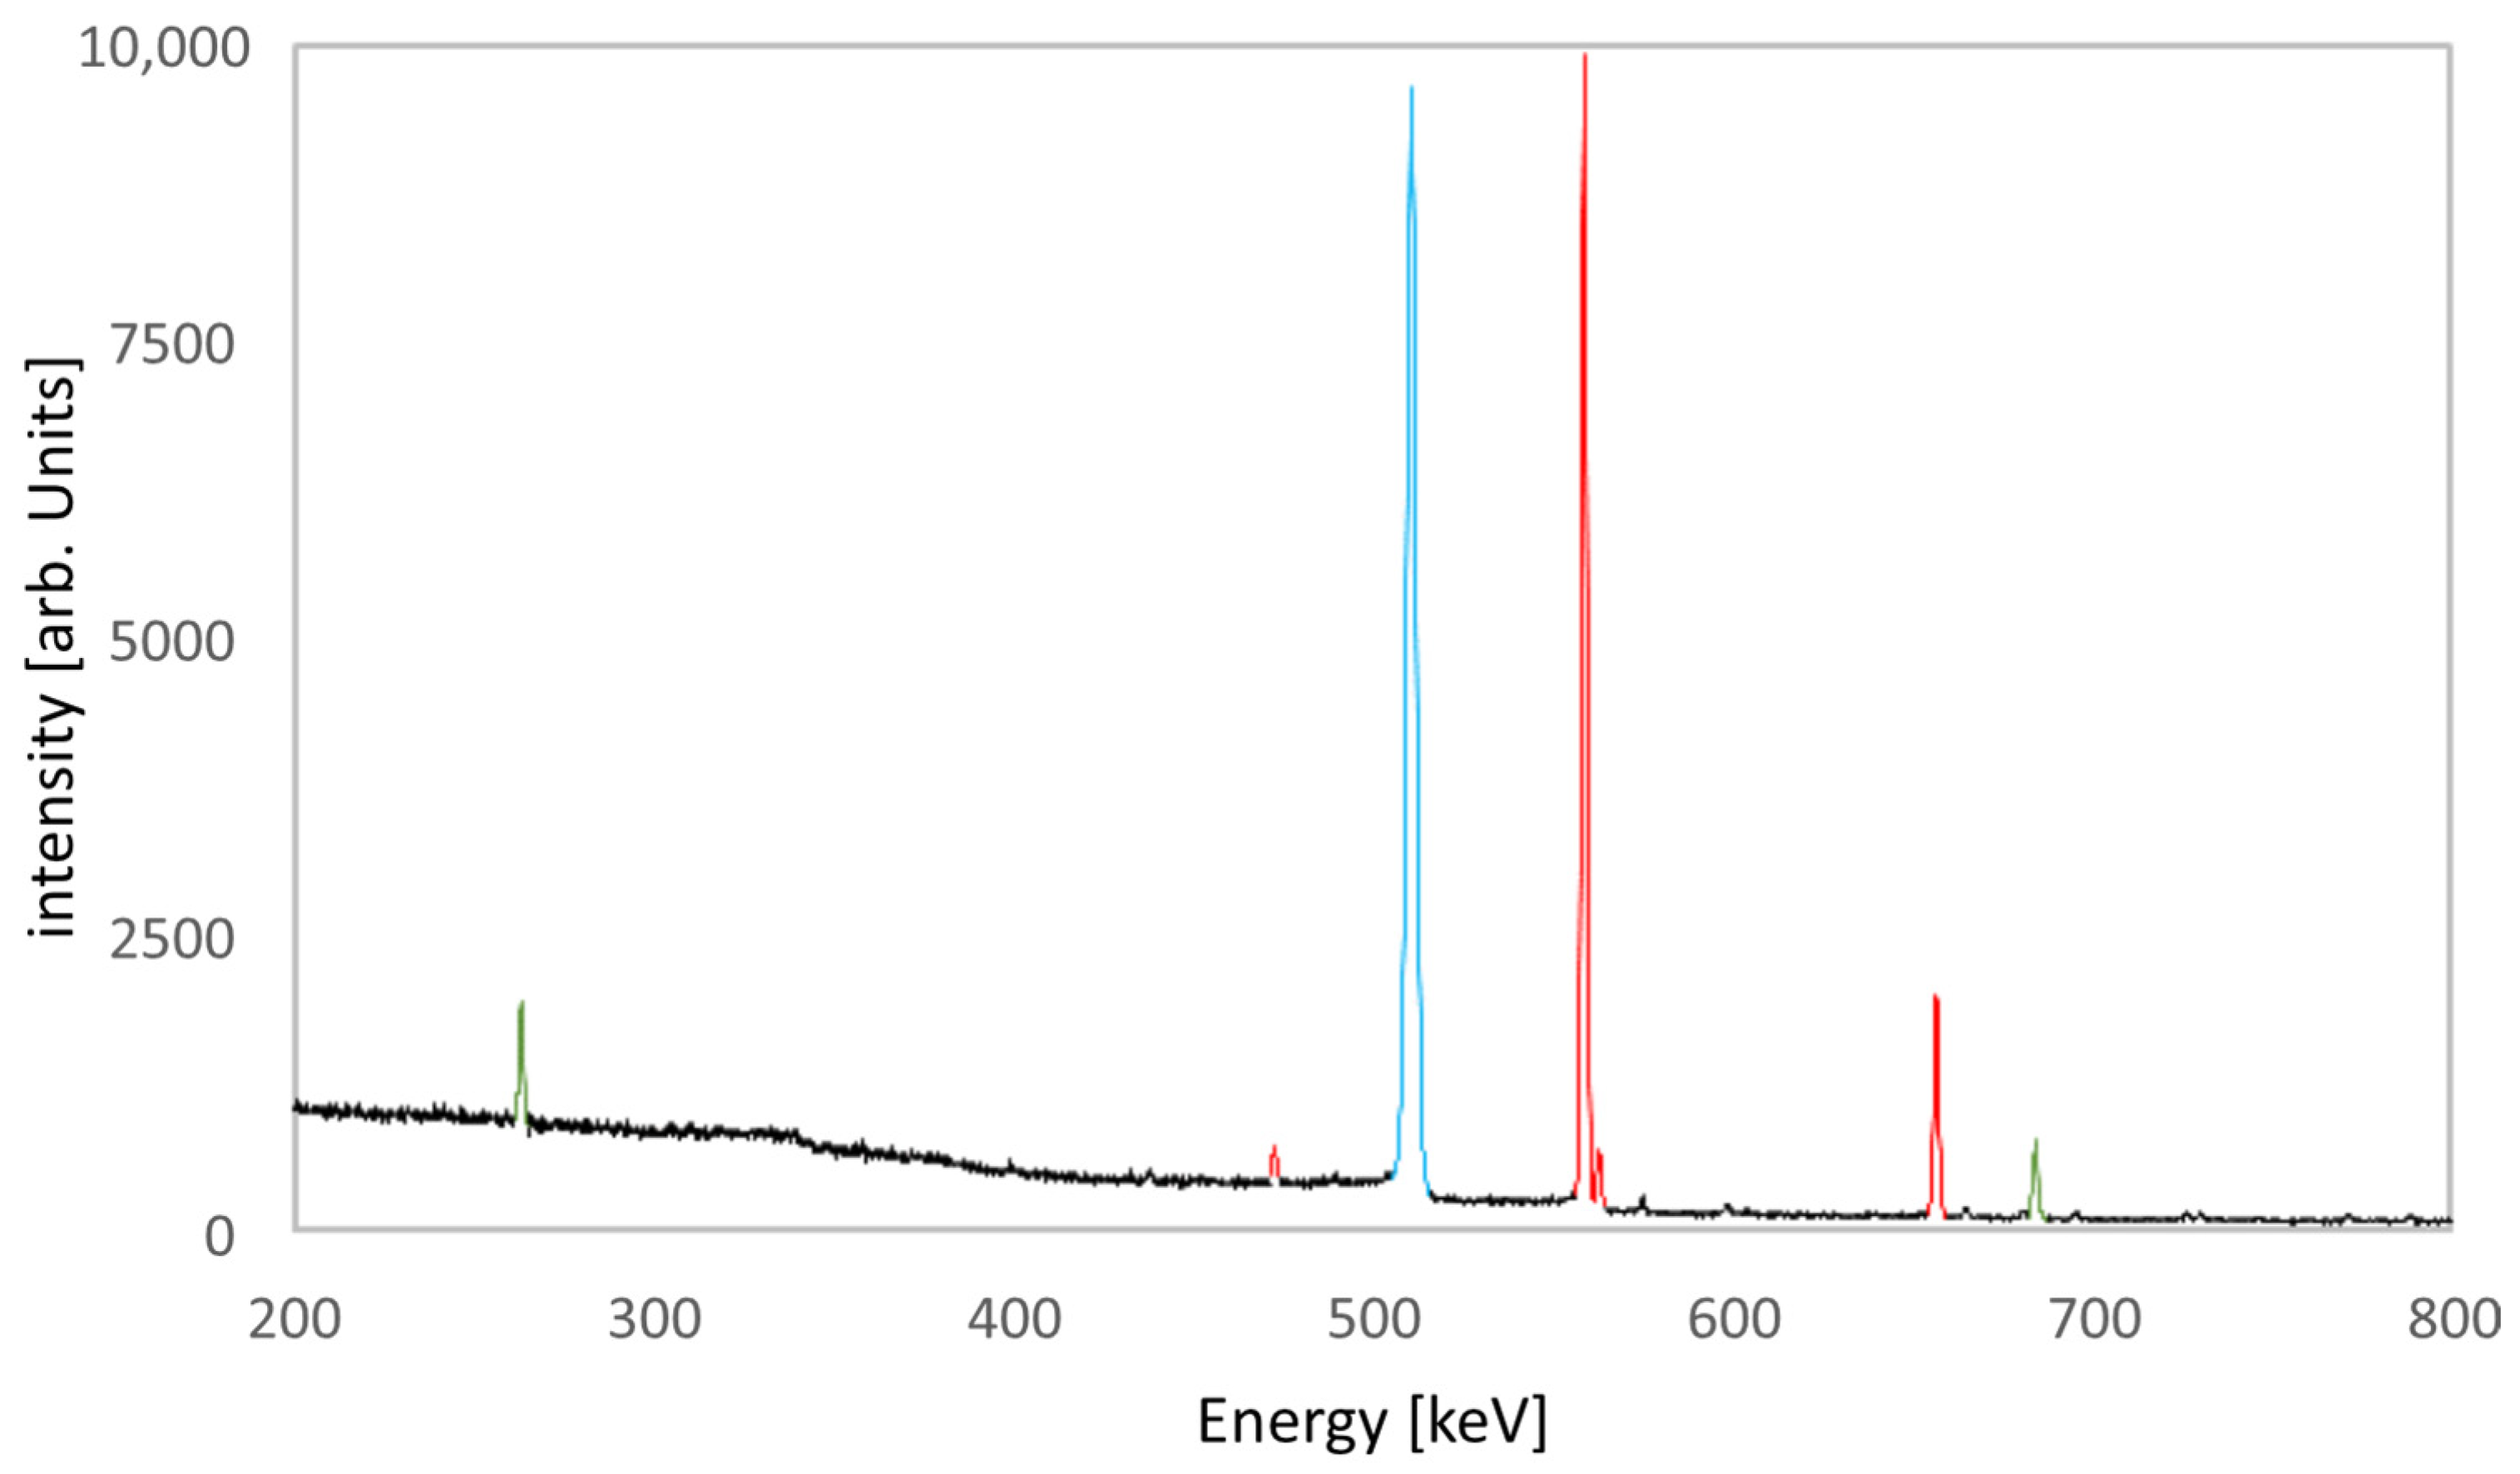
2.4. γ-Spectrometry
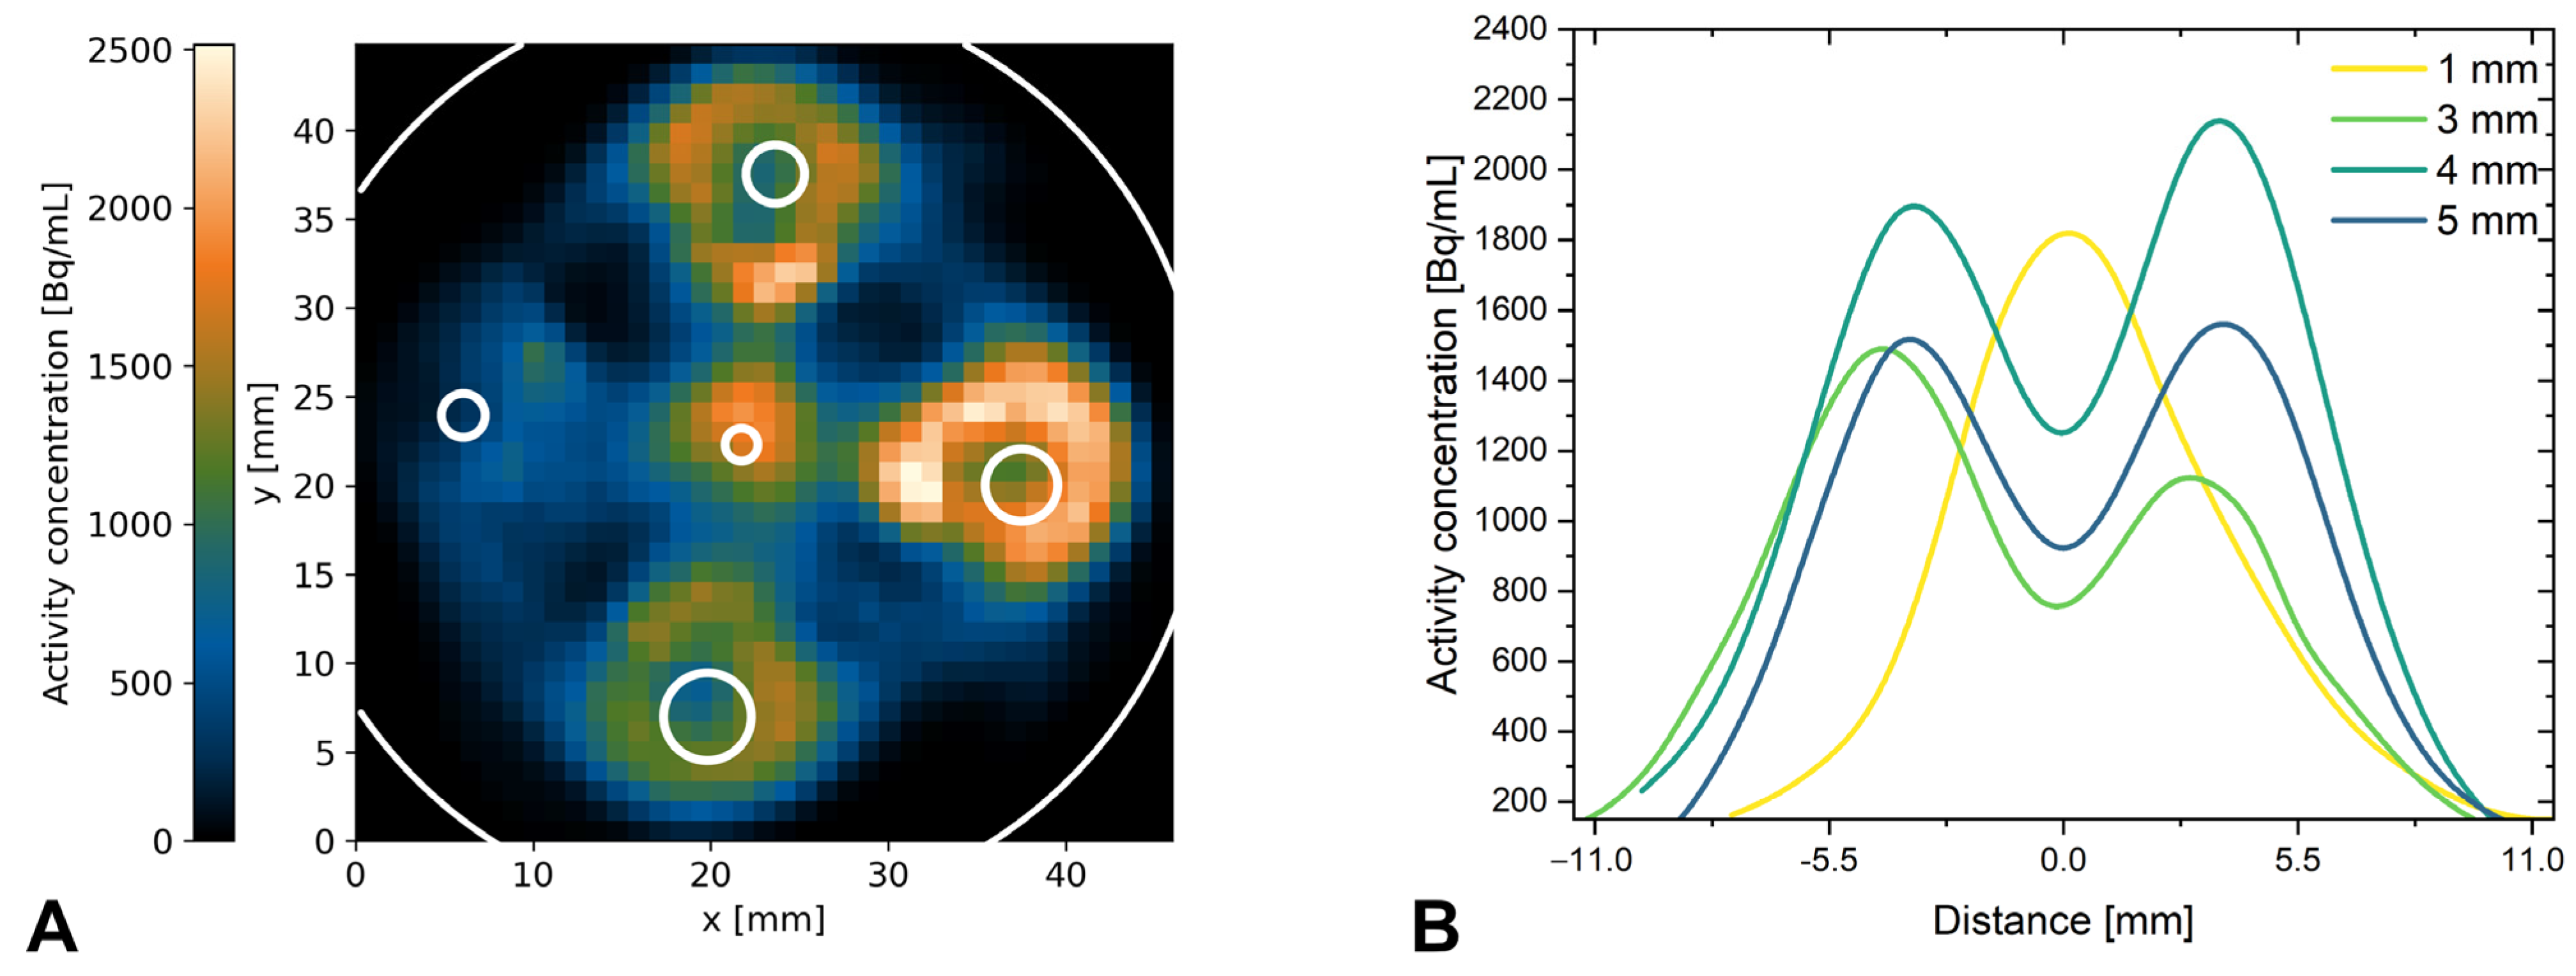
2.5. PET/CT
3. Results
3.1. Targetry
3.2. Target Irradiation
3.3. Target Processing
3.4. PET
4. Discussion and Conclusions
Author Contributions
Funding
Data Availability Statement
Acknowledgments
Conflicts of Interest
References
- Kulenkampff, J.; Gründig, M.; Zakhnini, A.; Lippmann-Pipke, J. Geoscientific process monitoring with positron emission tomography (GeoPET). Solid Earth 2016, 7, 1217–1231. [Google Scholar] [CrossRef]
- Kulenkampff, J.; Gründig, M.; Richter, M.; Enzmann, F. Evaluation of positron-emission-tomography for visualisation of migration processes in geomaterials. Phys. Chem. Earth 2008, 33, 937–942. [Google Scholar] [CrossRef]
- Pingel, J.; JKulenkampff, J.; Jara-Heredia, D.; Stoll, M.; Zhou, W.; Fischer, C.; Schäfer, T. In-situ flow visualization with Geo-Positron-Emission-Tomography in a granite fracture from Soultz-sous-Forêts, France. Geothermics 2023, 111, 102705. [Google Scholar] [CrossRef]
- Zahasky, C.; Benson, S.M. Micro-positron emission tomography for measuring sub-core scale single and multiphase transport parameters in porous media. Adv. Water Resour. 2018, 115, 1–16. [Google Scholar] [CrossRef]
- Bollermann, T.; Yuan, T.; Kulenkampff, J.; Stumpf, T.; Fischer, C. Pore network and solute flux pattern analysis towards improved predictability of diffusive transport in argillaceous host rocks. Chem. Geol. 2022, 606, 120997. [Google Scholar] [CrossRef]
- Khalili, A.; Basu, A.J.; Pietrzyk, U. Flow visualization in porous media via Positron Emission Tomography. Phys. Fluids 1998, 10, 1031–1033. [Google Scholar] [CrossRef]
- Kulenkampff, J.; Gründig, M.; Zakhnini, A.; Gerasch, R.; Lippmann-Pipke, J. Process tomography of diffusion, using PET, to evaluate anisotropy and heterogeneity. Clay Miner. 2015, 50, 369–375. [Google Scholar] [CrossRef]
- Schmidt, M.P.; Mamet, S.D.; Ferrieri, R.A.; Peak, D.; Siciliano, S.D. From the Outside in: An Overview of Positron Imaging of Plant and Soil Processes. Mol. Imaging 2020, 19, 1536012120966405. [Google Scholar] [CrossRef]
- Kulenkampff, J.; Stoll, M.; Gründig, M.; Mansel, A.; Lippmann-Pipke, J.; Kersten, M. Time-lapse 3D imaging by positron emission tomography of Cu mobilized in a soil column by the herbicide. MCPA. Sci. Rep. 2018, 8, 7091. [Google Scholar] [CrossRef] [PubMed]
- Tits, J.; Jakob, A.; Wieland, E.; Spieler, P. Diffusion of tritiated water and 22Na+ through non-degraded hardened cement pastes. J. Contam. Hydrol. 2003, 61, 45–62. [Google Scholar] [CrossRef]
- Wersin, P.; Soler, J.M.; Van Loon, L.R.; Eikenberg, J.; Baeyens, B.; Grolimund, D.; Gimmi, T.; Dewonck, S. Diffusion of HTO, Br−, I−, Cs+, 85Sr2+ and 60Co2+ in a clay formation: Results and modelling from an in situ experiment in Opalinus Clay. Appl. Geochem. 2008, 23, 678–691. [Google Scholar] [CrossRef]
- D’Alessandro, M.; Mousty, F.; Bidoglio, G.; Guimera, J.; Benet, I.; Sánchez-Vila, X.; Gutiérrez, M.G.; De Llano, A.Y. Field tracer experiment in a low permeability fractured medium: Results from El Berrocal site. J. Contam. Hydrol. 1997, 26, 189–201. [Google Scholar] [CrossRef]
- Hoehn, E.; Eikenberg, J.; Fierz, T.; Drost, W.; Reichlmayr, E. The Grimsel Migration Experiment: Field injection–withdrawal experiments in fractured rock with sorbing tracers. J. Contam. Hydrol. 1998, 34, 85–106. [Google Scholar] [CrossRef]
- Leitão, T.E.; Lobo-Ferreira, J.P.; Valocchi, A.J. Application of a reactive transport model for interpreting non-conservative tracer experiments: The Rio Maior case-study. J. Contam. Hydrol. 1996, 24, 167–181. [Google Scholar] [CrossRef]
- Hiemstra, T.; Van Riemsdijk, W.H. Fluoride Adsorption on Goethite in Relation to Different Types of Surface Sites. J. Colloid Interface Sci. 2000, 225, 94–104. [Google Scholar] [CrossRef] [PubMed]
- Meeussen, J.C.L.; Scheidegger, A.; Hiemstra, T.; van Riemsdijk, W.H.; Borkovec, M. Predicting Multicomponent Adsorption and Transport of Fluoride at Variable pH in a Goethite-Silica Sand System. Environ. Sci. Technol. 1996, 30, 481–488. [Google Scholar] [CrossRef]
- Berka, M.; Bányai, I. Surface Complexation Modeling of K+, NO3−, SO42−, Ca2+, F−, Co2+ and Cr3+ Ion Adsorption on Silica Gel. J. Colloid Interface Sci. 2001, 233, 131–135. [Google Scholar] [CrossRef]
- Weerasooriya, R.; Wickramarathne, H.U.S.; Dharmagunawardhane, H.A. Surface complexation modeling of fluoride adsorption onto kaolinite. Colloids Surf. A 1998, 144, 267–273. [Google Scholar] [CrossRef]
- Hoff, W.D.; Wilson, M.A.; Benton, D.M.; Hawkesworth, M.R.; Parker, D.J.; Flowles, P. The use of positron emission tomography to monitor unsaturated water flow within porous construction materials. J. Mater. Sci. 1996, 15, 1101–1104. [Google Scholar] [CrossRef]
- Zhang, L.Y.; Hou, X.L. Speciation analysis of 129I and its applications in environmental research. Radiochim. Acta 2013, 101, 525–540. [Google Scholar] [CrossRef]
- Ellison, P.A.; Olson, A.P.; Barnhart, T.E.; Hoffmann, S.L.V.; SW Reilly Makvandi, M.; Bartels, J.I.; Murali, D.; DeJesus, O.T.; Lapi, S.E.; Bednarz, B. Improved production of 76Br, 77Br and 80mBr via CoSe cyclotron targets and vertical dry distillation. Nucl. Med. Biol. 2019, 80–81, 32–36. [Google Scholar] [CrossRef]
- Wilbur, D.S.; Adam, M.J. Radiobromine and radioiodine for medical applications. Radiochim. Acta 2019, 9–11, 1033–1063. [Google Scholar] [CrossRef]
- Mixdorf, J.C.; Hoffman, S.L.V.; Aluicio-Sarduy, E.; Barnhart, T.E.; Engle, J.W.; Ellison, P.A. Copper-mediated radiobromination of (hetero)aryl boronic pinacol esters. J. Org. Chem. 2023, 88, 2089–2094. [Google Scholar] [CrossRef]
- NuDat 2.8 Database. Available online: https://www.nndc.bnl.gov/nudat3/nudat2.jsp (accessed on 6 February 2023).
- Hassan, H.E.; Qaim, S.M.; Shubin, Y.; Azzam, A.; Morsy, M.; Coenen, H.H. Experimental studies and nuclear model calculations on proton-induced reactions on natSe, 76Se and 77Se with particular reference to the production of the medically interesting radionuclides 76Br and 77Br. Appl. Radiat. Isot. 2004, 60, 899–909. [Google Scholar] [CrossRef]
- Paans, A.M.J.; Welleweerd, J.; Vaalburg, W.; Reiffers, S.; Woldring, M.G. Excitation functions for the production of bromine-75: A potential nuclide for the labelling of radiopharmaceuticals. Int. J. Appl. Radiat. Isot. 1980, 31, 267–273. [Google Scholar] [CrossRef]
- El-Azony, K.; Suzuki, K.; Fukumura, T.; Szélecsényi, F.; Kovács, Z. Excitation functions of proton induced reactions on natural selenium up to 62 MeV. Radiochim. Acta 2009, 97, 71–77. [Google Scholar] [CrossRef]
- Qaim, S.M.; Stöcklin, G.; Weinreich, R. Excitation functions for the formation of neutron deficient isotopes of bromine and krypton via high-energy deuteron induced reactions on bromine: Production of 77Br, 76Br and 79Kr. Int. J. Appl. Radiat. Isot. 1977, 28, 947–953. [Google Scholar] [CrossRef]
- Aslam, M.N.; Sudár, S.; Hussain, M.; Malik, A.A.; Qaim, S.M. Evaluation of excitation functions of proton, 3He- and α-particle induced reactions for production of the medically interesting positron-emitter bromine-76. Appl. Radiat. Isot. 2011, 69, 1490–1505. [Google Scholar] [CrossRef] [PubMed]
- Hollemann, A.F.; Wiberg, E. Lehrbuch der Anorganischen Chemie; de Gruyter: Berlin, Germany, 1985. [Google Scholar]
- Tolmachev, V.; Lövqvist, A.; Einarsson, L.; Schultz, J.; Lundqvist, H. Production of 76Br by a Low-energy Cyclotron. Appl. Radiat. Isot. 1998, 49, 1537–1540. [Google Scholar] [CrossRef]
- Tang, L. Radionuclide production and yields at Washington University School of Medicine. Q. J. Nucl. Med. Mol. Imaging 2008, 52, 121–133. [Google Scholar] [PubMed]
- Breunig, K.; Spahn, I.; Spellerberg, S.; Coenen, H.H. Production of no-carrier-added radiobromine: New nickel selenide target and optimized separation by dry distillation. Radiochim. Acta 2015, 103, 397–402. [Google Scholar] [CrossRef]
- Hassan, H.E.; El-Azony, K.M.; Azzam, A.; Qaim, S.M. Investigation of selenium compounds as targets for 76,77Br production using protons of energies up to 34 MeV. Radiochim. Acta 2017, 105, 841–850. [Google Scholar] [CrossRef]
- Thielemans, K.; Tsoumpas, C.; Mustafovic, S.; Beisel, T.; Aguiar, P.; Dikaios, N.; Jacobson, M.W. STIR: Software for tomographic image reconstruction release 2. Phys. Med. Biol. 2012, 57, 867–883. [Google Scholar] [CrossRef] [PubMed]
- XCOM: Photon Cross Section Database (Version 1.5). Available online: http://physics.nist.gov/xcom (accessed on 23 January 2023).


| End-Point Energy [keV] | Intensity [%] | Energy [keV] | Intensity [%] | ||
|---|---|---|---|---|---|
| β1 | 871 | 6.3 | γ1 | 559.09 | 74.0 |
| β2 | 990 | 5.2 | γ2 | 657.02 | 15.9 |
| β3 | 3382 | 25.8 | γ3 | 1216.10 | 8.8 |
| β4 | 3941 | 6.0 | γ4 | 1853.67 | 14.7 |
| γ5 | 2950.53 | 7.4 | |||
| γ6 | 2792.69 | 5.6 |
Disclaimer/Publisher’s Note: The statements, opinions and data contained in all publications are solely those of the individual author(s) and contributor(s) and not of MDPI and/or the editor(s). MDPI and/or the editor(s) disclaim responsibility for any injury to people or property resulting from any ideas, methods, instructions or products referred to in the content. |
© 2024 by the authors. Licensee MDPI, Basel, Switzerland. This article is an open access article distributed under the terms and conditions of the Creative Commons Attribution (CC BY) license (https://creativecommons.org/licenses/by/4.0/).
Share and Cite
Franke, K.; Schöngart, J.; Mansel, A. Production and Processing of the Radionuclide 76Br. Instruments 2024, 8, 22. https://doi.org/10.3390/instruments8010022
Franke K, Schöngart J, Mansel A. Production and Processing of the Radionuclide 76Br. Instruments. 2024; 8(1):22. https://doi.org/10.3390/instruments8010022
Chicago/Turabian StyleFranke, Karsten, Jann Schöngart, and Alexander Mansel. 2024. "Production and Processing of the Radionuclide 76Br" Instruments 8, no. 1: 22. https://doi.org/10.3390/instruments8010022