Article

Heritability Estimates for Growth Traits and Correlation Analysis between Weight and Metamorphosis Rate in the Bullfrog Rana (Aquarana) catesbeiana

1
Key Laboratory of Healthy Mariculture for the East China Sea, Ministry of Agriculture and Rural Affairs, Fisheries College, Jimei University, Xiamen 361021, China
2
State Key Laboratory of Mariculture Breeding, Fisheries College, Jimei University, Xiamen 361021, China
3
Fisheries Research Institute of Fujian, 7 Shanhai Road, Huli, Xiamen 361000, China
*
Author to whom correspondence should be addressed.
Fishes 2024, 9(3), 105; https://doi.org/10.3390/fishes9030105
Submission received: 20 January 2024 / Revised: 5 March 2024 / Accepted: 7 March 2024 / Published: 9 March 2024
(This article belongs to the Special Issue Genetics and Breeding in Aquaculture)

Abstract

:
Metamorphosis is a crucial process in the life cycle of Rana (Aquarana) catesbeiana. R. catesbeiana tadpoles, in their short larval period, possess a high survival rate and also a highly competitive ability in the amphibious stage. In actual seed production, the economic traits of larval period and metamorphosis rate are used as quantifiable indicators of quality for individuals and populations, respectively. However, studies of these economic traits in larval cultivation and production are still lacking. In this study, we constructed 40 full-sib families of R. catesbeiana and measured the weight and metamorphosis rate of tadpoles at different developmental stages. Subsequently, we calculated the phenotypic and genetic association between weight and metamorphosis rate in tadpoles and assessed the heritability of these two traits. The heritabilities of weight at three developmental stages were all higher than 0.40 and decreased with advancement of the developmental stage; the heritability of the metamorphosis rate was 0.18 ± 0.20, a moderate level. Correlation analysis of weight and metamorphosis rate at each developmental stage in each tadpole family showed that weight at stages 25-I, 25-II, and 25-III was significantly correlated at the phenotypic level but non-significantly at the genetic level. The metamorphosis rate was only moderately associated with stage 25-III weight (0.38, p < 0.05). The results of this study confirm the importance and transportability of tadpole weight in actual seed production and provide basic data and a potentially optimized direction for the selective breeding of high-metamorphosis-rate bullfrogs.
Key Contribution: This is the first study on the phenotypic and genetic association between weight and metamorphosis rate in bullfrog tadpoles. The metamorphosis rate was moderately associated with weight at stage 25-III, providing basic data for the selective breeding of high-metamorphosis-rate bullfrogs.

1. Introduction

The bullfrog Rana (Aquarana) catesbeiana was introduced into China in the 1960s and cultivated in Guangdong, Guangxi, Fujian, Jiangxi, Zhejiang, and Anhui provinces in the 1990s. By 2022, the national cultivated output of R. catesbeiana reached 700,000 tons, an increase of about 10% over 2021, and the output value of the whole industrial chain reached nearly CNY 100 billion. Compared to fish and shrimp culture, bullfrogs offer advantages of rapid growth, being a rich protein source produced efficiently with regard to land, feed, and water, and being well suited to industrial production. However, with the continuous expansion of bullfrog production, there are many problems, such as a lack of policy and financial support, low investment in science and technology, a lack of approved drugs, and environmental pollution. Moreover, the most important problem is the lack of excellent bullfrog lines, which is constraining the development of bullfrog production. Therefore, breeding improved lines is a pressing issue for the sustainable development of bullfrog farming.
In production, it generally takes 150–200 days for a fertilized egg to develop into a commercial frog of 250 g, in which the tadpole stage is 60–120 days, accounting for about one-half of the whole growth cycle. Development is a continuous, hierarchical, and irreversible process. The metamorphosis of R. catesbeiana is a crucial stage in the transition of tadpoles from aquatic larvae to amphibious juveniles, during which there is a significant change in physiological structure and lifestyle. Tadpole metamorphosis includes cell proliferation, cell differentiation, cell death, and tissue specificity, which is mainly regulated by thyroid hormones produced from the hypothalamic–pituitary–thyroid axis [1,2]. It is generally believed that individuals with a larger size or shorter larval period could have a high-level ability to resist predation and avoid injury in the amphibious stage compared to other individuals [3,4]. This view has been verified in the pool frog (Pelophylax lessonae) and edible frog (Pelophylax esculentus) [4]. Individuals with a short larval period have stronger resistance to stress and disease resistance [5,6] and could develop into larger frogs [7,8] possessing higher fecundity [6,9,10,11,12]. As one of the most important farmed frogs, stronger resistance to stress and disease resistance in bullfrogs would be conducive to production. Tadpoles with a short larval period are favored for production. Hence, the genetics of metamorphosis in the bullfrog, R. catesbeiana, could have great significance in production.
The metamorphosis rate of tadpoles refers to the proportion of individuals completing metamorphosis relative to the total number of tadpoles in the population, a metric which can be used to compare the metamorphosis performance between populations. It is impossible to quantify a tadpole’s metamorphosed performance in terms of metamorphosis rate; instead, it is typically determined by the amount of time that passes between fertilization and the end of metamorphosis. In production, it is hard to observe the metamorphosis time in a large number of individuals at the same time.
Owing to the varying degrees of association among distinct traits in organisms, attributes can be measured indirectly in addition to directly [13]. Studies of the wood frog, Rana sylvatica [14], and the African clawed frog, Xenopus laevis [15], showed that the duration of metamorphosis correlates with individual size at the beginning of metamorphosis. Studies of metamorphosis in R. catesbeiana populations show that large individual tadpoles usually undergo a shorter larval period as a tadpole [16]. Thus, we suggest that the weight of the larval stage at a given period could indicate the larval period in tadpoles.
In the process of breeding, bullfrogs have a breeding habit in which a single father and single dam produce offspring. This habit allows families to spontaneously form and makes it easy to identify the parents and offspring in a small area. In this study, we measured the weight and metamorphosis rate of tadpoles at different developmental stages, evaluated their heritabilities, and estimated the breeding values for the weight and metamorphosis rate of tadpoles. The goal was to find the correlation between the weight and metamorphosis rate of tadpoles and to provide basic data for R. catesbeiana production.

2. Materials and Methods

2.1. Ethics Statement

Rare or protected animals were not included in the experiments of this study. This study was carried out according to the guidelines of the Declaration of Helsinki and was approved by the Animal Care Advisory Committee of Jimei University (Approval No. 2019-0906-003, 6 September 2019).

2.2. Family Construction

The parental R. catesbeiana were from the Yifan Biotechnology Company Limited (Xiamen, China). Parents of bullfrogs were separated and held temporarily according sex in a greenhouse pool of 400 cm × 600 cm × 100 cm in flowing water and with a water depth of 10 cm. The cultivation density was approximately 90 animals per square meter, and the feed was equivalent to 2% of the weight of the bullfrogs. The feed was bullfrog compound feed from Xiamen Jiakang Feed Company Limited (Xiamen, China). Following sexual maturity, sires and dams weighing 350–400 g and 400–500 g, respectively, were chosen and incubated in 90 cm × 90 cm × 90 cm boxes. In 10-day short-term cultivation, these bullfrogs were combined in pairs to construct 120 full-sib families labeled 23MYFM1–23MYFM120. Afterwards, non-spawning and low-hatching-rate families were excluded, and 40 families with more spawning were selected as experimental materials.

2.3. Tadpole Cultivation

The tadpoles were incubated in glass tanks of 65 cm × 45 cm × 45 cm with a water depth of 15 cm. Each family had 600 tadpoles, which were grown for 120 days after being split into three groups of 200 tadpoles each, with the production density adjusted according to actual production. After 30 days, the density was reduced to 100 individuals per tank and to 20 individuals per tank after 65 days. During the cultivation period, the total daily feeding of each group was consistent, and the ration was equally distributed among feedings. Tadpoles were fed twice a day (8:00 and 20:00) at a rate of 7% of body weight, with adjustment of the ration based on the weight of the tadpoles. One-third of the culture water was exchanged every day. Throughout the experimental period, the average air temperature was 26–30 °C, the average water temperature was 25–28 °C, the dissolved oxygen was 6.0 mg/L, and the pH was 7.0–7.6.

2.4. Data Measurement

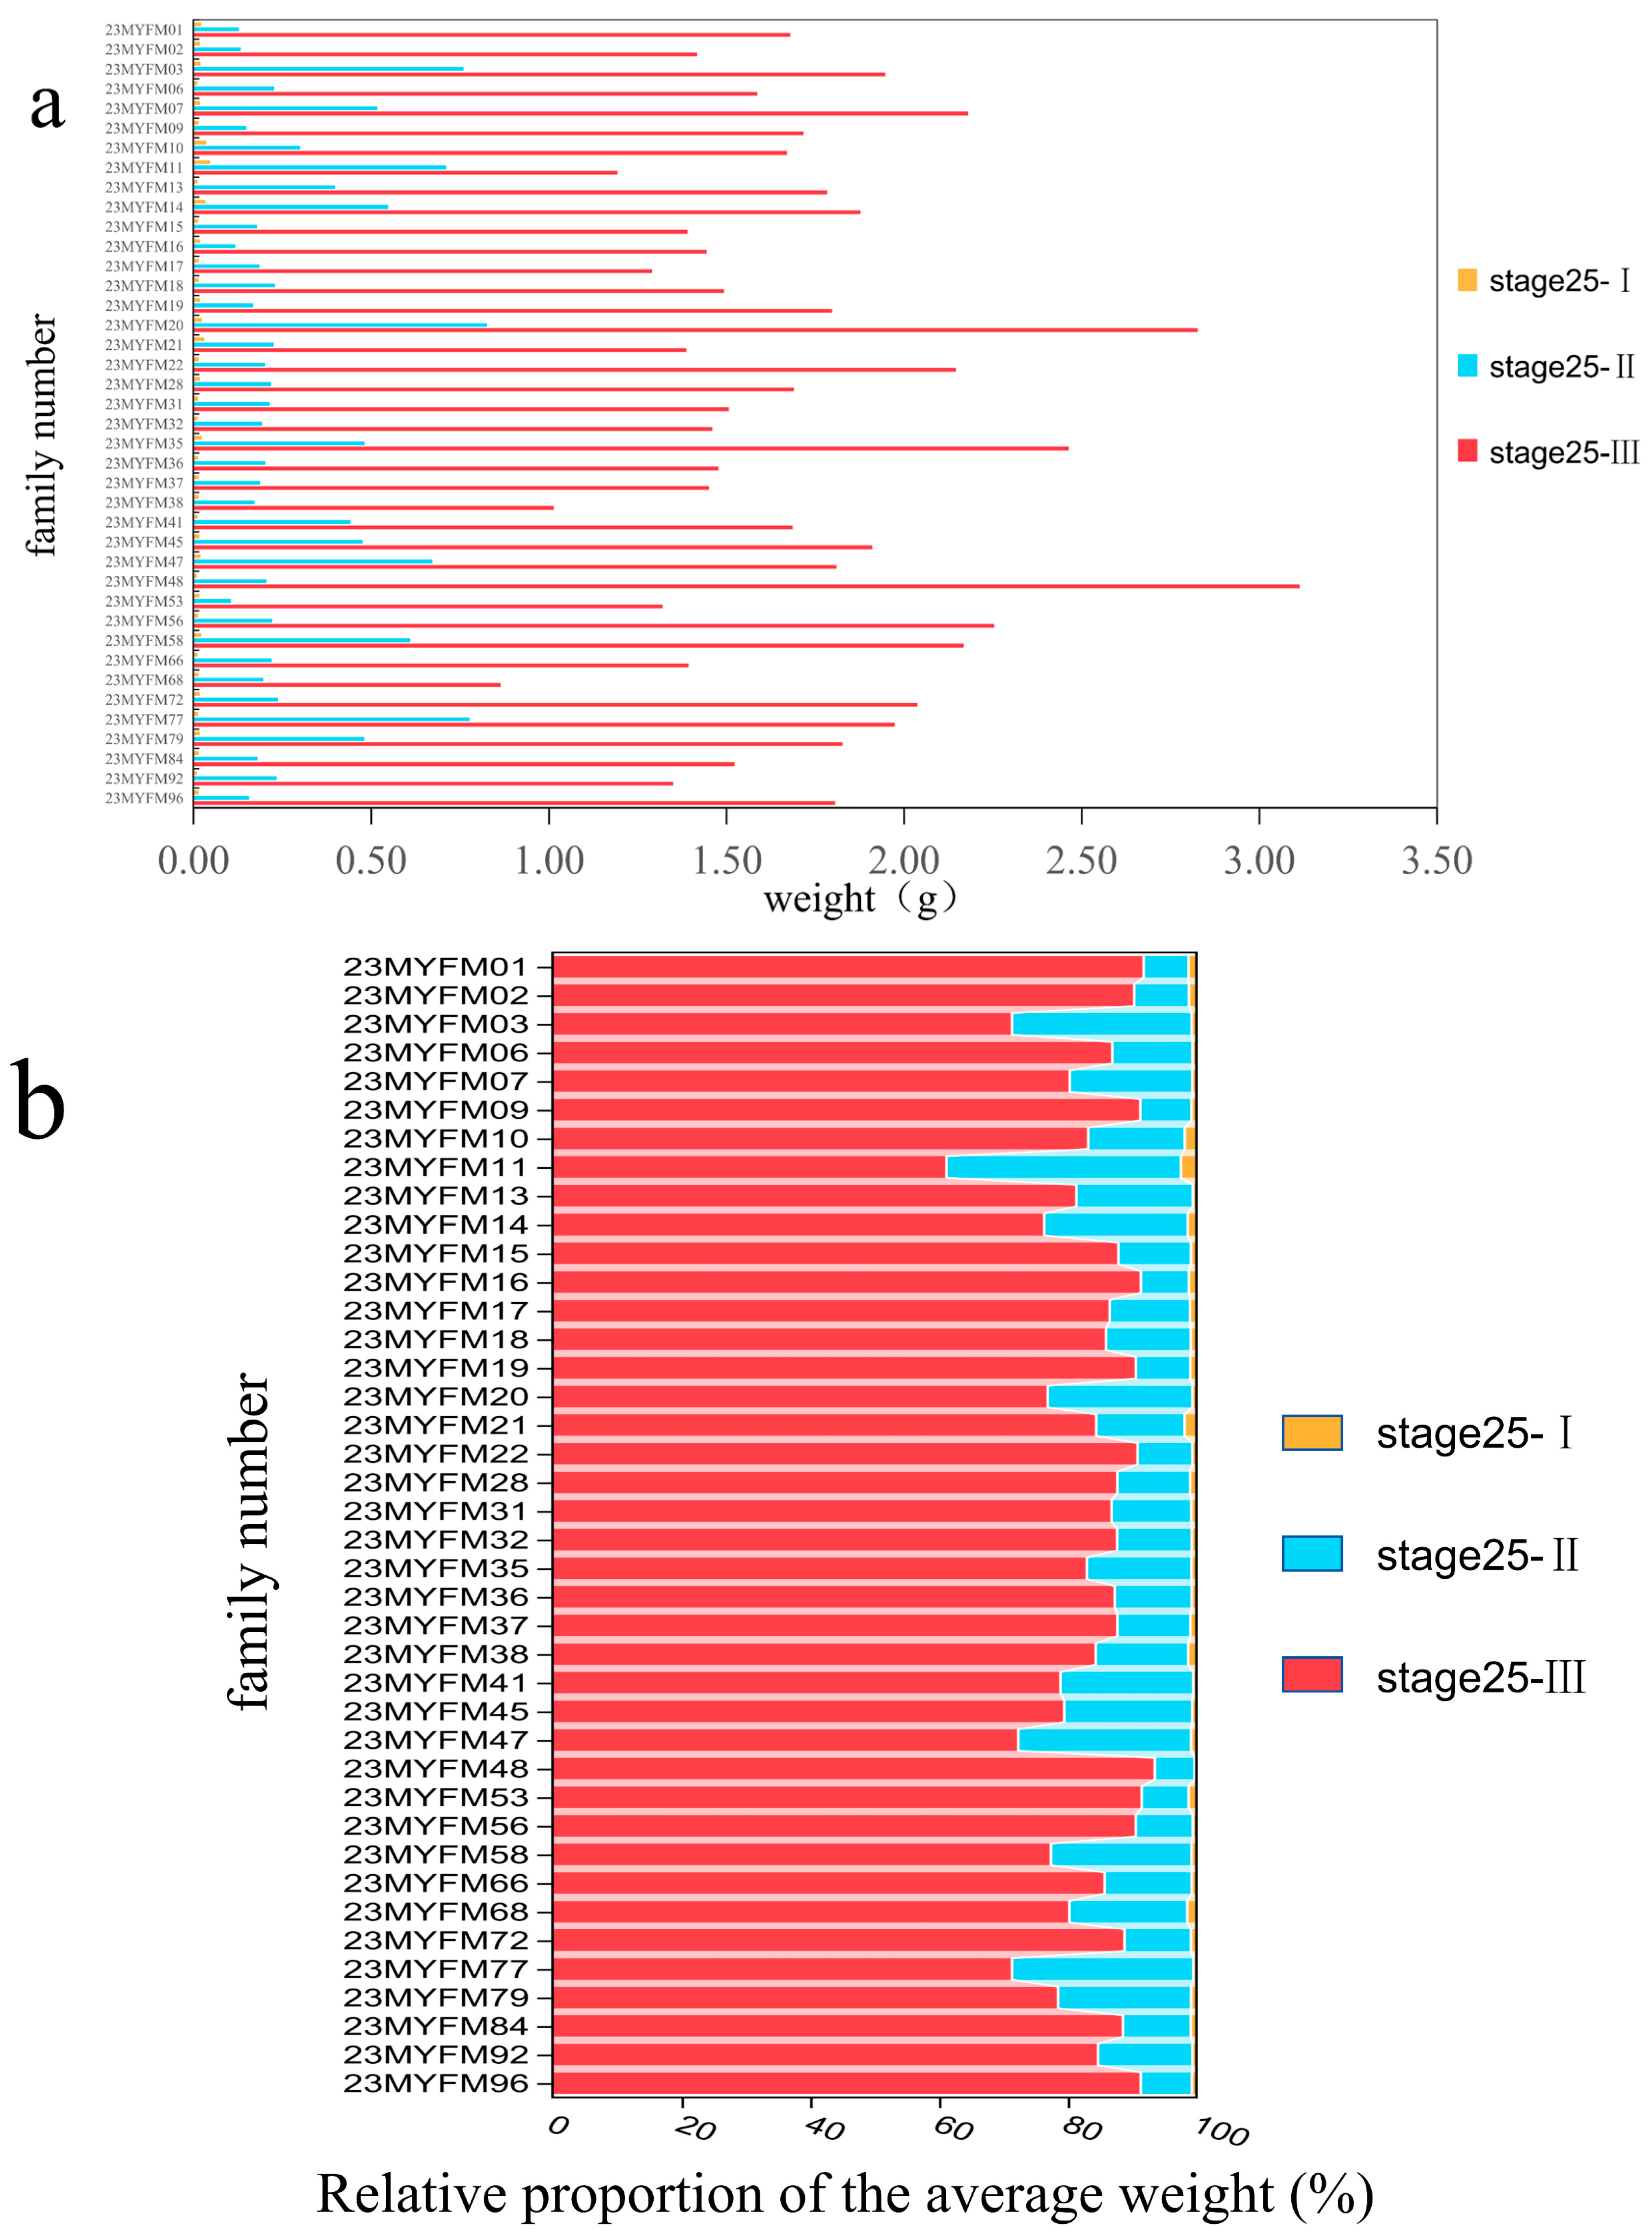
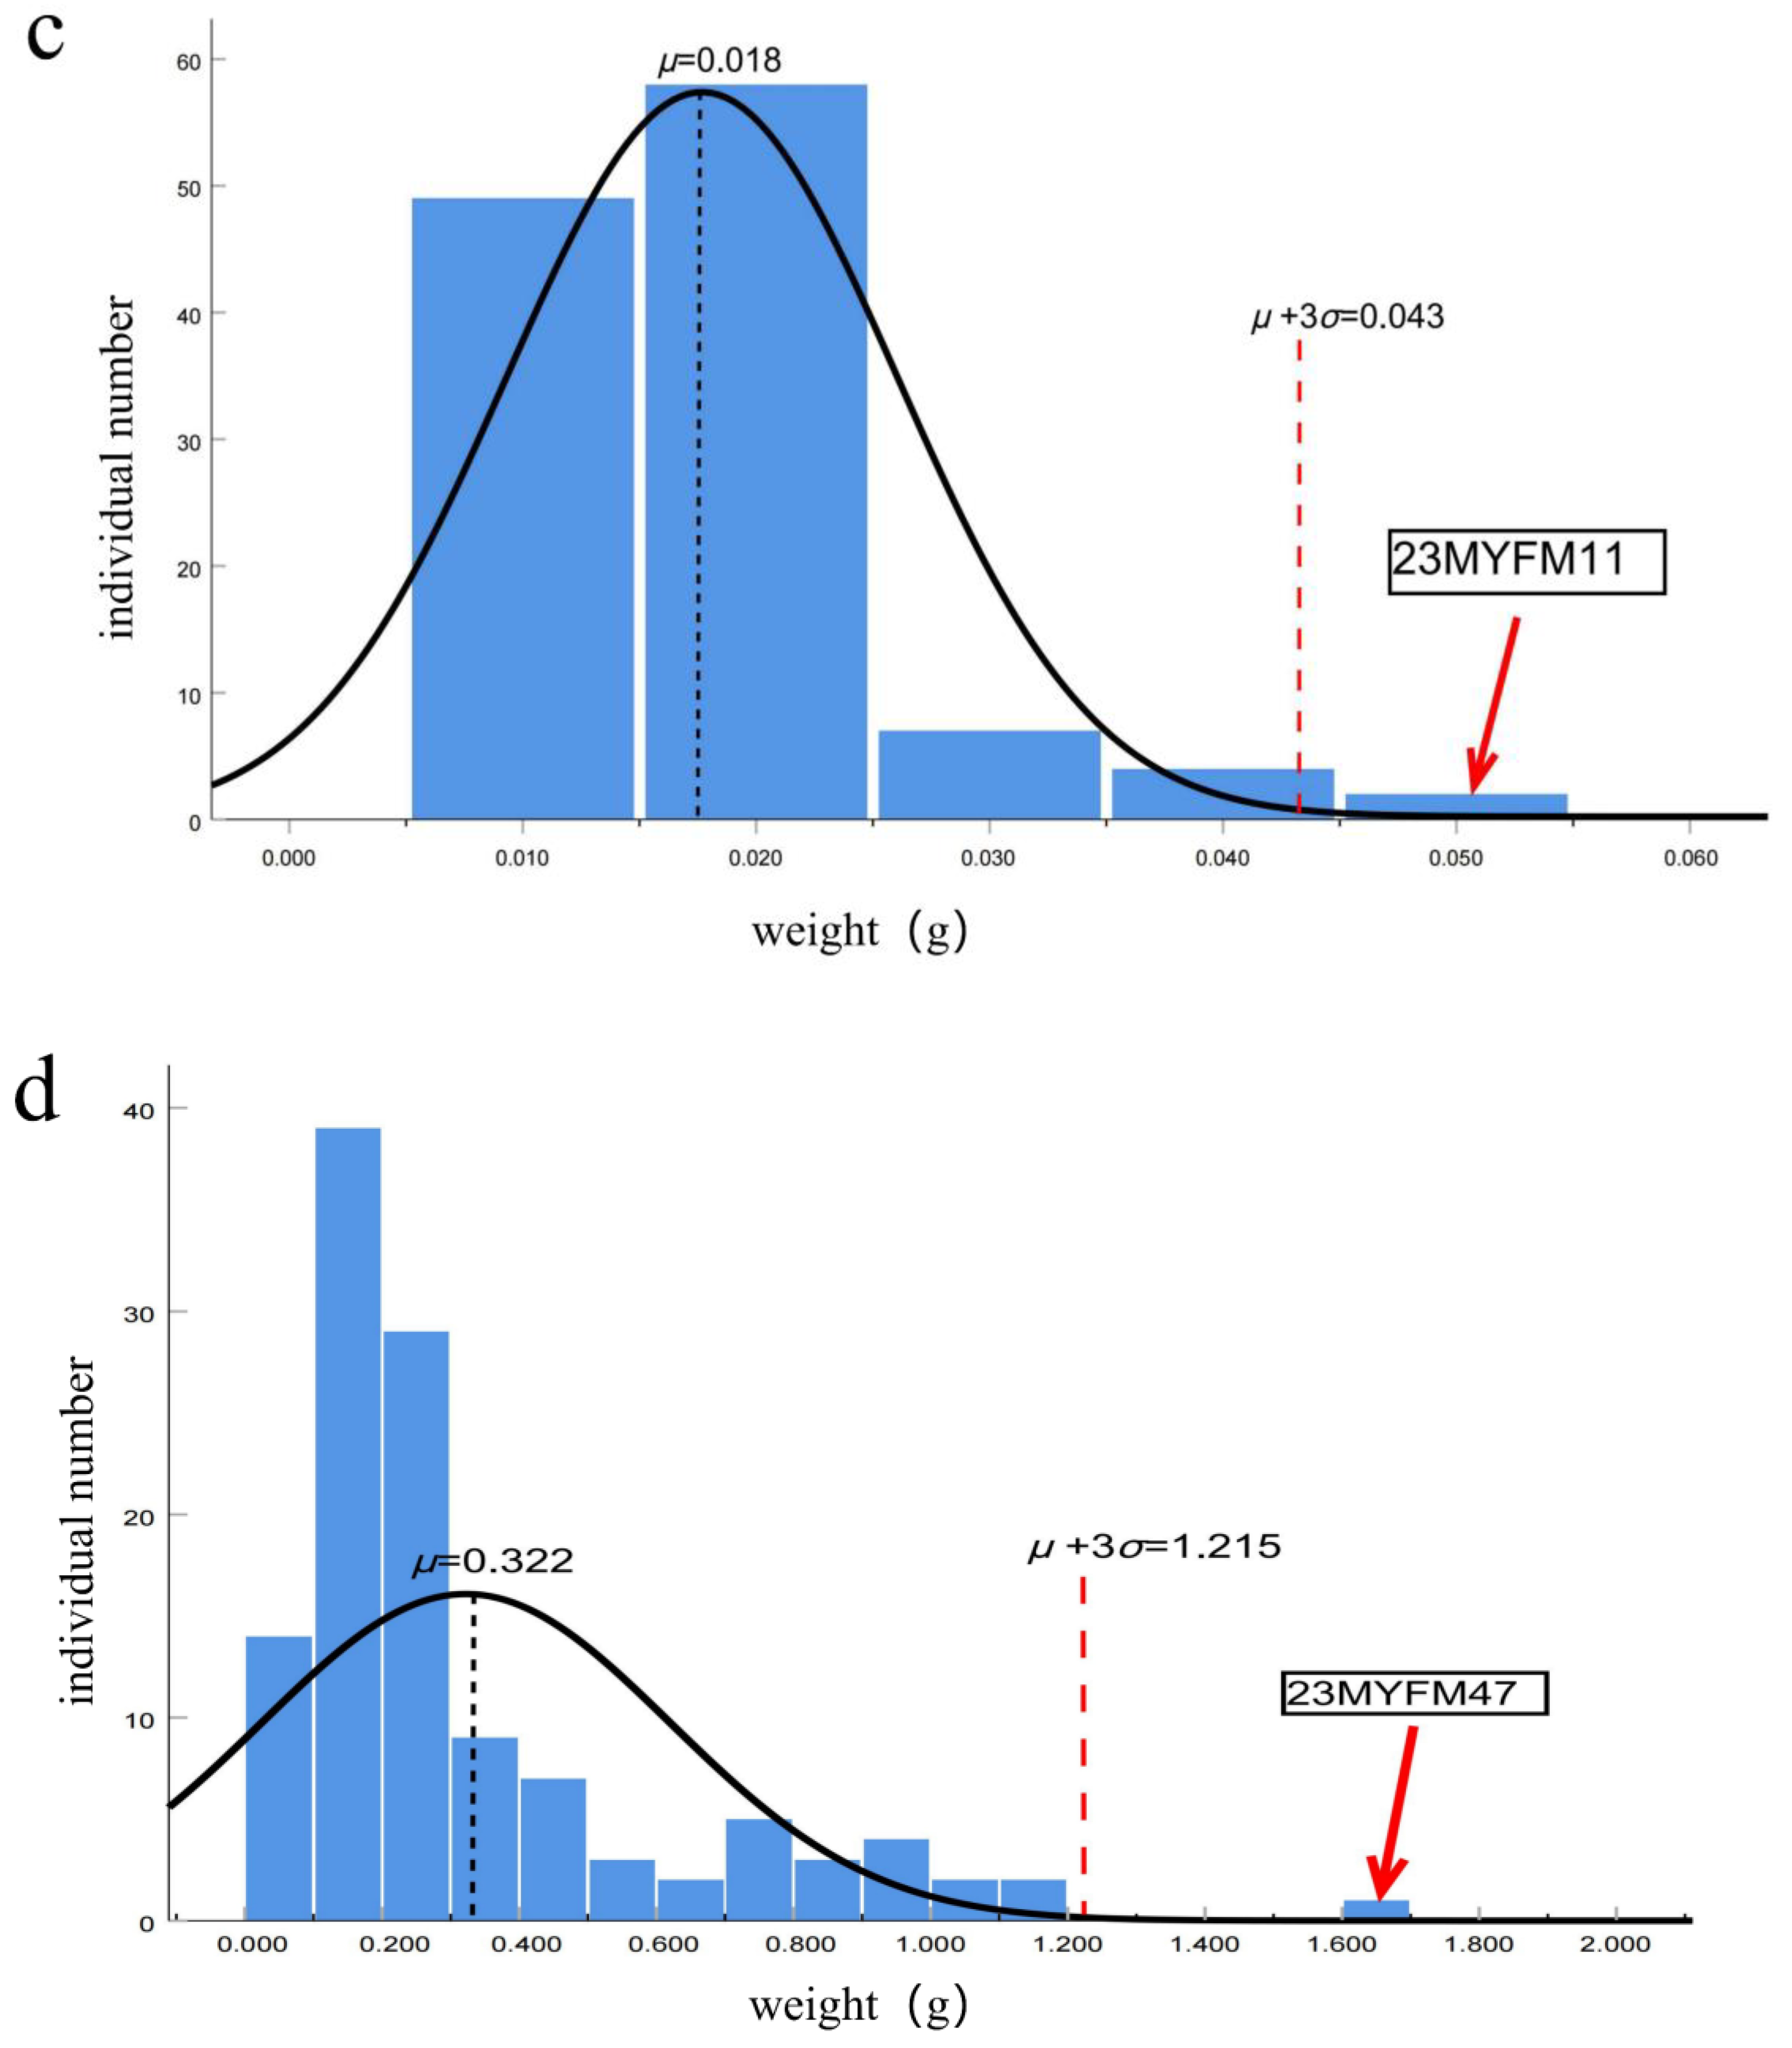
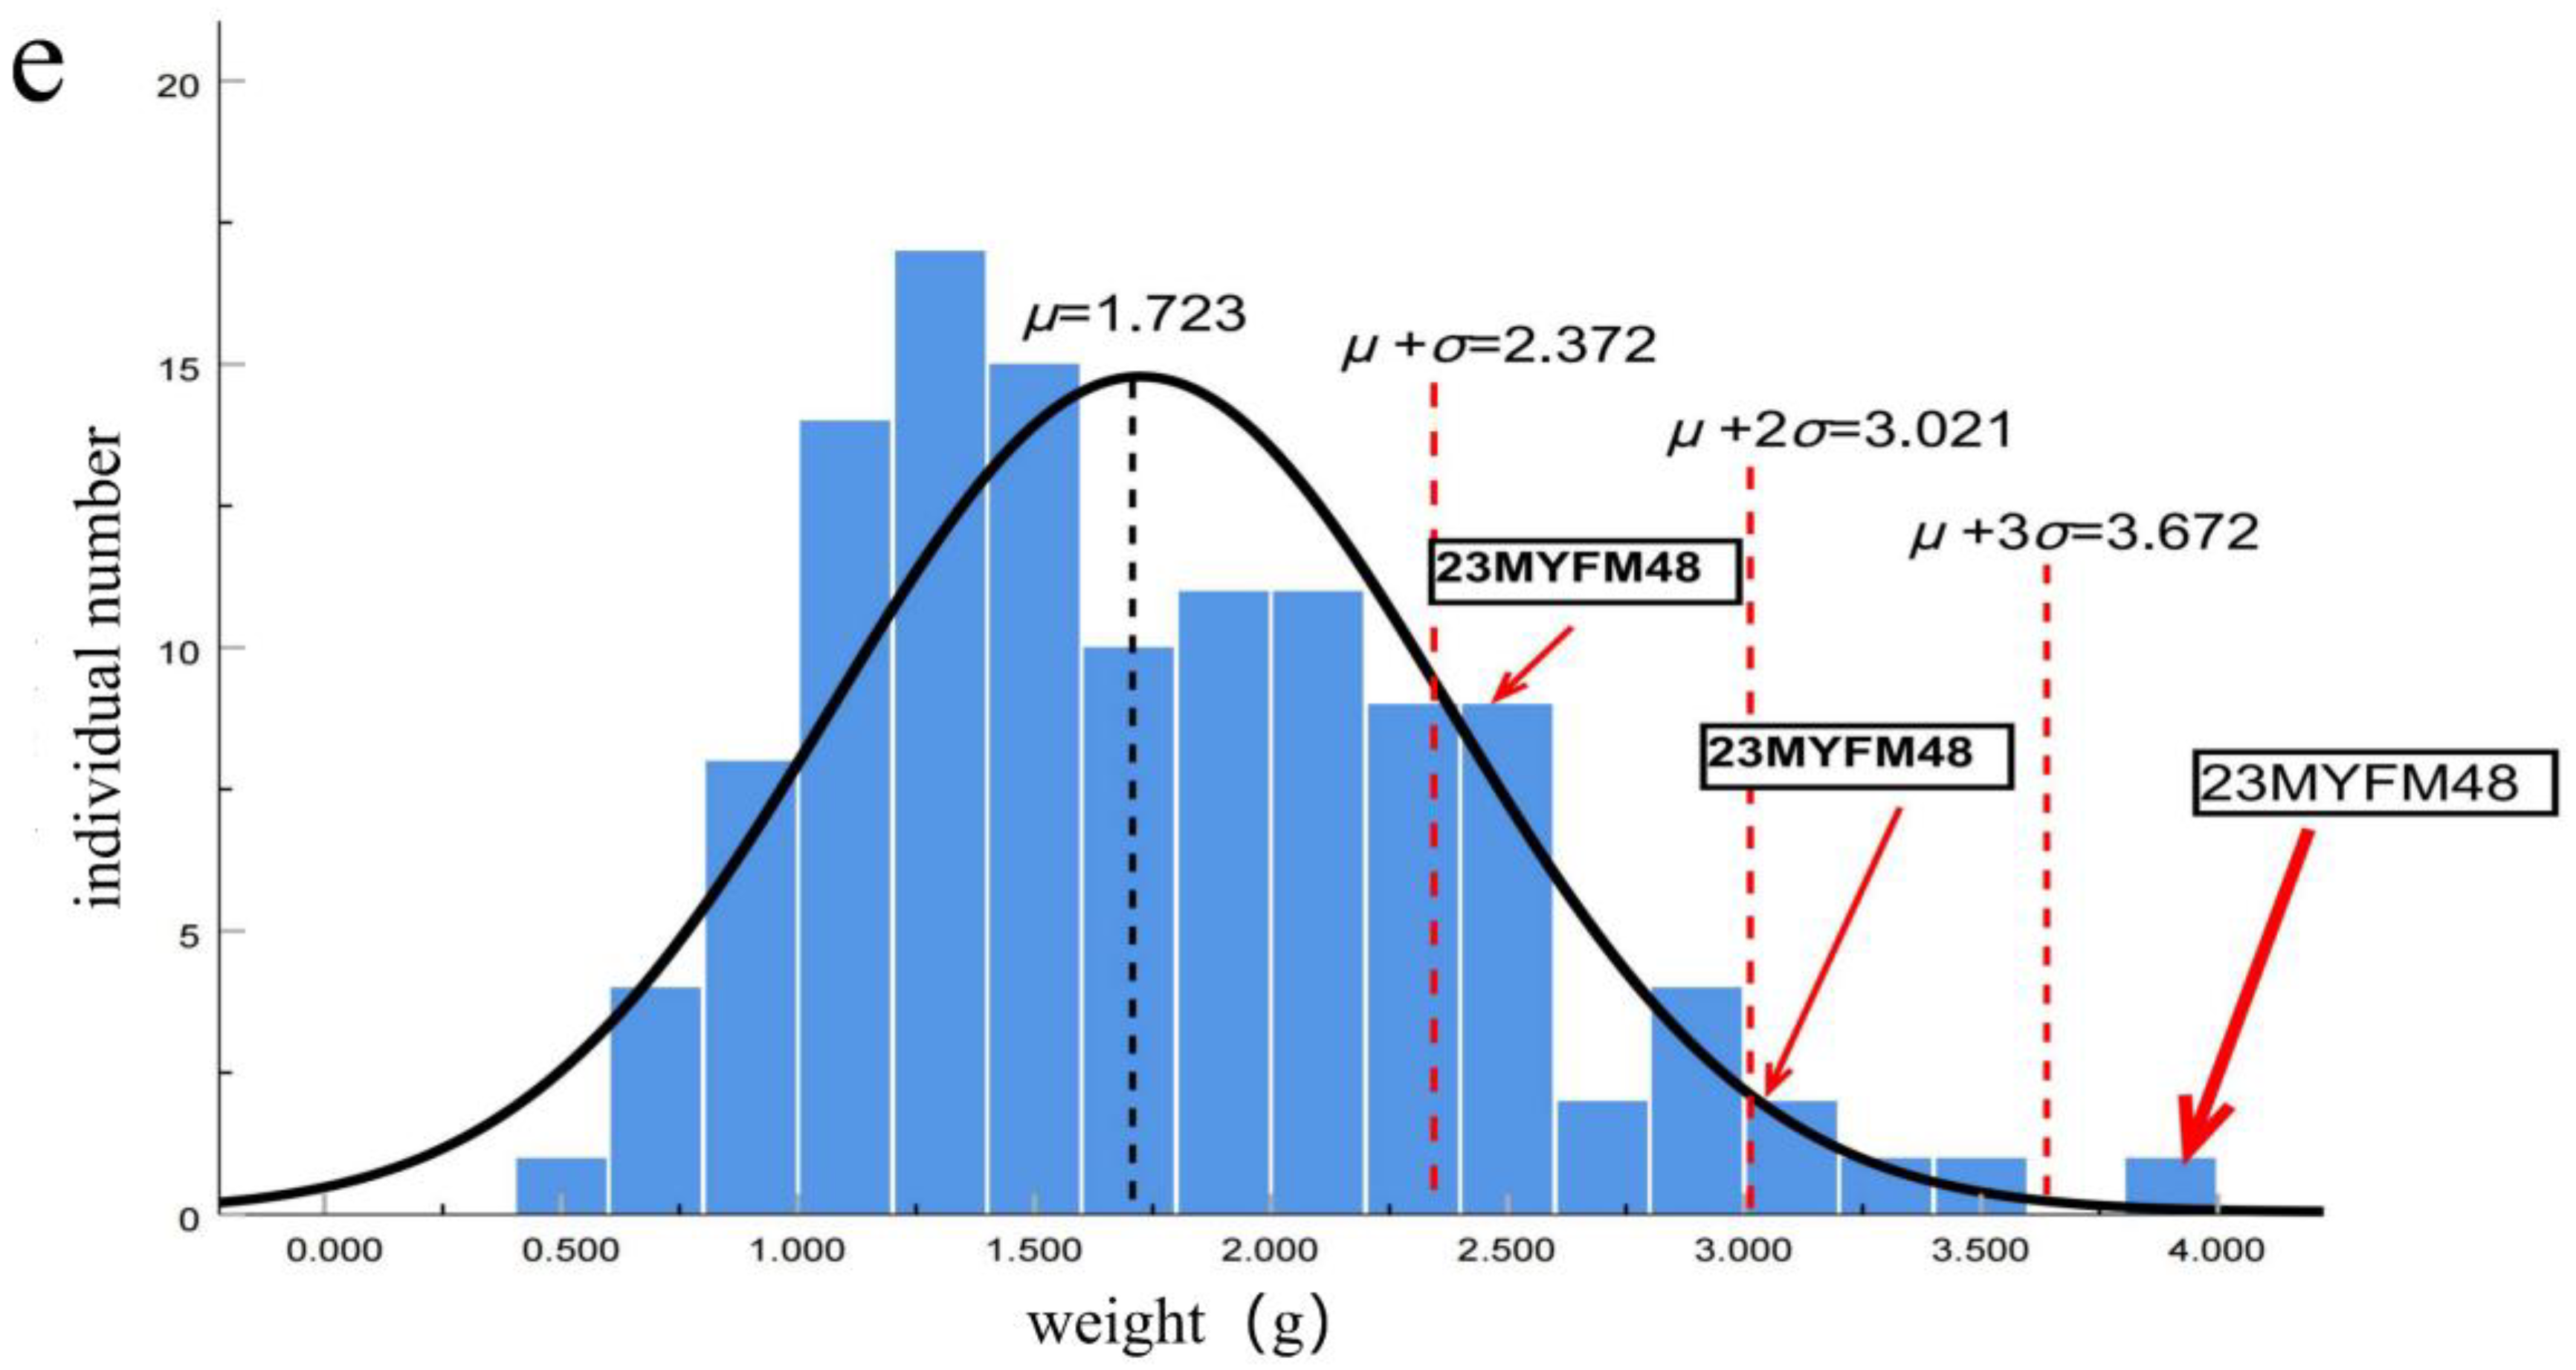
2.4.1. Weight of Tadpoles in Each Period

According to Gosner stages (GSs) [17], tadpole stages 0–20 are called the embryonic stage, stages 21–24 are the outer gill stage, and stage 25 is the tadpole stage, where they can swim freely for feeding. In stage 26, the hind legs begin to develop until the tail disappears completely at stage 46, marking the completion of metamorphosis. Stage 25 of R. catesbeiana is 45–110 days long, accounting for four fifths of the entire larval stage. High inter-individual variation exists in the deviation of developmental stages. In this study, the developmental stage at which a tadpole’s BMW (body maximum width) was greater than 2.5 mm was defined as stage 25-I, corresponding to the staging system frequently employed in actual production, which occurs roughly 10–29 days after incubation. Stage 25-II, or roughly 30–59 days after incubation, was described as the point at which the tadpole’s BMW was greater than 4.0 mm. Stage 25-III, roughly 60–80 days after incubation, was defined as the point at which the tadpole’s BMW was greater than 9.0 mm. These definitions indicated the various stages of stage 25 growth, and the weight of each tadpole in each family was recorded at each stage.

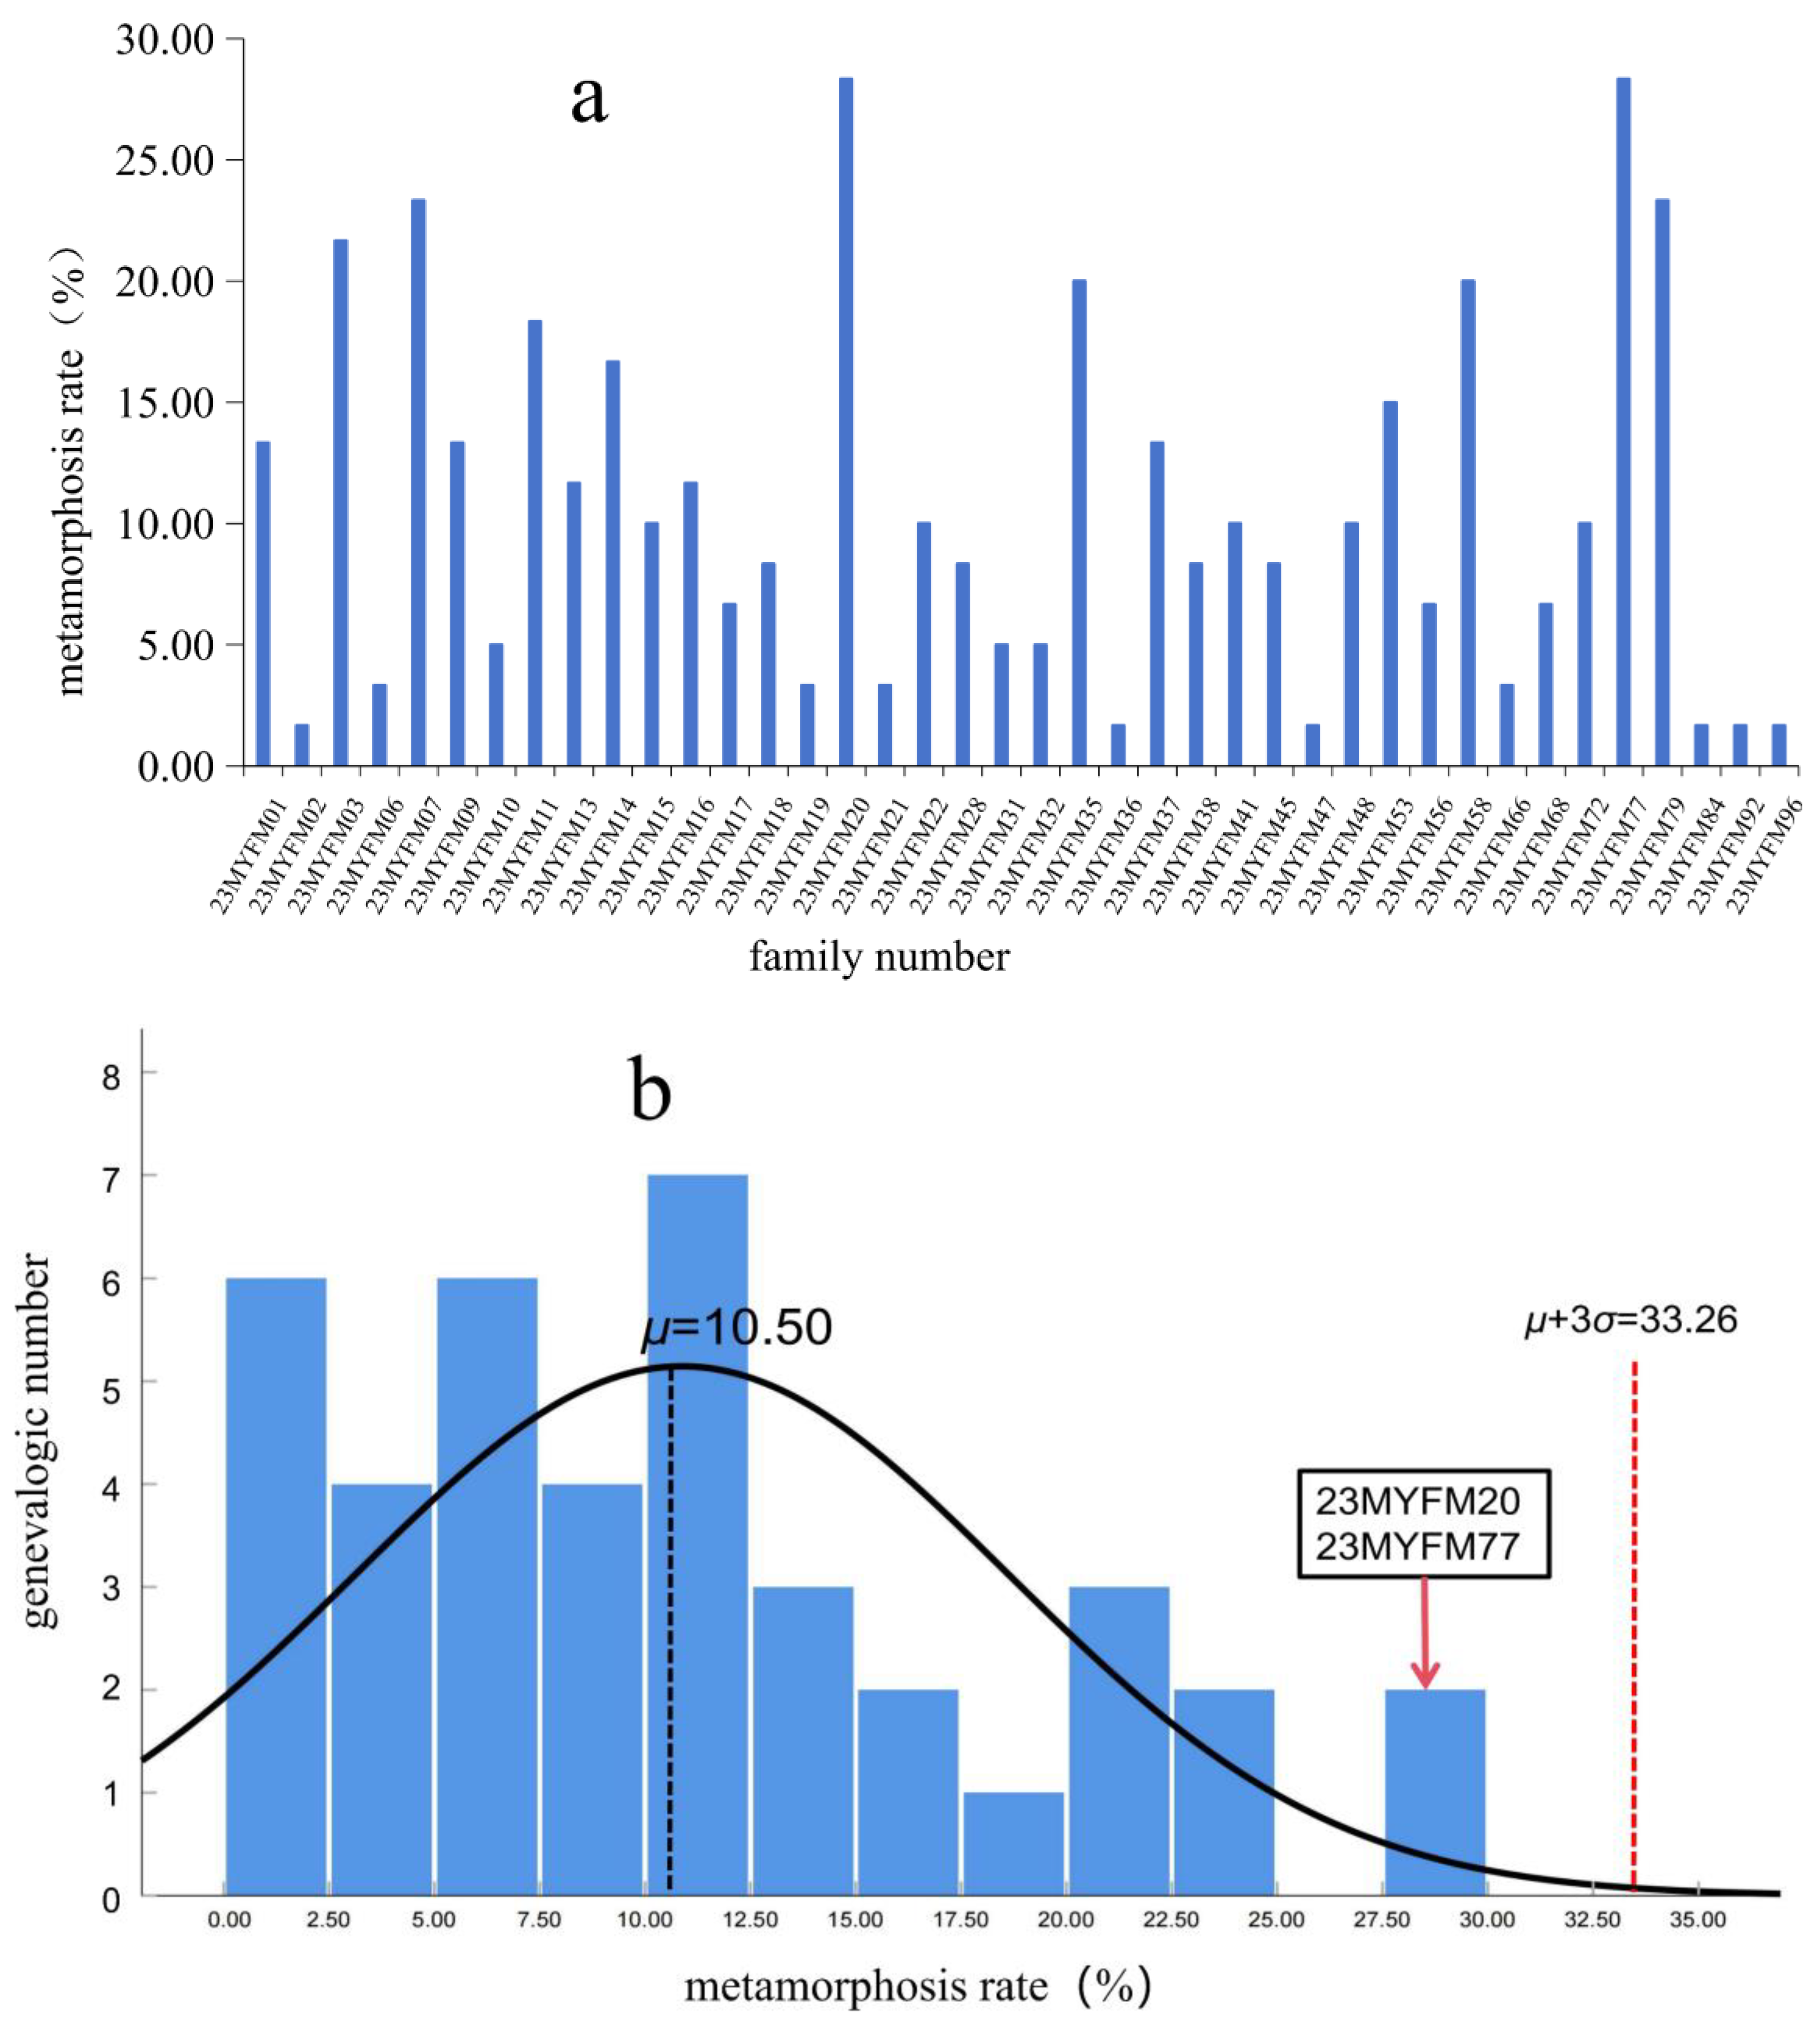
2.4.2. Metamorphosis Rate

The number of juvenile frogs that had completed metamorphosis after 120 days was recorded, and then, the metamorphosis rate of each family was calculated. The metamorphosis rate was defined as the proportion of juvenile frogs that completed metamorphosis as a fraction of the total number of juvenile frogs and tadpoles in captivity for each family.

2.4.3. Statistical Analysis

The heritability of traits was evaluated by the restricted maximum likelihood method using the R package ASReml-R 4.2 [18]. The variance of the traits was calculated using the animal model as follows:
y ijk = μ + a ijk + f ij + e ijk
where yijk represents the observation from the parent i and parent j for individual k; μ represents the population means; aijk represents the additive genetic effect value, namely, the breeding value; fij represents the common random effect of all all-sib families; and eijk denotes the random residuals. The formula for heritability evaluation is as follows:
h 2 = σ a 2 / σ a 2 + σ f 2 + σ e 2
where σ a 2 is the additive genetic variance, σ f 2 is the random effect variance, and σ e 2 is the residual variance. Weight heritability was calculated using the animal model; the residual variance was calculated using ASReml-R default parameters. A heritability value less than 0.10 is regarded as “low” heritability, 0.10–0.40 is “moderate”, and greater than 0.4 is “high” heritability [19]. The significance level of heritability was then tested using the method of Liu et al. [20]. The formula is as follows:
t = h 2 / σ
The mean of individual weight breeding values was used as the weight-related breeding value of families. Correlation was analyzed using SPSS 22.0, after which the genetic correlation between breeding values of weight and metamorphosis rate was assessed using the Pearson coefficient.

3. Results

By accounting for the weight and relative proportion of different developmental stages in each family at stage 25 (Figure 1a,b), family number 23MYFM11 had the maximum average weight of 0.05 g (Figure 1c), which was significantly higher than those in the other families. Moreover, the minimum average weight of the family was only 0.01 g. At stage 25-II, the average weight of the 40 families was 0.32 g (Figure 1d). Individuals in 50% of families in stage 25-III weighed between 1.40 and 1.90 g, and several individuals in family 23MYFM48 weighed as much as 3.87 g (Figure 1e). As shown in Figure 1, there was no correlation between weight at stage 25-I and stage 25-III. For instance, family 23MYFM48 presented the lowest mean of weight at stage 25-I but presented the opposite result at stage 25-III.
After 120 days of cultivation (Figure 2a), the metamorphosis rate was concentrated between 6–16%, and the number of families with a metamorphosis rate of 8–10% accounted for one-fourth of the total families (Figure 2b). In actual production, the metamorphosis rate of tadpoles is about 10–20%, and results of our study align with actual production. The highest metamorphosis rate was 28.3% (families 23MYFM20, 23MYFY77), which was significantly higher than other families and higher than most groups in actual production. The lowest metamorphosis rate was only 1.7% (families 23MYFM2, 23MYFM36, 23MYFM47, 23MYFM84, 23MYFM92, and 23MYFM96). The data showed that the earliest individual had undergone metamorphosis after 78 days, and some individuals did not complete metamorphosis for 150 days. Therefore, there is a large variation in the larval period among families, as well as between individuals in the same family.
As shown in Table 1, a relatively low heritability was estimated for the metamorphosis rate (0.18 ± 0.20), while the weight at stages 25-I, II, and III showed a high heritability. Moreover, stages 25-I and II showed a strong correlation with the metamorphosis rate (0.57 and 0.38, p < 0.05), and the correlation coefficient with stage 25-I was not significant (0.03, p > 0.05). The metamorphosis rate was significantly correlated only with 25-III’s weight at the genetic level (0.38, p < 0.05), but not growth (0.26, p > 0.05) or weight at stages 25-I (0.21, p > 0.05) and 25-II (−0.03, p > 0.05). Given the number of comparisons undertaken, Table 1’s significance level was Bonferroni-adjusted [21]. Only the metamorphosis rate was significantly associated with the phenotypic correlation of the stage 25-II weight (0.57, p < 0.005).

4. Discussion

4.1. Metamorphosis of Tadpoles

Tadpoles undergo metamorphosis to develop into amphibious juveniles, and the time of actual production is concentrated at 85–95 d. In contrast, tadpoles of the rice field frog, Quasipaa spinosa, take about three years to complete metamorphosis [22], and there is huge variation between individuals. Hence, we regard R. catesbeiana as more suitable for practical production due to its relatively short larval period and its advantage of high economic value.
To adapt to amphibious life, the morphology of tadpoles needs to change, including limb differentiation, gill and tail disappearance, alterations in the liver, and remodeling of the skin, gut, and cranial cartilage [23]. The distribution and vulnerability to predation of R. catesbeiana increase when it transitions from a tadpole in aquatic life to a young amphibious frog, and it strengthens its defense against predation [24]. Tadpole transformation has a direct impact on the financial advantages that farmers receive from selling young frogs during production. In conclusion, research on the metamorphosis of tadpoles has scientific significance as well as significance for guiding practical production. The occurrence of metamorphosis can be used as an evaluation index for production.

4.2. Weight and Metamorphosis Rate of Tadpoles

We found that the metamorphosis rate of tadpoles was moderately related to their weights at stages 25-II and 25-III. Tadpole metamorphosis is affected by hormone levels and nutrient accumulation. Body size gradually increases during growth but decreases after metamorphosis, which includes the disappearance of the tail and the growth of limbs. Some studies have shown that thyroid hormone content in tadpoles is kept at an extremely low level before metamorphosis, gradually increases with the process of metamorphosis, reaches the highest level at the climax of metamorphosis, and then gradually decreases [25,26]. Similarly, from the beginning of stage 21, the level of lipids begins to rise and reaches its highest level before the climax period of metamorphosis, then decreases in the late stage of metamorphosis [27]. The liver lipids of tadpoles of the Omei brown frog, Rana omeimontis, play a role in promoting and regulating metamorphosis [28]. The lipid accumulation of tadpoles is mostly concentrated in the tail and viscera, and the external manifestations are tail length and body broadening [26]. Tadpole weight is correlated with metamorphosis. Tadpoles with a longer tail and a greater body width were shown to weigh more and have a shorter larval duration and larger bodies after metamorphosis.
From the perspective of predation, the individual size of amphibians is positively correlated with their ability for rapid movement, and larger individuals have a higher survival rate when avoiding natural enemies in the wild [29]. Larger individuals have an advantage in dealing with adverse factors such as the environment [30] as well as interspecies [25,26] and intraspecific competition [27]. According to certain research [4], individuals undergoing shorter larval periods could have a larger body size, earlier feeding capacity, and lower mortality rate, whereas those with longer larval periods could have poor feeding ability and greater mortality rate. In production, smaller individuals with long larval periods could be preyed upon by young frogs with shorter larval periods and larger individual size. Further, sudden changes in their living environment during transformation are likely to cause mortality of almost 80% of smaller tadpoles. We also found that tadpoles died during the period of metamorphosis and subsequent development, with a mortality rate of about 10–20%, and the majority consisted of individuals with a long larval period. The major phenotypes of these individuals were lacking forelegs, although their tails had nearly or completely vanished, but their front legs were still covered in skin and could not stretch. Therefore, large tadpoles will have a stronger ability to complete metamorphosis and have a high survival rate.
Selective breeding is important to aquaculture production. Some selection methods, such as index selection methods, BLUP breeding value estimation, and other derived BLUP methods, have been widely used to breed high-performance families for certain traits in salmon and trout [31,32]. Metamorphosis rate, as a population-level trait, reflects the metamorphosis of the families in a population. In production, various factors affect the rate of metamorphosis in a family. The larval periods of some individuals may be too long, and individuals may die in large numbers. In this study, the breeding environment was basically the same. The larval periods of same-family individuals varied greatly. Individual mortality was higher in some families. These result in a low rate of metamorphosis within the family. The heritability of metamorphosis rate was only 0.18 ± 0.20. This estimate may indicate that the metamorphosis rate is affected by a variety of other factors. Correspondingly, a family’s metamorphosis rate may be higher if its tadpoles are heavier and there are more individuals with shorter larval periods. In the process of breeding, the combination of a solitary sire and a solitary dam to produce offspring can produce families naturally. The family selection method for R. catesbeiana has natural advantages. As a result, the weight in the larval stage can be used to select breeders for bullfrog species with high rates of metamorphosis.

4.3. Heritability and Correlation between Weight and Metamorphosis Rate

Berven [33] discovered varied heritability for growth (0.07–0.66) and moderate heritabilities for development (0.35) in wood frogs. The heritability of early growth and development traits differs greatly among different individuals in Acuracea [33]. Couch’s spadefoot, Scaphiopus couchii, has no substantial heritability for growth, although having high heritabilities of development (0.87) [34]. Tadpoles of the grass frog Rana temporaria exhibit low growth heritability (0–0.1) and significant development heritability (0.1–0.3) [35,36]. Spring peeper Pseudacris crucifer does not seem to have any appreciable heredity (less than 0.1) for either growth or development [37,38]. Lastly, the moderate heritability of growth rate for Rana temporaria tadpoles was 0.17 ± 0.11 [35]. Thus, the heritability of life-history traits can be quite variable among anurans. Similarly, the estimated heritability of weight and metamorphosis rate in this study was 0.13–0.99, with a wide range, which is similar to results of the above studies.
In this study, the heritability of weight at stage 25-I was at an extremely high level (0.99 ± 0.00). Kaplan [39] suggested that weight at this stage is greatly affected by the maternal effect. At this stage, the tadpole relies mainly on the nutrients stored in the body for nutrient supply. In production, a tadpole during this period does not feed much, there is a high probability of deformity and mechanical damage, and weak individuals are more likely to die during the process. This was also the case in our study, and the remaining individuals had small differences in weight. We think that individuals that survived showed relatively high levels of genetic adaptation under the environmental conditions of this study. At stages 25-I (48 d) and 25-III (100 d), the heritability of weight gradually reduced to 0.46 ± 0.12 and 0.44 ± 0.20, respectively. In production, the tadpoles at stage 25-II are about to enter the stage of development where their diets alter and their internal organs start to develop into those of the adult stage [40,41]. During this stage, most tadpoles show signs such as abdominal enlargement and the abdomen appears red. Similarly, individuals with such indications have a mortality rate of up to 80%. In comparison to previous stages, the tadpole’s growth rate in stage 25-II was faster. In this same period, tadpole sizes began to differ from one another. After Bonferroni correction was performed to minimize errors in the interpretation of interpretation of results, only the rate of metamorphosis was significantly associated with the phenotypic correlation of stage 25-II weight. In stage 25-III, the body-size difference between individuals was more obvious. With the growth and development of tadpoles, the difference in weight between individuals also increased. Some studies compared the different growth rates in different living environments of the same species [42], and concluded that the differences in the growth and development of bronze frog Rana clamitans are induced by the environment. For example, both feeding level and diet density during production have significant effects on tadpole size [43,44]. The development of the same group in the same location will also change with the environment [45]. Weight was quite different among individual tadpoles in the same family in the same breeding environment in our study. Different phenotypes are affected by environmental selection in different ways. Individual differences increase in response to specific stresses as environmental effects increase in the latter stages of tadpole development. Rose [46] wrote that this is due to the genetic differences in response to the living environment and interspecific competition. Thus, the differences are directly manifested as feeding and further reflected by the variation in weight. During the production process, weaker-feeding individuals will grow too small, have weaker disease resistance, or may die, whereas stronger-feeding individuals will grow larger, faster, and have stronger disease resistance. The present study found a gradual decrease in weight heritability with the advance of tadpole growth. Introducing time as a fixed effect, and combining the weight heritability of data from each developmental period, the estimated growth heritability (0.13 ± 0.06) was significantly lower than in a single developmental period. Tadpole size significantly affects both fitness and natural selection [35]. In conclusion, we think that the variations in tadpoles’ larval weight are caused by their distinctive genetic makeup. These results might indicate that compared with other stages, the development of stage 25-II is more related to subsequent growth, and thereby affect metamorphosis.
We found a significant phenotypic correlation between metamorphosis rate and both weights at stages 25-II (0.57, p < 0.05) and 25-III (0.38, p < 0.05), while there was no correlation with stage 25-I (−0.03, p > 0.05). There was a significant phenotypic correlation between weights in adjacent stages. In its genetic correlations, the metamorphosis rate was only moderately significantly associated with stage 25-III (0.38, p < 0.05), but not stages 25-I (0.21, p > 0.05) and 25-II (−0.03, p > 0.05). The genetic correlation between weight at the three stages was also not significant. As a study of the Pacific treefrog (Pseudacris regilla) showed [19], while there was no genetic association between individuals of different stages, there was a significant correlation between them in phenotype. From the genetic correlation between metamorphosis rate and weight at each stage, there was a significant correlation with metamorphosis in stage 25-III. This is similar to the barking treefrog Hyla gratiosa [47], which represents a similar size at metamorphosis. The advantage of weight mentioned above will make individual tadpoles more suitable for the environment, and continuously affect their viability after metamorphosis. Thus, we believe that the significant correlation of metamorphosis rate with weight in stage 25 is consistent with biological characteristics.
In this study, the heritability of the metamorphosis rate in bullfrog tadpoles was 0.18 ± 0.20, which is moderate and has selective breeding potential. Therefore, the proportion of genetic control in phenotypic effects was increased by positive assortative mating between families with high metamorphosis rates. Groups with high metamorphosis rates were selected by measuring tadpole weight before metamorphosis to shorten the production time and improve production efficiency. The stage 25-III weight as a breeding index is comparable to the selection that occurs after metamorphosis since it is near the onset of metamorphosis. There was minimal heredity at stages 25-II and 25-III, and the transformation rate was not substantially correlated with stage 25-II. To increase production efficiency and identify the weight during developmental stages that have a strong genetic correlation with the metamorphosis rate, it is necessary to weigh tadpoles between stages 25-II and 25-III. This practice will increase the accuracy and efficiency of subsequent breeding efforts to produce high-metamorphosis-rate lines.

5. Conclusions

The metamorphosis of tadpoles is crucial in the whole growth and development of R. catesbeiana and is important for the transition from aquatic tadpoles to amphibious young frogs. At the same time, the short larval period also makes R. catesbeiana individuals have greater survival at the amphibious stage. A short larval period has a natural advantage, and it is feasible to use it evaluate the rate of metamorphosis. According to the correlation between the weight of tadpoles and their metamorphosis rate, the metamorphosis rate of families can be estimated by the weight of tadpoles at different developmental stages, as well as by weighing tadpoles between stages 25-II and 25-III and estimating their heritability as well as the genetic and phenotypic association. The results of this study confirm the importance and portability of tadpole weight in actual seed production and provide basic data and a potential optimized direction for the selective breeding of high-metamorphosis-rate bullfrogs.

Author Contributions

W.X.: validation, data analysis, writing—original draft. Y.W.: data analysis, writing—review and editing. G.W.: conceptualization, methodology, funding acquisition. L.Z.: conceptualization, project administration, resources, supervision. G.Z.: methodology. Z.H.: resources. H.G.: supervision. All authors have read and agreed to the published version of the manuscript.

Funding

This research was supported by the National Natural Science Foundation of China (grant number 31602172) and the Industry-Academia-Research Project of Fujian (grant number 2021N5012).

Institutional Review Board Statement

This study was carried out according to the guidelines of the Declaration of Helsinki and was approved by the Animal Care Advisory Committee of Jimei University (Approval No. 2019-0906-003, 6 September 2019).

Data Availability Statement

The data presented in this study are available on request from the corresponding author.

Acknowledgments

We are grateful to all those who contributed to this manuscript.

Conflicts of Interest

The authors declare that there are no conflicts of interest.

References

  1. Kikuyama, S.; Kawamura, K.; Tanaka, S.; Yamamoto, K. Aspects of amphibian metamorphosis: Hormonal control. Int. Rev. Cytol. 1993, 145, 105–148. [Google Scholar]
  2. Rose, C.S. Hormonal control in larval development and evolution—Amphibians. In The Origin and Evolution of Larval Forms; Elsevier: Amsterdam, The Netherlands, 1999; p. 167-VI. [Google Scholar]
  3. Werner, E.E. Amphibian metamorphosis: Growth rate, predation risk, and the optimal size at transformation. Am. Nat. 1986, 128, 319–341. [Google Scholar] [CrossRef]
  4. Altwegg, R.; Reyer, H.U. Patterns of natural selection on size at metamorphosis in water frogs. Evolution 2003, 57, 872–882. [Google Scholar]
  5. Wilbur, H.M. Competition, predation, and the structure of the Ambystoma-Rana sylvatica community. Ecology 1972, 53, 3–21. [Google Scholar] [CrossRef]
  6. Brockelman, W.Y. An analysis of density effects and predation in Bufo americanus tadpoles. Ecology 1969, 50, 632–644. [Google Scholar] [CrossRef]
  7. Collins, J.P. A Comparative Study of the Life History Strategies in a Community of Frogs. Ph.D. Dissertation, University of Michigan, Ann Arbor, MI, USA, 1975. [Google Scholar]
  8. Berven, K.A. The genetic basis of altitudinal variation in the wood frog Rana sylvatica II. An experimental analysis of larval development. Oecologia 1982, 52, 360–369. [Google Scholar] [CrossRef] [PubMed]
  9. Smith-Gill, S.J.; Gill, D.E. Curvilinearities in the competition equations: An experiment with ranid tadpoles. Am. Nat. 1978, 112, 557–570. [Google Scholar] [CrossRef]
  10. Berven, K.A. Mate choice in the wood frog, Rana sylvatica. Evolution 1981, 35, 707–722. [Google Scholar] [CrossRef]
  11. Wilbur, H.M. Interactions of food level and population density in Rana sylvatica. Ecology 1977, 58, 206–209. [Google Scholar] [CrossRef]
  12. McDiarmid, R.W.; Altig, R. Tadpoles: The Biology of Anuran Larvae; University of Chicago Press: Chicago, IL, USA, 1999. [Google Scholar]
  13. Brooks, R.; Endler, J.A. Direct and indirect sexual selection and quantitative genetics of male traits in guppies (Poecilia reticulata). Evolution 2001, 55, 1002–1015. [Google Scholar] [CrossRef] [PubMed]
  14. Wilbur, H.M.; Collins, J.P. Ecological aspects of amphibian metamorphosis: Nonnormal distributions of competitive ability reflect selection for facultative metamorphosis. Science 1973, 182, 1305–1314. [Google Scholar] [CrossRef] [PubMed]
  15. McCoy, K.A.; McCoy, M.W.; Amick, A.; Guillette, L.J., Jr.; St. Mary, C.M. Tradeoffs between somatic and gonadal investments during development in the African clawed frog (Xenopus laevis). J. Exp. Zool. Part A Ecol. Genet. Physiol. 2007, 307, 637–646. [Google Scholar] [CrossRef] [PubMed]
  16. Collins, J.P. Intrapopulation variation in the body size at metamorphosis and timing of metamorphosis in the bullfrog, Rana catesbeiana. Ecology 1979, 60, 738–749. [Google Scholar] [CrossRef]
  17. Gosner, K.L. A simplified table for staging anuran embryos and larvae with notes on identification. Herpetologica 1960, 16, 183–190. [Google Scholar]
  18. Gilmour, A.R.; Gogel, B.J.; Cullis, B.R.; Welham, S.; Thompson, R. ASReml User Guide Release 1.0; University of Hamburg: Hamburg, Germany, 2002. [Google Scholar]
  19. Watkins, T.B. A quantitative genetic test of adaptive decoupling across metamorphosis for locomotor and life-history traits in the Pacific tree frog, Hyla regilla. Evolution 2001, 55, 1668–1677. [Google Scholar]
  20. Liu, X.L.; Chang, Y.Q.; Xiang, J.H.; Cao, X.B. Estimates of genetic parameters for growth traits of the sea urchin, Strongylocentrotus intermedius. Aquaculture 2005, 243, 27–32. [Google Scholar] [CrossRef]
  21. Rice, W.R. Analyzing tables of statistical tests. Evolution 1989, 43, 223–225. [Google Scholar] [CrossRef]
  22. Traijitt, T.; Kitana, N.; Khonsue, W.; Kitana, J. Chronological changes in the somatic development of Hoplobatrachus rugulosus (Wiegmann, 1834) (Anura: Dicroglossidae). Trop. Nat. Hist. 2021, 21, 184–199. [Google Scholar]
  23. Dodd, M.; Dodd, J. The biology of metamorphosis. Physiol. Amphib. 1976, 3, 467–599. [Google Scholar]
  24. Loman, J. Food, feeding rates and prey size selection in juvenile and adult frogs, Rana arvalis Nilss. and R. temporaria L. Ekol. Pol. 1979, 27, 581–601. [Google Scholar]
  25. Tollrian, R. Predator-induced morphological defenses: Costs, life history shifts, and maternal effects in Daphnia pulex. Ecology 1995, 76, 1691–1705. [Google Scholar] [CrossRef]
  26. Segers, F.H.; Taborsky, B. Juvenile exposure to predator cues induces a larger egg size in fish. Proc. R. Soc. B Biol. Sci. 2012, 279, 1241–1248. [Google Scholar] [CrossRef]
  27. Michimae, H.; Nishimura, K.; Tamori, Y.; Wakahara, M. Maternal effects on phenotypic plasticity in larvae of the salamander Hynobius retardatus. Oecologia 2009, 160, 601–608. [Google Scholar] [CrossRef] [PubMed]
  28. Zhu, W.; Zhang, M.; Chang, L.; Zhu, W.; Li, C.; Xie, F.; Zhang, H.; Zhao, T.; Jiang, J. Characterizing the composition, metabolism and physiological functions of the fatty liver in Rana omeimontis tadpoles. Front. Zool. 2019, 16, 42. [Google Scholar] [CrossRef] [PubMed]
  29. Kusano, T. Growth and survival rate of the larvae of Hynobius nebulosus tokyoensis Tago (Amphibia, Hynobiidae). Popul. Ecol. 1981, 23, 360–378. [Google Scholar] [CrossRef]
  30. Pakkasmaa, S.; Merilä, J.; O’Hara, R. Genetic and maternal effect influences on viability of common frog tadpoles under different environmental conditions. Heredity 2003, 91, 117–124. [Google Scholar] [CrossRef] [PubMed]
  31. Gjedrem, T.; Robinson, N.; Rye, M. The importance of selective breeding in aquaculture to meet future demands for animal protein: A review. Aquaculture 2012, 350, 117–129. [Google Scholar] [CrossRef]
  32. Vandeputte, M.; Quillet, E.; Chevassus, B. Early development and survival in brown trout (Salmo trutta fario L.): Indirect effects of selection for growth rate and estimation of genetic parameters. Aquaculture 2002, 204, 435–445. [Google Scholar] [CrossRef]
  33. Berven, K.A. The heritable basis of variation in larval developmental patterns within populations of the wood frog (Rana sylvatica). Evolution 1987, 41, 1088–1097. [Google Scholar]
  34. Newman, R.A. Genetic variation for larval anuran (Scaphiopus couchii) development time in an uncertain environment. Evolution 1988, 42, 763–773. [Google Scholar]
  35. Laurila, A.; Karttunen, S.; Merilä, J. Adaptive phenotypic plasticity and genetics of larval life histories in two Rana temporaria populations. Evolution 2002, 56, 617–627. [Google Scholar] [PubMed]
  36. Sommer, S.; Pearman, P.B. Quantitative genetic analysis of larval life history traits in two alpine populations of Rana temporaria. Genetica 2003, 118, 1–10. [Google Scholar] [CrossRef]
  37. Travis, J.; Emerson, S.B.; Blouin, M. A quantitative-genetic analysis of larval life-history traits in Hyla crucifer. Evolution 1987, 41, 145–156. [Google Scholar]
  38. Emerson, S.B.; Travis, J.; Blouin, M. Evaluating a hypothesis about heterochrony: Larval life-history traits and juvenile hind-limb morphology in Hyla crucifer. Evolution 1988, 42, 68–78. [Google Scholar] [PubMed]
  39. Kaplan, R.H. The implications of ovum size variability for offspring fitness and clutch size within several populations of salamanders (Ambystoma). Evolution 1980, 34, 51–64. [Google Scholar]
  40. Atkinson, B.G.; Warkman, A.S.; Chen, Y. Thyroid hormone induces a reprogramming of gene expression in the liver of premetamorphic Rana catesbeiana tadpoles. Wound Repair Regen. 1998, 6, S323–S336. [Google Scholar] [CrossRef]
  41. Rollins-Smith, L.A. Metamorphosis and the amphibian immune system. Immunol. Rev. 1998, 166, 221–230. [Google Scholar] [CrossRef] [PubMed]
  42. Berven, K.A.; Gill, D.E.; Smith-Gill, S.J. Countergradient selection in the green frog, Rana clamitans. Evolution 1979, 33, 609–623. [Google Scholar] [CrossRef]
  43. Murray, D.L. The effects of food and density on growth and metamorphosis in larval wood frogs (Rana sylvatica) from central Labrador. Can. J. Zool. 1990, 68, 1221–1226. [Google Scholar] [CrossRef]
  44. Berven, K.A.; Chadra, B.G. The relationship among egg size, density and food level on larval development in the wood frog (Rana sylvatica). Oecologia 1988, 75, 67–72. [Google Scholar] [CrossRef]
  45. Travis, J. Variation in development patterns of larval anurans in temporary ponds. I. Persistent variation within a Hyla gratiosa population. Evolution 1983, 37, 496–512. [Google Scholar] [CrossRef] [PubMed]
  46. Rose, C.S. Integrating ecology and developmental biology to explain the timing of frog metamorphosis. Trends Ecol. Evol. 2005, 20, 129–135. [Google Scholar] [CrossRef] [PubMed]
  47. Travis, J. Anuran size at metamorphosis: Experimental test of a model based on intraspecific competition. Ecology 1984, 65, 1155–1160. [Google Scholar] [CrossRef]
Figure 1. The weight distribution of each family. (a) Average weight of each family at each growth stage. (b) Relative proportion of the average weight at each developmental stage in each family. (ce) Normal distributions of individual weight in stages 25-I, 25-II, and 25-III, respectively. μ represents the mean, σ represents the standard deviation, and the weight value beyond the discrete interval (beyond μ ± 3σ) represents the weight value of an individual which is significantly higher than those of others.
Fishes 09 00105 g001aFishes 09 00105 g001bFishes 09 00105 g001c
Figure 2. The metamorphosis rate of each family. (a) Metamorphosis rate of each family. (b) Normal distribution of metamorphosis rate. μ represents the mean and σ represents the standard deviation.
Fishes 09 00105 g002
Table 1. Heritability of metamorphosis rate, stage 25-I weight, stage 25-II weight, stage 25-III weight, growth, with phenotypic (above diagonal) and genetic (below diagonal) correlations between these traits.
h2GrowthStage 25-I WeightStage 25-II WeightStage 25-III WeightMetamorphosis Rate
growth0.13 ± 0.06 ----
stage 25-I weight0.99 ± 0.000.20 0.40 *−0.030.21
stage 25-II weight0.46 ± 0.120.60 *0.22 0.42 *0.57 **
stage 25-III weight0.44 ± 0.200.66 *−0.03−0.09 0.38 *
metamorphosis rate0.18 ± 0.200.260.21−0.030.38 *
Significance: * p < 0.05; ** p < 0.005.
Disclaimer/Publisher’s Note: The statements, opinions and data contained in all publications are solely those of the individual author(s) and contributor(s) and not of MDPI and/or the editor(s). MDPI and/or the editor(s) disclaim responsibility for any injury to people or property resulting from any ideas, methods, instructions or products referred to in the content.

