Article

Molecular Characteristics, Expression Patterns, and Response of Insulin-like Growth Factors Gene Induced by Sex Steroid Hormones in Blotched Snakehead (Channa maculata)

1
Key Laboratory of Tropical and Subtropical Fishery Resources Application and Cultivation, Ministry of Agriculture and Rural Affairs, Pearl River Fisheries Research Institute, Chinese Academy of Fishery Sciences, Guangzhou 510380, China
2
College of Fisheries and Life Science, Shanghai Ocean University, Shanghai 201306, China
3
School of Life Sciences, Hunan University of Science and Technology, Xiangtan 411201, China
*
Authors to whom correspondence should be addressed.
Fishes 2024, 9(4), 120; https://doi.org/10.3390/fishes9040120
Submission received: 29 February 2024 / Revised: 27 March 2024 / Accepted: 27 March 2024 / Published: 28 March 2024
(This article belongs to the Special Issue Genetics and Breeding in Aquaculture)

Abstract

:
Insulin-like growth factors (IGFs) play central roles in the growth and development of vertebrates. Blotched snakehead (Channa maculata), an economically significant fish, exhibits obvious sexual dimorphism and achieves sexual maturity in one year. However, the role of IGFs in C. maculata remains unknown. Three IGF genes were identified in C. maculata, designated as CmIGF1-1, CmIGF1-2, and CmIGF2. The cDNA sequences of these genes are 1184, 655, and 695 bp, encoding putative proteins of 168, 131, and 215 amino acids, respectively, and all three proteins contain a conserved IGF domain. Quantitative real-time PCR (qPCR) revealed the predominant expression of CmIGFs in the liver of adult fish, with higher expression levels observed in males. Notably, CmIGF1-1, CmIGF1-2, and CmIGF2 displayed analogous expression profiles in the liver across various developmental stages, peaking at 365 days after hatching (dah). Subsequently, 600 individuals at 75 dah, at an early developmental stage, were randomly divided equally into six groups and reared in aerated 2 m × 2 m × 2 m cement ponds at 26.0 ± 1.0 °C. Following a one-week acclimatization period, fish without observed abnormalities were intraperitoneally injected with either 17α-ethynylestradiol (EE2) or 17α-methyltestosterone (MT) at a dose of 10 μg/g body weight. Three groups underwent short-term hormone treatment, and the remaining three groups underwent long-term hormone treatment, which included five injections at two-week intervals over ten weeks. The analysis of CmIGFs expression levels in the liver under different hormone treatments revealed that EE2 suppressed the expression of CmIGF1-1 and CmIGF1-2 while promoting CmIGF2 expression. In females, MT up-regulated the expression of CmIGF1-1 and CmIGF2 in a time-dependent manner, but consistently inhibited CmIGF2 expression. In males, MT promoted the expression of CmIGFs in a time-dependent manner, reaching peak levels for CmIGF1-1, CmIGF1-2, and CmIGF2 after 8, 10, and 2 weeks of injection, respectively. Additionally, CmIGF1 and CmIGF2 might exhibit a complementary relationship, with a compensatory increase in CmIGF2 expression in response to low CmIGF1 concentration. These findings highlight the potential key role of IGFs upon growth and their regulation by sex steroid hormones in C. maculata, providing a crucial foundation for future research aimed at elucidating the molecular mechanisms underlying the growth dimorphism between female and male blotched snakeheads.
Key Contribution: This study shows, for the first time, the presence of three insulin-like growth factor genes (CmIGF1-1, CmIGF1-2, and CmIGF2) in the economically significant blotched snakehead (Channa maculata), and elucidates their predominant expression in liver, with higher levels observed in males. Furthermore, it demonstrates the regulatory impact of sex steroid hormones (EE2 and MT) on the expression of CmIGFs. These findings highlight the potential key role of IGFs in growth and their regulation by sex steroid hormones in blotched snakehead (C. maculata), providing a foundation for future research aimed at elucidating the molecular mechanisms underlying the growth dimorphism between female and male blotched snakeheads.

1. Introduction

The growth hormone/insulin-like growth factor (GH/IGF) axis plays a vital role in vertebrate growth, encompassing key molecules such as growth hormone (GH), growth hormone receptor (GHR), insulin-like growth factor (IGF), and their associated binding proteins and receptors, including IGF-binding proteins (IGFBPs) and IGF receptors (IGF1R and IGF2R) [1]. GH secretion is regulated by the anterior pituitary gland, which responds to various hormones released from the hypothalamus, notably growth hormone-releasing hormone (GHRH) and growth hormone-releasing peptide (GHRP). GH travels to the liver through the bloodstream, where it rapidly binds to GHR, initiating a cascade of cellular signaling events that culminate in the secretion of IGFs [2]. Subsequently, IGFs travel through body fluids to various tissues, promoting cell growth and differentiation. GH, GHR, and IGFs orchestrate biological growth and development through close coordination during the different development stages of an organism’s lifespan [2,3].
IGFs have garnered considerable attention across various species because of their vital role in growth regulation. IGFs are highly conserved and primarily include two types, IGF-1 and IGF-2 [4]. In mammals, IGF-1 primarily governs postnatal growth and development, while IGF-2 plays a crucial role during embryonic development, influencing processes such as cell proliferation, differentiation, migration, and apoptosis [5]. The IGF-1 gene in fish was first cloned from Coho salmon (Oncorhynchus kisutch) [6] and subsequently identified in other fish species, such as gopher rockfish (Sebastes carnatus) [7], Nile tilapia (Oreochromis niloticus) [8], zebrafish (Danio rerio) [9], tongue sole (Cynoglossus semilaevis) [10], yellow catfish (Pelteobagrus fulvidraco) [11], and spotted scat (Scatophagus argus) [12]. IGF-1 exhibits widespread expression in various tissues, particularly expressed in the liver of gopher rockfish (S. carnatus) [7], Nile tilapia (O. niloticus) [8], yellow catfish (P. fulvidraco) [11], and spotted scat (S. argus) [12]. Additionally, in Nile tilapia (O. niloticus) and yellow catfish (P. fulvidraco), males exhibit higher IGF-1 expression levels than females. On the other hand, IGF-2 in fish was initially cloned from rainbow trout (Oncorhynchus mykiss) [13] and subsequently identified in other fish species, such as zebrafish (D. rerio) [9], medaka (Oryzias latipes) [14], and spotted scat (S. argus) [12]. Studies have reported the expression patterns of IGF-2 during embryonic development in Nile tilapia (O. niloticus) [8], zebrafish (D. rerio) [9], medaka (O. mykiss) [14], and spotted scat (S. argus) [12]. In zebrafish (D. rerio), the expression of IGF-2 initiates at the gastrula stage and exhibits a gradual increase throughout embryonic development [9], and the disruption of IGF-2 results in embryonic lethality [15]. The expression profile of IGF-2 mRNA closely mirrors that of IGF-1, expressed in diverse tissues, and particularly pronounced in the liver. Furthermore, IGF-1 or IGF-2 exhibit different subtypes in a few fish species, including IGF-1a and IGF-1b in giant grouper (Epinephelus lanceolatus) [16] and IGF-2a and IGF-2b in grass carp (Ctenopharyngodon idellus) [17].
The synthesis and secretion of sex steroid hormones by the gonads are pivotal in regulating the hypothalamus–pituitary–liver axis in vertebrates [18]. Cumulative evidence indicates that sex steroid hormones can impact the growth and development of vertebrates by modulating the synthesis and secretion of IGFs [18,19,20]. In rainbow trout (O. mykiss) [21], testosterone (T) induction has been shown to stimulate the mRNA expression of IGF1 and IGF2, while treatment with 17α-estradiol (E2) decreases IGF1 expression. In Nile tilapia (O. niloticus), the long-term injection of E2 in females dramatically increases IGF-1 expression levels in the liver [22], and MT strongly enhances IGF-1 expression in males, albeit without significant effects on females [23]. These findings suggest that sex steroid hormones can regulate IGFs expression in fishes, with potential variation among species [24,25]. However, the underlying mechanisms remain unclear and warrant further investigation.
Blotched snakehead (Channa maculata), a member of the Channidae family, is widely farmed in China for its palatable taste, high protein content, and pharmacological properties [26]. Male snakeheads exhibit faster growth rates and bigger sizes than females; given the demand for large individuals in the market, it is imperative to understand the molecular mechanism of growth disparities between male and female individuals, which will provide a theoretical basis for selective breeding in production practices [27]. Previous studies have demonstrated the crucial role of the GH gene in the growth of blotched snakehead (C. maculata) [28]. This research aims to illustrate the function of the IGFs in the GH/IGF axis and explore their expression patterns during ontogeny and in adult tissues. Moreover, the effects of exogenous hormone induction via EE2 and MT on the expression levels of IGFs in both male and female individuals were investigated. This work endeavors to provide insight into the basic function of IGFs and offers novel perspectives for exploring the molecular mechanisms underlying the growth disparities between male and female blotched snakehead.

2. Materials and Methods

2.1. Fish and Sampling

Blotched snakeheads in this study were reared in the fish laboratory of the Model Animal Research Center, Pearl River Fisheries Research Institute (Guangzhou City, Guandong Province, China). The fish were cultivated in an open system, with water quality parameters meeting aquaculture standards. Specifically, dissolved oxygen levels exceeded 6–8 mg/L, ammonia nitrogen remained below 0.5 mg/L, nitrite levels were less than 0.01 mg/L, and pH values were 7.0–7.5. Water exchange occurred every three days at a 20% exchange rate. To mimic natural environmental conditions, the lighting followed a 12 h day and night cycle. The fish were fed with a commercial diet provided by Nanhai Bairong Improved Aquatic Seed Co., Ltd. (FoShan City, Guangdong Province, China), comprising 45% protein, 5% fat, and 27% carbohydrates, ensuring the balanced nutritional intake that is suitable for snakehead growth requirements. The feeding ratio was adjusted according to the growth stage and size of the fish, following the manufacturer’s recommendations. One-year-old male and female fish were randomly selected, respectively, and a small piece of fin tissue was sampled for the subsequent genomic DNA (gDNA) extraction and the cloning of gDNA sequences of IGF genes. Additionally, twelve tissue samples (gill (G), liver (L), spleen (S), intestines (I), middle kidney (MK), muscle (M), head kidney (HK), gonad [ovary (O)/testis (T)], heart (H), pituitary (P), hypothalamus (HY) and brain (B)) were collected from the blotched snakeheads (n = 3). Tissues were collected under sterile conditions, with each tissue individually removed using sterile instruments to prevent cross-contamination. The collected tissues were immediately snap-frozen in liquid nitrogen and stored at −80 °C to maintain RNA integrity for subsequent RNA extraction, cDNA cloning, and the assessment of IGF distribution patterns.
To analyze IGF expression levels in the liver, samples were collected from male and female blotched snakeheads (n = 5) at various developmental stages (45, 75, 105, 135, 165, 195, and 365 dah) after anesthetization. Genetic sex was identified by sex-specific molecular markers, as previously described [29]. All fish experiments were conducted following the regulations outlined in the National Institutes of Health guide for the care and use of laboratory animals (https://olaw.nih.gov/resources/publications/guide-care-2011.htm, accessed on 1 January 2024).

2.2. Hormone Treatment

Healthy individuals at 75 dah (n = 600; body length: 15.1 ± 0.4 cm; body weight: 67. 9 ± 4.3 g) were randomly divided into six groups, each comprising 100 individuals. These fish were reared in 2 m × 2 m × 2 m aerated cement ponds at 26.0 ± 1.0 °C. After a one-week acclimatization period, the fish with no abnormal clinical signs were subjected to further studies. Sex steroid hormones, EE2 and MT (Aladdin, Shanghai, China) were dissolved in corn oil prior to intraperitoneal injection. Three groups underwent short-term hormone treatment: the first group received an intraperitoneal injection of MT (10 μg/g body weight); the second group was intraperitoneally injected with EE2 (10 μg/g body weight); and the third group served as the control, receiving an intraperitoneal injection of corn oil [26]. Liver samples were collected from male and female individuals (n = 5) at 24, 48, 72, 96, 120, and 144 h post-injection. Genetic sex was determined using the same method as previously described [29]. The remaining three groups underwent a long-term hormone treatment, which consisted of five injections at two-week intervals over a ten-week period. At each injection, the fourth group received an intraperitoneal injection of MT (10 μg/g body weight), the fifth group received EE2 (10 μg/g body weight) intraperitoneally, and the sixth group served as the control, receiving an intraperitoneal injection of corn oil. Liver samples were collected from male and female individuals (n = 5) at 2, 4, 6, 8, and 10 weeks post-injection, and genetic sex identification was performed as previously described [29]. Subsequently, all samples were immediately frozen in liquid nitrogen and stored at −80 °C before RNA extraction.

2.3. RNA Extraction and cDNA Synthesis

The total RNA was extracted from tissue samples utilizing TRIzol reagent (Invitrogen, Carlsbad, CA, USA) following the manufacturer’s protocol. The quality and quantity of RNA were assessed using a spectrophotometer (ThermoFisher, Waltham, MA, USA), and RNA integrity was detected by electrophoresis using a 1.0% agarose gel. Subsequently, total RNA extracted from tissue samples of different individuals under the same conditions was pooled in equal amounts for cDNA synthesis. The synthesis of the first-strand cDNA was performed utilizing the pooled RNA, a random hexamer primer (Takara, Osaka, Japan), and M-MLV Reverse Transcriptase (Promega, Fitchburg, WI, USA). To obtain both 5′- and 3′-RACE Ready cDNA, the SMARTTM RACE cDNA Amplification Kit (Takara, Japan) was employed. Finally, cDNA template for qPCR was synthesized using the ReverTra Ace qPCR RT Kit (Toyobo, Tokyo, Japan) with the pooled RNA as the template.

2.4. Full-Length cDNA Cloning and Sequence Analysis for IGFs in Blotched Snakehead (C. maculata)

Three IGF genes were identified in the blotched snakehead genome (SRA Accession No. PRJNA730430) [30]. Primers were specifically designed to verify the predicted cDNA sequences. To obtain the 5′ and 3′ untranslated regions (UTRs), specific and adapter primers were designed using 5′-RACE- and 3′-RACE-ready cDNA as templates, with primers within the UTRs designed accordingly (Table 1). PCR amplification was performed by 2 × Super Pfx MasterMix (Cwbio, Taizhou, China). The amplified products of the expected size were purified using a Gel Extraction Kit (Omega, Norwalk, CT, USA). The purified products were cloned into a pMD-19T vector (Takara, Japan) and transformed into competent Escherichia coli DH5α cells (Takara, Japan). Positive colonies including the target fragments were sequenced by a commercial company (Tianyihuiyuan, Guangzhou City, Guangdong Province, China).
Sequence analysis of CmIGFs was conducted using the Sequence Manipulation Suite (STS) (http://www.bio-soft.net/sms/, accessed on 10 January 2024). Domain features of the IGF proteins were predicted utilizing the Simple Modular Architecture Research Tool (SMART) (http://smart.embl-heidelberg.de, accessed on 15 January 2024). Physicochemical properties of the IGF proteins were predicted by ExPASy-Protparam Tool (https://web.expasy.org/protparam/, accessed on 15 January 2024). IGF protein sequences from other species were retrieved from the NCBI database (http://www.ncbi.nlm.nih.gov/, accessed on 15 January 2024). Multiple amino acid sequence alignments were performed using ClustalX 2.1 (http://www.ebi.ac.uk/tools/clustalx2.1, accessed on 15 January 2024), and a phylogenetic tree was constructed using Mega 5.0 software (http://www.megasoftware.net/index.html, accessed on 15 January 2024) with the neighbor-joining method and bootstrap resampling (1000 replicates) [31].

2.5. Cloning the Genomic Sequence of IGFs Genes in Blotched Snakehead (C. maculata)

The gDNA was extracted from fin tissues using the General AllGen Kit (CWBio, Taizhou, China) following the manufacturer’s protocol. Specific primers (Table 2) were designed according to the predicted genome sequences of IGFs obtained from the blotched snakehead genome [30]. Subsequently, the genomic sequences of CmIGFs were amplified using these primers and the fin gDNA as the template. The PCR products were sequenced to obtain the genomic sequences of CmIGFs, which were then compared with the cDNA sequences to identify exons and introns based on the GT/AG principle.

2.6. Quantitative Real-Time PCR (qPCR)

Gene-specific primers were designed for quantifying the expression of CmIGFs using qPCR. β-actin and EF1α genes were selected as reference genes according to our previous study [26,32]. qPCR was performed utilizing the StepOnePlusTM Real-Time PCR System (ABI, Los Angeles, CA, USA) by SYBR® Green Realtime PCR Master Mix (Toyobo, Osaka, Japan), and each sample was subjected to three replications. For normalization, the geometric mean of the Ct values of both β-actin and EF1α was calculated for each sample. The expression levels of CmIGFs in adult tissues and developmental stages were calculated by the 2−∆∆Ct method [33]. The expression levels of CmIGFs in female gills were used as the baseline (1.0) for tissue expression pattern analysis, and the expression levels of CmIGFs in the liver of 45 dah males were used as the baseline (1.0) for the developmental expression pattern analysis. The expression levels of CmIGFs after hormone treatment were calculated using the 2∆Ct method [26].

2.7. Statistical Analysis

The experimental data were displayed as mean (n = 3) ± standard error of the mean (S.E.M). Two-way ANOVA was conducted in SPSS (version 22.0; SPSS, Chicago, IL, USA). When significant differences were observed among factors, one-way ANOVA was conducted, followed by Tukey’s test. p < 0.05 was considered to indicate statistical significance.

3. Results

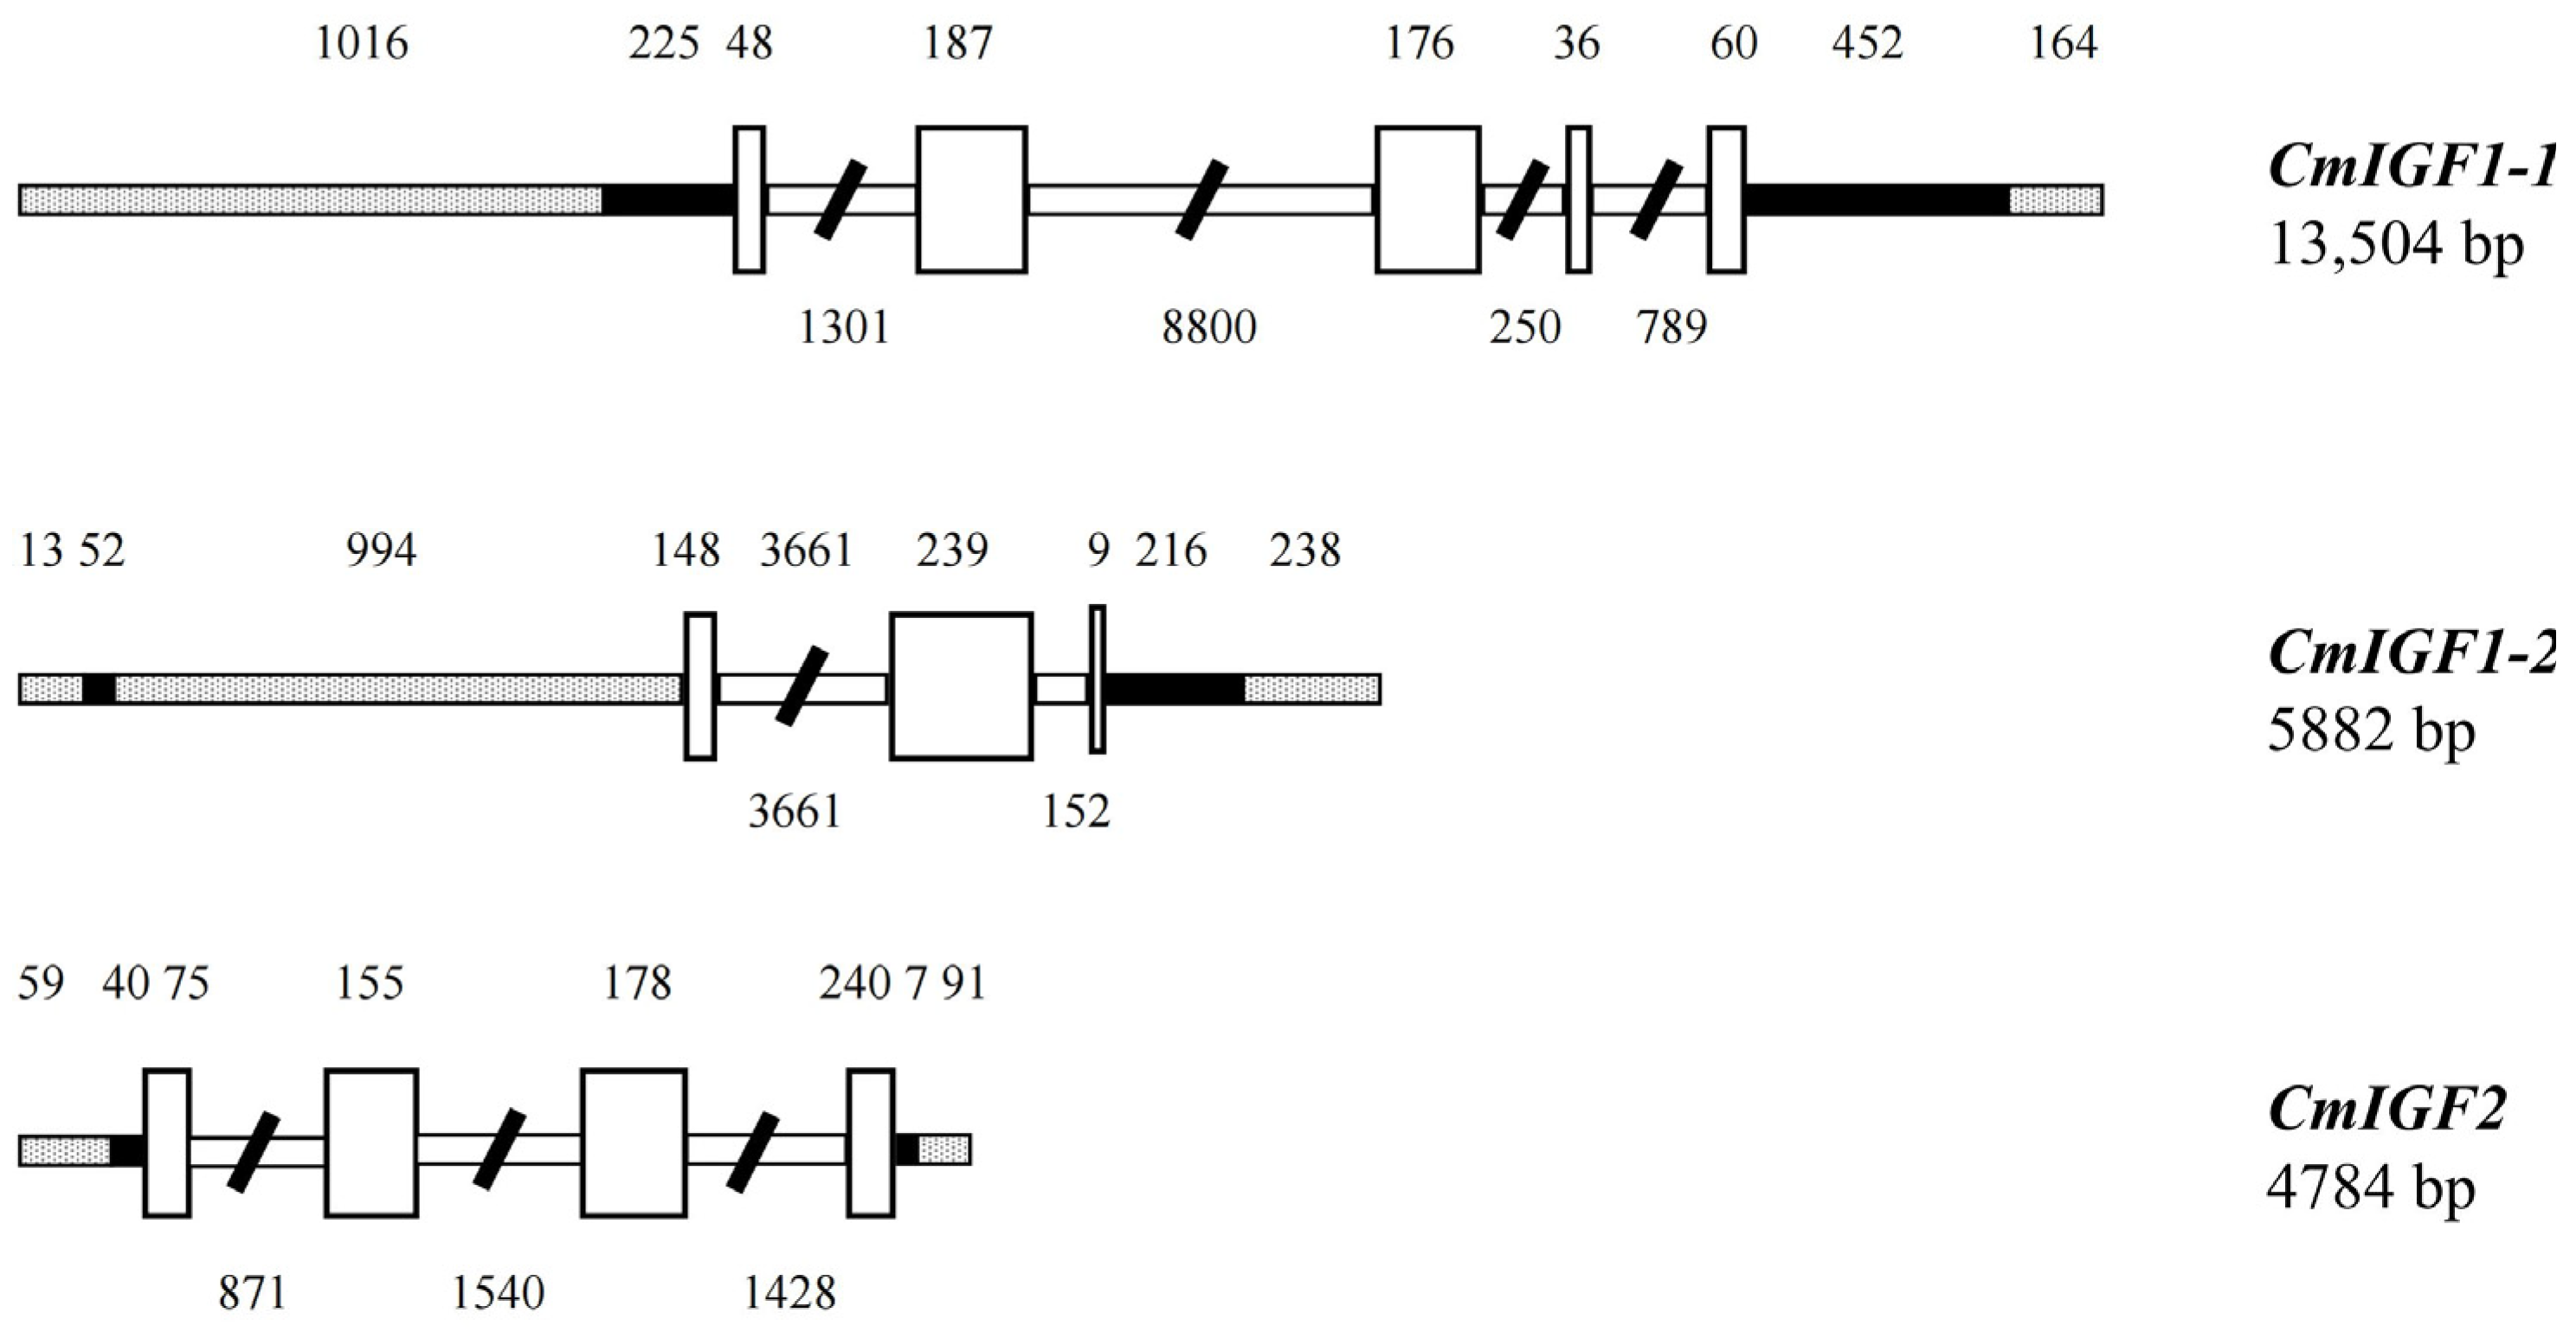
3.1. Characterization of CmIGFs

After PCR amplification and sequencing, a 1184-bp CmIGF1-1 cDNA sequence (GenBank No. MW715800) was obtained. It included a 255-bp 5′-UTR, a 507-bp open reading frame (ORF) encoding 168 amino acids (aa), and a 452-bp 3′-UTR with RNA instability motifs (ATTTA), and a poly(A) tail. The analysis of the putative protein revealed the presence of a signal peptide (aa 1–43) and an IGF domain (aa 56–112) (Figure S1a). The genomic sequence of CmIGF1-1, obtained through amplification, sequencing, and alignment, spanned 13,504 bp. It consisted of five exons with lengths of 48, 187, 176, 36 and 60 bp, and four introns measuring 1301, 8800, 250 and 789 bp, respectively (Figure 1). It was in line with the GT/AG rule.
The homologous CmIGF1-2 was also determined to be 675 bp in length (GenBank No. MW715801), comprising a 58-bp 5′-UTR, a 396-bp ORF encoding 131 aa, and a 211-bp 3′-UTR with a typical AATAA and a poly (A) tail. The bioinformatics analysis of the putative protein indicated the presence of a signal peptide (aa 1–26) and an IGF domain (aa 27–83) (Figure S1b). CmIGF1-2 shared an amino acid sequence homology of 83.29% with CmIGF1-1. After sequence identification, a genomic sequence of 5882 bp in length was obtained, comprising three exons (148, 239, and 9 bp) and two introns (3661 and 152 bp) following the GT/AG consensus rule (Figure 1).
The sequence of CmIGF2 was determined to be 695 bp in length (GenBank No. MW715802) with an ORF of 648 bp encoding 215 aa, a 5′-UTR of 40 bp, and a 3′-UTR of 7 bp. The putative protein was determined to have an IGF domain (aa 53–110) and an IGF2_C domain (aa 147–202) (Figure S1c). When comparing the amino acid sequences of CmIGF2 and CmIGF1-1 with CmIGF1-2, the similarities were 50.40% and 54.08%, respectively. The genomic sequence of CmIGF2 was 4784 bp long, comprising four exons (75, 155, 178, and 240 bp) and three introns that were 871, 1540, and 1428 bp in size, respectively (Figure 1). All introns began with GT and ended with AG, which was consistent with the splicing rules between exons and introns in eukaryotes.

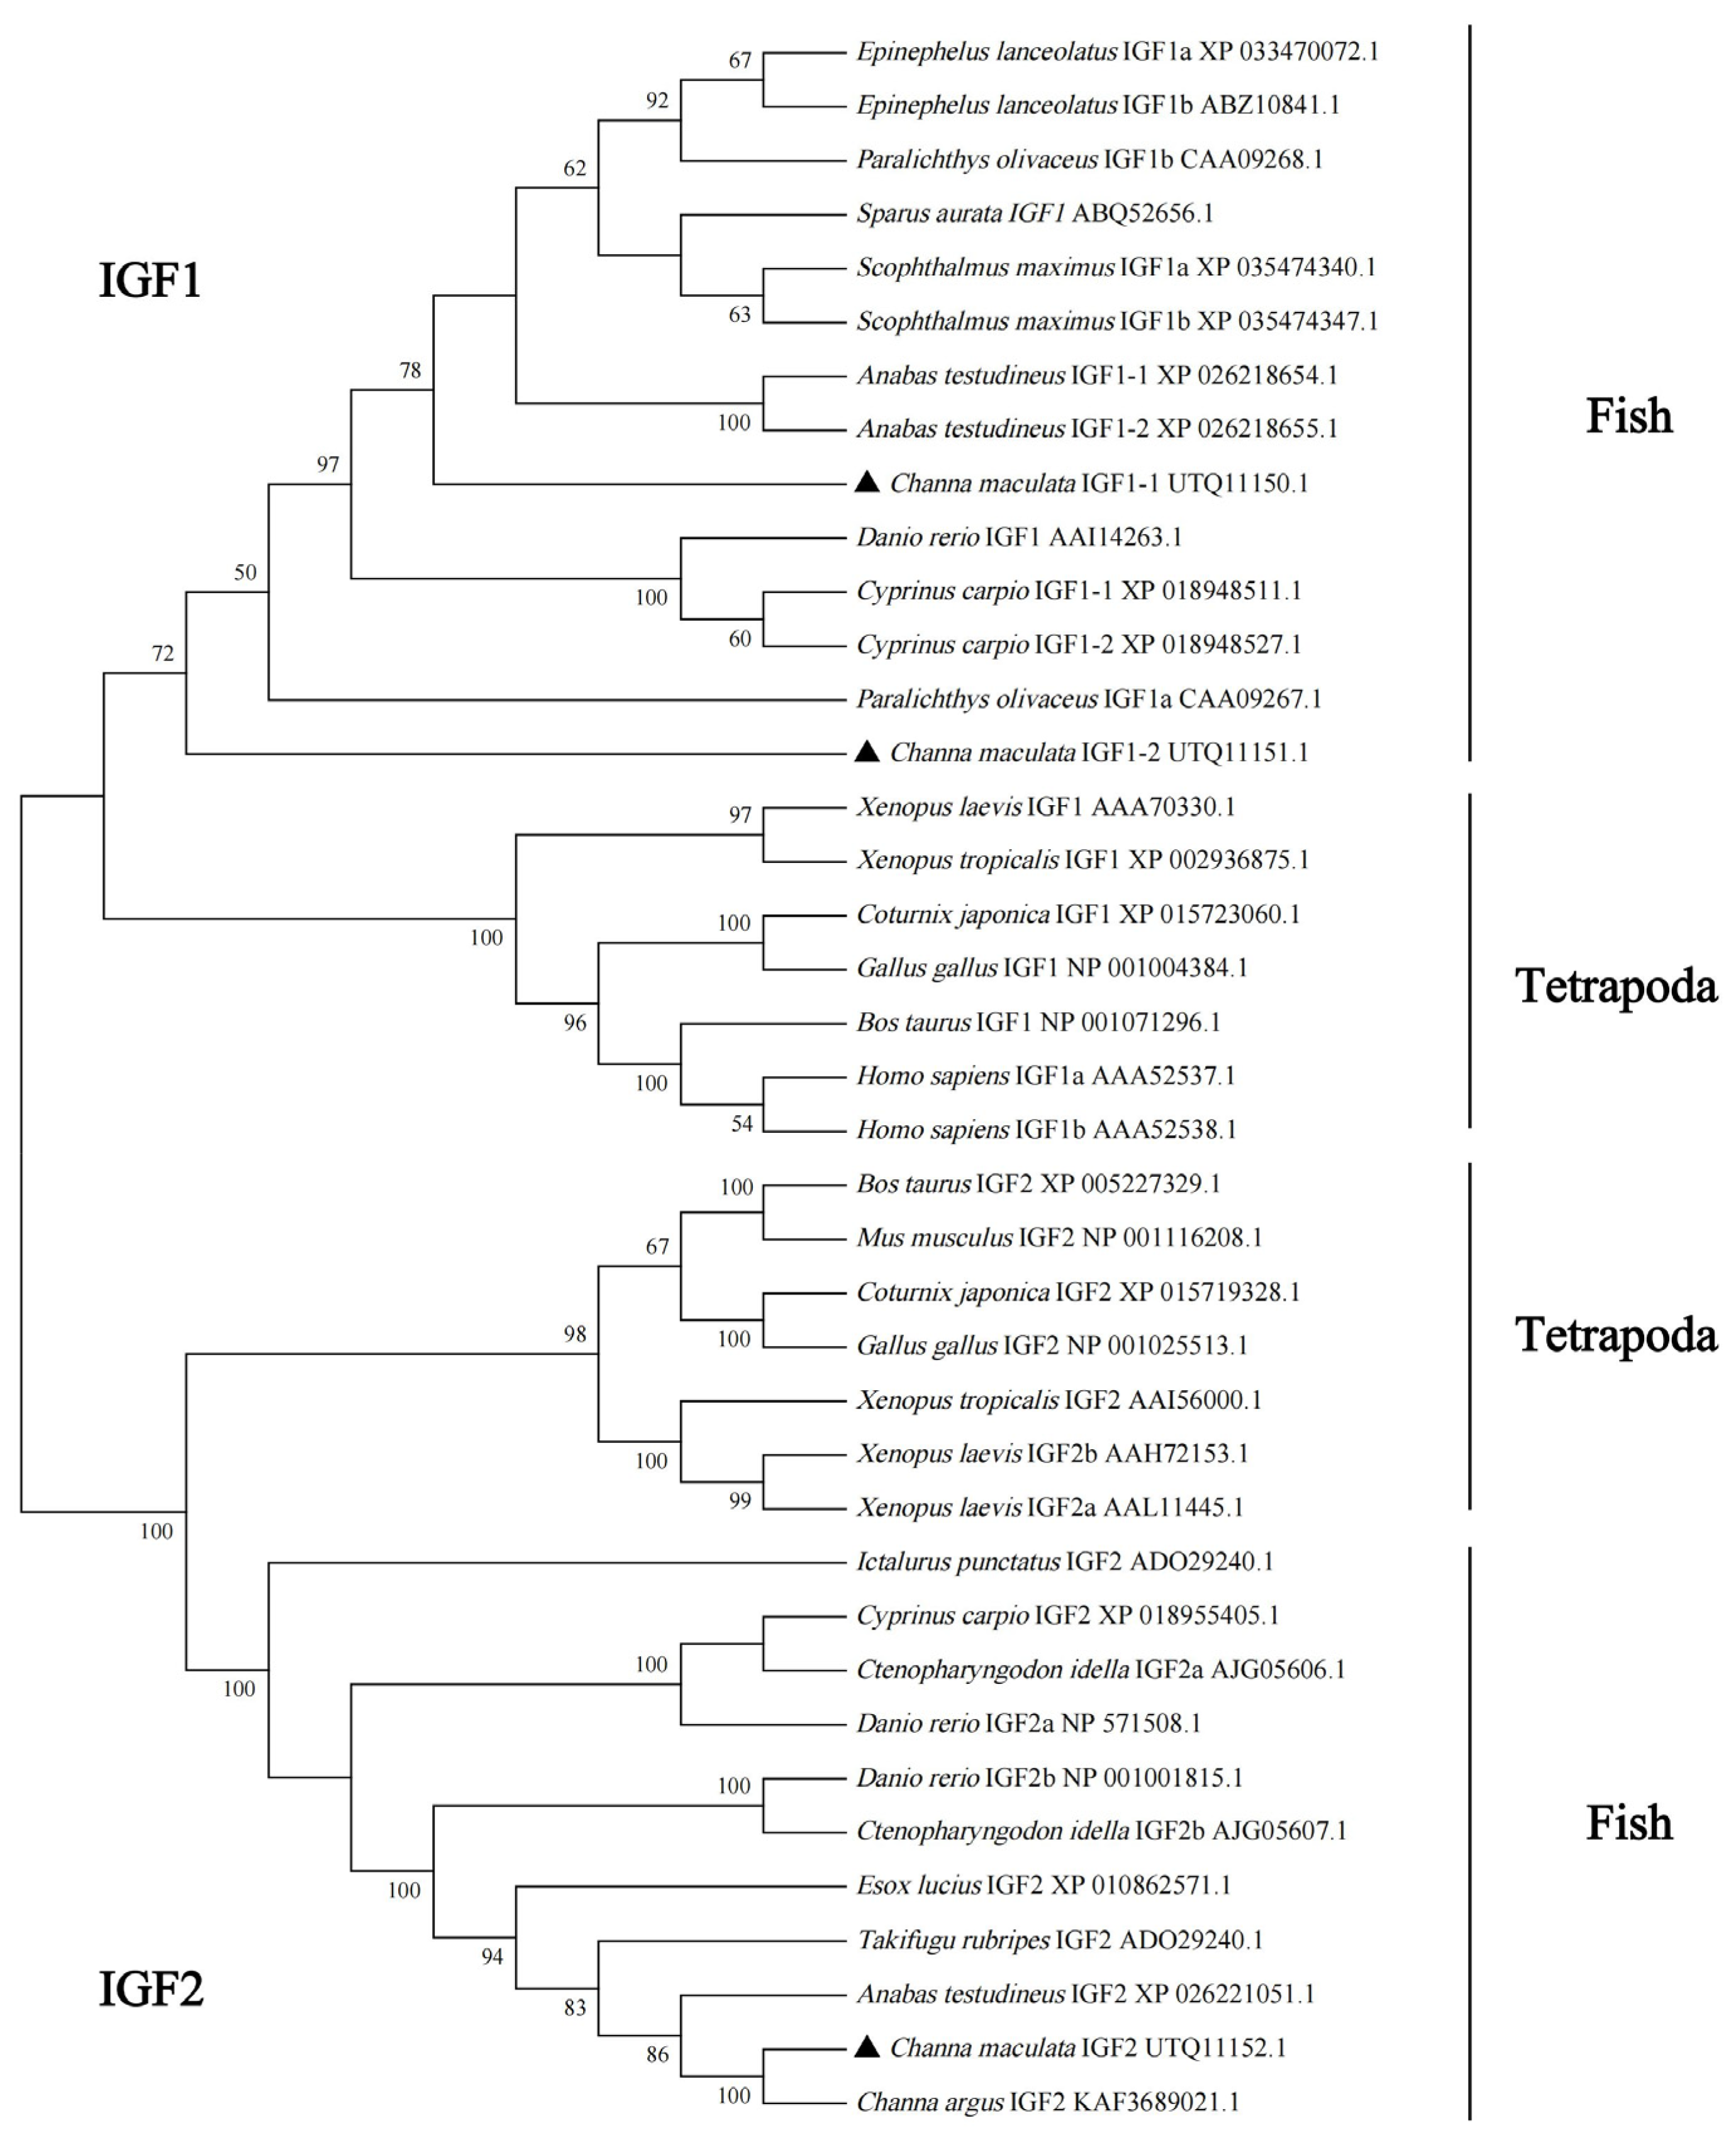
3.2. Multiple Alignments and Phylogenetic Analysis

CmIGF1-1 exhibited the highest similarity to PoIGF1a (IGF1a in olive flounder (Paralichthys olivaceus)) (96.97%), followed by PoIGF1b (IGF1b in P. olivaceus) (91.82%) and SaIGF1 (IGF1 in silthed sea bream (Sparus aurata)) (87.50%). Conversely, the lowest similarity was observed between CmIGF1-1 and HsIGF1b (IGF1b in human (Homo sapiens)) (50.05%) (Figure S2a). The protein sequence similarities between CmIGF1-2 and other species varied, ranging from its highest homology with PoIGF1a (84.85%) to its lowest homology with HsIGF1a (52.67%) (IGF1a in H. sapiens), as shown in Figure S2b. Further analysis indicated that the sequence similarity between CmIGF1-1 and CmIGF1-2 was only 73.28%. CmIGF2 showed the highest identity with CaIGF2 (IGF2 in C. argus) (98.68%) and AtIGF2 (IGF2 in climbing bass (Anabas testudineus)) (90.73%), while it was the least similar to XlIGF2a (IGF2a in African clawed frog (Xenopus laevis)) (44.98%) (Figure S2c). These results were corroborated by phylogenetic analysis (Figure 2). The phylogenetic tree suggested that these homologous proteins can be classified into two clades: IGF1 and IGF2. Each main clade consisted of four subclades, encompassing fishes, amphibians, birds, and mammals. Interestingly, the IGF1 and IGF2 proteins of fish appeared distinctly separated from those of other vertebrates. The phylogenetic tree reflected the consistent genetic relationships and evolution among species.

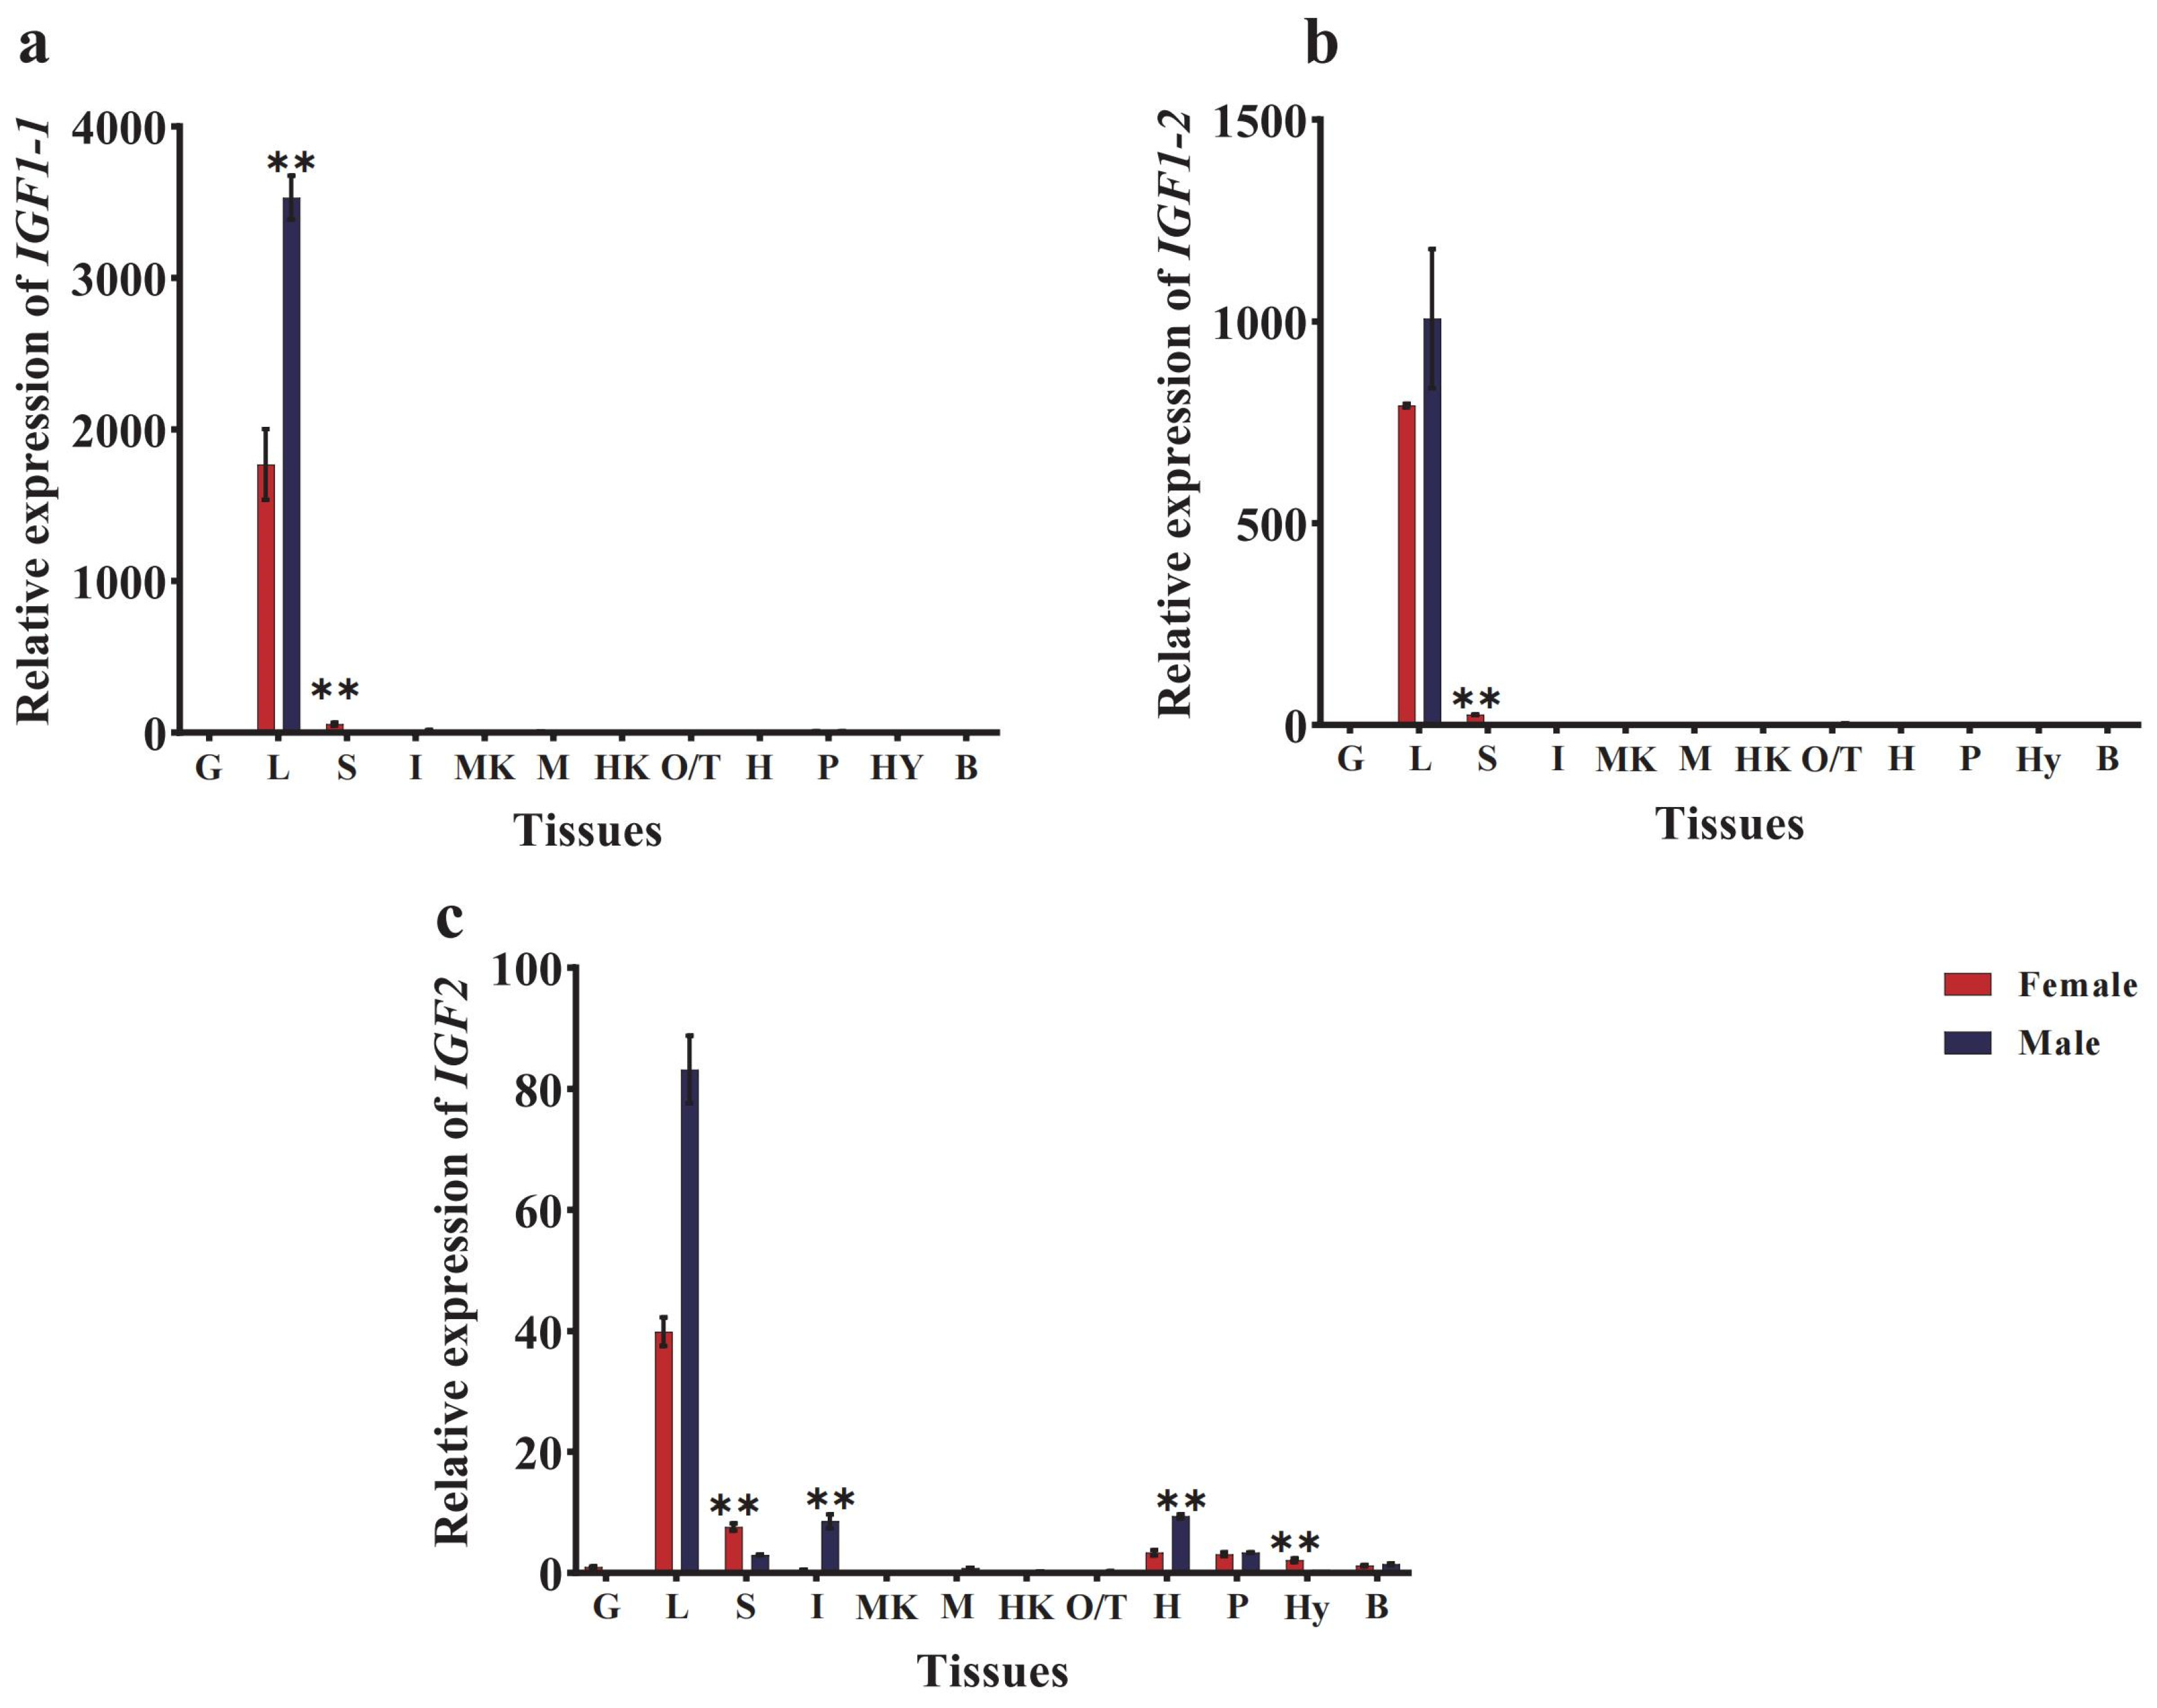
3.3. Tissue Distribution of CmIGFs

The expression levels of CmIGFs in male and female blotched snakeheads were assessed through qPCR. As depicted in Figure 3, similar expression patterns of CmIGF1-1 (Figure 3a) and CmIGF1-2 (Figure 3b) were observed, primarily expressed in liver (L), with low levels in spleen (S), and undetectable in other tissues. Interestingly, the expression levels of CmIGF1-1 and CmIGF1-2 in the liver (L) exhibited significant sexual dimorphism between males and females (p < 0.01). CmIGF2 transcripts were strongly expressed in the liver (L), with higher expression in males compared to females (p < 0.01). Additionally, moderate expression levels were detected in spleen (S), intestines (I), and heart (H), with significant sex differences (p < 0.01), while low levels were observed in other tissues (Figure 3c).

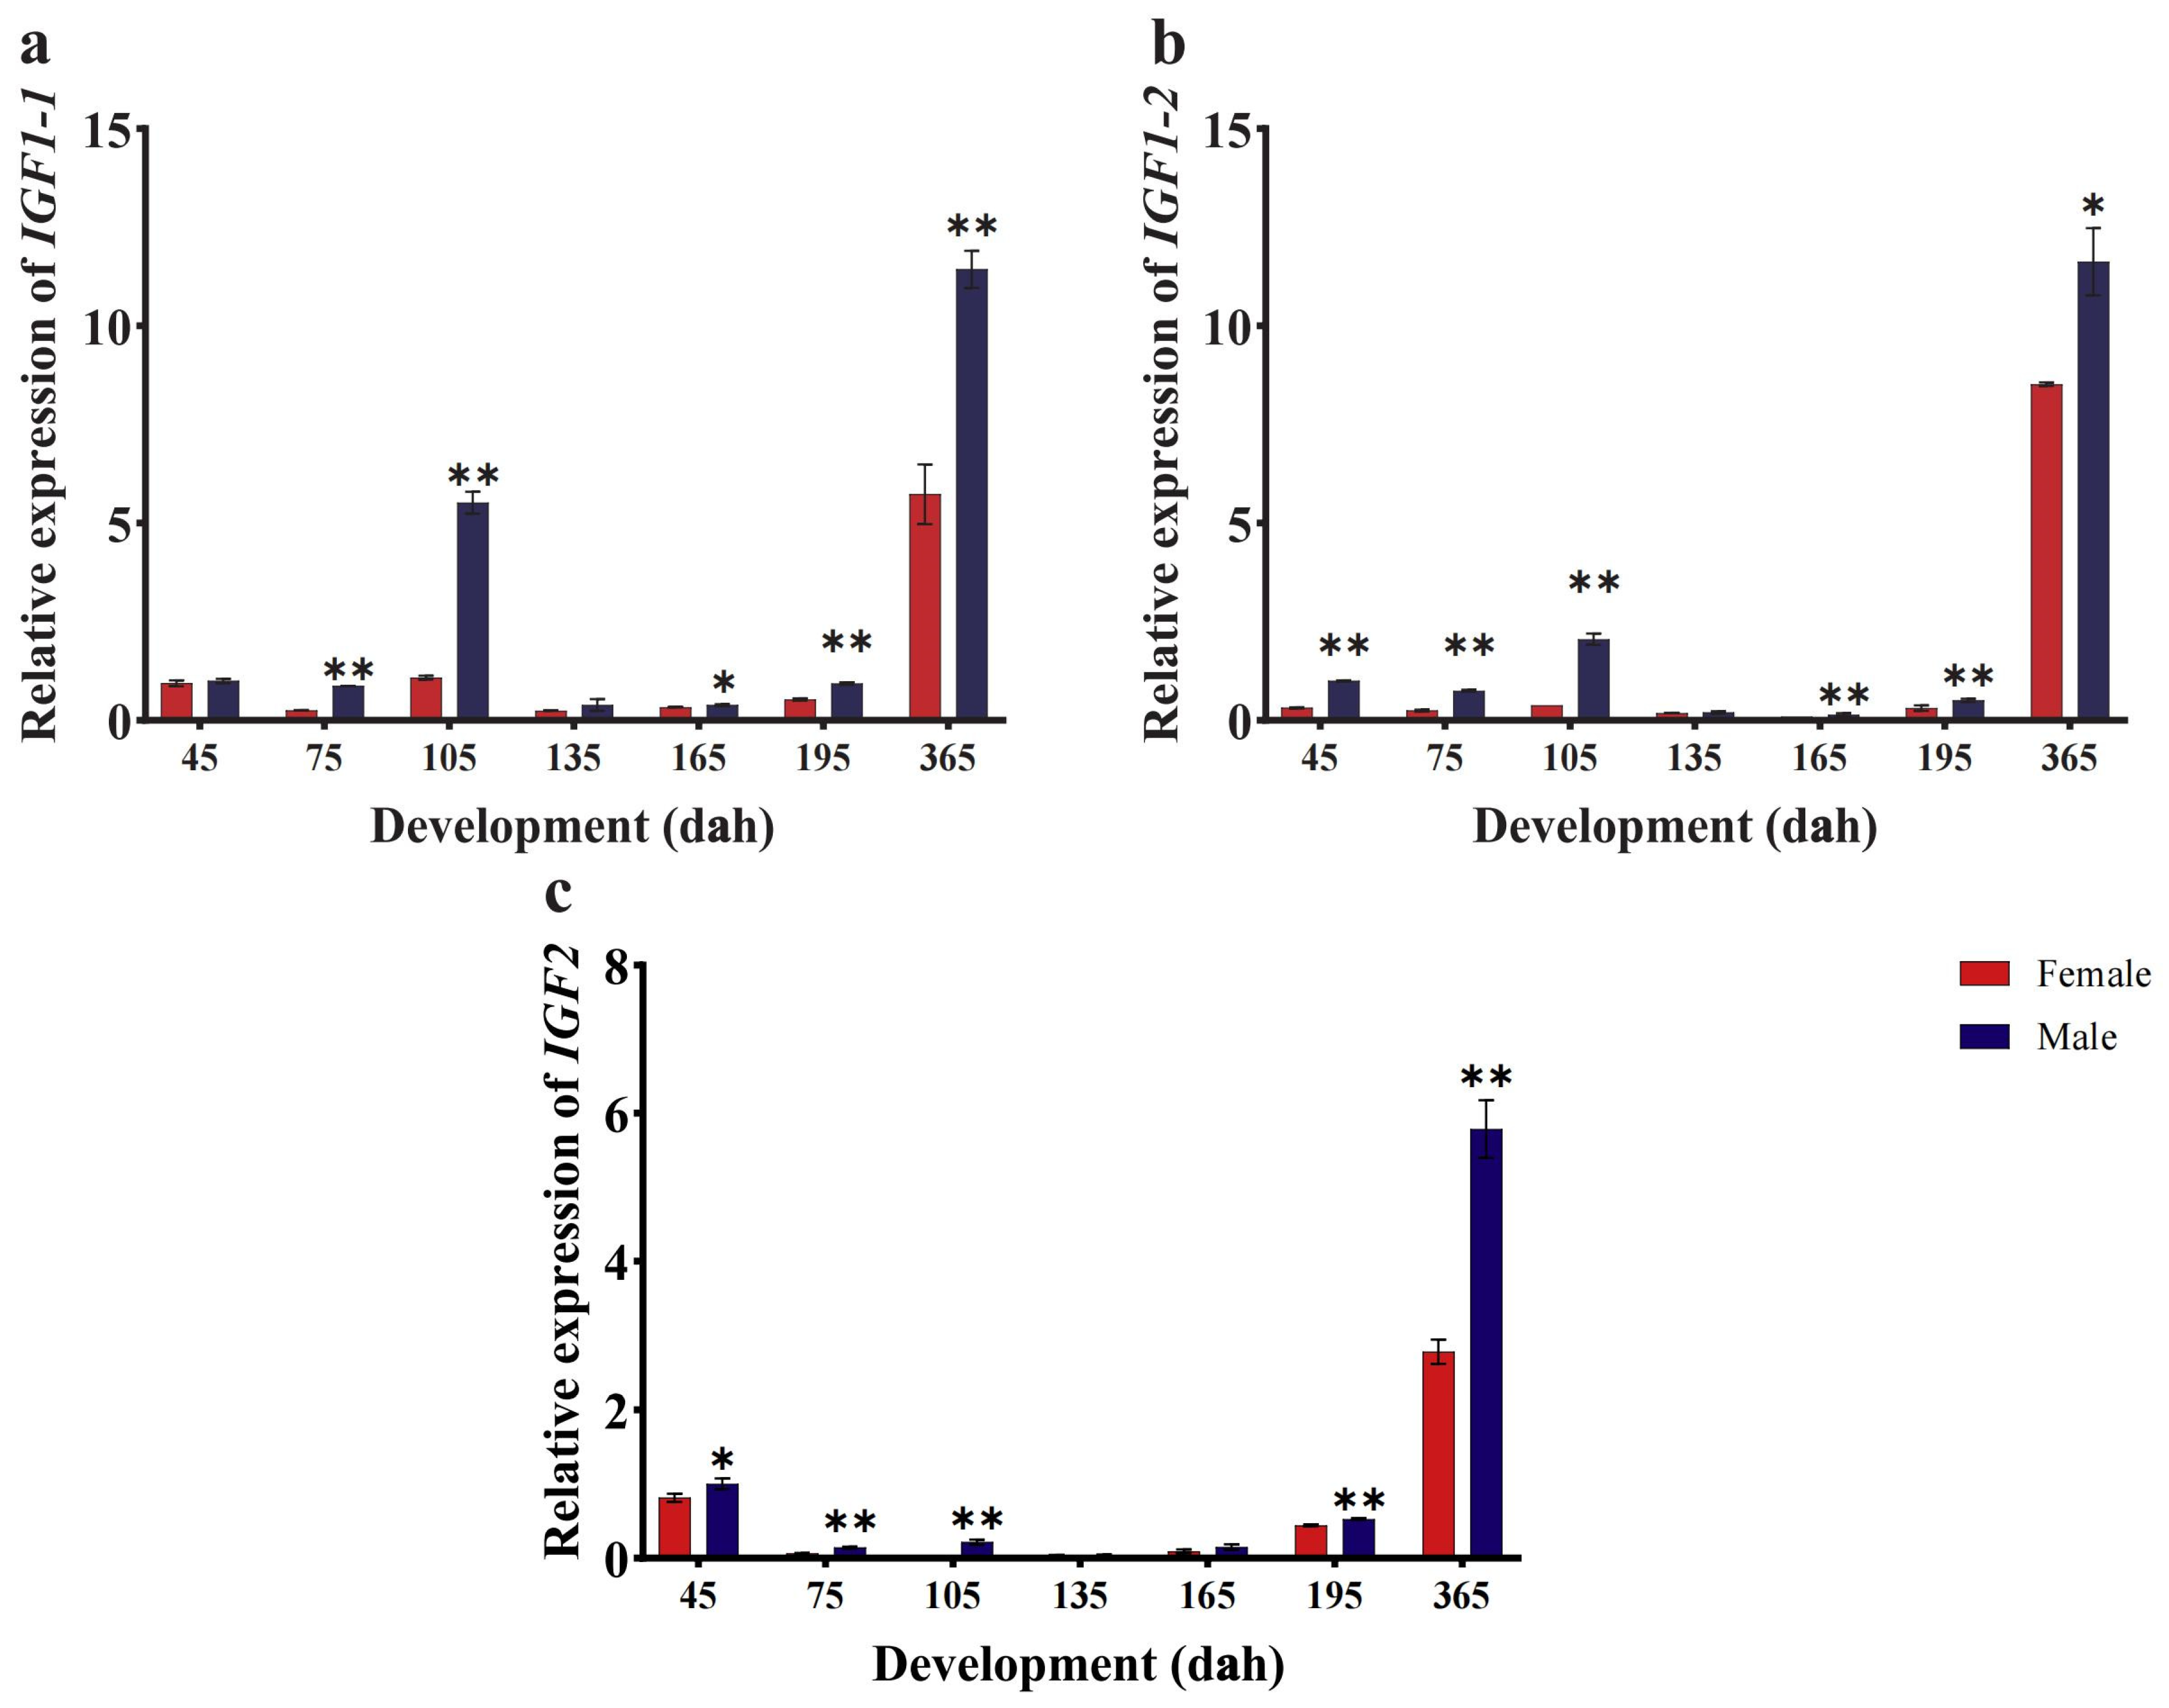
3.4. CmIGFs Expression Patterns at Different Developmental Stages

In order to investigate the role of CmIGFs in growth, the expression levels of CmIGFs in liver (L) were analyzed across seven different developmental stages. Males reached body lengths of 9.6 ± 0.8 cm at 45 dah, 14.3 ± 0.8 cm at 75 dah, 21.3 ± 0.8 cm at 105 dah, 27.1 ± 1.2 cm at 135 dah, 29.1 ± 1.9 cm at 165 dah, 31.1 ± 1.3cm at 195 dah, and 44.7 ± 1.6 cm at 365 dah, and females reached body lengths of 9.7 ± 0.4 cm at 45 dah, 14.3 ± 0.7 cm at 75 dah, 20.5 ± 1.1 cm at 105 dah, 24.9 ± 1.5 cm at 135 dah, 28.0 ± 1.5 cm at 165 dah, 27.5 ± 2.8 at 195 dah, and 40.1 ± 1.3 cm at 365 dah. As shown in Figure 4, CmIGFs expression was higher in males than that in females across different developmental stages. In females, CmIGF1-1 maintained low expression levels from 45 to 195 dah and peaked at 365 dah (p < 0.01). For male individuals, the transcription of CmIGF1-1 started increasing from 75 to 105 dah and reached a tiny peak at 105 dah (p < 0.01). Subsequently, the expression levels decreased significantly from 105 dah to 195 dah before reaching the highest level at 365 dah (p < 0.01) (Figure 4a). The expression patterns of CmIGF1-2 were similar to those of CmIGF1-1 at developmental stages, peaking at 365 dah in both male and female individuals. From 45 to 195 dah, CmIGF1-2 expression maintained a low level in females, while exhibiting a parabolic trend and peaking at 105 dah in males (p < 0.01) (Figure 4b). As for CmIGF2, the expression levels showed a considerable decline from the initial sample in both females and males, reaching the lowest levels at 135 dah. Then, they were gradually up-regulated and peaked at 365 dah (p < 0.01) (Figure 4c).

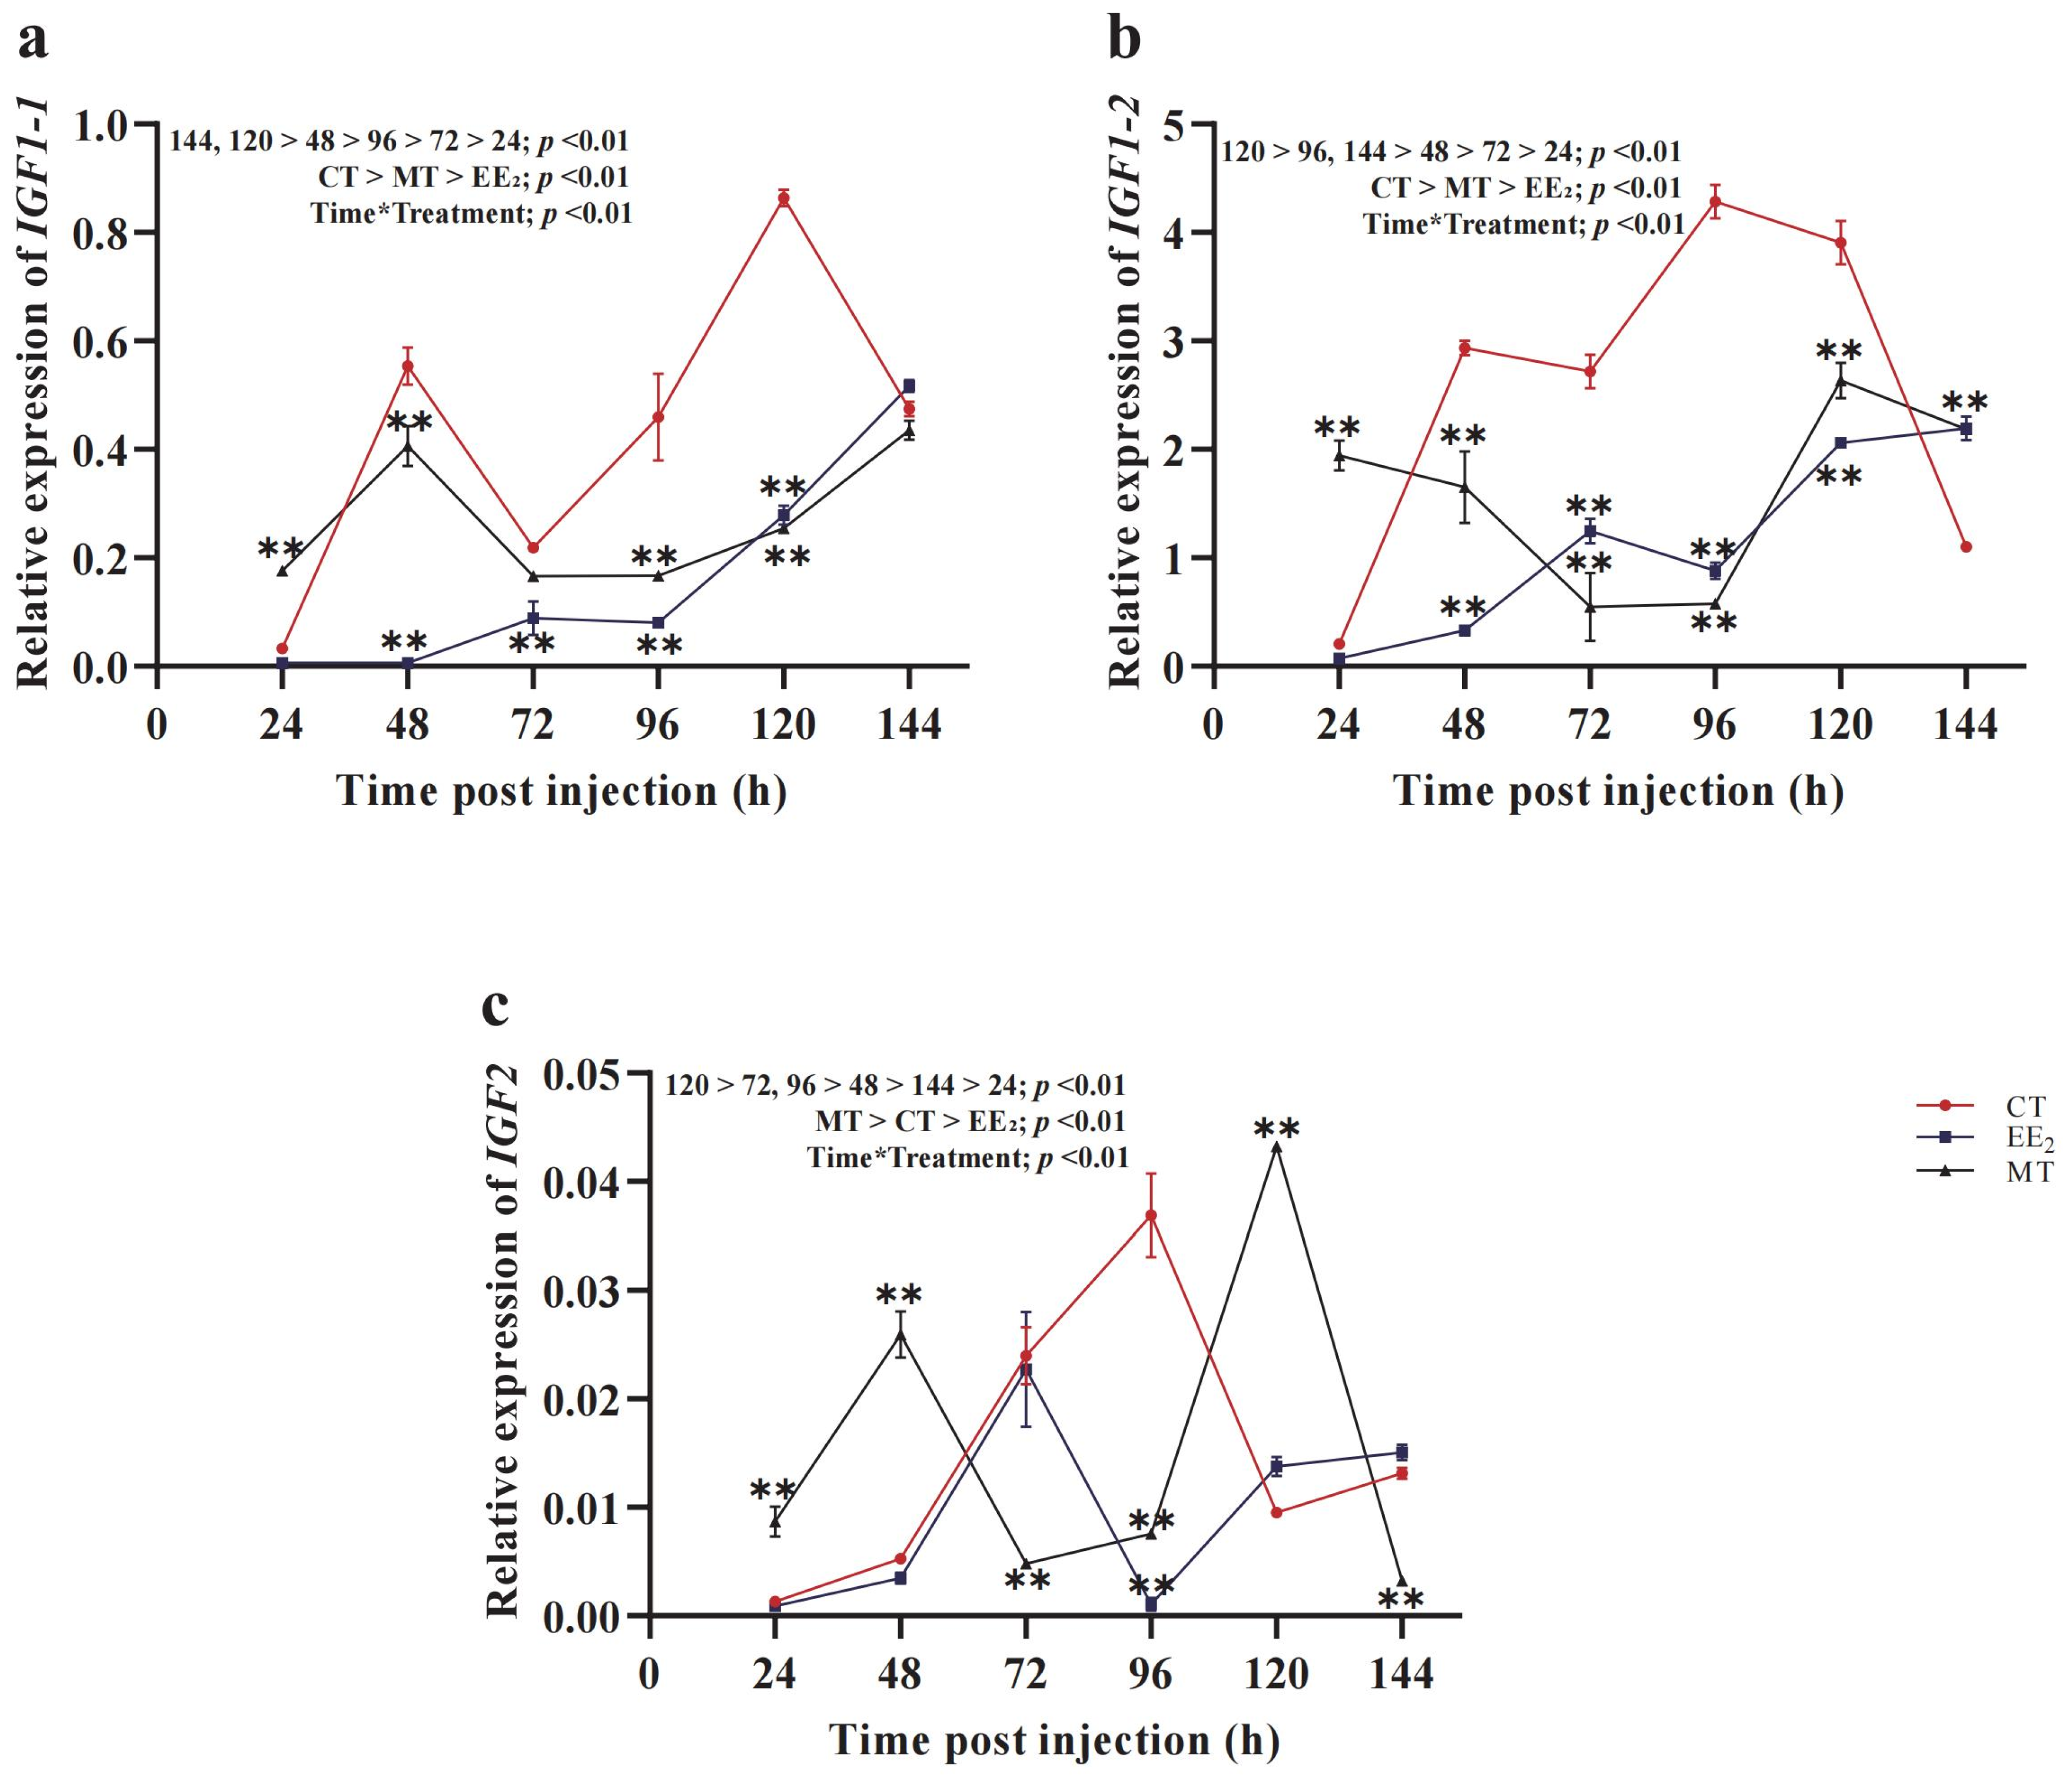
3.5. Effects of Short-Term Hormone Treatment on CmIGFs in Females

In female blotched snakehead, the expression of CmIGF1-1 in the control group fluctuated from 24 h to 144 h and peaked at 48 h and 120 h (F5,10 = 84.254, p < 0.01), respectively. Upon the administration of EE2, CmIGF1-1 transcription was inhibited, remaining lower than that in the control group (F2,10 = 35.081, p < 0.01) until 144 h, when the expression levels of CmIGF1-1 were comparable between the control and the EE2 treatment group (Figure 5a). After MT treatment, the highest peak of CmIGF1-1 expression occurred at 48 h, while it remained significantly lower than that in the control group (F2,10 = 35.081, p < 0.01) (Figure 5a). Both EE2 and MT administration down-regulated the expression of CmIGF1-2 (F2,10 = 48.841, p < 0.01), which was lower than that in the control group from 48 h to 120 h (Figure 5b). A marked increase was observed in CmIGF1-2 expression at 144 h when it was significantly higher (F5,10 = 60.233, p < 0.01) than that in the control group (Figure 5b). CmIGF2 transcripts in EE2-treated group were consistently lower (F2,10 = 61.829, p < 0.01) than those in the control group until 120 h, when CmIGF2 displayed equivalent levels in the control and the EE2 treatment group. After treatment with MT, CmIGF2 showed higher levels than those in the control group from 24 h to 48 h (F2,10 = 61.829, p < 0.01), reaching the highest level at 120 h, after which it sharply dropped to the lowest level at 144 h (F5,10 = 30.592, p < 0.01) (Figure 5c).

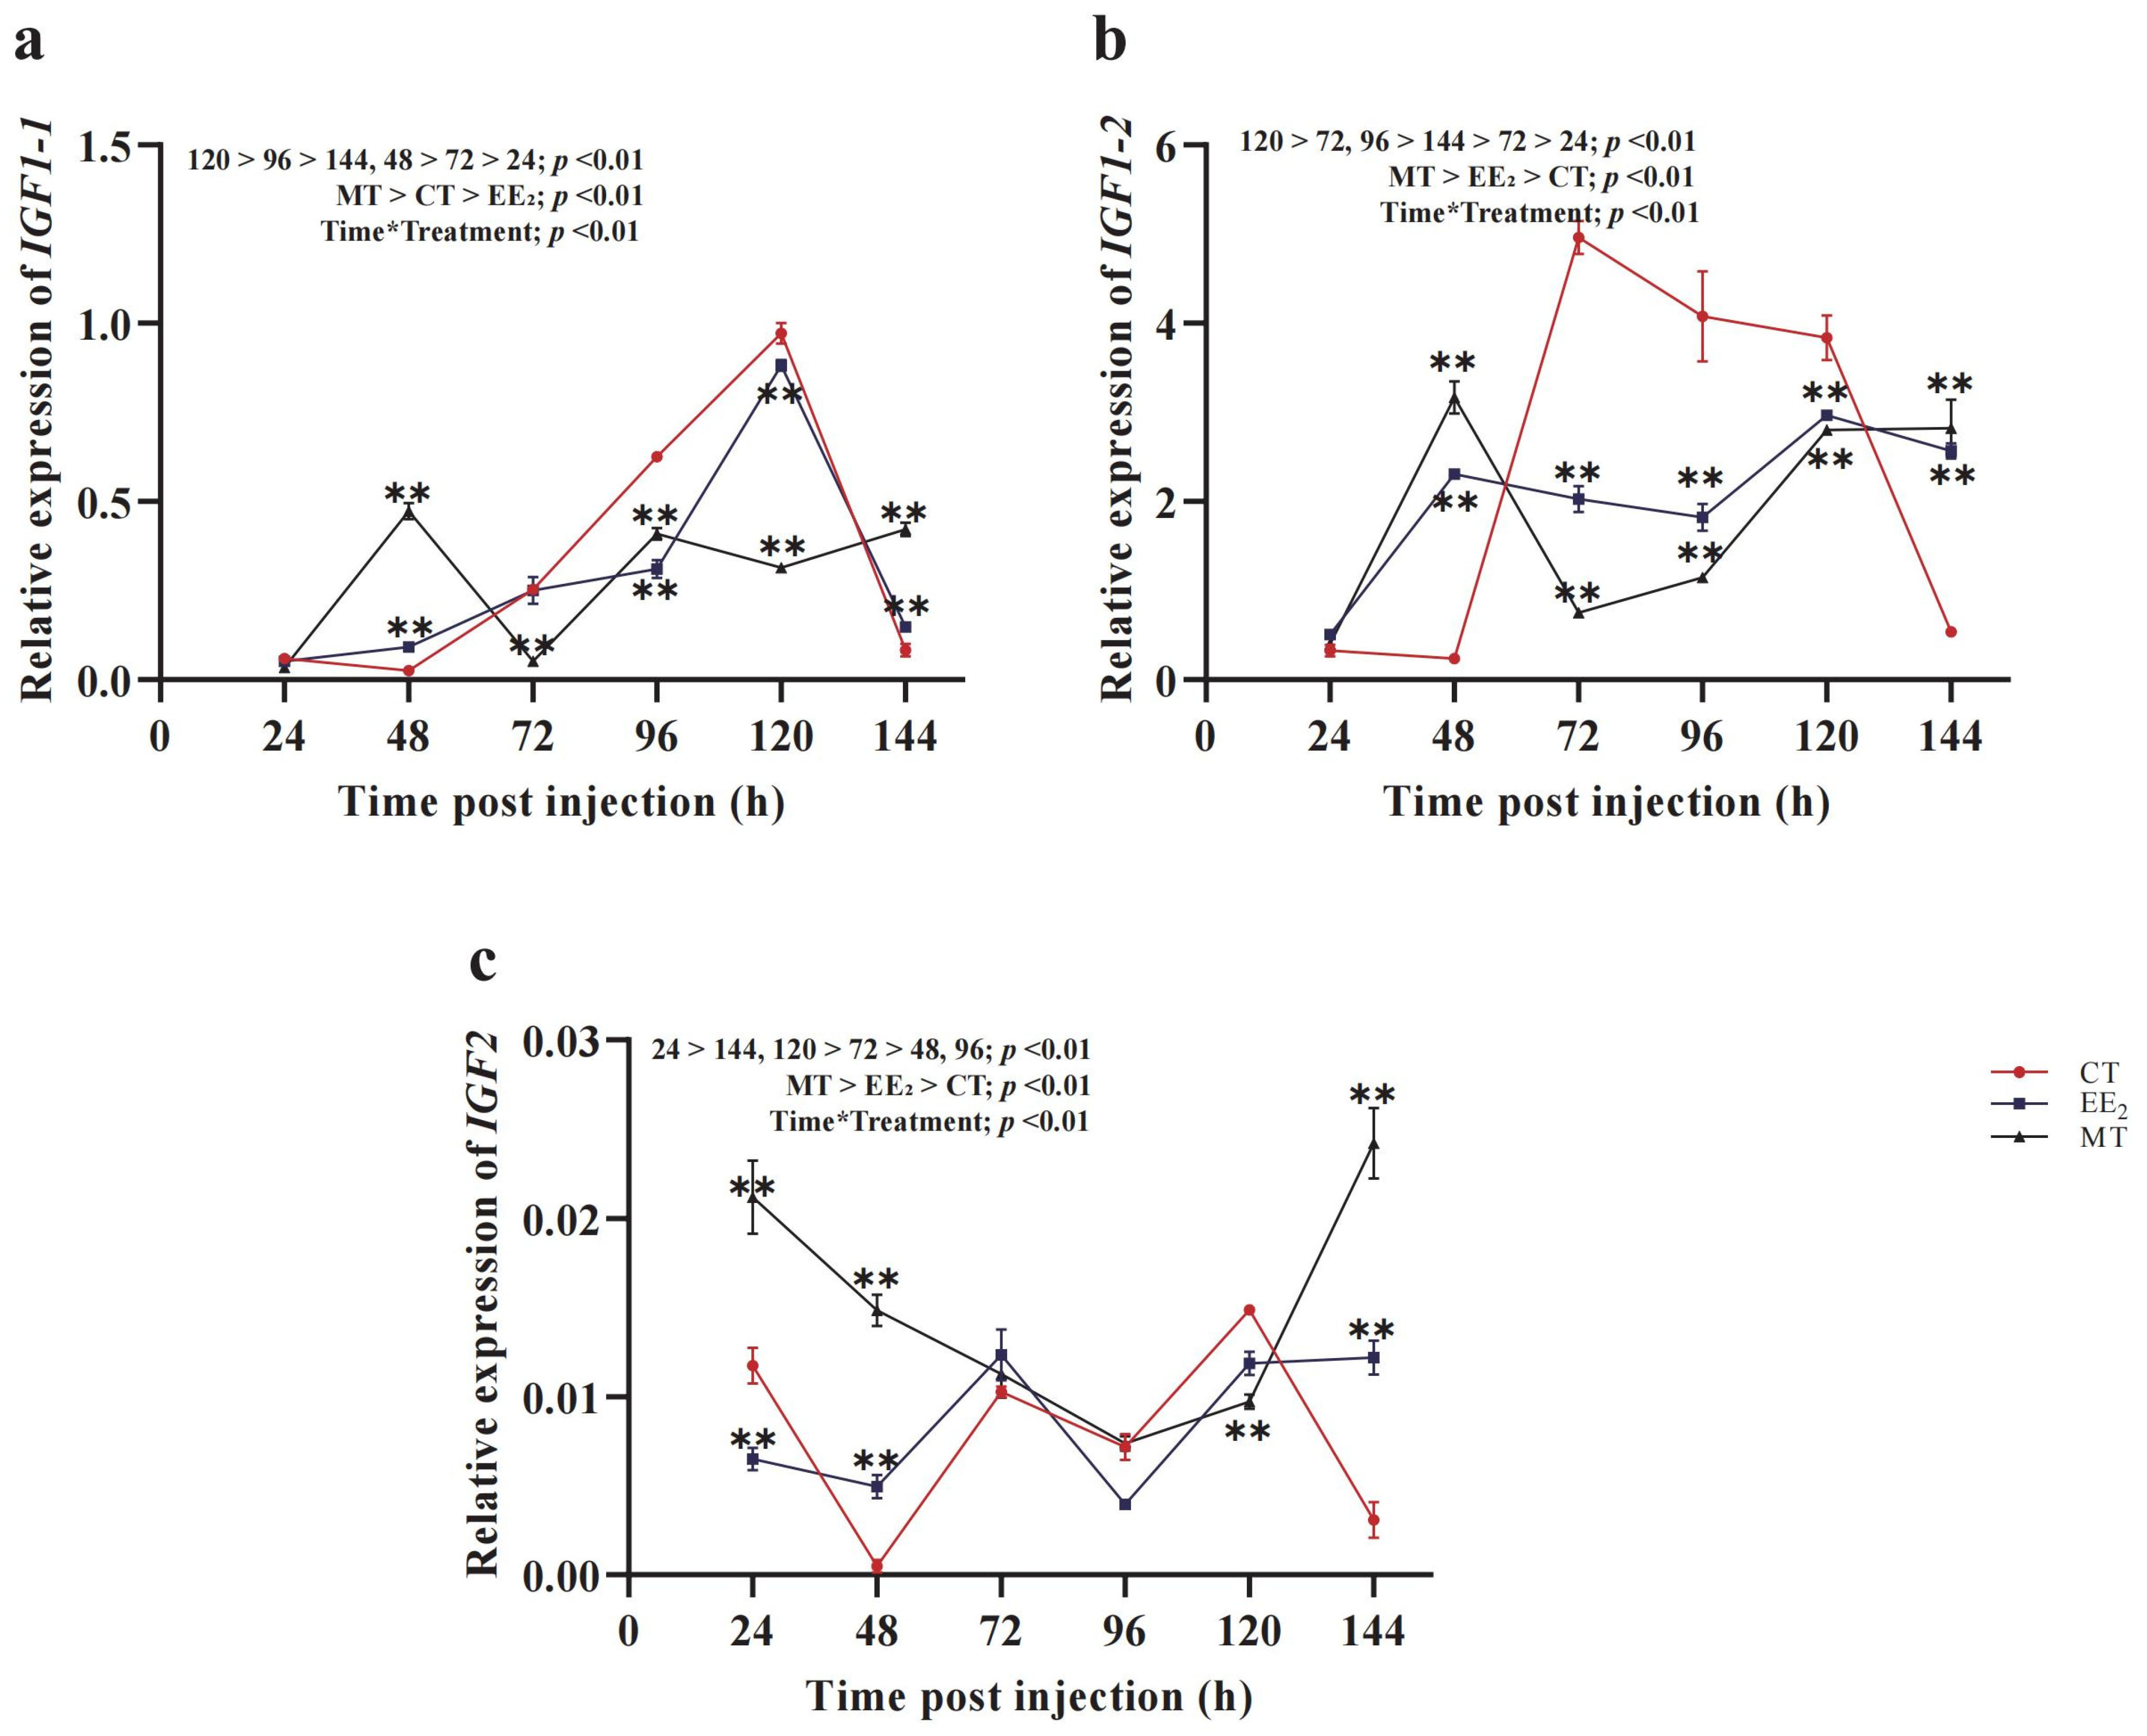
3.6. Effects of Short-Term Hormone Treatment on CmIGFs in Males

In male individuals, CmIGF1-1 transcripts showed a similar expression pattern, with the parabolic trends in both the control and EE2-treated groups, gradually increasing and reaching their peak at 120 h, then sharply dropping to the initial level at 144 h (F5,10 = 32.762, p < 0.01) (Figure 6a). However, it showed fluctuating variation in the MT-treated group (F2,10 = 54.339, p < 0.01) (Figure 6a). In the control group, CmIGF1-2 expression reached the highest value at 72 h and then gradually decreased and returned to the starting level at 144 h (F5,10 = 54.207, p < 0.01). CmIGF1-2 expression displayed fluctuating changes in the EE2-treated and MT-treated groups (F2,10 = 33.880, p < 0.01), with the expression level at 144 h being significantly higher than that in the control group (Figure 6b). CmIGF2 expression exhibited a similar dynamic pattern of change in both the control and EE2-treated groups, with CmIGF2 being sharply down-regulated in the control group from 120 h, while showing a slight up-regulation (F2,10 = 55.904, p < 0.01) in the EE2-treated group. After MT treatment, CmIGF2 transcription gradually decreased and reached the lowest level at 96 h and then quickly rose to the highest level at 144 h, which was significantly higher (F5,10 =92.615, p < 0.01) than that in the control group (p < 0.01) (Figure 6c).

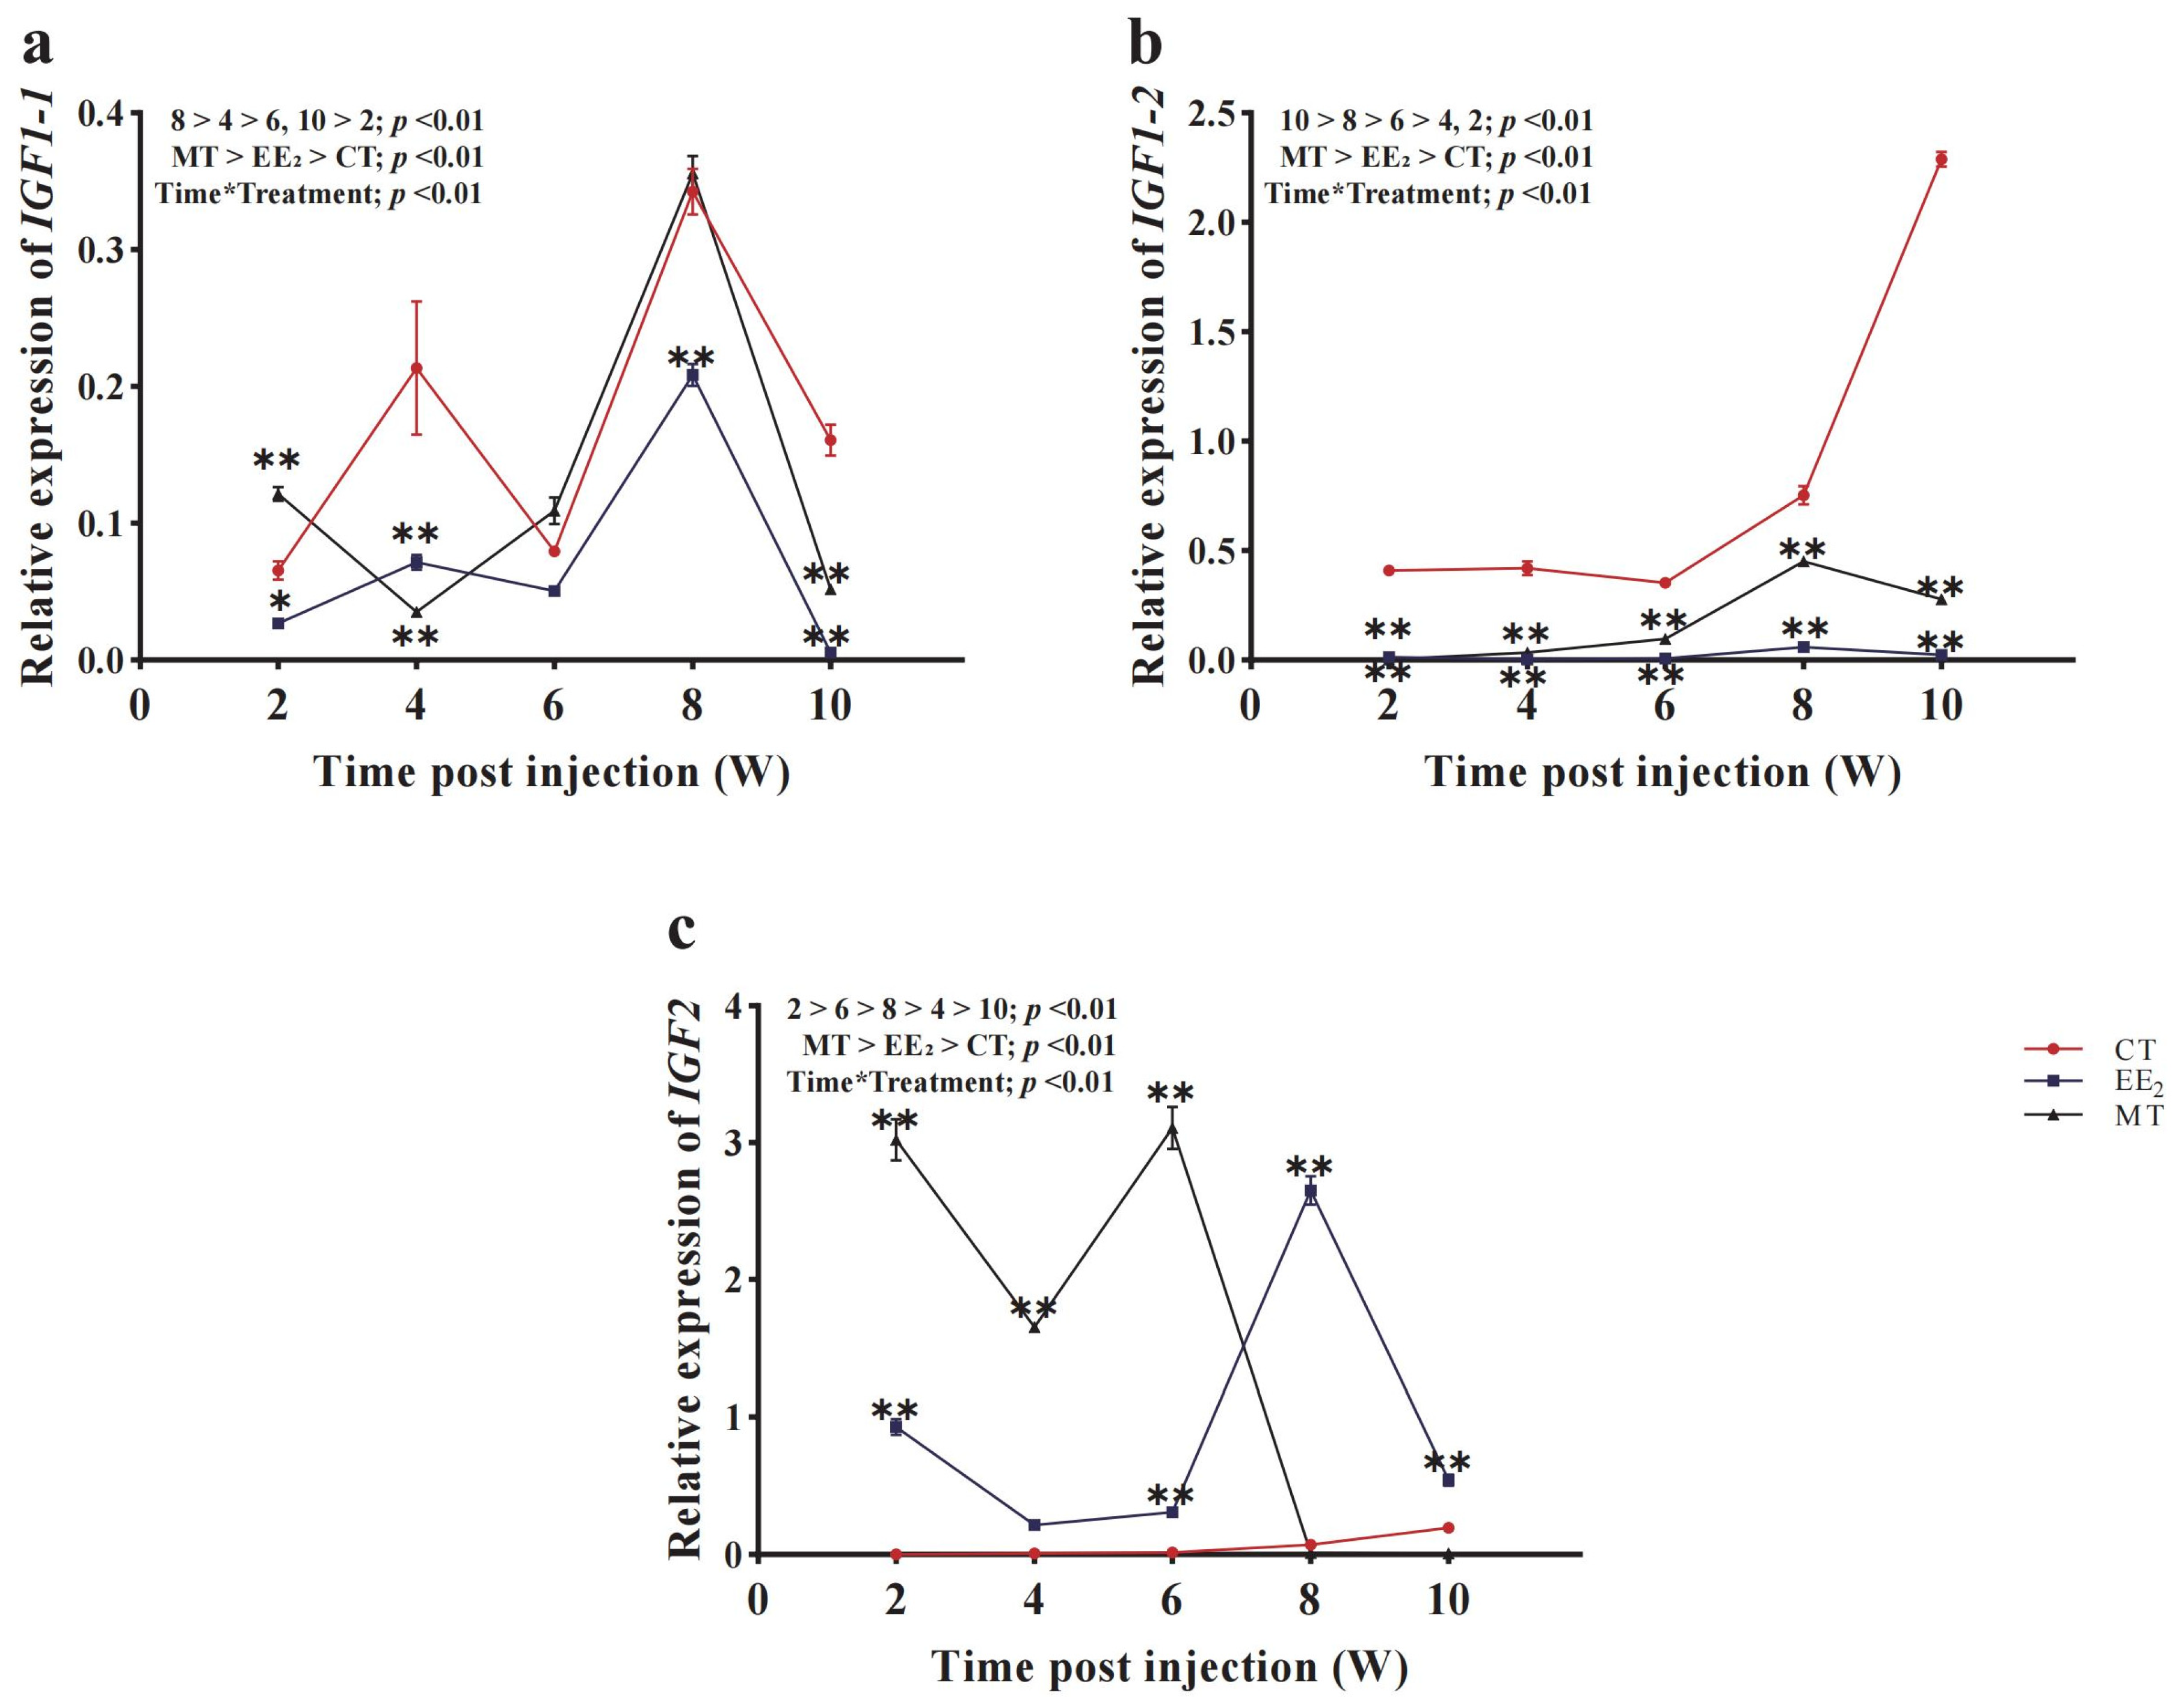
3.7. Effects of Long-Term Hormone Treatment on CmIGFs in Females

In females, MT considerably boosted CmIGF1-1 mRNA levels in comparison to the control group at 2 weeks (F2,8 = 55.732, p < 0.01), followed by a sudden drop to the lowest level at 4 weeks (Figure 7a). The highest level was detected at 8 weeks, which was not significantly different from the control group (Figure 7a). Treatment with EE2 resulted in consistently lower CmIGF1-1 mRNA levels than controls throughout ten weeks, reaching the lowest level at 10 weeks and being significantly lower (F4,8 = 62.65, p < 0.01) than that in the control group (Figure 7a). Hormone treatment (EE2 and MT) led to the maintenance of low transcription levels of CmIGF1-2, which were significantly lower than that in the control group (F2,8 = 69.249, p < 0.01) (Figure 7b). CmIGF2 remained at a low expression level in the control group, while CmIGF2 mRNA levels were considerably boosted (F2,8 = 73.017, p < 0.01) after the administration of MT and EE2, with the highest levels detected at 6 weeks and 8 weeks (F4,8 = 74.372, p < 0.01), respectively, which were much higher than that in the control group (Figure 7c). Finally, the body weight and length of fish in the control and treated groups were measured at 10 weeks post-injection. Females treated with MT achieved an average body length of 21.4 ± 1.1 cm and a weight of 240.1 ± 9.2 g. Compared to the control group, which presented an average body length of 26.7 ± 1.8 cm and a weight of 331.5 ± 9.3 g, the growth rates were reduced by 19.8% in length and 27.4% in weight. Females treated with EE2 reached an average body length of 19.2 ± 1.5 cm and a weight of 207.5 ± 8.7 g, indicating the reductions in growth rates of 28.0% in length and 37.3% in weight compared to the control group.

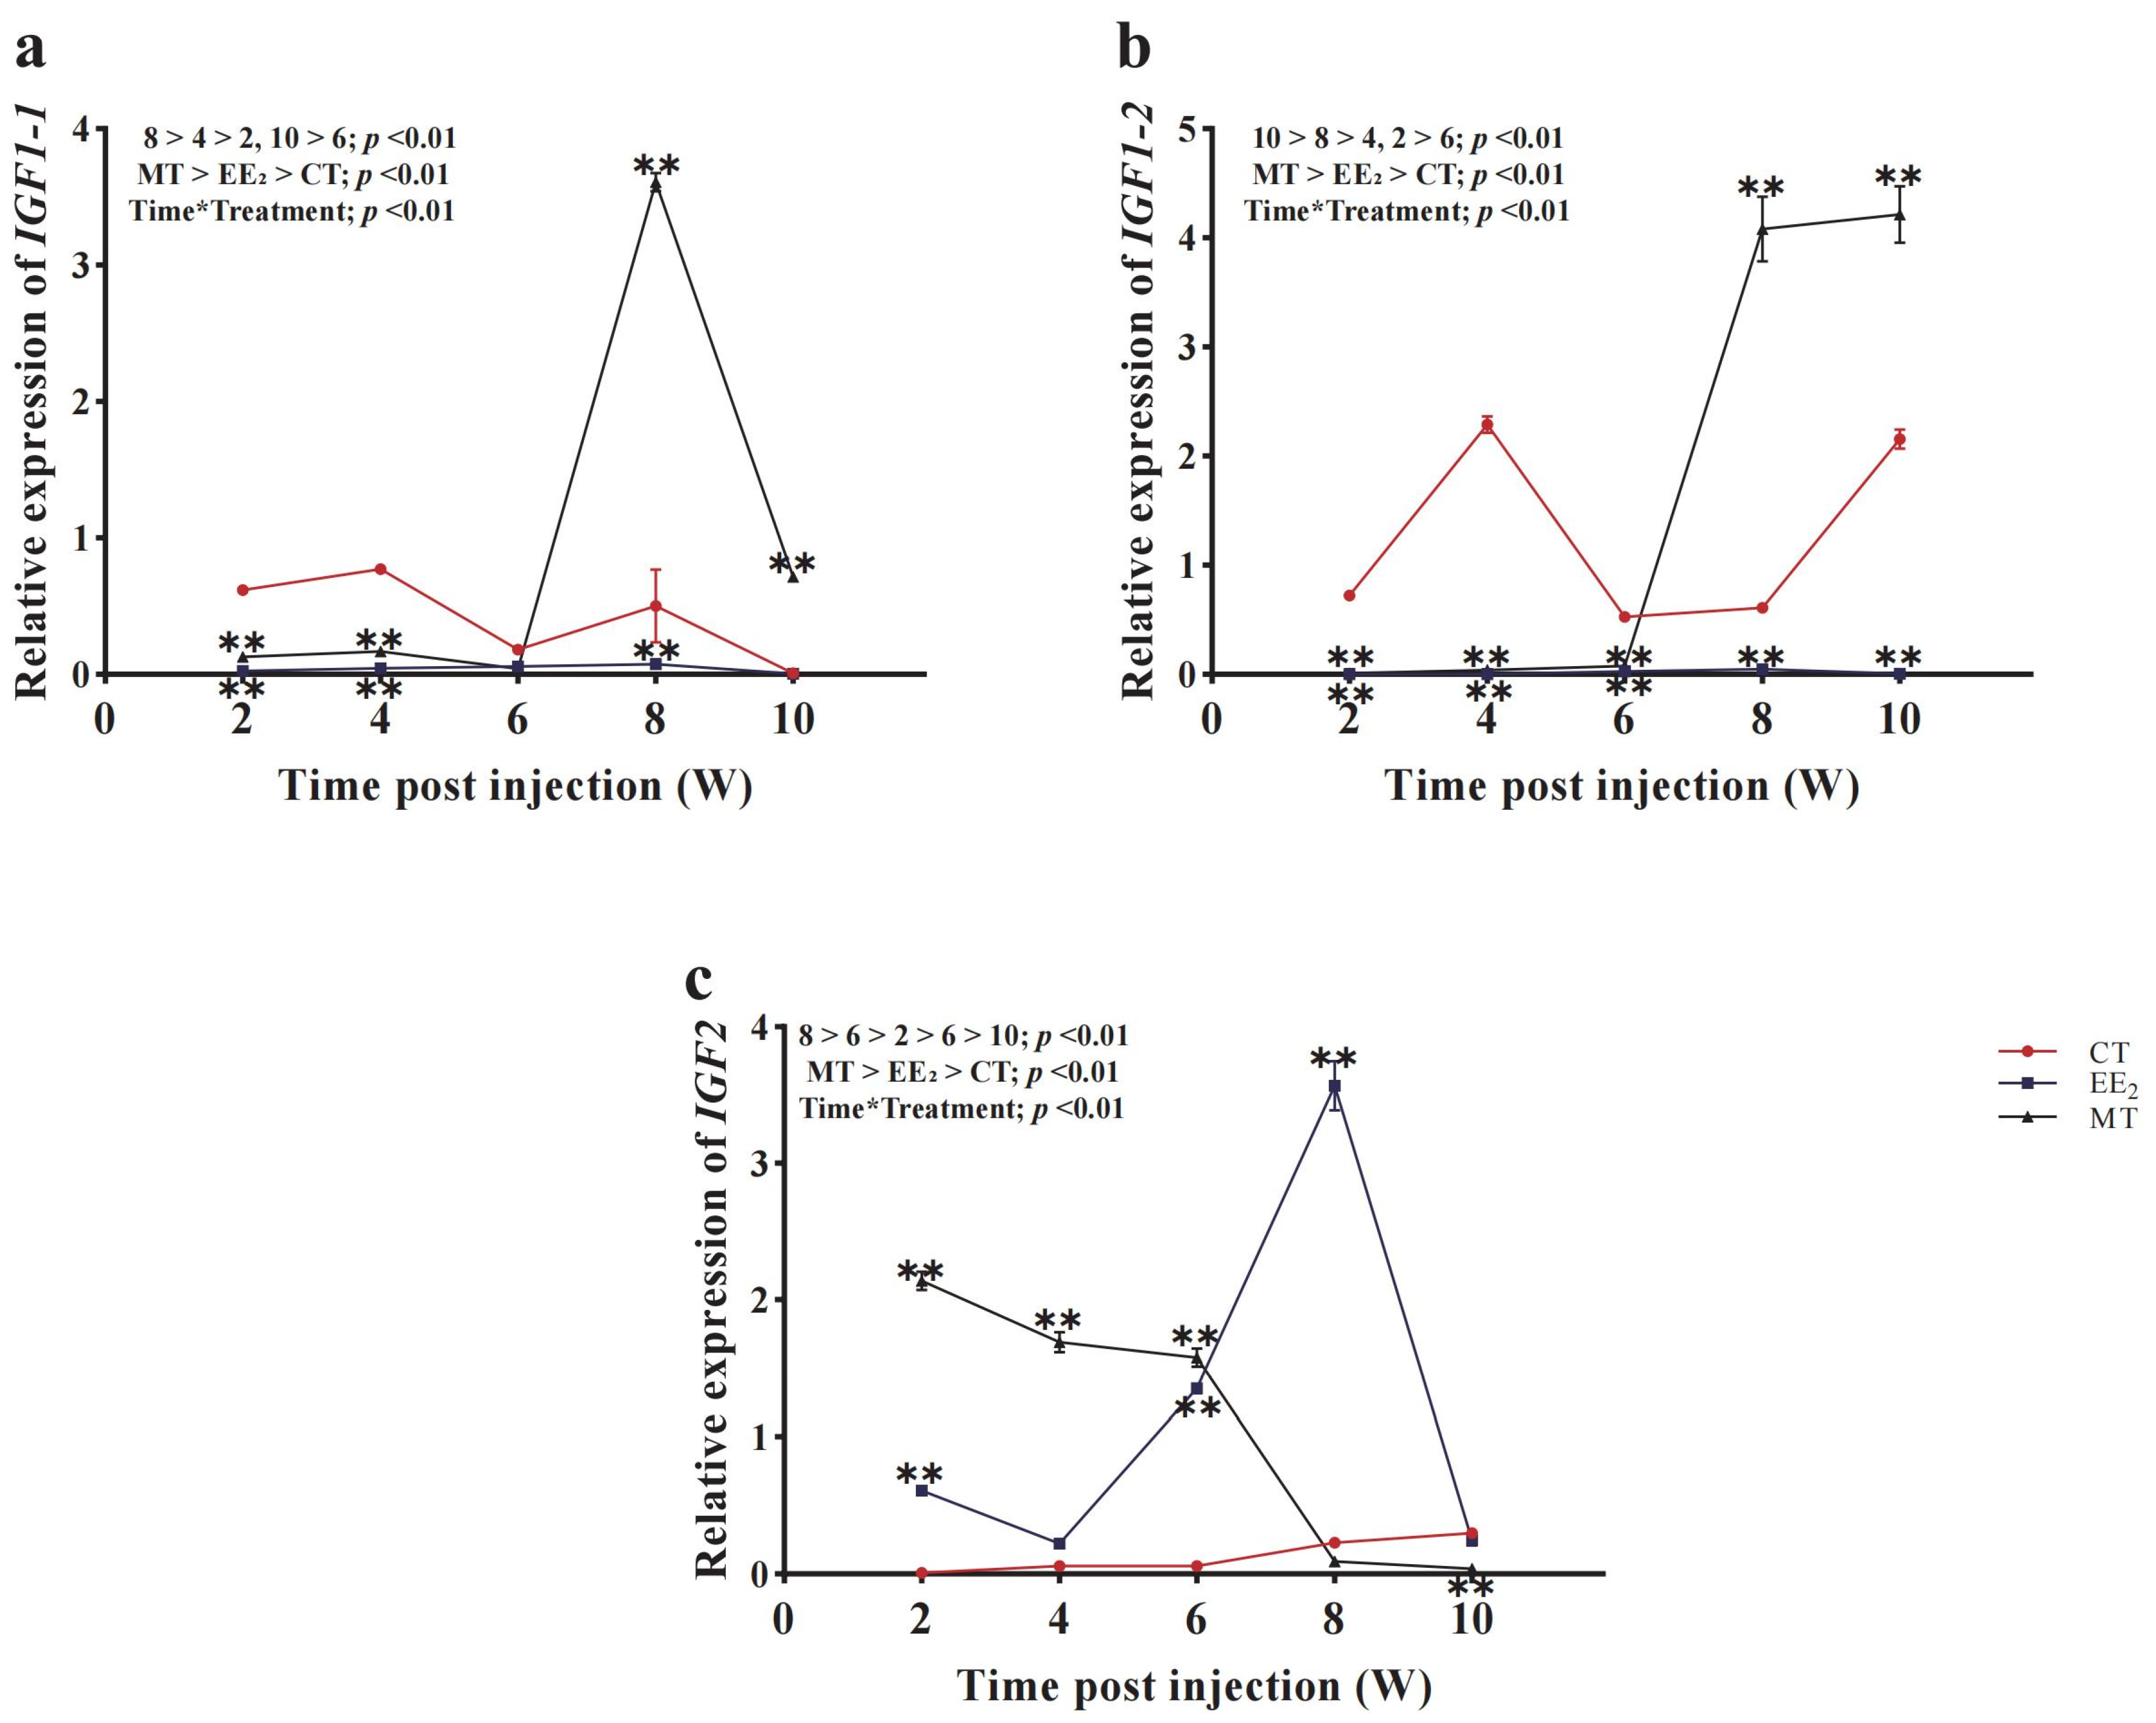
3.8. Effects of Long-Term Hormone Treatment on CmIGFs in Males

As shown in Figure 8a,b, the expression levels of CmIGF1-1 (F2,8 = 57.041, p < 0.01) and CmIGF1-2 (F2,8 = 62.436, p < 0.01) remained low in males after the administration of EE2, being lower than those in the control group. Upon the administration of MT, the transcription of CmIGF1-1 (F4,8 = 78.874, p < 0.01) and CmIGF1-2 (F4,8 = 43.802, p < 0.01) remained at low levels until 6 weeks, then increased sharply and reached their peaks at 8 and 10 weeks, respectively, which were significantly higher than those in the control group (Figure 8a,b). EE2 and MT treatments up-regulated (F2,8 = 69.567, p < 0.01) the expression levels of CmIGF2 compared to the control group at 2 weeks (Figure 8c). After that, CmIGF2 expression displayed a decreasing trend and achieved the lowest level at 10 weeks (F4,8 = 58.721, p < 0.01) (Figure 8c). In contrast, CmIGF2 transcripts dramatically increased from 4 weeks and reached the peak (F2,8 = 69.567, p < 0.01) at 8 weeks with EE2 administration and subsequently rapidly declined to the lowest level at 10 weeks (F4,8 = 58.721, p < 0.01) (Figure 8c). At 10 weeks post-treatment, males treated with EE2 achieved an average body length of 24.3 ± 1.6 cm and a body weight of 330.6 ± 7.4 g. Compared to the control group, which presented an average body length of 28.6 ± 1.3 cm and a body weight of 370.5 ± 8.8 g, the growth rates were reduced by 15.1% in length and 10.8% in weight. Males treated with MT reached an average body length of 33.7 ± 1.4 cm and a body weight of 406.2 ± 10.3 g, indicating the increased growth rates of 15.1% in length and 15.1% in weight compared to the control group.

4. Discussion

Growth, one of the most crucial economic traits in farmed fishes, plays a vital role in the advancement of aquaculture. In the present study, IGFs, which are known to be involved in growth regulation, were characterized in blotched snakehead (C. maculata). Consistent with findings in zebrafish (D. rerio) [9] and giant grouper (E. lanceolatus) [16], two copies of IGF1 were identified in blotched snakehead, designated as CmIGF1-1 and CmIGF1-2, located on chromosomes 15 and 10, respectively [30]. The IGF1 gene in many fish species, including giant grouper (E. lanceolatus) [16], ussuri catfish (Pseudobagrus ussuriensis) [34], and zebrafish (D. rerio) [9], typically consists of five exons and four introns, with intron 2 being the longest. In our study, CmIGF1-1 also consisted of five exons and four introns, with intron 2 being the longest at 8800 bp. In contrast, CmIGF1-2 manifested a more concise structure, with solely three exons and two introns. The structural differences between the two gene products may potentially stem from divergent splicing methodologies [35]. The IGF2 gene differs from IGF1 in exon–intron composition in ussuri catfish (P. ussuriensis) [34] and yellow catfish (P. fulvidraco) [11], typically consisting of four exons and three introns. In this study, CmIGF2 comprised four exons and three introns. The alignment of amino acid sequences revealed conserved IGF domains in both IGF1-1 and IGF1-2 across species. Furthermore, IGF2 exhibited conserved IGF and IGF2_C domains, which play a vital role in protein folding, maintaining proper secondary spatial structure, and facilitating normal physiological functions [36]. Evolutionary analysis revealed that IGF1 and IGF2 clustered together among all fish species, diverging from those of tetrapods, which encompass mammals, birds, and reptiles. Our findings are consistent with both systematic evolutionary analysis and traditional taxonomy.
Two distinct variant forms have been identified in CmIGF1, whereas CmIGF2 was expressed as a single form, consistent with observations in giant grouper (E. lanceolatus) [16] and olive flounder (P. olivaceus) [37]. In contrast, in zebrafish (D. rerio) [9], both IGF1 and IGF2 present two variants, a disparity that may stem from gene duplication. This suggests that the retention of gene duplication among species may be selective, reflecting the diversity of evolutionary histories and genomic adaptabilities [38]. CmIGF1-1 and CmIGF1-2 exhibited notable expression levels in liver, consistent with the previous findings in spotted scat (S. argus) [25], giant grouper (E. lanceolatus) [16], and Japanese sea bass (Lateolabrax japonicus) [39], indicating the significant role of liver cells in IGF1 secretion. CmIGF2 was broadly distributed across tissues, although it showed predominant expression in the liver. A high expression of IGF2 has been observed in the gonads of Chinese sturgeon (Acipenser dabryanus) [40] and the gills of redbanded seabream (Pagrus Auriga) [24]. The observed variation in the predominant tissue for IGF2 mRNA expression among different fish species may be attributed to interspecific differences. Sex-biased differences in the expression of CmIGFs were observed, with higher levels in male livers than in females, consistent with reports in yellow catfish (P. fulvidraco) [11] where IGFs expression levels were higher in the livers of males with faster growth rates than female individuals. Sexual dimorphism in growth has been observed in European eels (Anguilla anguilla) [41] and tongue sole (C. semilaevis) [42], with females demonstrating faster growth rates than males. In the late juvenile stage of European eels (A. anguilla) [41] and the larval phase of tongue sole (C. semilaevis) [10], the expression levels of IGF1 and IGF2 are significantly higher in females compared to males. In addition to IGF1 and IGF2, a gonad-specific IGF family gene (IGF3) has been isolated in the gonads of turbot (Scophthalmus maximus) [4], zebrafish (D. rerio) [9], orange-spotted grouper (Epinephelus coioides) [43], and common carp (Cyprinus carpio) [44], uniquely expressed in ovaries and testes. IGF3 commences at the early stage of sex determination and differentiation and remains high in expression throughout gonadal development, offering insights into fish gonadal development, particularly in economically valuable species. However, the expression profiles of CmIGF1-1, CmIGF1-2, and CmIGF2 across various tissues did not reveal any gonad-specific expression patterns like IGF3. Additionally, the comparison of the amino acid sequences of IGF3 from zebrafish (D. rerio) retrieved from the NCBI database (https://www.ncbi.nlm.nih.gov/, accessed on 20 January 2024) with those of CmIGF1-1, CmIGF1-2, and CmIGF2 showed low similarity levels, at only 25.6%, 22.3%, and 43.1%, respectively. Furthermore, the IGF3 gene was not identified in the genome of blotched snakehead (C. maculata) (SRA Accession No. PRJNA730430) [30], suggesting the potential absence of IGF3 in blotched snakehead (C. maculata), warranting further investigation.
CmIGFs were detected in all tissues sampled from 45 to 365 dah, with global expression levels higher in males than in females. The expression of CmIGF1-1 and CmIGF1-2 gradually increased with growth and culminated in a minor peak at 105 dah, similar to observations in yellow catfish (P. fulvidraco) [11] and spotted scat (S. argus) [25]. Subsequently, a gradual decrease in the expression of CmIGF1-1 and CmIGF1-2 was observed from 135 dah, potentially due to a substantial portion of energy from feed being used for gonadal development [28,45]. CmIGF1-1 and CmIGF1-2 revealed the highest expression levels at 365 dah, corresponding to sexual maturity in blotched snakehead (C. maculata), with energy primarily directed toward growth. Furthermore, CmIGF1-1 and CmIGF1-2 exhibited elevated expression levels in male snakehead compared to females, possibly due to deferred sexual maturity in males and preferential energy allocation toward growth [46]. Similar expression patterns of IGF1 have observed in Nile tilapia (O. niloticus) at different developmental stages [47], showing temporal and spatial variations with the gradual elevation of hepatic expression levels during the initial growth stages, followed by a minor peak, rapid decline, and resurgence to peak levels in the late sampling period. CmIGF2 expression was high at 45 dah and decreased to a minimum at 135 dah and then gradually increased to peak at 365 dah, suggesting a crucial role of IGF2 in early growth and maturation in blotched snakehead (C. maculata). Similar results have been reported in aucha perch (Siniperca chuatsi) [48] and dark sleeper (Odontobutis potamophila) [49]. However, IGF2 exhibits different expression profiles in mammals, where it is highly expressed during early embryonic development and subsequently diminishes [5], suggesting a broader role of IGF2 in fishes beyond embryonic growth and development. Our results suggest that differences in growth between male and female individuals may be connected with sexually dimorphic expression levels of IGFs, warranting further investigation.
Sex steroid hormones are assimilated by fish and influence the expression of genes associated with growth, thereby regulating protein synthesis, cellular proliferation, and overall growth [50,51]. Previous studies have suggested interactions between sex steroid hormones and components of the GH/IGF axis [11,18,21,25,27]. However, these interactions are varied, and the reason for the variety among these studies remains unclear. In this study, both CmIGF1-1 and CmIGF1-2 were down-regulated in response to EE2 treatment in both sexes, consistent with findings in rainbow trout (O. mykiss) where E2 treatment reduces the hepatic expression levels of IGF1 [21]. Additionally, EE2 inhibits GH expression in the pituitary of blotched snakehead (C. maculata) [27], indicating that EE2 down-regulates hepatic CmIGF1 transcription levels in both sexes, probably by diminishing the expression of CmGH. After EE2 stimulation, the expression of CmIGF2 was up-regulated in both sexes, which differs slightly from the results in Nile tilapia (O. niloticus), where E2 stimulation increased IGF2 expression in females but had no significant effect on IGF2 expression in males [18]. Conversely, in spotted scat (S. argus), E2 treatment increased the transcription of both IGF1 and IGF2 in males, while in females, IGF1 was up-regulated and IGF2 was down-regulated [25]. These findings indicate that the transcriptional levels of IGFs are influenced by sex steroid hormones and exhibit variation among different fishes, potentially attributable to differences in experimental methods (such as administration method, concentration, and exposure duration) and developmental stages.
The ability of androgens to regulate the GH/IGF axis is supported by several observations of this study. In females, CmIGF1-1 expression initially increased after MT treatment for up to 2 weeks, but eventually, its expression was inhibited, while the expression of CmIGF1-2 remained inhibited. Additionally, CmIGF2 expression was significantly up-regulated in females before 6 weeks, but eventually, its expression was inhibited. Comparable results were observed in other fish species. In female yellow catfish (P. fulvidraco), IGF-1 and IGF-2 were up-regulated in the liver after 2–3 weeks of MT treatment and then declined, significantly falling to a lower level than the control group by 4 weeks [11]. Similarly, in female Nile tilapia (O. niloticus), following T treatment, IGF1 expression initially increased, then significantly dropped below the control group by 3 weeks [18]. Such fluctuations may be due to the resistance of endogenous estrogen to exogenous androgen, thereby regulating IGFs expression [35,52]. CmIGF1-1 and CmIGF1-2 expression levels were significantly up-regulated in males treated with MT after 6 weeks. It is possible that the anabolic effect of MT leads to an increase in food intake in males, thus enhancing energy allocation for growth in males [53]. Similar findings have been observed in rainbow trout (O. mykiss), where T directly increases steady-state IGF-1 and IGF-2 expression levels [21]. Likewise, IGF1 and IGF2 are provoked by T treatment in male Nile tilapia (O. niloticus), with expression increasing 7–21 days after injection [18]. However, the responses of CmIGF1-1 and CmIGF1-2 to MT stimulation differed after 8 weeks, suggesting that MT regulates the expression of GH/IGF axis genes in a time-dependent manner. Additionally, MT treatment significantly up-regulated CmIGF2 expression compared to the control group before 6 weeks, and subsequently, it gradually decreased to below the control level. We suggest that exogenous sex steroid hormones stimulate IGFs via IGF-1R in blotched snakehead (C. maculata), resulting in a compensatory increase in CmIGF2 expression in response to low CmIGF1 concentration, as IGF-1R has higher binding affinity for IGF1 than for IGF2 [54]. The specific pathways through which MT regulates the expression of CmIGFs, thereby affecting the growth of blotched snakehead, are currently unclear. Perhaps in the future, we can conduct a deeper investigation by using liquid chromatography–mass spectrometry (LC–MS) to detect changes in sex steroid hormones in both males and females during hormone treatment processes.
Sexual dimorphism in growth is governed by a complex interplay of factors, including the differential expression of GH/IGF axis genes, the influence of exogenous sex steroid hormones, and various other elements such as environmental conditions, the abundance of IGF receptors, interactions among growth axis genes, and the modulation of endogenous hormones. Future research projects will focus on delving deeper into the mechanisms underlying growth dimorphism between male and female snakehead.

5. Conclusions

The full-length sequences of CmIGFs were cloned, and their sequence characteristics and gene expression patterns were thoroughly scrutinized. The investigation unveiled that CmIGFs closely resembled those documented in bony fishes, exhibiting the typical IGF domain of the IGF family. Gene expression analyses showed the predominant expression of CmIGFs in the male liver, signifying that the liver serves as the primary site for the synthesis and secretion of IGFs. Furthermore, the study showed that exogenous sex steroid hormones, EE2 and MT, exerted significant modulatory effects on the expression of CmIGFs genes. Specifically, EE2 was observed to suppress the expression of CmIGF1-1 and CmIGF1-2 while promoting the expression of CmIGF2. In females, MT up-regulated the expression of CmIGF1-1 and CmIGF2 in a time-dependent manner, while consistently inhibiting the expression of CmIGF1-2. Interestingly, MT was found to promote the expression of CmIGFs in males in a time-dependent manner, and CmIGF1 and CmIGF2 may exhibit a complementary relationship, with a compensatory increase in CmIGF2 expression in response to low CmIGF1 concentration. These findings lay the groundwork for future investigations aimed at unraveling the molecular mechanism underlying the growth dimorphism between female and male blotched snakeheads.

Supplementary Materials

The following supporting information can be downloaded at: https://www.mdpi.com/article/10.3390/fishes9040120/s1. Figure S1: Nucleotide and putative amino sequences of CmIGF1-1 (a), CmIGF1-2 (b), and CmIGF2 (c). The sequence numbers of nucleotide (lower row) and putative amino acid (upper row) are shown on the left. The translation initiation codons and stop codons are in bold. The motif-associated mRNA instability (ATTTA) is shown as a double underscore. The poly-adenylation signal sequence (AATAA) is shown as a wavy line. The signal peptide is shown as an underscore. The IGF domain is marked with a green background. The IGF2_C domain is marked with a yellow background. The box represents the IGF-1R recognition sequence. Figure S2: Multiple protein alignments of CmIGF1-1 (a), CmIGF1-2 (b), and CmIGF2 (c) in various species. The amino acid sequences of IGF1s from typical organisms were aligned using the Clustal X 2.1 program. The black shade represents 100% identity, dark gray represents 80% identity, and the IGF domain is marked by a green box. AtIGF1-1 stands for IGF1-1 protein in A. testudineus (Protein ID. XP_026218654.1), AtIGF1-2 stands for IGF1-2 protein in A. testudineus (Protein ID. XP_026218655.1), AtIGF2 stands for IGF2 protein in A. testudineus (Protein ID. XP_026221051.1), BtIGF1 stands for IGF1 protein in B. taurus (Protein ID. NP_001071296.1), BtIGF2 stands for IGF2 protein in B. taurus (Protein ID. XP_005227329.1), CaIGF1a stands for IGF1a protein in C. argus (Protein ID. KAF3696413.1), CaIGF2 stands for IGF2 protein in C. argus (Protein ID. KAF3689021.1), CcIGF1-1 stands for IGF1-1 protein in C. carpio (Protein ID. XP_018948511.1), CcIGF1-2 stands for IGF1-2 protein in C. carpio (Protein ID. XP_018948527.1), CcIGF2 stands for IGF2 protein in C. carpio (Protein ID. XP_018955405.1), CmIGF1-1 stands for IGF1-1 protein in C. maculata (Protein ID. UTQ11150.1), CmIGF1-2 stands for IGF1-2 protein in C. maculata (Protein ID. UTQ11151.1), CmIGF2 stands for IGF2 protein in C. maculata (Protein ID. UTQ11152.1), CiGF2a stands for IGF2a protein in C. idella (Protein ID. AJG05606.1), CiGF2b stands for IGF2b protein in C. idella (Protein ID. AJG05607.1), CjIGF2 stands for IGF2 protein in C. japonica (Protein ID. XP_015719328.1), DrIGF1 stands for IGF1 protein in D. rerio (Protein ID. AAI14263.1), DrIGF2a stands for IGF2a protein in D. rerio (Protein ID. NP_571508.1), DrIGF2b stands for IGF2b protein in D. rerio (Protein ID. NP_001001815.1.), ElIGF1a stands for IGF1a protein in E. lanceolatus (Protein ID. ABZ10840.1), ElIGF1b stands for IGF1b protein in E. lanceolatus (Protein ID. ABZ10841.1), GgIGF1 stands for IGF1 protein in G. gallus (Protein ID. NP_001004384.1), GgIGF2 stands for IGF2 protein in G. gallus (Protein ID. NP_001025513.1), HsIGF1a stands for IGF1a protein in H. sapiens (Protein ID. AAA52538.1), HsIGF1b stands for IGF1a protein in H. sapiens (Protein ID. AAA52537.1), IpIGF2 stands for IGF2 protein in I. punctatus (Protein ID. ADO29240.1), MmIGF2 stands for IGF2 protein in M. musculus (Protein ID. NP_001116208.1), PoIGF1a stands for IGF1a protein in P. olivaceus (Protein ID. CAA09267.1), PoIGF1b stands for IGF1b protein in P. olivaceus (Protein ID. CAA09268.1), SaIGF1 stands for IGF1 protein in S. aurata (Protein ID. ABQ52656.1), SmIGF1a stands for IGF1a protein in S. maximus (Protein ID. XP 035474340.1), SmIGF1b stands for IGF1b protein in S. maximus (Protein ID. XP 035474347.1), TrIGF2 stands for IGF2 protein in T. rubripes (Protein ID. ADO29240.1), XlIGF1 stands for IGF1 protein in X. laevis (Protein ID. AAA70330.1), XlIGF2a stands for IGF2a protein in X. laevis (Protein ID. AAL11445.1), XlIGF2b stands for IGF2b protein in X. laevis (Protein ID. AAH72153.1), XtIGF1 stands for IGF1 protein in X. tropicalis (Protein ID. XP_002936875.1), and XtIGF2 stands for IGF2 protein in X. tropicalis (Protein ID. AAI56000.1).

Author Contributions

Conceptualization, X.Z. and M.O.; data curation, X.Z. and Y.W.; formal analysis, X.Z., J.Z.(Jin Zhang) and Y.Z.; funding acquisition, K.C., J.Z. (Jian Zhao) and M.O.; investigation, X.Z., Y.W., H.L., Q.L. and S.F.; project administration, K.C., J.Z. (Jian Zhao) and M.O.; visualization, K.C., Q.L., X.Z. and J.Z. (Jian Zhao); writing—original draft, X.Z. and Y.W.; writing—review and editing, J.Z. (Jian Zhao), K.C. and M.O. All authors have read and agreed to the published version of the manuscript.

Funding

This work was supported by the China Agriculture Research System of Ministry of Finance and Ministry of Agriculture and Rural Affairs (CARS-46), the Central Public-interest Scientific Institution Basal Research Fund of the Chinese Academy of Fishery Sciences (2023XT0202, 2023TD37), the National Natural Science Foundation of China (32373127), the Guangdong Province Rural Revitalization Strategy Special Fund (2022-SPY-00-016), and the National Freshwater Genetic Resource Center (FGRC18537).

Institutional Review Board Statement

All fish experiments in the present study were approved by the Pearl River Fisheries Research Institute and the Chinese Academy of Fishery Sciences under contract LAEC-PRFRI-2021-01-04, and the experimental process complied with protocols of international guidelines for the ethical use of animals in research.

Informed Consent Statement

Not applicable.

Data Availability Statement

All the data related to this project are available from the corresponding author and will be provided upon request.

Conflicts of Interest

The authors declare that they have no known competing financial interests or personal relationships that could have influenced the work reported in this paper.

References

  1. Dixit, M.; Poudel, S.B.; Yakar, S. Effects of GH/IGF axis on bone and cartilage. Mol. Cell. Endocrinol. 2021, 519, 111052. [Google Scholar] [CrossRef] [PubMed]
  2. Ranke, M.B.; Wit, J.M. Growth hormone—Past, present and future. Nat. Rev. Endocrinol. 2018, 14, 285–300. [Google Scholar] [CrossRef]
  3. Sun, C.; Sun, H.; Dong, J.; Tian, Y.; Hu, J.; Ye, X. Correlation analysis of mandarin fish (Siniperca chuatsi) growth hormone gene polymorphisms and growth traits. J. Genet. 2019, 98, 58. [Google Scholar] [CrossRef]
  4. Zhao, C.; Zheng, S.; Dang, Y.; Wang, M.; Ren, Y. Identification of a new insulin-like growth factor 3 (igf3) in turbot (Scophthalmus maximus): Comparison and expression analysis of IGF system genes during gonadal development. Fishes 2023, 8, 240. [Google Scholar] [CrossRef]
  5. Baral, K.; Rotwein, P. The Insulin-like The insulin-like growth factor 2 gene in mammals: Organizational complexity within a conserved locus. PLoS ONE 2019, 14, e0219155. [Google Scholar] [CrossRef]
  6. Cao, Q.; Duguay, S.J.; Plisetskaya, E.; Steiner, D.F.; Shu, J. Nucleotide sequence and growth hormone-regulated expression of salmon insulin-like growth factor I mRNA. Mol. Endocrinol. 1989, 3, 2005–2010. [Google Scholar] [CrossRef] [PubMed]
  7. Bersin, T.V.; Cordova, K.L.; Journey, M.L.; Beckman, B.R.; Lema, S.C. Food deprivation reduces sensitivity of liver Igf1 synthesis pathways to growth hormone in juvenile gopher rockfish (Sebastes carnatus). Gen. Comp. Endocrinol. 2024, 346, 114404. [Google Scholar] [CrossRef]
  8. Caelers, A.; Berishvili, G.; Meli, M.L.; Eppler, E.; Reinecke, M. Establishment of a real-time RT-PCR for the determination of absolute amounts of IGF-I and IGF-II gene expression in liver and extrahepatic sites of the tilapia. Gen. Comp. Endocrinol. 2004, 137, 196–204. [Google Scholar] [CrossRef] [PubMed]
  9. Zou, S.; Kamei, H.; Modi, Z.; Duan, C. Zebrafish IGF genes: Gene duplication, conservation and divergence, and novel roles in midline and notochord development. PLoS ONE 2009, 4, e7026. [Google Scholar] [CrossRef]
  10. Ma, Q.; Liu, S.; Zhuang, Z.; Sun, Z.; Liu, C.; Su, Y.; Tang, Q. Molecular cloning, expression analysis of insulin-like growth factor I (IGF-I) gene and IGF-I serum concentration in female and male tongue sole (Cynoglossus semilaevis). Comp. Biochem. Physiol. Part B Biocchem. Mol. Biol. 2011, 160, 208–214. [Google Scholar] [CrossRef]
  11. Ma, W.; Wu, J.; Zhang, J.; He, Y.; Gui, J.; Mei, J. Sex differences in the expression of GH/IGF axis genes underlie sexual size dimorphism in the yellow catfish (Pelteobagrus fulvidraco). Sci. China Life Sci. 2016, 59, 431–433. [Google Scholar] [CrossRef] [PubMed]
  12. Zhang, K.; Chen, H.; Jiang, D.; Deng, S.; Zhu, C.; Wu, T.; Li, G. Insulin-like growth factors 1 and 2 in spotted scat (Scatophagus argus): Molecular cloning and differential expression during embryonic development. J. Guangdong Ocean. Uni. 2018, 38, 7–14. (In Chinese) [Google Scholar] [CrossRef]
  13. Shamblott, M.J.; Chen, T.T. Identification of a second insulin-like growth factor in a fish species. Proc. Natl. Acad. Sci. USA 1992, 89, 8913–8917. [Google Scholar] [CrossRef]
  14. Yuan, Y.; Hong, Y. Medaka insulin-like growth factor-2 supports self-renewal of the embryonic stem cell line and blastomeres in vitro. Sci. Rep. 2017, 7, 78. [Google Scholar] [CrossRef]
  15. White, Y.A.R.; Kyle, J.T.; Wood, A.W. Targeted gene knockdown in zebrafish reveals distinct intraembryonic functions for insulin-like growth factor II signaling. Endocrinology 2009, 150, 4366–4375. [Google Scholar] [CrossRef] [PubMed]
  16. Dong, H.; Zeng, L.; Duan, D.; Zhang, H.; Wang, Y.; Li, W.; Lin, H. Growth hormone and two forms of insulin-like growth factors I in the giant grouper (Epinephelus lanceolatus): Molecular cloning and characterization of tissue distribution. Fish Physiol. Biochem. 2010, 36, 201–212. [Google Scholar] [CrossRef]
  17. Yuan, X.; Jiang, X.; Pu, J.; Li, Z.; Zou, S. Functional conservation and divergence of duplicated insulin-like growth factor 2 genes in grass carp (Ctenopharyngodon idellus). Gene 2011, 470, 46–52. [Google Scholar] [CrossRef] [PubMed]
  18. Yue, M.; Zhao, J.; Tang, S.; Zhao, Y. Effects of estradiol and testosterone on the expression of growth-related genes in female and male Nile tilapia, Oreochromis niloticus. J. World Aquac. Soc. 2018, 49, 216–228. [Google Scholar] [CrossRef]
  19. Nipkow, M.; Wirthgen, E.; Luft, P.; Rebl, A.; Hoeflich, A.; Goldammer, T. Characterization of igf1 and igf2 genes during maraena whitefish (Coregonus maraena) ontogeny and the effect of temperature on embryogenesis and igf expression. Growth Horm. Igf. Res. 2018, 40, 32–43. [Google Scholar] [CrossRef]
  20. Venken, K.; Boonen, S.; Kopchick, J.; Coschigano, K.; Moverare, S.; Bouillon, R.; Ohlsson, C.; Vanderschueren, D. Growth without growth hormone receptor: Estradiol is a major growth-hormone independent regulator of hepatic insulin-like growth factor-I synthesis. J. Bone Miner. Res. 2004, 19, S43. [Google Scholar] [CrossRef]
  21. Norbeck, L.A.; Sheridan, M.A. An in vitro model for evaluating peripheral regulation of growth in fish: Effects of 17β-estradiol and testosterone on the expression of growth hormone receptors, insulin-like growth factors, and insulin-like growth factor type 1 receptors in rainbow trout (Oncorhynchus mykiss). Gen. Comp. Endocrinol. 2011, 173, 270–280. [Google Scholar] [CrossRef] [PubMed]
  22. Ma, X.; Zhang, Y.; Chen, Y.; Zhou, L. Steroid hormones (E2 and MT) displayed difference in sex for Nile tilapia Oreochromis niloticus. Oceanol. Limnol. Sin. 2015, 46, 1487–1493. (In Chinese) [Google Scholar]
  23. Shen, M.; Zhu, J.; Wu, T.; Ren, T.; Zhang, Z.; Li, X.; Liu, F.; Zheng, S. Cloning and expression analysis of insunlin-like growth factor-I gene before and after reproduction in Zacco platypus. Acta Hydrobiol. Sin. 2020, 44, 1182–1190. [Google Scholar] [CrossRef]
  24. Ponce, M.; Infante, C.; Funes, V.; Manchado, M. Molecular characterization and gene expression analysis of insulin-like growth factors I and II in the redbanded seabream, Pagrus auriga: Transcriptional regulation by growth hormone. Comp. Biochem. Physiol. Part B Biocchem. Mol. Biol. 2008, 150, 418–426. [Google Scholar] [CrossRef]
  25. Zhang, K.; Wu, T.; Chen, H.; Jiang, D.; Zhu, C.; Deng, S.; Zhang, Y.; Li, G. Estradiol-17 beta regulates the expression of insulin-like growth factors 1 and 2 via estradiol receptors in spotted scat (Scatophagus argus). Comp. Biochem. Physiol. Part B Biocchem. Mol. Biol. 2019, 237, 110328. [Google Scholar] [CrossRef]
  26. Ou, M.; Chen, K.; Gao, D.; Wu, Y.; Luo, Q.; Liu, H.; Zhao, J. Characterization, expression and cpg methylation analysis of dmrt1 and its response to steroid hormone in blotched snakehead (Channa maculata). Comp. Biochem. Physiol. Part B Biocchem. Mol. Biol. 2022, 257, 110672. [Google Scholar] [CrossRef] [PubMed]
  27. Ou, M.; Chen, K.; Gao, D.; Wu, Y.; Chen, Z.; Luo, Q.; Liu, H.; Zhao, J. Comparative transcriptome analysis on four types of gonadal tissues of blotched snakehead (Channa maculata). Comp. Biochem. Physiol. Part D Genom. Proteom. 2020, 35, 100708. [Google Scholar] [CrossRef]
  28. Gao, D.; Ou, M.; Wu, Y.; Chen, K.; Liu, H.; Luo, Q.; Zhao, J. Gene cloning and expression analysis of growth hormonr gene from blotched snakehead (Channa maculata). J. Agric. Biotech. 2021, 29, 2328–2341. Available online: http://journal05.magtech.org.cn/Jwk_ny/EN/10.3969/j.issn.1674-7968.2021.12.007 (accessed on 18 January 2024). (In Chinese).
  29. Zhao, J.; Ou, M.; Wang, Y.; Liu, H.; Luo, Q.; Zhu, X.; Chen, B.; Chen, K. Breeding of YY super-male of blotched snakehead (Channa maculata) and production of all-male hybrid (Channa argus ♀ × C. maculata ♂). Aquaculture 2021, 538, 736450. [Google Scholar] [CrossRef]
  30. Ou, M.; Huang, R.; Yang, C.; Gui, B.; Luo, Q.; Zhao, J.; Li, Y.; Liao, L.; Zhu, Z.; Wang, Y.; et al. Chromosome-level genome assemblies of Channa argus and Channa maculata and comparative analysis of their temperature adaptability. Gigascience 2021, 10, giab070. [Google Scholar] [CrossRef]
  31. Tamura, K.; Peterson, D.; Peterson, N.; Stecher, G.; Nei, M.; Kumar, S. MEGA5: Molecular evolutionary genetics analysis using maximum likelihood, evolutionary distance, and maximum parsimony methods. Mol. Biol. Evol. 2011, 28, 2731–2739. [Google Scholar] [CrossRef] [PubMed]
  32. Mao, H.; Chen, K.; Zhu, X.; Luo, Q.; Zhao, J.; Li, W.; Wu, X.; Xu, H. Identification of suitable reference genes for quantitative real-time PCR normalization in blotched snakehead Channa maculata. J. Fish Biol. 2017, 90, 2312–2322. [Google Scholar] [CrossRef] [PubMed]
  33. Livak, K.J.; Schmittgen, T.D. Analysis of relative gene expression data using real-time quantitative pcr and the 2(T)(-Delta Delta C) method. Methods 2001, 25, 402–408. [Google Scholar] [CrossRef] [PubMed]
  34. Wei, M.; Wang, M.; Ning, J.; Fan, F.; Zhu, C. Cloning and association analysis with growth traits of igf gene in ussuri catfish Pseudobagrus ussuriensis. Fish Sci. 2022, 41, 738–748. (In Chinese) [Google Scholar] [CrossRef]
  35. Shamblott, M.J.; Chen, T. Age-related and tissue-specific levels of five forms of insulin-like growth factor mRNA in a teleost. Mol. Mar. Biol. Biotechnol. 1993, 2, 351–361. [Google Scholar]
  36. Ndandala, C.B.; Dai, M.S.; Mustapha, U.F.; Li, X.; Liu, J.; Huang, H.; Li, G.; Chen, H. Current research and future perspectives of GH and IGFs family genes in somatic growth and reproduction of teleost fish. Aquac. Rep. 2022, 26, 101289. [Google Scholar] [CrossRef]
  37. Sun, P.; Wu, Z.; You, F.; Li, J. Annual cycle change of sex steroid hormones in cultured Paralichthys olivaceus. Mar. Fish 2013, 35, 34–37. [Google Scholar] [CrossRef]
  38. Parey, E.; Louis, A.; Montfort, J. An atlas of fish genome evolution reveals delayed rediploidization following the teleost whole-genome duplication. Genome Res. 2022, 32, 1685–1697. [Google Scholar] [CrossRef]
  39. Qian, K.; Wen, H.; Chi, M.; Ni, M.; Zhang, D.; Ding, Y. Solation of full-length cDNA of Insulin-like growth factor-1 (IGF-1) gene of Japanese sea bass (Lateolabrax japonicas) and its expression analysis. J. Ocean Univ. China 2014, 44, 27–34. (In Chinese) [Google Scholar] [CrossRef]
  40. Chen, Y.; Liu, Y.; Lai, J.; Song, M.; Gong, Q. Molecular cloning of insulin-like growth factor 1, 2 in Acipenser dabryanus and their expression level during starvation stress. Southwest China J. Agric. Sci. 2020, 33, 447–455. (In Chinese) [Google Scholar] [CrossRef]
  41. Degani, G.; Tzchori, I.; Yom-Din, S.; Goldberg, D.; Jackson, K. Growth differences and growth hormone expression in male and female European eels [Anguilla anguilla (L.)]. Gen. Comp. Endocrinol. 2003, 134, 88–93. [Google Scholar] [CrossRef] [PubMed]
  42. Ma, Q.; Liu, S.; Zhuang, Z.; Lin, L.; Sun, Z.; Liu, C.; Ma, H.; Su, Y.; Tang, Q. Genomic structure, polymorphism and expression analysis of the growth hormone (GH) gene in female and male half-smooth tongue sole (Cynoglossus semilaevis). Gene 2012, 493, 92–104. [Google Scholar] [CrossRef]
  43. Yang, H.; Chen, H.; Zhao, H.; Liu, L.; Xie, Z.; Xiao, L.; Li, S.; Zhang, Y.; Lin, H. Molecular cloning of the insulin-like growth factor 3 and difference in the expression of igf genes in orange-spotted grouper (Epinephelus coioides). Comp. Biochem. Phys. B 2015, 186, 68–75. [Google Scholar] [CrossRef] [PubMed]
  44. Song, F.; Wang, L.; Zhu, W.; Fu, J.; Dong, J.; Dong, Z. A novel igf3 gene in common carp (Cyprinus carpio): Evidence for its role in regulating gonadal development. PLoS ONE 2016, 7, e1002447. [Google Scholar] [CrossRef] [PubMed]
  45. Wu, Y.; Ou, M.; Gao, D.; Chen, K.; Luo, Q.; Liu, H.; Zhao, J. Molecular cloning, expression and respone of foxl2 gene induced by sex steroid hormones in blotched snakehead Channa maculata. J. Dalian Ocean Uni. 2022, 37, 49–60. (In Chinese) [Google Scholar] [CrossRef]
  46. Li, X.; Mei, J.; Ge, C.; Liu, X.; Gui, J. Sex determination mechanisms and sex control approaches in aquaculture animals. Sci. China Life Sci. 2022, 65, 1091–1122. [Google Scholar] [CrossRef]
  47. Hu, Y.; Zou, Z.; Zhu, J.; Li, D.; Xiao, W.; Han, Y.; Le, Y.; Wang, T.; Yang, H. The expression analysis of IGF1 gene during different development stages in Nile tilapia. Chin. Agric. Sci. Bull. 2014, 30, 107–111. (In Chinese) [Google Scholar]
  48. Liu, J.; Zhao, J.; Zhang, M.; Dai, W. Cloning and expression of full-length cDNA of insulin-like growth factor-Ⅱ in mandarin fish Siniperca chuatsi. J. Dalian Ocean Uni. 2012, 27, 495–501. (In Chinese) [Google Scholar] [CrossRef]
  49. Zhu, W.; Zhang, H.; Wang, T.; Wang, D.; Zhang, H.; Yin, S.; Chen, S.; Zhou, G. Cloning and temporal expression analysis of GHR and IGF-2 in Odontobutis potamophila. Mar. Fish 2019, 41, 421–433. (In Chinese) [Google Scholar] [CrossRef]
  50. James, M.O. Steroid catabolism in marine and freshwater fish. J. Steroid. Biochem. Mol. Biol. 2011, 127, 167–175. [Google Scholar] [CrossRef]
  51. Shved, N.; Berishvili, G.; D’Cotta, H.; Baroiller, J.F.; Segner, H.; Eppler, E.; Reinecke, M. Ethinylestradiol differentially interferes with IGF-I in liver and extrahepatic sites during development of male and female bony fish. J. Endocrinol. 2007, 195, 513–523. [Google Scholar] [CrossRef] [PubMed]
  52. Yuan, C.; Wu, T.; Zhang, Y.; Gao, J.; Yang, Y.; Qin, F.; Liu, S.; Zheng, Y.; Wang, Z. Responsiveness of four gender-specific genes, figla, foxl2, scp3 and sox9a to 17α-ethinylestradiol in adult rare minnow Gobiocypris rarus. Gen. Comp. Endocrinol. 2014, 200, 44–53. [Google Scholar] [CrossRef]
  53. Liu, S.; Lv, W.; Lv, X. Effect of 17α-methyltestosterone (MT) on mRNA expression of vtg gene in liver of Brachydanio rerio. Anim. Husb. Feed Sci. 2016, 3, 9–11. (In Chinese) [Google Scholar] [CrossRef]
  54. Fruchtman, S.; McVey, D.C.; Borski, R.J. Characterization of pituitary IGF-I receptors: Modulation of prolactin and growth hormone. Am. J. Physiol. Regul. Integr. Comp. Physiol. 2002, 283, R468–R476. [Google Scholar] [CrossRef] [PubMed]
Figure 1. Genomic structure of CmIGFs. The shadow represents the flanking region, the black horizontal frame represents the untranslated region, the white vertical frame represents the exon, the white horizontal frame represents the intron, and the numbers above and below each schematic represent the length, respectively.
Fishes 09 00120 g001
Figure 2. Phylogenetic relationship between the IGFs proteins in different species. A neighbor-joining phylogenetic tree was constructed using MEGA 5.0 software. The bootstrap values of the branches were obtained by testing the tree 1000 times and values were over 50% percent marked. The GenBank accession numbers of IGF proteins are given after the species names in the tree. The triangle represents IGF in blotched snakehead (C. maculata).
Fishes 09 00120 g002
Figure 3. Gene expression patterns of CmIGFs in twelve tissues of males and females. (a) CmIGF1-1; (b) CmIGF1-2; (c) CmIGF2. The tissues are designated as follows: G (gills), L (liver), S (spleen), I (intestine), MK (middle kidney), M (muscle), HK (head kidney), O/T (ovary/testis), H (heart), P (pituitary), HY (hypothalamus), B (brain). β-actin and EF1α were the internal controls. Results represent the mean ± S.E.M (n = 3), and the relative expression levels in different tissues were the ratio of the expression in the female gills (G). Asterisks represent significant differences between males and females. ** p < 0.01.
Fishes 09 00120 g003
Figure 4. Gene expression profiles of CmIGFs in the liver of male and female individuals at different development stages. (a) CmIGF1-1; (b) CmIGF1-2; (c) CmIGF2. β-actin and EF1α were the internal controls. Results represent the mean ± S.E.M (n = 3), and CmIGFs transcription in the liver of 45 dah female served as the baseline (1.0). Asterisks represent significant differences between males and females. * p < 0.05, and ** p < 0.01.
Fishes 09 00120 g004
Figure 5. Effects of short-term hormone treatment on CmIGFs in female blotched snakehead. (a) CmIGF1-1; (b) CmIGF1-2; (c) CmIGF2. β-actin and EF1α were used as the internal controls for qPCR. Data are presented as mean ± S.E.M (n = 3). Asterisks represent significant differences between treatments and control at the corresponding time point for each dataset. ** p < 0.01.
Fishes 09 00120 g005
Figure 6. Effects of short-term hormone treatment on CmIGFs in male blotched snakehead. (a) CmIGF1-1; (b) CmIGF1-2; (c) CmIGF2. β-actin and EF1α were used as the internal controls for qPCR. Data are presented as mean ± S.E.M (n = 3). Asterisks represent significant differences between treatments and control at the corresponding time point for each dataset. ** p < 0.01.
Fishes 09 00120 g006
Figure 7. Effects of long-term hormone treatment on CmIGFs in female blotched snakehead. (a) CmIGF1-1; (b) CmIGF1-2; (c) CmIGF2. β-actin and EF1α were used as the internal controls for qPCR. Data are presented as mean ± S.E.M (n = 3). Asterisks represent significant differences between treatments and control at the corresponding time point for each dataset. * p < 0.05, and ** p < 0.01.
Fishes 09 00120 g007
Figure 8. Effects of long-term hormone treatment on CmIGFs in male blotched snakehead. (a) CmIGF1-1; (b) CmIGF1-2; (c) CmIGF2. β-actin and EF1α were used as the internal controls for qPCR. Data are presented as mean ± S.E.M (n = 3). Asterisks represent significant differences between treatments and control at the corresponding time point for each dataset. ** p < 0.01.
Fishes 09 00120 g008
Table 1. Primers used for IGF genes cloning and qPCR in blotched snakehead (C. maculata).
Primer NameSequence (5′~3′)Application
IGF1-1-F1CTCCTGTAGCCACACCCTCPartial sequence obtaining
IGF1-1-R1GAATGACTGTGTCCAGGTAAAG
IGF1-2-F1ATGGGCTGTATCTCCTGTAGTC
IGF1-2-R1AGTATTCTCGGCAAGTCGGT
IGF2-F1AGCAAAGATACGGACAGCAC
IGF2-R1GTTGACATAGTTATCCGTGGC
IGF1-1-5′R-outAAGCCTCTTTCTCCACACACAAACTGC5′-RACE PCR amplification
IGF1-1-5′R-inGCAGTGAGAGGGTGTGGCTACAGGAG
IGF1-2-5′R-outAGCGTGTGGGTTTACT
IGF1-2-5′R-inTGTCGACCAGCTCCACCC3′-RACE PCR amplification
IGF1-1-3′F-outCCTGCCAAGACTAACAAGCCAACTCG
IGF1-1-3′F-inGAGAACAACTAAGAGACCTTTACCTGGACACA
IGF1-1-F2CCTGTTCGCTAAATCTCACTTCTCORF identification
IGF1-1-R2CATTTGTCCATTCGCTCCATC
IGF1-2-F2GGACTACAAGAGAGACGG
IGF1-2-R2TTTGTCCCTTCGCTCCAT
IGF2-F2AGCCAAATAACCCCCAACA
IGF2-R2AGCGGGCTCATTTGTGG
IGF1-1-DL-FCGCTCTTTCCTCTCAGTGGCqPCR amplification
IGF1-1-DL-RCCATAGCCTGTGGGTTTACTGA
IGF1-2-DL-FGTTTGTGTGTGGAGACAGAGGC
IGF1-2-DL-RGCACGCACAGAGTGAGTTGG
IGF2-DL-FGTCTTCGTCCAGTCGTTCGC
IGF2-DL-RTGTTGCCCCTGCTGGTTG
β-actin-FGCAAGCAGGAGTATGATGAG
β-actin-RTTGGGATTGTTTCAGTCAGT
EF1α-FGGGAGACCCACAATAACATCG
EF1α-RCCAGGCATACTTGAAGGAGC
Table 2. Primers used for genomic sequence amplification of blotched snakehead (C. maculata) IGFs gene.
Primer NameSequence (5′~3′)Length (bp)
IGF1-1-gDNA-F1TTTATGATTGGGTCACAGCA1674
IGF1-1-gDNA-R1GGACTCAGCAGGAATTACTCT
IGF1-1-gDNA-F2GTTACTTACTGGCAGGTTTT1827
IGF1-1-gDNA-R2TGTTTGGGTTCTACTCAATT
IGF1-1-gDNA-F3GGCGGCAAATTAGAGTTGTG1848
IGF1-1-gDNA-R3ATGGACGAACTGAGGTTACAAG
IGF1-1-gDNA-F4ACAAACGCTGTGAAGTGGTC1764
IGF1-1-gDNA-R4CAGGGAGCTACTTAATGCTTA
IGF1-1-gDNA-F5GGGTGATTTCACTGGGATGT1962
IGF1-1-gDNA-R5AACCTGTGGATTCTTGGAGC
IGF1-1-gDNA-F6TAGTCCCTGCCCAGCCGTAA1997
IGF1-1-gDNA-R6AGAAACAAAGCATAGGTGAA
IGF1-1-gDNA-F7TCGATTCCCCTGTCCCCTAA2008
IGF1-1-gDNA-R7GCCTGCGTTTCGACTTCACG
IGF1-1-gDNA-F8GATGTTTTAGGCAGCGTCTG1588
IGF1-1-gDNA-R8AACCGTGTTTTACTCTTTTAG
IGF1-2-gDNA-F1TGCCTTTGTAGTTTACCTTT1829
IGF1-2-gDNA-R1TAATTTGTCCCCTTTATTCG
IGF1-2-gDNA-F2ATGCTAGGACTGAAATGCTA1727
IGF1-2-gDNA-R2TAGATGATAAATAACGGGTA
IGF1-2-gDNA-F3GTCAGTGCTGTTCTTTCCAA1155
IGF1-2-gDNA-R3AAAAGGGGCTGTGCCTTGTT
IGF1-2-gDNA-F4AAGTGAAGCATTTCAAACTT1546
IGF1-2-gDNA-R4TAACTGGCAGAAGATGACTA
IGF2-gDNA-F1GGAGGAGCGATGGGTGGTGG1677
IGF2-gDNA-R1AGCGGCCCATTGTCAGTCCG
IGF2-gDNA-F2GTCTCAAGACTTCGTCCAGG1623
IGF2-gDNA-R2GTCTCAAGACTTCGTCCAGG
IGF2-gDNA-F3CCACTATGGGAAACAATGCC1742
IGF2-gDNA-R3AGGACTGCCACAGAAATCAC
Disclaimer/Publisher’s Note: The statements, opinions and data contained in all publications are solely those of the individual author(s) and contributor(s) and not of MDPI and/or the editor(s). MDPI and/or the editor(s) disclaim responsibility for any injury to people or property resulting from any ideas, methods, instructions or products referred to in the content.

