Article

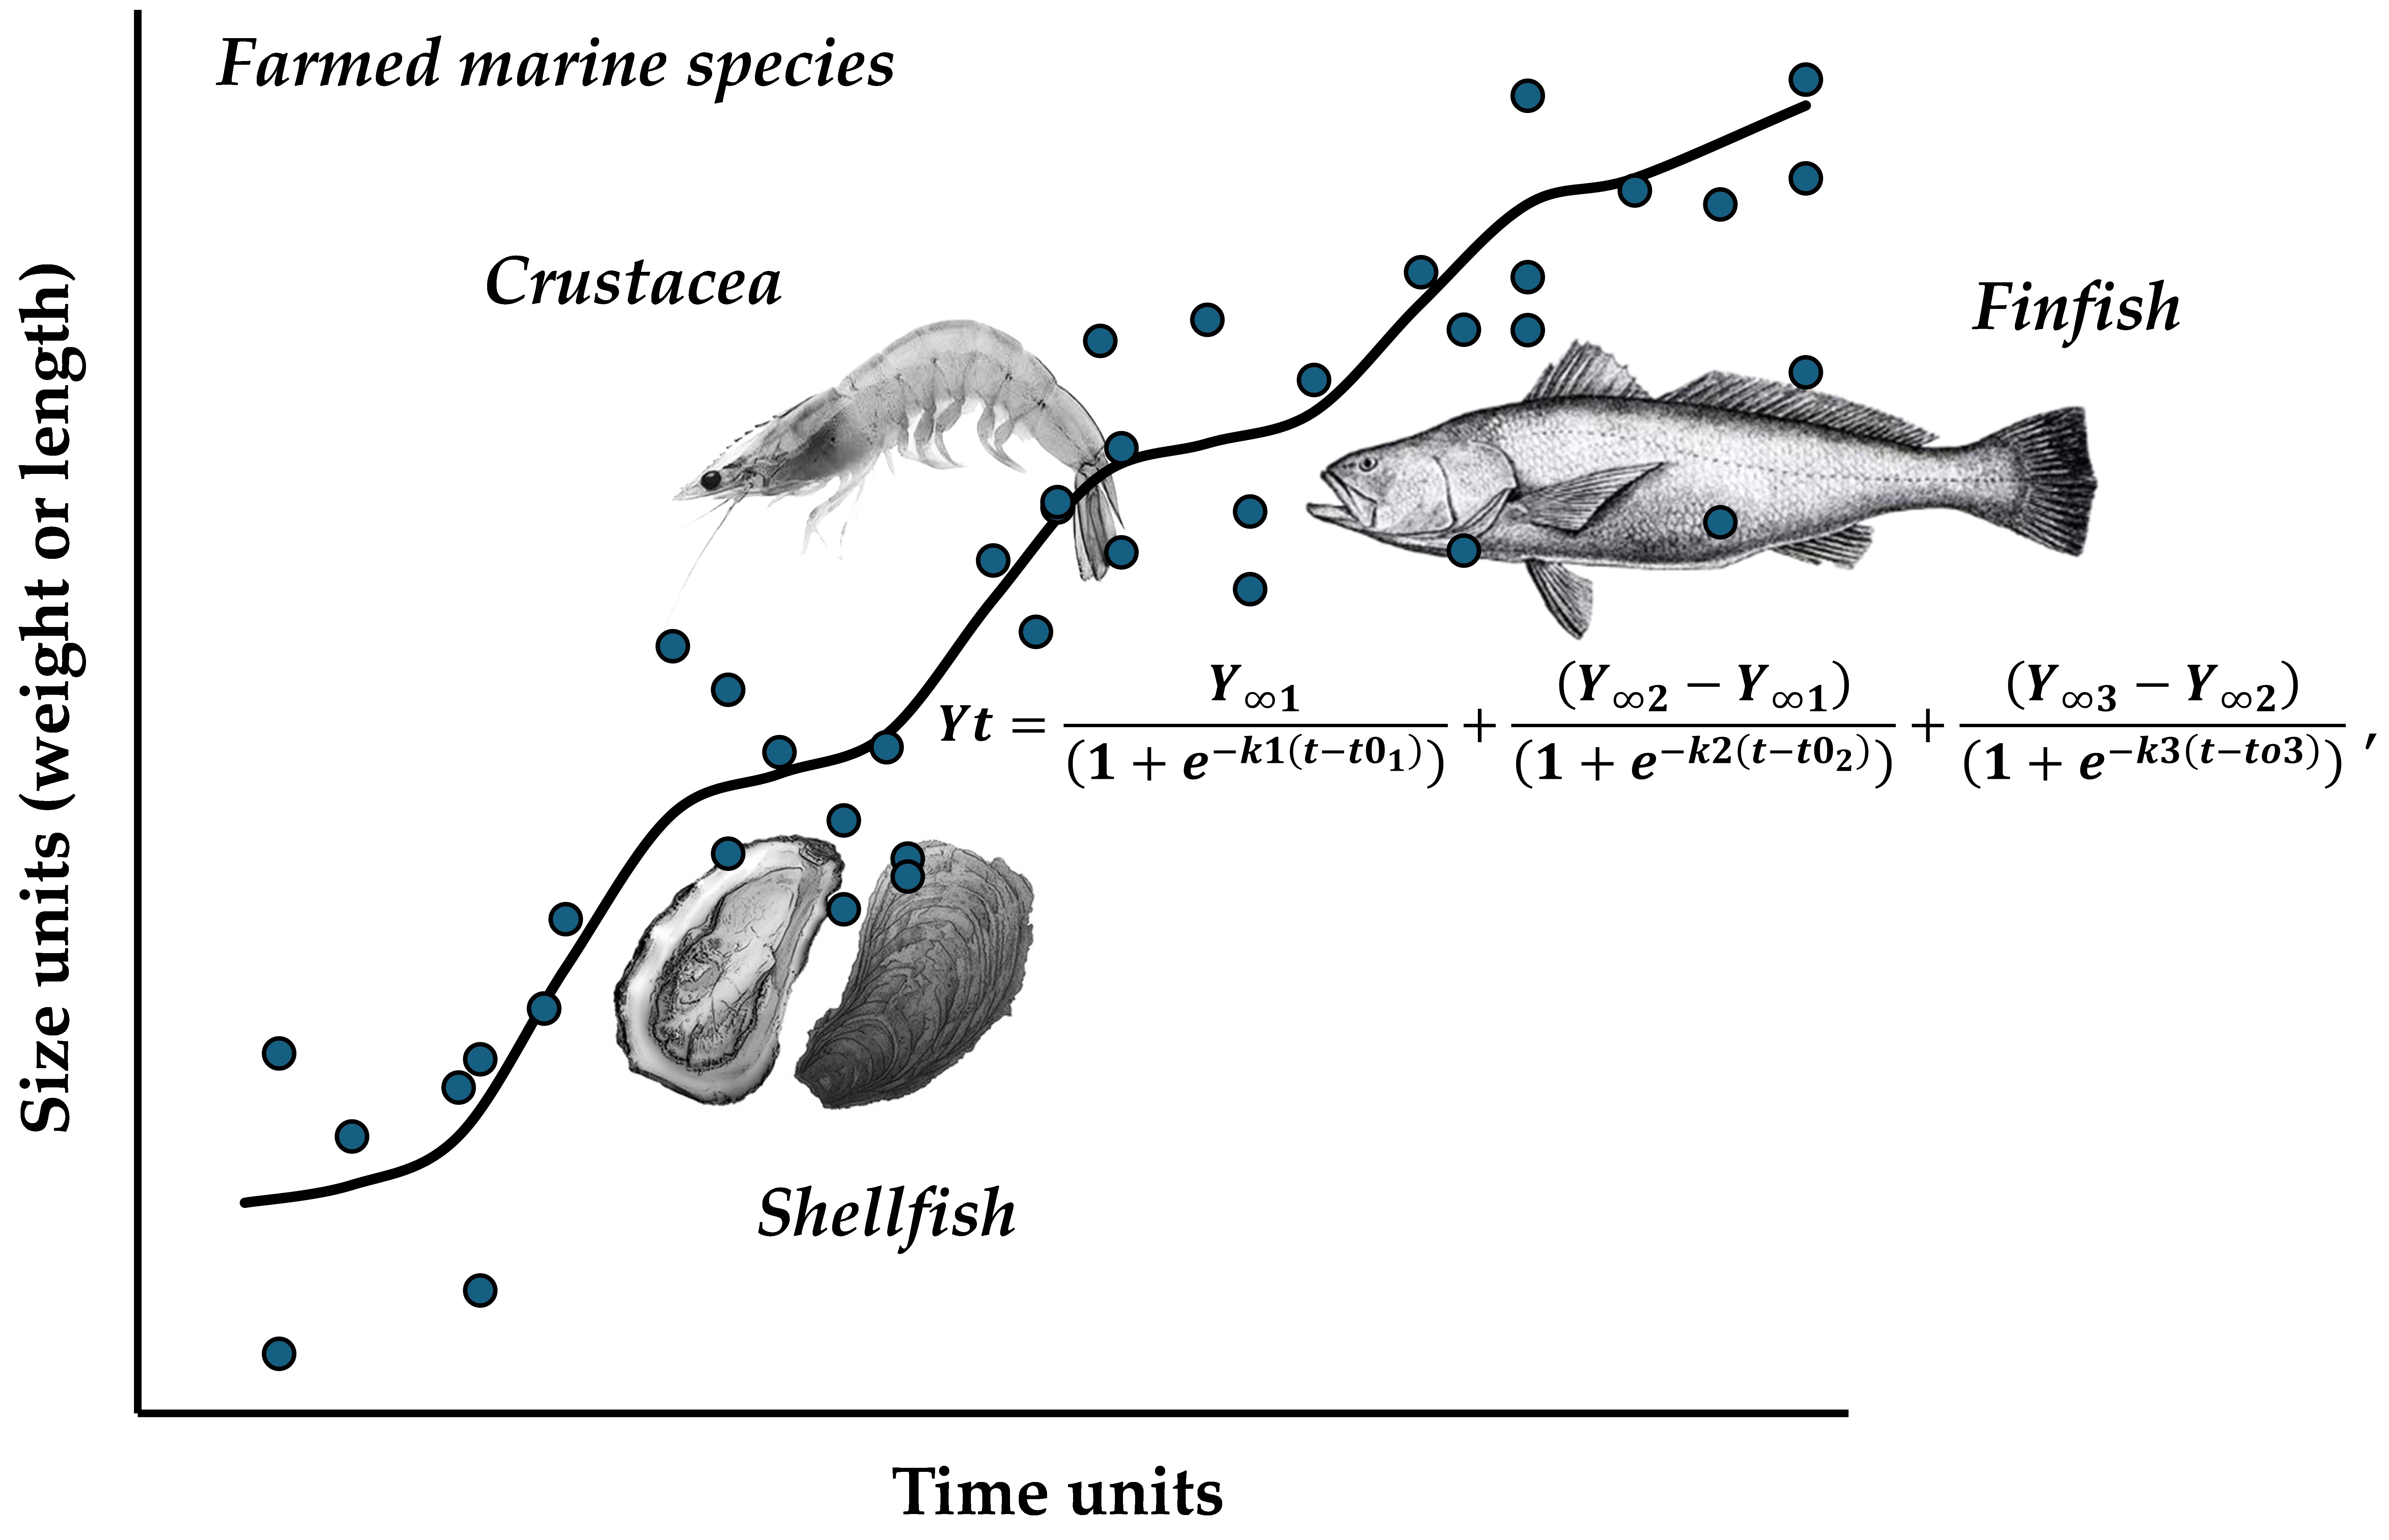
The Fractal Approach to Describe Growth of Farmed Marine Species: Using Double and Triple Logistic Models

by
Guillermo Rodríguez-Domínguez
1,
Eugenio Alberto Aragón-Noriega
2,*,
Jorge Payán-Alejo
1,
Jaime Edzael Mendivil-Mendoza
3,*,
Marcelo Vidal Curiel-Bernal
4,
Wenceslao Valenzuela-Quiñonez
5 and
Ricardo Urías-Sotomayor
1
1
Facultad de Ciencias del Mar, Universidad Autónoma de Sinaloa, Paseo Claussen s/n, Mazatlan 82000, Mexico
2
Unidad Guaymas del Centro de Investigaciones Biológicas del Noroeste, S.C. Km 2.35 Camino a El Tular, Estero de Bacochibampo, Guaymas 85454, Mexico
3
Departamento de Ingenierías, Instituto Tecnológico del Valle del Yaqui, Tecnológico Nacional de México Academy of Biology, Av. Tecnológico, Block 611, Bacum 85276, Mexico
4
Instituto Nacional de Pesca y Acuacultura-Guaymas, Instituto Mexicano de Investigación en Pesca y Acuacultura Sustentables, Calle 20 No. 605-Sur, Guaymas 85400, Mexico
5
Departamento de Acuacultura, Centro Interdisciplinario de Investigación para el Desarrollo Integral Regional, Unidad Sinaloa, Instituto Politécnico Nacional, Boulevard Juan de Dios Bátiz Paredes # 250, Guasave 81101, Mexico
*
Authors to whom correspondence should be addressed.
Fishes 2024, 9(3), 106; https://doi.org/10.3390/fishes9030106
Submission received: 17 January 2024 / Revised: 5 March 2024 / Accepted: 8 March 2024 / Published: 12 March 2024
(This article belongs to the Section Biology and Ecology)

Abstract

:
Modeling individual growth in marine species for aquaculture encounters many difficulties when the species pauses its growth but resumes its later after the disrupting phenomenon (environmental or physiological) has been overcome. Seasonal or oscillatory growth has been addressed by modifying existing models, such as von Bertalanffy and Gompertz, to include an oscillatory component in this study. The novelty of this study lies in the fractal approach used to analyze growth using multiple logistic functions. Three commercially farmed marine species were studied, including shellfish, crustacea, and finfish. The oscillatory version of the von Bertalanffy model as well as double and triple logistic functions were used for analysis. The best model was selected using the information theory, Specifically the Akaike criterion (AIC) and the Bayesian criterion (BIC). Normal and log-normal distributions of error were assumed. The triple logistic model with log-normal distribution in the error structure was found to be the best model to describe the growth pattern of the three commercially farmed species as it obtained the lowest AIC. Overall, this study concludes that the fractal approach is the most effective way to describe growth in farmed species, including shellfish, crustacean, and finfish.
Key Contribution: The growth process in the three studied species was divided into three logistic harmonics. However, for totoaba and shrimp, it was suggested that four logistic harmonics could be applied. Fractal approaches are recommended for future studies to describe individual growth.

Graphical Abstract

1. Introduction

Modeling species growth curves in aquaculture is not a common practice. The most commonly reported value is the specific growth rate or thermal growth coefficient. However, a bioeconomic model of aquaculture activity requires a production model that involves modeling the growth of the species in culture. Several models were applied in the literature to describe the growth of the farmed species, including finfish, crustacean, and shellfish [1]. This study was devoted to demonstrating the efficiency of a new model and, for the first time, used and described as a new model. But, the relevance in this study was that the authors proved the new model in finfish, crustacean, and shellfish. The equations they used included the von Bertalanffy, the Single Logistic, and the Gompertz and Richard models, as well as the already mentioned new model. It is interesting to note that, throughout the paper, they referred to the “new model” as the equation they proposed. Maybe, in the future, the researchers will refer to this model as the name of the authors, as is usually custom (see the above listed models; i.e., Bertanffy, Gompertz, Richard). There are other examples of aquaculture studies that have applied many mathematical equations to describe the growth in farmed species, such as tilapia (Oreochromis niloticus), [2] which used the Gompertz, logistic, quadratic, and von Bertalanffy and turbot (Psetta maxima) equations [3]. Additionally, the authors have proven Gompertz, von Bertalanffy, and four versions of the Schnute model. In places where there are marked seasonal environmental changes, it is common to observe a pause in the growth of commercially cultivated individuals. Fisheries biologists often use the von Bertalanffy oscillatory model [4] to fit seasonal variations in growth. Although the oscillatory von Bertalanffy model has not been the best option to describe seasonal growth in some species according to the multi-model selection paradigm [5], it has been found that this model does not adequately describe the growth of organisms in early stages [6,7]. This could be problematic for describing the growth of species in aquaculture, where culturing begins at early phases of the species under culture conditions.
Every growth process can be considered a fractal of several logistic functions [8]. The authors describe how human growth can be described with three logistic functions: one from the fetus to childhood, another from childhood to adolescence, and, finally, one from adolescence to adulthood. This approach is described as “successive growth stages depicted by cascading logistic curves may outline an overall growth process that is itself amenable to a logistic description”. “The idea that a growth process can, on closer examination, reveal similar but smaller cascading growth processes, suggests a fractal nature for the logistic curve. The implication is that further “zooming-in” may reveal an even finer structure of logistic cascades”. In other words, a single logistic function consists of two phases with an inflection point, where the growth rate increases before the infection point and decreases after it.
The growth rate before and after each inflection point in double logistics consists of two stages with two phases each. This process can be repeated for multiple logistics in fractal growth. A similar growth pattern was observed in the growth of agricultural crop species, where cultivation may span several seasons of the year. In this case, a double logistic model was used to describe the seasonality of the growth pattern [9]. The authors mentioned the double logistic model but did not link their findings to the fractal approach proposed by [8].
The above statements lead us to compare multiple models to obtain a better anticipated curve based on the data. Using more than one model instead of a single model a priori is a common practice in recent growth studies [10]. After selecting the model to use, it needs to be parametrized by considering the error structure. To select the appropriate error structure for the data, the normal or lognormal error structure is the most suitable to address the residual generated during parameterization of models. Several approaches are implemented to select the model that best describes the shape of the curve generated by the data. The two most important approaches are the goodness of fit by R2 and information theory [10,11]. The most robust approach is the information theory, implementing the Akaike’s information criterion (AIC) and Bayesian information criterion (BIC) [12]. The information theory has gained more importance in recent years [10] since the first peer-reviewed paper analyzing the somatic growth of fishes was published in 2002. In the context of goodness of fit, a more complex model may receive greater acceptance due to its higher R2 value. However, when considering AIC and BIC, the principle of parsimony model is applied, meaning that models with fewer parameters are preferred. It is important to note that AIC and BIC differ in their penalty term. In information theory, the best performing and most parsimonious model is preferred over a more complex one.
Under laboratory conditions, it has been observed that the growth pattern of early stages of aquatic species follows a quasi-sigmoid curve with two inflection points [13,14], which suggests a double logistic growth model. However, in commercial aquaculture, species can experience changes in feeding type that can influence growth across multiple seasons, making a triple logistic model a potential alternative. The purpose of this study is to describe the growth of three species during the culture period using the oscillatory von Bertalanfy growth model, as well as double and triple logistic models.

2. Materials and Methods

The growth data analyzed in this study are from an oyster culture (Crassostrea corteziensis), a commercial shrimp culture (Penaeus vannamei), and growth of totoaba (Totoaba macdonaldi) larvae under laboratory conditions, which have preexisting published studies with details on cultivation period, feeding procedures, and husbandry techniques [14,15,16]. In this study, the focus is on modeling the growth by means of new approaches not used in the original studies.
Three models were selected, each considering more than one stage with two phases. Each stage can be described as having one inflection point, where the growth rate increases before the inflection point and decreases after it.
The following are candidate models to describe the growth of these species: von Bertalanffy oscillatory model:
Y t = Y 1 e c sin 2 π t t s 250 + k t t o ,
Double logistics model:
Y t = Y 1 1 + e k 1 t t 0 1 + Y 2 Y 1 1 + e k 2 t t 0 2 ,
Triple logistics model:
Y t = Y 1 1 + e k 1 t t 0 1 + Y 2 Y 1 1 + e k 2 t t 0 2 + Y 3 Y 2 1 + e k 3 t t o 3 ,
where Yt is the length or weight at age t. Y, Y1, Y2, and Y3 are the lengths at which growth slows down. k, k1, k2, and k3 are growth coefficients with units of t−1. t0 is an adjustment parameter of the von Bertalanffy model that represents the theoretical age when length is 0. t01, t02, and t03 are the inflection ages of the growth curve in the logistic models.
To parametrize the models, the maximum log-likelihood, LL, functions were used assuming normal and lognormal distribution of the errors. This means that the optimum parameters were selected when the maximum LL was reached.
Normal loglikelihood function:
L L = n 2 L n   2 π + 2 L n Y t Y t ^ 2 n + 1 ,
Lognormal loglikelihood function:
L L = n 2 L n   2 π + 2 L n l n Y t l n Y t ^ 2 n + 1 L n Y t ,
where Yt is the observed length or weight at age t, ( Y t ^ ) is the estimated length or weight with any candidate model, and n is total observations.
The errors were plotted against the days of culture after adjusting for maximum likelihood, and a quadratic regression was applied to observe for any deviation from linearity. When assuming a lognormal distribution of errors, it is necessary to ensure that the logarithm of the ratio of observed length or weight against estimated length or weight follows a normal distribution. To test this assumption, quantile graphs were utilized.
To select the best model, the multi-model selection procedure was employed, fitting three candidate models to the same data set. The Akaike information criterion (AIC) and the Bayesian information criterion (BIC) were estimated as follows: AIC = −2LL + 2θ and BIC = −2LL + ln(n)θ. LL is the value of the log likelihood obtained by normal or log-normal functions, θ are the number of parameters in each model, and n is the number of paired size-at-age data used. The model with the lowest value of the indices is the one that is selected as the best to describe the growth of the species under analyses. Once the best model was selected, the confidence intervals (95%) for parameters were estimated by bootstrapping with 10,000 repetitions.

3. Results

The triple logistic model, with a log-normal distribution in the structure of the errors, was found to be the best model for describing the type of growth in the three commercially cultivated species. This was determined by obtaining the lowest AIC and BIC among the other candidate models and distribution of assumed errors (Table 1). On the other hand, the VBO model was the worst model for obtaining a larger AIC in the three species and failed to converge when a log normal distribution was assumed in the oyster and shrimp data. The BIC also shows a similar result, but regarding the data for totoaba, assuming a normal distribution of errors, it ranked second, displacing the double logistic model to third place. The weight of the triple logistic model over the other two candidate models is defined by the distance of 18 to 625 AIC units from the second-ranked model (considering log normal error distribution). A similar result is obtained using the BIC, except in the totoaba data, where the distance in BIC units between the triple logistic model and the second-ranked one was only 2 BIC units. This indicates that both the triple logistic model and the double logistic model are well-supported by the data. The triple logistic model is a suitable description of growth in all three crop species. This is supported by the graphic analysis of the residuals in Figure 1, which shows a horizontal line in the quadratic regression. Additionally, the model passes through the geometric mean of the data for each day of culture when the sampling was carried out.
However, the assumption of a lognormal distribution for model errors is not fully met by oyster and shrimp data. The errors in the totoaba data show a fat-tailed distribution to the right, while the shrimp data is highly skewed from the normal distribution. In the case of oyster data, it can be considered that the assumed normality of the errors was adequately met. Table 2 displays the parameters and confident interval at 95% of the triple logistic model for each cultivated species, assuming a lognormal distribution of errors.

4. Discussion

The growth patterns of the three analyzed cultivated species was accurately described using the triple logistic model with a lognormal distribution of errors. The model follows the trajectory of the geometric means of size, length, or weight, estimating the mathematical expectation of the size distributions at different ages in the three species. The analysis of errors and quadratic regression confirm that there is no observed trend in errors with respect to the cultivation period in any of the three species analyzed. The double logistic model was consistently the second best model, but the distance from the best model was always greater than 10 AIC units, classifying it as a model that lacks support [12]. The growth patterns of oyster and shrimp showed the same results with the BIC. However, for the totoaba data, the difference in BIC between the double and triple logistic model was only 2 units, indicating that both models have sufficient support from the data [12]. In this case, it may be preferable to choose the double logistics model since it is simpler than the triple logistics model. It is important to note that AIC penalizes the triple logistic model for having more parameters than the double logistic model. While goodness of fit tends to select the most complex model, information theory approaches, such as AIC, are replacing it. A combination of goodness of fit and information theory could be used in specific circumstances [10,11,17]. In aquaculture studies, the use of information theory is expected to become common for selecting models. However, goodness of fit will still be used with sufficient justification.
As expected, the von Bertalanffy oscillatory model performed poorly in describing the seasonal growth of these three cultured aquatic species. The AIC or BIC distance from the best model exceeded 100 units and, in two cases, optimization did not converge when errors with a lognormal distribution were assumed. The inadequacy of the von Bertalanffy model in describing the growth pattern of aquatic species during their early developmental stages is once again demonstrated, as previously reported in other case studies [6,7]. It is worth noting that the von Bertalanffy growth equation has been widely used to predict size as a function of age since its introduction for fished stock assessments [18] (pp. 218–219). This equation defines the growth by balancing negative and positive (anabolic and catabolic, respectively) processes within individuals [19].
Accurate estimation of individual growth parameters is crucial for population dynamic studies since growth is among the most important aspects in demographic analyses. Stock biomass is related to individual growth, and fish grow in response to seasonal and local environmental conditions based on timing or location [20,21]. The importance of this is reflected in the large amount of scientific literature published on individual growth in fisheries, aquaculture, and ecological environments [22,23,24,25].
The reasons for the periods of low and high growth rates, as supported by double or triple logistic models, can vary and depend on the species. These reasons may include changes in density, quantity, and quality of natural food, seasonal temperature changes, and physiological changes in each stage of the species during cultivation. The age or time of the inflection points, as well as the asymptotic lengths or weights of each logistic function may be correlated with these change factors from low to high growth rate or vice versa. The use of these models in aquaculture can help identify these stages of stress in the cultured species, allowing decisions to be made in advance to avoid prolonging or stagnating the stages of low growth rates once the factor causing them is identified, thereby affecting the profitability of the culture. Any growth process can be broken down into logistic harmonics [8]. In this analysis, it appears that there are three logistic harmonics represented in the triple logistic model. According to reference [14], the somatic growth of totoaba under laboratory conditions exhibited two inflection points: between 16 to 18 days post-hatching (DPH) and another 31 to 33 DPH. The exp-Schnute model accurately captures the major characteristics of the growth pattern of this species, except in the last days of the culture period, which requires a more detailed analysis. The observations from the original article support the triple logistic model developed here for the early stages of totoaba. The two inflection points seem to mark the end of the first two logistic harmonics, and the lack of adjustment in the last days of the farmed period corresponds to the beginning of the third logistic harmonic. The authors explain these inflections in terms of the development of the digestive tract and the success of weaning. In [14], the authors note that the second turning point occurred when feeding with a formulated diet began at 31 DPH, which stimulated growth between 31–35 DPH.
In [10], it was suggested that growth equations can be improved to capture the realism of the data to improve our understanding of the underlying mechanisms of fish growth. For many years, the von Bertalanffy growth model (VBGM) was overwhelmingly dominant in stock assessments, even when better-fitting models had been found for the most important species in commercial fisheries. In studies analyzing growth in adult totoaba, the VBGM has been the single most model used to anticipate growth curves [25,26,27,28,29,30,31]. This is an influential model because it has been derived from an ingrained paradigm coined in 1957 by the authors in their book of fisheries assessment in reference [32]. They instilled the idea that VBGM should be used without any modifications to express such oscillations, although they occured in all the fishes they studied. Technological limitations have hindered advances in models improvements as computer programs have restrictions in calculating data with high time demands. Nowadays, testing multiple models and statistical approaches with various size error structures is much easier. In [14], the authors modified Schnute’s original model in an attempt to represent the growth of totoaba larvae. The study used the exp-Schnute model, which was found to be the most effective, but was unable to accurately represent the last two days of the culture period. The application of a fractal approach in the present study is a significant improvement to the growth model’s performance.
When fitting a model to the data, it is common to assume a probability distribution of the errors for the log-likelihood function; however, it is important to verify whether the error distribution assumption was met after fitting the model. In this study, the quantile–quantile graphs indicate that the assumption of normality of the errors is met for the oyster data. However, in the case of totoaba and shrimp, a deviation from the expected linear shape of normality is observed. For totoaba, the greatest discrepancy was found to occur between days 15 and 20 of culture and, indeed, at these points, and more precisely at 17 and 18 DPH, the observed values are above what the model estimates. To correct this bias, a fourth logistic harmonic could be considered. Nevertheless, it has to be analyzed in more detail, taking into account information on the physiology of larval growth. For shrimp, the largest deviations from the normal model were found in the second logistic harmonic, which is integrated from 22 to 80 days of culture. The behavior of the geometric means suggests that this second harmonic could be divided into two parts: one between days 22 to 57 days of cultivation and another from 57 to 80 days. It is important to frequently check the assumption of normality of errors after fitting a model. This is because a departure from the assumption may indicate that the true model is not among the candidate models evaluated. Examining as many models as possible should not be considered a waste of time if the objective is to obtain the best model to determine the growth pattern of the species involved in any aquacultural purpose.
In an order that contain errors, after fitting a model to observed data, to follow a normal distribution, it is necessary that the distribution of the dependent variable follows a normal distribution at each point or section of the independent variable and that the variance is homogeneous (throughout independent variables). However, when the variances are heterogeneous, the assumption of normality is compromised and the errors will have a different distribution, for example, a lognormal distribution (but this is not a rule). Other types of error distributions should be analyzed in cases where heterogeneity of variances is evident. The fat-tailed t student, gamma, and logistic distributions could be other alternative distribution types to use but are out of the scope of focus of this paper.
In this study, the objective was not to describe the growth phases of species in culture, but to demonstrate that it is possible to decompose the growth process of aquatic species into logistical harmonics using the fractal approach. The AIC or BIC may in any case be a criterion to discriminate when the inclusion of a new logistic harmony is proven by the data.

5. Conclusions

The fractal approach exhibited better performance than oscillatory growth equations, such as von Bertalanffy. Fractal approach is the most effective method for describing the growth of farmed species, including shellfish, crustacean, or finfish. In the three species studied, the growth process can be divided into three logistic harmonics, while, for totoaba and shrimp, four logistic harmonics may be applicable. The selection of appropriate error structure for the data and the normal or lognormal processes to parametrize the models are concluded to be crucial in the study. It is recommended that future studies employ fractal approaches to describe individual growth.

Author Contributions

Conceptualization, E.A.A.-N. and G.R.-D.; methodology, E.A.A.-N. and G.R.-D.; software, E.A.A.-N., J.P.-A. and G.R.-D.; validation, E.A.A.-N. and G.R.-D.; formal analysis, E.A.A.-N., J.P.-A. and G.R.-D.; investigation, J.E.M.-M., M.V.C.-B. and W.V.-Q.; resources, E.A.A.-N. and G.R.-D.; data curation, J.E.M.-M., M.V.C.-B., W.V.-Q. and R.U.-S.; writing—original draft preparation, E.A.A.-N., J.P.-A., G.R.-D., J.E.M.-M., M.V.C.-B., W.V.-Q. and R.U.-S.; writing—review and editing, E.A.A.-N., J.P.-A., G.R.-D., J.E.M.-M., M.V.C.-B., W.V.-Q. and R.U.-S.; visualization, E.A.A.-N.; supervision, E.A.A.-N.; project administration, E.A.A.-N.; funding acquisition, E.A.A.-N. All authors have read and agreed to the published version of the manuscript.

Funding

This research was funded by “CONAHCYT, grant number CF-2023-I-668” and the APC was also funded by “CONAHCYT, grant number CF-2023-I-668”.

Institutional Review Board Statement

Ethical review and approval were waived for this study since this study did not manipulate any animals. Only data that come from published papers are incorporated.

Informed Consent Statement

Not applicable.

Data Availability Statement

All data are available in the cited paper.

Acknowledgments

This project was supported by CONAHCYT in 2023. Thanks are due to CONAHCYT for the grant awarded to Marcelo Vidal Curiel-Bernal as an SNII level 3 research assistant (Contract I1200/051/2023 MOD.ORD. /02/2023). We also thank Edgar Alcantara Razo from CIBNOR-Guaymas Applied Ecology and Fisheries lab for aid in data acquisition.

Conflicts of Interest

The authors declare no conflicts of interest.

References

  1. Hernandez-Llamas, A.; Ratkowsky, D.A. Growth of fishes, crustaceans and molluscs: Estimation of the von Bertalanffy, Logistic, Gompertz and Richards curves and a new growth model. Mar. Ecol. Progr. Ser. 2004, 282, 237–244. [Google Scholar] [CrossRef]
  2. Ansah, Y.B.; Frimpong, E.A. Using model-based inference to select a predictive growth curve for farmed Tilapia. N. Am. J. Aquac. 2015, 77, 281–288. [Google Scholar] [CrossRef]
  3. Baer, A.; Schulz, C.; Traulsen, I.; Krieter, J. Analysing the growth of turbot (Psetta maxima) in a commercial recirculation system with the use of three different growth models. Aquac. Int. 2011, 19, 497–511. [Google Scholar] [CrossRef]
  4. Pauly, D. Length-converted catch curves and the seasonal growth curves of fishes. Fishbyte 1990, 8, 24–29. [Google Scholar]
  5. Rodríguez-Domínguez, G.; Castillo-Vargasmachuca, S.G.; Ramírez-Pérez, J.S.; Pérez-González, R.; Aragón-Noriega, E.A. Modelos múltiples para determinar el crecimiento de organismos juveniles de jaiba azul Callinectes arcuatus en cautiverio. Cienc. Pesq. 2014, 22, 29–35. [Google Scholar]
  6. Day, T.; Taylor, P.D. Von Bertalanffy’s growth equation should not be used to model age and size at maturity. Am. Nat. 1997, 149, 381–393. [Google Scholar] [CrossRef]
  7. Semmens, J.M.; Pecl, G.T.; Villanueva, R.; Jouffre, D.; Sobrino, I.; Wood, J.B.; Rigby, P.R. Understanding octopus growth: Patterns, variability and physiology. Mar. Freshw. Res. 2004, 55, 367–377. [Google Scholar] [CrossRef]
  8. Modis, T. Fractal Aspects of Natural Growth. Technol. Forecast. Soc. Change 1994, 47, 63–73. [Google Scholar] [CrossRef]
  9. Shabani, A.; Sepaskhah, A.R.; Kamgar-Haghighi, A.A.; Honar, T. Using double logistic equation to describe the growth of winter rapeseed. J. Agric. Sci. 2018, 156, 37–45. [Google Scholar] [CrossRef]
  10. Flinn, S.A.; Midway, S.R. Trends in Growth Modeling in Fisheries Science. Fishes 2021, 6, 1. [Google Scholar] [CrossRef]
  11. Zhu, L.; Li, L.; Liang, Z. Comparison of six statistical approaches in the selection of appropriate fish growth models. Chin. J. Oceanogr. Limnol. 2009, 27, 457–467. [Google Scholar] [CrossRef]
  12. Burnham, K.P.; Anderson, D.R. Model Selection and Multimodel Inference: A Practical Information-Theoretic Approach, 2nd ed.; Springer: New York, NY, USA, 2002; pp. 1–488. [Google Scholar]
  13. Diken, G.; Demir, O.; Naz, M. The inhibitory situational analysis of some feed ingredients for meagre, Argyrosomus regius (Asso 1801) larvae and evaluation for diet formulations. Aquat. Res. 2019, 2, 41–52. [Google Scholar] [CrossRef]
  14. Curiel-Bernal, M.V.; Cisneros-Mata, M.A.; Rodríguez-Domínguez, G.; Sánchez-Velasco, L.; Jiménez-Rosenberg, S.P.A.; Parés-Sierra, A.; Aragón-Noriega, E.A. Modelling early growth of Totoaba macdonaldi under laboratory conditions. Fishes 2023, 8, 155. [Google Scholar] [CrossRef]
  15. Valenzuela-Madrigal, I.E.; Valenzuela-Quiñonez, W.; Esparza-Leal, H.M.; Rodríguez-Quiroz, G.; Aragón-Noriega, E.A. Effects of ionic composition on growth and survival of white shrimp Litopenaeus vannamei culture at low-salinity well water. Rev. Biol. Mar. Oceanogr. 2017, 52, 103–112. [Google Scholar] [CrossRef]
  16. Góngora-Gómez, A.M.; Leal-Sepúlveda, A.L.; García-Ulloa, M.; Aragón-Noriega, E.A.; Valenzuela-Quiñónez, W. Morphometric relationships and growth models for the oyster Crassostrea corteziensis cultivated at the southeastern coast of the Gulf of California, Mexico. Lat. Am. J. Aquat. Res. 2018, 46, 735–743. [Google Scholar] [CrossRef]
  17. Mundry, R. Issues in information theory-based statistical inference a commentary from a frequentist’s perspective. Behav. Ecol. Sociobiol. 2011, 62, 57–68. [Google Scholar] [CrossRef]
  18. Hilborn, R.; Walters, C.J. Quantitative Fish Stock Assessment. Choice, Dynamics and Uncertainty, 1st ed.; Chapman and Hall: New York, NY, USA, 1992; pp. 410–428. [Google Scholar]
  19. Von Bertalanffy, L. A quantitative theory of organic growth. Hum. Biol. 1938, 10, 181–213. [Google Scholar]
  20. Hutchinson, C.E.; TenBrink, T.T. Age determination of the yellow Irish lord: Management implications as a result of new estimates of maximum age. N. Am. J. Fish. Manag. 2011, 31, 1116–1122. [Google Scholar] [CrossRef]
  21. Lee, L.; Atkinson, D.; Hirst, A.G.; Cornell, S.J. A new framework for growth curve fitting based on the von Bertalanffy growth function. Sci. Rep. 2020, 10, 7953. [Google Scholar] [CrossRef]
  22. Lorenzen, K. A simple von Bertalanffy model for density-dependent growth in extensive aquaculture, with an application to common carp (Cyprinus carpio). Aquaculture 1996, 142, 191–205. [Google Scholar] [CrossRef]
  23. De Graaf, G.; Prein, M. Fitting growth with the von Bertalanffy growth function: A comparison of three approaches of multivariate analysis of fish growth in aquaculture experiments. Aquac. Res. 2005, 36, 100–109. [Google Scholar] [CrossRef]
  24. Brunel, T.; Dickey-Collas, M. Effects of temperature and population density on von Bertalanffy growth parameters in Atlantic herring: A macro-ecological analysis. Mar. Ecol. Prog. Ser. 2010, 405, 15–28. [Google Scholar] [CrossRef]
  25. Martínez-Jerónimo, F. Description of the individual growth of Daphnia magna (Crustacea: Cladocera) through the von Bertalanffy growth equation. Effect of photoperiod and temperature. J. Limnol. 2012, 13, 65–71. [Google Scholar] [CrossRef]
  26. Flanagan, C.A. Study of the feasibility of modeling the totoaba fishery of the northern Gulf of California with preliminary estimation of some critical parameters. Univ. Ariz. Biol. Sci. Rep. 1973, 249, 1–58. [Google Scholar]
  27. Cisneros-Mata, M.Á.; Montemayor-López, G.; Román-Rodríguez, M.J. Life history and conservation of Totoaba macdonaldi. Conserv. Biol. 1995, 9, 806–814. [Google Scholar] [CrossRef]
  28. Pedrín-Osuna, O.; Córdova-Murueta, J.H.; Delgado-Marchena, M. Crecimiento y mortalidad de la totoaba, Totoaba macdonaldi, del Alto Golfo de California. Cienc. Pesq. 2001, 15, 131–140. [Google Scholar]
  29. De Anda-Montañez, J.A.; García de León, F.J.; Zenteno-Savín, T.; Balart-Páez, E.; Méndez-Rodríguez, L.C.; Bocanegra-Castillo, N.; Martínez-Aguilar, S.; Campos-Dávila, L.; Román Rodríguez, M.J.; Valenzuela-Quiñonez, F.; et al. Estado de Salud y Estatus de Conservación de la(s) Población(es) de Totoaba (Totoaba macdonaldi) en el Golfo de California: Una Especie en Peligro de Extinción; Informe Final, SNIB-CONABIO. Proyecto Núm. hK050; Centro de Investigaciones Biológicas del Noroeste, S.C.: La Paz, Mexico, 2013; Available online: http://www.conabio.gob.mx/institucion/proyectos/resultados/InfHK050.pdf (accessed on 3 February 2021).
  30. Valenzuela-Quiñonez, F. Genética y Dinámica Poblacional de la Totoaba (Totoaba macdonaldi Gilbert, 1891) en el Golfo de California. Ph.D. Thesis, Centro de Investigaciones Biológicas del Noroeste, S.C., La Paz, Mexico, 22 May 2014. [Google Scholar]
  31. Román-Rodríguez, M.; Hammann, M.G. Age and growth of totoaba, Totoaba macdonaldi (Sciaenidae) in the upper Gulf of California. Fish. Bull. 1997, 95, 620–628. [Google Scholar]
  32. Beverton, R.J.H.; Holt, S.J. On the Dynamics of Exploited Fish Populations, 1st ed.; Chapman and Hall: London, UK, 1957. [Google Scholar]
Figure 1. Quantile–quantile graphs (column A), graphic analysis of errors of models (column B), and best model fitted to the growth data of the three species analyzed (column C).
Fishes 09 00106 g001
Table 1. AIC and BIC values used as a goodness of fit in each candidate models by type of assumed distribution of the errors for the three cultivated species. The best model is in bold. VB = von Bertalanffy. NC means that the model failed to converge to maximum log-likelihood.
AICBIC
SpeciesModelNParametersNormalLog-NormalNormalLog-Normal
Crassostrea corteziensis
Oyster
Triple Logistic1349109358698394107035
Double Logistic 79353760893897644
VB Oscillatory 69662NC9693NC
Totoaba macdonaldi
Finfish
Triple Logistic1391106600465866534711
Double Logistic 76732467667694713
VB Oscillatory 66733528767645319
Penaeus vannamei
Shrimp
Triple Logistic1809106942467769694732
Double Logistic 76971482070104858
VB Oscillatory 67813NC7841NC
Table 2. Parameters and confidence intervals at 95% in parenthesis after fitting with triple logistic model to growth data of three cultivated species, assuming lognormal distributions of errors.
Species
Logistic HarmonicParametersCrassostrea corteziensisTotoaba macdonaldiPenaeus vannamei
1L12.17 (1.96, 2.35)3.99 (3.58, 4.33)0.415 (0.269, 0.993)
k11.39 (1.39, 1.39)0.21 (0.15, 0.31)0.218 (0.155, 0.320)
t0152.9 (52.68, 52.93)0.004 (0.002, 0.090)19.27 (16.15, 25.31)
2L228.47 (27.6, 29.3)48.27 (46.11, 50.21)4.85 (4.58, 5.05)
k20.085 (0.082, 0.087)0.26 (0.25, 0.27)0.108 (0.103, 0.148)
t02114.9 (113.2, 116.6)26.69 (26.25, 27.08)52.34 (50.51, 54.8)
3L3104.53 (94.61, 119.60)58.1 (53.51, 89.73)10.98 (10.43, 11.55)
k30.0225 (0.0219, 0.023)1.603 (0.564, 21.77)1.889 (1.888,1.911)
t03383.15 (370.0, 399.0)38.8 (37.33, 41.81)92.65 (92.47, 92.83)
Disclaimer/Publisher’s Note: The statements, opinions and data contained in all publications are solely those of the individual author(s) and contributor(s) and not of MDPI and/or the editor(s). MDPI and/or the editor(s) disclaim responsibility for any injury to people or property resulting from any ideas, methods, instructions or products referred to in the content.

