
Going beyond Chat: Designing Connotative Meaningful Line Stickers to Promote Road Safety in Thailand through Participatory Design


Abstract
:1. Introduction
2. Literature Review
2.1. Research Background
2.2. Overview of the Popularity of Line Stickers in Thailand
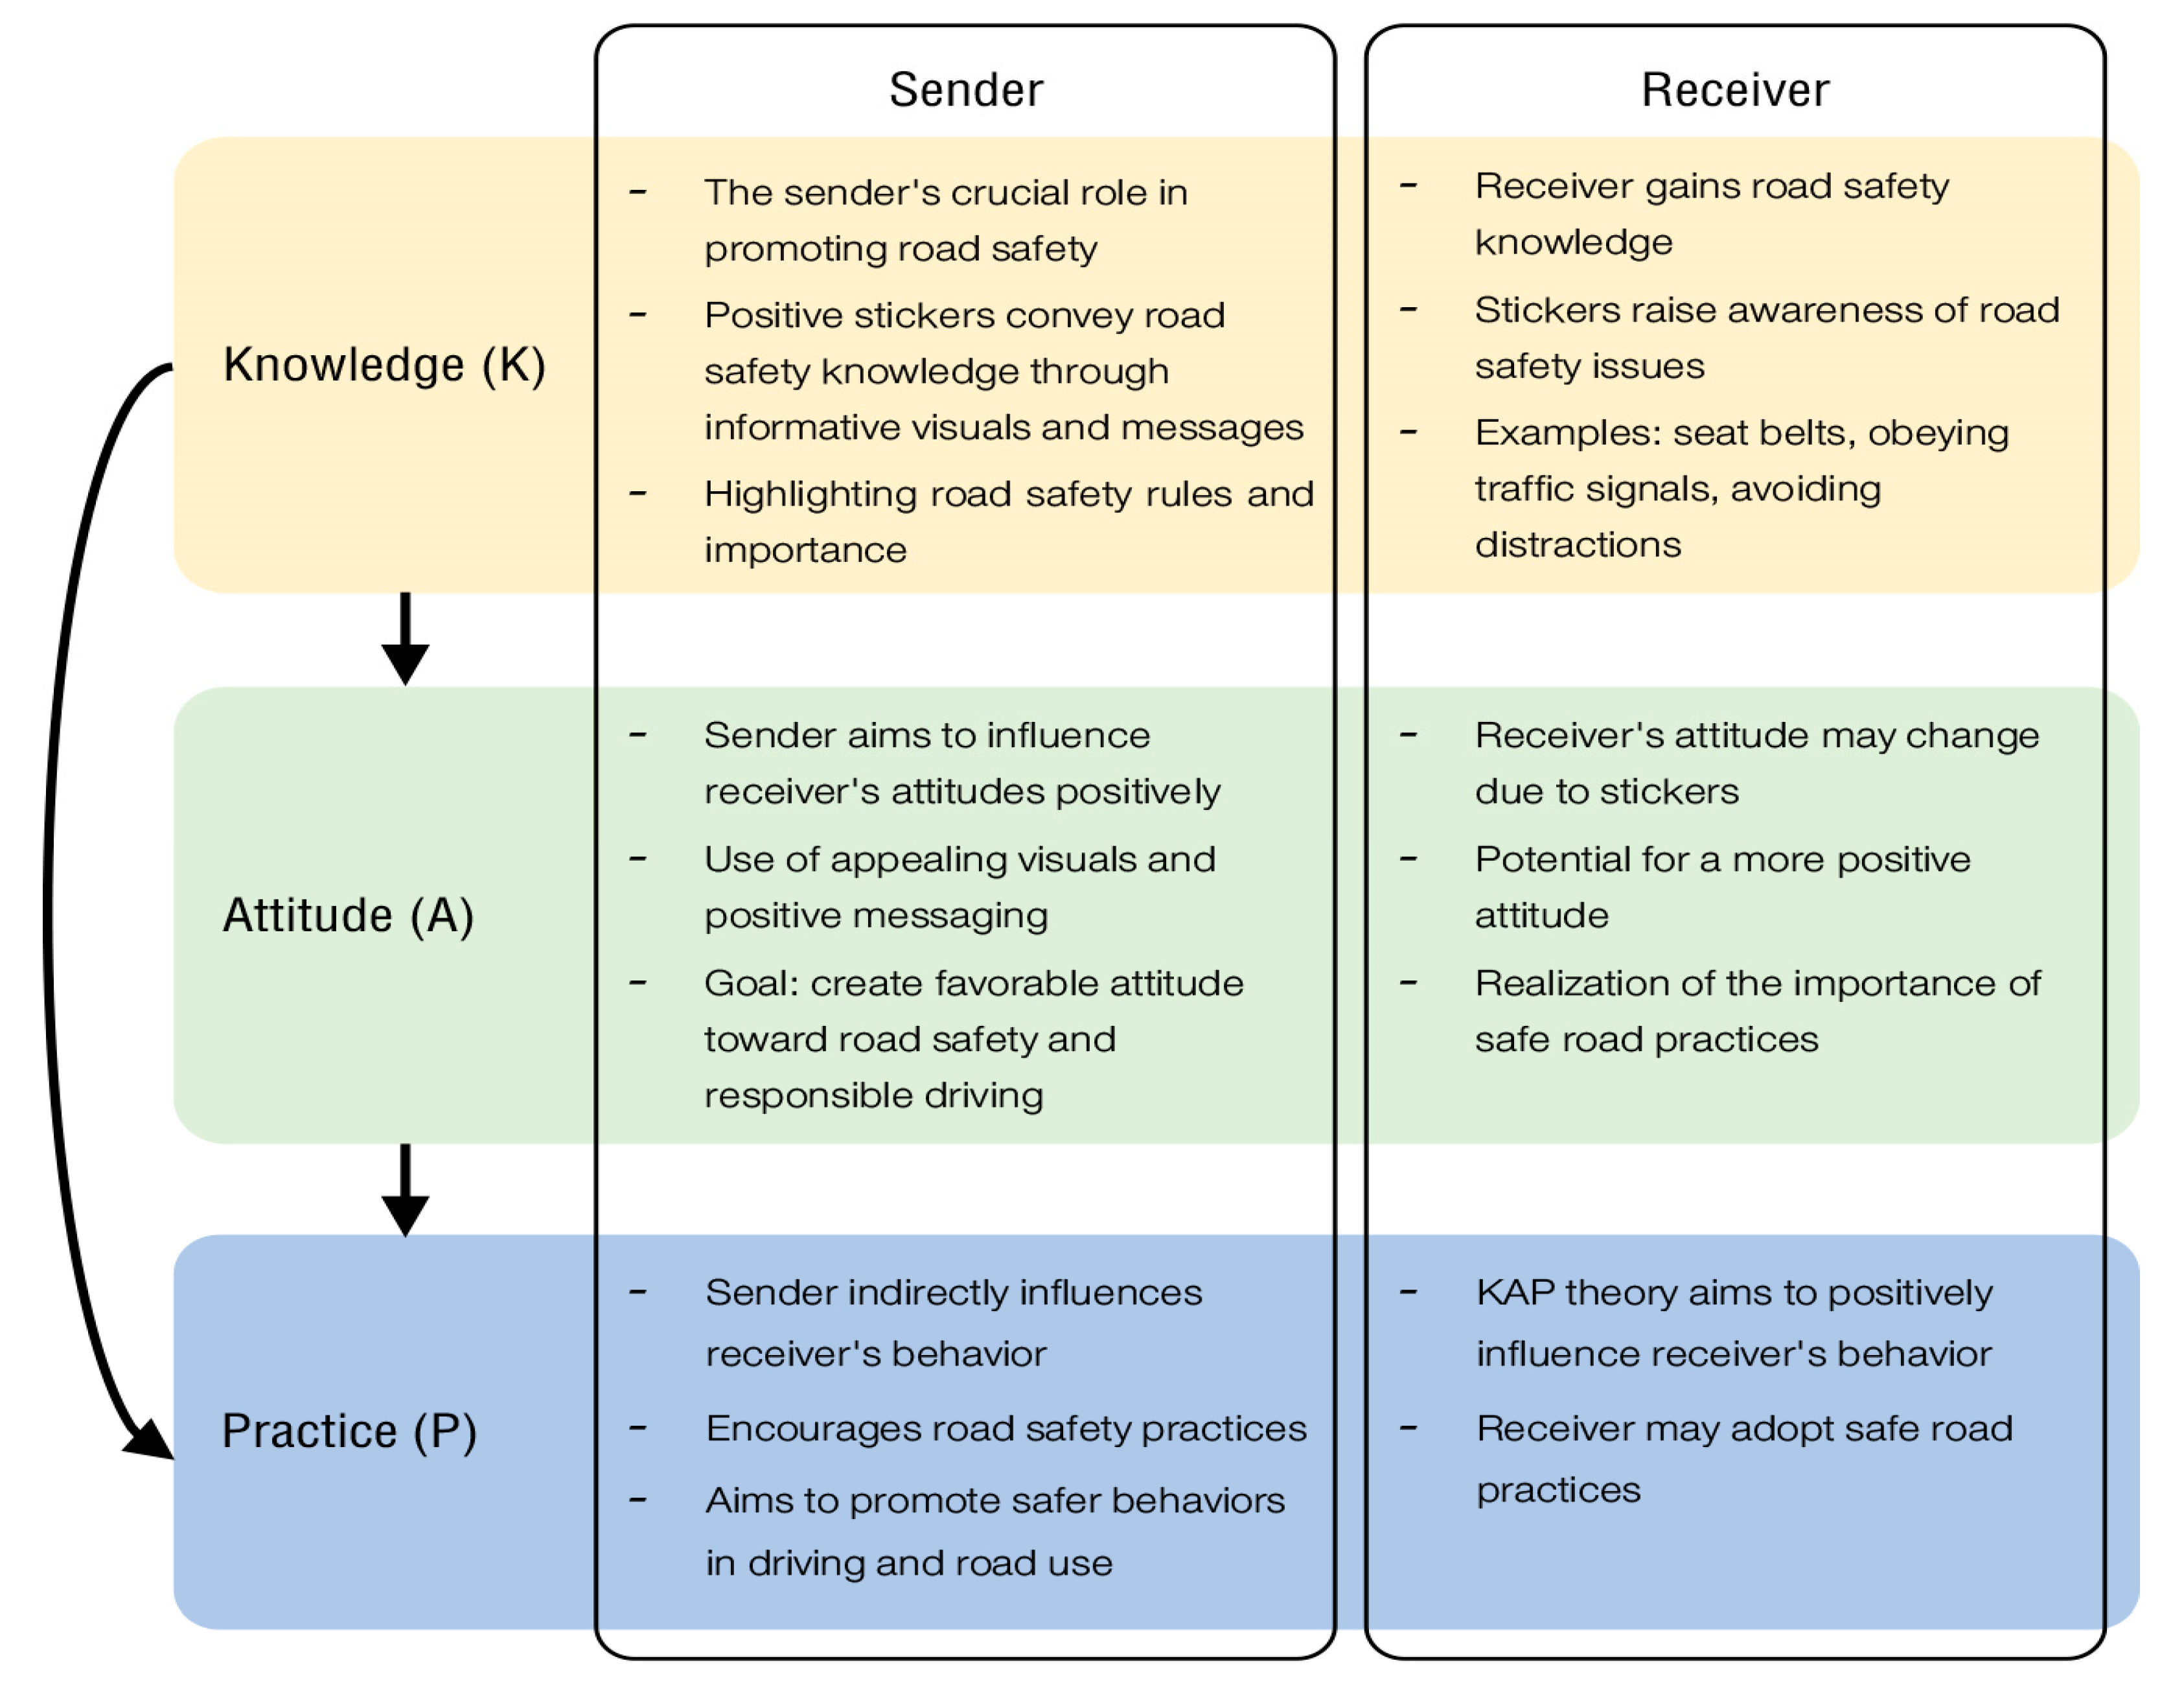
2.3. Knowledge, Attitude, Practice (KAP)
2.4. Participatory Design (PD)
3. Research Objectives
3.1. Objective 1: Development of Line Stickers Utilizing a Participatory Design Approach
3.2. Objective 2: Assessment of User Satisfaction/Opinion with the Designed Stickers
4. Research Hypothesis
5. Research Methodology
5.1. Needs Analysis Employing Participatory Design
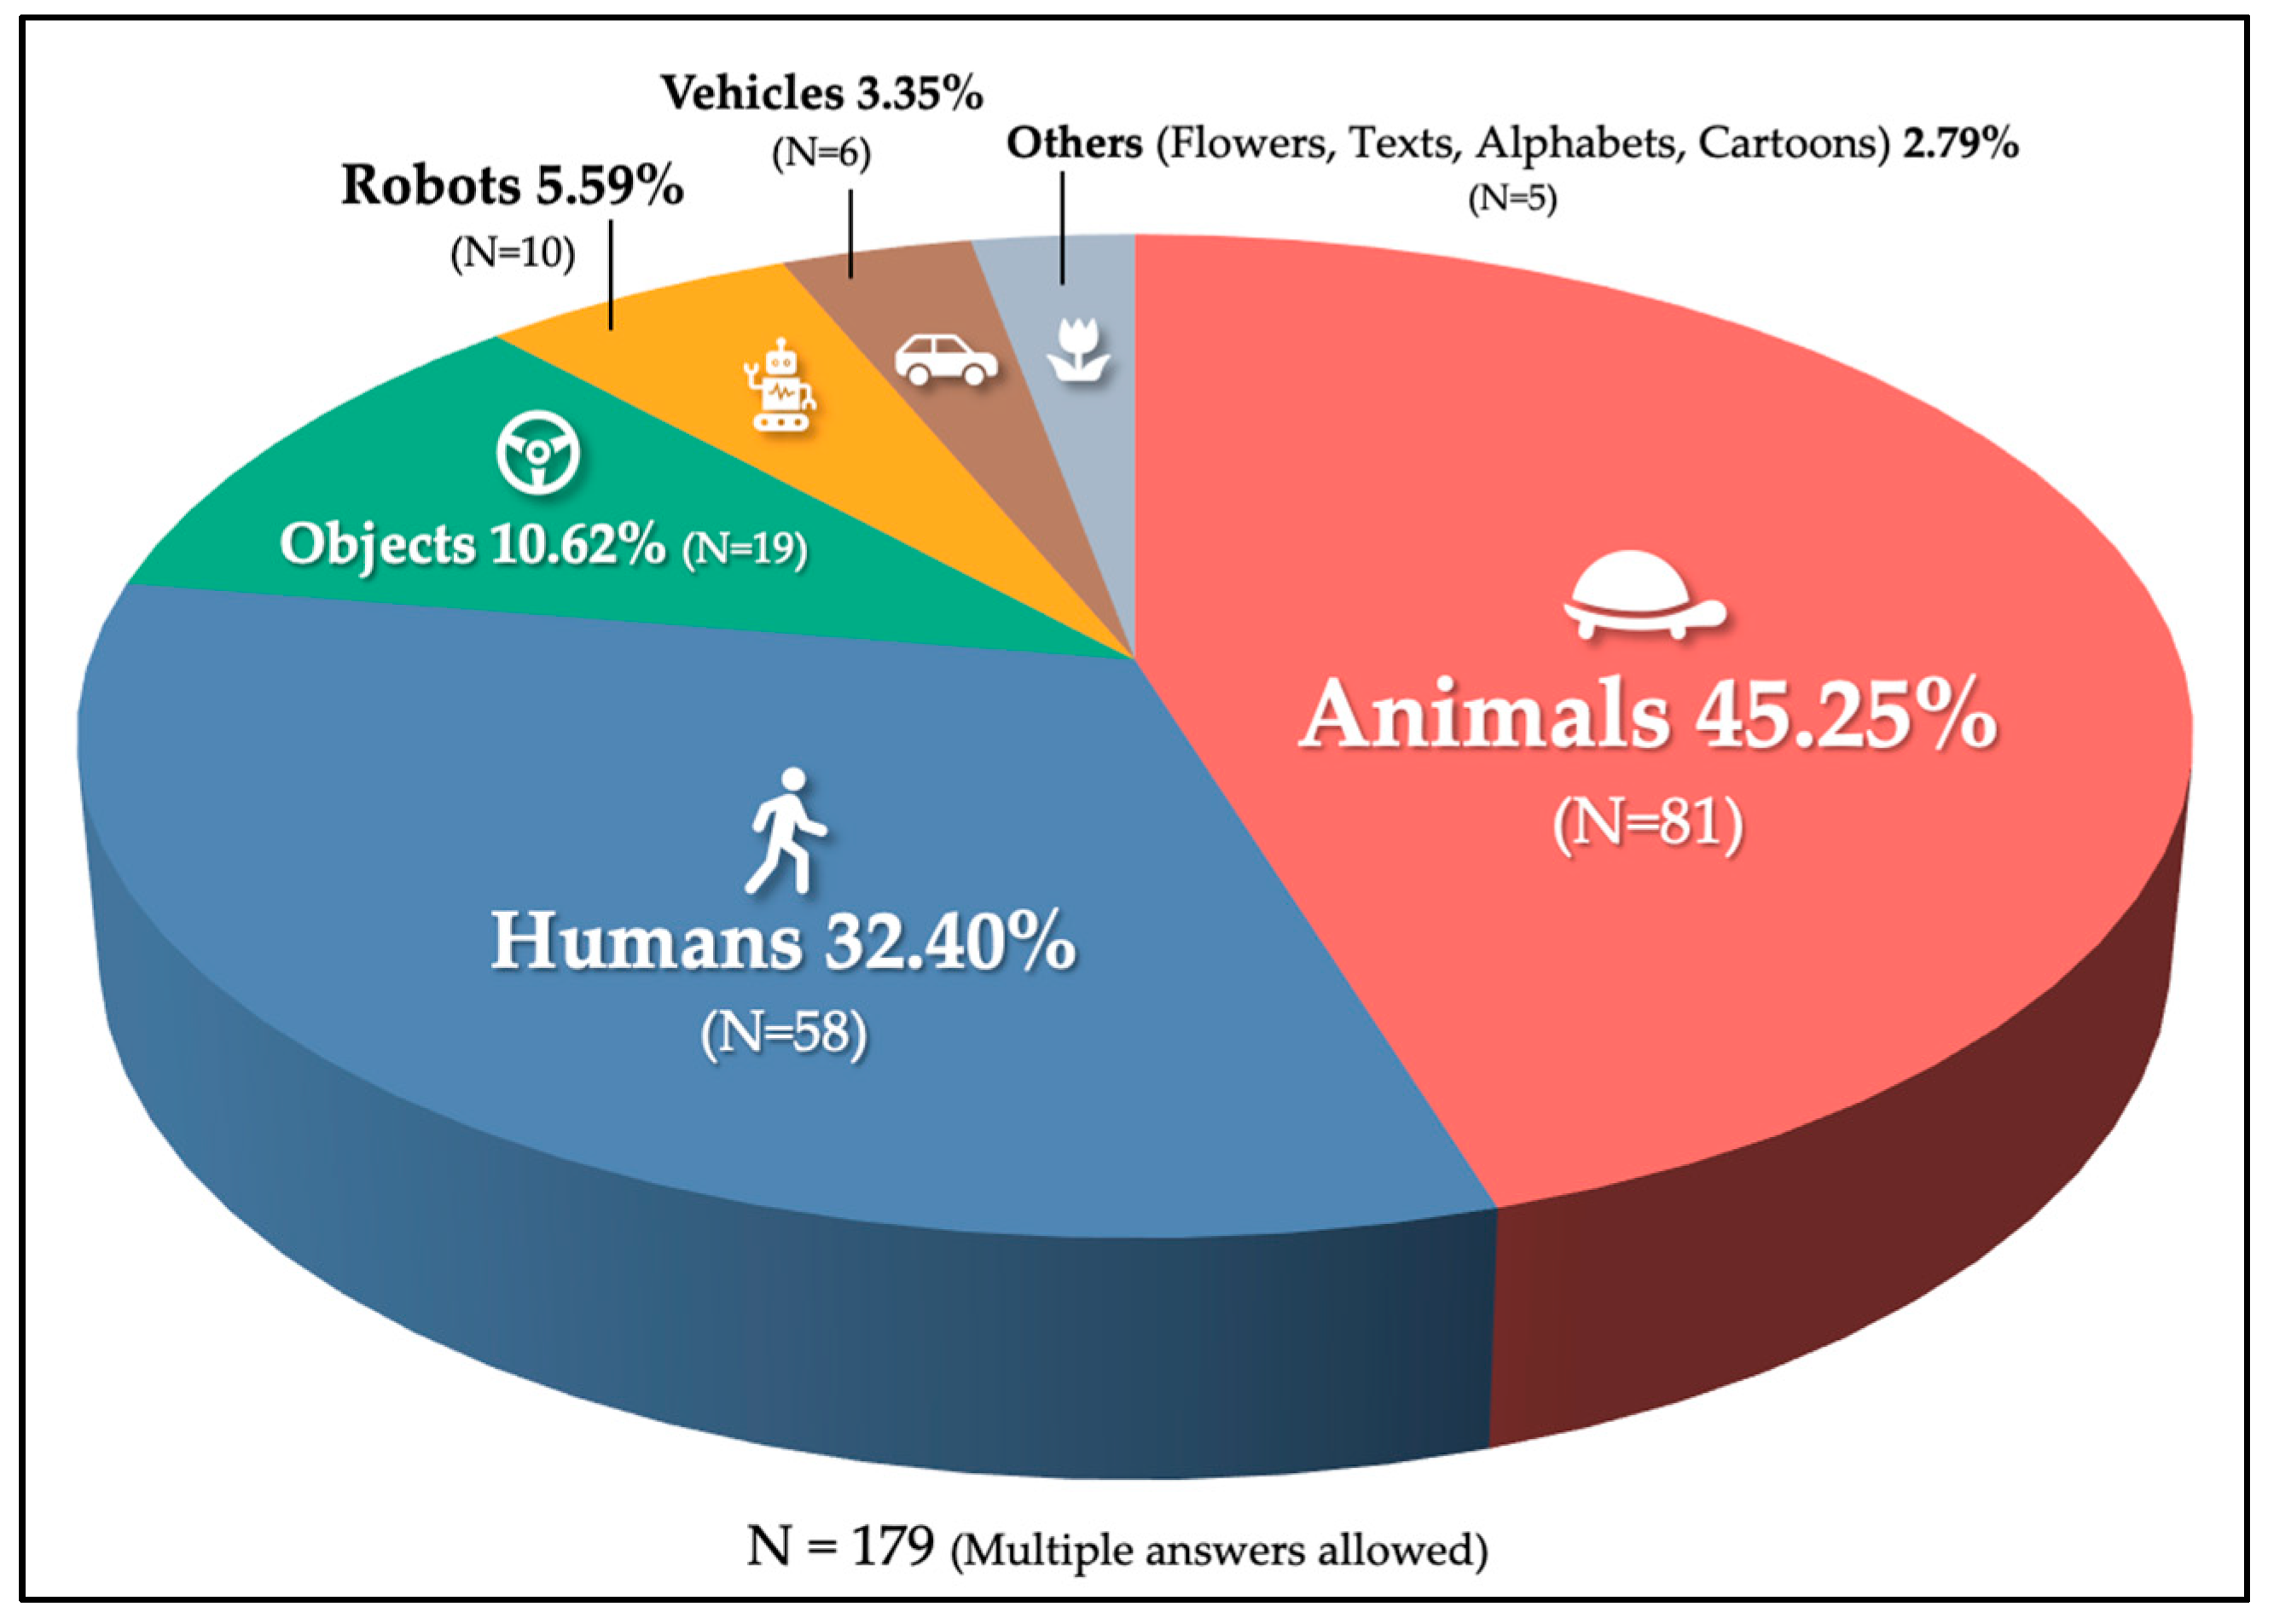
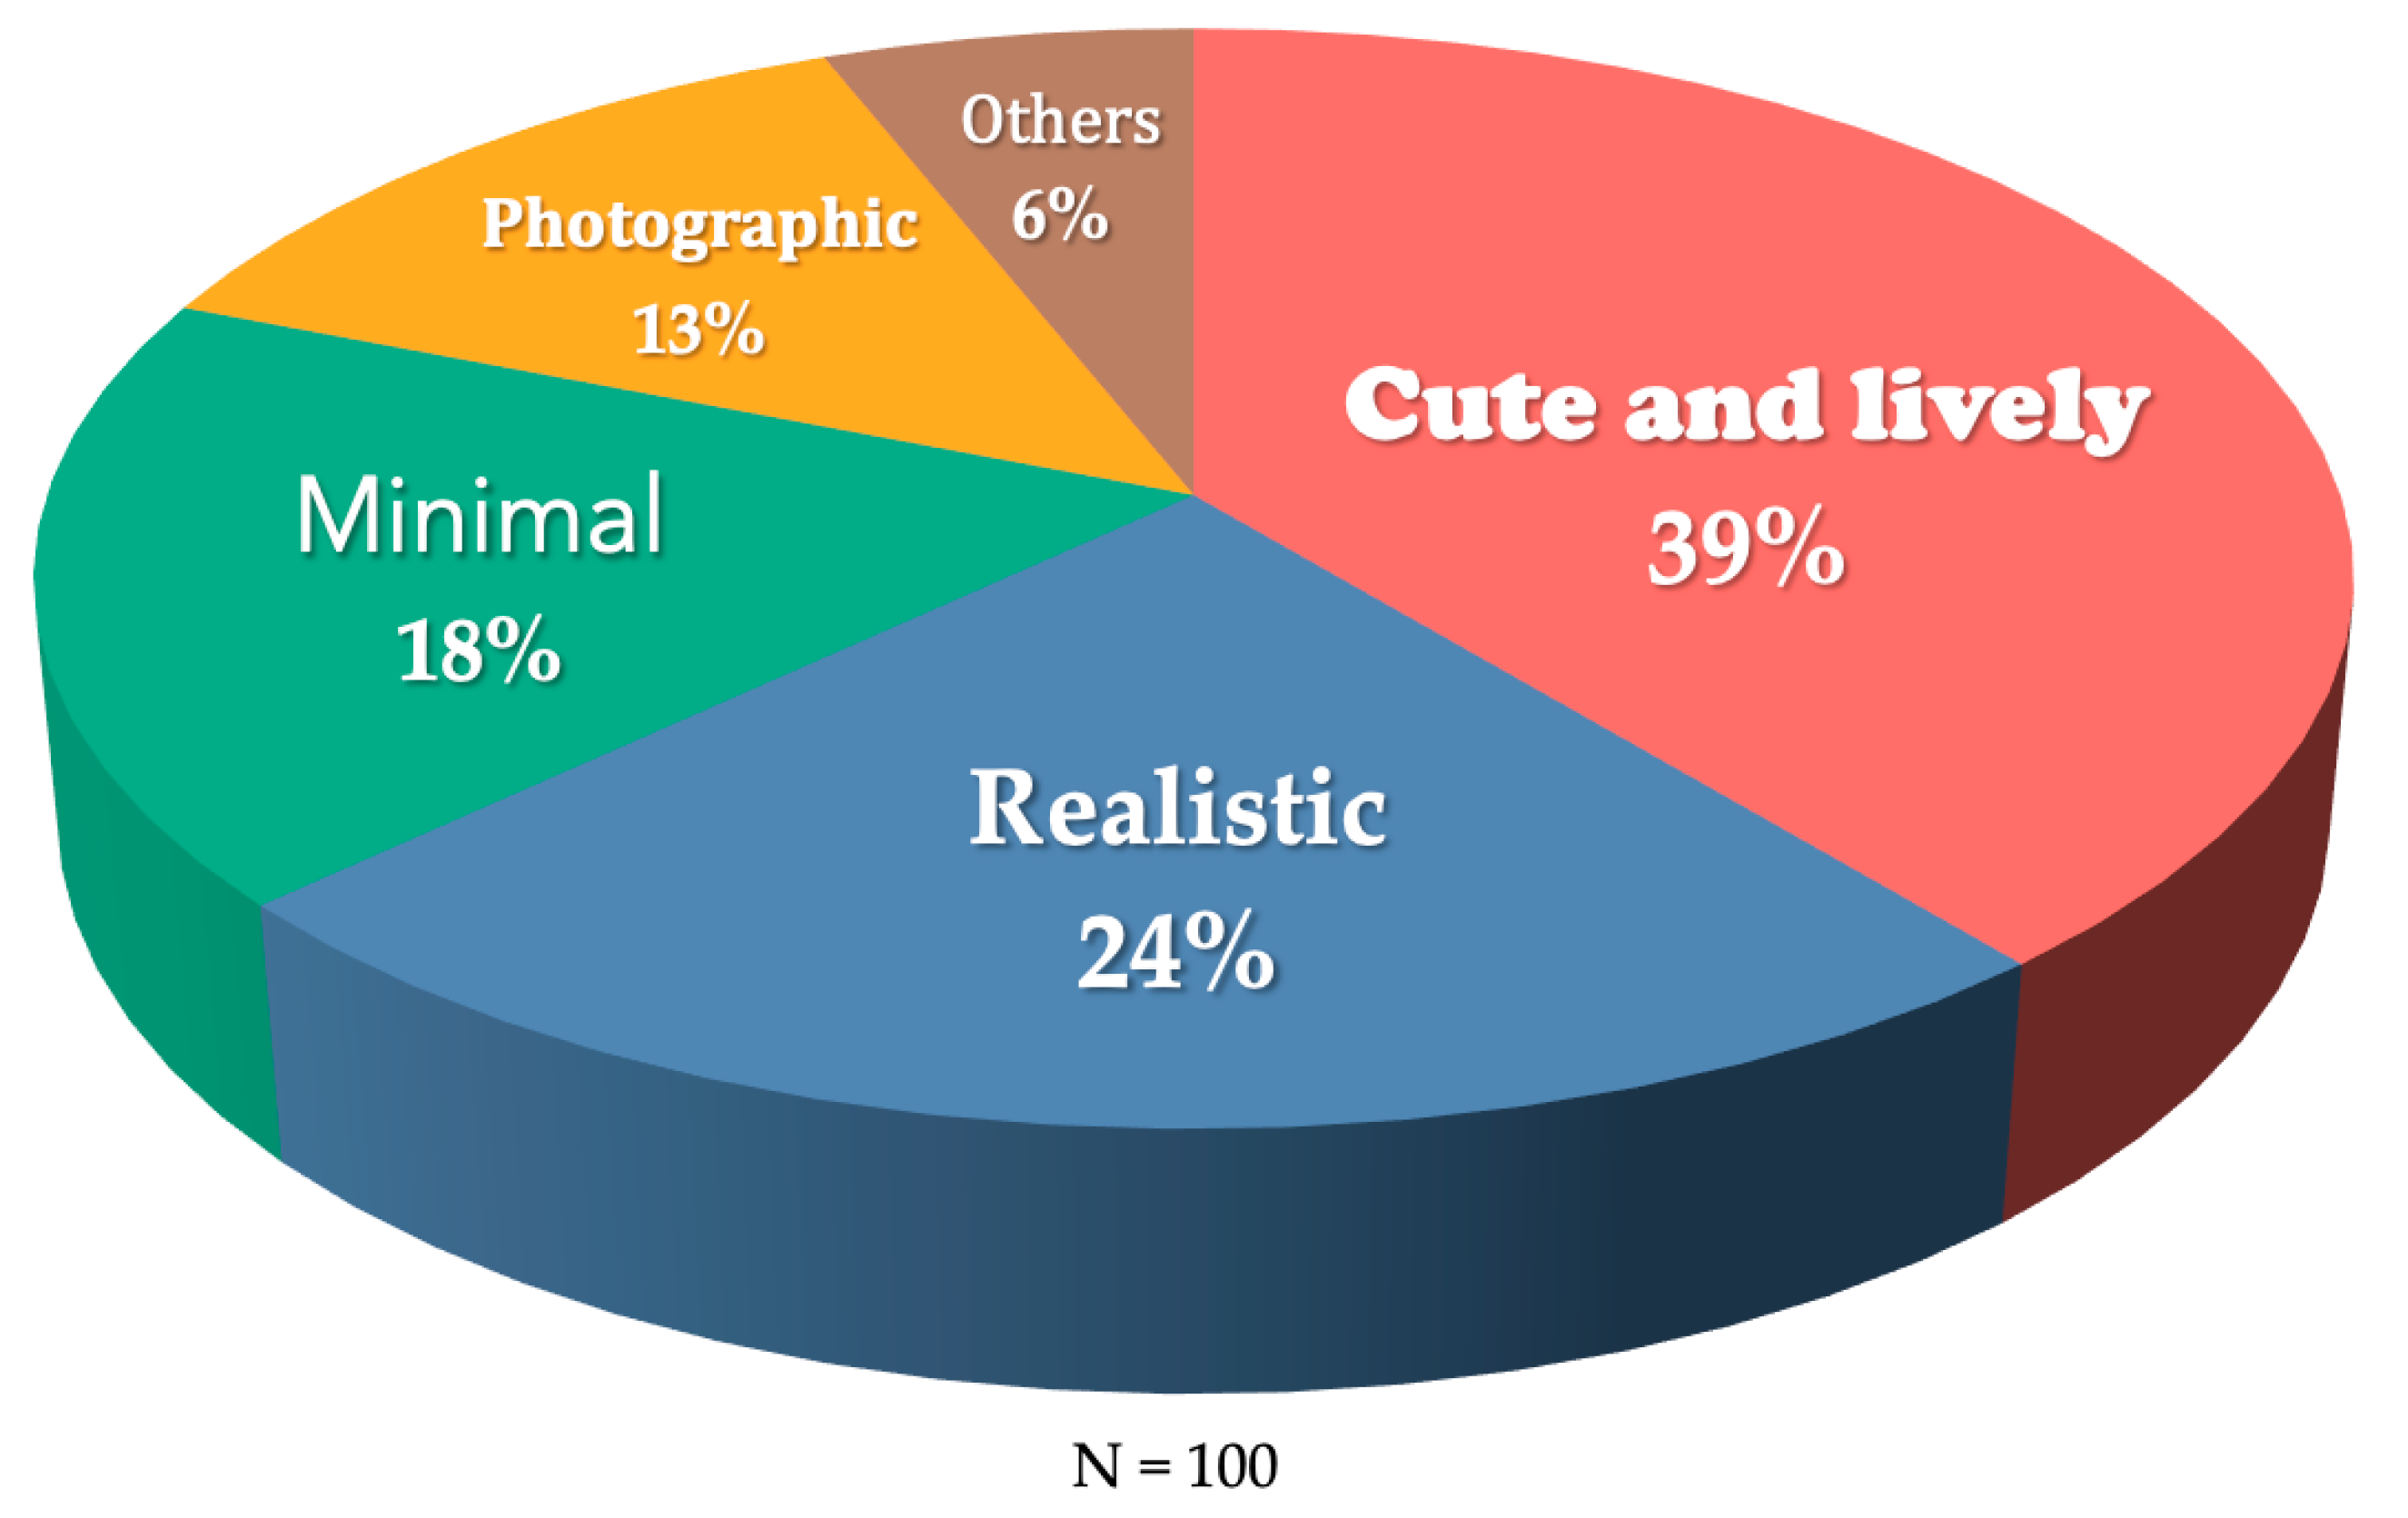
5.1.1. Determining Type of Characters, Characters’ Mood and Tone, and Communication Goal
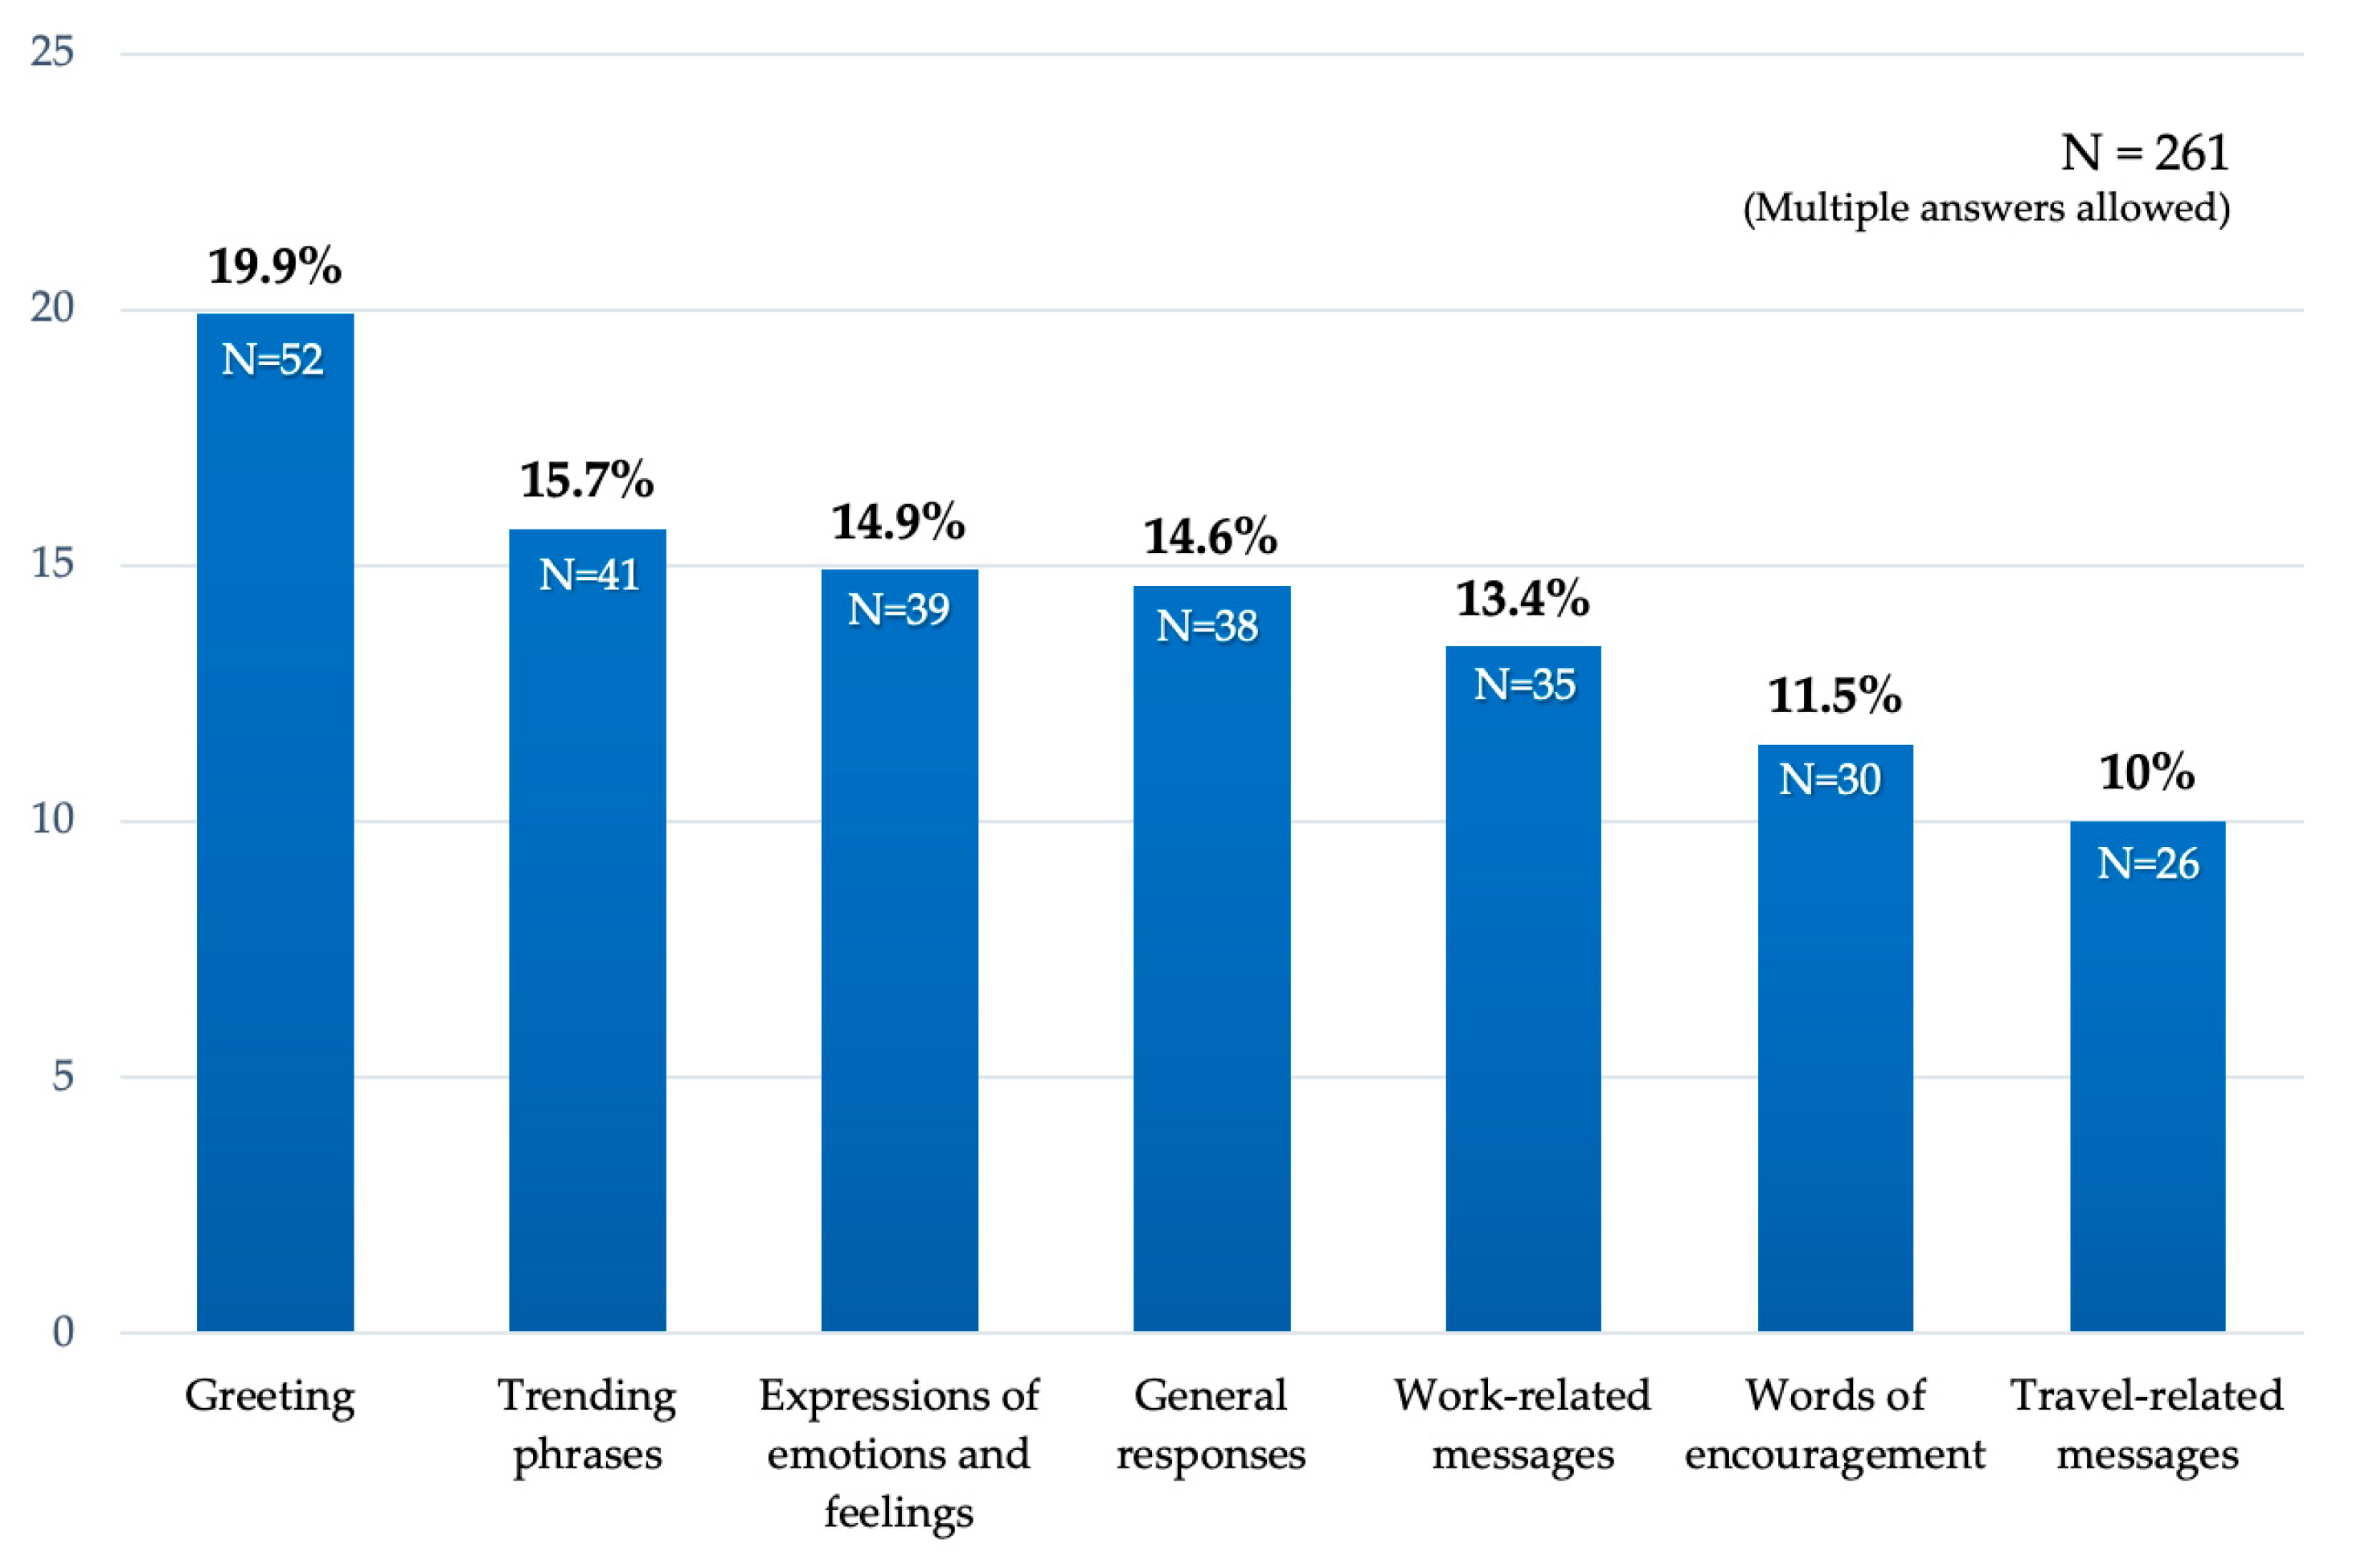
5.1.2. Determining Specific Characters, Text, and Phrases
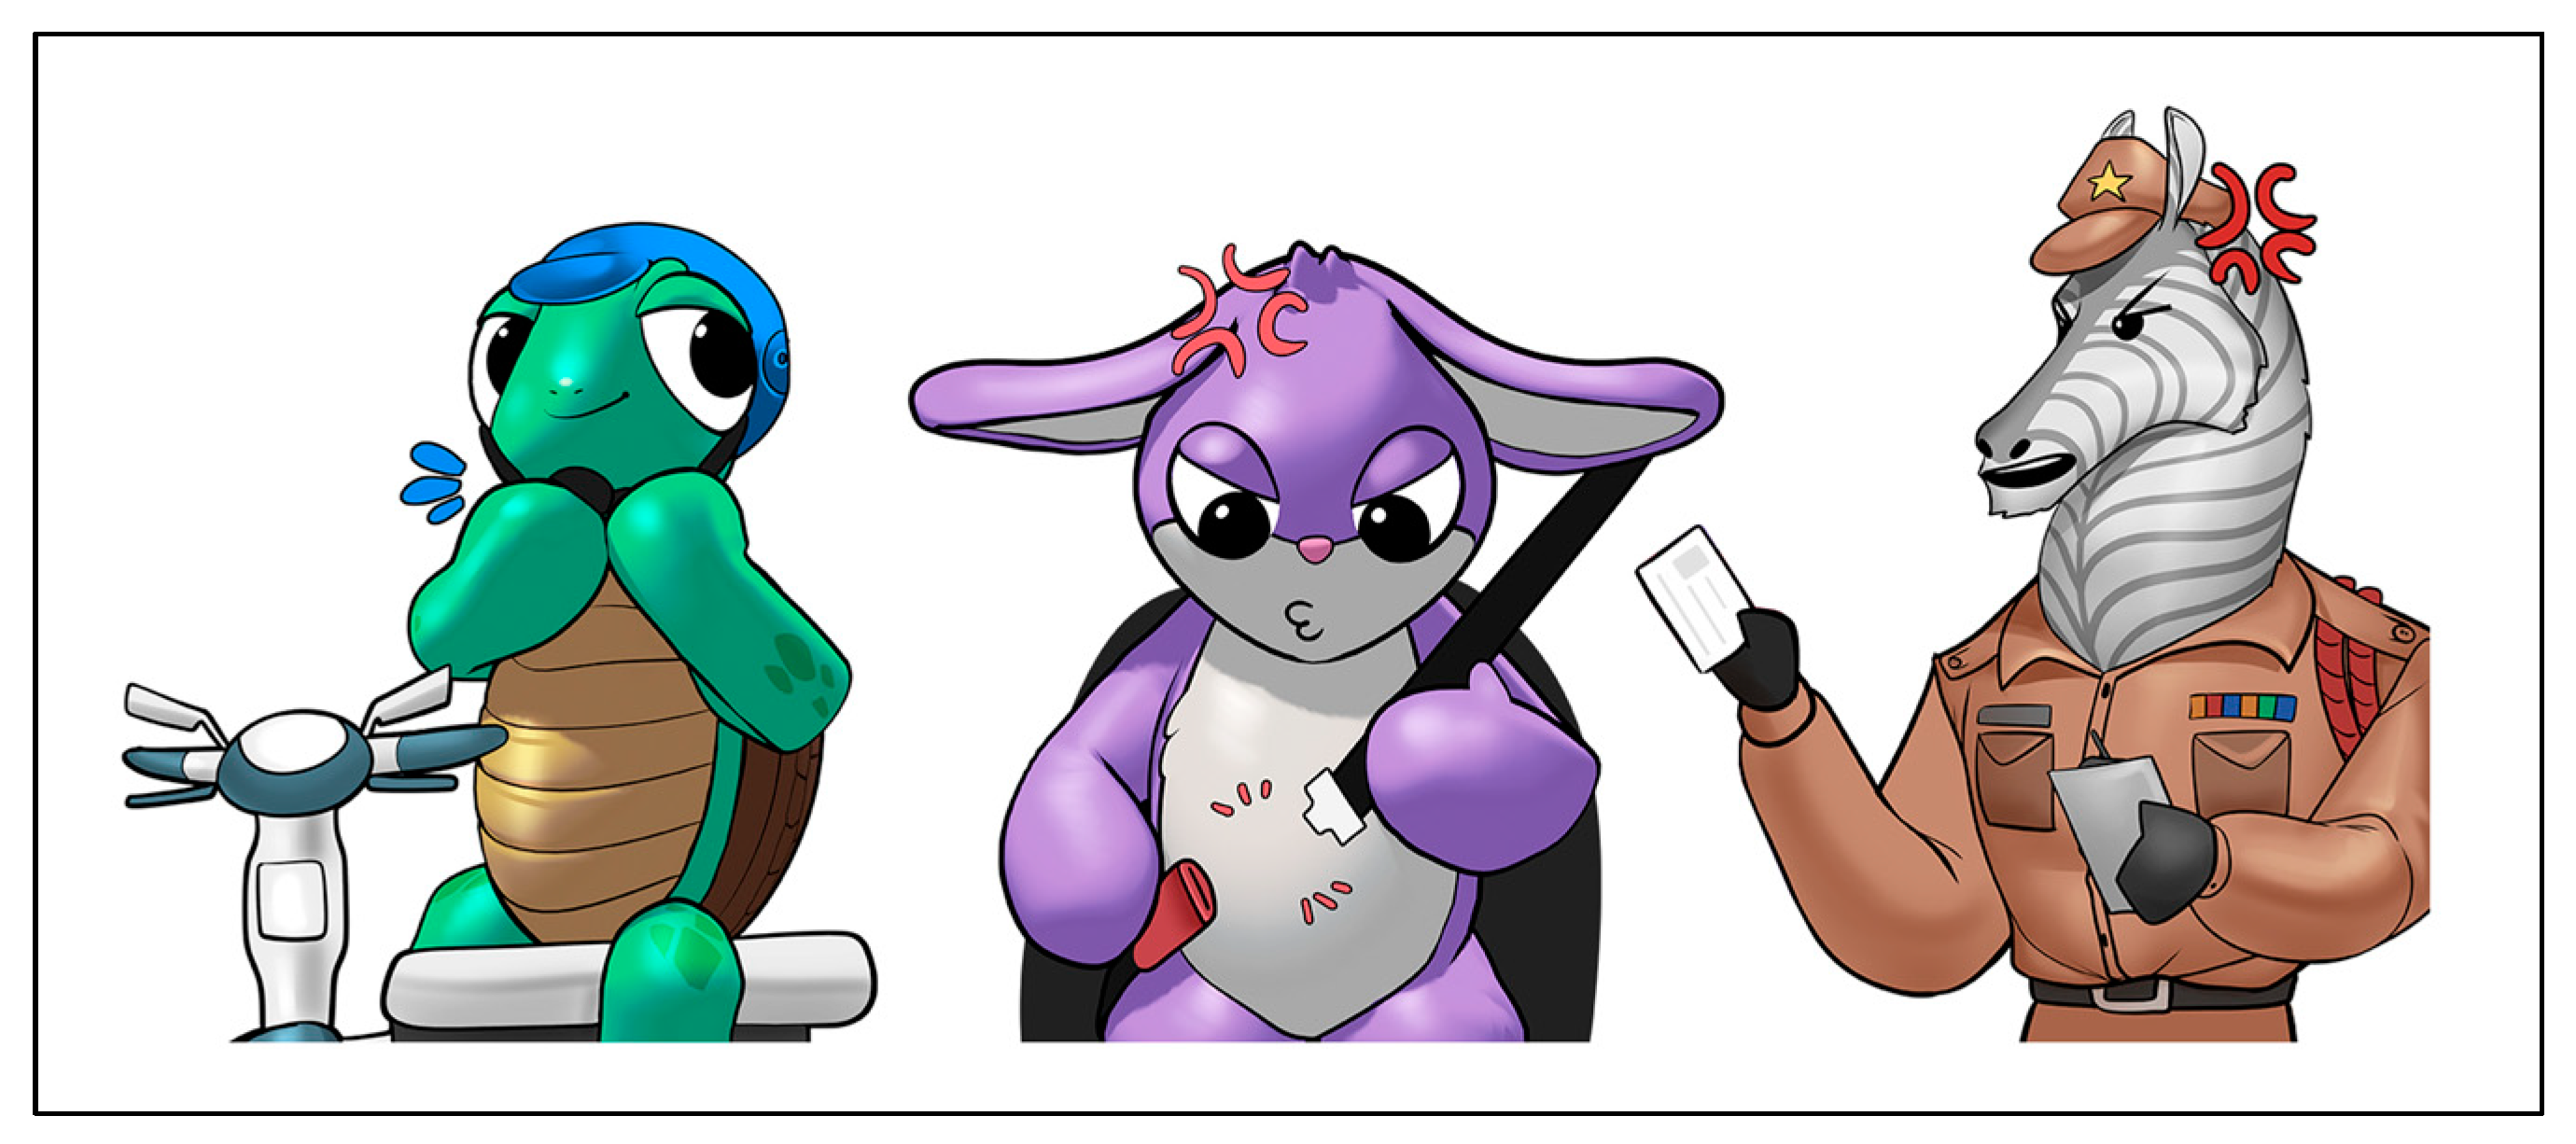
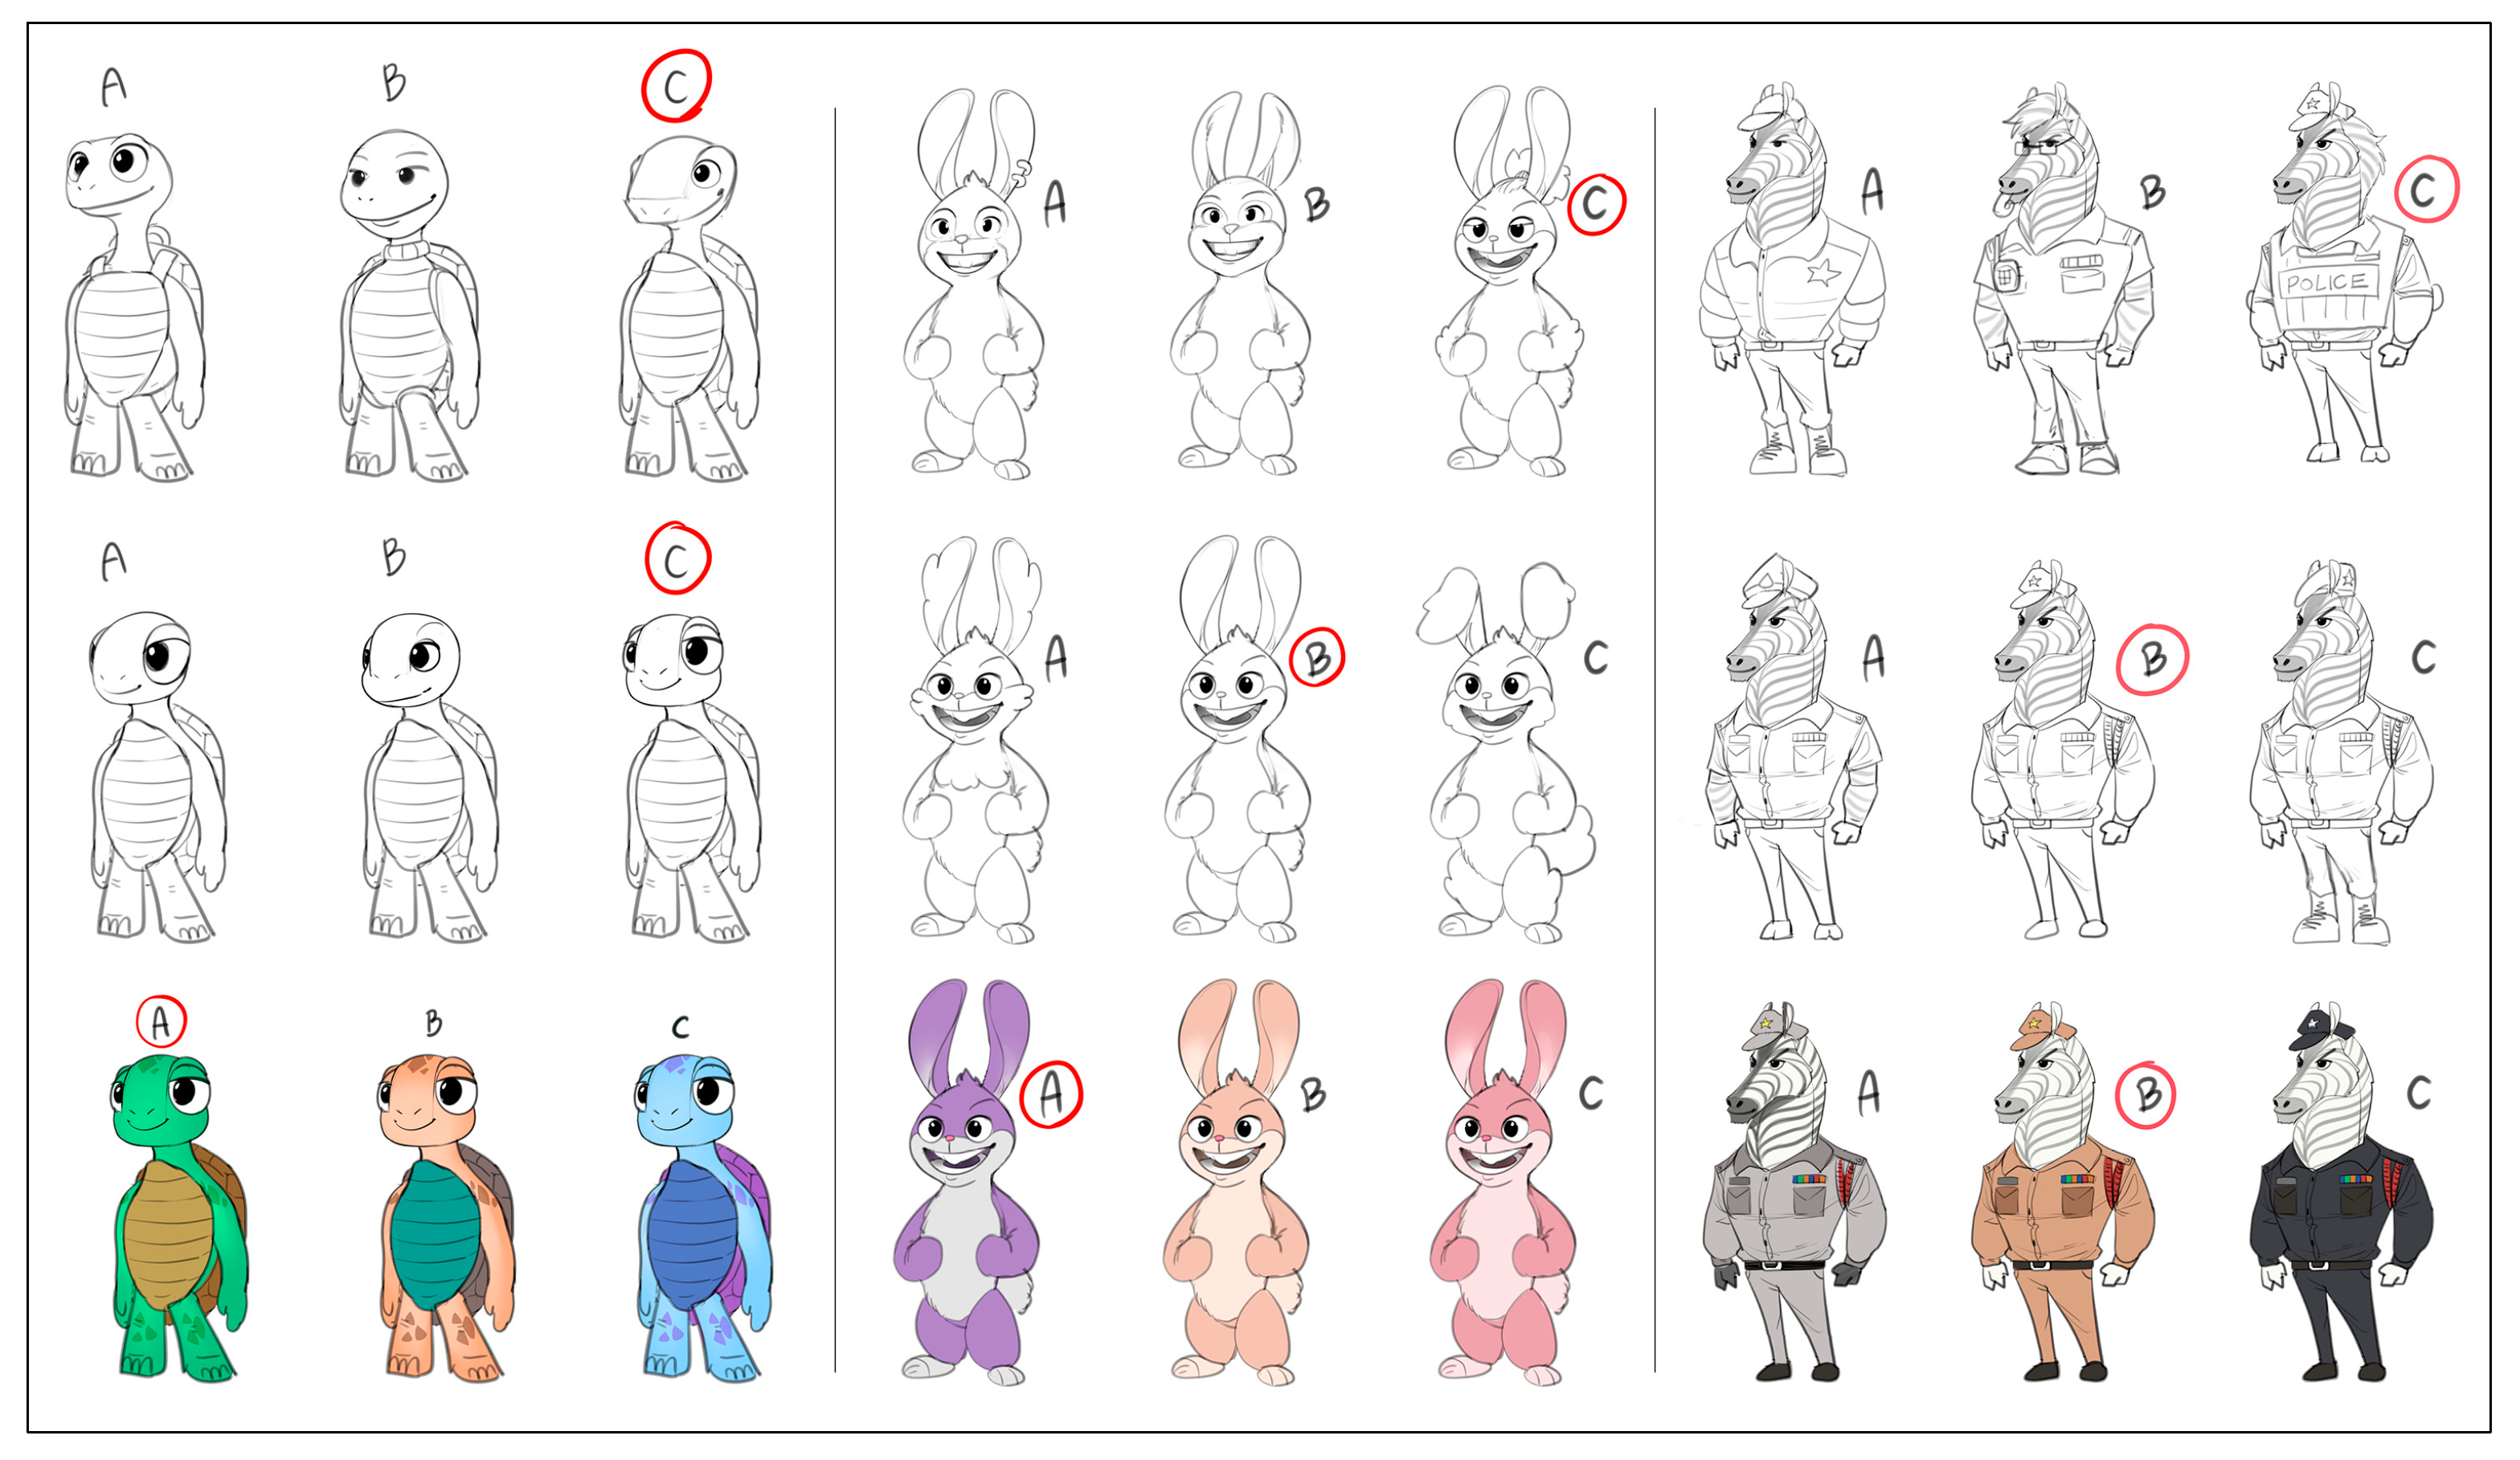
- To promote road safety in Thailand, three animals have been selected as representatives for the campaign’s stickers. The tortoise represents cautious drivers who follow traffic rules, drive slowly but surely, and show empathy on the roads. The rabbit represents fast and risky drivers who tend to make hasty decisions and lack patience on the road. Both the tortoise and rabbit were drawn from Aesop’s fable, “The Tortoise and the Hare”. The zebra represents vigilant and disciplined traffic police officers who uphold regulations and respect rules. The zebra was chosen from the pedestrian crossing markings that consist of black and white stripes on roads, serving as a safe passage for pedestrians. These characters are presented in Figure 4.
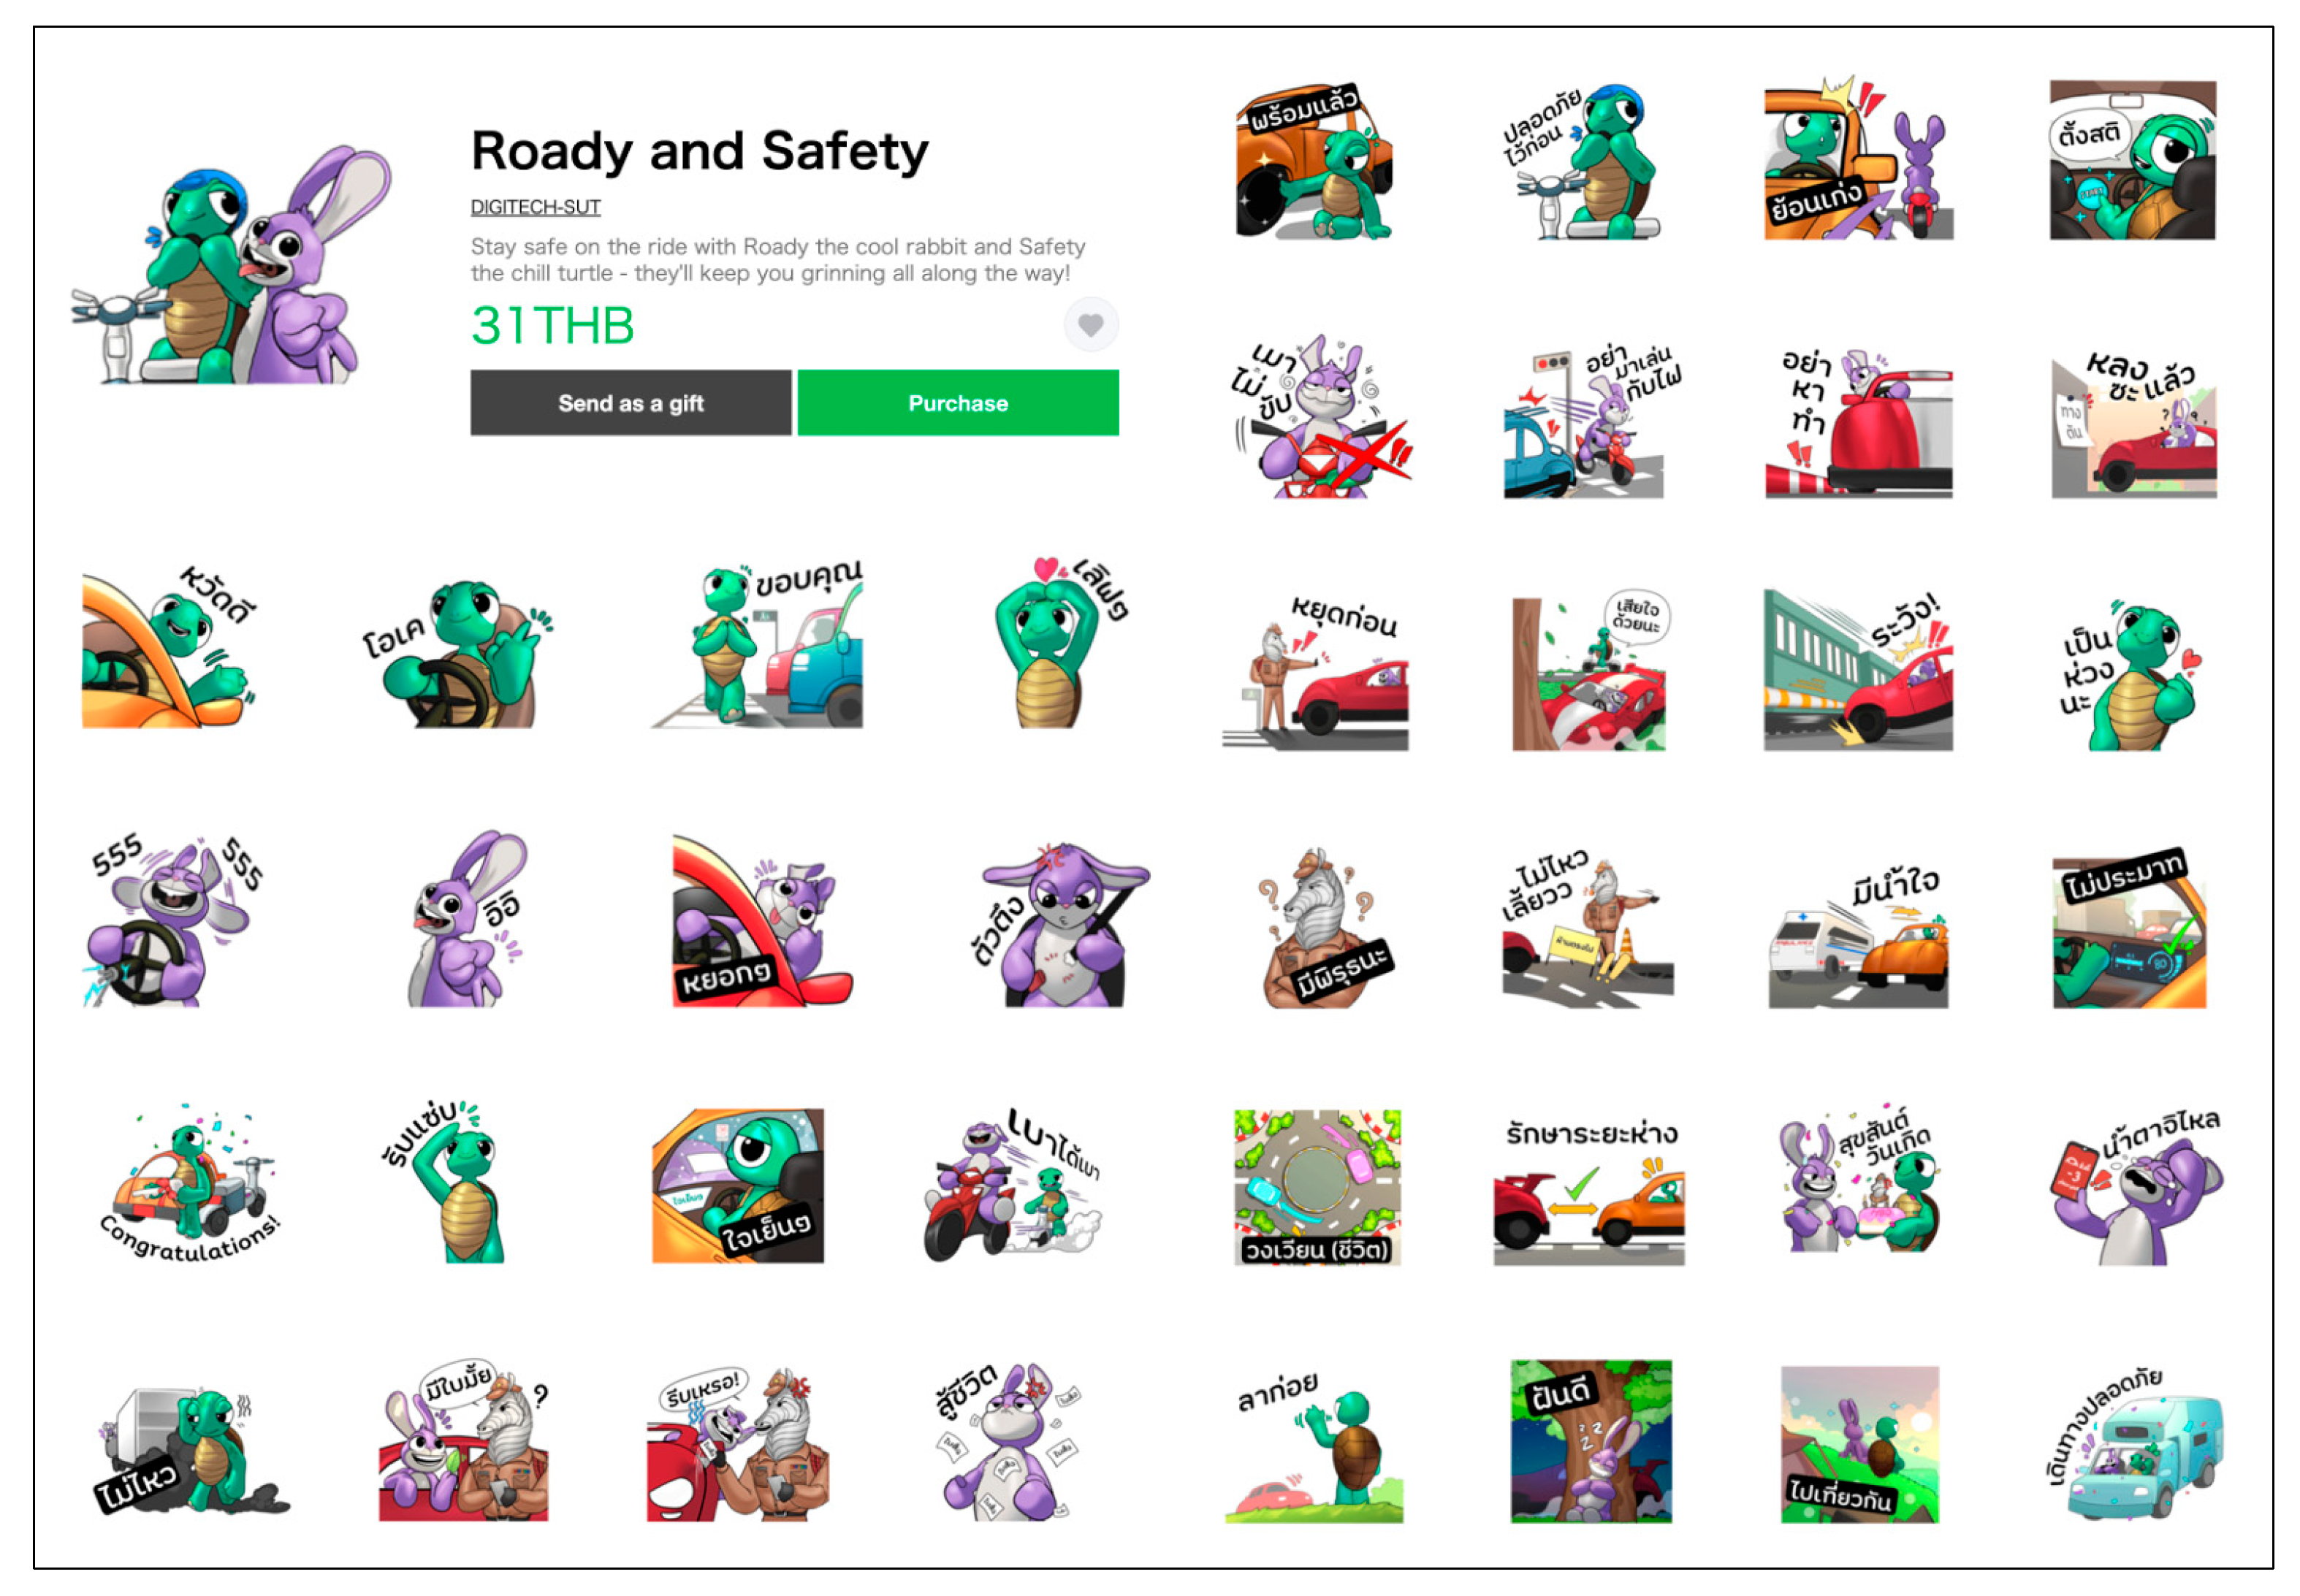
- The developed sticker set consisted of 40 messages, which is the maximum number feasible for a single image sticker set. There were seven categories of messages as presented in Table 1.
5.1.3. Determining Denotative and Connotative Meaning for Each Sticker
5.2. Line Stickers’ Development Employing Participatory Design
5.3. Evaluation Step
6. Research Results
7. Discussion and Conclusions
7.1. Sender or Source
7.2. Message
7.3. Channel
7.4. Receiver
Author Contributions
Funding
Institutional Review Board Statement
Informed Consent Statement
Data Availability Statement
Conflicts of Interest
References
- Witaya, C. Situation of Road Traffic Injury and Road Safety Management in Thailand. J. Emerg. Med. Serv. Thail. 2022, 2, 187–198. [Google Scholar] [CrossRef]
- Pauwels, A.; Pourmohammad-Zia, N.; Schulte, F. Safety and Sustainable Development of Automated Driving in Mixed-Traffic Urban Areas—Considering Vulnerable Road Users and Network Efficiency. Sustainability 2022, 14, 13486. [Google Scholar] [CrossRef]
- ThaiRSC. Available online: https://www.thairsc.com (accessed on 15 March 2023).
- Phinyaphat, S.; Wichian, T. The development of the activity “Road Safety” to strengthen awareness of road safety by using a participatory learning process for lower secondary school students. JEDU NU 2022, 24, 208–220. [Google Scholar]
- Faus, M.; Alonso, F.; Javadinejad, A.; Useche, S.A. Are Social Networks Effective in Promoting Healthy Behaviors? A Systematic Review of Evaluations of Public Health Campaigns Broadcast on Twitter. Front. Public Health 2022, 10, 1045645. [Google Scholar] [CrossRef] [PubMed]
- Picazo-Vela, S.; Fernandez-Haddad, M.; Luna-Reyes, L.F. IT’s Alive!! Social Media to Promote Public Health. In Proceedings of the 14th Annual International Conference on Digital Government Research, Quebec City, QC, Canada, 17–20 June 2013; pp. 111–119. [Google Scholar]
- Ghahramani, A.; de Courten, M.; Prokofieva, M. The Potential of Social Media in Health Promotion Beyond Creating Awareness: An Integrative Review. BMC Public Health 2022, 22, 2402. [Google Scholar] [CrossRef] [PubMed]
- Zainafree, I.; Hadisaputro, S.; Suwandono, A.; Widjanarko, B. The Road Safety Education Program for Adolescents Using Social Media, Proving Increasing Knowledge, Beliefs, Attitudes, Intentions and Behavior. Safety 2022, 8, 12. [Google Scholar] [CrossRef]
- Ramírez, Y.D.G.; Peralta-Torres, J.; Trujillo-Salazar, M. Promoting road safety education in young adults with Facebook: A mini-case study in engineering university students in Ecuador. Av. Investig. Ing. 2020, 17, 1–16. [Google Scholar] [CrossRef]
- Leung, C.H.; Chan, W.T.Y. Using Emoji Effectively in Marketing: An Empirical Study. J. Digit. Soc. Media Mark. 2017, 5, 76–95. [Google Scholar]
- Chan, W.T.Y.; Leung, C.H. An Empirical Study on the Effective Usage of Emojis in Marketing Communication. Int. J. Technol. Knowl. Soc. 2019, 15, 1–18. [Google Scholar] [CrossRef]
- Das, G.; Wiener, H.J.D.; Kareklas, I. To Emoji or Not to Emoji? Examining the Influence of Emoji on Consumer Reactions to Advertising. J. Bus. Res. 2019, 96, 147–156. [Google Scholar] [CrossRef]
- McShane, L.; Pancer, E.; Poole, M.; Deng, Q. Emoji, Playfulness, and Brand Engagement on Twitter. J. Interact. Mark. 2021, 53, 96–110. [Google Scholar] [CrossRef]
- Wang, S.S. More Than Words? The Effect of Line Character Sticker Use on Intimacy in the Mobile Communication Environment. Soc. Sci. Comput. Rev. 2016, 34, 456–478. [Google Scholar] [CrossRef]
- Konrad, A.; Herring, S.C.; Choi, D. Sticker and Emoji Use in Facebook Messenger: Implications for Graphic Change. J. Comput.Mediat. Comm. 2020, 25, 217–235. [Google Scholar] [CrossRef]
- Jessica, G.; Franzia, E. The Analysis of Line Sticker Character “Cony Special Edition”. Humaniora 2017, 8, 291–301. [Google Scholar] [CrossRef]
- Rachmawati, N.A.; Salam, O.D.; Setiawan, G.A.; Izaak, R.G.A. Evolution of Interpersonal Communication Through Symbols (Sticker) Cyber Native in The Line App. Bus. Econ. Comm. Soc. Sci. J. 2021, 3, 125–135. [Google Scholar] [CrossRef]
- Everydaymarketing. Available online: https://www.everydaymarketing.co/trend-insight/why-line-is-good-for-online-business (accessed on 16 March 2023).
- Liao, S.H.; Hsu, S.Y. Big Data Analytics for Investigating Taiwan Line Sticker Social Media Marketing. Asia Pac. J. Mark. Logist. 2020, 32, 589–606. [Google Scholar] [CrossRef]
- Hubbard, S.M.; Hayashi, S.W. Use of Diffusion of Innovations Theory to Drive a Federal Agency’s Program Evaluation. Eval. Program Plan 2003, 26, 49–56. [Google Scholar] [CrossRef]
- World Health Organization. World Health Organization Global Status Report on Road Safety 2018; World Health Organization: Geneva, Switzerland, 2018. [Google Scholar]
- Thailand Accident Research Center. Available online: http://www.tarc.or.th/research/142#.ZCVP9XZBy3A (accessed on 20 May 2023).
- O’Hern, S.; Willberg, E.; Fink, C.; Useche, S. Relationships among Bicycle Rider Behaviours, Anger, Aggression, and Crashes in Finland. Safety 2022, 8, 18. [Google Scholar] [CrossRef]
- Ma, Y.; Xu, J.; Gao, C.; Mu, M.; E, G.; Gu, C. Review of Research on Road Traffic Operation Risk Prevention and Control. Int. J. Environ. Res. Public Health 2022, 19, 12115. [Google Scholar] [CrossRef] [PubMed]
- Beshah, T.; Hill, S. Mining Road Traffic Accident Data to Improve Safety: Role of Road-Related Factors on Accident Severity in Ethiopia. In Proceedings of the 2010 AAAI Spring Symposium, Technical Report SS-10-01, Stanford, CA, USA, 22–24 March 2010; AAAI Spring Symposium Series. pp. 14–19. [Google Scholar]
- Museru, L.M.; Mcharo, C.N.; Leshabari, M.T. Road Traffic Accidents in Tanzania: A Ten Year Epidemiological Appraisal. East Cent. Afr. J. Surg. 2002, 7, 23–26. [Google Scholar]
- Asogwa, S.E. Road Traffic Accidents in Nigeria: A Review and a Reappraisal. Accid. Anal. Prev. 1992, 24, 149–155. [Google Scholar] [CrossRef]
- Sararad, C.; Pawinee, I. The Study of Risk Behavior Factors Affecting Road Accident. NRRU Community Res. J. 2011, 15, 30–42. [Google Scholar]
- Sararad, C.; Jirawan, K.; Pawinee, I. Tourism Promotion towards an Improving Road Safety: A Case Study of Motorcycle Rental of Foreign Tourists in Chiang Mai. JITT 2018, 14, 155–173. [Google Scholar]
- Sittichai, S. Studies Related to Inspection of Safety Management on Defensive Driving on the Roads of Thailand and Abroad: A Literature Review. PTU J. Sci. Technol. 2022, 3, 22–36. [Google Scholar]
- GoOnlineThailand. Available online: https://goonlinethailand.com/blog/social-media/line (accessed on 14 July 2023).
- Šeibokaitė, L.; Markšaitytė, R.; Endriulaitienė, A.; Slavinskienė, J.; Šakinytė, D.; Tamajevaitė, G. Targeting Smartphone Use While Driving: Drivers’ Reactions to Different Types of Safety Messages. Sustainability 2021, 13, 13241. [Google Scholar] [CrossRef]
- Naris, P. Brand Communication by Using Spoke-Characters Featured in LINE Stickers in Thailand. Panyapiwat J. 2020, 12, 193–207. [Google Scholar]
- Phichanan, P.; Phuwaritsittha, P.; Chacha, S.; Saharat, J. Line Sticker Design “Chao Lay” to Promote and Carry on the Language and Ethnicity of the Urak Lawoi People. Des. Echo. 2022, 3, 32–40. [Google Scholar]
- Saowaluck, P. A Study of Concept and Style in Character Sticker for Using on Social Media. J. Soc. Commun. Innov. 2019, 7, 156–167. [Google Scholar]
- Palisa, N. Factors Affecting to the Purchase of LINE Sticker for Chatting in Bangkok. Master’s Thesis, Mahidol University, Nakhon Pathom, Thailand, 7 December 2019. [Google Scholar]
- Buakaew, S. The Semiotics Reflection of Stickers Used in the Line Application. Political Sci. Public Adm. J. 2019, 10, 1–22. [Google Scholar]
- Kaliyaperumal, K.I.E.C. Guideline for Conducting a Knowledge, Attitude and Practice (KAP) Study. AECS Illum. 2004, 4, 7–9. [Google Scholar]
- Peek-Asa, C.; Zwerling, C.; Stallones, L. Acute Traumatic Injuries in Rural Populations. Am. J. Public Health 2004, 94, 1689–1693. [Google Scholar] [CrossRef]
- Ning, L.; Niu, J.; Bi, X.; Yang, C.; Liu, Z.; Wu, Q.; Liu, C. The Impacts of Knowledge, Risk Perception, Emotion and Information on Citizens’ Protective Behaviors During the Outbreak of COVID-19: A Cross-Sectional Study in China. BMC Public Health 2020, 20, 1751. [Google Scholar] [CrossRef] [PubMed]
- Vingilis, E.; Coultes, B. Mass Communications and Drinking-Driving: Theories, Practices and Results. Alcohol Drugs Driv. 1990, 6, 61–81. [Google Scholar]
- Mirzaei, R.; Hafezi-Nejad, N.; Sabagh, M.S.; Moghaddam, A.A.; Eslami, V.; Rakhshani, F.; Rahimi-Movaghar, V. Dominant Role of Drivers’ Attitude in Prevention of Road Traffic Crashes: A Study on Knowledge, Attitude, and Practice of Drivers in Iran. Accid. Anal. Prev. 2014, 66, 36–42. [Google Scholar] [CrossRef] [PubMed]
- Bachani, A.M.; Risko, C.B.; Gnim, C.; Coelho, S.; Hyder, A.A. Knowledge, Attitudes, and Practices Around Drinking and Driving in Cambodia: 2010–2012. Public Health 2017, 144, S32–S38. [Google Scholar] [CrossRef] [PubMed]
- Schuler, D.; Namioka, A. Participatory Design: Principles and Practices; CRC Press: Boca Raton, FL, USA, 1993. [Google Scholar]
- Bjerknes, G.; Ehn, P.; Kyng, M. Computers and Democracy: A Scandinavian Challenge; Avebury: Beatty, NV, USA, 1987. [Google Scholar]
- Sanders, E.B.N.; Stappers, P.J. Co-Creation and the New Landscapes of Design. CoDesign 2008, 4, 5–18. [Google Scholar] [CrossRef]
- Spinuzzi, C. The Methodology of Participatory Design. Tech. Commun. 2005, 52, 163–174. [Google Scholar]
- Muller, M.J. Participatory Design: The Third Space in HCI. In Handbook of HCI; Erlbaum: Mahway, NJ, USA, 2002; pp. 1051–1068. [Google Scholar]
- Okada, T. The Potential of the Participatory Design of Mobile Media in Post-mobile Society. In The Second Offline: Doubling of Time and Place; Springer: Singapore, 2021; pp. 89–103. [Google Scholar] [CrossRef]
- Van Even, P.; Vermeersch, L.; Nouwen, M. Young People in an Era of Images: Designing Tools to Create Opportunities for Visual Learning in Art Museums through a Participatory Design Approach. In Proceedings of the 8th European Communication Conference 2021, Braga, Portugal, 6–9 September 2021. [Google Scholar]
- Robertson, T.; Simonsen, J. Challenges and Opportunities in Contemporary Participatory Design. Des. Issues 2012, 28, 3–9. [Google Scholar] [CrossRef]
- Department of Land Transport. Available online: https://web.dlt.go.th/statistics (accessed on 10 September 2023).
- Davidson, J.L.; Jensen, C. Participatory Design with Older Adults: An Analysis of Creativity in the Design of Mobile Healthcare Applications. In Proceedings of the 9th ACM Conference on Creativity & Cognition, Sydney Australia, 17–20 June 2013. [Google Scholar] [CrossRef]
- Lindsay, S.; Jackson, D.; Schofield, G.; Olivier, P. Engaging Older People Using Participatory Design. In Proceedings of the SIGCHI Conference on Human Factors in Computing Systems, Austin, TX, USA, 5 May 2012. [Google Scholar]
- Nilasari, N.L.; Sudipa, I.N.; Sukarini, N.W. Sticker Emoticons Used in LINE Messenger: A Semantic Study. J. Humanis 2018, 22, 585–591. [Google Scholar] [CrossRef]
- Barnard, M. Graphic Design as Communication; Routledge: Abingdon, UK, 2006. [Google Scholar]
- Likert, R. The Human Organization: Its Management and Value; McGraw-Hill Book: New York, NY, USA, 1967. [Google Scholar]
- Rovinelli, R.J.; Hambleton, R.K. On the Use of Content Specialists in the Assessment of Criterion-Referenced Test Item Validity. Dutch J. Educ. Res. 1977, 2, 49–60. [Google Scholar]


| Categories | Communication Goals | N (Messages) | Texts/Messages |
|---|---|---|---|
| 1 | Greeting | 4 | (1) Hello (2) Bye (3) Good night (4) Let’s hangout |
| 2 | Trending phrases | 8 | (1) Big bros! (2) Calm down! (3) Fighting! (4) Don’t play with fire! (5) How dare you! (6) So drama! (7) Get high! (8) Smell fishy! |
| 3 | Expressions of emotions and feelings | 9 | (1) Hahaha (2) Hehe (3) Just kidding (4) Give up! (5) Offensive! (6) Be careful! (7) I wanna cry (8) In hurry? (9) Exhausted! |
| 4 | General responses | 5 | (1) Okay (2) Thank you (3) Roger that (4) Ready! (5) Happy birthday |
| 5 | Work-related messages | 4 | (1) Focus! (2) Keep calm! (3) Safety first! (4) Be cautious! |
| 6 | Words of encouragement | 4 | (1) Take care! (2) Sorry (3) Love you (4) Congratulations |
| 7 | Travel-related messages | 6 | (1) Safe trip (2) Don’t drive drunk (3) Stop (4) Be generous (5) Keep distance (6) Got lost! |
| Texts/ Messages | Images | Denotative Meaning | Connotative Meaning | Texts/ Messages | Images | Denotative Meaning | Connotative Meaning |
|---|---|---|---|---|---|---|---|
| 1. Thank you! |  | A tortoise is walking across the zebra crossing. Cars are stopped to let it pass. | Expressing gratitude when receiving assistance from others. | 7. Ready! |  | The tortoise is inspecting a vehicle that is in a usable condition. | Being well-prepared before travelling. |
| 2. Keep calm! |  | The tortoise is comfortably driving the car without rushing. | Reminding yourself to perform actions gradually and steadily. | 8. Safety first! |  | The tortoise is wearing a helmet before driving. | Preventing danger before engaging in any activity. |
| 3. How dare you! |  | A rabbit is parking the car in a white and red parking area. | Maintaining discipline and refraining from inappropriate actions. | 9. Focus! |  | The tortoise, inside the car, is saying, “focus,” to concentrate before pressing the car’s start button. | Being focused in the present, controlling emotions and feelings steadfastly. |
| 4. Don’t drive drunk |  | The rabbit is driving drunk. There is a sign of intoxication. | Driving a vehicle drunk is illegal. | 10. Be careful! |  | The rabbit suddenly is hitting brake, responsible for blocking the railroad crossing. | Taking care without negligence to prevent harm. |
| 5. Don’t play with fire! |  | The rabbit is driving through a red light while the straight-going cars are exiting. | Avoiding risks with known potential dangers. | 11. Be generous |  | The tortoise is driving the car to let the ambulance pass. | Being generous and understanding, allowing mutual compassion. |
| 6. Calm down! |  | The rabbit is driving at high speed, overtaking the tortoise. | Reducing excessive behaviors. | 12. Keep distance |  | Two cars are driving, maintaining distance between them. | Maintaining a gap between personal relationships, not letting them become too close to each other. |
| Scale | Scale Interval | Level | Scale Description | |
|---|---|---|---|---|
| User Satisfaction Evaluation * | User Opinion Evaluation ** | |||
| 5 | 4.50–5.00 | Highest | Very Satisfied | Strongly Agree |
| 4 | 3.50–4.49 | High | Satisfied | Agree |
| 3 | 2.50–3.49 | Moderate | Acceptable | Neutral/Uncertain |
| 2 | 1.50–2.49 | Low | Dissatisfied | Disagree |
| 1 | 1.00–1.49 | Lowest | Very Dissatisfied | Strongly Disagree |
| Dimension | Criteria | Gender | Age Group | |||||||||||||
|---|---|---|---|---|---|---|---|---|---|---|---|---|---|---|---|---|
| Male | Female | t(48) | p | 15–20 | 20–29 | 30–39 | 40 and Above | F (3.49) | ||||||||
| S.D. | S.D. | S.D. | S.D. | S.D. | S.D. | |||||||||||
| 1 | Character Dimension | |||||||||||||||
| 1.1 | Attractiveness of the characters | 4.30 | 0.76 | 4.37 | 4.33 | −0.335 | 0.739 | 4.23 | 0.83 | 4.39 | 0.69 | 4.17 | 0.41 | 4.67 | 0.58 | 0.50 |
| 1.2 | Proportions and size of the characters | 4.39 | 0.72 | 4.56 | 0.74 | −0.852 | 0.398 | 4.54 | 0.78 | 4.43 | 0.63 | 4.50 | 0.84 | 4.67 | 0.58 | 0.16 |
| 1.3 | Uniqueness and distinctiveness of the characters | 4.22 | 0.74 | 4.59 | 0.69 | −1.853 | 0.070 | 4.23 | 0.83 | 4.46 | 0.69 | 4.50 | 0.84 | 4.67 | 0.58 | 0.48 |
| 1.4 | Color tones used | 4.08 | 0.72 | 4.30 | 0.61 | −1.103 | 0.275 | 3.92 | 0.64 | 4.21 | 0.63 | 4.50 | 0.84 | 4.67 | 0.58 | 1.70 |
| 1.5 | Overall likability of the characters | 4.22 | 0.67 | 4.37 | 0.63 | −0.831 | 0.410 | 4.15 | 0.69 | 4.28 | 0.66 | 4.50 | 0.55 | 4.67 | 0.58 | 0.73 |
| Average | 4.27 | 0.54 | 4.40 | 0.44 | −0.914 | 0.365 | 4.25 | 0.52 | 4.34 | 0.46 | 4.34 | 0.58 | 4.70 | 0.44 | 0.67 | |
| 2 | Text and Message Dimension | |||||||||||||||
| 2.1 | Clarity of the text | 4.48 | 0.51 | 4.67 | 0.51 | −1.343 | 0.186 | 4.62 | 0.51 | 4.61 | 0.50 | 4.33 | 0.52 | 4.67 | 0.58 | 0.55 |
| 2.2 | Ease of use (such as reduced typing time) | 4.30 | 0.72 | 4.37 | 0.48 | −0.309 | 0.758 | 4.00 | 0.58 | 4.43 | 0.79 | 4.50 | 0.84 | 4.67 | 0.58 | 1.35 |
| 2.3 | Font type | 4.39 | 0.66 | 4.48 | 0.64 | −0.490 | 0.627 | 4.23 | 0.73 | 4.48 | 0.64 | 4.50 | 0.55 | 5.00 | 0.00 | 1.26 |
| 2.4 | Font size | 4.30 | 0.70 | 4.59 | 0.50 | −1.688 | 0.098 | 4.38 | 0.51 | 4.54 | 0.64 | 4.17 | 0.75 | 4.67 | 0.58 | 0.77 |
| 2.5 | Text arrangement and positioning | 4.60 | 0.50 | 4.56 | 0.64 | −0.323 | 0.748 | 4.62 | 0.51 | 4.57 | 0.63 | 4.50 | 0.55 | 4.67 | 0.58 | 0.08 |
| 2.6 | Text and background colors | 4.60 | 0.50 | 4.56 | 0.64 | 0.323 | 0.748 | 4.38 | 0.65 | 4.64 | 0.56 | 4.50 | 0.55 | 5.00 | 0.00 | 1.20 |
| 2.7 | Trending phrases | 4.52 | 0.67 | 4.56 | 0.80 | −0.161 | 0.873 | 4.46 | 0.78 | 4.54 | 0.79 | 4.67 | 0.52 | 4.67 | 0.58 | 0.13 |
| Average | 4.46 | 0.47 | 4.54 | 0.53 | −0.584 | 0.562 | 4.38 | 0.41 | 4.65 | 0.57 | 4.45 | 0.41 | 4.77 | 0.40 | 0.61 | |
| 3 | Meaning Dimension | |||||||||||||||
| 3.1 | Facial expressions and postures of the “tortoise” character | 4.35 | 0.78 | 4.48 | 0.51 | −0.730 | 0.469 | 4.46 | 0.66 | 4.36 | 0.68 | 4.50 | 0.55 | 4.67 | 0.58 | 0.27 |
| 3.2 | Facial expressions and postures of the “rabbit” character | 4.48 | 0.73 | 4.59 | 0.57 | −0.620 | 0.538 | 4.38 | 0.77 | 4.61 | 0.63 | 4.50 | 0.55 | 4.67 | 0.58 | 0.38 |
| 3.3 | Facial expressions and postures of the “zebra” character | 4.52 | 0.73 | 4.37 | 0.63 | 0.787 | 0.435 | 4.46 | 0.66 | 4.39 | 4.74 | 4.33 | 0.52 | 5.00 | 0.00 | 0.78 |
| 3.4 | Interpretation of other elements in the picture such as background scenes, vehicles, atmosphere | 4.65 | 0.57 | 4.48 | 0.58 | 0.433 | 0.302 | 4.84 | 0.38 | 4.39 | 0.63 | 4.50 | 0.55 | 5.00 | 0.00 | 2.71 |
| 3.5 | Conveying feelings to others through the use of these Line stickers | 4.39 | 0.72 | 4.44 | 0.70 | −0.264 | 0.793 | 4.31 | 0.63 | 4.43 | 0.79 | 4.50 | 0.55 | 4.67 | 0.58 | 0.25 |
| 3.6 | Interest level in the story depicted in these Line stickers | 4.39 | 0.78 | 4.51 | 0.70 | −0.607 | 0.547 | 4.54 | 0.52 | 4.39 | 0.83 | 4.33 | 0.82 | 5.00 | 0.00 | 0.72 |
| 3.7 | Overall integration of knowledge in promoting road safety within these Line stickers | 4.65 | 0.65 | 4.67 | 0.48 | −0.091 | 0.928 | 4.85 | 0.38 | 4.61 | 0.63 | 4.50 | 0.55 | 4.67 | 0.58 | 0.72 |
| Average | 4.49 | 0.59 | 4.51 | 0.44 | −0.166 | 0.869 | 4.55 | 0.41 | 4.46 | 0.58 | 4.43 | 0.42 | 4.80 | 0.35 | 0.48 | |
| 4 | Benefits Received Dimension | |||||||||||||||
| 4.1 | Suitability of Line stickers for daily communication | 4.39 | 0.72 | 4.33 | 0.62 | 0.305 | 0.761 | 4.15 | 0.55 | 4.43 | 0.69 | 4.33 | 0.81 | 4.67 | 0.58 | 0.72 |
| 4.2 | Appropriate quantity of 40 stickers for use | 4.61 | 0.66 | 4.67 | 0.62 | −3.21 | 0.750 | 4.53 | 0.66 | 4.64 | 0.62 | 4.67 | 0.82 | 5.00 | 0.00 | 0.43 |
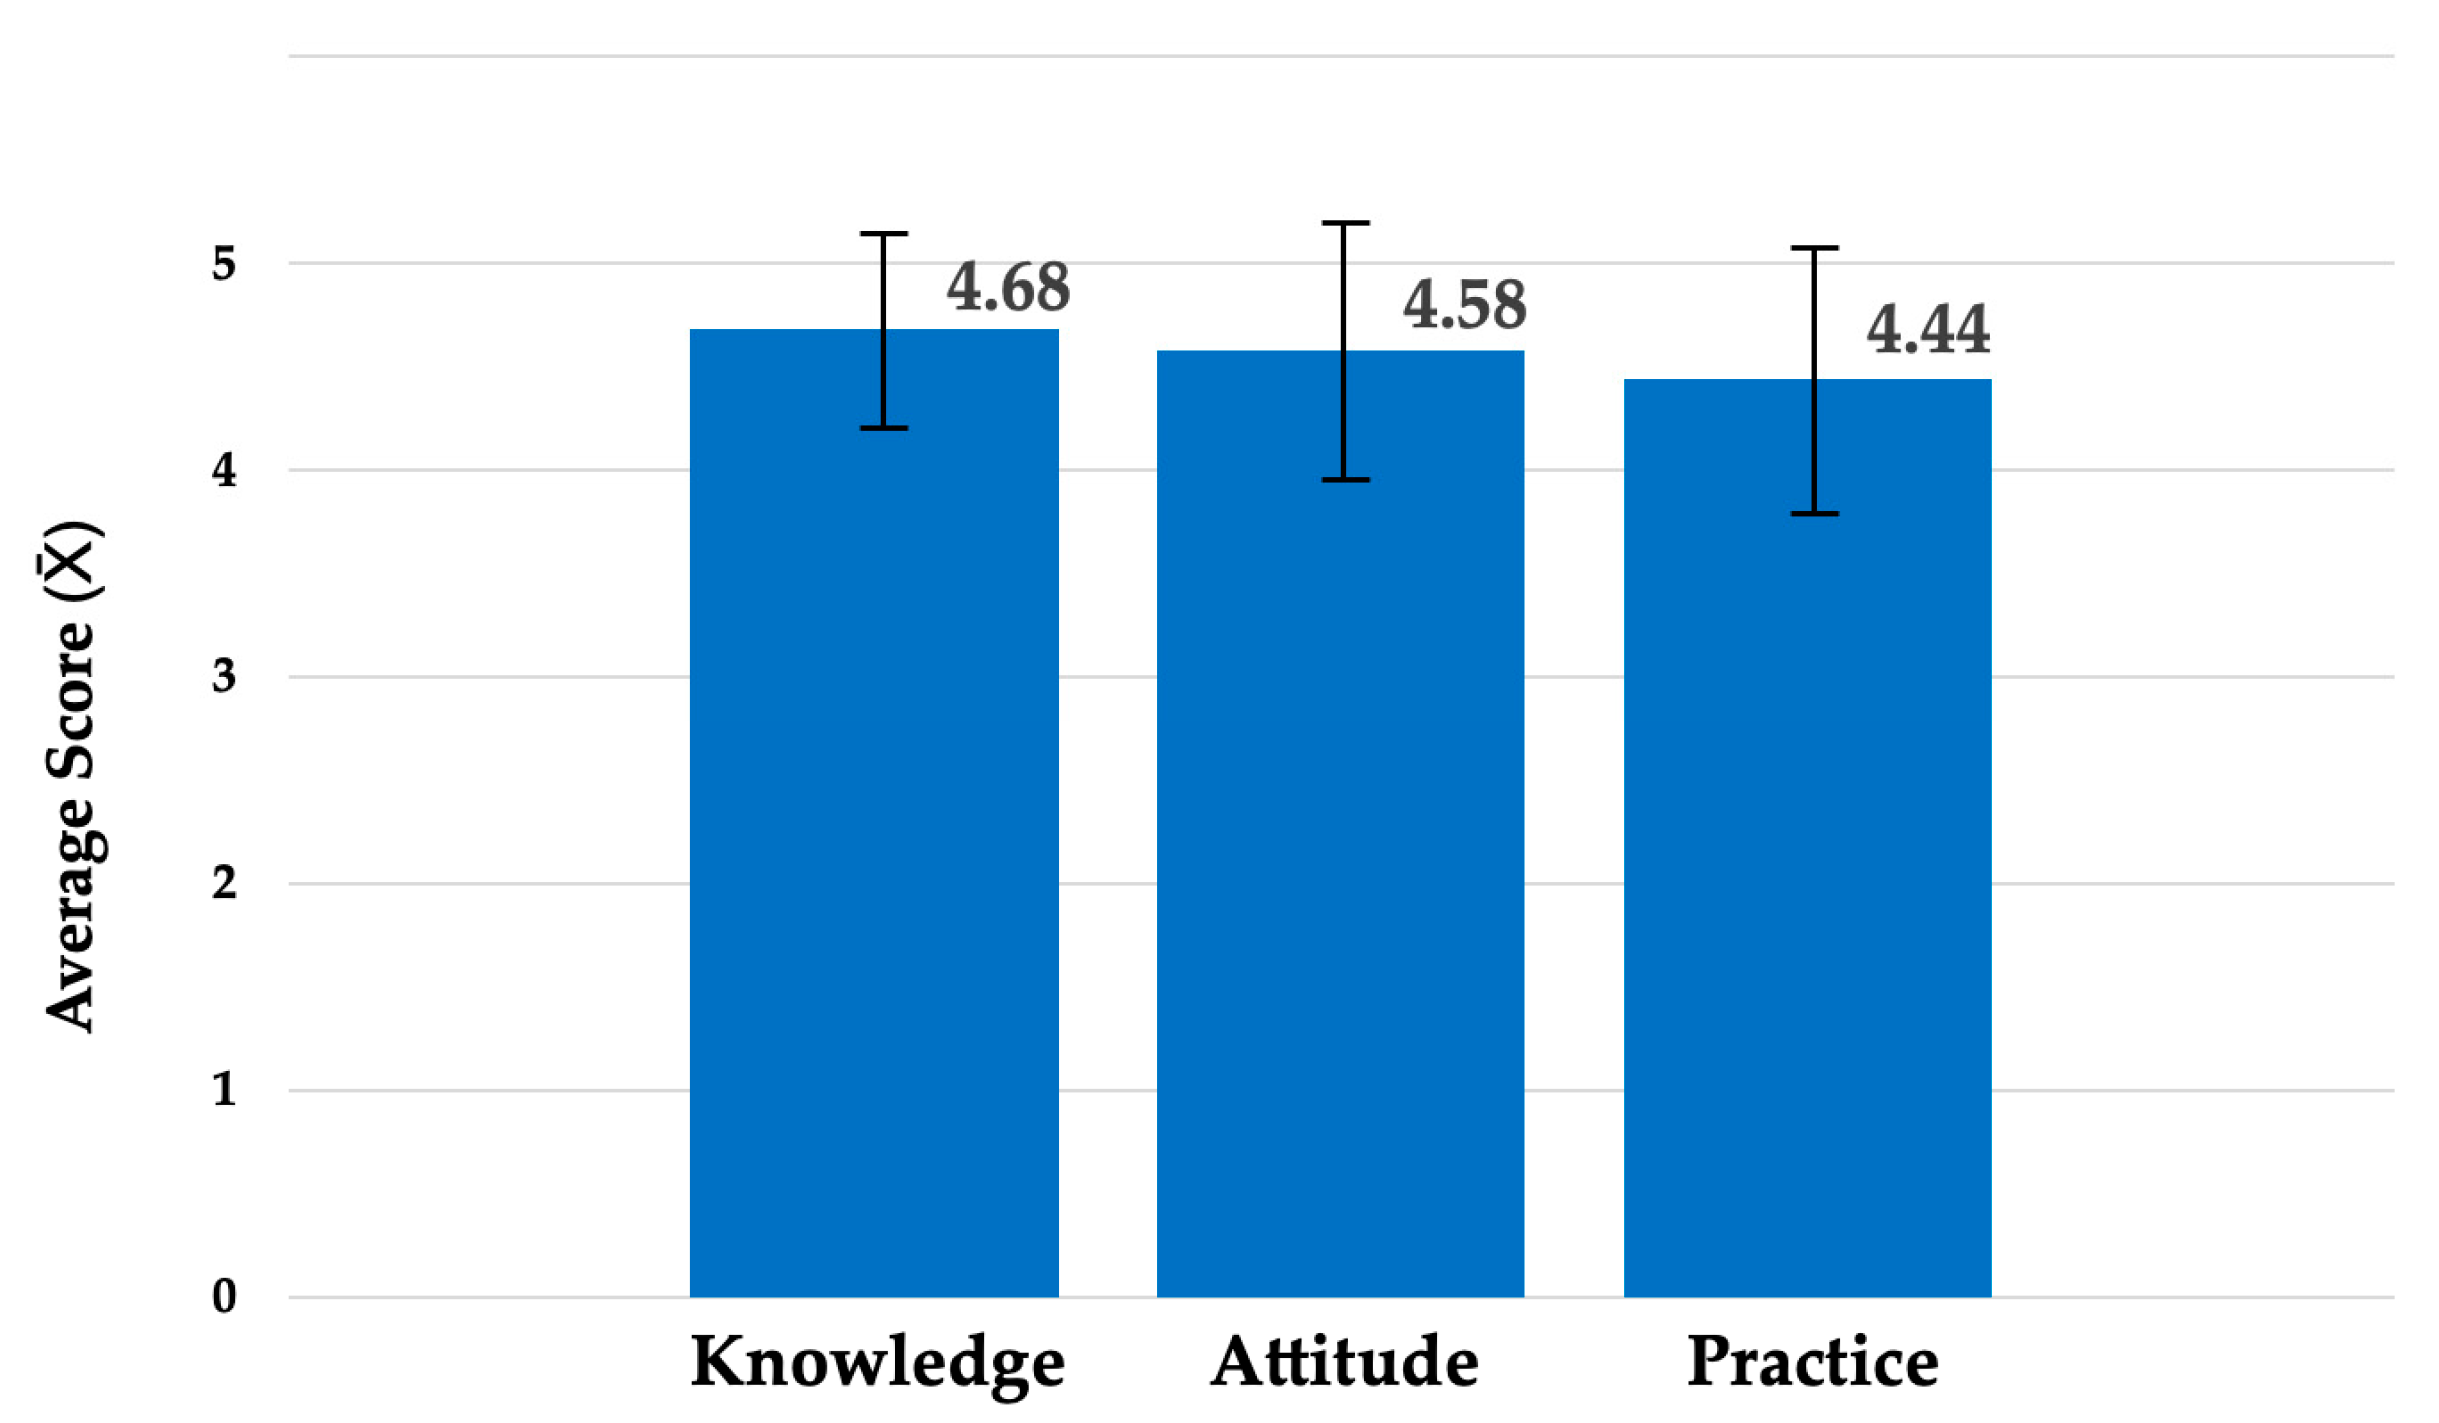
| 4.3 | Promoting road safety understanding in Thailand (Knowledge) | 4.65 | 0.49 | 4.70 | 0.47 | −0.382 | 0.704 | 4.53 | 0.52 | 4.68 | 0.48 | 4.83 | 0.41 | 5.00 | 0.00 | 1.07 |
| 4.4 | Raising awareness of safe land transportation (Attitude) | 4.52 | 0.67 | 4.62 | 0.56 | −0.620 | 0.538 | 4.46 | 0.52 | 4.64 | 0.62 | 4.33 | 0.82 | 5.00 | 0.00 | 1.07 |
| 4.5 | Reinforcing traffic discipline for safety (Practice) | 4.26 | 0.69 | 4.59 | 0.57 | −1.860 | 0.069 | 4.38 | 0.77 | 4.50 | 0.58 | 4.33 | 0.82 | 4.33 | 0.58 | 0.19 |
| Average | 4.49 | 0.46 | 4.59 | 0.35 | −0.862 | 0.393 | 4.42 | 0.34 | 4.58 | 0.41 | 4.50 | 0.67 | 4.80 | 0.41 | 0.94 | |
| Dimension | Criteria | S.D. | Description | |
|---|---|---|---|---|
| 1 | Character Dimension | |||
| 1.1 | Attractiveness of the characters | 4.33 | 0.61 | Satisfied |
| 1.2 | Proportions and size of the characters | 4.47 | 0.60 | Satisfied |
| 1.3 | Uniqueness and distinctiveness of the characters | 4.43 | 0.63 | Satisfied |
| 1.4 | Color tones used | 4.17 | 0.62 | Satisfied |
| 1.5 | Overall likability of the characters | 4.29 | 0.58 | Satisfied |
| 4.34 | 0.61 | Satisfied | ||
| 2 | Text and Message Dimension | |||
| 2.1 | Clarity of the text | 4.58 | 0.50 | Very Satisfied |
| 2.2 | Ease of use (such as reduced typing time) | 4.34 | 0.75 | Satisfied |
| 2.3 | Font type | 4.44 | 0.64 | Satisfied |
| 2.4 | Font size | 4.46 | 0.61 | Satisfied |
| 2.5 | Text arrangement and positioning | 4.58 | 0.57 | Very Satisfied |
| 2.6 | Text and background colors | 4.58 | 0.57 | Very Satisfied |
| 2.7 | Trending phrases | 4.54 | 0.73 | Very Satisfied |
| Average | 4.50 | 0.63 | Very Satisfied | |
| 3 | Meaning Dimension | |||
| 3.1 | Facial expressions and postures of the “tortoise” character | 4.42 | 0.64 | Satisfied |
| 3.2 | Facial expressions and postures of the “rabbit” character | 4.54 | 0.65 | Very Satisfied |
| 3.3 | Facial expressions and postures of the “zebra” character | 4.44 | 0.67 | Satisfied |
| 3.4 | Interpretation of other elements in the picture such as background scenes, vehicles, atmosphere | 4.56 | 0.58 | Very Satisfied |
| 3.5 | Conveying feelings to others through the use of these Line stickers | 4.42 | 0.70 | Satisfied |
| 3.6 | Interest level in the story depicted in these Line stickers | 4.46 | 0.73 | Satisfied |
| 3.7 | Overall integration of knowledge in promoting road safety within these Line stickers | 4.66 | 0.56 | Very Satisfied |
| Average | 4.50 | 0.65 | Very Satisfied | |
| 4 | Benefits Received Dimension * | |||
| 4.1 | Suitability of Line stickers for daily communication | 4.36 | 0.66 | Satisfied |
| 4.2 | Appropriate quantity of 40 stickers for use | 4.64 | 0.63 | Very Satisfied |
| 4.3 | Promoting road safety understanding in Thailand (Knowledge) | 4.68 | 0.47 | Strongly Agree |
| 4.4 | Raising awareness of safe land transportation (Attitude) | 4.58 | 0.61 | Strongly Agree |
| 4.5 | Reinforcing traffic discipline for safety (Practice) | 4.44 | 0.64 | Agree |
| Average | 4.54 | 0.60 | Very Satisfied, Strongly Agree | |
Disclaimer/Publisher’s Note: The statements, opinions and data contained in all publications are solely those of the individual author(s) and contributor(s) and not of MDPI and/or the editor(s). MDPI and/or the editor(s) disclaim responsibility for any injury to people or property resulting from any ideas, methods, instructions or products referred to in the content. |
© 2023 by the authors. Licensee MDPI, Basel, Switzerland. This article is an open access article distributed under the terms and conditions of the Creative Commons Attribution (CC BY) license (https://creativecommons.org/licenses/by/4.0/).
Share and Cite
Phithak, T.; Surasangprasert, P.; Kamollimsakul, S. Going beyond Chat: Designing Connotative Meaningful Line Stickers to Promote Road Safety in Thailand through Participatory Design. Safety 2023, 9, 87. https://doi.org/10.3390/safety9040087
Phithak T, Surasangprasert P, Kamollimsakul S. Going beyond Chat: Designing Connotative Meaningful Line Stickers to Promote Road Safety in Thailand through Participatory Design. Safety. 2023; 9(4):87. https://doi.org/10.3390/safety9040087
Chicago/Turabian StylePhithak, Thawatphong, Pawanrat Surasangprasert, and Sorachai Kamollimsakul. 2023. "Going beyond Chat: Designing Connotative Meaningful Line Stickers to Promote Road Safety in Thailand through Participatory Design" Safety 9, no. 4: 87. https://doi.org/10.3390/safety9040087