1. Introduction
Red-light violations and speeding are the primary factors contributing to road collisions in the United States and Canada [
1]. Studies have demonstrated diverse outcomes for these two violations, depending on their magnitude and severity. Notably, a direct correlation exists between speeding and the probability of being involved in a collision [
1]. According to Evans (2004), a mere 1% rise in the average speed corresponds to a heightened fatality risk, ranging between 4% and 12% [
2]. In Elvik’s (2005) research, involving the utilization of meta-analyses encompassing over ninety-eight studies, a noteworthy conclusion was drawn regarding the substantial and causally comprehensive relationship between road safety and speed [
3]. He posited that speeding serves as the primary contributing factor in traffic fatality cases, emphasizing that it not only holds the status of the foremost determinant but also underscores a significant divergence in fatality risk when a vehicle surpasses the speed of the surrounding traffic, a phenomenon commonly referred to as “speed dispersion” [
3].
Traffic enforcement is one approach to mitigating the number and severity of speed-related collisions. Automated enforcement, in particular, offers a solution to the equity concerns often associated with traditional, human-centered policing practices. In automated enforcement, officers do not interact directly with citizens, unlike conventional policing methods that require face-to-face encounters. This distinction helps mitigate the potential for biases, whether they be racial or personal, that may arise during traditional policing interactions. Automated systems contribute to more consistent and impartial enforcement of traffic laws by removing potential bias or discrimination in traffic stops. Moreover, these systems can be calibrated to prioritize safety over revenue generation, reinforcing their role as tools for enhancing road safety rather than punitive measures.
Several national and international reports have demonstrated that introducing Automated Speed Enforcement (ASE) programs positively impacts road safety [
4]. Canadian cities, such as Winnipeg, Calgary, and Edmonton, have effectively implemented ASE [
5,
6]. For instance, data from Edmonton indicate a reduction in collisions of up to 20% due to ASE programs [
5].
Nonetheless, the consensus leans toward mobile speed enforcement, as intersection safety devices occasionally yield inconsistent outcomes [
7]. Reviews undertaken between the late 1990s and 2000s revealed significant reductions in speeding through the implementation of Mobile Photo Enforcement (MPE). MPE is the utilization of mobile cameras to enforce traffic regulations and oversee road safety. This technology enables authorities to observe traffic conduct across diverse locations, including those where deploying fixed cameras might be challenging or impractical. The deployment of mobile enforcement devices within unmarked vehicles across different sites and timeframes enhances the unpredictability of enforcement efforts, thereby increasing the potential for a broader spectrum of deterrence effects [
8]. According to Rodier et al. (2007), the reduction rates were 82% and 51%, respectively, during these periods [
9]. In particular, one study pointed out that the MPE programs are reliable because the perceived risk of detection increases with each subsequent deployment, resulting in broader deterrence levels and lower numbers of speeding violations [
7].
The results have indicated favorable reductions in collision rates following the implementation of MPE technologies. For instance, this technology has led to a 26% decrease in fatal collisions and a 21% reduction in non-fatal collisions in France [
8]. In British Columbia, Canada, speed-related collisions experienced a 25% reduction across different enforcement locations. Similarly, in Australia, there was a notable decrease in collision incidents by 22%, with a significant 38% reduction in injury-related collisions [
8]. A report prepared for the City of Winnipeg highlights the adoption of MPE in Charlotte, North Carolina, and Washington, where collision statistics have shown an average reduction of 10% and 14%, respectively. Furthermore, in Washington, there was a remarkable 82% reduction in the number of vehicles exceeding the posted speed limit by 10 mph in the region [
6].
Nevertheless, despite these reported success cases, there remains an ongoing challenge in determining the effectiveness of this technology in establishing a direct link between deployment outcomes and their impact on road safety. The clarity of such assessments can be obscured by several factors, including data availability and quality, the complexity of the variables involved, resource allocation, and geographical variations. These complexities make it essential to carefully evaluate the methods and data sources used to ensure a comprehensive and accurate understanding of the technology’s true impact on enhancing road safety. A predominant concern that persists is the optimal allocation and utilization of resources to achieve the highest level of safety enhancement [
8]. Thus, this research aims to incorporate program deployment data, using measures from the literature, along with safety data from deployment sites to examine the effectiveness of MPE in reducing the time interval between successive collisions.
The primary objective of this research is to establish a correlation between the variables associated with the deployment of MPE, specifically, the hours of deployment, the frequency of visits, and the ratio of hours per visit, and the time elapsed between two consecutive collisions. The study consists of an in-depth analysis of MPE and collision data, employing survival analysis techniques to accomplish this objective. This approach estimates the survival probabilities resulting from MPE deployments, shedding light on their impact on collision occurrence.
Additionally, this study aims to delve into the influence of deployed MPE variables across various road categories. These categories encompass all sites, arterial roads, collector roads, roads with differing levels of traffic exposure, and collisions specifically related to speeding violations. By examining these diverse scenarios, the research seeks to provide a comprehensive understanding of how MPE variables influence road safety outcomes across different road types and traffic conditions.
2. Literature Review
2.1. MPE Operation
Studies on MPE typically examine its effectiveness concerning collisions and speeding, particularly emphasizing the deterrence effects, deployment strategies, and resource allocation. Previous studies have shown that the practical implementation of MPE can significantly reduce mean vehicle speeds [
8]. Additionally, related studies have highlighted that MPE is pivotal in decreasing collisions, leading to severe injuries and fatalities on the road.
The effectiveness of the MPE program can be attributed to its immediate, unavoidable, and severe punishments, which significantly influence driver behavior and attitudes through specific and general deterrence mechanisms. Specifically, general deterrence occurs when potential violators conform to established standards upon recognizing the consequences faced by others or understanding the potential penalties for violating road traffic rules. The immediate and unavoidable repercussions of being caught speeding via MPE create a strong deterrent effect, shaping drivers’ behavior and contributing to overall road safety. Research has linked general deterrence to initiatives such as dangerous driving education, MPE implementation, and awareness campaigns.
On the other hand, specific deterrence occurs when a driver directly experiences detection and punishment [
10]. Some scholars posit that general deterrence can be enhanced by strategically targeting high-risk periods and locations through a combination of visible and non-visible enforcement strategies. Combining these approaches can increase unpredictability and enforcement visibility while incorporating long-term strategy within the enforcement program [
8].
Further research has assessed the impact of MPE using the before-and-after Empirical Bayes method, revealing a reduction in collision severity ranging from 14% to 20% [
11]. It should be noted that this method was primarily applied to urban arterial roads. In addition, previous studies show several variables that can impact transportation engineering outcomes (i.e., incidents). For instance, researchers employing the Cox proportional hazards model found that male and young drivers, as indicated by gender and age variables, received speeding citations more frequently than other gender and age groups [
12]. Moreover, drivers who receive speeding tickets were more likely to accumulate further citations, suggesting that speeding citations have a limited impact on altering speeding behavior compared to other speeding penalties [
12].
While various jurisdictions influence the guidance and regulations governing these programs, such as Alberta’s provincially dictated Automated Enforcement Guidelines [
13], the typical placement of MPE units is at locations recognized for speed limit violations, collision hotspots, and public complaints concerning speeding [
14].
The utilization of speed cameras and enforcement programs is not without controversy. Ongoing public debates often revolve around concerns related to privacy, the reliability of cameras, and issues of fairness, especially when speed cameras are perceived as being misused. Fairness concerns may arise due to factors such as the consistent application of speed limits, potential bias in camera placement, or issues related to the accuracy of recorded speeds. Misuse concerns can stem from the fear that automated enforcement might be exploited for revenue generation rather than solely for road safety.
Furthermore, there is some skepticism regarding whether moderate speeding significantly increases collision risks. Nonetheless, evidence suggests that public awareness programs can mitigate such concerns by reaching out to drivers through visible enforcement initiatives and educational efforts to raise awareness about road safety and responsible driving practices.
2.2. Survival Analysis and Hazard Models in Transportation Engineering
Survival analysis and hazard models, already extensively employed in medical contexts, are progressively finding applications in engineering, particularly in addressing field-related issues. In a broad sense, survival analysis is a statistical technique used to assess the duration of events, categorizing them as either “survival” or “failure.” “Failure” typically pertains to structural failure in various engineering applications. In transportation engineering, survival analysis is frequently utilized to study the duration of roadway incidents, such as car collisions, and their impact on traffic flow and safety. This adaptation of survival analysis techniques underscores their versatility and relevance in engineering problem-solving [
15,
16,
17,
18].
There are three related functions in survival analysis: the failure function, the survival function, and the hazard function. The failure function illustrates the probability of an incident occurring before a specified point in time [
15]. The survival function is the inverse of the failure function, representing the likelihood that the recorded duration continues beyond the specified point in time. While related to the other two functions, the hazard function is distinct. It reflects the probability that an individual incident will experience a “failure” at a precise time, given that it has survived up to that point [
15]. For instance, Nam et al. (2000) conducted a study that delved into the duration of traffic incidents using a dataset comprising incidents in Washington State from 1994 to 1995 [
16]. The investigation specifically focused on reporting, response, and clearance times managed by the Washington State Incident Response Teams. The researchers considered the “failure” to be when an Incident Response Team entirely cleared the incident and “survival” to be the persistence of the incident. The hazard function represented the probability that the incident would be removed at any given point in time.
Transportation engineering studies have employed survival analysis techniques to investigate mandatory lane-changing behaviors in vehicles and associated variables, employing the Cox proportional hazards model [
19]. Their findings indicate that the vehicle type does not significantly impact the duration of mandatory lane changing. Moreover, they reveal that the survival rate for compulsory lane changes during peak periods is higher than off-peak times, with time being a crucial factor influencing these observations.
2.3. Summary
Speeding represents a significant contributing factor to road collisions, prompting municipalities to invest substantial efforts in deterring speed violators through various initiatives, including speed cameras, increased fines for speeding violations, MPE programs, and educational campaigns. Studies in this field have expanded our understanding by identifying pertinent factors influencing road safety. For instance, variables such as age, gender, time, and vehicle type have significantly impacted the likelihood of receiving a speeding citation. Some research has focused on evaluating the effectiveness of deployed MPE programs, using methods like the before-and-after Empirical Bayes approach.
However, previous evaluations of MPE programs have not fully explored the efficient relationship between MPE deployment parameters and safety improvements. There is also room for further development in assessing the impact of MPE variables on different types of roadways and varying conditions. Therefore, it is imperative to take the next research step, seeking to elucidate how MPE strategies can enhance road safety outcomes.
One promising avenue for this endeavor is the application of survival analysis, an increasingly utilized method in transportation engineering studies. This analytical approach has previously been employed to investigate the duration of traffic incidents. In this study, survival analysis will explore the effectiveness of MPE deployment variables in extending the time between collisions, ultimately reducing collision risk and enhancing overall road safety. This research aims to provide valuable insights into the potential of MPE strategies to improve road safety outcomes.
3. Data Description
The Safe Mobility Section in the City of Edmonton (CoE) provided the data used in this analysis. The ‘collision data’ included historical details, such as causes, times, locations, and travel directions. The ‘MPE data’ also comprised information about control types and the MPE’s start and end times at each location. This dataset was crucial in compiling specific details on the duration and frequency of MPE visits at each location. The ‘site data’ included unique site IDs for all locations and detailed descriptions of each site, serving as a critical link between various files. The ‘event data’ also provided traffic count specifics for each location. The study spanned four years, from 2016 to 2019, with data from 2020 excluded due to the documented impacts of the COVID-19 pandemic on the transportation system.
All the data files were merged into a comprehensive dataset to facilitate the analysis. This combined dataset was then formatted for survival analysis, resulting in an Excel (version Microsoft Excel 2019 MSO (16.0.10401.20018) sheet containing essential information for each location, primarily identified by the site ID. While it was conceivable to perform this task manually, the significant time investment made it impractical. Therefore, a MATLAB (Version R2021a) code was developed to expedite the processing, ensuring efficiency and accuracy in the data preparation phase.
4. Methodology
4.1. K-Means Clustering
In this study, K-means clustering, a technique introduced by MacQueen in 1967, was employed to categorize the sites based on various variables: number of hours, number of visits, ratio of hours per visit, and traffic count. The calculation of the hours visited involved the meticulous extraction of relevant data from the MPE data table within a specified year. This process aimed to discern the temporal duration of each visit, spanning from commencement to conclusion. The number of visits was determined by tallying instances within the MPE data table that fell within the designated time frame. Additionally, the computation of the traffic count entailed filtering data from the traffic data table specifically for the given year to extract and quantify the traffic volume. This clustering process facilitated grouping observations into clusters with similar characteristics, where each observation belonged to the cluster with the nearest mean [
20].
The first step in the K-means clustering process is determining the number of clusters (K). In our study, we chose two clusters. It is worth mentioning that we initially tested with three clusters, differentiating between high, intermediate, and low categories. However, during our analysis, we observed that the high and intermediate clusters exhibited similar findings. Consequently, we proceeded with only two clusters, categorizing them as above-average and below-average.
Subsequently, each observation was assigned to one of these clusters based on its proximity, typically measured using the least squared Euclidean distance. To finalize the process, the centroid of each cluster was calculated, and iterations were performed until convergence was achieved. Convergence signifies that the same points were consistently assigned to the same cluster in successive analysis cycles. This K-means clustering approach facilitated the grouping of sites with comparable characteristics, aiding in the subsequent analysis of their respective impacts on road safety.
4.2. Survival Analysis
The study employed survival analysis to investigate the time-to-event occurrence, with the failure event defined as the occurrence of collisions. Fundamental concepts of survival analysis, including the definition of hazard and survival functions, the creation of Kaplan–Meier survival curves for various variables, and the comparison of two survival curves through the log-rank test, were utilized. The Stata statistical software was used to execute this analysis. The study encompassed five distinct stages, each contributing to exploring the relationship between MPE variables (such as the number of hours, number of visits, and the ratio of hours to visits) and the duration between two consecutive collisions.
In the initial step of the analysis, the data was classified into ‘survival time’ and tabulated to incorporate time and failure variables. The time variable denoted the duration between two consecutive collisions, measured in days, while the failure variable was binary (0 or 1). A value of 0 indicated the absence of a collision, whereas 1 signified a collision occurrence within the specified period.
This dataset also included essential details such as the site ID, duration between every pair of consecutive collisions, dates of the first and second collisions (utilized to calculate the time between collisions), number of deployed MPE visits, number of deployed MPE hours, the ratio of MPE hours to MPE visits (HpV), seasons of occurrence for the first and second collisions, collision severity, collision cause, land use, and traffic count. These variables provided a comprehensive overview of the factors under consideration during the survival analysis.
In the subsequent analysis, the primary variables considered were the number of deployed MPE visits, deployed MPE hours, the ratio between them (HpV), and traffic count. Each variable was individually examined in the survival analysis phase to discern its specific impact on the duration between two consecutive collisions. The objective was to identify the variable that exerted the most significant influence on collision occurrence. Furthermore, these variables were previously clustered into above-average and below-average categories. This clustering was performed to investigate whether the above-average or below-average variables offered greater survivability in the MPE locations exposed to them.
The Cox proportional hazards model was employed to investigate the effect of each variable on the time between collisions. This model is widely recognized as one of the most popular techniques among semi-parametric methods because it avoids making assumptions about the hazard baseline. One of its key advantages is that it examines the rate of occurrence of a specific event (i.e., hazard rate) while considering the influence of various factors [
21].
The general Cox proportional hazards model is represented as:
The Cox regression prototype can be transformed into another equation using the logarithmic transformation:
The relative risk (RR) can be denoted as , and the Cox regression is the linear model of the logarithm of the RR. When the other covariate variables remain constant, represents the logarithm changes of the RR with the unit change of the th covariate variable. Based on the definition above, the Cox regression has the following properties:
If , then the th variable is a risk factor, and its hazard may grow over time. This indicates that the incident may be resolved quickly.
If , this variable is a protective factor, and the traffic incident duration is more prolonged, indicating that the incident takes longer to be cleared.
If , this variable has nothing to do with the traffic incident duration.
The outcome of this step is a regression model that individually correlates the deployed MPE hours, visits, and HpV. These models yield hazard ratios for each variable, allowing us further to explore the impact of the aforementioned variables on the analysis.
The K-M hazard estimate is a univariate nonparametric analysis technique employed to estimate the survival probability based on observed survival times [
22]. This study utilized the K-M survival curve to discern the influence of MPE variables on various road categories. This curve was constructed by calculating the product of conditional probability sequences and obtaining the standard estimator, known as the K-M estimator. Comprehensive details on the calculation process can be found in the work of Lin et al. (2009) [
21]. This curve consists of a series of steps, each representing an event occurrence (i.e., collision). The survival probability is on the
Y-axis of the curve, and the time duration is on the
X-axis. Thus, the cumulative survival probability can be extracted at any time point by obtaining the corresponding value on the
Y-axis. The estimated cumulative survival at any time point is at 95% confidence intervals.
If
represents the event period of the traffic of the
th term example, and as the time series
satisfies the traffic event in the state where
, then the Kaplan–Meier-based survival likelihood of the traffic occurrence period represented by
Š(
t) is given by:
In this case, the traffic event time is represented by , denoting the th term of the entire samples. However, for a sample to be complete, it has to satisfy certain conditions, including the being less than and being a positive integer, where and .
There are two methods to compare the survival functions. The first method uses a prespecified time point, and the other compares the overall survival experience, known as the log-rank test. The log-rank test is considered more reliable than the prespecified time point method for reasons outlined in the work of MacQueen (1967) [
20]. Based on these reasons, the log-rank test was applied and executed in this study across the entire survival time range. The null hypothesis for the log-rank test between the two groups is:
where the dot represents the whole survival time range.
The alternative hypothesis is applicable when this null hypothesis is rejected. Moreover, the log-rank test compares the observed and expected collisions when the two groups have the same survival function. Thus, if the null hypothesis is true, the two groups would have the same survival probability, determined based on the p-value. This test estimates the Chi-square value for comparison groups and concludes the result. Then, the Chi-square value is compared for each group using the standard Chi-square test. By the end of this step, the equity test on the two groups will determine whether or not they have the same survival time probability. In our study, the log-rank test is used as a validator for the previous steps, showing whether or not the different road categories have the same survivability.
5. Data Analysis and Results
5.1. Analysis Involving All Study Locations ‘All Sites’
We applied our methodology to all sites from 1 January 2019 to 31 December 2019. There were 250 sites in Edmonton that employed MPE during this period. These sites had a total of 573 collisions. We conducted the Cox PH models, plotted the Kaplan–Meir graphs for the different variable groups, and finally carried out the log-rank tests.
Table 1 summarises the results.
The results for this group provide significant evidence of the MPE impact on reducing the duration between two consequent collisions. The deployed MPE hours and visits showed only small percentage reductions (1% and 3%, respectively) in the collision hazards. Given the percentage difference between the two, one conclusion might be that investing in increased visits would produce better outcomes than increasing the number of hours. For instance, splitting these into distinct shorter visits would be more beneficial if a municipality invested four MPE hours. In addition, the ratio of deployed MPE hours to visits (HpV) has a hazard ratio (HR) of 0.78, with a reduction of 22% (i.e., (1 − HR)%) in collision occurrences for locations that had a high HpV compared to sites without MPE.
The following figures show the results of the Kaplan–Meier survival estimates when including all the sites in the analysis.
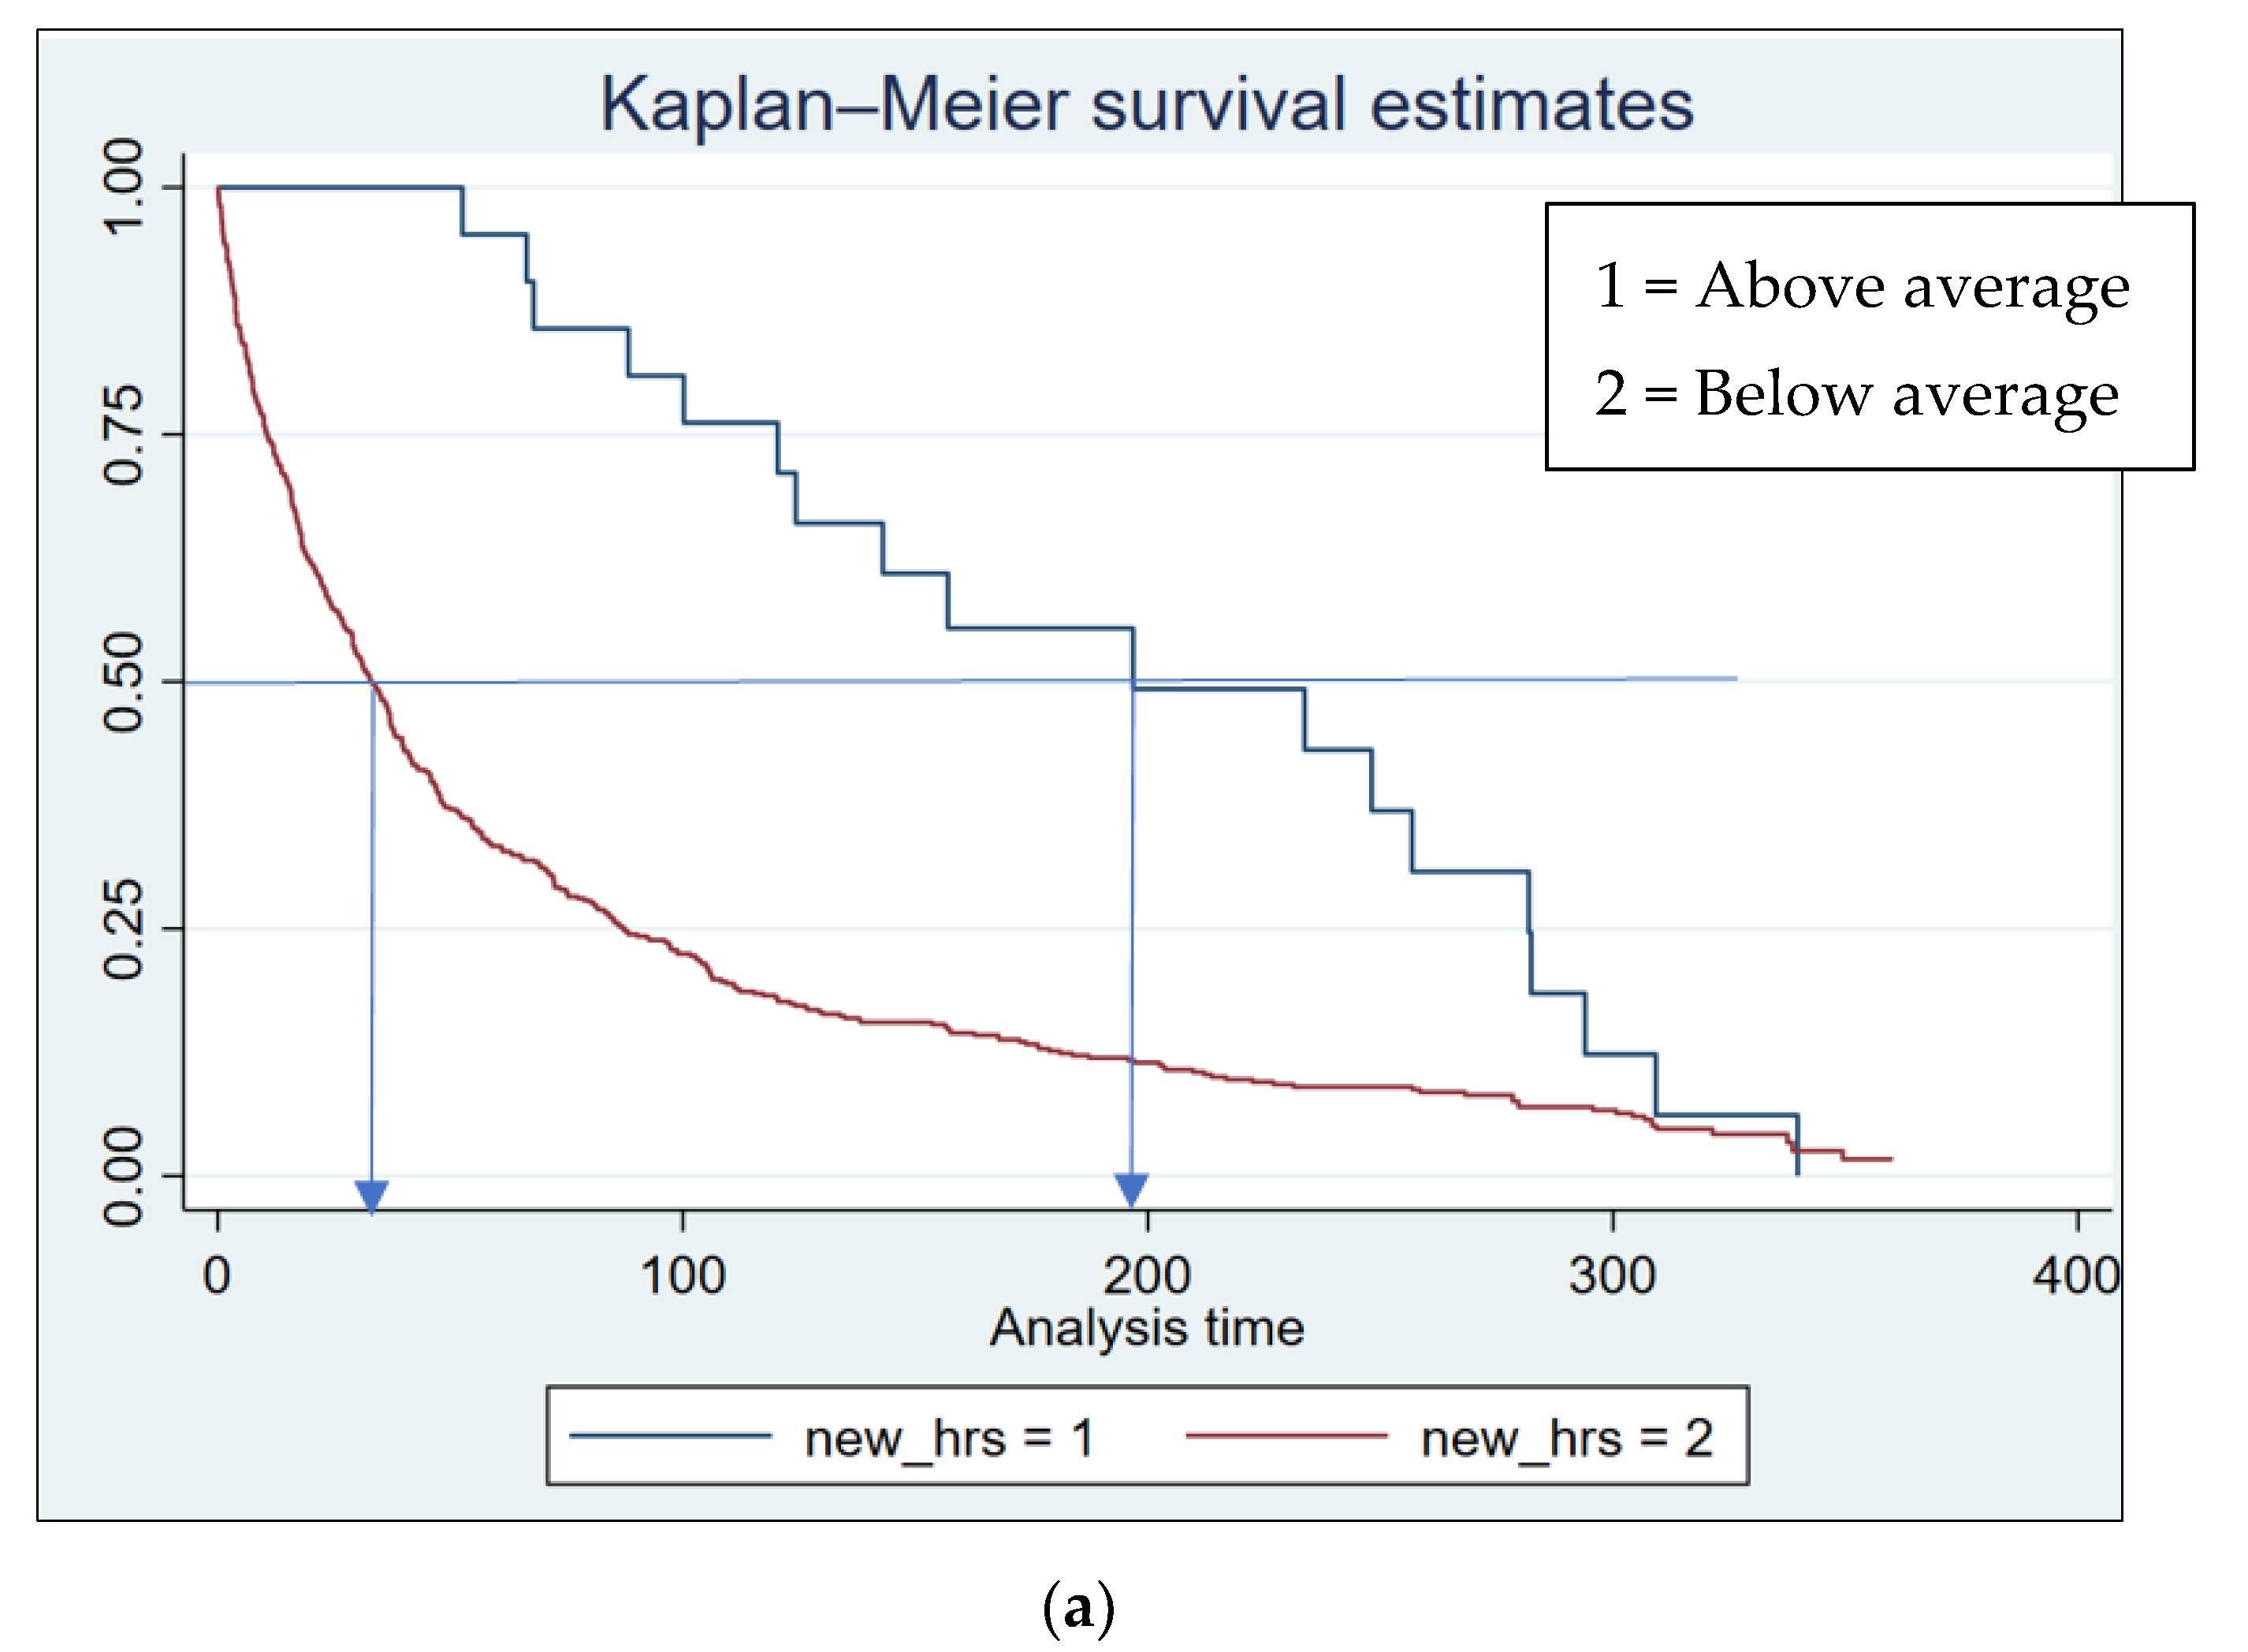
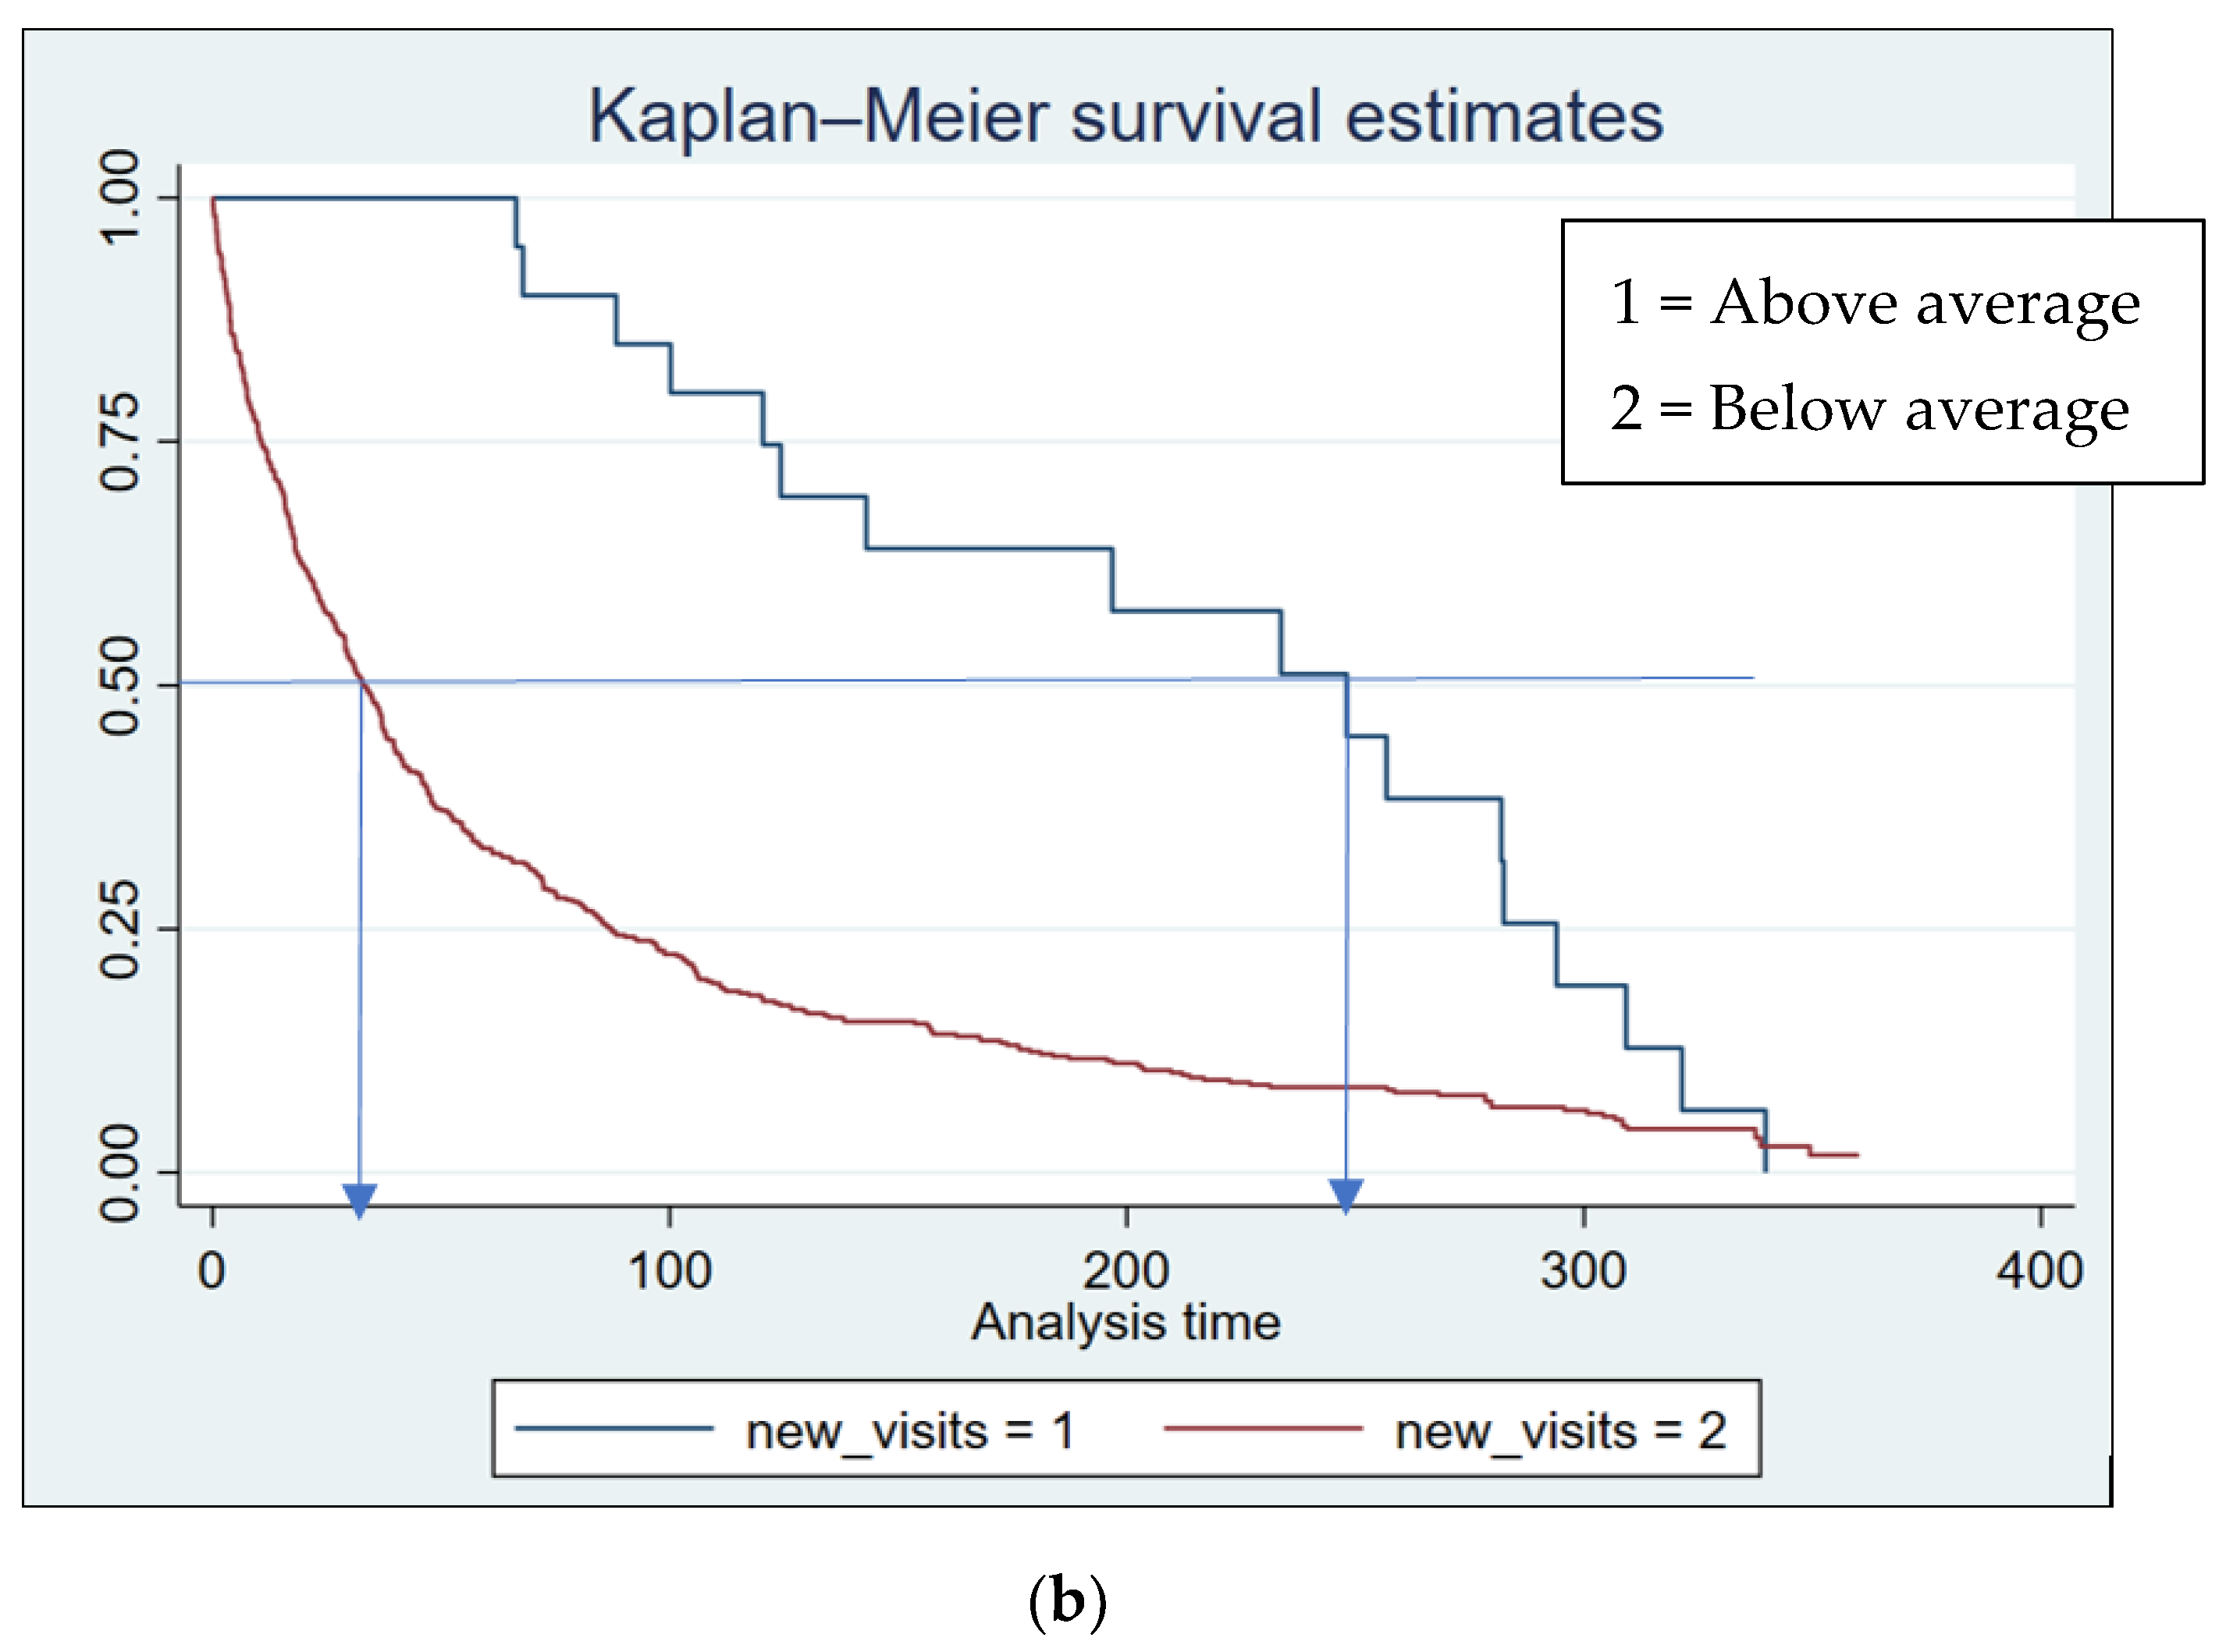
The K-M graphs were plotted to compare the survival probability for locations that experienced two levels of deployed MPE (i.e., above- and below-average deployed MPE). The K-M graphs yielded the same results regarding the deployed MPE hours and visits, showing that the locations that experienced high MPE hours or visits (above average) have higher survivability than those with lower MPE hours or visits (below average).
As shown in
Figure 1a, the median survival probability (at 0.5 on the
Y-axis) for sites with above-average deployed MPE hours is 198 days. These days represent the cumulative survival time in days for the above-average deployed MPE hours at the median.
In comparison, the below-average ones had a survival probability of 38 days. Similarly, in
Figure 1b, the survival probability at 0.5 on the
Y-axis for sites with above-average MPE visits is 248 days; meanwhile, the below-average group had a survival probability of 37 days. Moreover, groups with below-average MPE hours and visits encountered more frequent steps in the K-M graphs, indicating that these sites experienced more collisions over a shorter time than the above-average MPE groups.
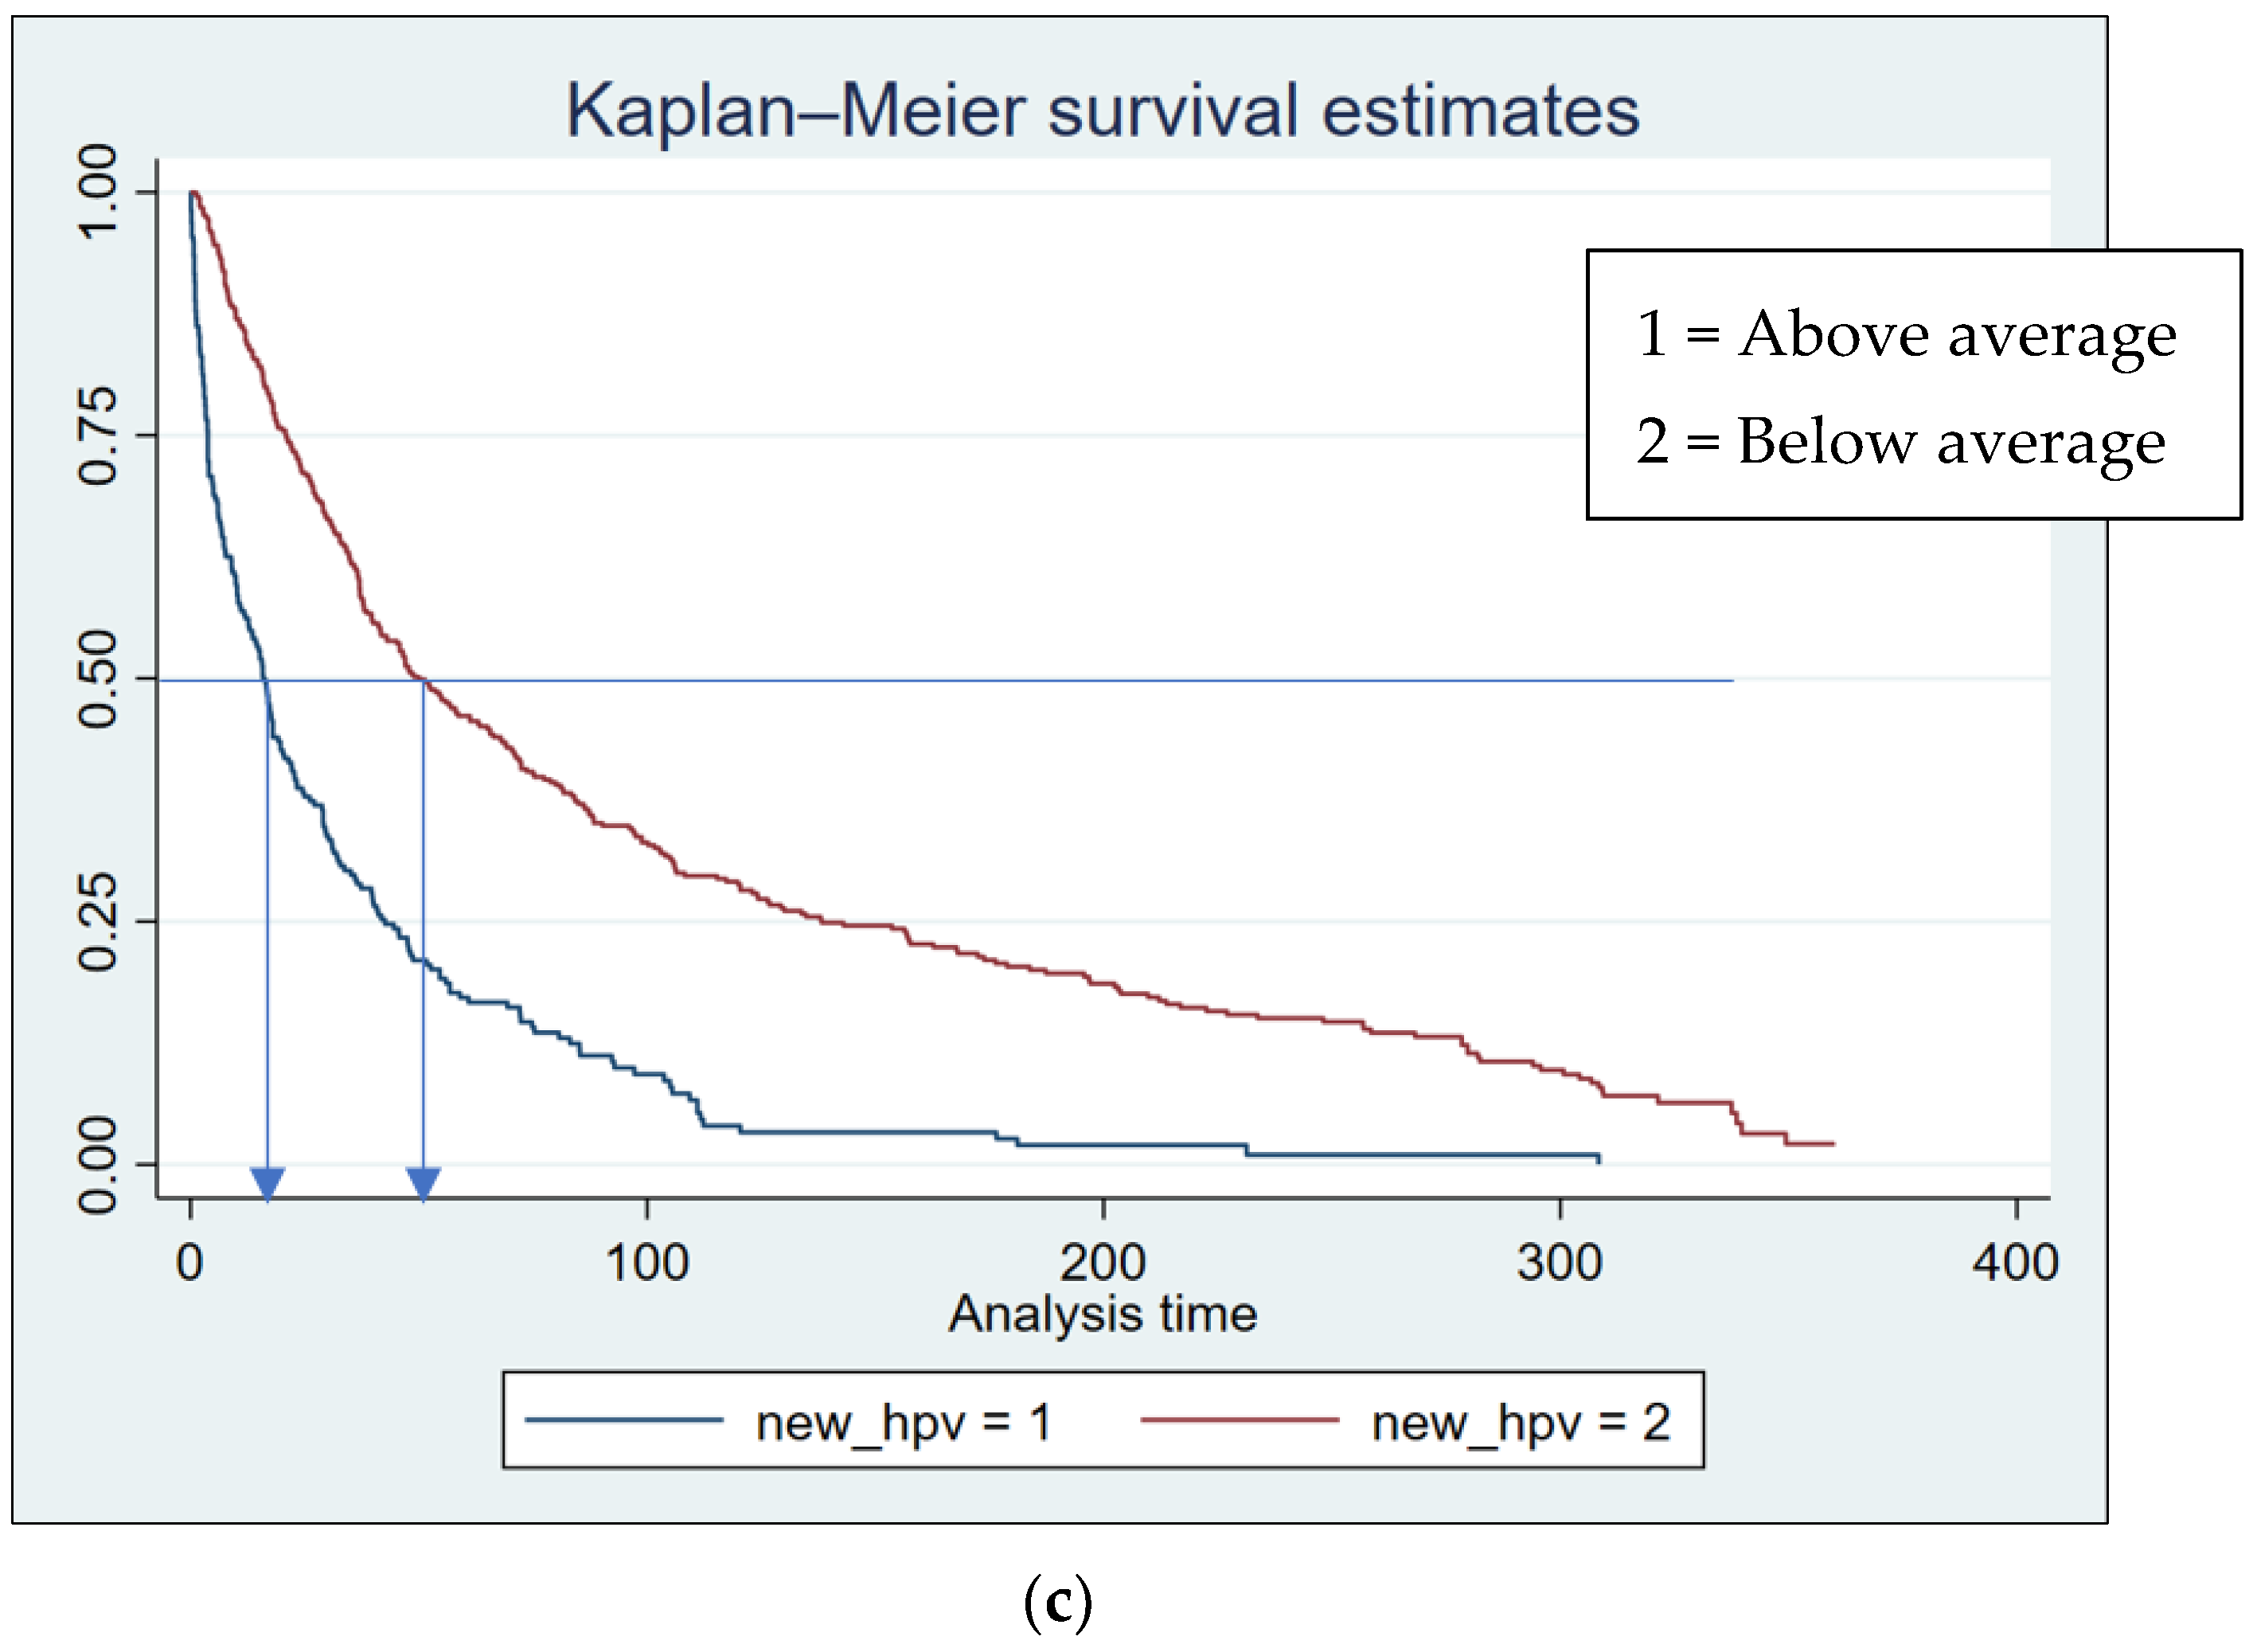
Figure 1c shows that, for the clustered MPE hours/visit groups, the locations that experienced a higher ratio of the deployed MPE hours to visits have a higher survival probability than the below-average locations.
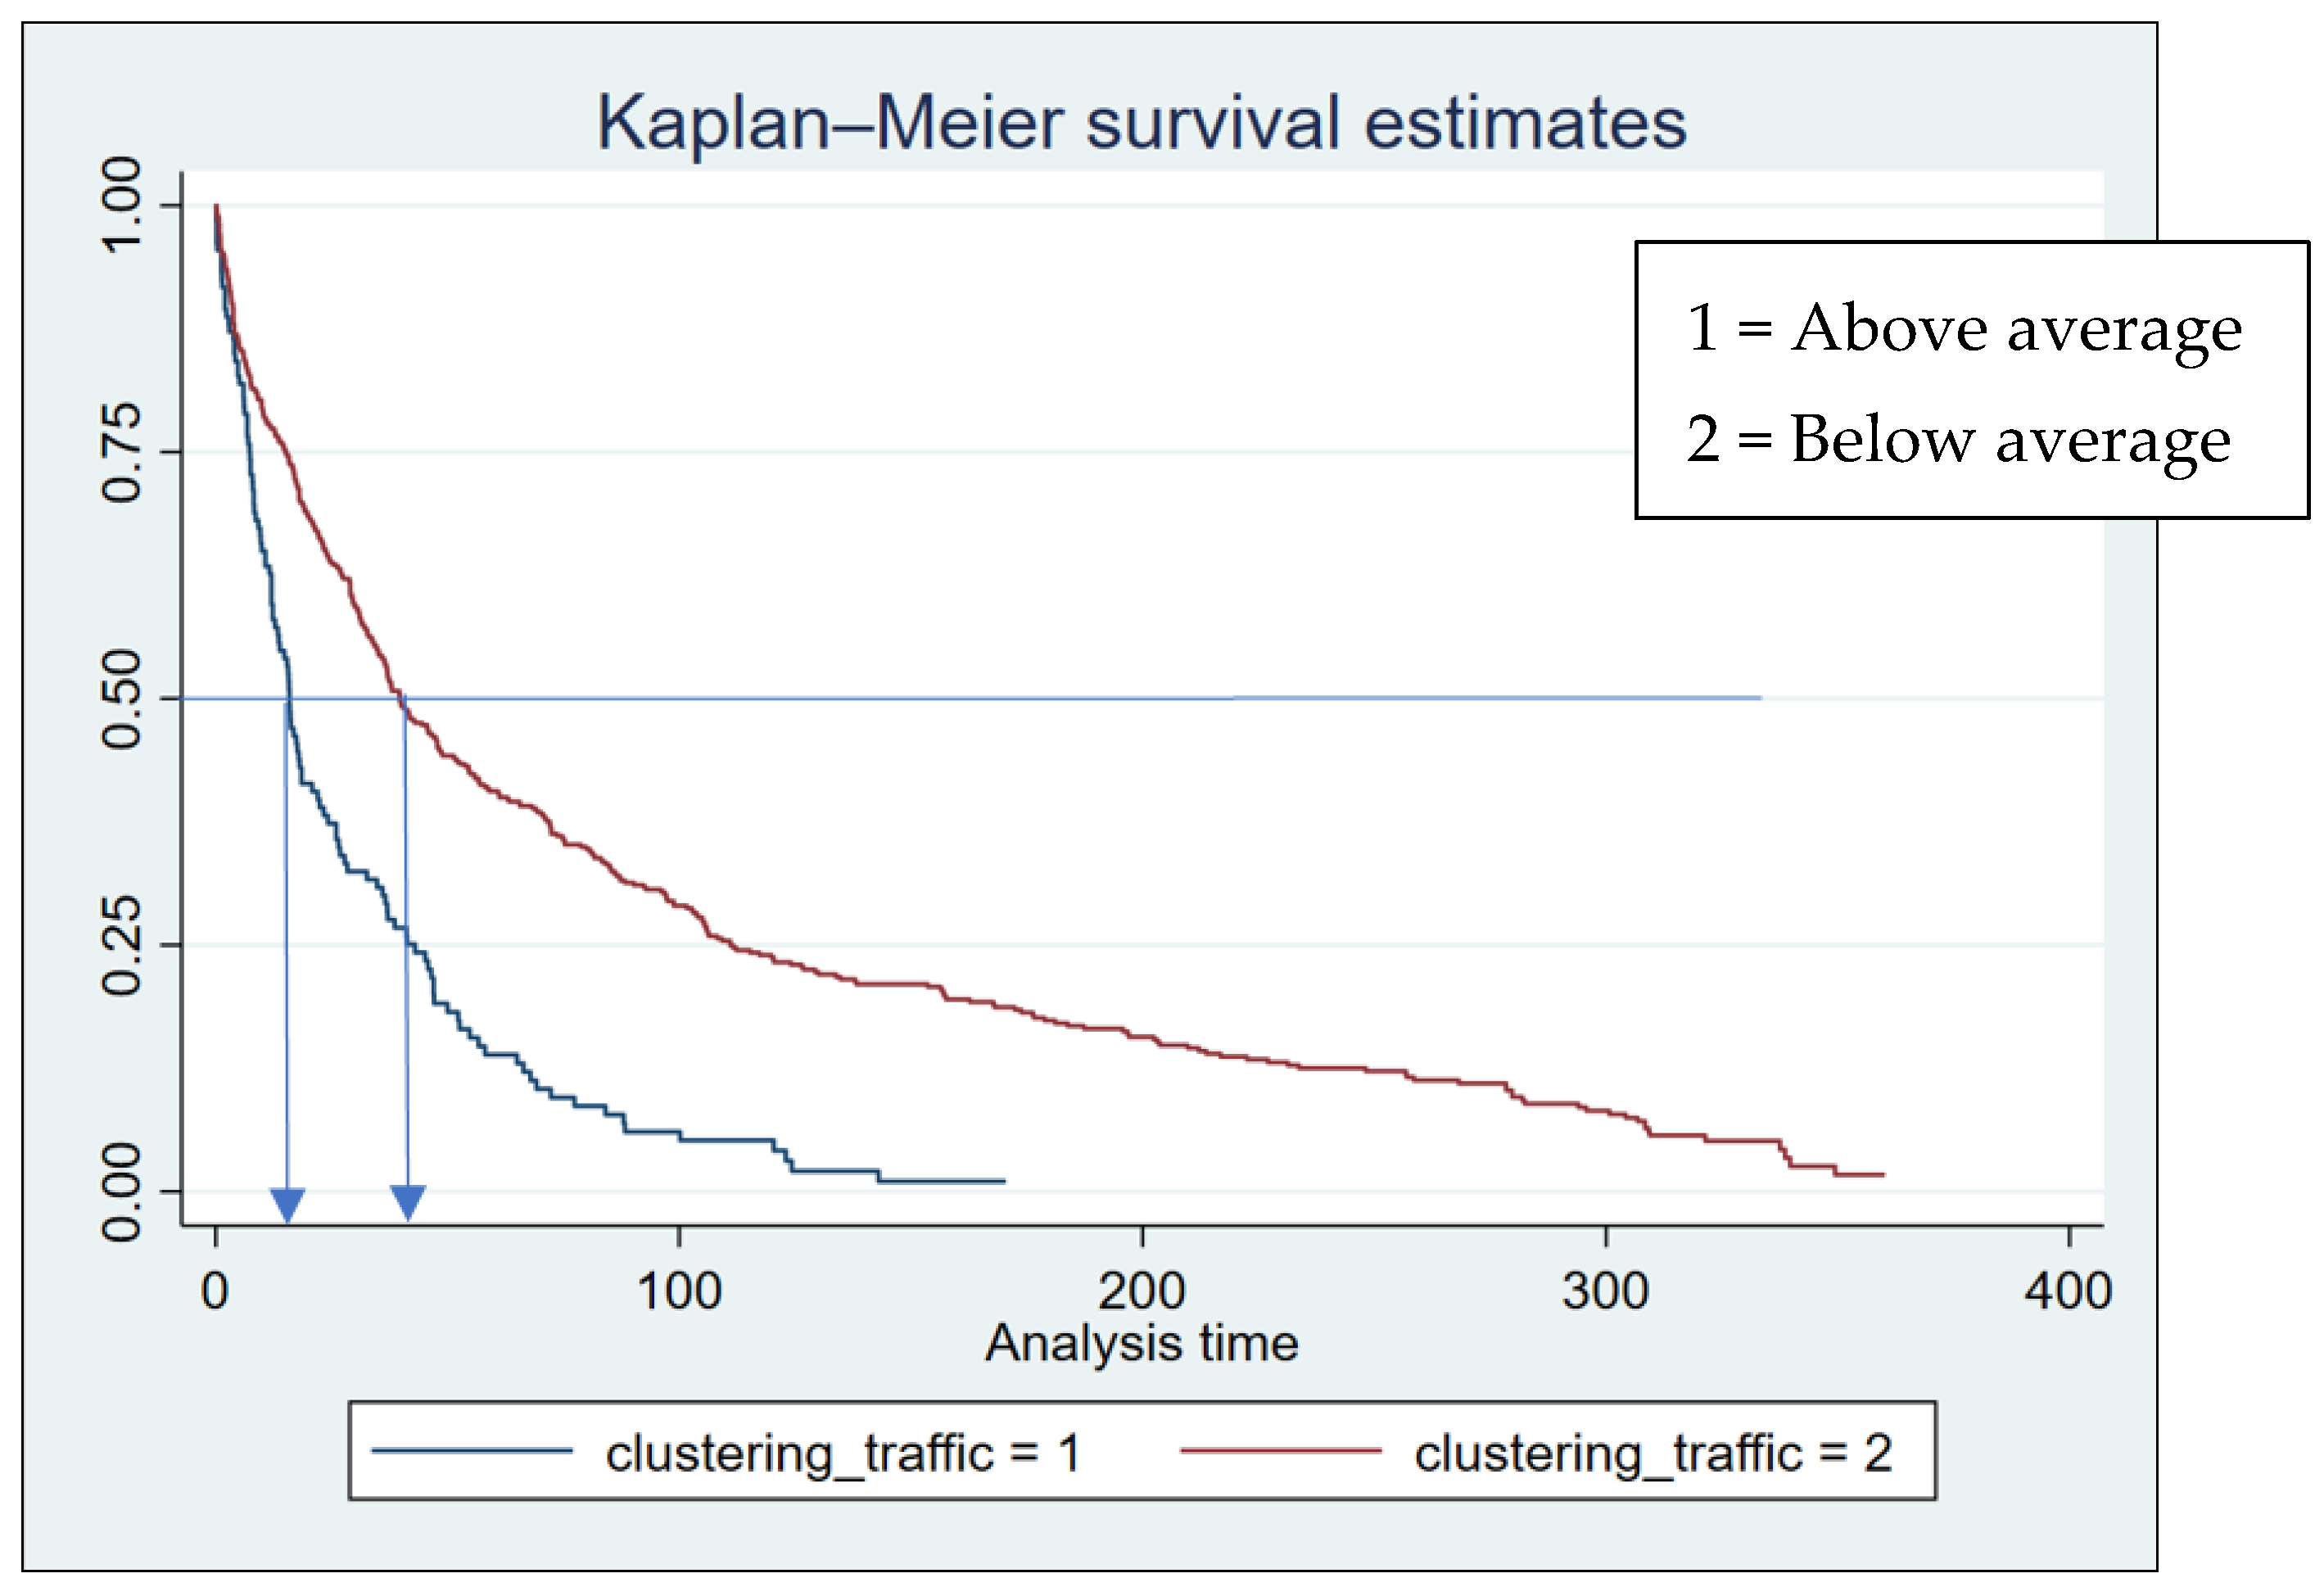
Figure 2 illustrates that above-average traffic volume locations have higher survivability than below-average sites. This difference may be because drivers tend to speed up, exceeding speed limits, when roadways have less or no congestion.
The log-rank tests were conducted to establish whether the two groups have the same survivability (i.e., null hypothesis) and whether they comply with the results from the K-M graphs. Thus, if the
p-value is less than 0.05, the tested groups do not have the same survival probability. As shown in
Table 2, all the tested groups had
p-values < 0.05, confirming the previous results of the K-M graphs.
5.2. Analysis Involving Only ‘Arterial and Collector Roads’
This subsection only analyzes the arterial and collector sites. We tested this category to examine the impact of MPE on the main roadway categories. There were 111 arterial and collector sites available in 2019, and these locations had 566 collisions.
The outcomes of the Cox PH models provide approximately the same results as those when all sites were used. The results for all the MPE variables are significant at a 95% confidence interval and had HR values less than 1, reflecting the positive impact of the deployed MPE variables. The HR for the deployed MPE hours/visit surpassed the other MPE variables, reducing collision occurrence by 22%.
The K-M survival estimates for the arterial and collector locations yielded the same conclusion as the results for all sites and followed similar trends. For instance, locations that experienced above-average MPE hours, visits, or HpV possessed a higher survival probability than the below-average category. In addition, the below-average traffic volume locations were at higher risk of collision occurrence.
The log-rank tests examined the equity of the survival probability for the clustered groups. The p-values for all tests were significant (i.e., p-value < 0.05). Thus, the log-rank test results compare favorably with the outcomes of the K-M graphs.
5.3. Analysis of ‘Arterial Sites Only’
We tested the arterial sites separately to examine the impact of the MPE variables. Sixty-four arterial sites recorded 436 collisions in 2019.
The results of the Cox PH models showed that the MPE variables had a proactive effect on collision occurrence compared to the locations not exposed to MPE deployment. For example, the deployed MPE hours/visit HR was 0.78, which means an expected reduction in the risk of collision occurrence of 22%.
The K-M survival graphs emphasize the conclusion that the higher the level of deployed MPE, the less the risk of collision occurrence. To illustrate, locations with above-average MPE hours had an average survival probability of 231 days, while below-average sites survived for an average of 27 days. In other words, the below-average MPE locations experienced more frequent collisions. Moreover, the survival probability for above-average traffic volume locations was higher than for below-average traffic volume sites, possibly due to changes in drivers’ propensity for speeding that otherwise may lead to a speeding-related collision.
Furthermore, the log-rank tests examining the survival probability equity for the two groups were significant, as the p-values were less than 0.05 for all the test groups. Therefore, the survival probabilities for each of the two tested groups were not equal, both proving and matching the previous results of the K-M graphs.
5.4. Analysis of ‘Collector Sites Only’
This section examines the effectiveness of the deployed MPE variables to explore the impact on collector roads. Forty-eight collector sites had 134 collisions in 2019.
The analysis of the collector site data showed that the MPE variables’ impact on the duration between collisions increased compared to the other categories (i.e., all sites, arterials and collectors, and arterials-only groups). For instance, the deployed MPE hours/visit variable had an HR of 0.65. Therefore, the consequence of accounting for the MPE hours/visit is a reduction in the risk of collision occurrence by 35%.
The K-M graphs results provided the same summary previously explained for different categories. For example, the median survival probability (at 0.5 on the Y-axis) for above-average MPE hours/visit locations is 265 days, compared to 34 days for the sites in the below-average group. Moreover, the K-M graph for the traffic volume clusters intersects at many points and yields almost the same survival probability over the year, indicating that the traffic volume does not impact the survival probability for the collectors’ sites. In other words, the traffic volume is not a factor affecting collector roadways’ survival probability.
The log-rank tests were not significant for all groups (i.e., p-value > 0.05 in one case). For instance, a p-value < 0.05 for the MPE hours, visits, and hours/visit groups indicates that these groups have different survival probabilities. However, as expected, the p-value was greater than 0.05 for the traffic volume groups, yielding the same results as the K-M graphs. This indicates that the null hypothesis was not rejected, and both traffic volume clusters have similar survival probability.
5.5. Analysis Based on Levels of Traffic Exposure ’High-Traffic Volume Locations’
Sites were further classified based on traffic volume. Ten high-traffic volume sites experienced 133 collisions in 2019. These sites were all arterial roadways.
The procedure’s outputs for the high-traffic volume sites indicated that the different MPE variables impacted the duration between two consequent collisions. All MPE variables significantly correlated with the period between collisions. The ratio of deployed MPE HpV significantly influenced collision occurrence. The hazard ratio for this variable is 0.48, indicating a 52% reduction in the risk of a collision. Moreover, the deployed MPE hours and visits had an HR of 0.97 and 0.91, respectively, reflecting a 3% and 9% decrease in collisions by implementing MPE hours and visits, respectively. These results confirm the previous conclusion that deploying MPE visits is more effective than deploying MPE hours.
The K-M charts showed that above-average MPE sites had a higher survival probability than below-average MPE sites. Notably, when the survival probability was at 0.5 on the Y-axis, the above-average MPE hours group was 91 days, while the below-average group was 15 days. Similarly, the survivability for the above-average MPE hours/visit cluster is at an average of 21 days, and the below-average is 1 day. This result demonstrates that higher MPE hours, visits, or hours/visit are linked to higher survivability and lower risk of collision, along with longer intervals between two consequent collisions.
Concerning the log-rank test results, the equity tests were significant for all groups. The p-value value was less than 0.05, which means the null hypothesis was rejected, and the clusters for each group have different survival probabilities. These results support the K-M graphs by providing the same conclusion.
5.6. Analysis Based on Levels of Traffic Exposure ’Low-Traffic Volume Locations’
One hundred and four low-traffic volume sites had 450 collisions in 2019. The categories of these sites varied between arterials, collectors, and locals, with a balanced presence of both arterial and collector categories.
The Cox PH models for the below-average traffic volume sites showed that the deployed MPE hours, visits, and HpV significantly reduced the collision risk. For instance, the ratio of deployed MPE hours to visits had the highest impact on collision rates, with an HR of 0.7, which means a 30% reduction in the risk of collisions when considering the MPE HpV. Moreover, the deployed MPE visits had a higher positive impact than MPE hours since they reduced the collision risk by 3%.
The clustered groups of MPE hours, visits, and HpV have different survivability in the K-M graphs. For example, the survival probability for the above-average MPE hours is 257 days, compared to 45 days for the below-average group. In addition, there is similar survivability for the deployed MPE-visit groups. Furthermore, for the HpV MPE clusters, the above-average sites survived for 138 days on average. On the other hand, the below-average sites survived for an average of 24 days.
The log-rank tests were significant for all variable groups. The p-values for MPE hours, visits, and HpV clusters are zero, emphasizing these groups’ different survivability. These results match the outcomes of the K-M graphs.
5.7. Analysis of ‘Speeding-Related Collisions Only’
In 2019, 217 speeding-related collisions were recorded. The results of the speeding-related collisions proved that deploying a higher rate of hours to visits increased the period between two consequent collisions, decreasing the probability of collision occurrence. However, comparing the results of all site analyses, the speeding-related collisions show that the deployed MPE is more effective on these specific collision causes. For instance, the MPE HpV’s HR for speeding-related collisions is 0.67, which means a 33% reduction in the risk of collision occurrence by accounting for the MPE HpV ratio. On the other hand, the HR for all collisions is generally 22%.
The K-M graphs showed that the average survival probability for above-average MPE hours or visits sites is 220 days, while it is 17 days for below-average MPE locations. This difference means that the survivability for the above-average MPE hours or visits sites is more than ten times higher than that of the below-average MPE sites. For the deployed MPE hours/visit, the survival probability for the below-average site group is ten days, compared to forty-five days for the above-average MPE hours/visit sites.
Moreover, the log-rank tests are proof of the K-M graphs’ results. The p-values for all the clustered groups are less than 0.05, reflecting that these clusters do not have the same survivability. For instance, the p-value equals 0.0026 for the MPE hours per visit clusters. Thus, these results comply with the K-M graphs.
5.8. Survival Analysis Results (2018, 2017, 2016, and All Years)
The methodology was applied separately to each year (2018, 2017, and 2016) and then integrated into one overall time period. The results for each year and the combined years yield the same conclusion. The findings were that the MPE variables considerably impact collision occurrence, whereby there is an increase in the time between two collisions and a corresponding decrease in collision risk. To summarize the results, the positive impact of increasing the number of MPE visits appears to be more significant than increasing the number of deployed MPE hours. Moreover, the ratio between MPE hours to visits has demonstrated the most influence on reducing the hazard of collision occurrence. By applying the analysis procedure to different road categories and traffic volume classifications, the outcomes of these processes provided similar results to those for the 2019 analysis.
Table 3 summarizes the hazard ratio for the optimal MPE variable (i.e., hours/visit) for all years.
6. Discussion
The comprehensive analysis undertaken in this study sheds light on the significant impact of MPE variables on collision occurrence and road safety across various road categories and traffic volumes in the City of Edmonton. The examination of collision data, spanning from 2016 to 2019, excluding the exceptional circumstances of the COVID-19-affected year 2020, revealed compelling insights.
K-means clustering facilitated the categorization of sites based on critical variables, such as the number of hours, visits, the ratio of hours per visit, and the traffic count. The selection of two clusters, representing above-average and below-average groups, emerged from meticulous testing and observation. The decision to opt for two clusters instead of three, as initially considered, was driven by the realization that the high and intermediate clusters exhibited similar findings during analysis, leading to a more nuanced classification of sites into above-average and below-average categories.
The subsequent application of survival analysis, particularly the Cox proportional hazards model, provided a robust framework for investigating the temporal dynamics of collision occurrence. By defining the failure event as a collision occurrence, the study explored the relationship between the MPE variables (number of hours, number of visits, HpV) and the duration between two consecutive collisions. Using survival functions, hazard ratios, and log-rank tests facilitated a nuanced understanding of how MPE variables influenced the time-to-event occurrence.
The results consistently highlighted the efficacy of MPE in enhancing road safety. The K-means clustering and survival analysis consistently pointed towards the positive impact of MPE variables, with the ratio of MPE HpV emerging as a particularly influential factor. This finding underscores the importance of deploying MPE resources and optimizing the distribution of MPE hours across visits to maximize effectiveness.
The categorization of sites based on the traffic volume and road categories further enriched the analysis. Arterial and collector roads exhibited similar trends, with above-average MPE variables associated with higher survivability and lower collision risk. Examining low-traffic volume sites revealed a significant reduction in collision risk, emphasizing the broad applicability of MPE benefits across diverse road conditions.
Speeding-related collisions provided an interesting focus, showcasing that MPE variables, especially the HpV ratio, were pivotal in reducing collision risks associated with this specific cause. The differential impact observed in speeding-related collisions compared to the general collision dataset underscores the nuanced effectiveness of MPE in addressing particular safety concerns.
When the analysis was extended to different years (2016–2019), the consistency in the findings across individual years and the overall period reaffirmed the robustness of the observed trends. The positive effect of MPE visits remained pronounced, and the HpV ratio consistently emerged as the most influential variable.
In summary, this study provides compelling evidence that deploying MPE contributes to road safety significantly by extending the time between consecutive collisions and reducing collision risks. The nuanced exploration across various variables, road categories, and traffic volumes enhances the applicability and relevance of these findings. Policymakers and urban planners can leverage these insights to optimize MPE deployment strategies and strengthen the effectiveness of road safety measures.
7. Conclusions
The primary objective of this research was to investigate the impact of deployed MPE hours, visits, and HpV on the duration between two consequent collisions, aiming to assist authorities in effectively mitigating the issue of speeding. The results demonstrated that accounting for the ratio between hours and visits significantly increased the period between collisions and reduced collision risk. The expected reduction in the collision hazard varied between 52% and 22%, with the maximum reduction anticipated in high-traffic volume locations. Additionally, the deployed MPE HpV exhibited a more pronounced effect on collector roads than on arterial roads. Notably, the number of deployed MPE visits had a more significant impact on increasing the duration between collisions than the number of deployed MPE hours. Those planning an MPE program should consider this by providing more timing options for critical deployments.
The K-M survival estimates were plotted for different groups of MPE hours, visits, HpV, and traffic volumes. These graphs demonstrated that the groups of above-average MPE hours, MPE visits, and MPE HpV have higher survivability than the below-average ones. These results emphasize the importance of MPE deployment to reduce the risk of collisions. Additionally, the K-M survival graphs were carried out for traffic count clusters. The results showed that the above-average traffic volume locations had higher survivability than those with a below-average traffic volume, possibly because drivers tend to exceed the speed limit when the traffic flow is light. Finally, log-rank tests were undertaken, and the outputs complied with the conclusions drawn from the K-M survival estimates.
Future work could enhance the findings from this study. For instance, this research was limited to exploring the impact of one MPE variable (i.e., hours, visits, or HpV) at a time using the Cox PH model. The results, then, only show an understanding of the influence of a single variable without considering the presence of other variables. Further research can address this limitation by exploring the multivariable impact in the Cox PH model, considering the simultaneous influence of multiple variables.
Additionally, the comparison between the two groups, while informative, does not fully account for potential confounding variables that may influence traffic events, apart from the presence of MPE. Factors such as road infrastructure, driver behavior, and local regulations could vary between the MPE and non-MPE sites, potentially impacting the observed outcomes. A more robust approach would involve selecting a control group with characteristics similar to MPE sites, ensuring a more accurate assessment of causal effects. Future research endeavors could focus on refining the study design to address these concerns and enhance the validity of the conclusions.
Moreover, this study analyzed the impact of deployed MPE variables on-road collisions for different road types and conditions. However, there is a need to investigate the influence of deploying MPE on other road characteristics. For example, sites can be categorized based on the posted speed limit or classified to account for the number of lanes on roads. This classification might assist in exploring the effect of MPE variables on collisions at sites where drivers have more lanes to maneuver.
Furthermore, this research can be expanded to include the impact of deployed MPE variables on the intervals between collisions during different seasons (i.e., fall, winter, spring, and summer). This analysis could be implemented by categorizing collisions into four groups based on the occurrence season and applying the same methodology to each group. The outcomes from this proposed analysis might lead to a better understanding of the optimal timing for deploying MPE per season.


