
The Effect of Driving Style on Responses to Unexpected Vehicle Cyberattacks


Abstract
:1. Introduction
1.1. Vehicle Cybersecurity and Human Factors
1.2. Self-Reported Risky Driving Behavior
1.2.1. The Driver Behavior Questionnaire (DBQ)
1.2.2. Sensation Seeking
1.3. Research Gap and Objective
2. Materials and Methods
2.1. Participants
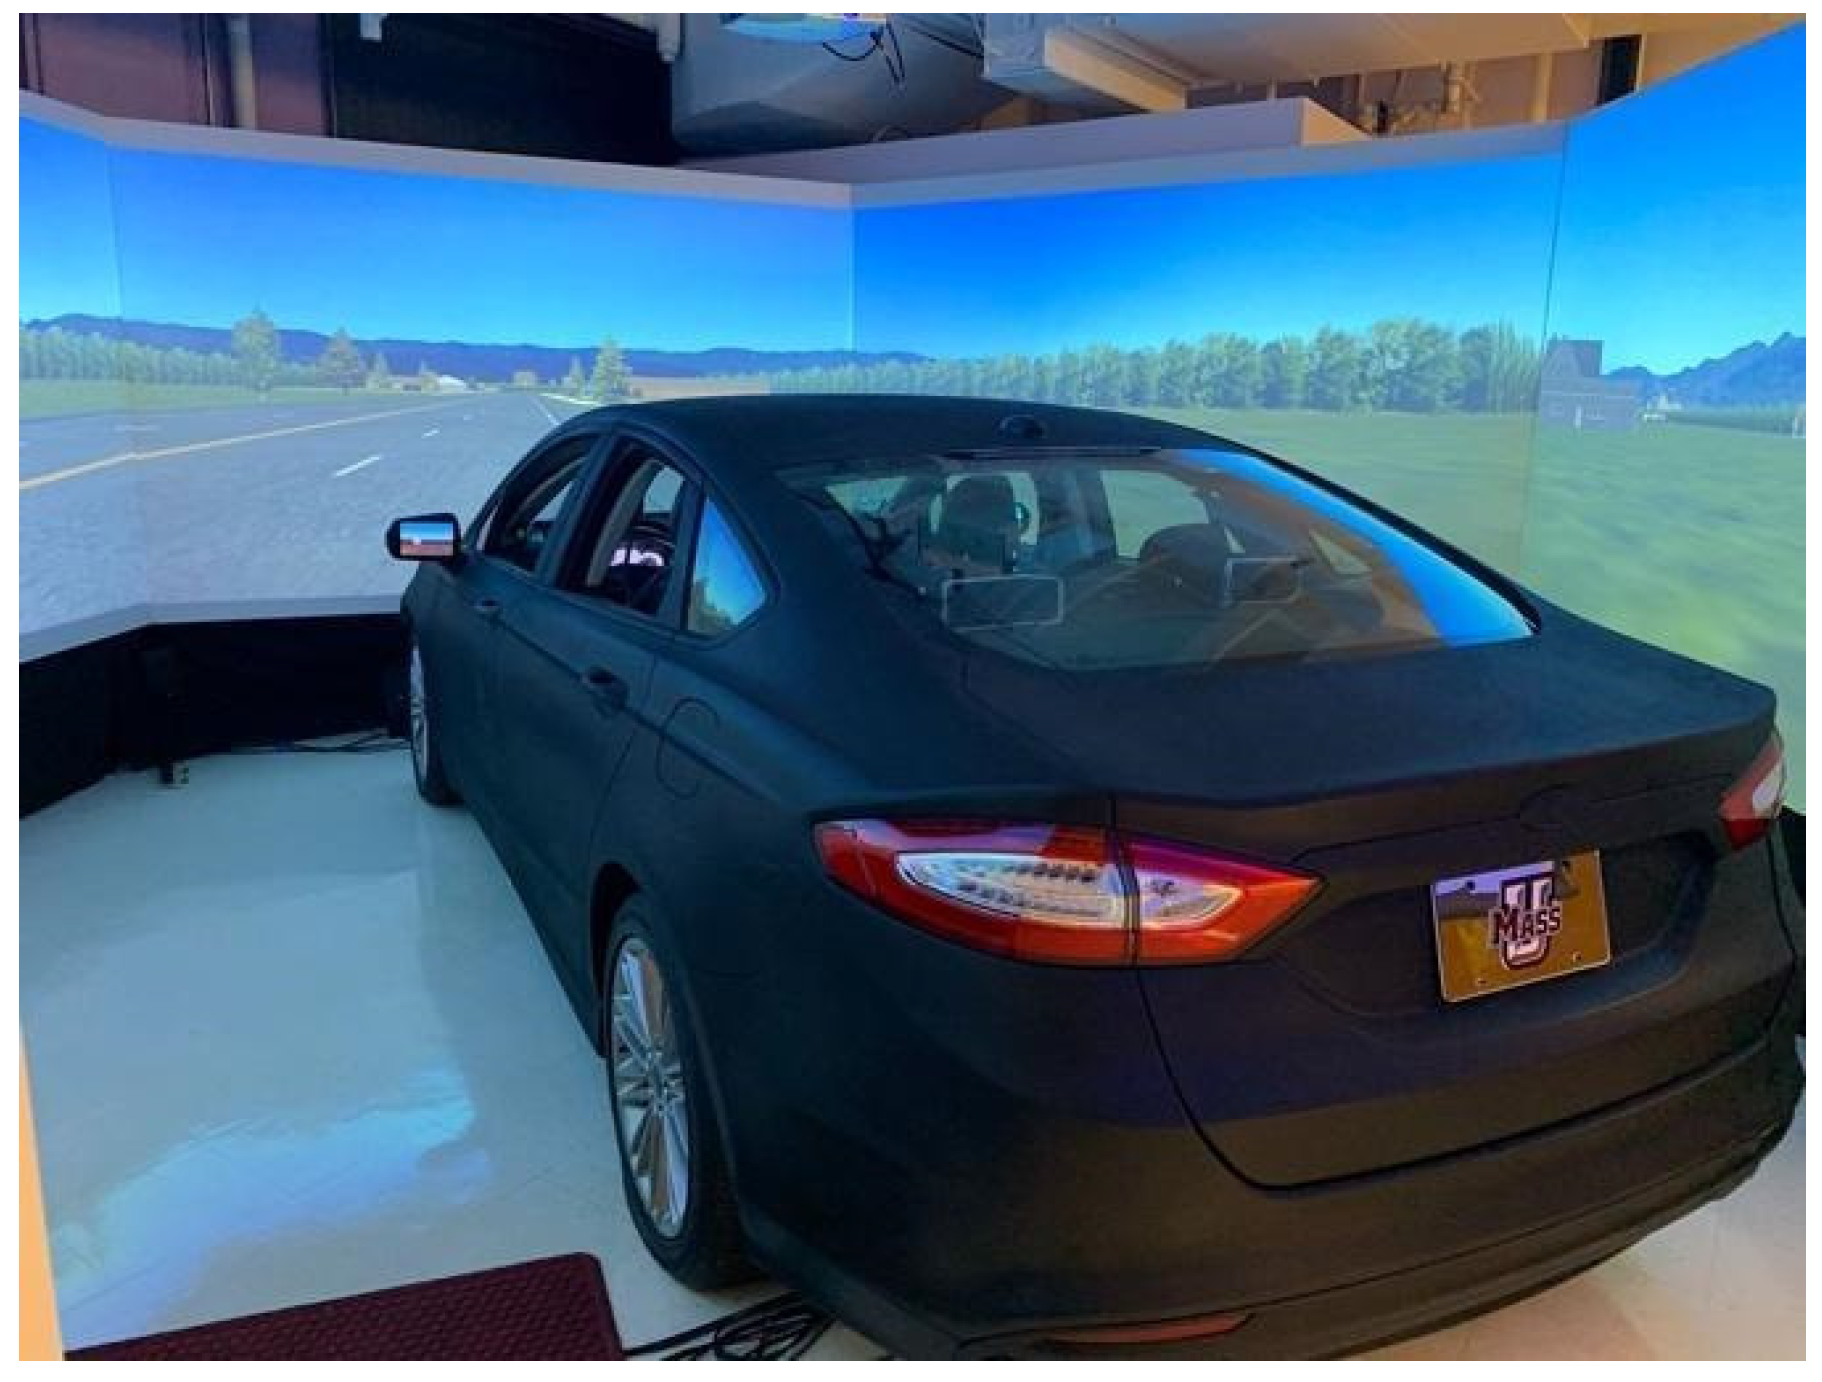
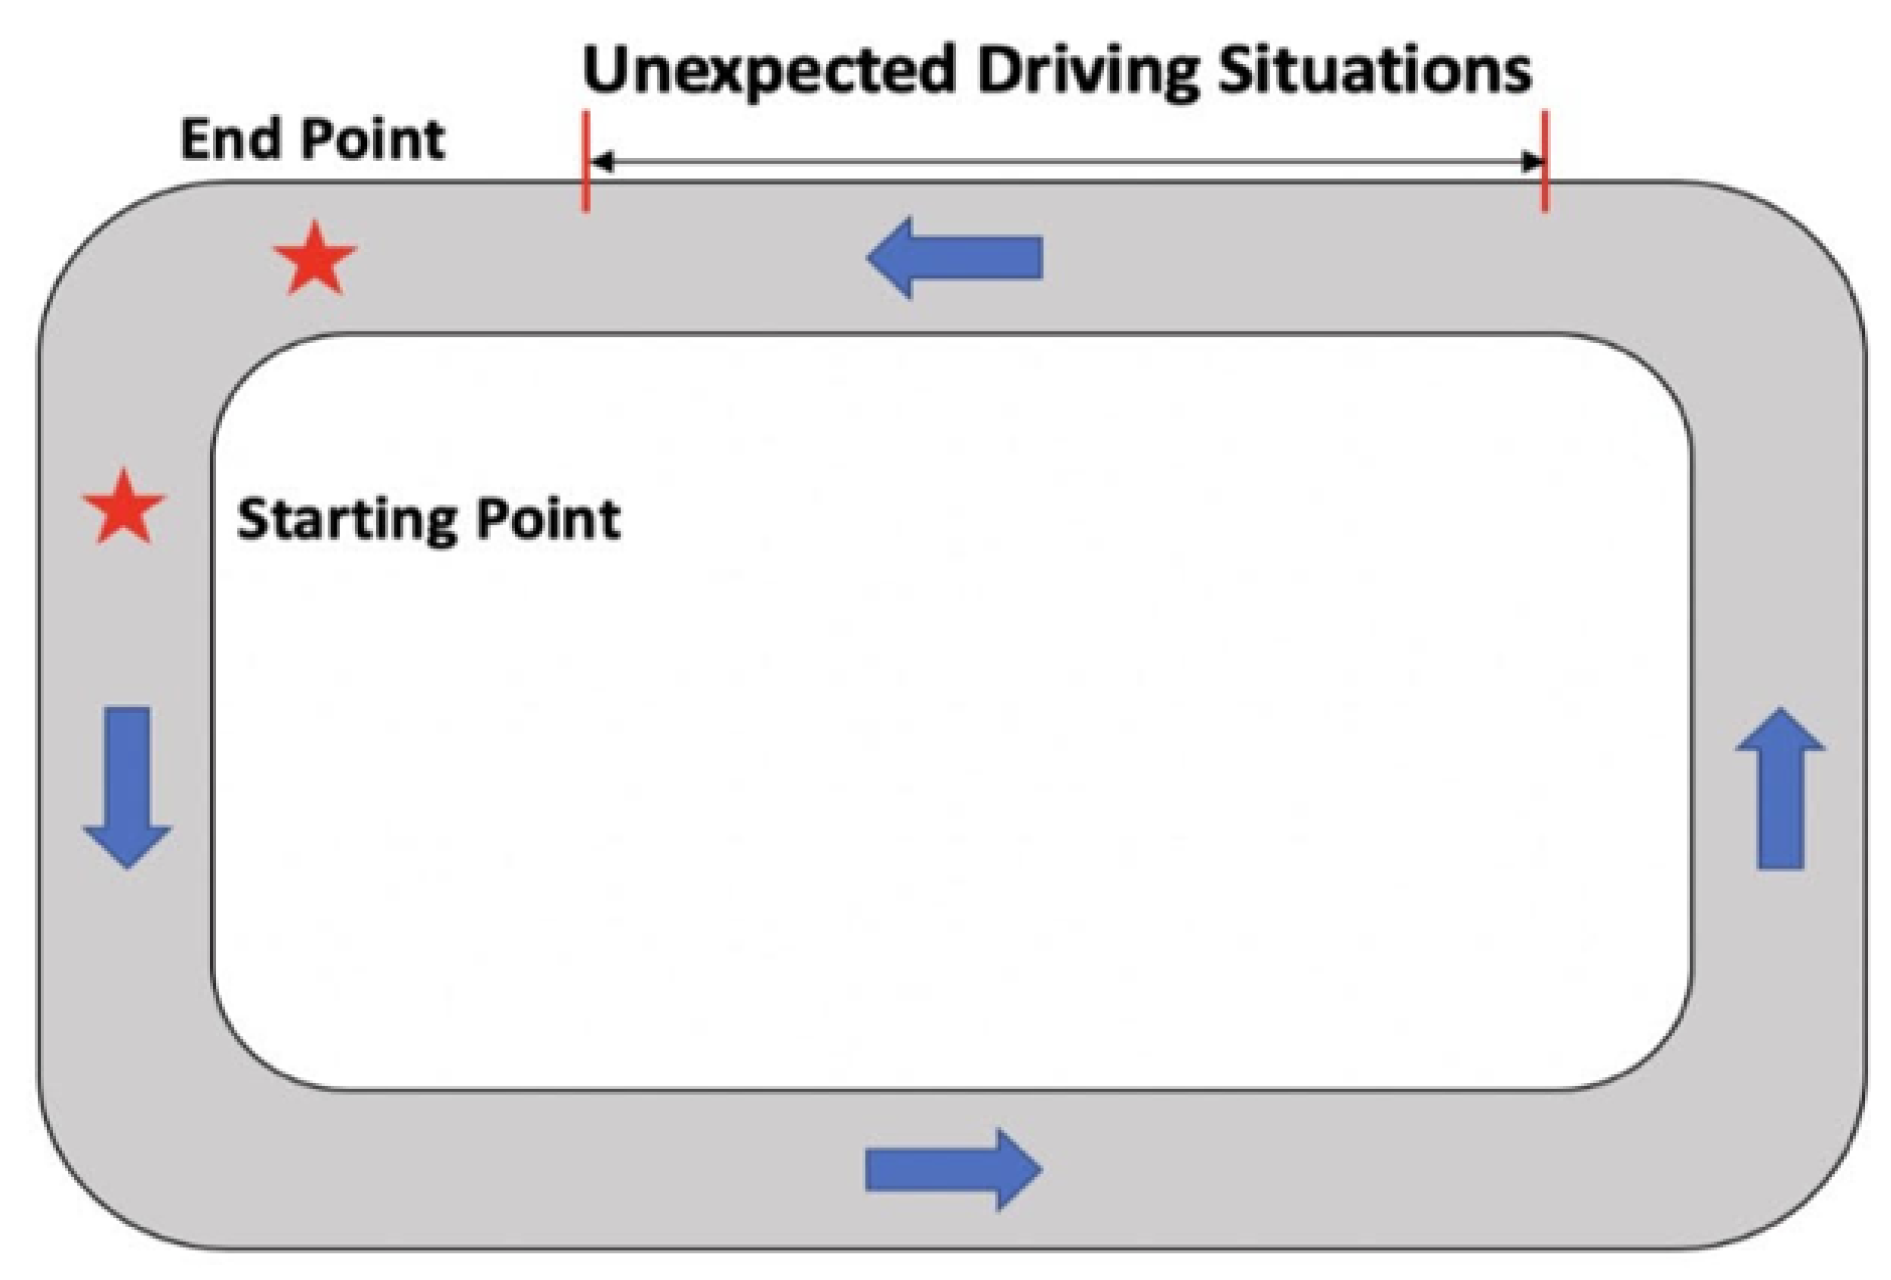
2.2. Driving Simulator and Scenarios
2.3. Procedure
2.4. Variables and Data Analysis
3. Results
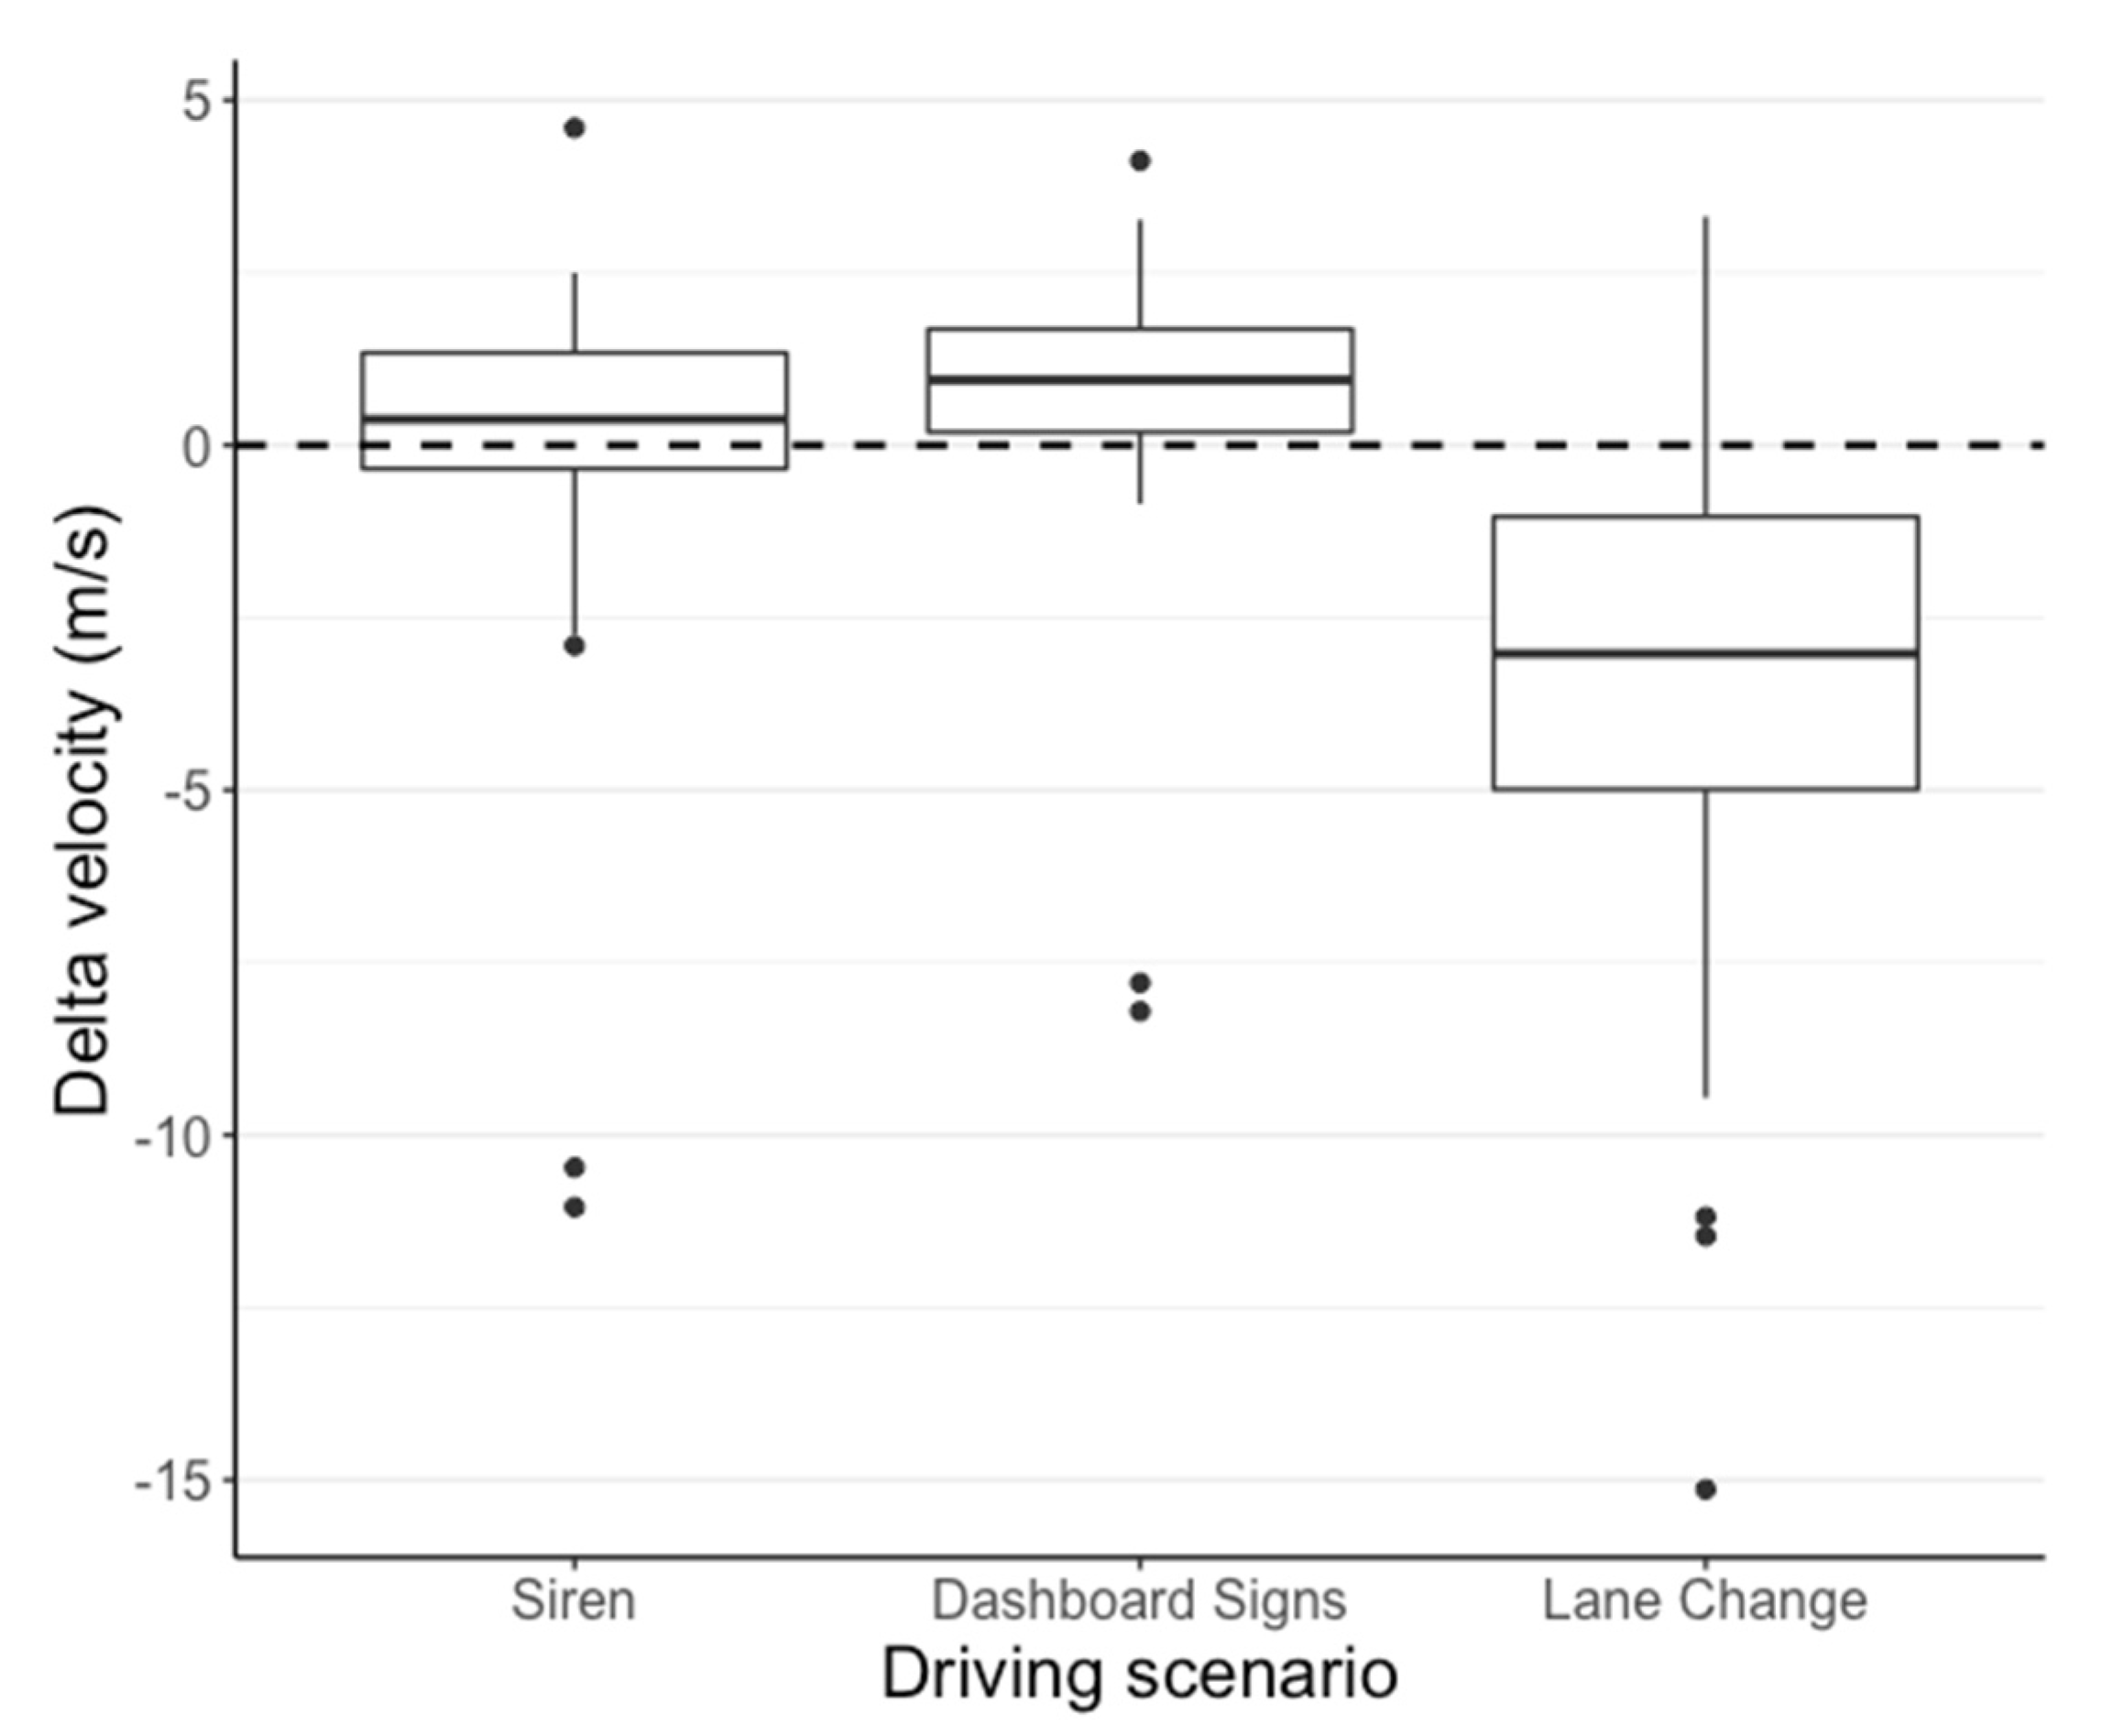
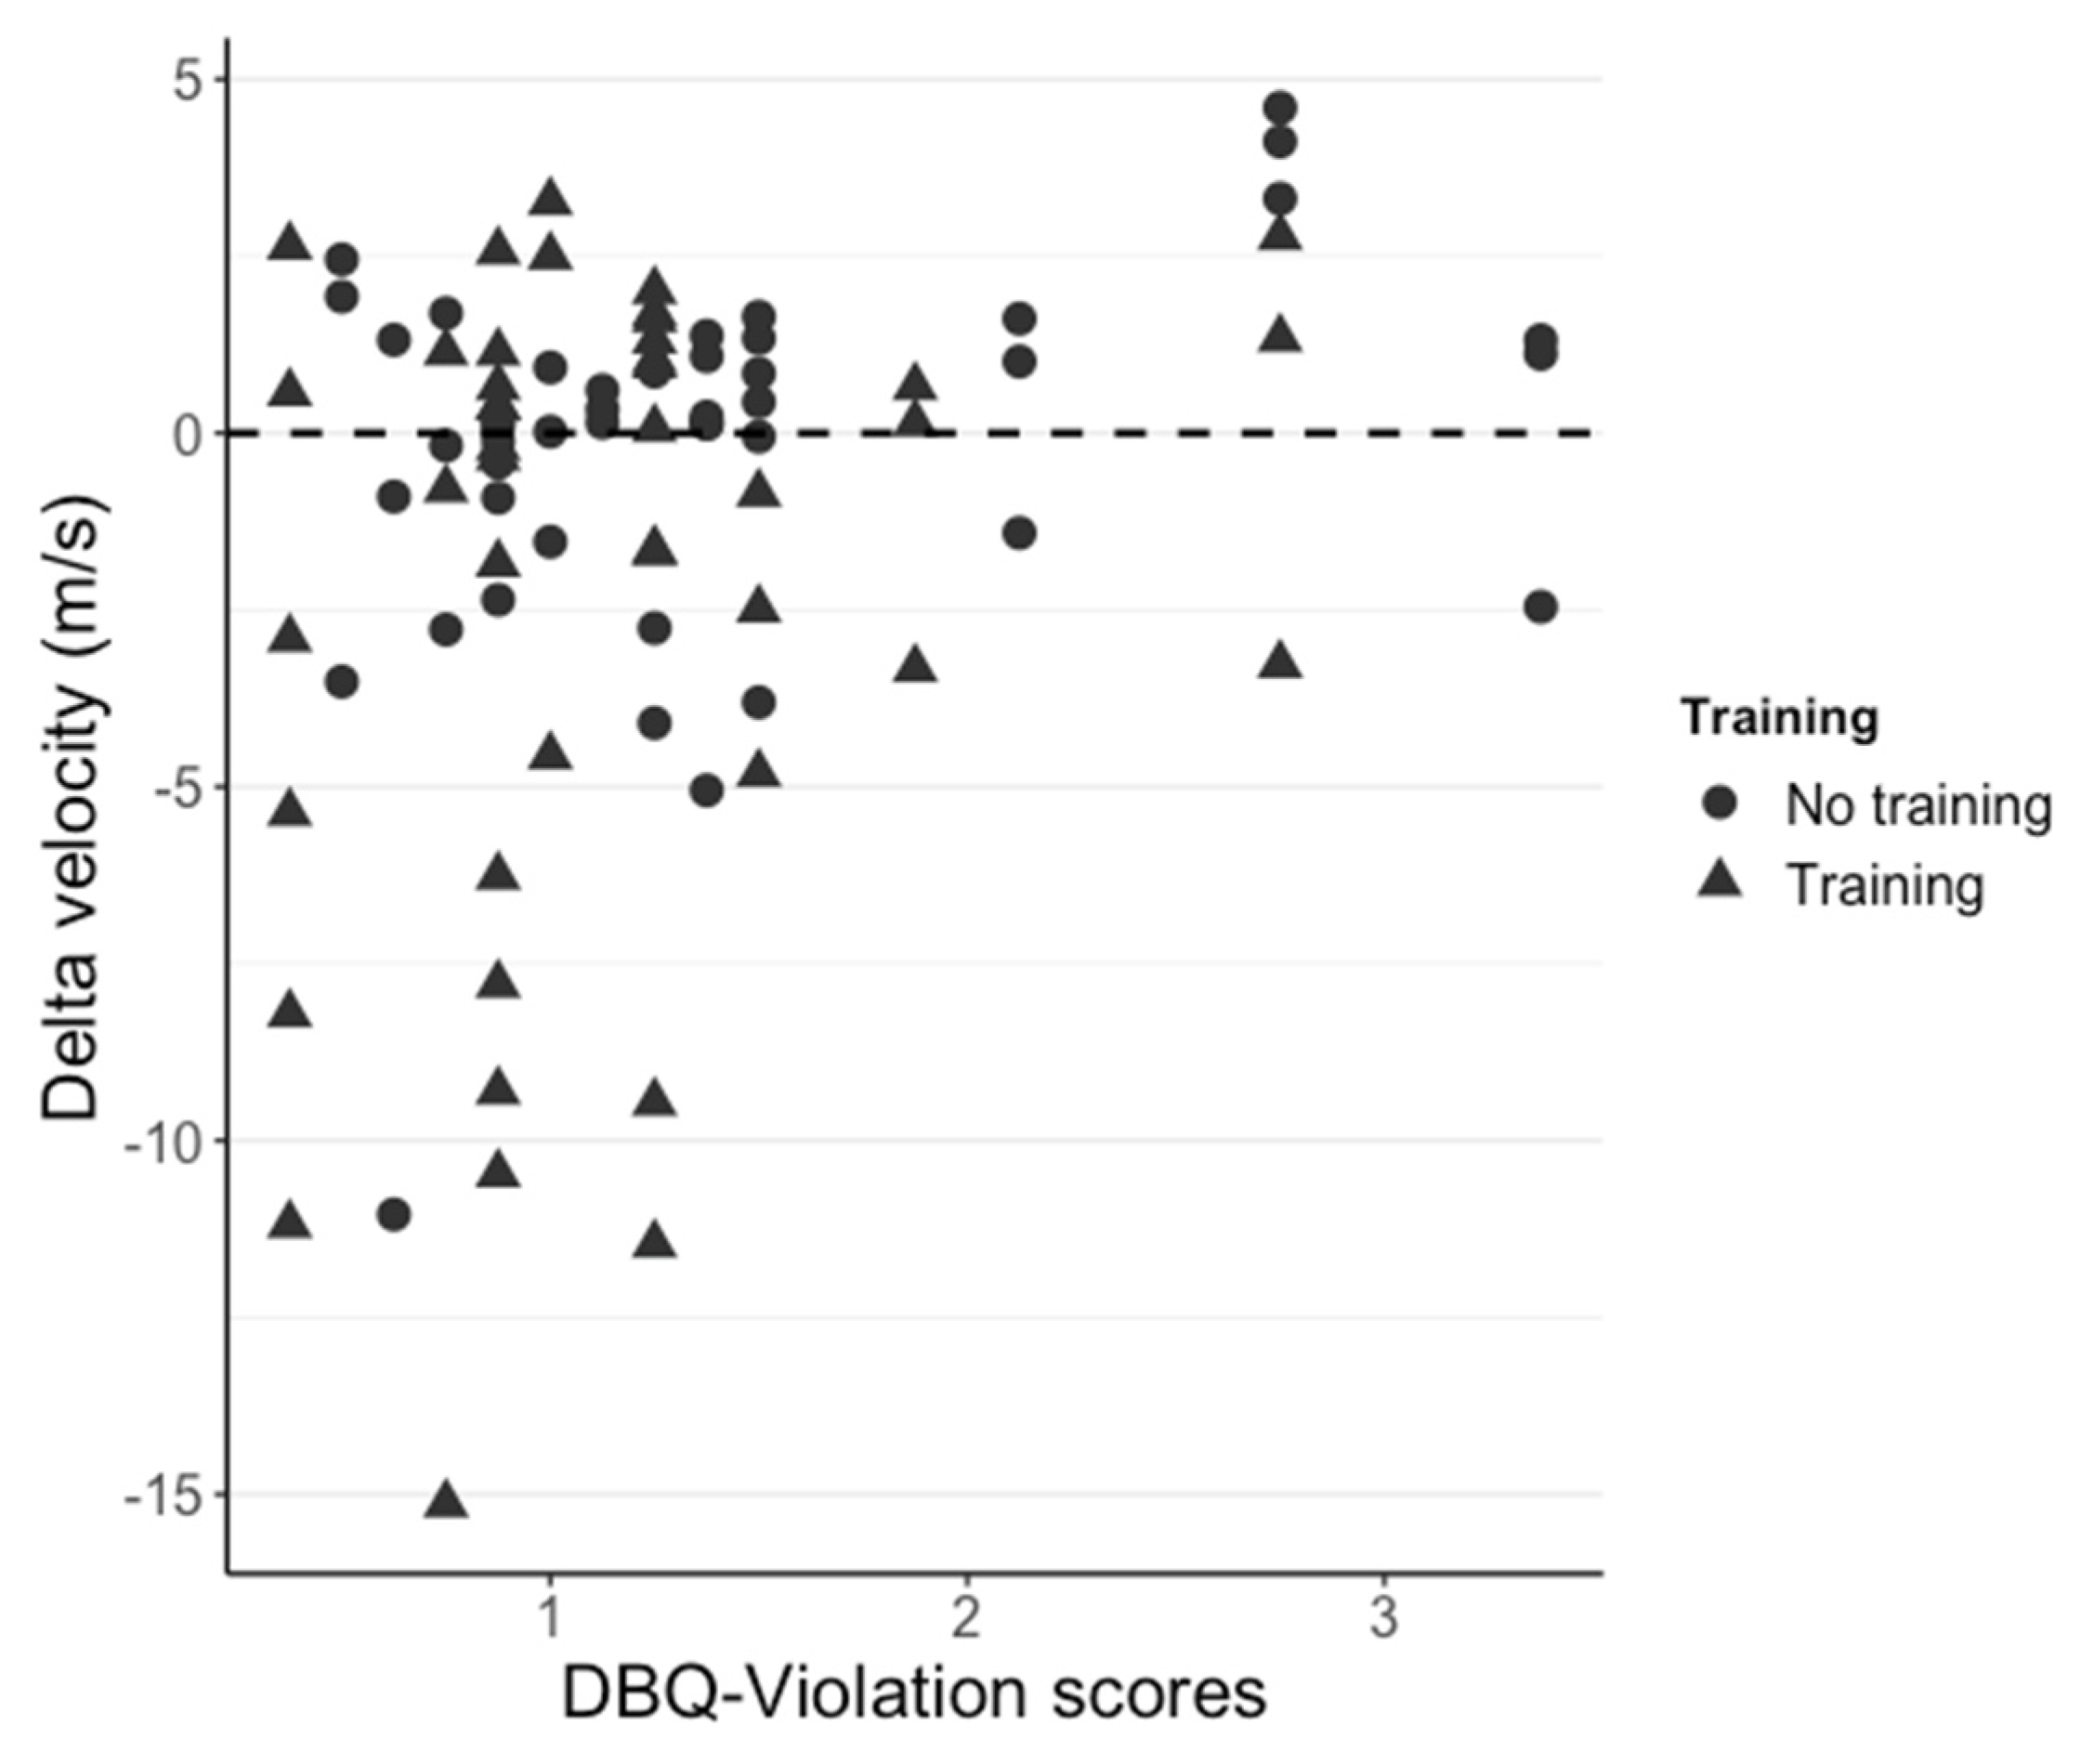
3.1. Delta Velocity
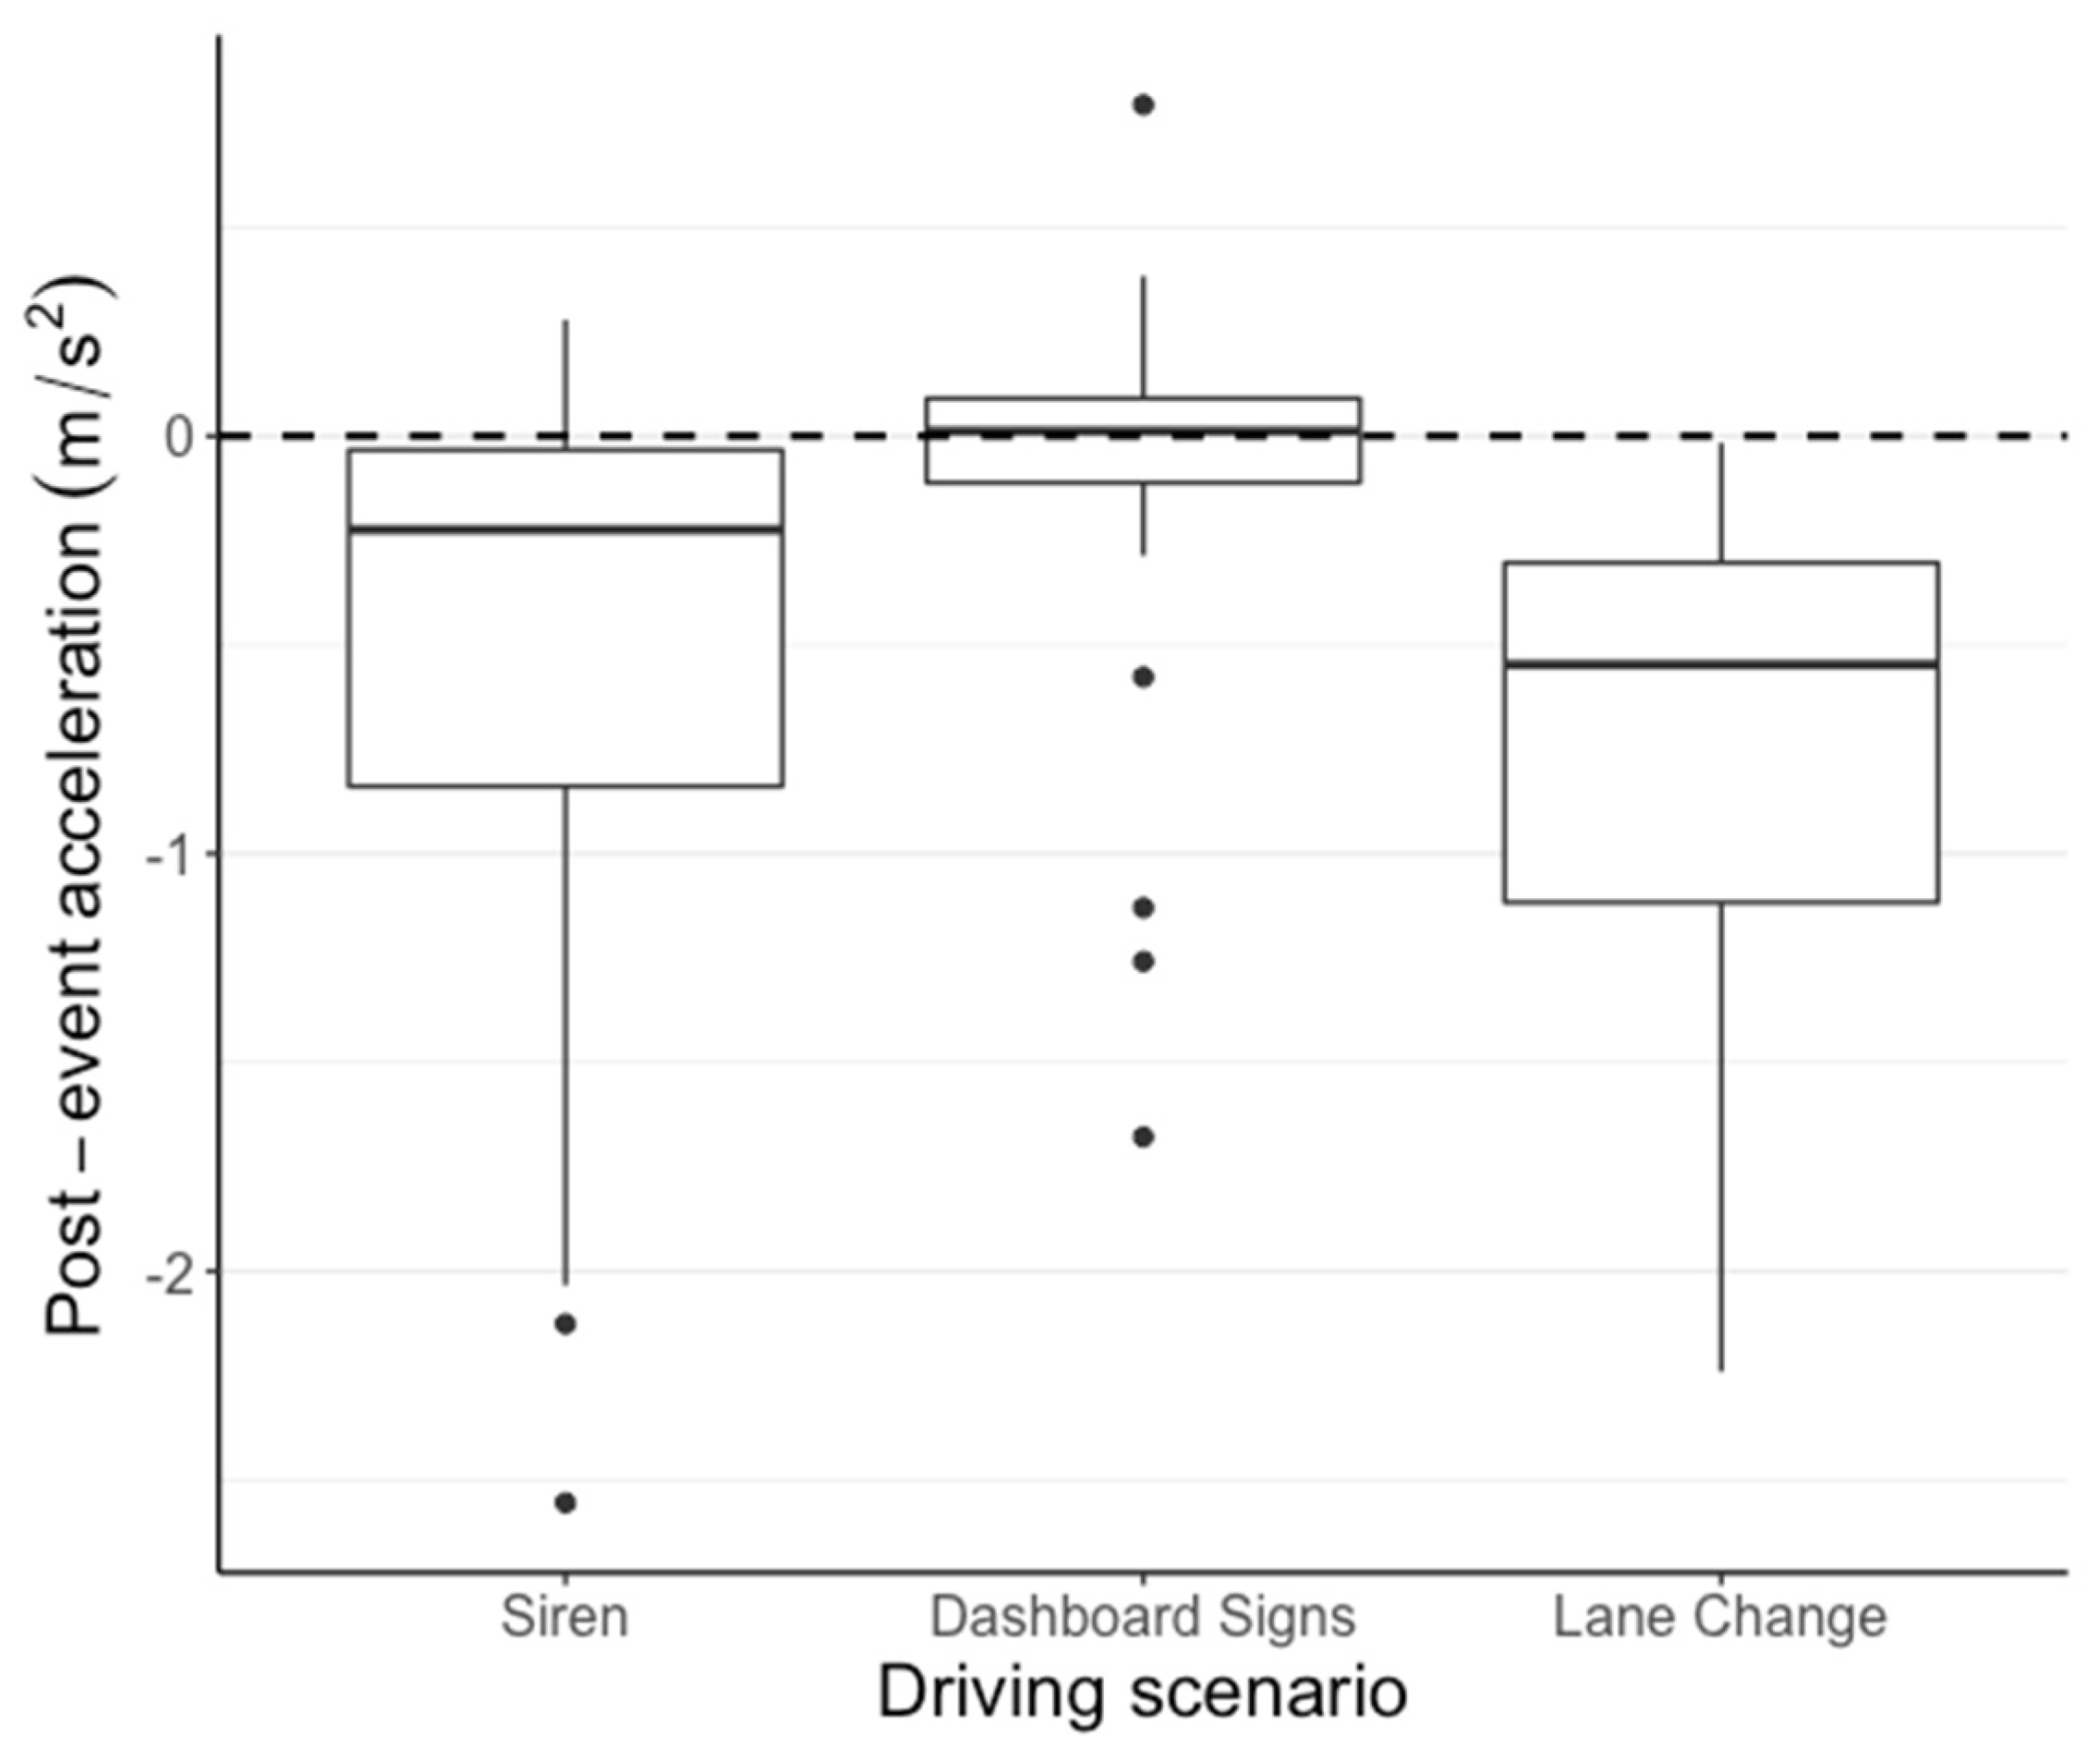
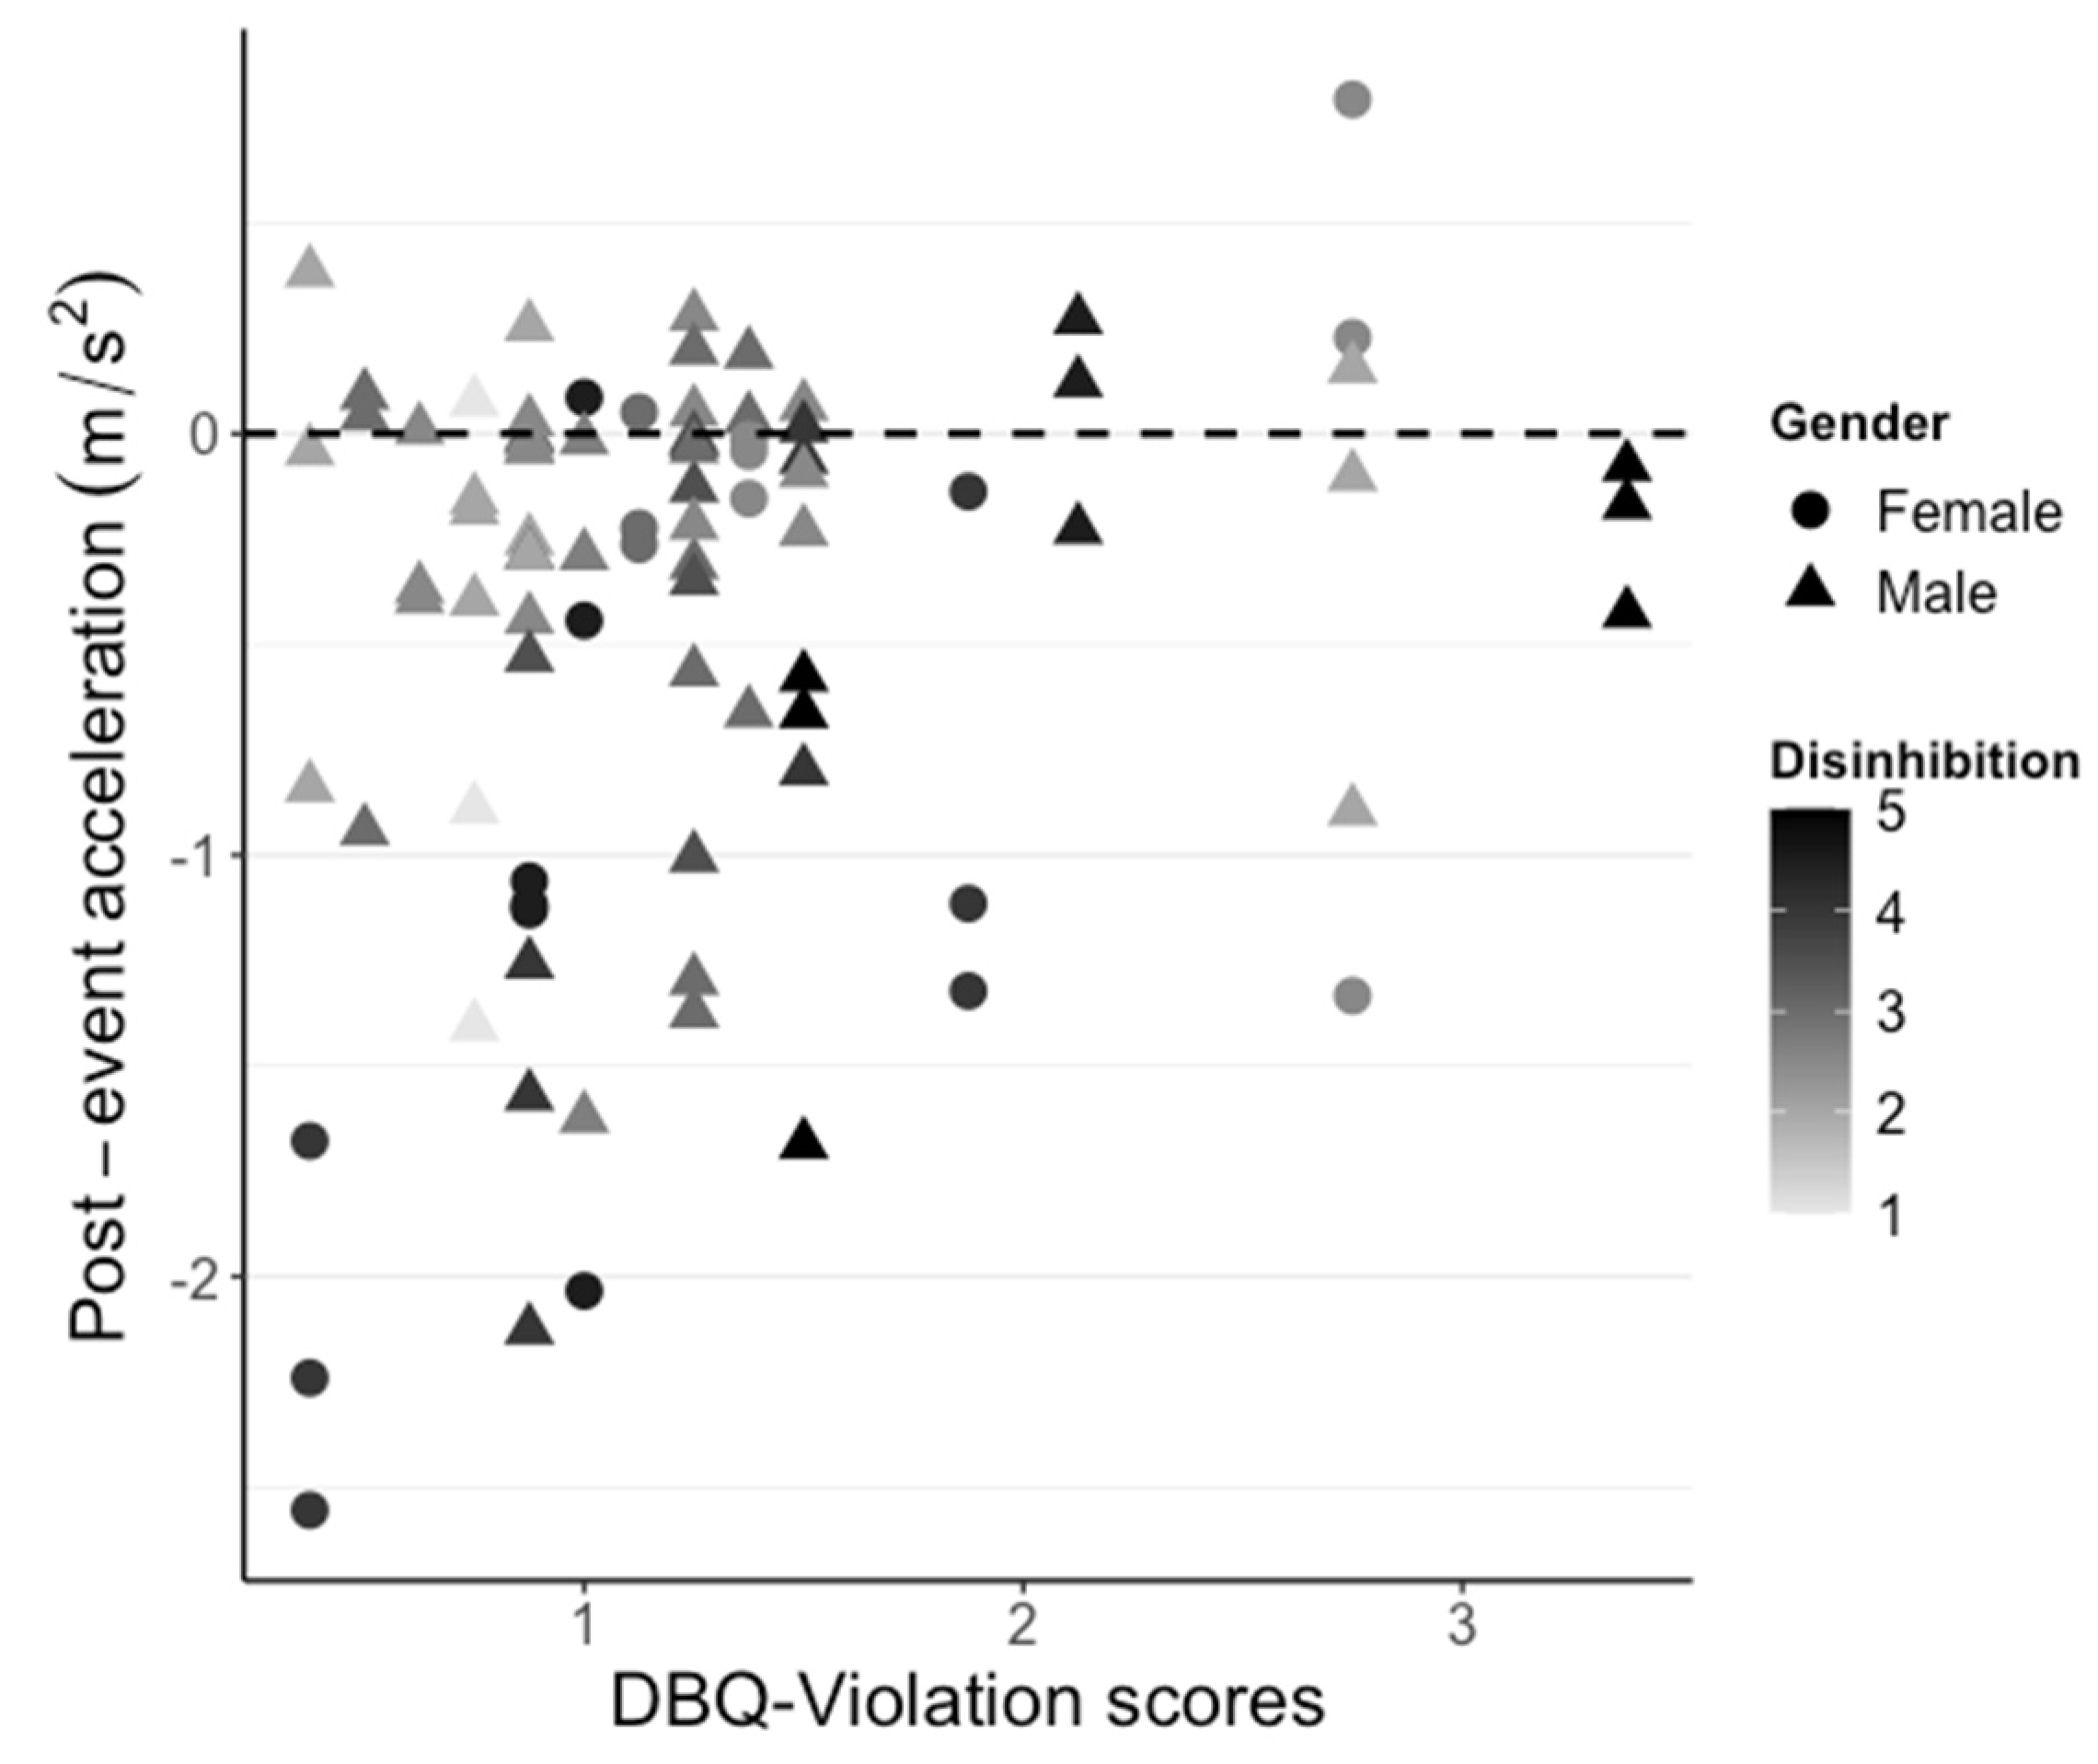
3.2. Post-Event Acceleration
3.3. Time to First Reaction
4. Discussion
5. Conclusions
Author Contributions
Funding
Institutional Review Board Statement
Informed Consent Statement
Data Availability Statement
Conflicts of Interest
References
- Khan, S.K.; Shiwakoti, N.; Stasinopoulos, P.; Chen, Y. Cyber-attacks in the next-generation cars, mitigation techniques, anticipated readiness and future directions. Accid. Anal. Prev. 2020, 148, 105837. [Google Scholar] [CrossRef] [PubMed]
- Ahmad, U.; Song, H.; Bilal, A.; Alazab, M.; Jolfaei, A. Securing smart vehicles from relay attacks using machine learning. J. Supercomput. 2020, 76, 2665–2682. [Google Scholar] [CrossRef]
- Chen, Q.; Romanowich, P.; Castillo, J.; Roy, K.C.; Chavez, G.; Xu, S. ExHPD: Exploiting Human, Physical, and Driving Behaviors to Detect Vehicle Cyber Attacks. IEEE Internet Things J. 2021, 8, 14355–14371. [Google Scholar] [CrossRef]
- Guo, L.; Yang, B.; Ye, J.; Velni, J.M.; Song, W. Attack-Resilient Lateral Stability Control for Four-Wheel-Driven EVs Considering Changed Driver Behavior Under Cyber Threats. IEEE Trans. Transp. Electrif. 2022, 8, 1362–1375. [Google Scholar] [CrossRef]
- Kamhoua, C.; Martin, A.; Tosh, D.K.; Kwiat, K.A.; Heitzenrater, C.; Sengupta, S. Cyber-threats information sharing in cloud computing: A game theoretic approach. In Proceedings of the 2015 IEEE 2nd International Conference on Cyber Security and Cloud Computing, New York, NY, USA, 3–5 November 2015; pp. 382–389. [Google Scholar]
- Seetharaman, A.; Patwa, N.; Jadhav, V.; Saravanan, A.S.; Sangeeth, D. Impact of Factors Influencing Cyber Threats on Autonomous Vehicles. Appl. Artif. Intell. 2021, 35, 105–132. [Google Scholar] [CrossRef]
- McCarthy, C.; Harnett, K.; Carter, A. Characterization of Potential Security Threats in Modern Automobiles: A Composite Modeling Approach (No. DOT HS 812 074) (United States); National Highway Traffic Safety Administration: Washington, DC, USA, 2014. [Google Scholar]
- Garcia, J.; Feng, Y.; Shen, J.; Almanee, S.; Xia, Y.; Chen, Q.A. A comprehensive study of autonomous vehicle bugs. In Proceedings of the ACM/IEEE 42nd International Conference on Software Engineering, Seoul, Republic of Korea, 27 June–19 July 2020; pp. 385–396. [Google Scholar] [CrossRef]
- Chen, X.; Zheng, H.; Wang, Z.; Chen, X. Exploring impacts of on-demand ridesplitting on mobility via real-world ridesourcing data and questionnaires. Transportation 2018, 48, 1541–1561. [Google Scholar] [CrossRef]
- Wolf, M.; Weimerskirch, A.; Paar, C. Security in Automotive Bus Systems. Workshop on Embedded Security in Cars; ESCRYPT GmbH: Bochum, Germany, 2004; pp. 1–13. [Google Scholar]
- Zhang, F.; Petit, J.; Roberts, S.C. A Simulator Study on Drivers’ Response and Perception Towards Vehicle Cyberattacks. Proc. Hum. Factors Ergon. Soc. Annu. Meet. 2019, 63, 1498–1502. [Google Scholar] [CrossRef]
- Eiza, M.H.; Ni, Q. Driving with sharks: Rethinking connected vehicles with vehicle cybersecurity. IEEE Veh. Technol. Mag. 2017, 12, 45–51. [Google Scholar] [CrossRef] [Green Version]
- Greenberg, A. Hackers remotely kill a jeep on the highway—With me in it. Wired 2015, 7, 21. [Google Scholar]
- Koscher, K.; Czeskis, A.; Roesner, F.; Patel, S.; Kohno, T.; Checkoway, S.; McCoy, D.; Kantor, B.; Anderson, D.; Shacham, H.; et al. Experimental Security Analysis of a Modern Automobile. In Proceedings of the 2010 IEEE Symposium on Security and Privacy, Oakland, CA, USA, 8 July 2010; pp. 447–462. [Google Scholar] [CrossRef]
- Guo, F.; Fang, Y. Individual driver risk assessment using naturalistic driving data. Accid. Anal. Prev. 2013, 61, 3–9. [Google Scholar] [CrossRef]
- Cranor, L.F. A Framework for Reasoning about the Human in the Loop; Analysis and Policy Observatory: Melbourne, Australia, 2008; pp. 1–15. [Google Scholar]
- Zhao, N.; Mehler, B.; Reimer, B.; D’Ambrosio, L.A.; Mehler, A.; Coughlin, J.F. An investigation of the relationship between the driving behavior questionnaire and objective measures of highway driving behavior. Transp. Res. Part F Traffic Psychol. Behav. 2012, 15, 676–685. [Google Scholar] [CrossRef]
- Curry, A.E.; Hafetz, J.; Kallan, M.J.; Winston, F.K.; Durbin, D.R. Prevalence of teen driver errors leading to serious motor vehicle crashes. Accid. Anal. Prev. 2011, 43, 1285–1290. [Google Scholar] [CrossRef]
- Walshe, E.; Ward McIntosh, C.; Romer, D.; Winston, F. Executive Function Capacities, Negative Driving Behavior and Crashes in Young Drivers. Int. J. Environ. Res. Public Health 2017, 14, 1314. [Google Scholar] [CrossRef] [Green Version]
- Cordazzo ST, D.; Scialfa, C.T.; Ross, R.J. Modernization of the Driver Behaviour Questionnaire. Accid. Anal. Prev. 2016, 87, 83–91. [Google Scholar] [CrossRef]
- Lawton, R.; Parker, D.; Manstead AS, R.; Stradling, S.G. The Role of Affect in Predicting Social Behaviors: The Case of Road Traffic Violations. J. Appl. Soc. Psychol. 1997, 27, 1258–1276. [Google Scholar] [CrossRef]
- Parker, D.; West, R.; Stradling, S.; Manstead AS, R. Behavioural characteristics and involvement in different types of traffic accident. Accid. Anal. Prev. 1995, 27, 571–581. [Google Scholar] [CrossRef] [PubMed]
- Reason, J.; Manstead, A.; Stradling, S.; Baxter, J.; Campbell, K. Errors and violations on the roads: A real distinction? Ergonomics 1990, 33, 1315–1332. [Google Scholar] [CrossRef] [PubMed]
- Jamt RE, G.; Gjerde, H.; Furuhaugen, H.; Romeo, G.; Vindenes, V.; Ramaekers, J.G.; Bogstrand, S.T. Associations between psychoactive substance use and sensation seeking behavior among drivers in Norway. BMC Public Health 2020, 20, 23. [Google Scholar] [CrossRef] [Green Version]
- Yang, J.; Du, F.; Qu, W.; Gong, Z.; Sun, X. Effects of Personality on Risky Driving Behavior and Accident Involvement for Chinese Drivers. Traffic Inj. Prev. 2013, 14, 565–571. [Google Scholar] [CrossRef]
- Machin, M.A.; Sankey, K.S. Relationships between young drivers’ personality characteristics, risk perceptions, and driving behaviour. Accid. Anal. Prev. 2008, 40, 541–547. [Google Scholar] [CrossRef] [Green Version]
- Tao, D.; Zhang, R.; Qu, X. The role of personality traits and driving experience in self-reported risky driving behaviors and accident risk among Chinese drivers. Accid. Anal. Prev. 2017, 99, 228–235. [Google Scholar] [CrossRef] [PubMed]
- Jonah, B.A. Sensation seeking and risky driving: A review and synthesis of the literature. Accid. Anal. Prev. 1997, 29, 651–665. [Google Scholar] [CrossRef] [PubMed]
- Reimer, B.; D’Ambrosio, L.A.; Gilbert, J.; Coughlin, J.F.; Biederman, J.; Surman, C.; Fried, R.; Aleardi, M. Behavior differences in drivers with attention deficit hyperactivity disorder: The driving behavior questionnaire. Accid. Anal. Prev. 2005, 37, 996–1004. [Google Scholar] [CrossRef] [PubMed]
- Ba, Y.; Zhang, W.; Salvendy, G.; Cheng AS, K.; Ventsislavova, P. Assessments of risky driving: A Go/No-Go simulator driving task to evaluate risky decision-making and associated behavioral patterns. Appl. Ergon. 2016, 52, 265–274. [Google Scholar] [CrossRef]
- Stephens, A.N.; Groeger, J.A. Situational specificity of trait influences on drivers’ evaluations and driving behaviour. Transp. Res. Part F Traffic Psychol. Behav. 2009, 12, 29–39. [Google Scholar] [CrossRef]
- Eachus, P. Using the Brief Sensation Seeking Scale (BSSS) to predict holiday preferences. Personal. Individ. Differ. 2004, 36, 141–153. [Google Scholar] [CrossRef]
- Zuckerman, M. Sensation Seeking: Beyond the Optimal Level of Arousal; Taylor & Francis Group: Boca Raton, FL, USA, 1979. [Google Scholar]
- Heino, A.; van der Molen, H.H.; Wilde, G.J.S. Differences in risk experience between sensation avoiders and sensation seekers. Personal. Individ. Differ. 1996, 20, 71–79. [Google Scholar] [CrossRef]
- Hoyle, R.H.; Stephenson, M.T.; Palmgreen, P.; Lorch, E.P.; Donohew, R.L. Reliability and validity of a brief measure of sensation seeking. Personal. Individ. Differ. 2002, 32, 401–414. [Google Scholar] [CrossRef]
- Zuckerman, M. Behavioral Expressions and Biosocial Bases of Sensation Seeking; Cambridge University Press: Cambridge, UK, 1994. [Google Scholar]
- Ayvaşık, H.B.; Er, N.; Sümer, N. Traffic Violations and Errors: The Effects of Sensation Seeking and Attention. In Proceedings of the 3rd International Driving Symposium on Human Factors in Driver Assessment, Training, and Vehicle Design, Rockport, ME, USA, 27–30 June 2005; pp. 395–402. [Google Scholar] [CrossRef]
- Zuckerman, M.; Kolin, E.A.; Price, L.; Zoob, I. Development of a sensation-seeking scale. J. Consult. Psychol. 1964, 28, 477. [Google Scholar] [CrossRef]
- Ranney, T. Psychological fidelity: The perception of risk. In Handbook of Driving Simulation for Engineering, Medicine, and Psychology; CRC Press: Boca Raton, FL, USA, 2011. [Google Scholar]
- Muguro, J.K.; Sasaki, M.; Matsushita, K. Evaluating Hazard Response Behavior of a Driver Using Physiological Signals and Car-Handling Indicators in a Simulated Driving Environment. J. Transp. Technol. 2019, 09, 439–449. [Google Scholar] [CrossRef] [Green Version]
- Mehrotra, S.; Zhang, F.; Roberts, S.C. Looking out or Looking Away?—Exploring the Impact of Driving With a Passenger on Young Drivers’ Eye Glance Behavior. Human Factors 2022, 00187208221081209. [Google Scholar] [CrossRef] [PubMed]
- Zhang, F.; Roberts, S.C. Factors affecting drivers’ off-road glance behavior while interacting with in-vehicle voice interfaces. Accid. Anal. Prev. 2023, 179, 106883. [Google Scholar] [CrossRef]
- Xiong, X.; Wang, M.; Cai, Y.; Chen, L.; Farah, H.; Hagenzieker, M. A forward collision avoidance algorithm based on driver braking behavior. Accid. Anal. Prev. 2019, 129, 30–43. [Google Scholar] [CrossRef] [PubMed] [Green Version]
- Zhang, F.; Mehrotra, S.; Roberts, S.C. Driving distracted with friends: Effect of passengers and driver distraction on young drivers’ behavior. Accid. Anal. Prev. 2019, 132, 105246. [Google Scholar] [CrossRef] [PubMed]
- Kontogiannis, T.; Kossiavelou, Z.; Marmaras, N. Self-reports of aberrant behaviour on the roads: Errors and violations in a sample of Greek drivers. Accid. Anal. Prev. 2002, 34, 381–399. [Google Scholar] [CrossRef]
- Roberts, S.C.; Zhang, F.; Fisher, D.; Vaca, F.E. The effect of hazard awareness training on teen drivers of varying socioeconomic status. Traffic Inj. Prev. 2021, 22, 455–459. [Google Scholar] [CrossRef]
- R Core Team. R: A Language and Environment for Statistical Computing; R Foundation for Statistical Computing: Vienna, Austria, 2020. [Google Scholar]
- Ball, S.A.; Zuckerman, M. Sensation Seeking and Selective Attention: Focused and Divided Attention on a Dichotic Listening Task. J. Personal. Soc. Psychol. 1992, 63, 825. [Google Scholar] [CrossRef]
- Qu, W.; Zhang, W.; Ge, Y. The moderating effect of delay discounting between sensation seeking and risky driving behavior. Saf. Sci. 2020, 123, 104558. [Google Scholar] [CrossRef]


| Variable | Type | Mean | Standard Deviation | ||
|---|---|---|---|---|---|
| Female | Male | Female | Male | ||
| Driving scenario | Categorical, reference level lane change | / | / | / | / |
| Gender | Categorical, coded as binary with reference level female participants | / | / | / | / |
| Training | Categorical, coded as binary with reference level no training | / | / | / | / |
| Warning | Categorical, coded as binary with reference level no warning | / | / | / | / |
| Age | Numeric | 21.0 | 20.4 | 2.19 | 1.90 |
| DBQ-Errors | Numeric | 1.0 | 0.5 | 1.01 | 0.40 |
| DBQ-Lapse | Numeric | 1.5 | 0.9 | 1.02 | 0.57 |
| DBQ-Violation | Numeric | 1.3 | 1.3 | 0.73 | 0.69 |
| Boredom susceptibility | Numeric | 3.6 | 3.4 | 0.94 | 0.79 |
| Disinhibition | Numeric | 3.6 | 3.0 | 0.84 | 1.02 |
| Experience seeking | Numeric | 3.4 | 3.9 | 1.04 | 0.76 |
| Thrill and adventure seeking | Numeric | 3.6 | 3.4 | 1.38 | 1.10 |
| Variable | Coefficient | Standard Error | t-Value | Pr (>|t|) |
|---|---|---|---|---|
| Driving scenario (ref = lane change) | β = 3.39 (siren) | 0.821 | 4.129 | <0.001 * |
| β = 4.30 (dashboard signs) | 0.814 | 5.284 | <0.001 * | |
| Training (ref = no training) | β = −1.59 | 0.680 | −2.341 | 0.021 * |
| DBQ-Violation | β = 1.34 | 0.489 | 2.735 | 0.008 * |
| Variable | Coefficient | Standard Error | t-Value | Pr (>|t|) |
|---|---|---|---|---|
| Driving scenario (ref = lane change) | β = 0.22 (siren) | 0.140 | 1.564 | 0.122 |
| β = 0.63 (dashboard signs) | 0.139 | 4.518 | <0.001 * | |
| Gender (ref = female) | β = 0.30 | 0.137 | 2.173 | 0.033 * |
| DBQ-Violation | β = 0.30 | 0.084 | 3.528 | <0.001 * |
| Disinhibition | β = −0.24 | 0.061 | −3.876 | <0.001 * |
| Variable | Coefficient | Standard Error | t-Value | Pr (>|t|) |
|---|---|---|---|---|
| Driving scenario (ref = lane change) | β = −18.96 (Siren) | 4.719 | −4.018 | <0.001 * |
| β = −15.71 (dashboard signs) | 4.719 | −3.33 | <0.001 * | |
| Training (ref = no training) | β = −8.93 | 3.864 | −2.311 | 0.023 * |
Disclaimer/Publisher’s Note: The statements, opinions and data contained in all publications are solely those of the individual author(s) and contributor(s) and not of MDPI and/or the editor(s). MDPI and/or the editor(s) disclaim responsibility for any injury to people or property resulting from any ideas, methods, instructions or products referred to in the content. |
© 2023 by the authors. Licensee MDPI, Basel, Switzerland. This article is an open access article distributed under the terms and conditions of the Creative Commons Attribution (CC BY) license (https://creativecommons.org/licenses/by/4.0/).
Share and Cite
Zhang, F.; Wang, M.; Parker, J.; Roberts, S.C. The Effect of Driving Style on Responses to Unexpected Vehicle Cyberattacks. Safety 2023, 9, 5. https://doi.org/10.3390/safety9010005
Zhang F, Wang M, Parker J, Roberts SC. The Effect of Driving Style on Responses to Unexpected Vehicle Cyberattacks. Safety. 2023; 9(1):5. https://doi.org/10.3390/safety9010005
Chicago/Turabian StyleZhang, Fangda, Meng Wang, Jah’inaya Parker, and Shannon C. Roberts. 2023. "The Effect of Driving Style on Responses to Unexpected Vehicle Cyberattacks" Safety 9, no. 1: 5. https://doi.org/10.3390/safety9010005