
Fatigue and Secondary Media Impacts in the Automated Vehicle: A Multidimensional State Perspective


Abstract
:1. Introduction
1.1. Individual Differences in Fatigue: Traits and States
1.2. Fatigue and Vehicle Automation
1.3. Decomposing Fatigue Processes
1.4. Study Aims
1.4.1. Influences on Driver Fatigue States
1.4.2. Individual Differences in State Fatigue Response
1.4.3. Automation and Media Influences on Driver Performance
1.4.4. Individual Differences in Driver Performance
2. Method
2.1. Participants
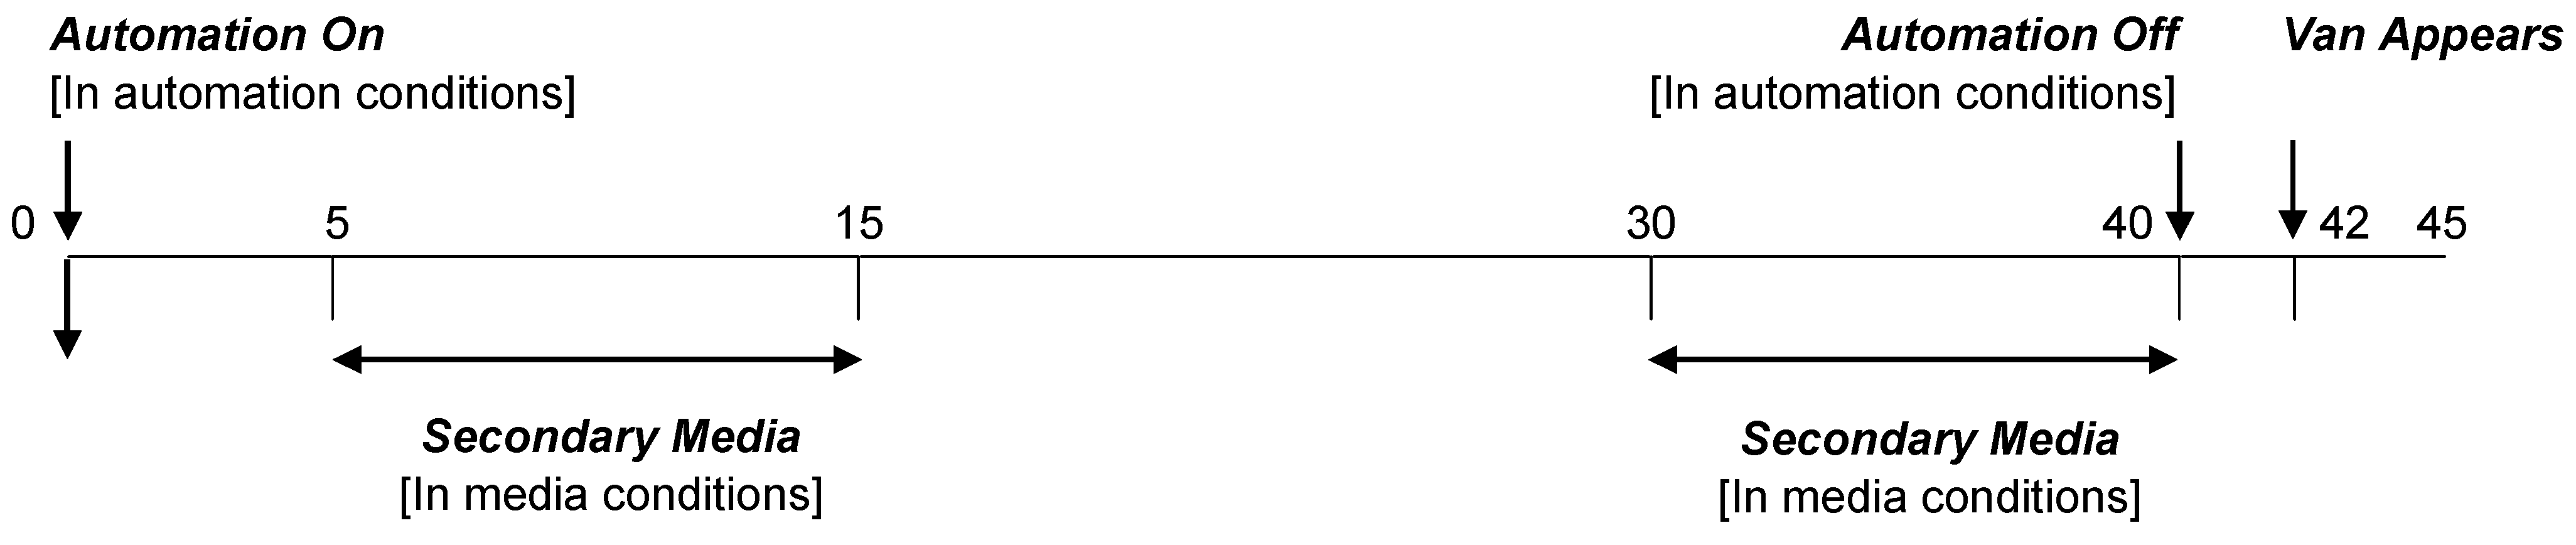
2.2. Design
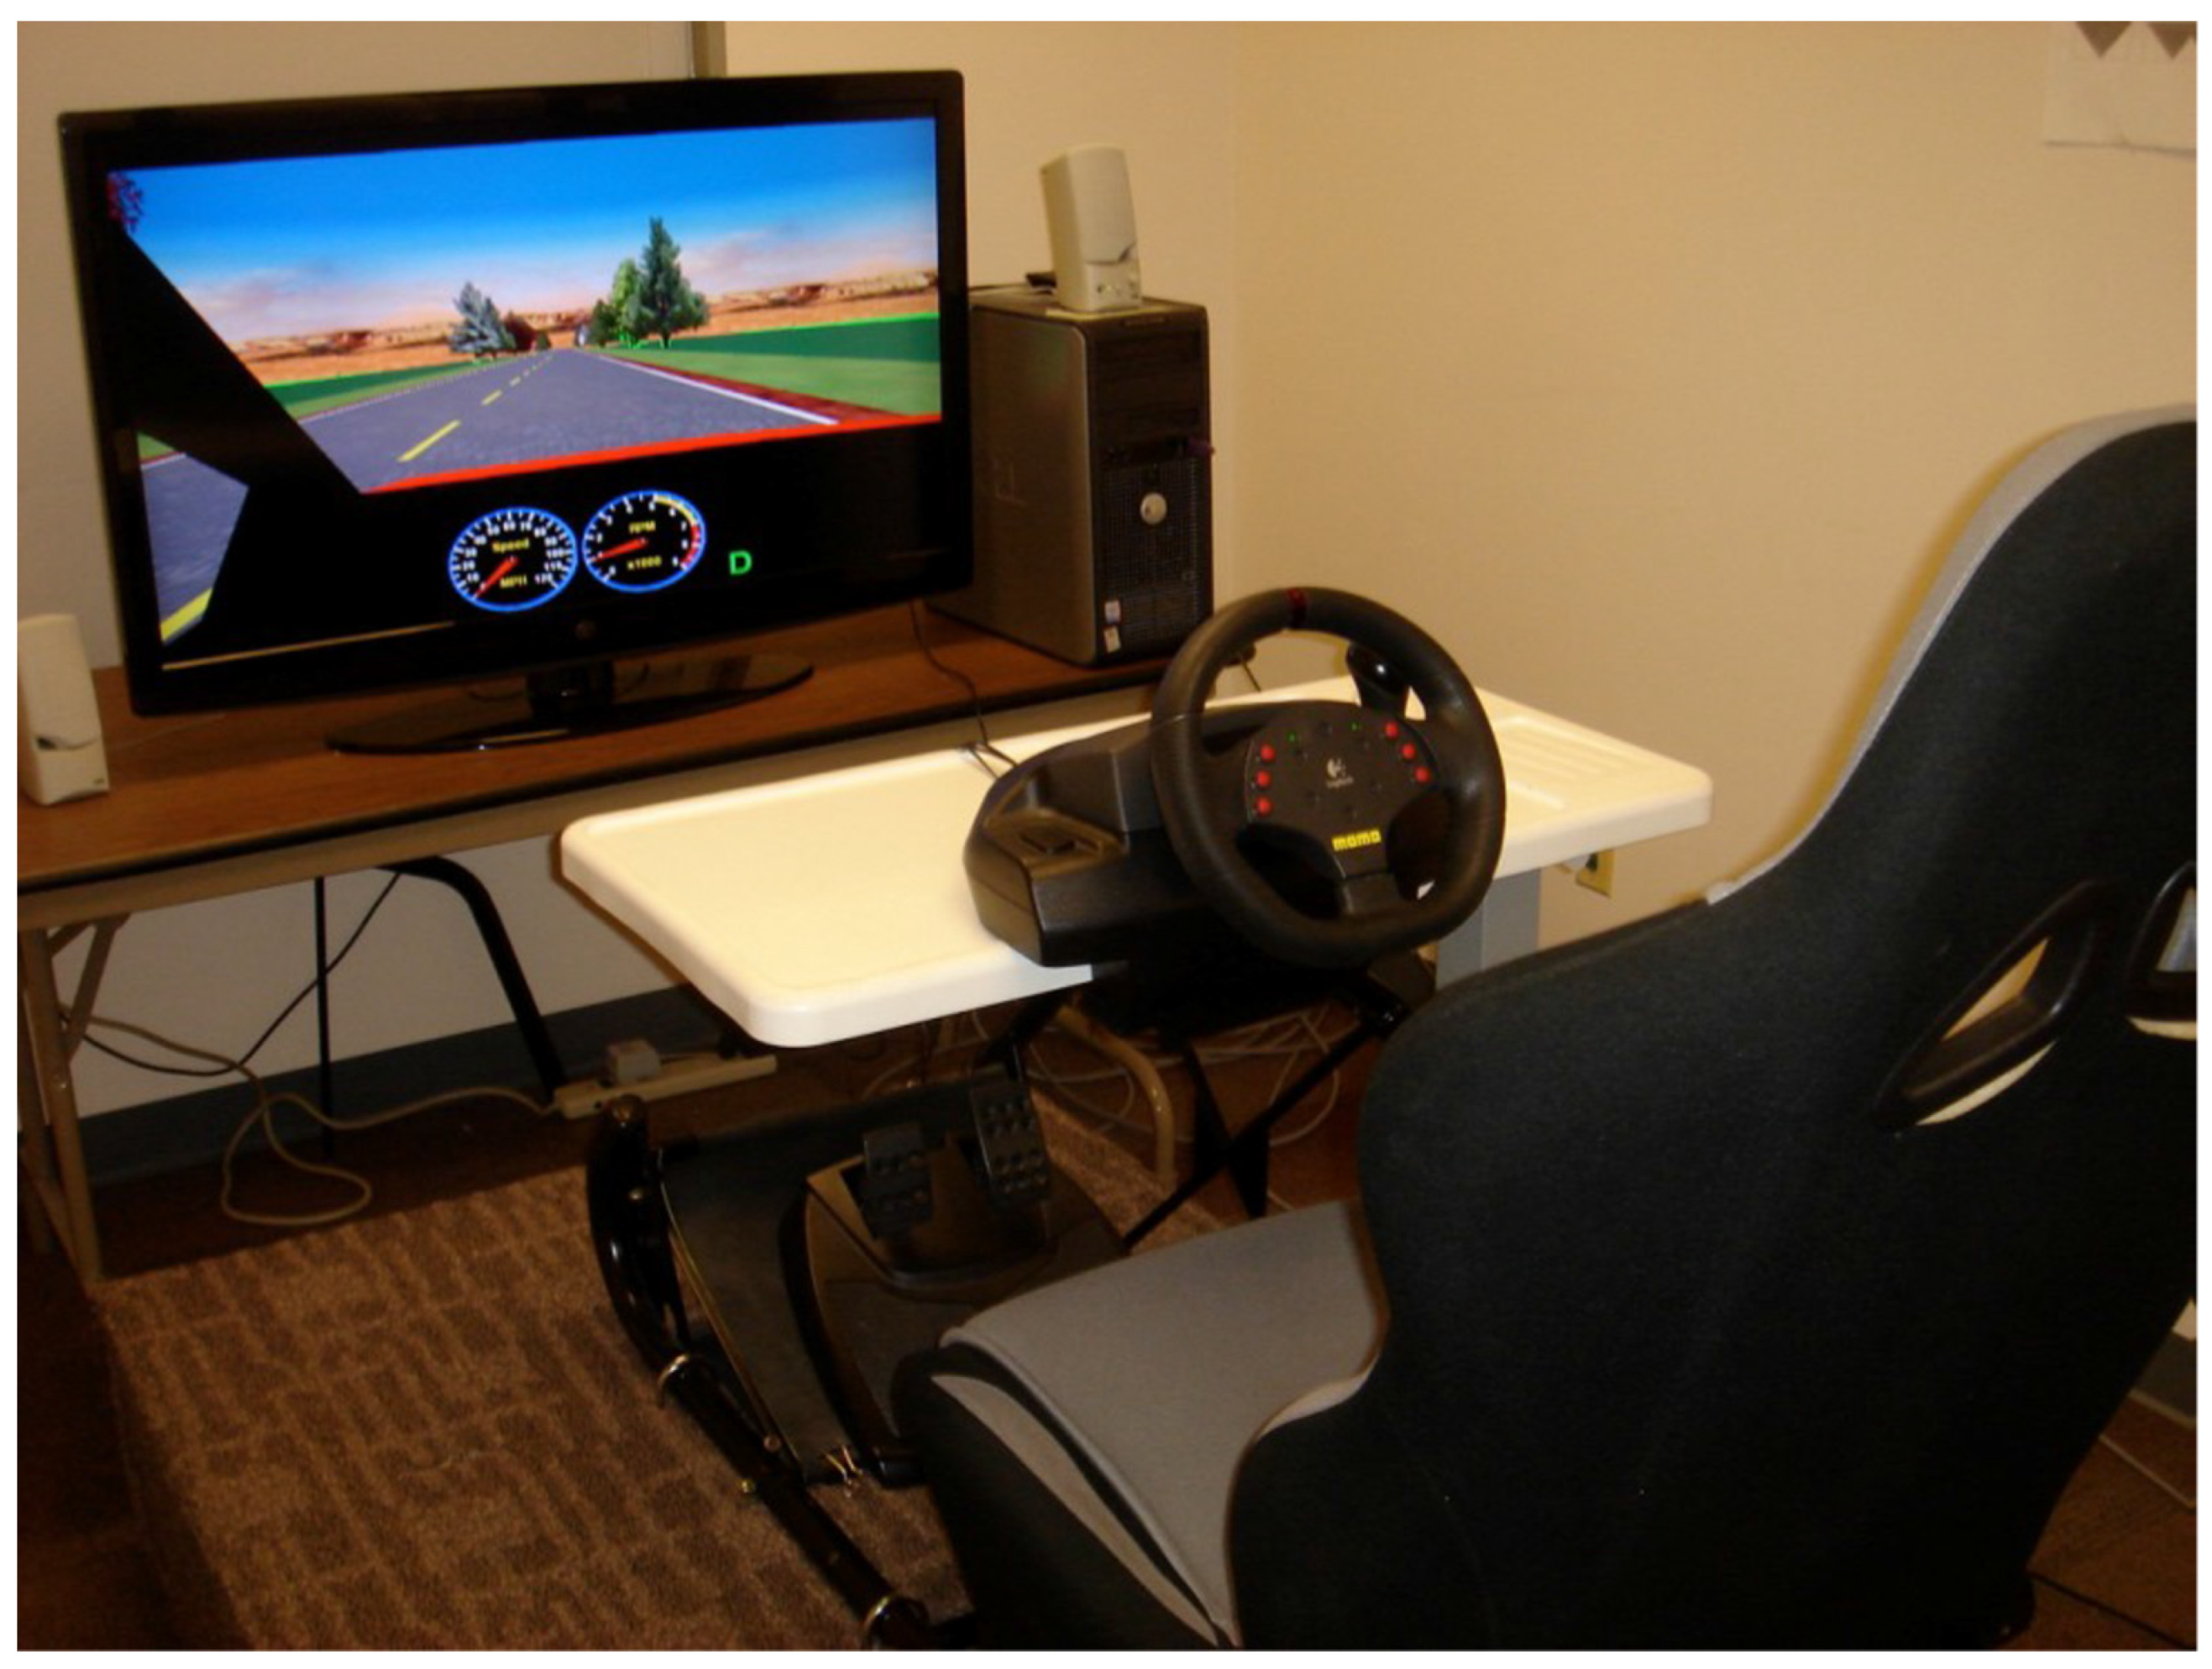
2.3. Apparatus
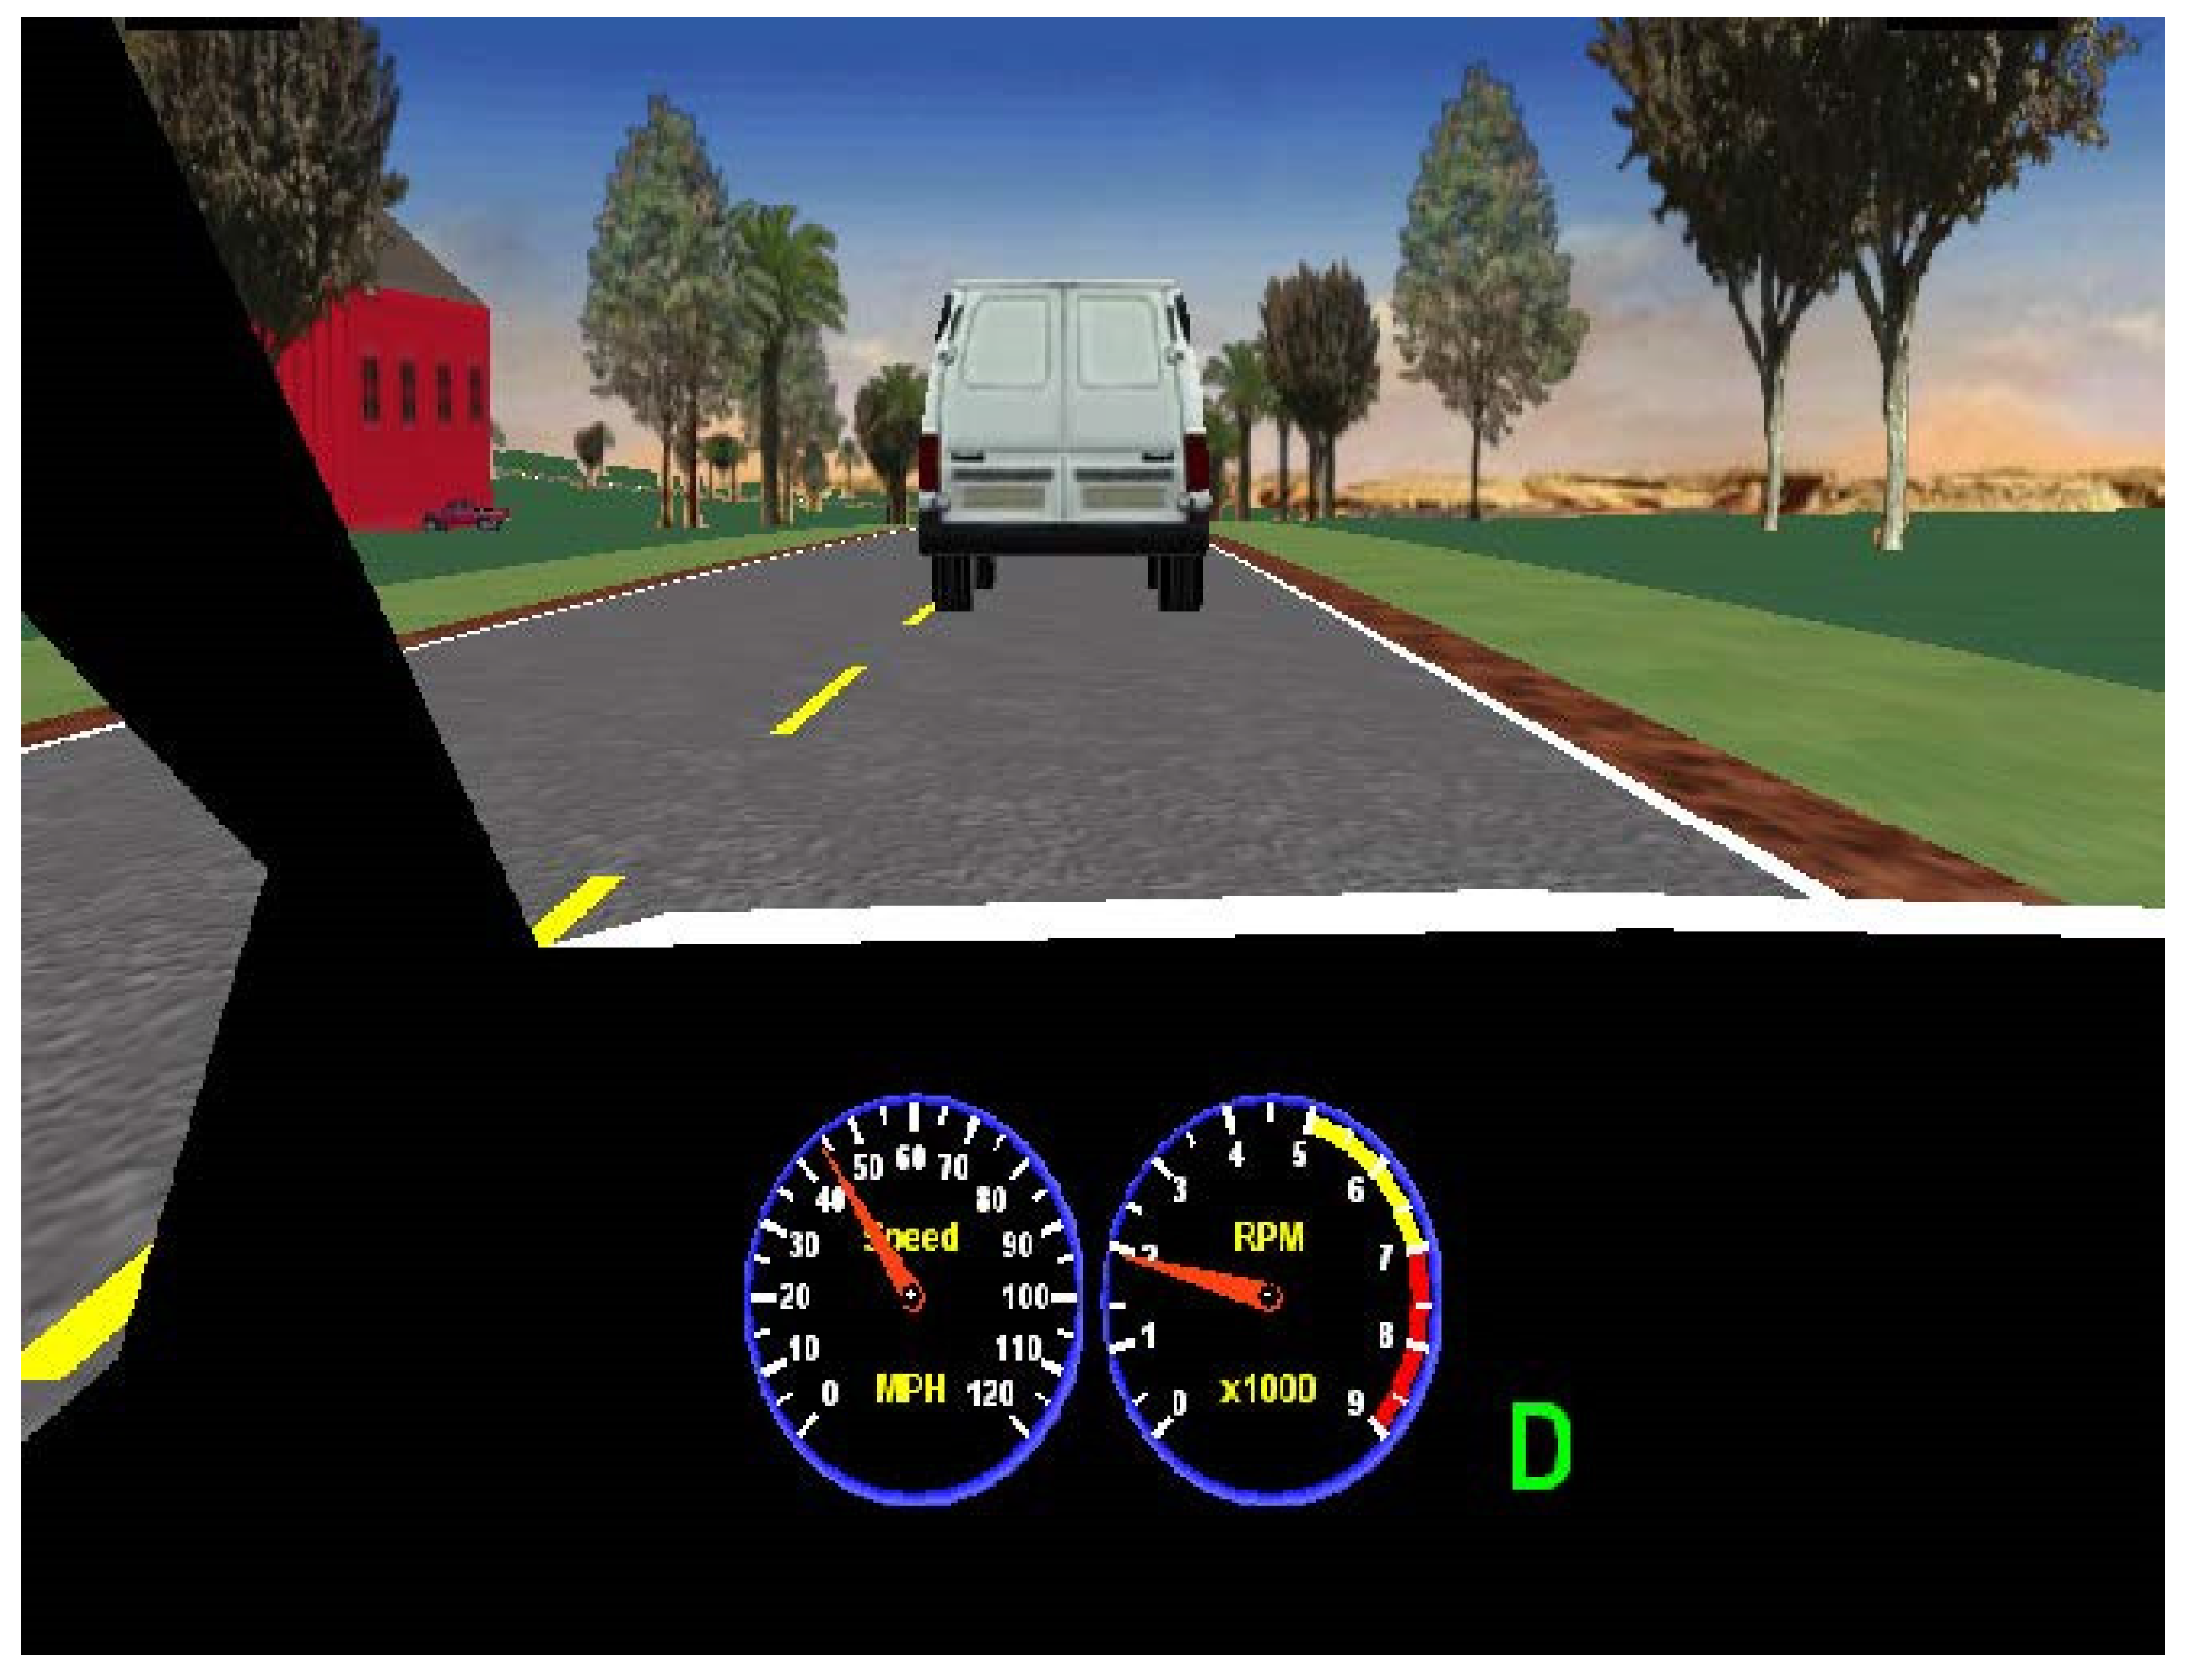
2.3.1. Simulator
2.3.2. Secondary Media
2.4. Questionnaires
2.5. Procedure
3. Results
3.1. Overview of Data Analysis
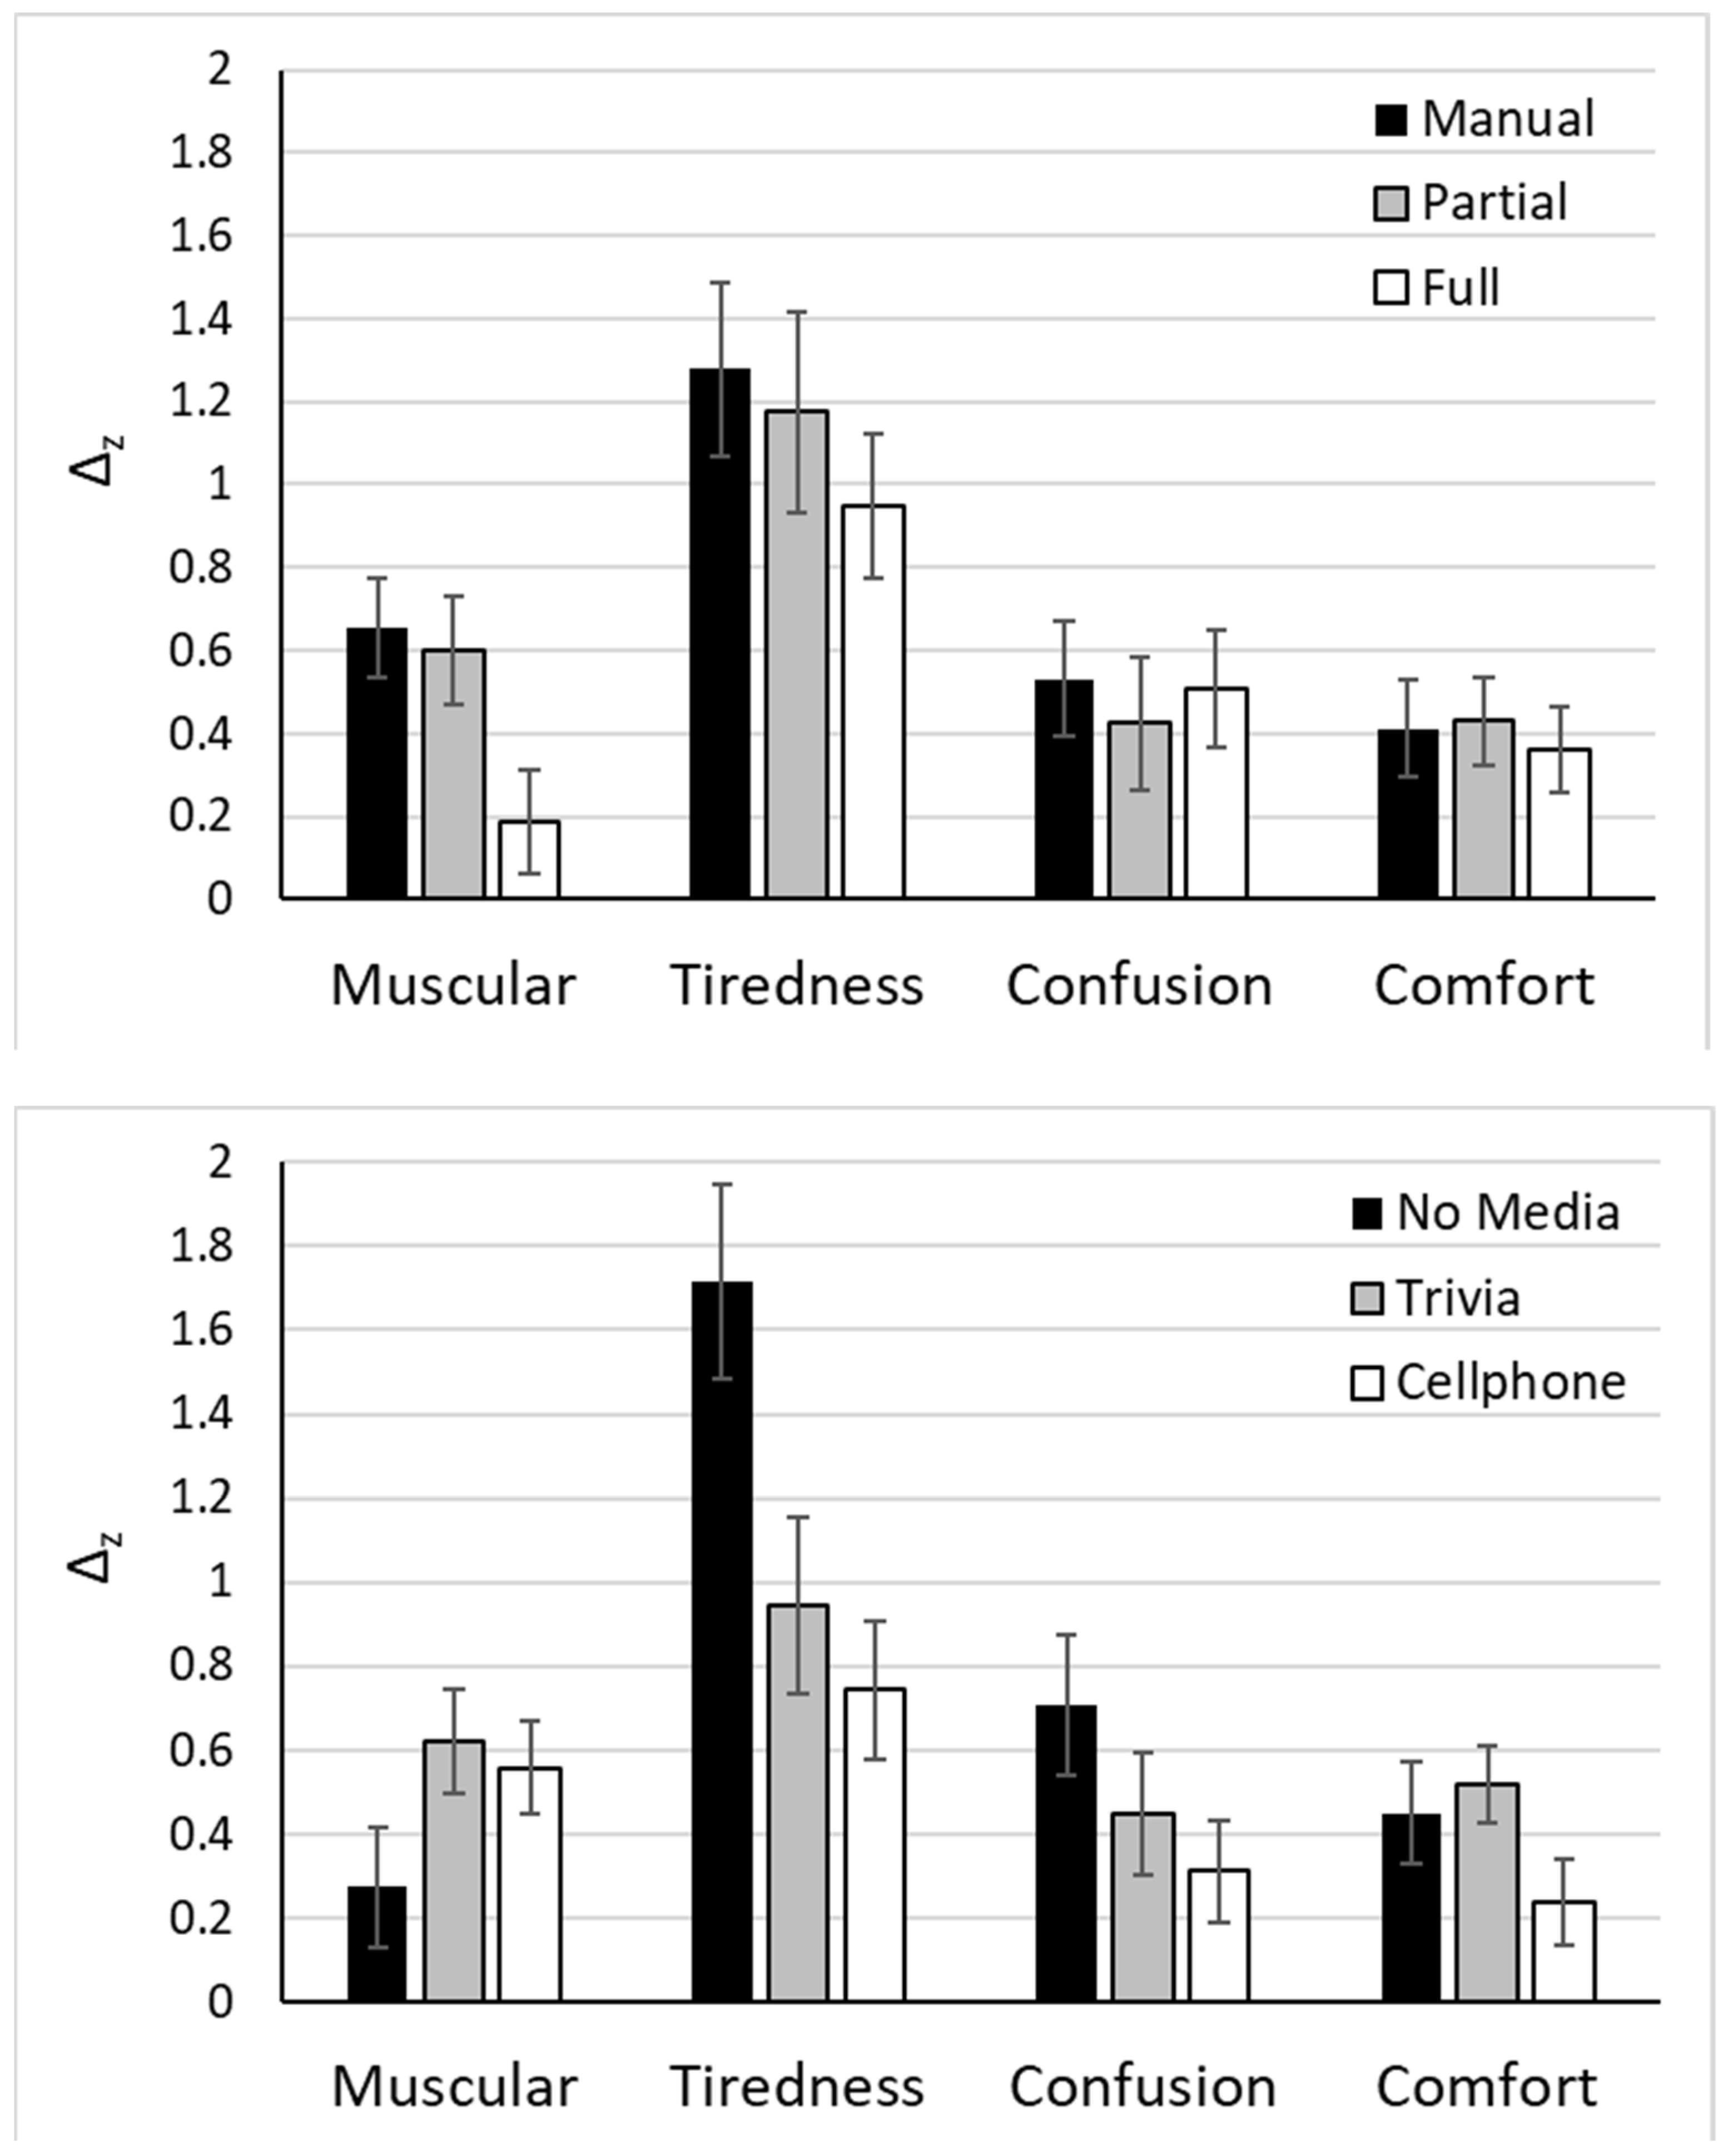
3.2. Effects of Automation and Secondary Media on Fatigue States
3.3. Predictors of Fatigue States
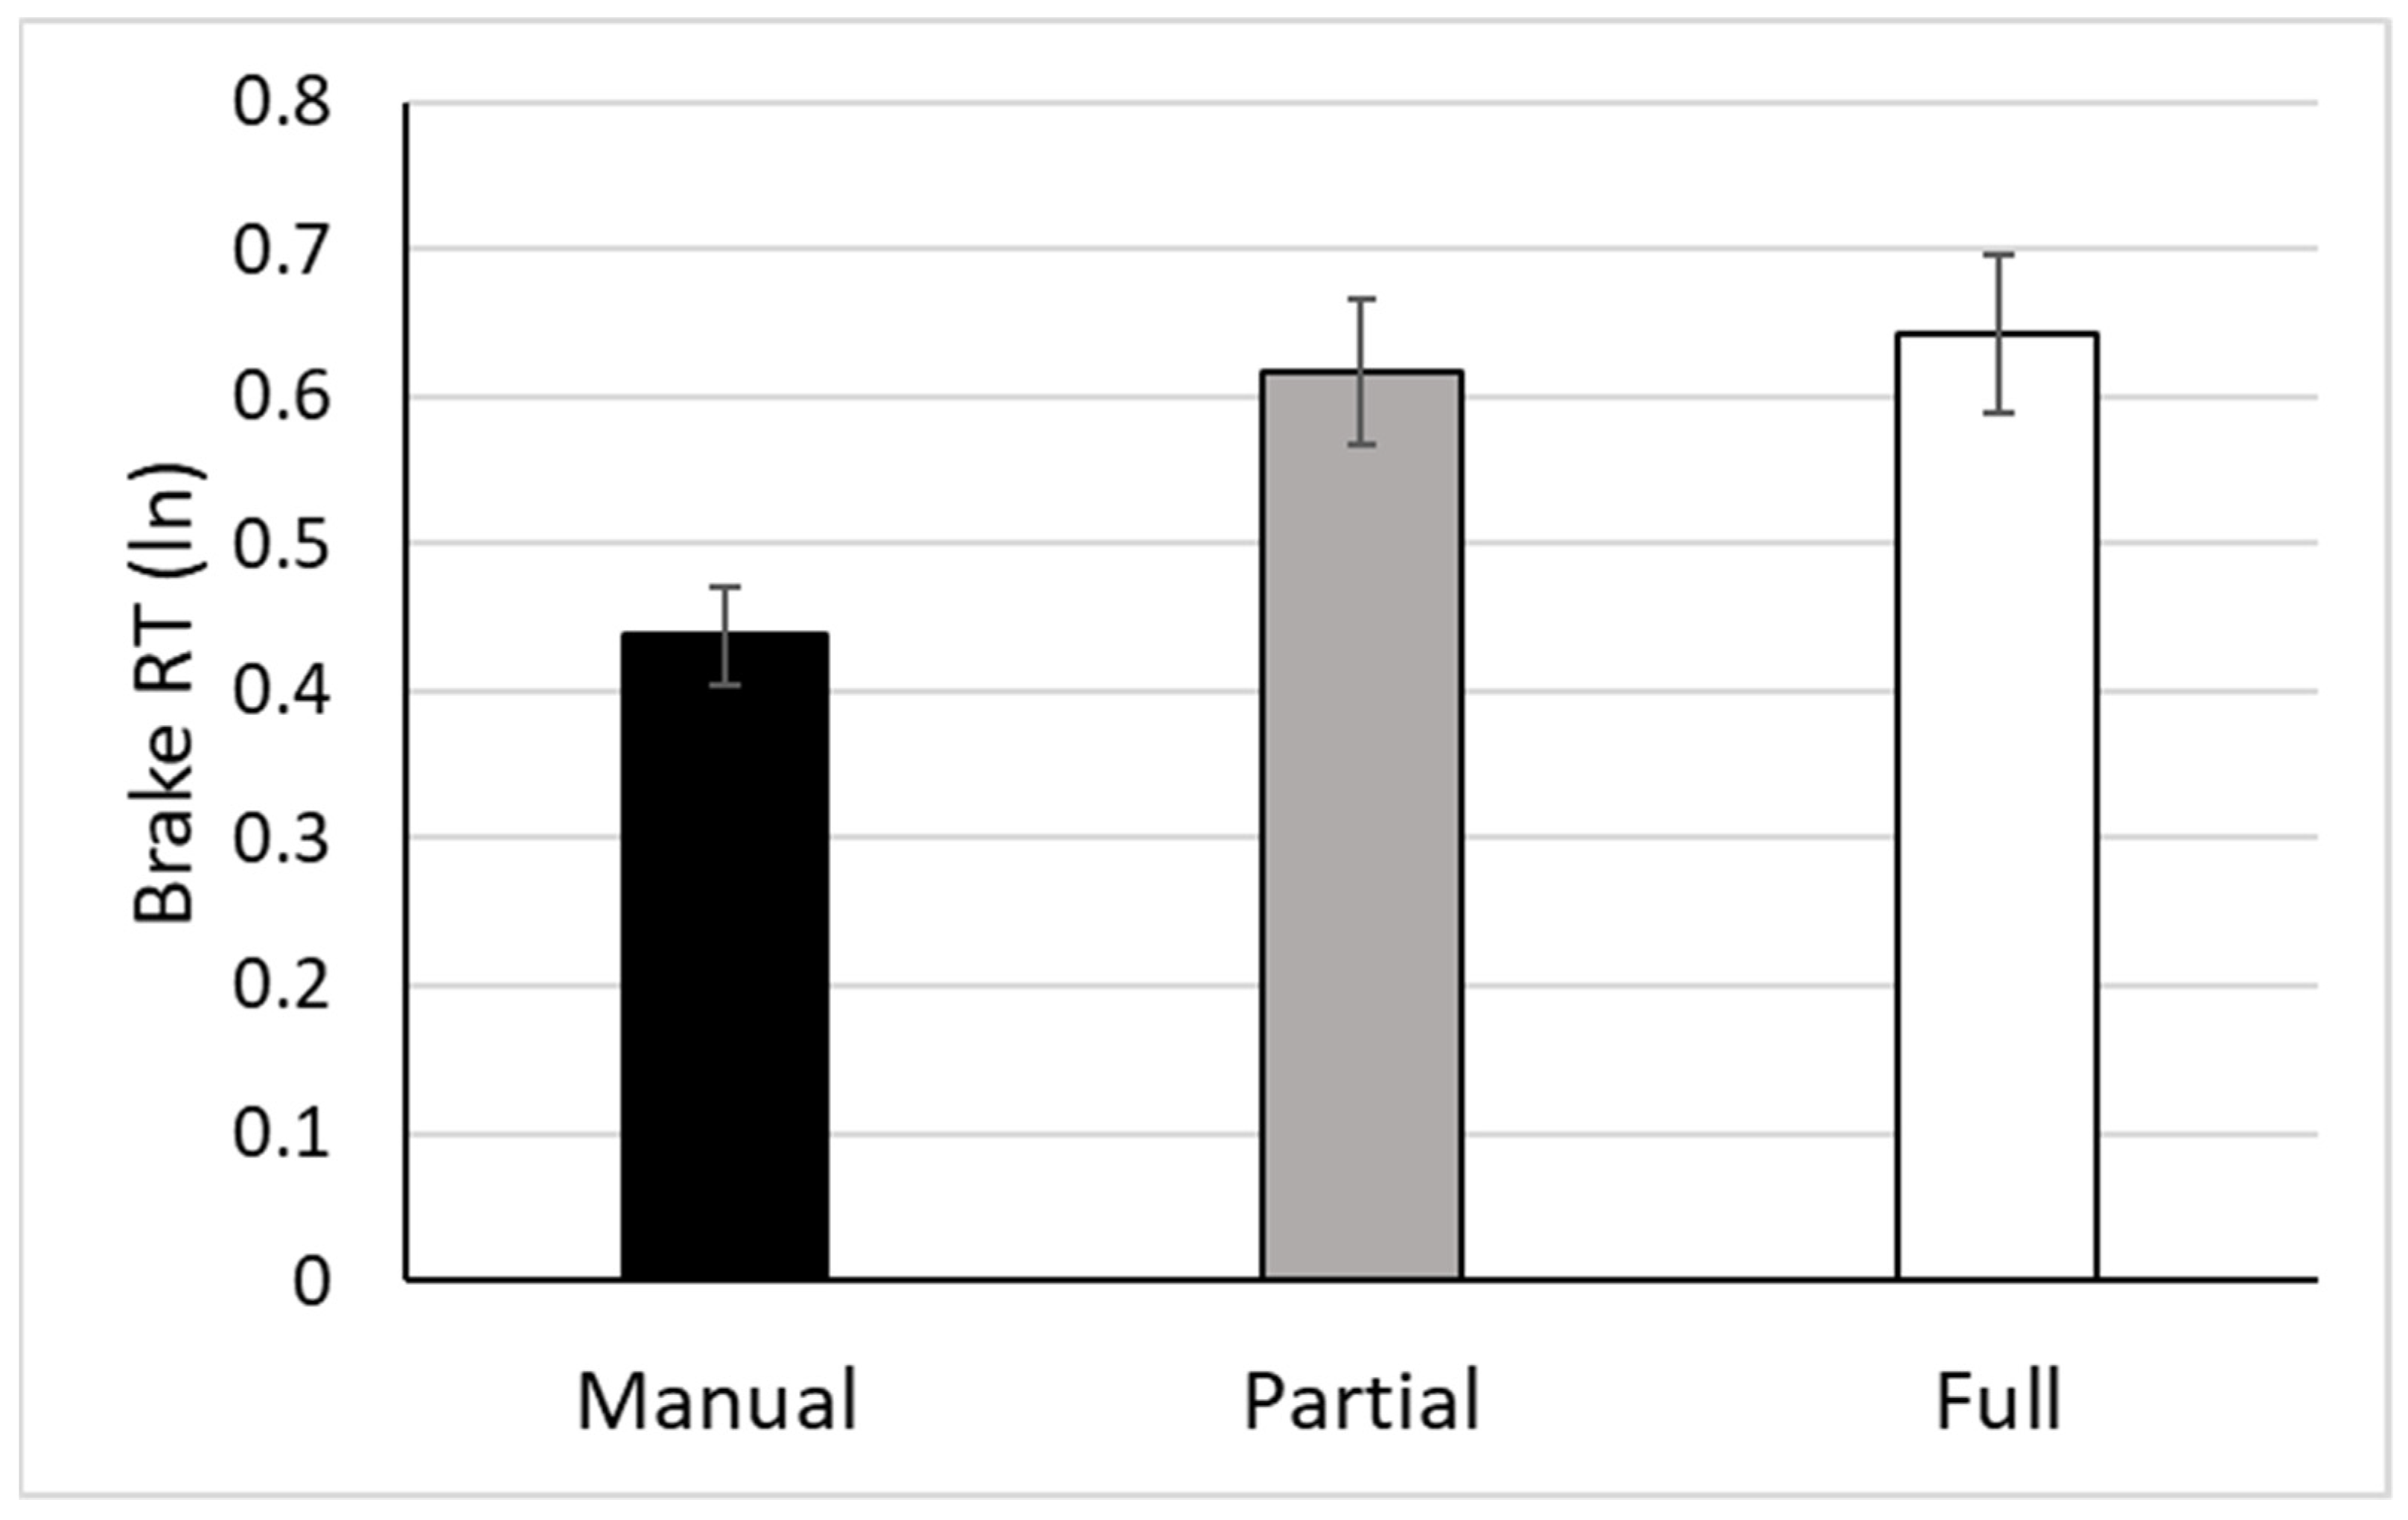
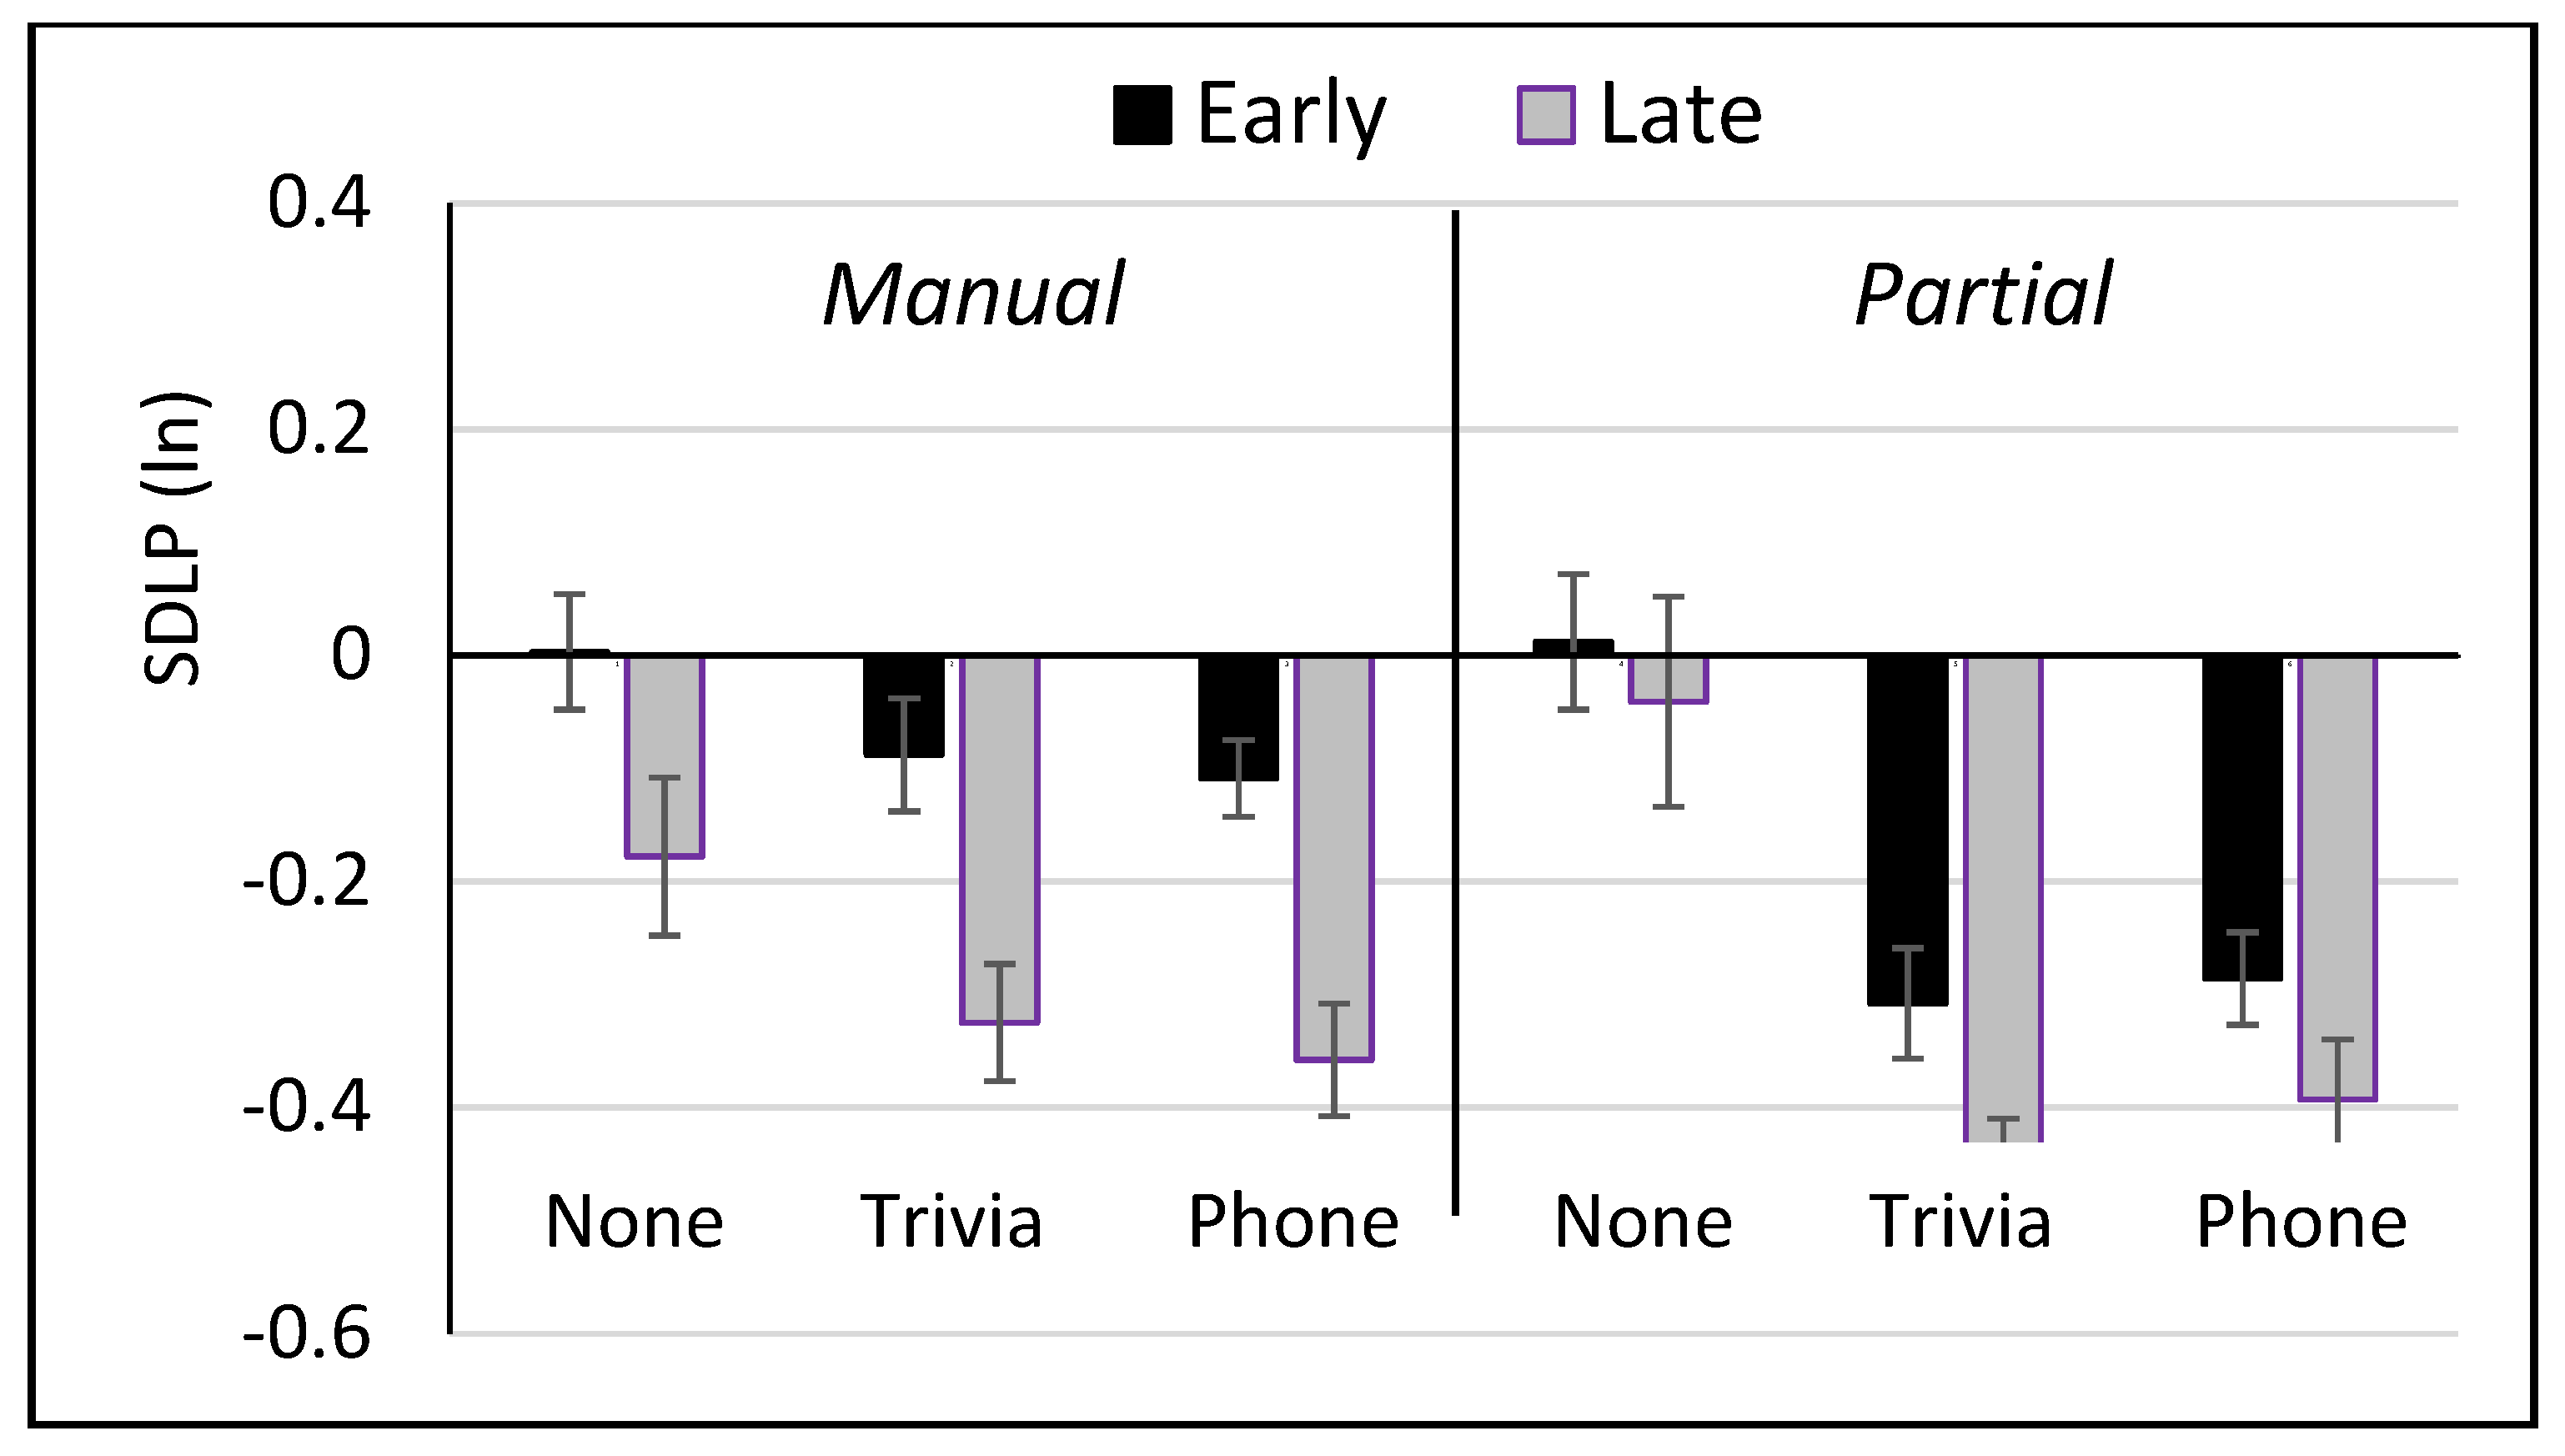
3.4. Effects of Automation and secondary Media on Performance
3.5. Performance Correlates of Fatigue States
4. Discussion
4.1. Automation, Secondary Media, and Safety
4.2. Individual Differences in Driver Fatigue States
4.3. Fatigue and Individual Differences in Performance
4.4. Practical Implications
4.5. Limitations
5. Conclusions
Author Contributions
Funding
Institutional Review Board Statement
Informed Consent Statement
Data Availability Statement
Conflicts of Interest
References
- Neubauer, C.; Saxby, D.J.; Matthews, G. Fatigue in the Automated Vehicle: Do Games and Conversation Distract or Energize the Driver? Proc. Hum. Factors Ergon. Soc. 2014, 58, 2053–2057. [Google Scholar] [CrossRef]
- Friswell, R.; Williamson, A. Comparison of the Fatigue Experiences of Short Haul Light and Long Distance Heavy Vehicle Drivers. Saf. Sci. 2013, 57, 203–213. [Google Scholar] [CrossRef]
- Williamson, A.; Lombardi, D.A.; Folkard, S.; Stutts, J.; Courtney, T.K.; Connor, J.L. The Link Between Fatigue and Safety. Accid. Anal. Prev. 2011, 43, 498–515. [Google Scholar] [CrossRef] [PubMed]
- SAE International. SAE Surface Vehicle Information Report: Taxonomy and Definitions for Terms Related to On-Road Motor Vehicle Automated Driving Systems (no. J3016); Society of Automotive Engineers: Warrendale, PA, USA, 2014. [Google Scholar]
- Meng, F.; Li, S.; Cao, L.; Li, M.; Peng, Q.; Wang, C.; Zhang, W. Driving Fatigue in Professional Drivers: A Survey of Truck and Taxi Drivers. Traffic Inj. Prev. 2015, 16, 474–483. [Google Scholar] [CrossRef]
- Saxby, D.J.; Matthews, G.; Warm, J.S.; Hitchcock, E.M.; Neubauer, C. Active and passive fatigue in simulated driving: Discriminating styles of workload regulation and their safety impacts. J. Exp. Psychol. Appl. 2013, 19, 287–300. [Google Scholar] [CrossRef] [Green Version]
- Thiffault, P.; Bergeron, J. Fatigue and Individual Differences in Monotonous Simulated Driving. Person. Individ. Diff. 2003, 34, 159–176. [Google Scholar] [CrossRef]
- Hu, X.; Lodewijks, G. Detecting Fatigue in Car Drivers and Aircraft Pilots by Using Non-Invasive Measures: The Value of Differentiation of Sleepiness and Mental Fatigue. J. Saf. Res. 2020, 72, 173–187. [Google Scholar] [CrossRef]
- Matthews, G. Multidimensional Profiling of Task Stress States for Human Factors: A Brief Review. Hum. Factors 2016, 58, 801–813. [Google Scholar] [CrossRef]
- Desmond, P.A.; Matthews, G. Individual Differences in Stress and Fatigue in Two Field Studies of Driving. Transp. Res. Part F Traffic Psychol. Behav. 2009, 12, 265–276. [Google Scholar] [CrossRef]
- Desmond, P.A.; Hancock, P.A. Active and Passive Fatigue States. In Stress, Workload, and Fatigue; Hancock, P.A., Desmond, P.A., Eds.; Lawrence Erlbaum: Mahwah, NJ, USA, 2001; pp. 455–465. [Google Scholar]
- May, J.F.; Baldwin, C.L. Driver Fatigue: The Importance of Identifying Causal Factors of Fatigue When Considering Detection and Countermeasure Technologies. Transp. Res. Part F Traffic Psychol. Behav. 2009, 12, 218–224. [Google Scholar] [CrossRef]
- Shapiro, C.M.; Devins, G.M.; Flanigan, M.; Fleming, J.A.E.; Morehouse, R.; Moscovitch, A.; Plamondon, J.; Reinish, L. Development of an Adjective Checklist to Measure Five Faces of Fatigue and Sleepiness: Data from a National Survey of Insomniacs. J. Psychosom. Res. 2002, 52, 467–473. [Google Scholar] [CrossRef] [PubMed]
- Yoshitake, H. Three Characteristic Patterns of Subjective Fatigue Symptoms. Ergonomics 1978, 21, 231–233. [Google Scholar] [CrossRef] [PubMed]
- Fuller, R.G. Effects of Prolonged Driving on Time Headway Adopted by HGV (Heavy Goods Vehicle) Drivers; Report number A685631 to the U.S.; Army Research Institute for the Behavioral and Social Science: Alexandria, VA, USA, 1983. [Google Scholar]
- Hockey, G.R.J. Challenges in Fatigue and Performance Research. In Handbook of Operator Fatigue; Matthews, G., Desmond, P.A., Neubauer, C., Hancock, P.A., Eds.; Ashgate Press: Aldershot, UK, 2012; pp. 45–60. [Google Scholar]
- Matthews, G.; Desmond, P.A.; Hitchcock, E.M. Dimensional Models of Fatigue. In Handbook of Operator Fatigue; Matthews, G., Desmond, P.A., Neubauer, C., Hancock, P.A., Eds.; Ashgate Press: Aldershot, UK, 2012; pp. 139–154. [Google Scholar]
- Hitchcock, E.M.; Matthews, G. Multidimensional Assessment of Fatigue: A Review and Recommendations. In Proceedings of the International Conference on Fatigue Management in Transportation Operations, Seattle, WA, USA, 11 September 2005. [Google Scholar]
- Matthews, G. Towards a Transactional Ergonomics for Driver Stress and Fatigue. Theor. Issues Ergon. Sci. 2002, 3, 195–211. [Google Scholar] [CrossRef]
- Oron-Gilad, T.; Ronen, A. Road Characteristics and Driver Fatigue: A Simulator Study. Traffic Inj. Prevent. 2007, 8, 281–289. [Google Scholar] [CrossRef]
- Matthews, G.; Desmond, P.A. Personality and Multiple Dimensions of Task-Induced Fatigue: A Study of Simulated Driving. Person. Individ. Diff. 1998, 25, 443–458. [Google Scholar] [CrossRef]
- McCrae, R.R. The Five-Factor Model of Personality: Consensus and Controversy. In The Cambridge Handbook of Personality Psychology; Corr, P., Matthews, G., Eds.; Cambridge University Press: Cambridge, UK; pp. 129–141.
- Stephan, Y.; Sutin, A.R.; Luchetti, M.; Canada, B.; Terracciano, A. Personality and Fatigue: Meta-Analysis of Seven Prospective Studies. Sci. Rep. 2022, 12, 9156. [Google Scholar] [CrossRef]
- Matthews, G. Stress states, Personality and Cognitive Functioning: A Review of Research with the Dundee Stress State Questionnaire. Person. Indiv. Diff. 2021, 169, 110083. [Google Scholar] [CrossRef]
- Dorn, L.; Matthews, G. Prediction of Mood and Risk Appraisals from Trait Measures: Two Studies of Simulated Driving. Eur. J. Pers. 1995, 9, 25–42. [Google Scholar] [CrossRef]
- Matthews, G.; Desmond, P.A.; Joyner, L.A.; Carcary, B. A Comprehensive Questionnaire Measure of Driver Stress and Affect. In Traffic and Transport Psychology: Theory and Application; Carbonell Vaya, E., Rothengatter, J.A., Eds.; Pergamon: Amsterdam, The Netherlands, 1997; pp. 317–324. [Google Scholar]
- Matthews, G.; Saxby, D.J.; Funke, G.J.; Emo, A.K.; Desmond, P.A. Driving in States of Fatigue or Stress. In Handbook of Driving Simulation for Engineering, Medicine and Psychology; Fisher, D., Rizzo, M., Caird, J., Lee, J., Eds.; Taylor and Francis: Boca Raton, FL, USA, 2011; pp. 29-1–29-11. [Google Scholar]
- Rowden, P.; Matthews, G.; Watson, B.; Biggs, H. The Relative Impact of Work-Related Stress, Life Stress and Driving Environment Stress on Driving Outcomes. Accid. Anal. Prev. 2011, 43, 1332–1340. [Google Scholar] [CrossRef] [Green Version]
- Neubauer, C.E.; Matthews, G.; Saxby, D.J. Driver Fatigue and Safety: A Transactional Perspective. In Handbook of Operator Fatigue; Matthews, G., Desmond, P.A., Neubauer, C., Hancock, P.A., Eds.; Ashgate Press: Aldershot, UK, 2012; pp. 365–377. [Google Scholar]
- Jarosch, O.; Bellem, H.; Bengler, K. Effects of Task-Induced Fatigue in Prolonged Conditional Automated Driving. Hum. Factors 2019, 61, 1186–1199. [Google Scholar] [CrossRef]
- Arefnezhad, S.; Eichberger, A.; Koglbauer, I.V. Effects of Automation and Fatigue on Drivers from Various Age Groups. Safety 2022, 8, 30. [Google Scholar] [CrossRef]
- Vogelpohl, T.; Kühn, M.; Hummel, T.; Vollrath, M. Asleep at the Automated Wheel—Sleepiness and Fatigue During Highly Automated Driving. Accid. Anal. Prev. 2019, 126, 70–84. [Google Scholar] [CrossRef]
- Greenlee, E.T.; DeLucia, P.R.; Newton, D.C. Driver Vigilance in Automated Vehicles: Hazard Detection Failures are a Matter of Time. Hum. Factors 2018, 60, 465–476. [Google Scholar] [CrossRef] [PubMed]
- Greenlee, E.T.; DeLucia, P.R.; Newton, D.C. Driver Vigilance Decrement is More Severe During Automated Driving than Manual Driving. Hum. Factors 2022. [Google Scholar] [CrossRef] [PubMed]
- Bourrelly, A.; Jacobé de Naurois, C.; Zran, A.; Rampillon, F.; Vercher, J.L.; Bourdin, C. Long Automated Driving Phase Affects Take-Over Performance. IET Intell. Transp. Syst. 2019, 13, 1249–1255. [Google Scholar] [CrossRef]
- Matthews, G.; Neubauer, C.; Saxby, D.J.; Wohleber, R.W.; Lin, J. Dangerous Intersections? A Review of Studies of Fatigue and Distraction in the Automated Vehicle. Accid. Anal. Prev. 2019, 126, 85–94. [Google Scholar] [CrossRef] [PubMed]
- Neubauer, C.; Matthews, G.; Langheim, L.; Saxby, D. Fatigue and Voluntary Utilization of Automation in Simulated Driving. Hum. Factors 2012, 54, 734–746. [Google Scholar] [CrossRef]
- Gershon, P.; Ronen, A.; Oron-Gilad, T.; Shinar, D. The Effects of an Interactive Cognitive Task (ICT) in Suppressing Fatigue Symptoms in Driving. Transp. Res. Part F Traffic Psychol. Behav. 2009, 12, 21–28. [Google Scholar] [CrossRef]
- Steinberger, F.; Schroeter, R.; Watling, C.N. From Road Distraction to Safe Driving: Evaluating the Effects of Boredom and Gamification on Driving Behaviour, Physiological Arousal, and Subjective Experience. Comput. Hum. Behav. 2017, 75, 714–726. [Google Scholar] [CrossRef] [Green Version]
- Atchley, P.; Chan, M. Potential Benefits and Costs of Concurrent Task Engagement to Maintain Vigilance: A Driving Simulator Investigation. Hum. Factors 2011, 53, 3–12. [Google Scholar] [CrossRef] [Green Version]
- Atchley, P.; Chan, M.; Gregersen, S. A strategically timed verbal task improves performance and neurophysiological alertness during fatiguing drives. Hum. Factors 2014, 56, 453–462. [Google Scholar] [CrossRef] [Green Version]
- Large, D.R.; Burnett, G.; Antrobus, V.; Skrypchuk, L. Driven to Discussion: Engaging Drivers in Conversation with a Digital Assistant as a Countermeasure to Passive Task-related Fatigue. IET Intell. Transp. Syst. 2018, 12, 420–426. [Google Scholar] [CrossRef] [Green Version]
- Mahajan, K.; Large, D.R.; Burnett, G.; Velaga, N.R. Exploring the Effectiveness of a Digital Voice Assistant to Maintain Driver Alertness in Partially Automated Vehicles. Traffic Inj. Prevent. 2021, 22, 378–383. [Google Scholar] [CrossRef] [PubMed]
- Neubauer, C.E.; Matthews, G.; Saxby, D.J. The Effects of Cell Phone Use and Automation on Driver Performance and Subjective State in Simulated Driving. Proc. Hum. Factors Ergon. Soc. 2012, 56, 1987–1991. [Google Scholar] [CrossRef]
- Saxby, D.J.; Matthews, G.; Neubauer, C. The Relationship Between Cell Phone Use and Management of Driver Fatigue: It’s Complicated. J. Saf. Res. 2017, 61, 129–140. [Google Scholar] [CrossRef] [PubMed]
- Warm, J.S.; Parasuraman, R.; Matthews, G. Vigilance Requires Hard Mental Work and is Stressful. Hum. Factors 2008, 50, 433–441. [Google Scholar] [CrossRef]
- Shaw, T.H.; Matthews, G.; Warm, J.S.; Finomore, V.; Silverman, L.; Costa, P.T., Jr. Individual Differences in Vigilance: Personality, Ability and States of Stress. J. Res. Pers. 2010, 44, 297–308. [Google Scholar] [CrossRef]
- Warm, J.S.; Tripp, L.D.; Matthews, G.; Helton, W.S. Cerebral Hemodynamic Indices of Operator Fatigue in Vigilance. In Handbook of Operator Fatigue; Matthews, G., Desmond, P.A., Neubauer, C., Hancock, P.A., Eds.; Ashgate Press: Aldershot, UK, 2012; pp. 197–207. [Google Scholar]
- Borghini, G.; Astolfi, L.; Vecchiato, G.; Mattia, D.; Babiloni, F. Measuring Neurophysiological Signals in Aircraft Pilots and Car Drivers for the Assessment of Mental Workload, Fatigue and Drowsiness. Neurosci. Biobehav. Rev. 2014, 44, 58–75. [Google Scholar] [CrossRef]
- Kustubayeva, A.; Zholdassova, M.; Borbassova, G.; Matthews, G. Temporal Changes in ERP Amplitudes During Sustained Performance of the Attention Network Test. Int. J. Psychophysiol. 2022, 182, 142–158. [Google Scholar] [CrossRef]
- Brown, I.D. Driver fatigue. Hum. Factors 1994, 36, 298–314. [Google Scholar] [CrossRef]
- Matthews, G.; Desmond, A. Task-induced Fatigue States and Simulated Driving Performance. Q. J. Exp. Psychol. 2002, 55, 659–686. [Google Scholar] [CrossRef] [PubMed]
- Walker, H.E.; Trick, L.M. Mind-wandering While Driving: The Impact of Fatigue, Task Length, and Sustained Attention Abilities. Transp. Res. Part F Traffic Psychol. Behav. 2018, 59, 81–97. [Google Scholar] [CrossRef]
- Zeuwts, L.H.; Iliano, E.; Smith, M.; Deconinck, F.; Lenoir, M. Mental Fatigue Delays Visual Search Behaviour in Young Cyclists When Negotiating Complex Traffic Situations: A Study in Virtual Reality. Accid. Anal. Prev. 2021, 161, 106387. [Google Scholar] [CrossRef] [PubMed]
- Matthews, G.; Warm, J.S.; Reinerman-Jones, L.E.; Langheim, L.K.; Washburn, D.A.; Tripp, L. Task Engagement, Cerebral Blood Flow Velocity, and Diagnostic Monitoring for Sustained Attention. J. Exp. Psychol. Appl. 2010, 16, 187–203. [Google Scholar] [CrossRef]
- Lin, J.; Matthews, G.; Wohleber, R.W.; Funke, G.J.; Calhoun, G.L.; Ruff, H.A.; Szalma, J.; Chiu, P. Overload and Automation-dependence in a Multi-UAS Simulation: Task Demand and Individual Difference Factors. J. Exp. Psychol. Appl. 2020, 26, 218. [Google Scholar] [CrossRef]
- Naujoks, F.; Höfling, S.; Purucker, C.; Zeeb, K. From Partial and High Automation to Manual Driving: Relationship Between Non-Driving Related Tasks, Drowsiness and Take-Over Performance. Accid. Anal. Prev. 2018, 121, 28–42. [Google Scholar] [CrossRef]
- Radlmayr, J.; Gold, C.; Lorenz, L.; Farid, M.; Bengler, K. How Traffic Situations and Non-Driving Related Tasks Affect the Take-Over Quality in Highly Automated Driving. Proc. Hum. Factors Ergon. Soc. 2014, 58, 2063–2067. [Google Scholar] [CrossRef] [Green Version]
- Roche, F.; Thüring, M.; Trukenbrod, A.K. What happens when drivers of automated vehicles take over control in critical brake situations? Accid. Anal. Prev. 2020, 144, 105588. [Google Scholar] [CrossRef]
- Vogelpohl, T.; Kühn, M.; Hummel, T.; Gehlert, T.; Vollrath, M. Transitioning to manual driving requires additional time after automation deactivation. Transp. Res. Part F Traffic Psychol. Behav. 2018, 55, 464–482. [Google Scholar] [CrossRef]
- McDonald, A.D.; Alambeigi, H.; Engström, J.; Markkula, G.; Vogelpohl, T.; Dunne, J.; Yuma, N. Toward Computational Simulations of Behavior During Automated Driving Takeovers: A Review of the Empirical and Modeling Literatures. Hum. Factors 2019, 61, 642–688. [Google Scholar] [CrossRef]
- Zeeb, K.; Buchner, A.; Schrauf, M. What Determines the Take-Over Time? An Integrated Model Approach of Driver Take-Over After Automated Driving. Accid. Anal. Prev. 2015, 78, 212–221. [Google Scholar] [CrossRef] [PubMed]
- Saxby, D.J.; Matthews, G.; Hitchcock, T. Fatigue States are Multidimensional: Evidence from Studies of Simulated Driving. In Proceedings of the Driving Simulation Conference—North America 2007; University of Iowa: Iowa City, IA, USA, 2007. [Google Scholar]
- Bier, L.; Emele, M.; Gut, K.; Kulenovic, J.; Rzany, D.; Peter, M.; Abendroth, B. Preventing the Risks of Monotony Related Fatigue While Driving Through Gamification. Eur. Transp. Res. Rev. 2019, 11, 44. [Google Scholar] [CrossRef]
- Matthews, G.; Campbell, S.E.; Falconer, S.; Joyner, L.; Huggins, J.; Gilliland, K.; Grier, R.; Warm, J.S. Fundamental Dimensions of Subjective State in Performance Settings: Task Engagement, Distress and Worry. Emotion 2002, 2, 315–340. [Google Scholar] [CrossRef] [PubMed]
- Drews, F.A.; Pasupathi, M.; Strayer, D.L. Passenger and Cell Phone Conversations in Simulated Driving. J. Exp. Psychol. Appl. 2008, 14, 392–400. [Google Scholar] [CrossRef]
- Pedhazur, E.J. Multiple Regression in Behavioral Research: Explanation and Prediction, 3rd ed.; Holt, Rinehart & Winston: New York, NY, USA, 1997. [Google Scholar]
- Dillmann, J.; Den Hartigh, R.J.R.; Kurpiers, C.M.; Raisch, F.K.; de Waard, D.; Cox, R.F.A. Keeping the Driver in the Loop in Conditionally Automated Driving: A Perception-Action Theory Approach. Transp. Res. Part F Traffic Psychol. Behav. 2021, 79, 49–62. [Google Scholar] [CrossRef]
- Eriksson, A.; Stanton, N.A. Takeover Time in Highly Automated Vehicles: Noncritical Transitions to and from Manual Control. Hum. Factors 2017, 59, 689–705. [Google Scholar] [CrossRef]
- Kamphuis, J.; Meerlo, P.; Koolhaas, J.M.; Lancel, M. Poor Sleep as a Potential Causal Factor in Aggression and Violence. Sleep Med. 2012, 13, 327–334. [Google Scholar] [CrossRef]
- Funke, G.J.; Matthews, G.; Warm, J.S.; Emo, A.K. Vehicle Automation: A Remedy for Driver Stress? Ergonomics 2007, 50, 1302–1323. [Google Scholar] [CrossRef]
- Feldhütter, A.; Ruhl, A.; Feierle, A.; Bengler, K. The Effect of Fatigue on Takeover Performance in Urgent Situations in Conditionally Automated Driving. IEEE Intell. Transp. Syst. Conf. (ITSC) 2019, 15392, 1889–1894. [Google Scholar]
- Guo, H.; Zhang, Y.; Cai, S.; Chen, X. Effects of Level 3 Automated Vehicle Drivers’ Fatigue on Their Take-Over Behaviour: A Literature Review. J. Adv. Transp. 2021, 2021, 8632685. [Google Scholar] [CrossRef]
- Head, J.; Tenan, M.S.; Tweedell, A.J.; LaFiandra, M.E.; Morelli, F.; Wilson, K.M.; Ortega, S.V.; Helton, W.S. Prior Mental Fatigue Impairs Marksmanship Decision Performance. Front. Physiol. 2017, 8, 680. [Google Scholar] [CrossRef] [PubMed] [Green Version]
- Bowen, L.; Budden, S.L.; Smith, A.P. Factors Underpinning Unsafe Driving: A Systematic Literature Review of Car Drivers. Transp. Res. Part F Traffic Psychol. Behav. 2020, 72, 184–210. [Google Scholar] [CrossRef]
- Li, Z.; Chen, L.; Nie, L.; Yang, S.X. A Novel Learning Model of Driver Fatigue Features Representation for Steering Wheel Angle. IEEE Trans. Veh. Tech. 2021, 71, 269–281. [Google Scholar] [CrossRef]
- Heikoop, D.D.; de Winter, J.C.; van Arem, B.; Stanton, N.A. Acclimatizing to Automation: Driver Workload and Stress During Partially Automated Car Following in Real Traffic. Transp. Res. Part F Traffic Psychol. Behav. 2019, 65, 503–517. [Google Scholar] [CrossRef] [Green Version]
- Matthews, G.; Warm, J.S.; Reinerman-Jones, L.E.; Langheim, L.K.; Guznov, S.; Shaw, T.H.; Finomore, V.S. The Functional Fidelity of Individual Differences Research: The Case for Context-Matching. Theor. Issues Ergon. Sci. 2011, 12, 435–450. [Google Scholar] [CrossRef]
- Matthews, G.; Reinerman-Jones, L.; Abich IV, J.; Kustubayeva, A. Metrics for Individual Differences in EEG Response to Cognitive Workload: Optimizing Performance Prediction. Person. Indiv. Diff. 2017, 118, 22–28. [Google Scholar] [CrossRef]


| Conceptual Category | Symptoms | Performance Impact | Safety Implications |
|---|---|---|---|
| Core affective-motivational symptoms | Tiredness, sleepiness, de-motivation | Loss of attentional resources, slowed response, reduced on-task effort | Impaired attention to traffic environment |
| Physical | Muscle stiffness and discomfort, visual disturbance, headache | Source of distraction | Direct impact of distraction on safety unknown |
| Cognitive | Mind-wandering, confusion, intrusive thoughts, performance concerns | Cognitive interference associated with loss of working memory and resources | Impaired attention to traffic environment |
| Coping | Self-arousal, comfort seeking, mental withdrawal | Mixed–depends on strategy | Mixed–depends on strategy |
| Condition | Fatigue State Dimension | |||
|---|---|---|---|---|
| Muscular | Tiredness | Confusion | Comfort-Seeking | |
| Manual | ||||
| Control | 0.532 (0.77) | 1.793 (1.79) | 0.846 (1.396) | 0.597 (0.966) |
| Trivia | 0.862 (1.036) | 1.217 (1.605) | 0.491 (0.837) | 0.49 (0.524) |
| Cellphone | 0.567 (0.933) | 0.825 (1.375) | 0.26 (0.837) | 0.149 (1.088) |
| Partial Auto | ||||
| Control | 0.532 (1.132) | 2.134 (2.27) | 0.888 (1.45) | 0.49 (0.987) |
| Trivia | 0.549 (0.963) | 0.681 (1.663) | 0.019 (1.022) | 0.44 (0.827) |
| Cellphone | 0.718 (0.941) | 0.707 (1.263) | 0.369 (1.1) | 0.355 (0.54) |
| Full Auto | ||||
| Control | −0.243 (1.226) | 1.217 (1.159) | 0.388 (1.014) | 0.263 (0.929) |
| Trivia | 0.439 (0.775) | 0.932 (1.634) | 0.846 (1.353) | 0.628 (0.729) |
| Cellphone | 0.382 (0.685) | 0.694 (1.232) | 0.303 (0.872) | 0.206 (0.684) |
| Fatigue State | DSI Scale | |||||
|---|---|---|---|---|---|---|
| Fatigue Proneness | Aggression | Dislike of Driving | Hazard Monitoring | Thrill Seeking | ||
| Muscular | Pre | 0.082 | 0.091 | 0.040 | 0.118 | 0.092 |
| Post | 0.183 * | 0.179 * | 0.101 | 0.018 | 0.085 | |
| Change | 0.189 * | 0.171 * | 0.111 | −0.089 | 0.036 | |
| Tiredness | Pre | 0.063 | 0.100 | 0.215 ** | 0.124 | −0.001 |
| Post | 0.250 ** | 0.259 ** | 0.226 ** | − 0.015 | 0.038 | |
| Change | 0.268 ** | 0.252 ** | 0.117 | −0.118 | 0.050 | |
| Confusion | Pre | 0.160 * | 0.157 * | 0.266 ** | 0.020 | 0.140 |
| Post | 0.225 ** | 0.160 * | 0.232 ** | − 0.132 | 0.100 | |
| Change | 0.178 * | 0.084 | 0.097 | −0.177 | 0.015 | |
| Comfort | Pre | 0.237 ** | 0.205 ** | 0.338 ** | 0.129 | −0.068 |
| Post | 0.279 ** | 0.225 ** | 0.270 ** | 0.048 | − 0.056 | |
| Change | 0.170 * | 0.119 | 0.053 | −0.058 | −0.021 | |
| Fatigue State Dimension | |||||||||
|---|---|---|---|---|---|---|---|---|---|
| Muscular | Tiredness | Confusion | Comfort-Seeking | ||||||
| Step | df | R | ΔR2 | R | ΔR2 | R | ΔR2 | R | ΔR2 |
| 1. Pre-drive state | 1177 | 0.636 ** | 0.405 ** | 0.614 ** | 0.377 ** | 0.603 ** | 0.363 | 0.692 ** | 0.478 ** |
| 2. Automation | 2175 | 0.659 ** | 0.029 * | 0.617 ** | 0.004 | 0.604 ** | 0.002 | 0.693 ** | 0.002 |
| 3. Secondary media | 2173 | 0.667 ** | 0.011 | 0.650 ** | 0.042 ** | 0.617 ** | 0.016 | 0.708 ** | 0.021 * |
| 4. DSI scales | 5168 | 0.684 ** | 0.022 | 0.708 ** | 0.078 ** | 0.648 ** | 0.039 | 0.720 ** | 0.018 |
| Automation | Secondary Media | ||
|---|---|---|---|
| None | Trivia | Phone | |
| Manual | 0.408 (0.266) | 0.450 (0.266) | 0.459 (0.223) |
| Partial Auto | 0.583 (0.257) | 0.709 (0.418) | 0.553 (0.350) |
| Full Auto | 0.667 (0.250) | 0.651 (0.339) | 0.617 (0.486) |
| Fatigue State Dimension | ||||
|---|---|---|---|---|
| Muscular | Tiredness | Confusion | Comfort-Seeking | |
| SDLP (1st half) | 0.060 | 0.366 ** | 0.327 ** | 0.188 * |
| SDLP (2nd half) | 0.067 | 0.363 ** | 0.236 ** | 0.194 * |
| Braking RT | −0.156 | −0.154 | −0.256 ** | −0.034 |
| Step | df | Braking RT | |
|---|---|---|---|
| R | ΔR2 | ||
| 1. Automation | 2176 | 0.258 ** | 0.067 ** |
| 2. Secondary media | 2174 | 0.265 * | 0.004 |
| 3. DFQ scales | 4170 | 0.349 ** | 0.052 * |
| Step | df | SDLP–Early | SDLP–Late | ||
|---|---|---|---|---|---|
| R | ΔR2 | R | ΔR2 | ||
| 1. Automation | 1118 | 0.263 ** | 0.069 ** | 0.020 | 0.000 |
| 2. Secondary media | 2116 | 0.474 ** | 0.156 ** | 0.415 ** | 0.172 ** |
| 3. Automation × Media | 2114 | 0.515 ** | 0.041 * | 0.454 ** | 0.033 |
| 4. DFQ scales | 5110 | 0.598 ** | 0.092 ** | 0.541 ** | 0.086 * |
Disclaimer/Publisher’s Note: The statements, opinions and data contained in all publications are solely those of the individual author(s) and contributor(s) and not of MDPI and/or the editor(s). MDPI and/or the editor(s) disclaim responsibility for any injury to people or property resulting from any ideas, methods, instructions or products referred to in the content. |
© 2023 by the authors. Licensee MDPI, Basel, Switzerland. This article is an open access article distributed under the terms and conditions of the Creative Commons Attribution (CC BY) license (https://creativecommons.org/licenses/by/4.0/).
Share and Cite
Neubauer, C.E.; Matthews, G.; De Los Santos, E.P. Fatigue and Secondary Media Impacts in the Automated Vehicle: A Multidimensional State Perspective. Safety 2023, 9, 11. https://doi.org/10.3390/safety9010011
Neubauer CE, Matthews G, De Los Santos EP. Fatigue and Secondary Media Impacts in the Automated Vehicle: A Multidimensional State Perspective. Safety. 2023; 9(1):11. https://doi.org/10.3390/safety9010011
Chicago/Turabian StyleNeubauer, Catherine E., Gerald Matthews, and Erika P. De Los Santos. 2023. "Fatigue and Secondary Media Impacts in the Automated Vehicle: A Multidimensional State Perspective" Safety 9, no. 1: 11. https://doi.org/10.3390/safety9010011