Article

The Production of Gypsum Materials with Recycled Citrogypsum Using Semi-Dry Pressing Technology

by
Nataliya Alfimova
1,2,
Sevda Pirieva
3,4,*,
Ksenia Levickaya
1,4,
Natalia Kozhukhova
4,5 and
Mikhail Elistratkin
1
1
Building Materials Science, Products and Structures Department, Belgorod State Technological University Named after V.G. Shukhov, 46 Kostyukova Str., 308012 Belgorod, Russia
2
Research and Education Center «Additive Technologies», National Research Tomsk State University, 36 Lenin Ave., 634050 Tomsk, Russia
3
Department of Real Estate Assessment and Management, Belgorod State Technological University Named after V.G. Shukhov, 46 Kostyukova Str., 308012 Belgorod, Russia
4
Laboratory of Advanced Materials and Technologies, Belgorod National Research University, 85 Pobedy Str., 308015 Belgorod, Russia
5
Department of Material Science and Material Technology, Belgorod State Technological University Named after V.G. Shukhov, 46 Kostyukova Str., 308012 Belgorod, Russia
*
Author to whom correspondence should be addressed.
Recycling 2023, 8(2), 34; https://doi.org/10.3390/recycling8020034
Submission received: 30 January 2023 / Revised: 2 March 2023 / Accepted: 6 March 2023 / Published: 8 March 2023
(This article belongs to the Special Issue Sustainable Materials from Waste and Renewable Sources)

Abstract

:
The search for ways to utilize and recycle industrial by-products is the basic principle that governs rational environmental management, synthesis of “green” materials, and appears as one of the main criteria for sustainable development in most countries of the world. Gypsum-containing waste (GCW) derived from industries, represents a large-tonnage product. The production of gypsum materials could be one of the ways to recycle GCW products. GCW from various industries can be used as an alternative to natural raw materials when producing gypsum binders. However, the features of GCW do not allow the production of a high-quality binder when traditional technologies are applied, so it requires the development of additional methods or the introduction of various modifiers to the binder system. One of the ways to increase the efficiency of GCW as a raw material for the production of gypsum binders is to apply a semi-dry pressing method, at reduced values of the W/S ratio of the binder. The objective of this research was to study the possibility of increasing the efficiency of GCW using citrogypsum for production of gypsum materials, by optimization of the mix design and by applying a semi-dry pressing method, using a lower pressure load at the molding stage. The mix design and technological parameters were optimized using mathematical planning of the experimental method. Parameters such as the amount of citrogypsum as an additive in the raw mixture, molding pressure, and water–solid (W/S) ratio were taken as input parameters of variation. To plot the relationship of the input–output parameters, the SigmaPlot software was applied, to analyze and demonstrate scientific and statistical data in the form of nomograms. It has been established that the use of the semi-dry pressing method with the optimal mix design and technological parameters, makes it possible to obtain gypsum samples with demolding strengths up to 2 MPa, and final compressive strengths up to 26 MPa. The incorporation of citrogypsum and the optimal W/S ratio of 0.25, results in positive effects, such as a reduction in the sticking properties of the mix during the demolding stage, and the homogeneity of compaction and visual appearance of the samples were also improved.

1. Introduction

Rational nature management is one of the priorities for sustainable development in most countries of the world. Of particular importance, in this aspect, is the search for ways to utilize and recycle industrial byproducts. The byproducts include such gypsum-containing waste (GCW) as phosphogypsum [1,2], flue gas desulfurization gypsum [3,4], borogypsum [5,6], citrogypsum (CG) [7,8], etc. The proportion of the processed GCW in the world is only about 15% [1]. The rest of the byproducts accumulate in dumps or artificial reservoirs, which leads to serious pollution of the environment: soil, water, and atmosphere [1,9,10].
In the territory of the Belgorod region (Russia), there is a citrogypsum storage site, where the process of waste accumulation has been realized for 50 years. The total storage area is about 58.5 thousand m2, with a total reserve of approximately 351.2 thousand m3. Therefore, nowadays the problem of searching for ways to process this GCW is very relevant [8].
Most often, GCW is considered as a raw material for the production of various ag-ricultural fertilizers [11,12,13], construction materials [14,15,16], road construction structures [10], gypsum binders [17,18,19], additives for the setting control of Portland cement [20,21,22], and as a reactive component in alkali-activated binders [23,24].
Of the applications presented, the manufacture of gypsum binders and products al-lows the largest volume of citrogypsum to be recycled. Previous studies investigated the possibility of a citrogypsum-based binder (CGB) production, by CG dehydration under high temperatures. However, the resulting CGB was characterized by increased water demand (standard consistency was 123%) and low compressive strength (up to 0.7 MPa, only) [25]. Such characteristics make it impossible to obtain products using injection molding technology and require the search for other ways to recycle CG in gypsum binders and materials.
A review of world scientific experience has shown that, to improve the efficiency of GCW as a raw material for the production of binders, various scientific groups have developed several additional measures, including the use of modifiers, technological methods, special regimes for the production of gypsum binders, and materials based on them, as well [14,15,16,17,26,27].
Among these methods, is pressing in a water medium, which allows the production of gypsum materials with desirable physical and mechanical characteristics [28,29] and pressing of a semi-dry raw mixture as well [30,31,32,33]. Zhou et al. [28,29], for the manufacture of plaster tiles as an analogue of drywall, used CaSO4 0.5H2O as a binding component, obtained from washed phosphogypsum heated at temperatures of 150 °C [28] and 170 °C [29]. A feature of the technology is applying pressing of granules at a pressure of 20 MPa in an aqueous medium, which were made by moistening the binder. It is important to note that this method is characterized by a large number of technological stages. In addition, the pressing stage and water-immersion must be repeated 24 times.
Mirsaev et al. [30] showed the possibility of using the semi-dry mixture pressing method (W/S = 0.17–0.22; molding pressure = 20 MPa), to manufacture small-piece wall materials based on gypsum binder and phosphogypsum. As a result, the authors designed a gypsum brick of 250 × 120 × 65 mm and a solid partition block of 120 × 190 × 590 mm, with a compressive strength of 10.5 MPa, as well as a wall block of 250 × 120 × 138 mm with a voidage of 30% and compressive strength of 5.4 MPa.
Also, in the reports of Petropavlovskaya et al. [31,32,33], the effectiveness of molding at a pressure load of 20–40 MPa was proved, when manufacturing gypsum materials based on byproducts of a faience factory and their mixtures with various mineral components, such as ammonium alum, microcalcite, and Portland cement. In particular, Petropavlovskii et al. [31] showed the possibility of increasing the efficiency of gypsum-containing faience production waste, by optimizing the formulation of the raw mixture for brick production by the pressing method. This made it possible to obtain gypsum materials with a compressive strength 2–2.5 times higher, and with the addition of microcalcite, 3–6 times higher, compared to wall materials based on natural gypsum produced by traditional technologies.
Thus, the minimum pressure load that was used to mold the GCW-based materials was 20 MPa. The possibility of production of GCW-based materials under lower pressure load has not been previously studied. At the same time, in real production, lower pressure at the molding stage will help to reduce the energy and metal intensities of the technological process and, as a result, will positively affect the cost of the final gypsum products.
Based on the above review, the objective of this article is to study the possibility of using citrogypsum to produce gypsum materials by applying a semi-dry pressing method, using a lower pressure load at the molding stage.

2. Results

2.1. Appearance of Experimental Mixes

The appearance of the experimental mixes at two days after demolding is presented in Table 1. All photos of samples are given in vertical orientation.

2.2. Properties of Experimental Mixes

The physical and mechanical characteristics of the experimental mixes are given in Table 2.

3. Discussion

3.1. Influence of Formulation and Molding Pressure on the Appearance of Samples

When analyzing the appearance of the samples, it was revealed that some of the mixes were characterized by defects in the form of delamination, surface cracks, and a wedge (Table 1). A comparison of the mix design and technological parameters with the formation of defects on the surface, made it possible to establish that lower contents of FCG and water in the raw mixture, led to higher defectiveness of the surface. At the same time, a lower molding pressure did not significantly affect the quality of the surface. However, the effect of the lower pressure was manifested in a reduced water content in the mixture, in the form of a deterioration in the quality of the surface. Mix 8 (Table 1) prepared at a molding pressure of 3 MPa, a minimum content of FCG (10% by wt.), and W/S = 0.15, was characterized by the maximum wedge and low surface quality. In addition, the presence of a significant number of defects on the surface was typical for reference mixes molded without the FCG (Table 1, mixes 16, 17, 18). It was observed that, the number of defects increased as the W/S ratio decreased.
The occurrence of defects on the surface of the samples is due to the high adhesion of the gypsum paste to the mold, as well as the friction of the peripheral sections of the molding mixture on the shaping metal surface of the mold, both during the molding and demolding stages. An increase in the FGC content and water in the mixture makes it possible to reduce the value of near-wall friction and improve the quality of the surface. This is because water acts as a lubricant, and FGC, being an inert component, has low adhesion to metal.
Also, when assessing the appearance of the CGB samples, a change in their height was observed. The height of the CGB samples is influenced by molding pressure and the FCG content in the raw mixture. Other things being equal, with increased molding pressure, the height of CGB samples decreased, which is associated with their better compaction. With an increase in the content of FCG in the raw mixture, the height of the samples increased, which is associated with a higher specific surface area of FCG versus specific surface area of CGB.

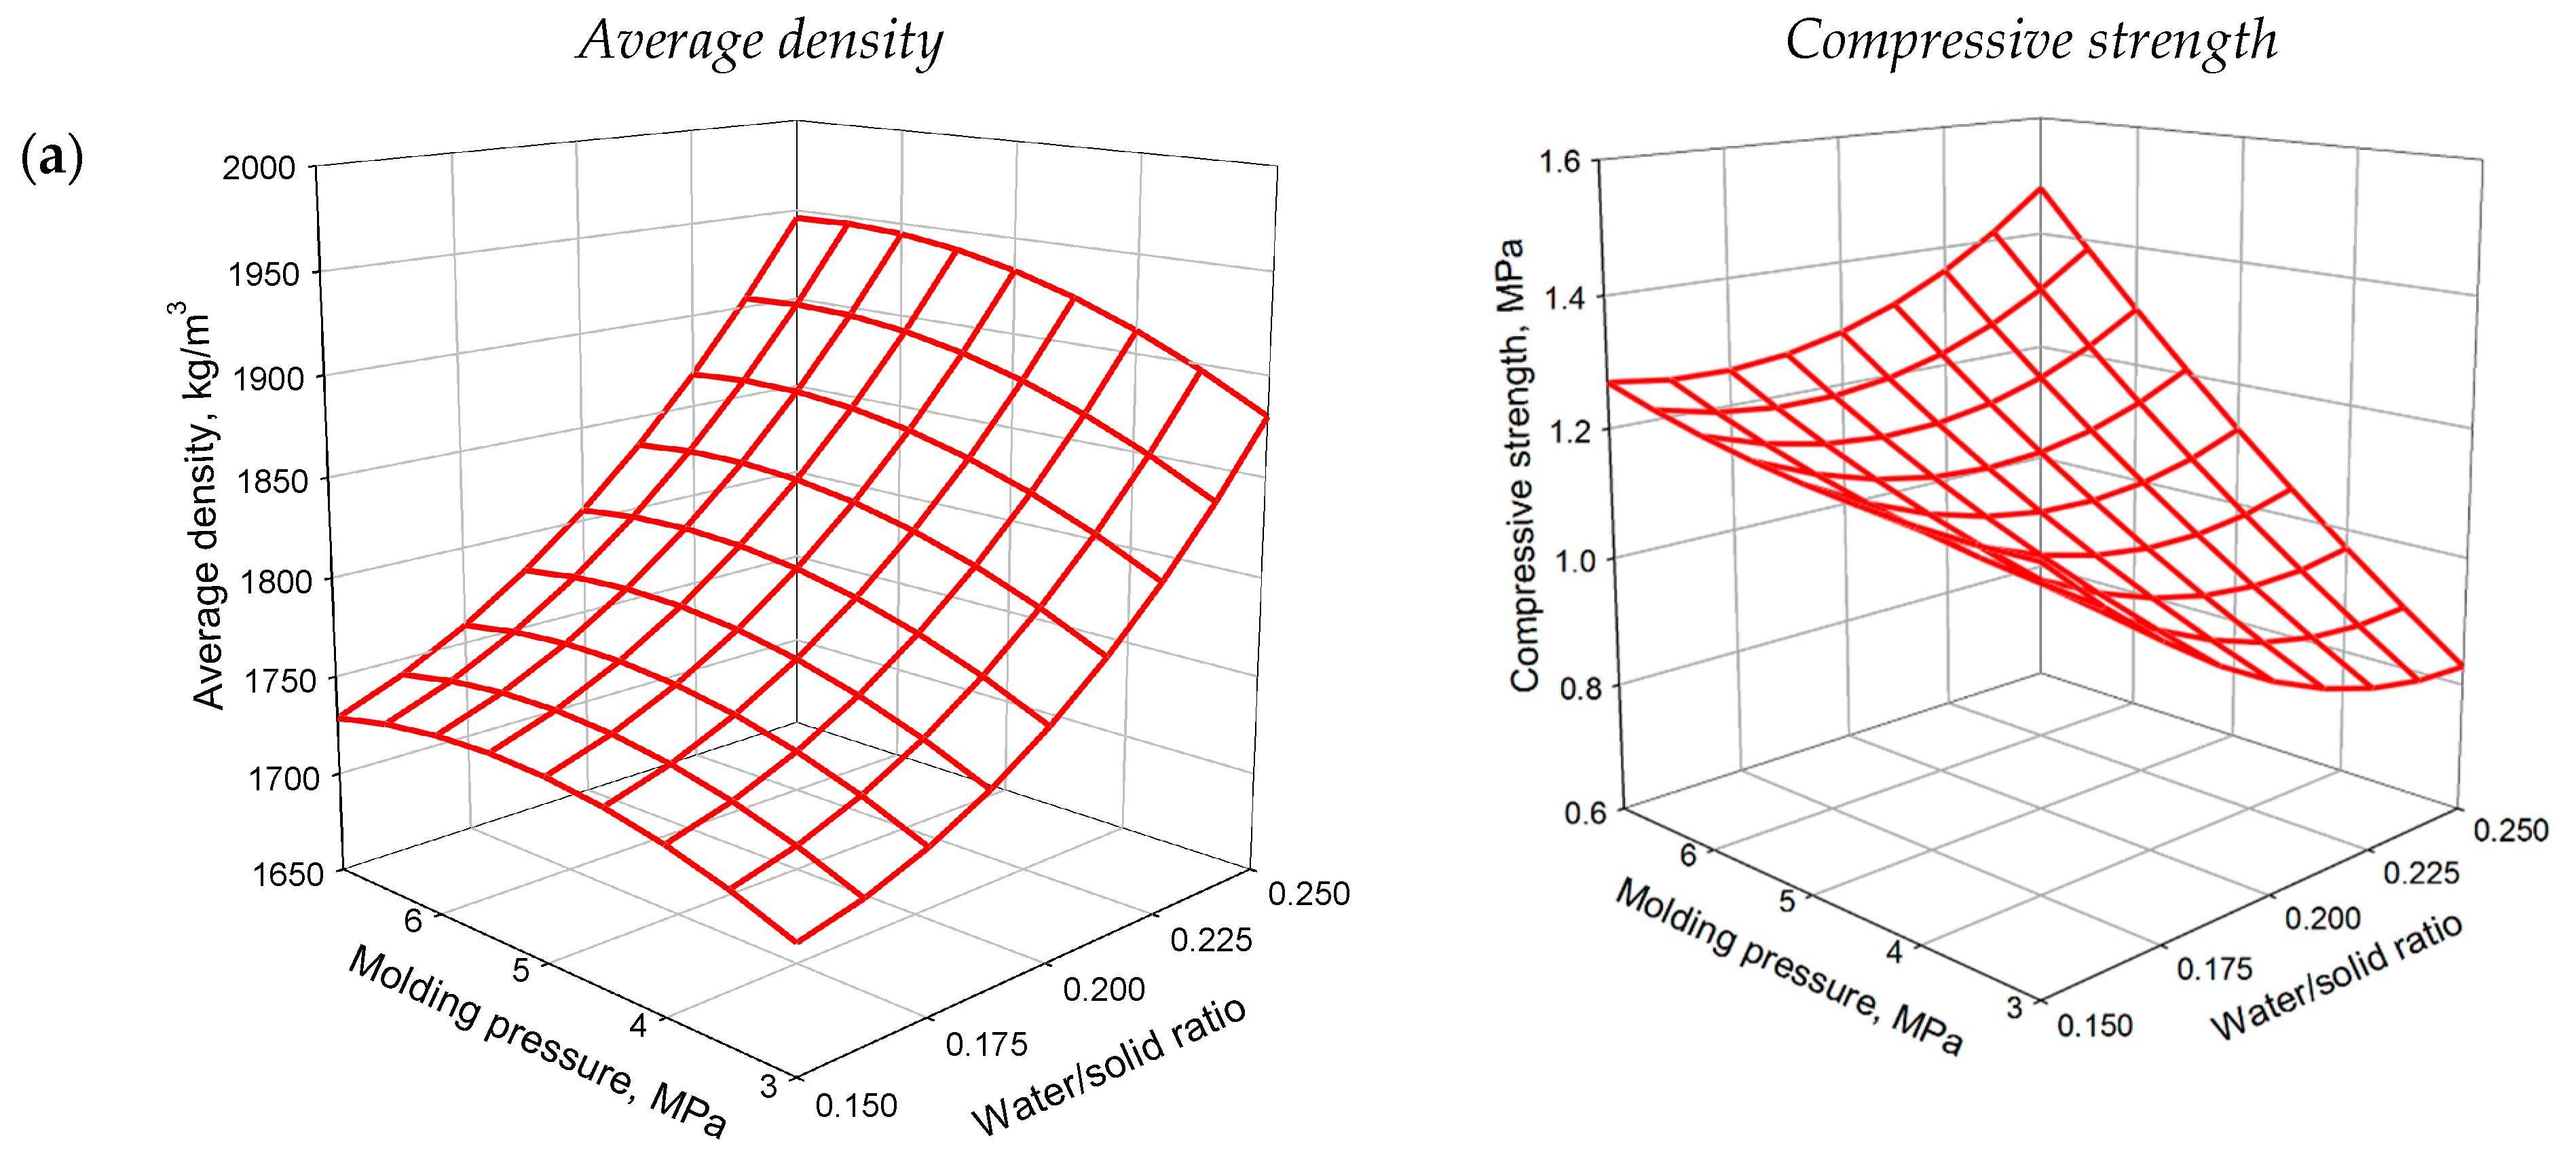
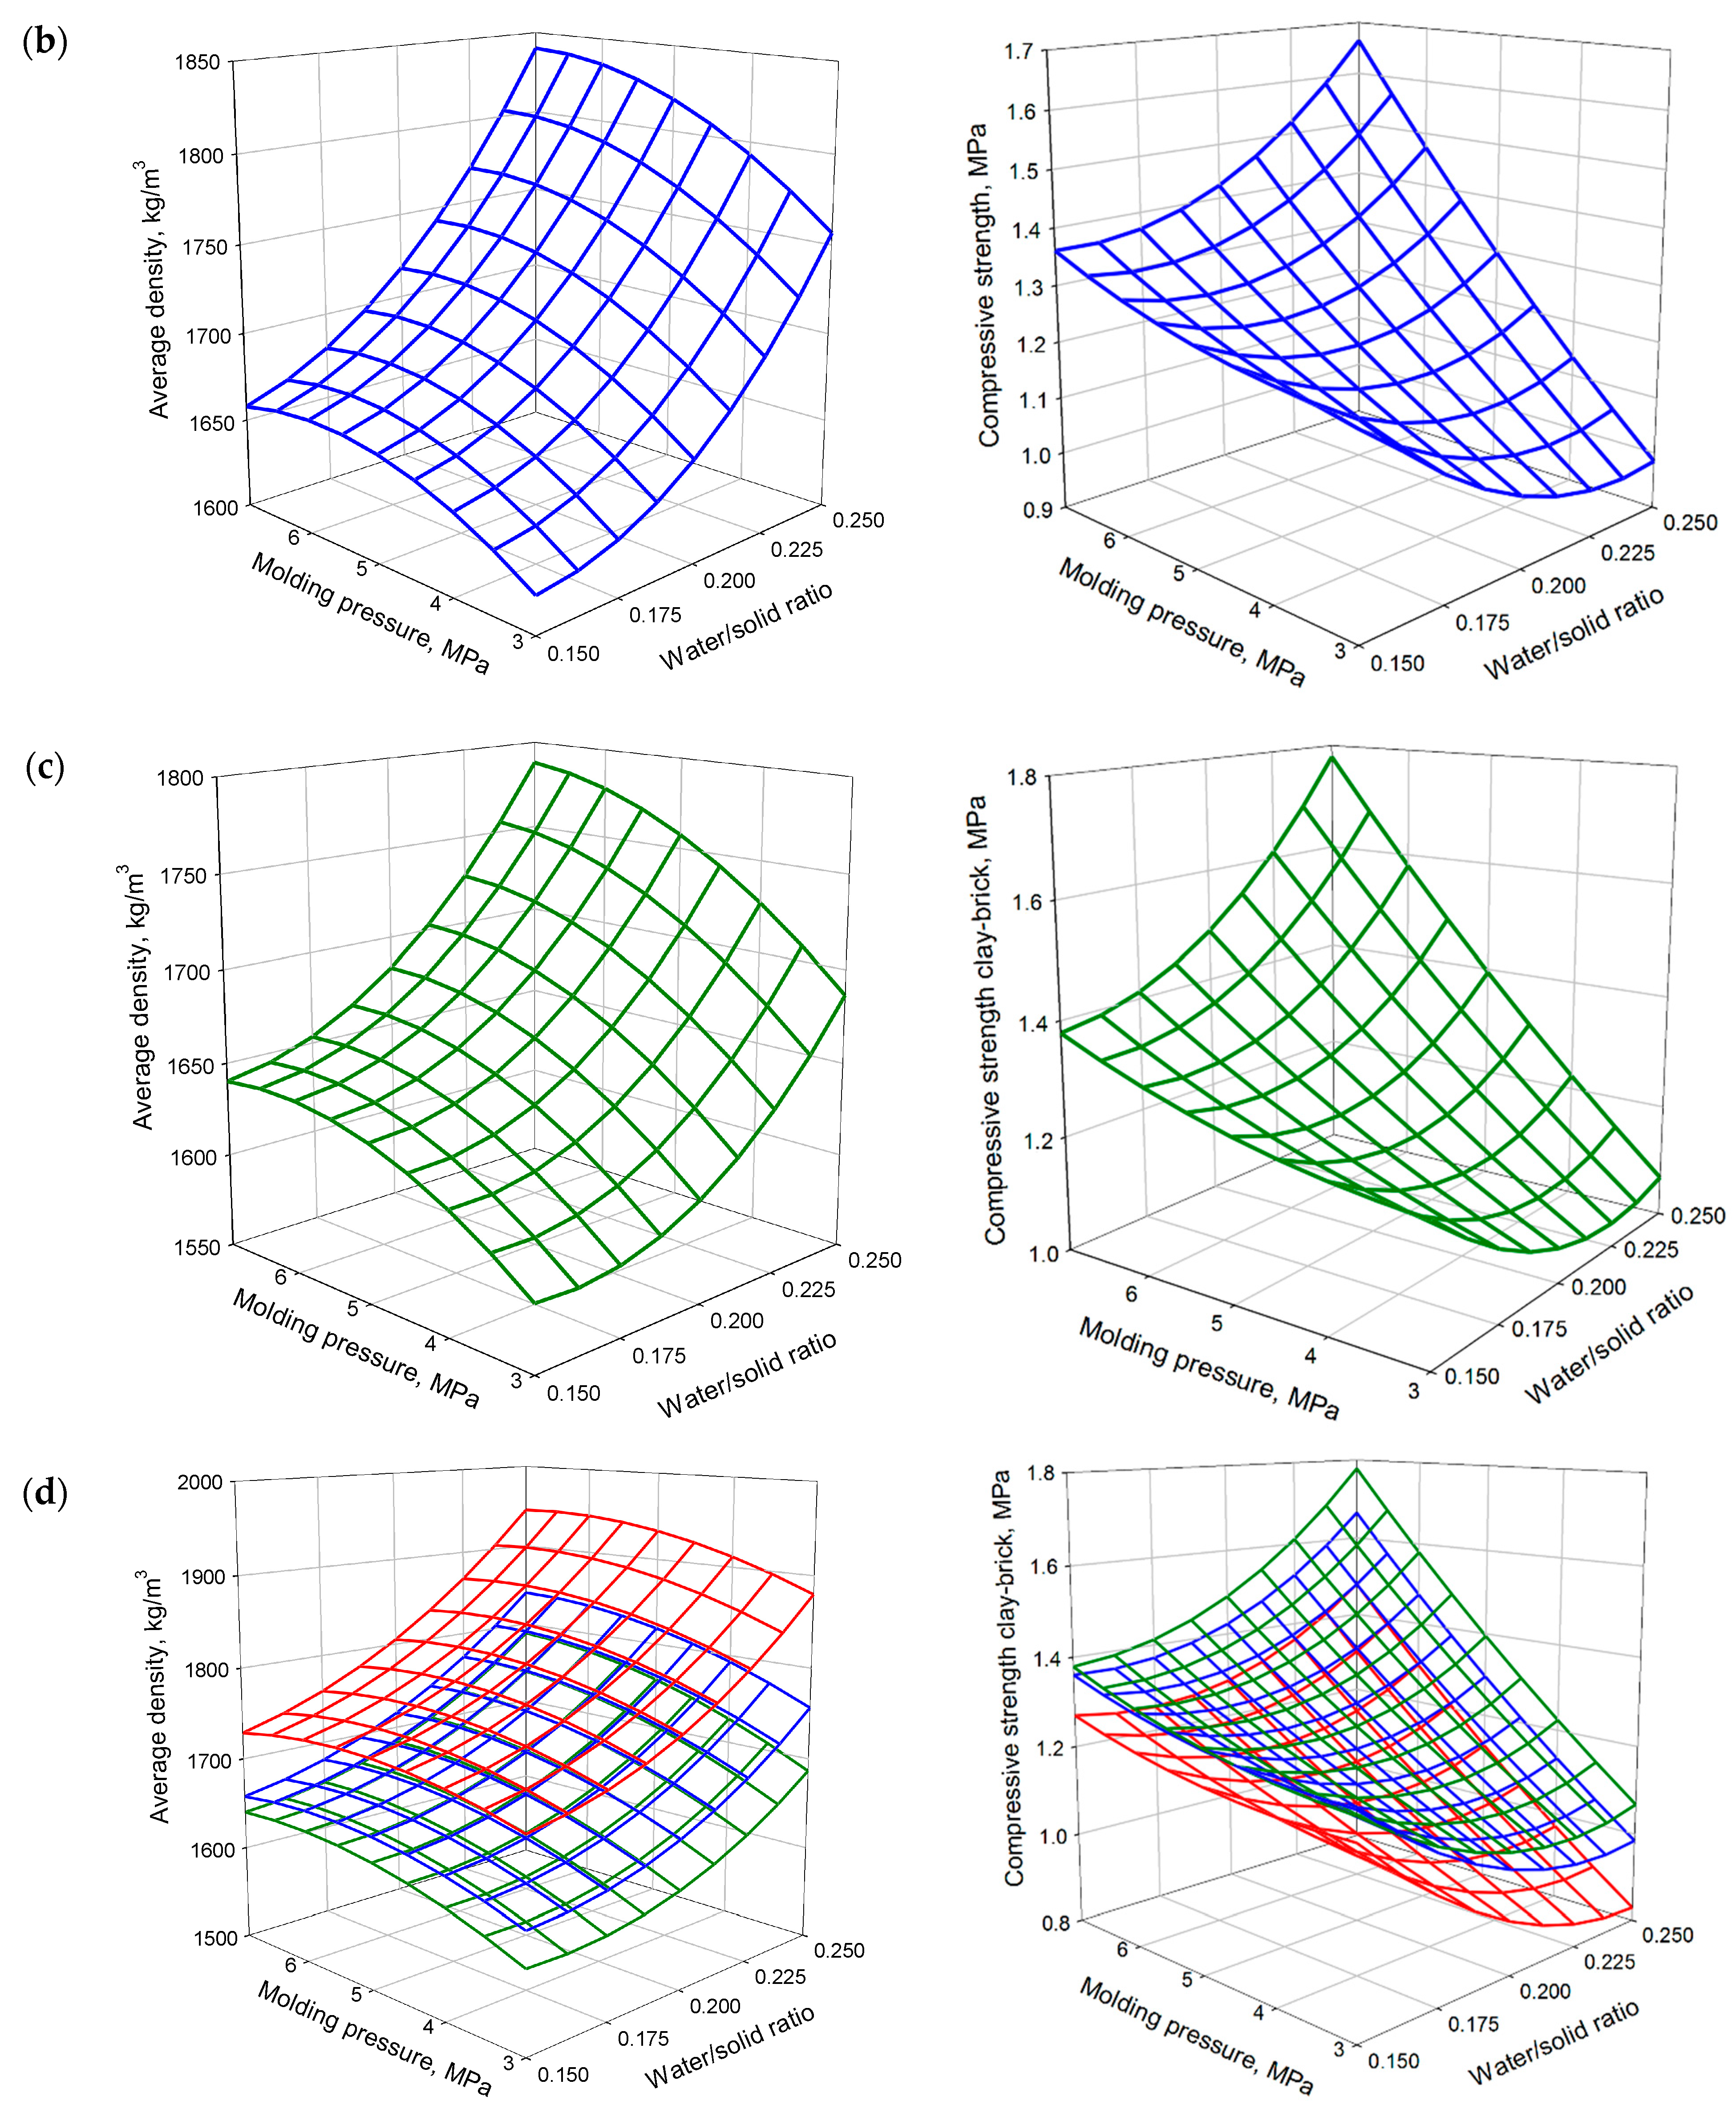
3.2. Influence of Formulation and Molding Pressure on the Physical and Mechanical Characteristics of Samples

It is known that when producing materials by the pressing method, their compressive strength immediately after molding is of great importance. Insufficiently high strength values lead to an increase in the rejection rate, due to surface damage that may occur as a result of product transportation. Normally, the minimum compressive strength for fresh samples should be within 0.5 MPa. This value meets the requirements of enterprises focused on pressing method production of materials, using a semi-dry raw mixture. According to these requirements, the strength of fresh samples must be at least 0.5 MPa. With this in mind, the influence of the formulation and technological parameters on the average density and compressive strength of the fresh samples was studied. To do this, immediately after demolding, weighing, measurement, and determination of the compressive strength of the samples were carried out.
Nomograms of the dependence of the average density and compressive strength (Figure 1) on the input variable parameters, were carried out for the fresh samples.
An analysis of the influence of the mix design and molding pressure on the average density of the fresh samples, showed that it is directly dependent on molding pressure, W/S ratio, and the CGB content in the raw mixture.
At the same time, when analyzing the influence of mix design and molding pressure on the compressive strength of the fresh samples, some of the following patterns were established: regardless of the FCG content in the raw mixture, the maximum values of the controlled parameter were achieved at the maximum molding pressure, of 7 MPa, and W/S ratio of 0.25; the minimum values of the controlled parameters were observed at the minimum molding pressure, of 3 MPa, and the minimum W/S ratio of 0.15. This is due to an increase in the proportion of CGB, which has high adhesion to the mold surface, and, consequently, the negative effect of wall friction on the uniformity of compaction of the samples increases. At the same time, with an increase in molding pressure, in combination with an increased W/S ratio, the negative effect of wall friction on the uniformity of the seal decreases, and the compressive strength of the fresh sample increases.
It should also be noted that an increase in the FCG content in the raw mixture contributes to a decrease in the average density of the fresh samples (Figure 1d). At the same time, the compressive strength of fresh samples increases with increasing FCG content. This is due to a decrease in the proportion of CGB in the raw mixture, which leads to a decrease in friction and adhesion of the raw mixture to the mold surface. This, in turn, contributes to a more homogeneous compaction of the samples by volume, and in the case of a high W/S ratio, to the complete elimination of defects on the surface of the samples. The positive effect of the FCG content in the raw mixture on the compressive strength of the fresh samples is also evidenced by the fact that, at a molding pressure load of 3 MPa, with an increase in the W/S ratio from 0.15 to 0.25, the decrease in compressive strength is: 13% with an FCG content of 50% (Figure 1c), 21% with an FCG content of 30% (Figure 1b), and 29.7% with an FCG content of 10% (Figure 1a).
A comparison of the physical and mechanical characteristics of the reference mixes (mixes 16–18, Table 2) demonstrates the average density and compressive strength of fresh samples are directly dependent on the molding pressure and W/S ratio. It should also be noted that the compressive strength of the reference mixes is lower versus mixes with the FCG content (mixes 1, 4, 6, 11, 15, Table 2) molded with certain mix designs and molding pressures (Table 2). This fact confirms the positive effect of the FCG on the homogeneous compaction of the samples.
In general, the compressive strength of the fresh samples with FCG and reference ones, is in the range of 0.75–1.99 MPa (Table 2), which is 1.5–4 times higher than the minimum required values (0.5 MPa). This will allow a reduction in rejection during production, and allow the possibility of producing hollow materials.

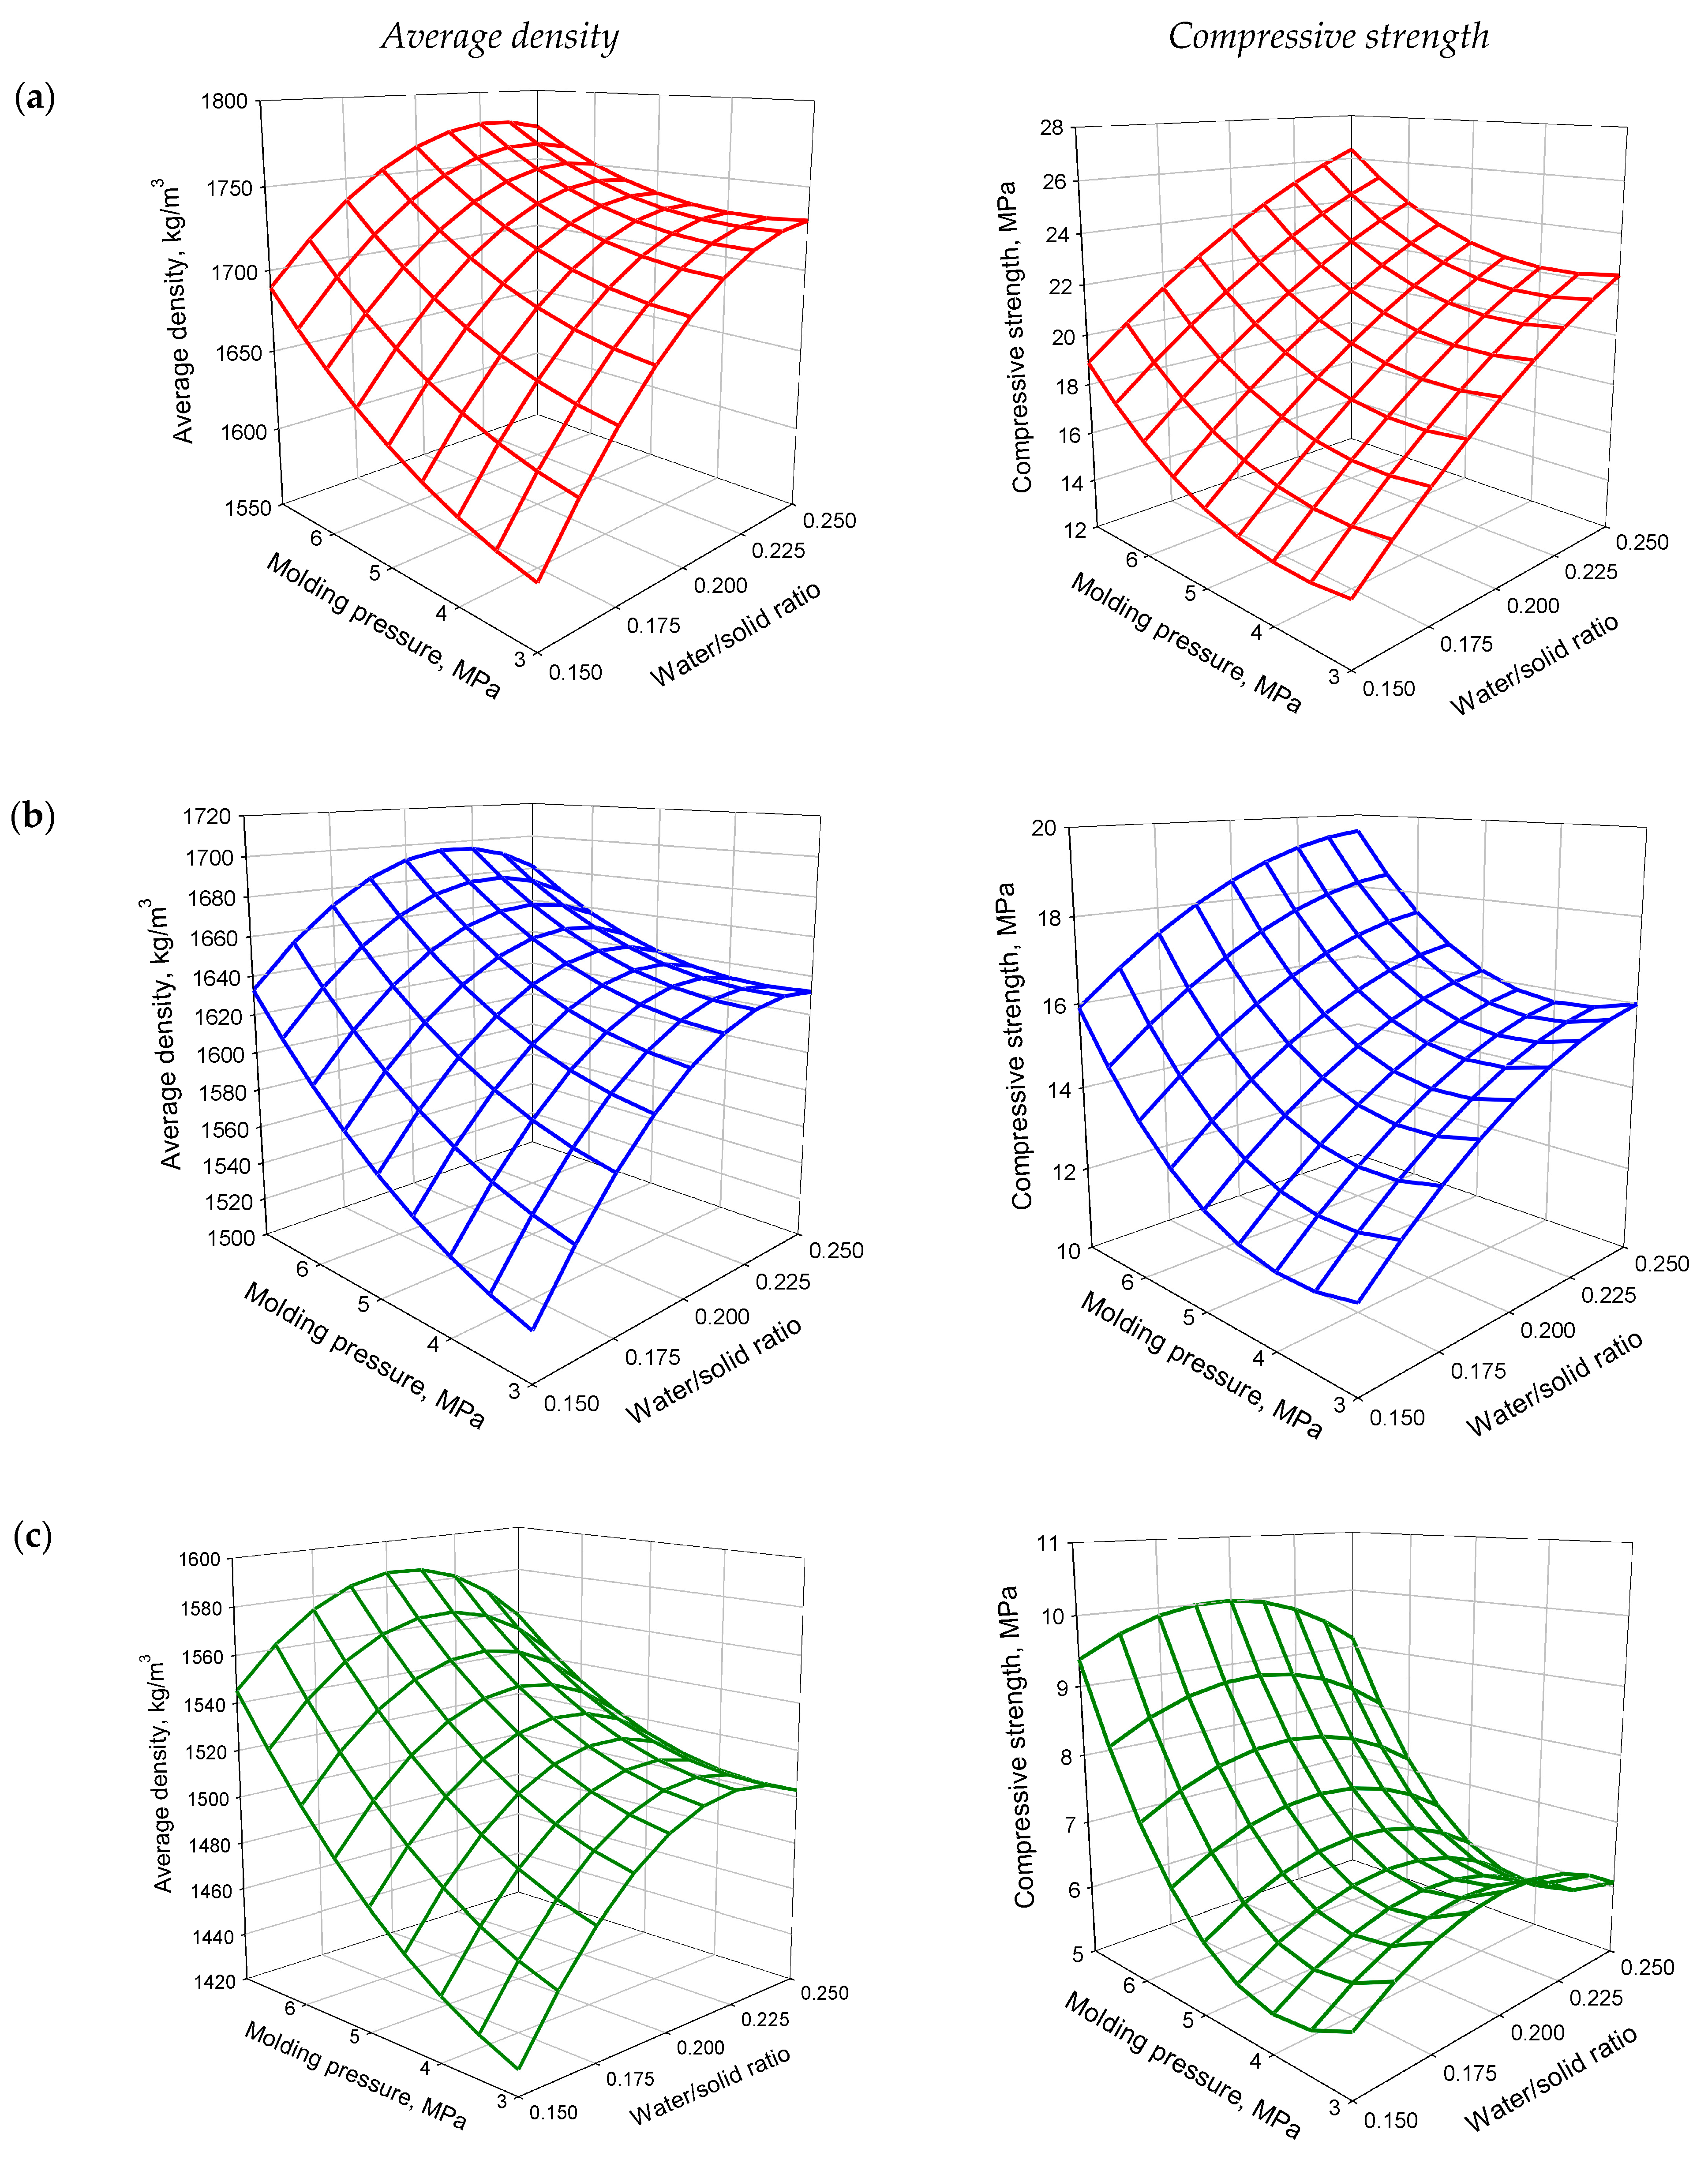
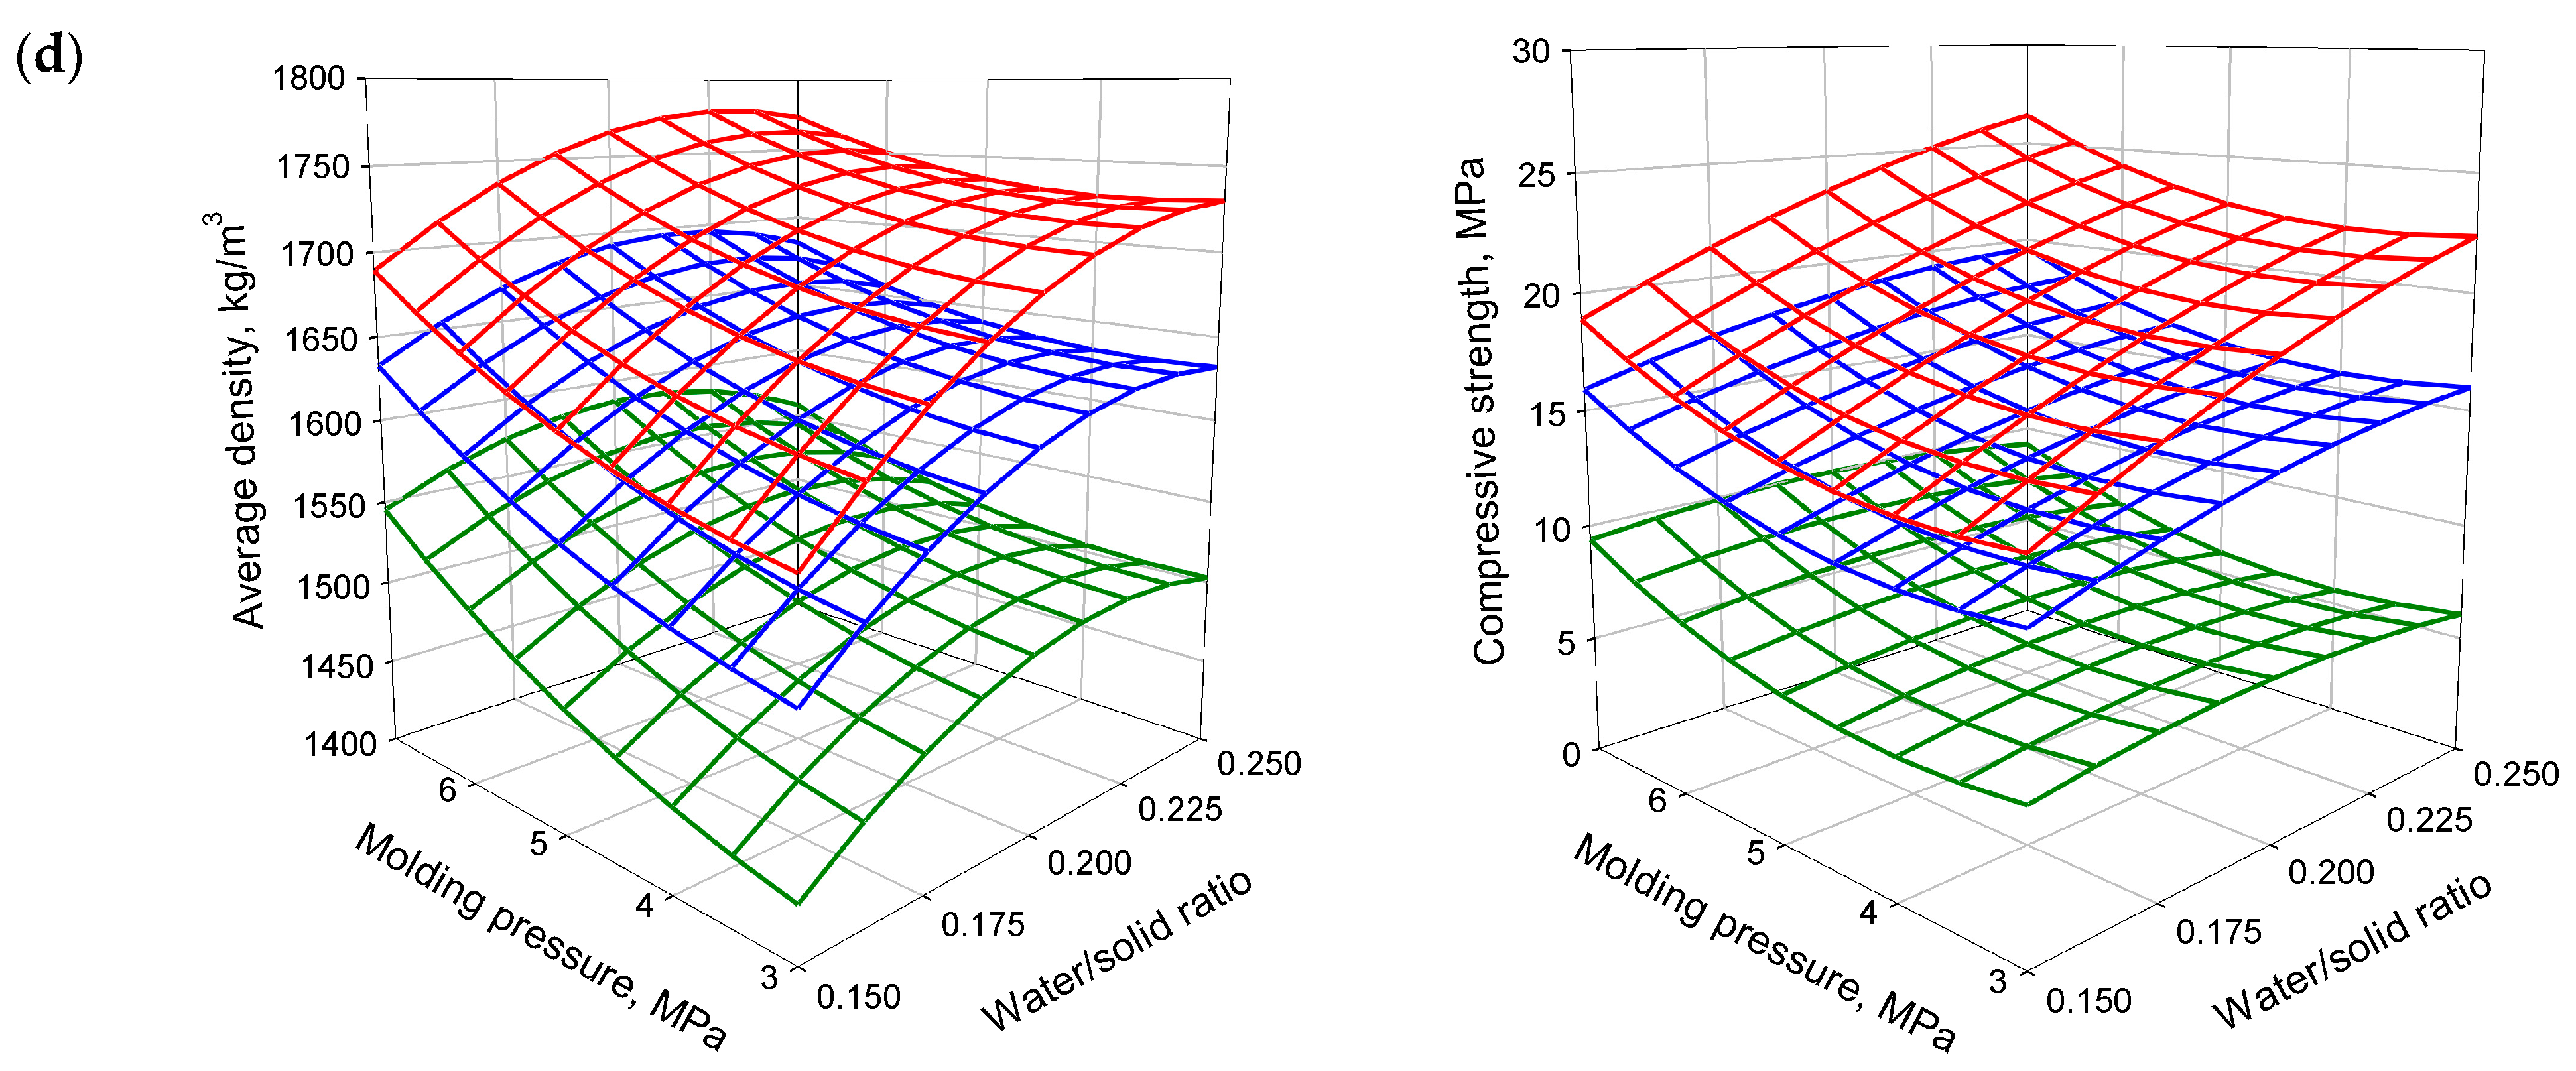
3.3. Influence of Formulation and Molding Pressure on the Physical and Mechanical Characteristics of Samples at Two Days after Demolding

The dependences of the average density and compressive strength of the mixes at two days after demolding, on the input variable parameters, are plotted in Figure 2. Figure 2 demonstrates that the compressive strength is directly dependent on molding pressure. Regardless of the W/S ratio, the maximum strength values are typical for mixes with an FCG content of 10%, (mixes 5–8, 10), molded at a pressure load of 7 MPa (Figure 2a); the minimum compressive strength is typical for mixes containing 50% FCG (mixes 1–4, 9), molded at a pressure load of 3 MPa (Figure 2d). In addition, an increase in molding pressure leads to an increase in the average density of CGB, with similar input variation parameters. An analysis of the effect of the W/S ratio on compressive strength showed that, regardless of molding pressure, the maximum compressive strength is observed for mixes with an FCG content of 10% (mixes 5–8, 10), and with a W/S ratio of 0.25 (Figure 2a); the minimum compressive strength is observed for mixes with 50% FCG and with a W/S ratio of 0.15. (Figure 2d). In cases where the content of FCG in the raw mixture is 10–30%, the compressive strength is directly dependent on the molding pressure and W/S ratio (Figure 2a,b). However, at 50% FCG (mixes 1–4, 9, Figure 2c), regardless of molding pressure, an increase in the W/S ratio from 0.20 to 0.25 leads to a slight decrease in compressive strength, up to 8 % (Figure 2c). A similar effect of the W/S ratio on the average density of the mixes with 50% FCG is observed (Figure 2c). In all cases, increasing the W/S ratio from 0.15 to 0.20 provides the maximum increase in compressive strength and average density. A further increase in the W/S ratio from 0.20 to 0.25 provides a slight increase in strength for mixes 1–4 and 9 (Figure 2c). In the same W/S ratio range, a slight decrease in average density for mixes 1–4, and 9, is observed.
The resulting relationships can be explained by the fact that water introduced into the raw mixture participates in hydration processes and also acts as a lubricant, providing better compressibility (more homogeneous densification) of the mixture. This leads to an increase in the average density and compressive strength. So, a higher content of CGB in the raw mixture provides better compressibility. In cases where the CGB content in the raw mixture is higher than 50%, the optimal W/S ratio is 0.225–0.25. At lower W/S ratios, the water content is insufficient to ensure complete hydration of the gypsum binder. In this case, the compaction of the mixture during the pressing stage is extremely difficult, which predetermines a decrease in the average density and leads to a decrease in the compressive strength of the samples.
For mixes 1–4, and 9, the optimal W/S ratio is 0.20–0.225. If the water content required for hydration increases up to a W/S ratio of 0.25, the concentration of unbound water increases. This water evaporates during the drying process, reducing the average density and compressive strength of the samples.
For the convenience of determining the effect of the FCG content in the raw mixture on the physical and mechanical characteristics of the samples, the obtained dependences were superimposed, in a combined nomogram in Figure 2d. The character of the nomogram demonstrates that, an increase in the FCG content in the raw mixture contributes to a decrease in the compressive strength and average density of the CGB, which is explained by the liquefaction of the binding system. With an increase in the FCG content from 10 to 30%, the maximum decrease in compressive strength (up to 33.5%) is observed, at the maximum values of the W/S ratio of 0.25 and molding pressure load of 7 MPa. The minimum decrease in compressive strength (up to 17.4%) is observed at a W/S ratio of 0.15 and molding pressure load of 3 MPa.
With a further increase in the FCG content from 30 to 50%, regardless of molding pressure and W/S ratio, the compressive strength decreases by 50–55%, on average.
An analysis of the physical and mechanical characteristics of the reference mixes (Table 2) demonstrates the general effects of the W/S ratio and molding pressure on the physical and mechanical characteristics of CGB without FCG. In particular, it was found that the greatest increase in physical and mechanical characteristics is observed with an increase in molding pressure from 3 to 5 MPa and a W/S ratio from 0.15 to 0.20. In this case, the compressive strength increased by 60%, and the average density by 7%. A further increase in molding pressure, from 5 to 7 MPa, and the W/S ratio from 0.20 to 0.25, increased the compressive strength by 10% and the average density by 0.4%, only.
Also, a comparison of the physical and mechanical characteristics of the reference mixes and the mixes with FCG, made it possible to establish that, at a W/S ratio of 0.25 and a molding pressure of 7 MPa, an FCG content in the raw mixture from 10 to 50% (Table 2, mixes 1 and 5) leads to a decrease in the compressive strength by 12.3–68%, and average density by 0–13.2%. At a W/S ratio of 0.2 (Table 2, mixes 9 and 10) and a molding pressure of 5 MPa, the compressive strength is reduced by 24.7–76.5%, and the average density is reduced by 3.2–14.5%. At the same time, at a W/S ratio of 0.15 and a molding pressure of 3 MPa, the introduction of 10% FCG into the raw mixture (Table 2, mix 8) contributes to an increase in compressive strength by 31.5%; and with 30% FCG, this increase is 19.2%. In these cases, the average density decreases by 3.7% and 4.2%, respectively. A further increase in the FCG to 50% (Table 2, mix 4) results in a decrease in compressive strength by 42.9%, and average density by 14.3%, in comparison with reference mix 16.
The increase in compressive strength for mixes with FCG contents from 10 to 30%, in comparison with the reference mixes, is explained by the absence of FCG in the system. A fifteen percent water content is not enough for effective hydration of the gypsum binder. At the same time, the addition of FCG, from 10 to 30%, eliminates the lack of water for hydration. In addition, the presence of the FCG in the raw mixture contributes to more homogeneous compaction of the samples by volume, due to a decrease in adhesion to the mold surface. A further increase in the content of the FCG, up to 50%, significantly deliquates the system, which negatively affects the strength characteristics of the samples.
A comparison of the results for fresh samples (Figure 1) and samples at two days after demolding (Figure 2), showed that, regardless of the FCG content in the raw mixture and molding pressure, a W/S ratio from 0.15 to 0.20 contributes to an increase in the average density. With a further increase in W/S ratio, up to 0.25, the average density of fresh samples continues to increase, while the average density of samples at two days after demolding remains constant (Figure 2a) or decreases (Figure 2b,c). It was also found that the decrease in the average density of dry samples, in comparison with the average density of fresh samples, is higher the greater the W/S ratio and the FCG content in the system. This is due to the increase in the free water that evaporates during the climatic drying of the samples. Thus, the minimum decrease in the average density for dry samples (2.3%) versus fresh ones, is observed for samples with 10% FCG, under a molding pressure of 7 MPa and with a W/S ratio of 0.15 (Figure 2a). The maximum reduction in average density (12.9%) is observed for samples with an FCG content of 50%, under a molding pressure of 7 MPa and with a W/S ratio of 0.25 (Figure 2c). The identified relationships must be taken into account in real production, since the presence of a significant amount of free water in the raw mixture, and its evaporation during the drying process, can lead to significant linear shrinkage of the finished products.
A comparison of the compressive strengths of fresh and dry samples revealed two main differences. First, regardless of the molding pressure and W/S ratio, with an increase in FCG content in the raw mixture, the compressive strength of fresh samples increases (Figure 3d), while the strength of samples at two days after demolding decreases (Figure 4d). Second, at low molding pressure (3 MPa), and with an increase in the W/S ratio, the compressive strength of fresh samples decreases, while for samples at two days after demolding, the strength increases. This is because the compressive strength of the samples at two days after demolding depends on the nature and amount of new formations, which is predetermined by the proportion of CGB and the water content in the raw mixture.

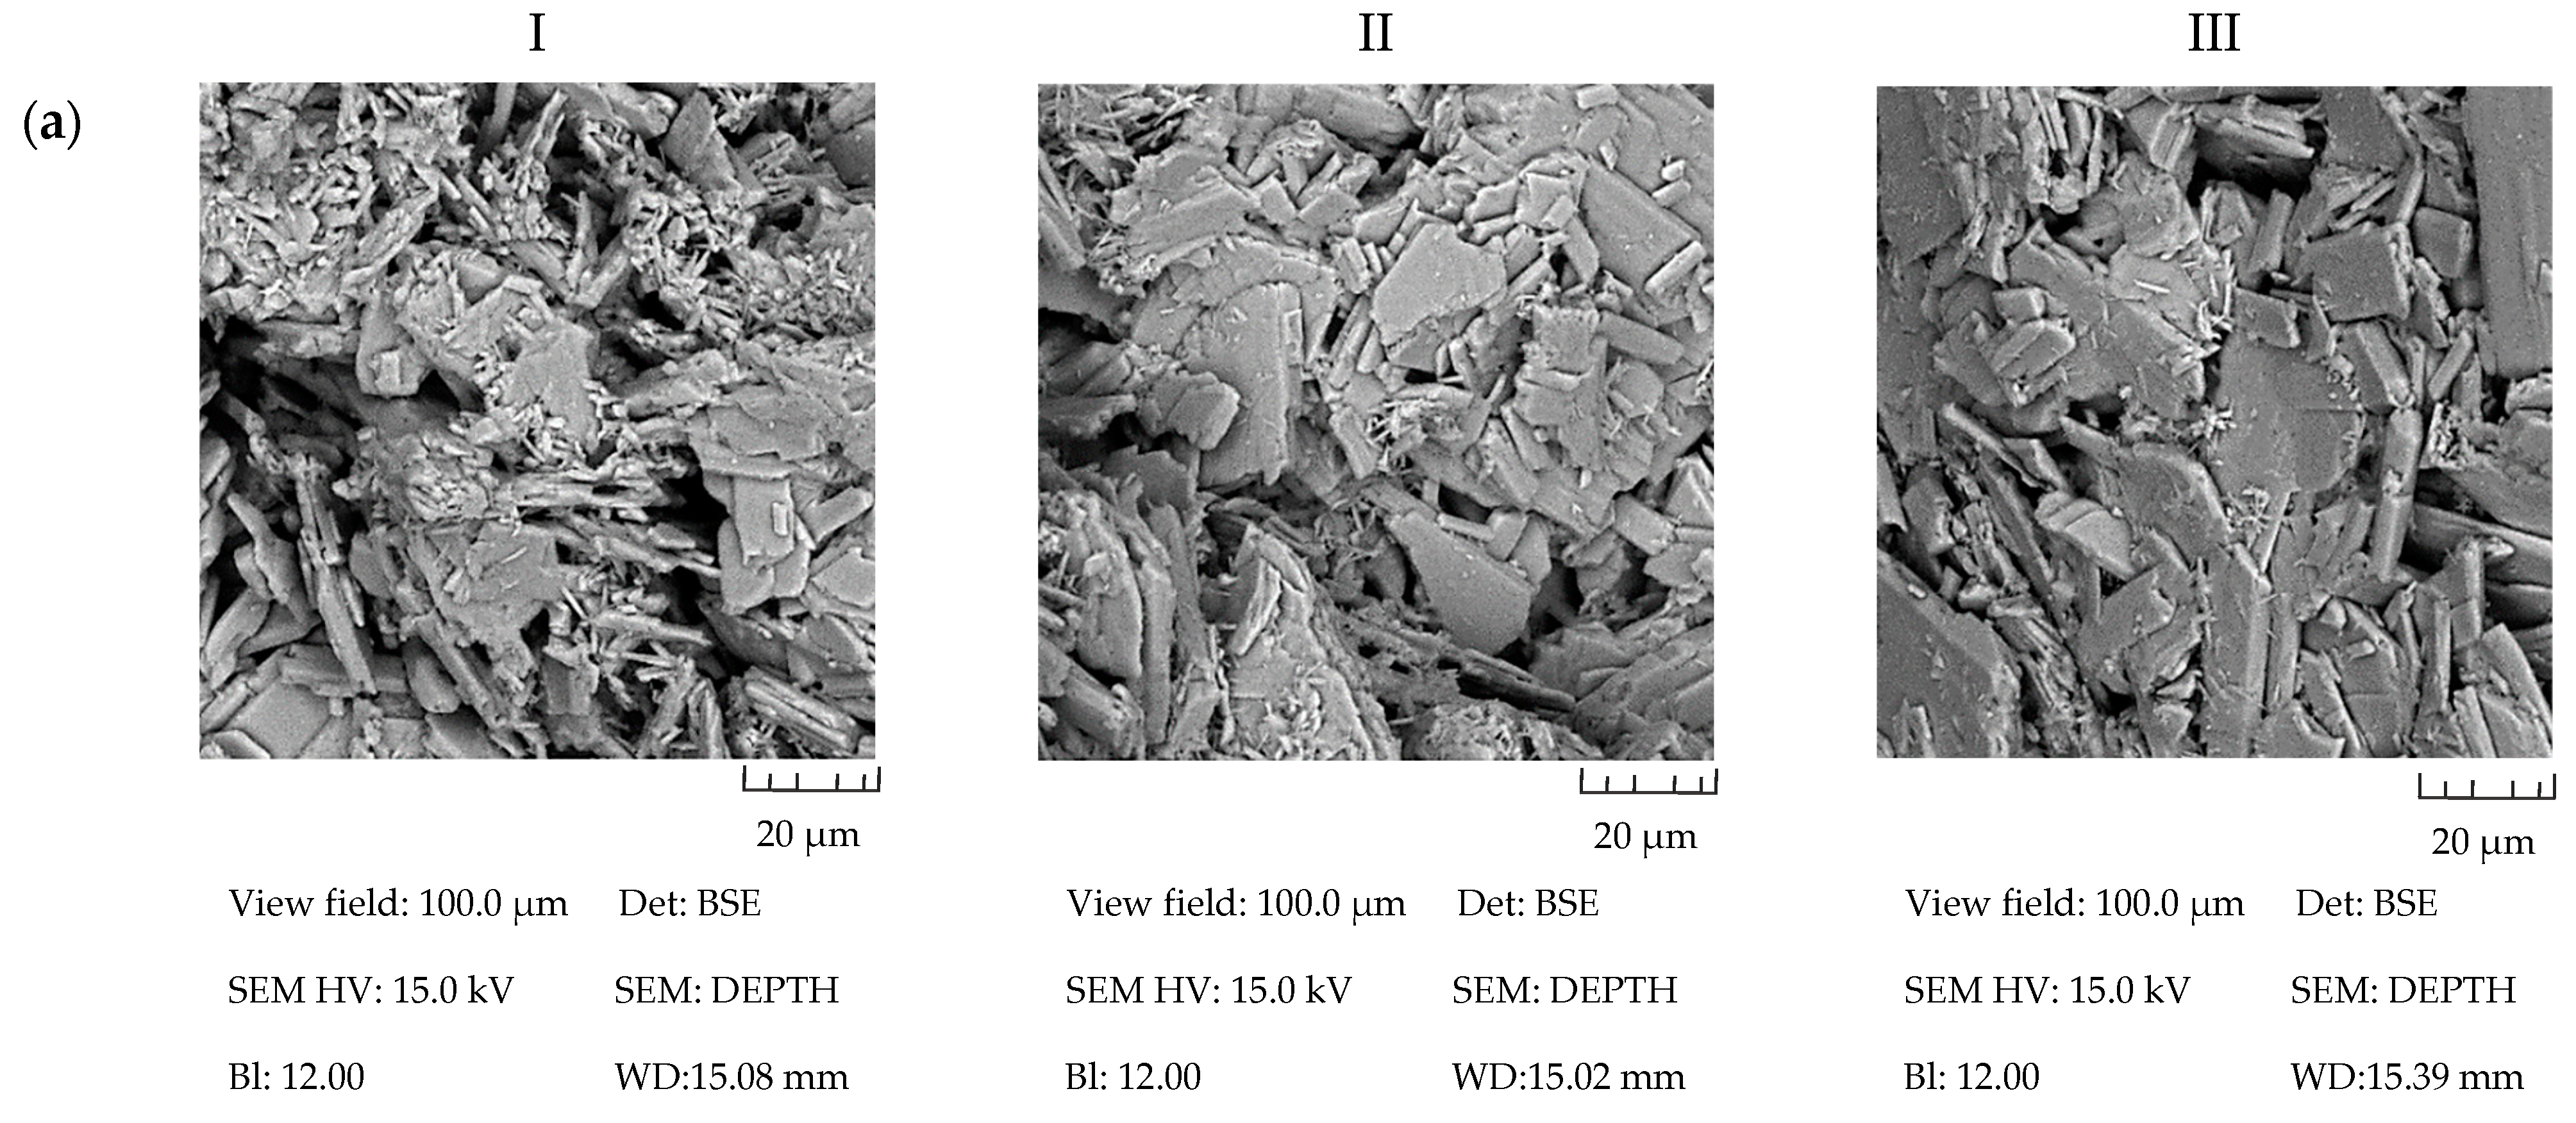
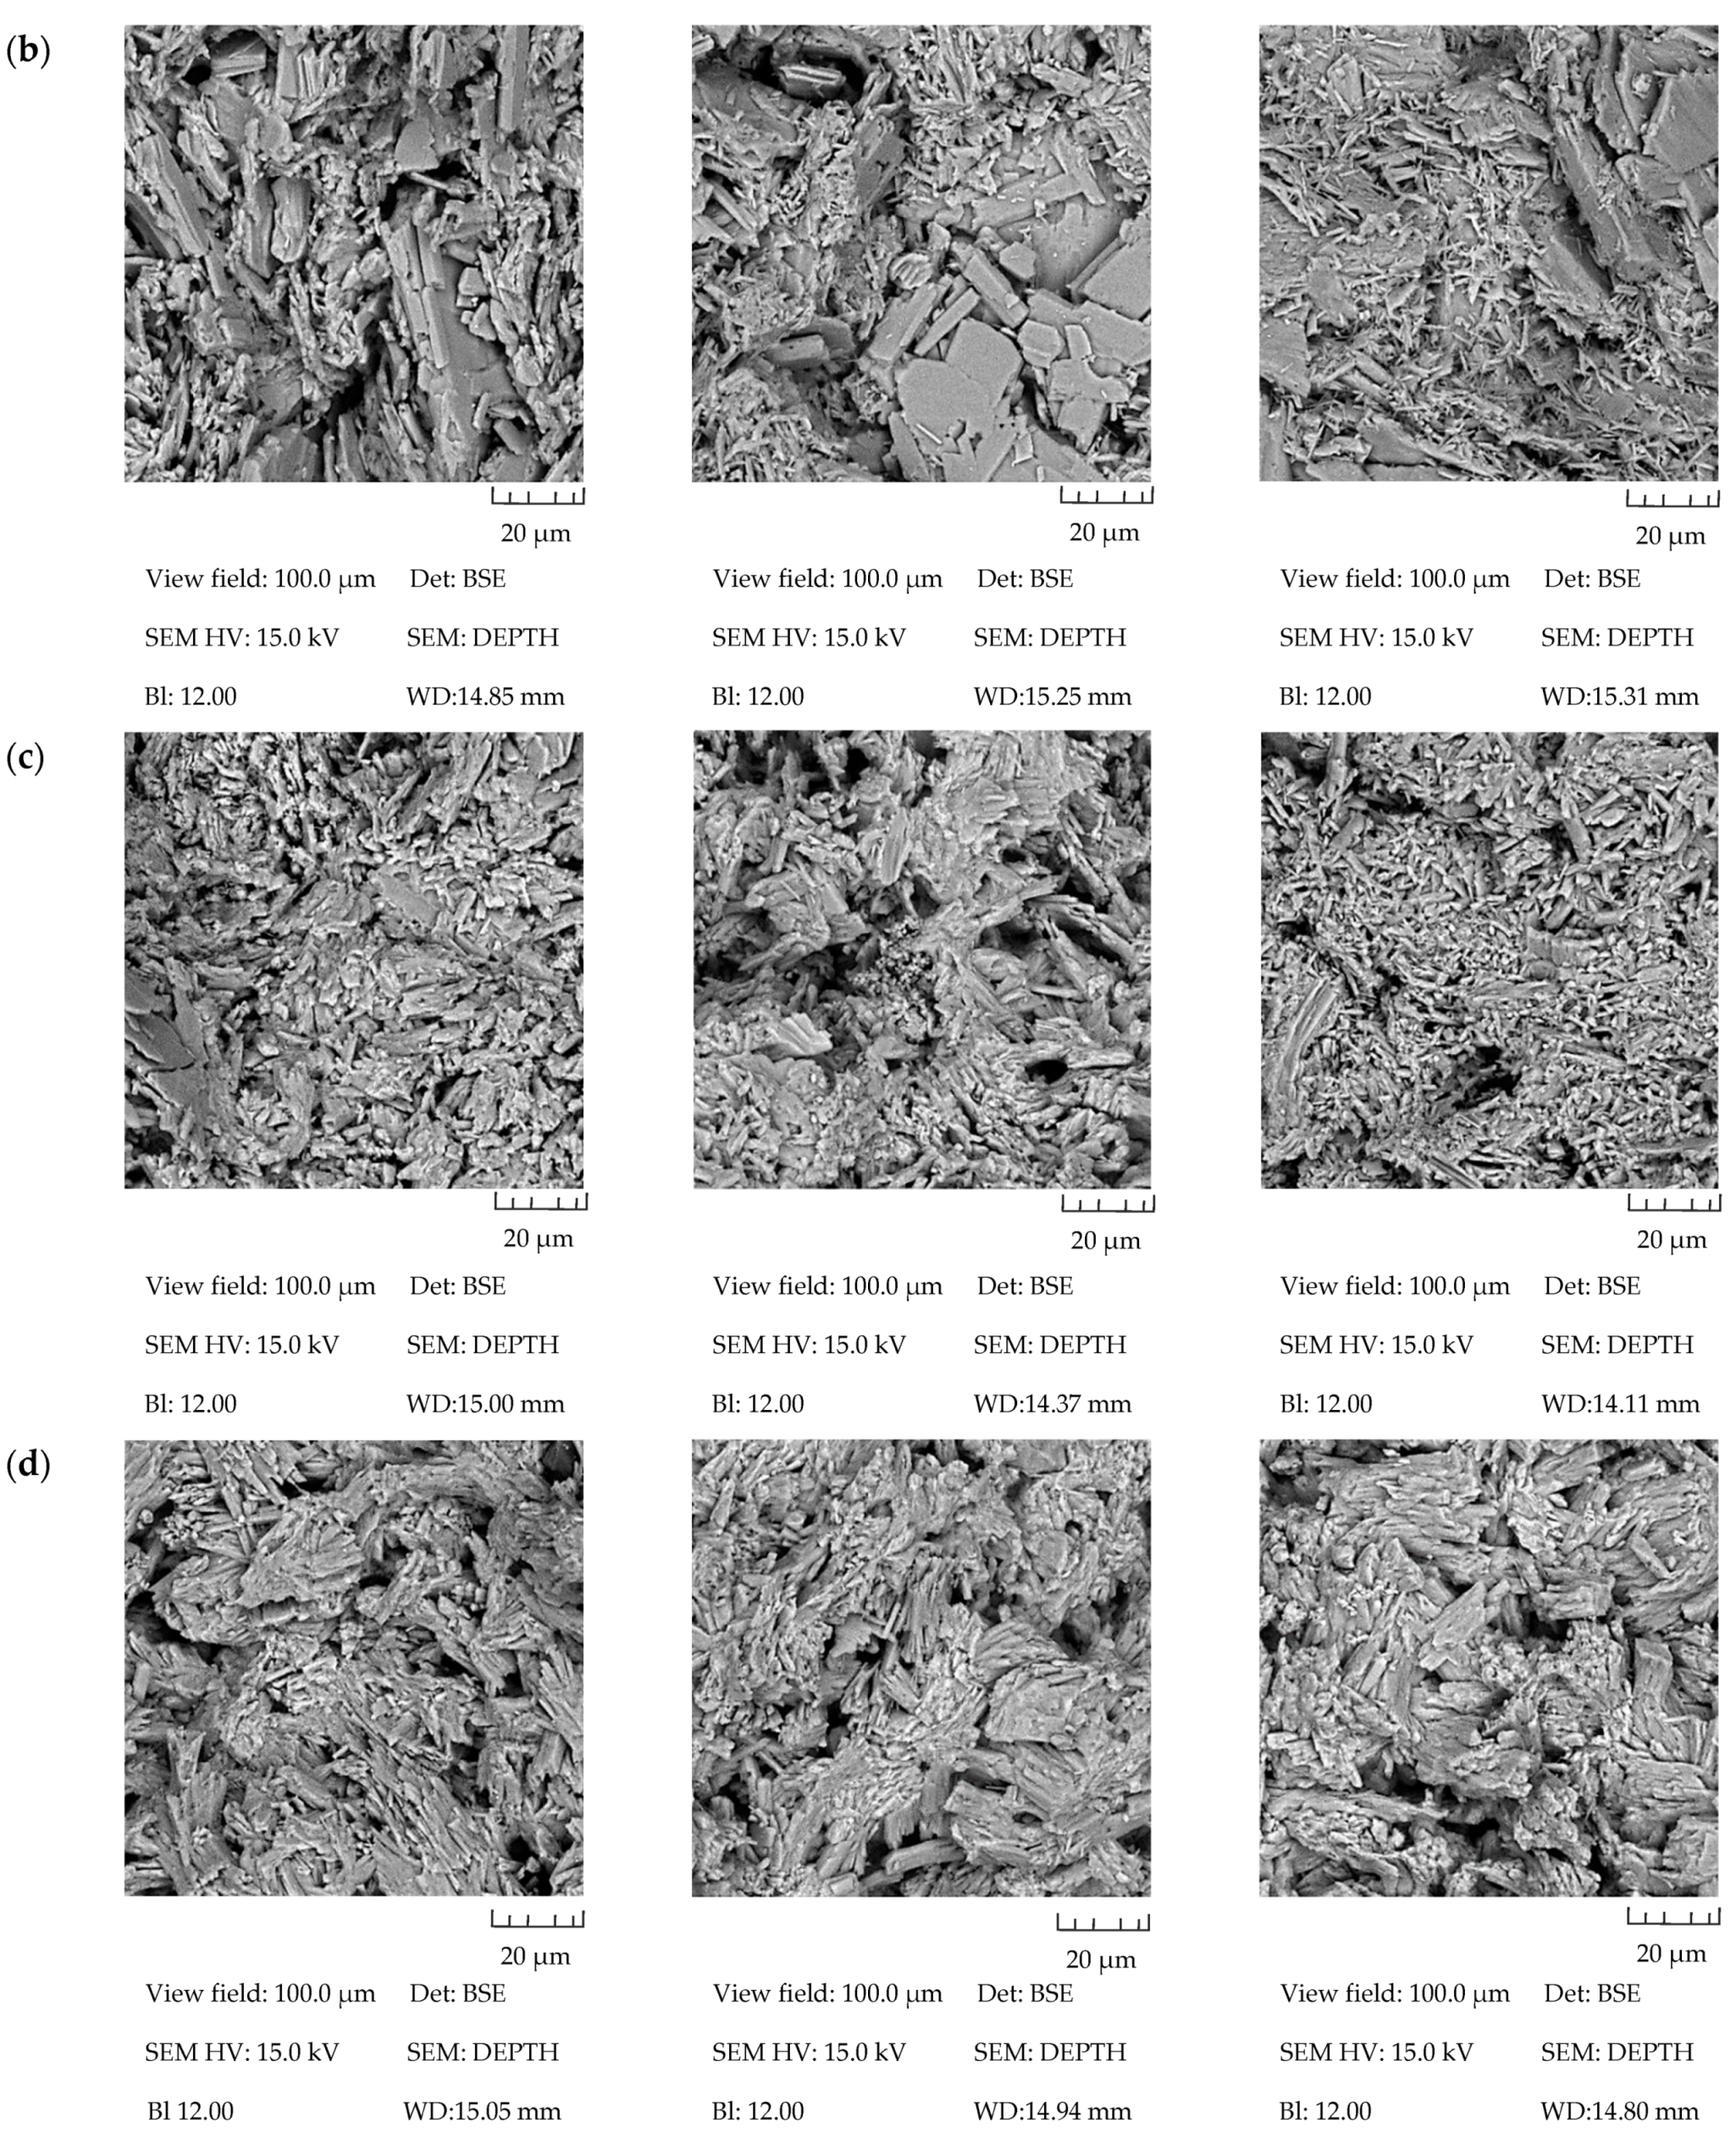
3.4. Effect of Formulation and Molding Pressure on the Microstructure of the Samples at Two Days after Demolding

According to SEM analysis, the microstructure of mixes with an FCG content of 50% (Figure 3a, mixes 1, 4, and 9) is represented mainly by citrogypsum plates covered with an insignificant layer of needle-like new formations. With a decrease in the FCG content, the proportion of new formations, and the density of the structure increases. The highest density and number of new formations are typical for reference mixes, without FCG (Figure 3d). It can also be seen that, regardless of the mix design of the raw mixture, an increase in molding pressure leads to compacting of the structure and a decrease in its porosity (Figure 3I), which is fully consistent with the previously identified principles (Table 2) of the dependence of the compressive strength and average density of the samples on mix design and molding pressure.
The microstructure of the reference mixes showed (Figure 3d) that the samples molded at the maximum W/S ratio of 0.25 and molding pressure of 7 MPa are the most homogeneous and compact (Figure 3dIII, mix 18). The lowest homogeneity and average density are typical for samples prepared at the minimum W/S ratio (0.15) and molding pressure (3 MPa) (Figure 5dI, mix 16), which is fully consistent with the physical and mechanical properties of the reference samples (Table 2). W/S values of 0.25 provide maximum CGB hydration, and also help to reduce wall friction, which together has a positive effect on the structure, compressive strength, and average density of the samples (Table 2 mix 18). At the same time, at W/S = 0.15, the amount of water becomes insufficient to provide CGB hydration, and the negative effect of wall friction also increases. Wall friction, as well as low molding pressure, lead to the formation of samples with a loose structure, and low compressive strength and average density, as a result (Table 2, mix 16).

4. Materials and Methods

4.1. Materials

The citrogypsum-based binder (CGB), and citrogypsum with a fraction of less than 112 μm, i.e., fractioned citrogypsum (FCG), were used as components of the raw mixture.
The chemical and elemental composition of citrogypsum are presented in Table 3.
Strontium is present in citrogypsum. However, this form of strontium is not radioactive, because its isotopic composition corresponds to the natural one. Its total radioactivity is 20 Bq/kg.
Visually, citrogypsum is a gray powder, with a bulk density of 770 kg/m3, which consists of small particles and their conglomerates, formed when stored under high humidity (80 % at least). Normally, with a slight load during mixing and transportation, the conglomerates break up. Synthesis of a CGB was carried out by heat treatment in the following sequence: citrogypsum was dried under ambient laboratory conditions: relative humidity of 34 ± 2% and temperature of 20 ± 2 °C. Then, large stony inclusions in citrogypsum were excluded, followed by placement in an oven on a baking sheet. The total weight of the sample of citrogypsum was 2 kg. To control the temperature variations, one thermocouple was placed in the citrogypsum mass, and the second thermocouple was placed directly in the oven, for additional control of the temperature. Heat treatment was carried out at a temperature of 175 °C (temperature rise rate was 1 °C per 10 s). Heating was carried out until the citrogypsum reached a temperature of 160–165 °C, at which point it was kept in the oven for an hour, after which it was cooled to ambient temperature (20 ± 2 °C) and was kept for 2 days until the citrogypsum mass stabilized. The synthesis parameters of CGB were selected experimentally under ambient laboratory conditions. The selected parameters of heat treatment ensured the best dehydration of citrogypsum and the formation of calcium sulfate hemihydrate [25].
The characteristics of the CGB are presented in Table 4.
FCG was obtained by sieving the original citrogypsum through a sieve, with a mesh size of 112 μm. The bulk density and specific surface area of FCG were 490 kg/m3 and 400 m2/kg, respectively.
Granulometry of CGB and FGB is shown in Figure 4. CGB is characterized by a unimodal particle distribution, with a well-defined peak in the size range of 28–36 µm. The modal particle diameter is 30.1 μm. FCG is characterized by a unimodal particle distribution, with a well-defined peak in the size range of 36–46 µm. The modal particle diameter of FCG is 37.79 μm.

4.2. Methods

For the experiment, a non-compositional plan for three factors, described by the Box–Behnken planning matrix (Table 5), was used (Table 6). Non-compositional plans for three factors require a smaller number of experiments (15 experiments), in comparison with rotatable central compositional plans of the second-order (27 experiments). A non-compositional plan, where 15 experiments are normally applied, provides three levels of factor variation, only, which simplifies and reduces the cost of the experiments. This is the reason why the non-compositional plan, where 15 experiments are used, was applied in this article.
The following input variable parameters were taken: FCG content in the mix (X1), molding pressure (X2), and water-solid (W/S) ratio (X3) (Table 5 and Table 6). The following output parameters were used, as controlled: average density and compressive strength of both series of samples: immediately after pressing (fresh) and at two days after demolding (dry).
The research was carried out as part of a scientific project, with the participation of an industrial enterprise producing the building materials. Therefore, the choice of variable parameters was based on the technical specifications of the industrial enterprise, namely, the production of materials with high physical and mechanical characteristics at low material and energy costs, as well as taking into account the technical characteristics of the equipment that was available at the enterprise.
The choice of the range of values of molding pressure and, in particular, its upper limit (7 MPa), was determined by the technical characteristics of the enterprise equipment. A W/S ratio in the range of 0.15–0.25 was chosen, based on the analysis of literary sources [30,31,32,33].
The ratio of components in the raw mixture was chosen based on the analysis of previous studies [30,31,32,33] where, if a semi-dry raw mixture consists of 50% CaSO4·2H2O by weight, at least, to ensure the adhesion of particles due to short-range forces, which creates a condition for the formation of nuclei of crystallization contacts, the external mechanical action should be 20 MPa, at least.
To form a compact structure of the gypsum material, under a lower molding pressure, the proportion of CaSO4·0.5H2O in the raw mixture must be increased.
Therefore, in this study, the FCG contents in the raw mixtures were 10, 30, 50%, and the CGB contents were 90, 70, 50%, respectively. The W/S ratio was varied in the range of 0.15–0.25 (Table 5).
CGB without FCG (mixes 15, 16, 17) were used as reference mixes (Table 6).
The sample preparation process consisted of the following stages (Figure 5):
1. CGB and FCG were weighed and manually mixed, in the proportions shown in Table 4. The mixing time was 1 min.
2. Water was added to the resulting “CGB–FCG” raw mixture. Then the mixture was manually mixed until a homogeneous mass was achieved. The mixing time was 1 min.
3. Press-tool 1 was installed on stand 2, and 42 g of the raw mixture was introduced in one step, after which it was compacted, using a piston for molding 4. Further, stand 2 was replaced by a piston for molding 3 (Figure 5b).
4. The press-tool was placed under the press plates and a pressure load was applied. Molding was carried out with a laboratory press under a molding pressure load of 10 tonnes. The sample was kept at a given pressure load for 30 s (Figure 5c). After releasing the pressure, the piston for molding 3 was removed from the press-tool and then the demolding ring 5 was placed. Then the mold was placed under the press plates and the sample was demolded from the press-tool. As a result, cylinders with diameters of 31 mm and heights of 31–39 mm, were obtained (Figure 2d).
The total duration of the sample manufacturing process was 10–15 min.
There are currently no standard test methods for gypsum-based materials produced by pressing methods. Therefore, in this study, the average density and compressive strength of the samples were determined in two cases: immediately after their demolding, and after their demolding and subsequent achievement of constant mass, i.e., at two days after demolding. The samples reached a constant weight after two days of storage in the laboratory, at a relative humidity of 33 ± 2% and a temperature of 20 ± 2 °C, which corresponds to the storage conditions of products during real production.
The criteria for evaluating the appearance were the presence of defects in the form of delaminations and wedges on the surfaces of the samples and their height and depth, as well. To evaluate the appearance, two samples with the best- and worst-quality surfaces were used. To plot the relationship of the input–output parameters, the SigmaPlot software was applied, for analysis and to demonstrate scientific and statistical data in the form of nomograms.
The microstructure and morphology of new formations in the CGB samples at the age of two days after demolding were studied using a scanning electron microscope, Mira 3 FesSem (Tescan, Brno, Czech Republic), operating in high-vacuum mode (InBeam), with a high-brightness Schottky cathode. Before the measurements, the samples were preliminarily covered with chromium (Cr).
The granulometry of the powdered raw materials was studied using an ANALYSETTE 22 NanoTec plus laser particle size analyzer (Fritsch, Markt Einersheim, Germany).
The specific surface area of the powders was determined on a PSH-12SP device (Pribory Khodakova, Moscow, Russia), by the air permeability method, based on the measurement of the hydraulic resistance that a layer of compacted powder has to air sucked through it.
The average density of the CGB samples was determined as the ratio of their measured mass and volume.
Compressive strength characteristics were determined on cylindric samples, in accordance with standard test methods. The following pressing equipment was used: a 10-tonne laboratory press with a measurement range of 0–100 kN (graduation 1 kN). The average loading rate during the test was (1.0 ± 0.5) MPa/s. The compressive strength of an individual sample was calculated as the quotient of the breaking load divided by the sample area. The compressive strength for the mixes was calculated as the arithmetic average of the test results of the samples.

5. Conclusions

It has been established that the use of the semi-dry pressing method, with an optimal mix design and technological parameters, makes it possible to obtain citrogypsum-based materials with demolding compressive strength (i.e., compressive strength for a freshly molded sample) up to 2 MPa, and final compressive strength (i.e., compressive strength for a dry sample) up to 26 MPa.
The effects of the mix design and technological parameters, such as FCG content in the raw mixture, molding pressure, and W/S ratio on compressive strength, average density, and appearance of samples, were determined.
It has been established that an increase in molding pressure, W/S ratio, and a decrease in FCG content in the CGB-based raw mixtures improves the physical and mechanical characteristics of the final materials. At the same time, the determining factors affecting the formation of defects on the surface are, a reduction in the FCG content and water in the raw mixture, which is due to the high adhesion of the CGB and the friction of the raw mixture during molding and demolding of the CGB samples.
The following relationship variations in the strength of fresh samples were revealed: the determining factor that affects the decrease in compressive strength is not the average density, but the homogeneity of the compaction of the sample in volume, which depends on wall friction. It is possible to reduce the negative effect of wall friction on demolding strength, by increasing the FCG content in the raw mixture, and by simultaneously increasing the molding pressure and W/S ratio.
In addition, the results obtained made it possible to identify the main problems in the manufacture of gypsum materials by the semi-dry pressing method, and to determine the directions for further research, aimed at improving the efficiency of using GCW as a raw material for the production of gypsum binders and materials.
Thus, an increase in the efficiency of using the semi-dry pressing method when producing CGB-based materials should be associated with the search for various solutions focused on reducing wall friction and adhesion of the CGB to the mold surface (for example, the use of additives, replacement of the material of mold, etc.).
Thus, the possibility of producing gypsum materials with high physical and mechanical characteristics and a good surface, by the semi-dry pressing method, using CGB and FCG at lower molding pressures of 3–7 MPa, has been established. The use of lower molding pressures will significantly reduce the material and energy costs of the production process and expand the possibilities of citrogypsum recycling.

Author Contributions

Conceptualization, S.P. and N.A.; methodology, S.P., N.A. and K.L.; validation, S.P., N.A. and M.E.; formal analysis, S.P., N.A. and K.L.; investigation, S.P., N.A., K.L. and M.E.; resources, S.P., N.A. and N.K.; data curation, N.A.; writing—original draft preparation, S.P., N.A. and N.K.; writing—review and editing, S.P., N.A. and N.K.; visualization, S.P., N.A. and M.E.; supervision, S.P. and N.A.; project administration, S.P. and N.A.; funding acquisition, S.P., K.L. and N.K. All authors have read and agreed to the published version of the manuscript.

Funding

The work was realized under support of the State Assignment for the creation of new laboratories in 2021, including under the guidance of young promising researchers of the national project “Science and Universities”. The research title is “Development of scientific and technological foundations for the creation of an integrated technology for processing gypsum-containing waste from various industrial enterprises”, FZWG-2021-0017.

Institutional Review Board Statement

Not applicable.

Informed Consent Statement

Not applicable.

Data Availability Statement

Not applicable.

Acknowledgments

The work was realized under administrative support of the world-class scientific and educational center “Innovative Solutions in the Agricultural Sector” (Belgorod), using equipment of the High Technology Center at BSTU, named after V. G. Shukhov.

Conflicts of Interest

The authors declare no conflict of interest.

References

  1. Rashad, A.M. Phosphogypsum as a construction material. J. Clean. Prod. 2017, 166, 732–743. [Google Scholar] [CrossRef]
  2. Yang, J.; Liu, W.; Zhang, L.; Xiao, B. Preparation of load-bearing building materials from autoclaved phosphogypsum. Constr. Build. Mater. 2009, 23, 687–693. [Google Scholar] [CrossRef]
  3. Guan, B.; Yang, L.; Wu, Z.; Shen, Z.; Ma, X.; Qingqing, Y. Preparation of a-calcium sulfate hemihydrate from FGD gypsum in K, Mg-containing concentrated CaCl2 solution under mild conditions. Fuel 2009, 88, 1286–1293. [Google Scholar] [CrossRef]
  4. Shen, Z.X.; Guan, B.H.; Fu, H.L.; Yang, L. Effect of Potassium Sodium Tartrate and Sodium Citrate on the Preparation of a-Calcium Sulfate Hemihydrate from Flue Gas Desulfurization Gypsum in a Concentrated Electrolyte Solution. Am. Ceram. Soc. 2009, 92, 2894–2899. [Google Scholar] [CrossRef]
  5. Sevim, U.K.; Ozturk, M.; Onturk, S.; Bankir, M.B. Utilization of boron waste borogypsum in mortar. J. Build. Eng. 2019, 22, 496–503. [Google Scholar] [CrossRef]
  6. Kavas, T.; Olgun, A.; Erdogan, Y. Setting and hardening of borogypsum—Portland cement clinker–fly ash blends. Studies on effects of molasses on properties of mortar containing borogypsum. Cem. Concr. Res. 2005, 35, 711–718. [Google Scholar] [CrossRef]
  7. Sverguzova, S.V.; Tarasova, G.I.; Chernysheva, N.V.; Shamshurov, A.V. Theoretical substantiation of the possibility of non-firing dehydration of citrogypsum. Bull. BSTU Im. V. G. Shukhov 2010, 2, 117–121. [Google Scholar]
  8. Kozhukhova, N.I.; Shurakov, I.M.; Titenko, A.A.; Alfimova, N.I.; Zhernovskaya, I.V.; Bukovtsova, A.I. Effect of the curing conditions on the characteristics of citrogypsum-containing alkali-activated binders. Constr. Mater. Prod. 2021, 4, 24–34. [Google Scholar] [CrossRef]
  9. Silva, L.F.O.; Oliveira, M.L.S.; Crissien, T.J.; Santosh, M.; Bolivar, J.; Shao, L.; Dotto, G.L.; Gasparotto, J.; Schindler, M. A review on the environmental impact of phosphogypsum and potential health impacts through the release of nanoparticles. Chemosphere 2022, 286, 131513. [Google Scholar] [CrossRef]
  10. Men, J.; Li, Y.; Cheng, P.; Zhang, Z. Recycling phosphogypsum in road construction materials and associated environmental considerations: A review. Heliyon 2022, 8, e11518. [Google Scholar] [CrossRef]
  11. Wang, J.; Yang, P. Potential flue gas desulfurization gypsum utilization in agriculture: A comprehensive review. Renew. Sustain. Energy Rev. 2018, 82, 1969–1978. [Google Scholar] [CrossRef]
  12. Voropaev, V.; Alfimova, N.; Nikulin, I.; Nikulicheva, T.; Titenko, A.; Nikulichev, V. Influence of Gypsum-Containing Waste on Ammonia Binding in Animal Waste Composting. Agriculture 2021, 11, 1153. [Google Scholar] [CrossRef]
  13. Cánovas, C.R.; Macías, F.; Pérez-López, R.; Basallote, M.D.; Millán-Becerro, R. Valorization of wastes from the fertilizer industry: Current status and future trends. J. Clean. Prod. 2018, 174, 678–690. [Google Scholar] [CrossRef]
  14. Liu, S.; Liu, W.; Jiao, F.; Qin, W.; Yang, C. Production and resource utilization of flue gas desulfurized gypsum in China—A review. Environ. Pollut. 2021, 288, 117799. [Google Scholar] [CrossRef] [PubMed]
  15. Qin, X.; Cao, Y.; Guan, H.; Hu, Q.; Liu, Z.; Xu, J.; Hu, B.; Zhang, Z.; Luo, R. Resource utilization and development of phosphogypsum-based materials in civil engineering. J. Clean. Prod. 2023, 387, 135858. [Google Scholar] [CrossRef]
  16. Emrullahoglu Abi, C.B. Effect of borogypsum on brick properties. Constr. Build. Mater. 2014, 59, 195–203. [Google Scholar] [CrossRef]
  17. Guan, B.; Kong, B.; Fu, H.; Yu, J.; Jiang, G.; Yang, L. Pilot scale preparation of α-calcium sulfate hemihydrate from FGD gypsum in Ca–K–Mg aqueous solution under atmospheric pressure. Fuel 2012, 98, 48–54. [Google Scholar] [CrossRef]
  18. Li, X.; Zhang, Q.; Shen, Z.; Li, L.; Li, X.; Ma, S. L-aspartic acid: A crystal modifier for preparation of hemihydrate from phosphogypsum in CaCl2 solution. J. Cryst. Growth 2019, 511, 48–55. [Google Scholar] [CrossRef]
  19. Alfimova, N.I.; Pirieva, S.Y.; Elistratkin, M.Y.; Kozhuhova, N.I.; Titenko, A.A. Production methods of binders containing gypsum-bearing wastes: A review. Bull. BSTU Named After V.G. Shukhov 2020, 11, 8–23. [Google Scholar] [CrossRef]
  20. Calderón-Morales, B.R.S.; García-Martínez, A.; Pineda, P.; García-Tenório, R. Valorization of phosphogypsum in cement-based materials: Limits and potential in eco-efficient construction. J. Build. Eng. 2021, 44, 102506. [Google Scholar] [CrossRef]
  21. Ozkul, M.H. Utilization of citro- and desulphogypsum as set retarders in Portland cement. Cem. Concr. Res. 2000, 30, 1755–1758. [Google Scholar] [CrossRef]
  22. Caillahua, M.C.; Moura, F.J. Technical feasibility for use of FGD gypsum as an additive setting time retarder for Portland cement. J. Mater. Res. Technol. 2018, 7, 190–197. [Google Scholar] [CrossRef]
  23. Vaičiukyniene, D.; Nizevičienė, D.; Kiele, A.; Janavičius, E.; Pupeikis, D. Effect of phosphogypsum on the stability upon firing treatment of alkali-activated slag. Constr. Build. Mater. 2018, 184, 485–491. [Google Scholar] [CrossRef]
  24. Kozhukhova, N.I.; Shurakov, I.M.; Kozhukhova, M.I.; Elistratkin, M.Y.; Alfimova, N.I. Understanding the relationship between composition and rheology in alkali-activated binders. J. Phys. Conf. Ser. Link Is Disabl. 2021, 2124, 012004. [Google Scholar] [CrossRef]
  25. Pirieva, S.; Alfimova, N.; Levickaya, K. Citrogypsum as a Raw Material for Gypsum Binder Production. Constr. Unique Build. Struct. 2022, 100, 10007. [Google Scholar] [CrossRef]
  26. Ma, B.; Jin, Z.; Su, Y.; Lu, W.; Qi, H.; Hu, P. Utilization of hemihydrate phosphogypsum for the preparation of porous sound absorbing material. Constr. Build. Mater. 2020, 234, 117346. [Google Scholar] [CrossRef]
  27. Lu, W.; Ma, B.; Su, Y.; He, X.; Jin, Z.; Qi, H. Preparation of a-hemihydrate gypsum from phosphogypsum in recycling CaCl2 solution. Constr. Build. Mater. 2019, 214, 399–412. [Google Scholar] [CrossRef]
  28. Zhou, J.; Sheng, Z.; Li, T.; Shu, Z.; Wang, Y. Preparation of hardened tiles from waste phosphogypsum by a new intermittent pressing hydration. Ceram. Int. 2016, 42, 7237–7245. [Google Scholar] [CrossRef]
  29. Zhou, J.; Li, X.; Zhao, Y.; Shu, Z.; Wang, Y.; Zhang, Y.; Shen, X. Preparation of paper-free and fiber-free plasterboard with high strength using phosphogypsum. Constr. Build. Mater. 2020, 243, 118091. [Google Scholar] [CrossRef]
  30. Mirsaev, R.N.; Babkov, V.V.; Nedoseko, I.V.; Yunusova, S.S.; Akhmadulina, I.I.; Shayakhmetov, U.S. Structural formation and hardening of pressed compositions based on calcium sulfate dehydrate. Build. Mater. 2009, 6, 6–9. [Google Scholar]
  31. Petropavlovskii, K.; Novichenkova, T.; Petropavlovskaya, V.; Salman, M.; Fediuk, R.; Amran, M. Faience waste for the production of wall products. Materials 2021, 14, 6677. [Google Scholar] [CrossRef] [PubMed]
  32. Petropavlovskaya, V.B.; Belov, V.V.; Novichenkova, T.B.; Buryanov, A.F.; Poleonova, Y.Y.; Petropavlovsky, K.S. Resource-saving non-fired gypsum composites. Build. Mater. 2015, 6, 79–81. [Google Scholar]
  33. Petropavlovskaya, V.B.; Novichenkova, T.B.; Buryanov, A.F. Improving the technological properties of non-fired hyper-pressed gypsum products. Bull. BSTU Named After V.G. Shukhov 2013, 6, 75–78. [Google Scholar]
Figure 1. The effect of molding pressure and W/S ratio on the average density and compressive strength of samples immediately after demolding at the different FCG contents in the raw mixture: (a) 10%; (b) 30%; (c) 50%; (d) combined nomogram.
Recycling 08 00034 g001aRecycling 08 00034 g001b
Figure 2. The effect of molding pressure and W/S ratio on the average density and compressive strength for samples at two days after demolding at different FCG contents in the raw mixture: (a) 10%; (b) 30%; (c) 50%; (d) combined nomogram.
Recycling 08 00034 g002aRecycling 08 00034 g002b
Figure 3. Microstructure of the samples at two days after demolding, depending on the mix design and molding pressure: (a) FCG content is 50%, by wt. (X1 = +1); (b) FCG content is 30%, by wt. (X1 = 0); (c) FCG content is 10%, by wt. (X1 = −1); (d) reference (FCG content is 0%). (I)—molding pressure is 3 MPa (X2 = −1); W/S ratio is 0.15 (X3 = −1). (II)—molding pressure is 5 MPa (X2 = 0); W/S ratio is 0.20 (X3 = 0). (III)—molding pressure is 7 MPa (X2 = +1); W/S ratio is 0.25 (X3 = +1).
Recycling 08 00034 g003aRecycling 08 00034 g003b
Figure 4. Granulometry of CGB () and FGB ().
Recycling 08 00034 g004
Figure 5. The sample preparation by semi-dry pressing method (a): 1—press-tool; 2—stand for fixing the molding mass; 3, 4—pistons for pressing; 5—cylinder for pressing out. (b,c) Molding stage; (d) demolding stage.
Recycling 08 00034 g005
Table 1. The appearance of the experimental mixes at two days after demolding.
Sample IDEvaluation of Sample Appearance
Sample AppearanceComments
mix 1Recycling 08 00034 i001Smooth surface without delamination
easy demolding; slight water release was observed
mix 2Recycling 08 00034 i002Smooth surface; slight delamination in the form of a surface crack at a distance of 5–10 mm from the top of the sample; easy demolding
mix 3Recycling 08 00034 i003Smooth surface without flaking;
easy demolding; slight water release was observed
mix 4Recycling 08 00034 i004Easy demolding; in the upper part of the sample, a surface delamination
4–10 mm high is observed
mix 5Recycling 08 00034 i005Easy demolding; there was a slight release of water; in the upper part of the sample, surface delamination 2–5 mm high is observed
mix 6Recycling 08 00034 i006Demolding was difficult; in the upper part of the sample, there is a significant delamination and a wedge with a height of 5–7 mm and a depth of 1 mm
mix 7Recycling 08 00034 i007Demolding was difficult; in the upper part of the sample, there is a slight delamination and a wedge with a height
of 2–7 mm and a depth of 1 mm
mix 8Recycling 08 00034 i008Demolding was difficult, in the upper part of the sample there is a significant delamination and a wedge with a height
of 5–10 mm, and with a depth of 1–2 mm
mix 9Recycling 08 00034 i009Smooth surface without delamination; easy demolding; there was a slight release of water
mix 10Recycling 08 00034 i010Demolding was difficult; in the upper part of the sample, there is a slight delamination and a wedge with a height
of 3–5 mm and a depth of 1–2 mm
mix 11Recycling 08 00034 i011Easy demolding; in the upper part of the sample, a slight delamination of the surface up to 10 mm high is observed
mix 12Recycling 08 00034 i012Easy demolding; in the upper part of the sample, there is a slight delamination of the surface with a height of 3–10 mm
mix 13Recycling 08 00034 i013Smooth surface, slight delamination in the form of a surface crack at a distance of 7–11 mm from the top of the sample; easy demolding
mix 14Recycling 08 00034 i014Demolding was difficult; there is a delamination and a slight wedge in the upper part of the sample with a height of 3–7 mm and a depth of 1 mm
mix 15Recycling 08 00034 i015Demolding was difficult; there is a delamination and a slight wedge in the upper part of the sample with a height of 1–10 mm, and a depth of 1 mm
Samples of Reference Mixes
mix 16Recycling 08 00034 i016Demolding was difficult, in the upper part of the sample there is a significant delamination and a wedge with a height
of 7–14 mm, and with a depth of 1–2 mm
mix 17Recycling 08 00034 i017Demolding was difficult, in the upper part of the sample there is a significant delamination and a wedge with a height of 2–8 mm, and with a depth of 1–2 mm
mix 18Recycling 08 00034 i018In the upper part of the sample, surface delamination 1–5 mm high is observed
Table 2. Physical and mechanical characteristics of experimental mixes.
Mix IDAverage Values of Controlled Output Parameters
Immediately after DemoldingAt 2 Days after Demolding
Average Density, kg/m3Compressive Strength, MPaAverage Density, kg/m3Compressive Strength, MPa
mix 11772 ± 1.50%1.99 ± 2.11%1550± 2.11%9.37 ± 4.10%
mix 21639 ± 0.98%1.24 ± 1.50%1564 ± 1.50%9.24 ± 2.11%
mix 31696 ± 1.10%0.99 ± 2,70%1512 ± 1.37%6.16 ± 4.17%
mix 41594 ± 1.30%1.49 ± 2.6%1418± 2.53%6.16 ± 4.17%
mix 519378 ± 1.78%1.24 ± 2.7%1786 ± 1.61%26.11 ± 3.13%
mix 61721 ± 0.79%1.37 ± 0.98%1680 ± 0.46%18.8 ± 0.34%
mix 71883 ± 0.5%0.99 ± 2.52%1711 ± 0.31%22.52 ± 4.09%
mix 81727 ± 0.98%0.99 ± 2.95%1594± 0.82%14.18± 6.60%
mix 91662 ± 2.11%0.99 ± 1.44%1520 ± 1.44%6.29 ± 4.20%
mix 101799 ± 0.86%1.24 ± 2.15%1721 ± 1.28%20.15 ± 3.83%
mix 111750 ± 0.77%1.49 ± 2.41%1678 ± 0.65%18.8 ± 2.12%
mix 121617 ± 1.98%0.87 ± 1.69%1627± 0.19%14.37 ± 1.46%
mix 131823 ± 1.27%1.24 ± 1.77%1646 ± 0.03%16.04 ± 3.60%
mix 141641 ± 0.98%1.24 ± 2.53%1557± 2.16%12.45 ± 5.28%
mix 151722 ± 1.78%1.37 ± 3.60%1634 ± 0.19%15.01 ± 4.11%
Reference Mixes
mix 161790 ± 2.80%0.75 ± 2.57%1655 ± 1.89%10.78 ± 4.78%
mix 171806 ± 2.00%1.12 ± 2.32%1778 ± 2.14%26.75 ± 3.51%
mix 181944 ± 2.01%1.24 ± 2.48%1785 ± 1.99%29.77 ± 2.42%
Table 3. Chemical and elemental composition of citrogypsum.
Oxidem/m%Elementsm/m%
SO355.47S22.22
CaO43.36Ca30.99
SiO20.54Si0.25
Fe2O30.15Fe0.12
SrO0.14Sr0.12
Al2O30.13Al0.06
MgO0.06Mg0.03
Na2O0.04Na0.03
P2O50.08P0.04
K2O0.03K0.02
O46.12
Table 4. Characteristics of the CGB.
ParametersValues
Bulk density, kg/m3690
Specific surface area, m2/kg290–300
Standard consistency (Russian standard GOST 23789-2018), %123
Initial setting (Russian standard GOST 23789-2018), min18
Final setting (Russian standard GOST 23789-2018), min30
Compressive strength (Russian standard GOST 23789-2018), MPa0.7
Table 5. Experiment planning conditions.
ParametersVariation Levels of Studied ParametersVariability
Interval
Original FormCoded Form−10+1
FCG content, wt.%X110305020
Molding pressure, MPaX23572
W/S ratioX30.150.200.250.05
Table 6. Experiment design matrix.
NoInput Parameters
Coded FormOriginal Form
X1X2X3FCG Content, wt.%Molding Pressure, MPaW/S Ratio
1+1+1+15070.25
2+1+1−15070.15
3+1−1+15030.25
4+1−1−15030.15
5−1+1+11070.25
6−1+1−11070.15
7−1−1+11030.25
8−1−1−11030.15
9+1005050.20
10−1001050.20
110+103070.20
120−103030.20
1300+13050.25
1400−13050.15
150003050.20
Reference mixes
16−1−130.15
170050.20
18+1+170.25
Disclaimer/Publisher’s Note: The statements, opinions and data contained in all publications are solely those of the individual author(s) and contributor(s) and not of MDPI and/or the editor(s). MDPI and/or the editor(s) disclaim responsibility for any injury to people or property resulting from any ideas, methods, instructions or products referred to in the content.

