Article

Flotation Sludges from Precious Metal Recovery Processes: From Waste to Secondary Raw Material in Ceramics

1
Department of Physical, Earth and Environmental Sciences, DSFTA, (UniSI), Via Laterina, 8, 53100 Siena, Italy
2
Electrochemical Innovation Laboratory, Department of Chemical Engineering, University College London, London WC1E6BT, UK
3
Department of Earth and Environmental Sciences, DISAT, (UniMIB) Piazza della Scienza, 4, 20126 Milano, Italy
4
Department of Physical, Earth and Environmental Sciences, DSFTA and Centre of Geotechnologies CGT (UniSI), Via Vetri Vecchi, 34, 52027 San Giovanni Valdarno (Arezzo), Italy
5
Grinn Srl, Via Wanda Osiris, 11, 00139 Roma, Italy
*
Author to whom correspondence should be addressed.
Recycling 2023, 8(2), 35; https://doi.org/10.3390/recycling8020035
Submission received: 27 January 2023 / Revised: 15 February 2023 / Accepted: 6 March 2023 / Published: 10 March 2023

Abstract

:
In this study, we investigated flotation muds (FM) deriving from the recovery processes of precious metals contained in e-waste (wastes from electronics) and exhausted catalysts. FM consist of an amorphous phase, corresponding to a Ca- and Al-rich silicatic glass, potentially usable as a secondary raw material (SRM) to obtain a final ceramic product (CFM). A high FM amount was used in our ceramic tests, and suitably mixed with variable percentages of other phases. Chemical analysis, phase composition, microstructure, pore pattern and technological properties of the new ceramic products were determined using different analytical techniques, including bulk XRF, XRD, SEM-EDS and µCT. The CFM product predominantly consists of nepheline, pyroxene and wollastonite as the main crystalline phases, with a minor amorphous phase occurring as a compact interstitial matrix. The ceramic product has a porous interconnected microstructure. Nevertheless, this microstructure does not negatively affect the mechanical properties of the ceramic product, as testified by the geo-mechanical tests, revealing good properties in terms of bending and uniaxial strength. These preliminary results point out that FM recycling is feasible, at least at the laboratory scale.

1. Introduction

Recovery and recycling of valuable materials from industrial waste is one of the main goals in present society. Most natural resources are not renewable (at least at the human time scale), and their availability is running out. Further issues of concern derive from the global impact of exploitation and mining operations, in terms of economic costs, political and social implications, and environmental and landscape protection. In this context, the circular economy (the reuse and recycling of pre-existing materials and wastes) has become an unavoidable solution. The reuse of industrial wastes, often consisting of more or less hazardous phases, has the further benefit of limiting landfill disposal [1].
Only in 2019, the Italian metallurgic industry (code 24 and 25 according to the Italian economic classification, ATECO) produced more than 10 million tons of special wastes, accounting for 37.5% of the overall national production of special wastes, placing the sector in third place after construction/demolition and treatment/remediation wastes [2].
The recovery of wastes containing precious metals (hereafter PM) is of primary interest not only in the jewelry industry, but also in the electronics and catalysts industrial sectors [3]. Because of their excellent corrosion resistance, good electrical conductivity and high catalytic activity, PM are widely applied in many fields. For instance, gold and silver make up parts of switches, bonding wires and contacts in the electronics industry, while palladium is mainly used in hard disk production [3,4]. Other widespread applications of these materials are as activation components in various types of catalysts, from automotive to chemical engineering to oil-refining processes [3]. The need for recovery is primarily due to the extremely low natural amount of PM and REE in the Earth’s crust (globally below 0.01 ppm), which can be exploited only in the few sites/countries where they are geochemically concentrated [5]. The increasing demand for these rare and limited natural resources makes their recovery from end-of-life products necessary, which is also in agreement with 2030 Sustainable Development Goals. PM recovery is cheaper than exploitation and has several environmental advantages, since emitted CO2 and energy consumption are lower than those deriving from traditional mining exploitation [6,7].
The recovery of PM from existing end-of-life products (wastes from electronics, namely e-wastes, and spent catalysts) is typically carried out through pyrometallurgical (i.e., smelting in furnaces and successive refinements) and hydrometallurgical techniques (i.e., leaching with cyanide, aqua regia, thiourea, thiosulfate, halide reagents; [3,8,9]). Waste treatment allows PM to be separated from the “inert” material and concentrated at a rate high enough to allow PM recovery. A considerable amount of both gold and silversmith wastes and e-wastes are also recovered through physical and physico-chemical procedures such as froth flotation [10,11,12,13]. Froth flotation is a separation technique widely applied in mineral processing to concentrate minerals (e.g., copper sulfides, lead, zinc, platinum, tin minerals), which takes advantage of the different physico-chemical properties of PM after the addition of various flotation chemical reagents [12,13]. Flotation wastes are typically represented by PM-free “inert” muds, that can be reused as well (e.g., as secondary raw materials for asphalt production, [11]). According to the Environmental Protection Agency (EPA) and the European Waste Catalogue (EWC), flotation muds of secondary production from the PM recovery industry are classified as non-dangerous wastes, but they still must face storage problems. All these concepts and the entire life cycle of natural resources, from extraction to their application, their subsequent depletion and disposal, to their possible recovery and reuse, as secondary raw materials, are graphically summarized in Figure 1.
Different types of wastes have been extensively recycled in the production of ceramic and glass-ceramic, since these materials are versatile enough to accommodate various kinds of waste, such as coal fly ash [14,15], slag from the steel industry [16], ash and slag from waste incinerators [17,18], mud from zinc hydrometallurgy [19], red mud from alumina production [20] and other types of waste (see [21,22,23,24] for comprehensive reviews). As far as we know, flotation muds from PM recovery processes have not been yet tested as secondary raw materials in ceramic production, but some applications of mine wastes from flotation processes exist in the literature. For example, Drif et al. [25] investigated the use of treated silver mine tailings in substitution for natural clays in different proportions and under different sintering temperatures: they show that as the percentage of used waste increases, the mechanical properties of the ceramics decrease, but still remain within the limits acceptable by law. Other authors [26] presented a study concerning the recycling of iron ore tailings in ceramic production: a percentage from 0 to 5% of iron ore tailings has been mixed with clay to produce ceramic specimens at 950 °C, with good results and high feasibility both from the technical and environmental point of view. Treated coal mine tailings after flotation processes have been used by Taha et al. [27] to test their possible recycling in brick manufacturing: their results point out that the properties of bricks obtained with this kind of waste are perfectly in line with the technical requirements determined by international regulations. In addition, ceramic products have been manufactured, among other methods, by using phosphate rock wastes [28], lithium tailings [29] and red mud waste from alumina processing [30]. This paper deals with flotation muds derived from PM recovery processes and conducts a preliminary investigation, at a laboratory scale, of their use as a secondary raw material (SRM) in the production of a thermoformed ceramic product, following the procedures described in patent n. 0001369219 “Procedimento per realizzare manufatti termoformati, specialmente utilizzando materiali riciclati o di recupero”, released by the Italian Patent and Trademark Office in 11/01/2010 (owner GRINN Solutions S.r.l.). The results of this preliminary investigation confirm that this kind of waste can be successfully re-used in the ceramic industry, resulting in products with suitable technological performances and which are competitive with respect to traditional ceramics.

2. Materials and Methods

A representative flotation mud waste sample (FM) derived from PM recovery processes was used as secondary raw material to produce ceramic specimens (CFM). The production of this type of waste was monitored through time and the average composition of the mud waste turned out to be relatively homogeneous. The overall details of manufacturing and firing process are described in patent n. 0001369219, owned by Grinn Solutions S.r.l., a startup company dealing with waste material recycling. According to the above patent, ceramic specimens are usually produced using up to 80–85% of FM waste mixed with three additives: (i) aluminum-silicates of Ca, Mg, Fe (≈1–8%); (ii) amorphous silica and Na-silicate (≈5–15%); and (iii) Ca-sulfate, Fe-sulfate, boron oxide (B2O3), Na2O, SnO2 and ZnO (≈1–8%). Powdered dried sample was disaggregated using ultrasonic treatment, pressed and formed under wet conditions (with 15% H2O), and dried in a pre-furnace environment (humidity reduction of 5%). Sintering occurred in an oxidizing atmosphere at 1000 °C for about 30 min (heating rate 80 °C/h), followed by cooling at a 100 °C/h rate.
The chemical, mineralogical and microstructural characteristics of both secondary raw material (FM) and new products (the ceramic specimens, CFM) were determined using the following techniques.
Bulk chemical analyses were obtained using energy-dispersive X-ray fluorescence (ED-XRF) spectrometry with a PANalytical Epsilon 3XL instrument (Malvern, UK). The Omnian standardless method was used for quantitative analyses. Volatile components (H2O plus CO2) were determined through the weight loss on ignition (LOI). The Fe3+/Fe2+ ratio was determined through KMnO4 redox titration.
X-ray powder diffraction (XRPD) analyses were carried out with a Bragg-Brentano Philips X’Pert PRO PW3050/60 (Malvern Panalytical, Malvern, UK) diffractometer equipped with a PW3071 X’Celerator detector, using CuKa radiation in the 0–60 2θ range, with an operation condition of 40 kV and 30 mA. XRPD allowed the determination of the bulk mineralogical composition of both starting raw material (FM) and the final ceramic product (CFM).
Scanning electron microscope (SEM) analyses were carried out with a TESCAN VEGA 3 (Brno, Czech Republic), working at a 20 kV accelerating voltage, 15 μA emission current, 0.1 nA beam current, and equipped with an energy dispersive X-ray spectrometer (EDS) Bruker Quantax 200EDX for chemical microanalysis. Natural minerals were used as standards for EDS calibration and the P/B—ZAF correction method was used for quantitative analysis. SEM analyses were carried out on an untreated FM sample and on a polished thin section of the CFM product. Samples were carbon-coated before SEM observations. Back-scattered electron (BSE) images of the CFM sample were analyzed for particle analysis to determine the average apparent porosity, aspect ratio, roundness and equivalent diameter of pores, following the same procedure described in the works of Bernasconi et al. and Marian et al. [31,32]. For this analysis, three images at a 400× magnification, representative of the sample, were collected and treated by smoothing, filtering and thresholding processes, using a machine learning algorithm for pixel segmentation implemented in the Trainable WEKA Segmentation plugin of the open-source FIJI/ImageJ software [33,34]. Images were segmented to discriminate between areas occupied by 2D pores and areas occupied by the ceramic material, and then they were processed with the particle analysis tool of FIJI/ImageJ. A minimum threshold of 1 μm2 was chosen to analyze particles. The total porosity calculated in this way is the average value (%) of area occupied by pores of the 3 processed images.
Moreover, the porosity and the internal microstructure of the ceramic sample were investigated by means of X-ray computed tomography (micro-CT) using two microscopes: a Nikon XTH 225 (Nikon Metrology, Tring, UK) scanner and a micron-scale ZEISS Xradia 620 Versa (Carl Zeiss, Pleasanton, CA, USA). A sample of approximately 11 mm by 11 mm by 14 mm was mounted on a rotating stage that allows a 360° rotation with the sample in between the X-ray source and the detector. The Nikon scan was collected with a tube voltage of 80 kV and 93 μA. A total of 3185 projections were acquired with an acquisition time of 1 s per projection. After reconstruction with the proprietary Nikon reconstruction software CT Pro 3D (Nikon, Tring, UK), the resulting images for all datasets had a voxel size of 8.5 µm. Instead, 1601 projections (2 s exposure time) were acquired with a ZEISS Xradia 620 Versa microscope. For an optimal transmission, a tube with 120 kV and 146 μA was set. The raw projections were reconstructed with the proprietary ZEISS XM Reconstructor software package, achieving a voxel size of 1 µm.
For the 3D analysis of porosity, Avizo 3D 2022.1 (ThermoFisher Scientific, Waltham, MA, USA) was used to create volume renderings and to perform the image segmentation. For each scan a subvolume was created (790 × 942 × 748 voxels, corresponding to 6.7 mm by 8.0 mm by 6.4 mm, and 864 × 1138 × 928 voxels, corresponding to 863 × 1137 × 927 microns for Nikon and Versa scans, respectively) to avoid artifacts present in the external part of the scan. To reduce noise, an anisotropic diffusion filter was used. This improved the quality of the data in order to facilitate segmentation. To avoid user bias, an automatic segmentation was employed following the Otsu method present in Avizo software.
Additional tests were conducted to determine the physical and mechanical properties of the thermoformed ceramic material. In particular, 6 cubes (50 × 50 × 50 mm) and 6 joists (300 × 50 × 50 mm), obtained from CFM sample tiles, were subjected to mechanical tests (Figure S1 in Supplementary Material), to determine: (I) the uniaxial compressive strength test (UNI EN 1926); (II) flexural strength under a concentrated load (UNI EN 12372), with a load rate increase equal to 0.25 MPa/s (83.3 N/s) and the distance between supports equal to 250 mm (before both of these tests, specimens were dried at a temperature of 70 °C, then they were conditioned at a temperature of 20 °C.); and (III) wear resistance on about 2 kg weight of CFM reduced to the size required for the “Micro-Deval” test (UNI EN 1097–1).

3. Flotation mud Wastes: Chemical Composition and Microstructure

Table 1 shows the bulk chemical composition of the starting raw material (the dried flotation mud waste) and derived ceramic product. The former has a substantially Si-, Al- and Ca-rich composition, with a lower amount of Fe (here expressed as Fe2O3 wt%), Mg and Na. Other elements are present in minor amounts (P, S, Cl, Zn, Cu, Ni, Cr, Sn and Ba), below 1 wt% of their relative oxide, except for Ce and Zr oxides that are present above 1 wt%. Loss on ignition is below 1 wt%, indicating that the sample has minimal amounts of volatile components.
XRPD analysis carried out on the FM sample revealed a completely amorphous phase, even if the sample showed weak peaks possibly attributed to hercynite (FeAl2O4) (Figure 2A).
As seen in the SEM images, the untreated dried flotation mud waste (FM, Figure 3A–D) is composed of grains with variable shape and size (from a few micrometers to ~200 µm). Figure 3B,C highlights the conchoidal fracture typical of glass, in agreement with XRPD results. Judging from the BSE contrast, the glass fragments appear homogeneous and no evident heavy minor phase can be detected, except for some rare tiny grains made up of Fe-oxides and Ni-sulfate (brighter grains with a high BSE yield in Figure 3A–D). EDS data relating to some grains (Table 2) confirm the composition of a Ca- and Al-rich silicatic material, with a certain amount of Na2O and MgO, as revealed in the XRF bulk chemical analyses, and with minor amounts of Ce, Zr, Sn and Cr.

4. Characteristics of Ceramic Products Obtained Using Flotation Muds as SRM

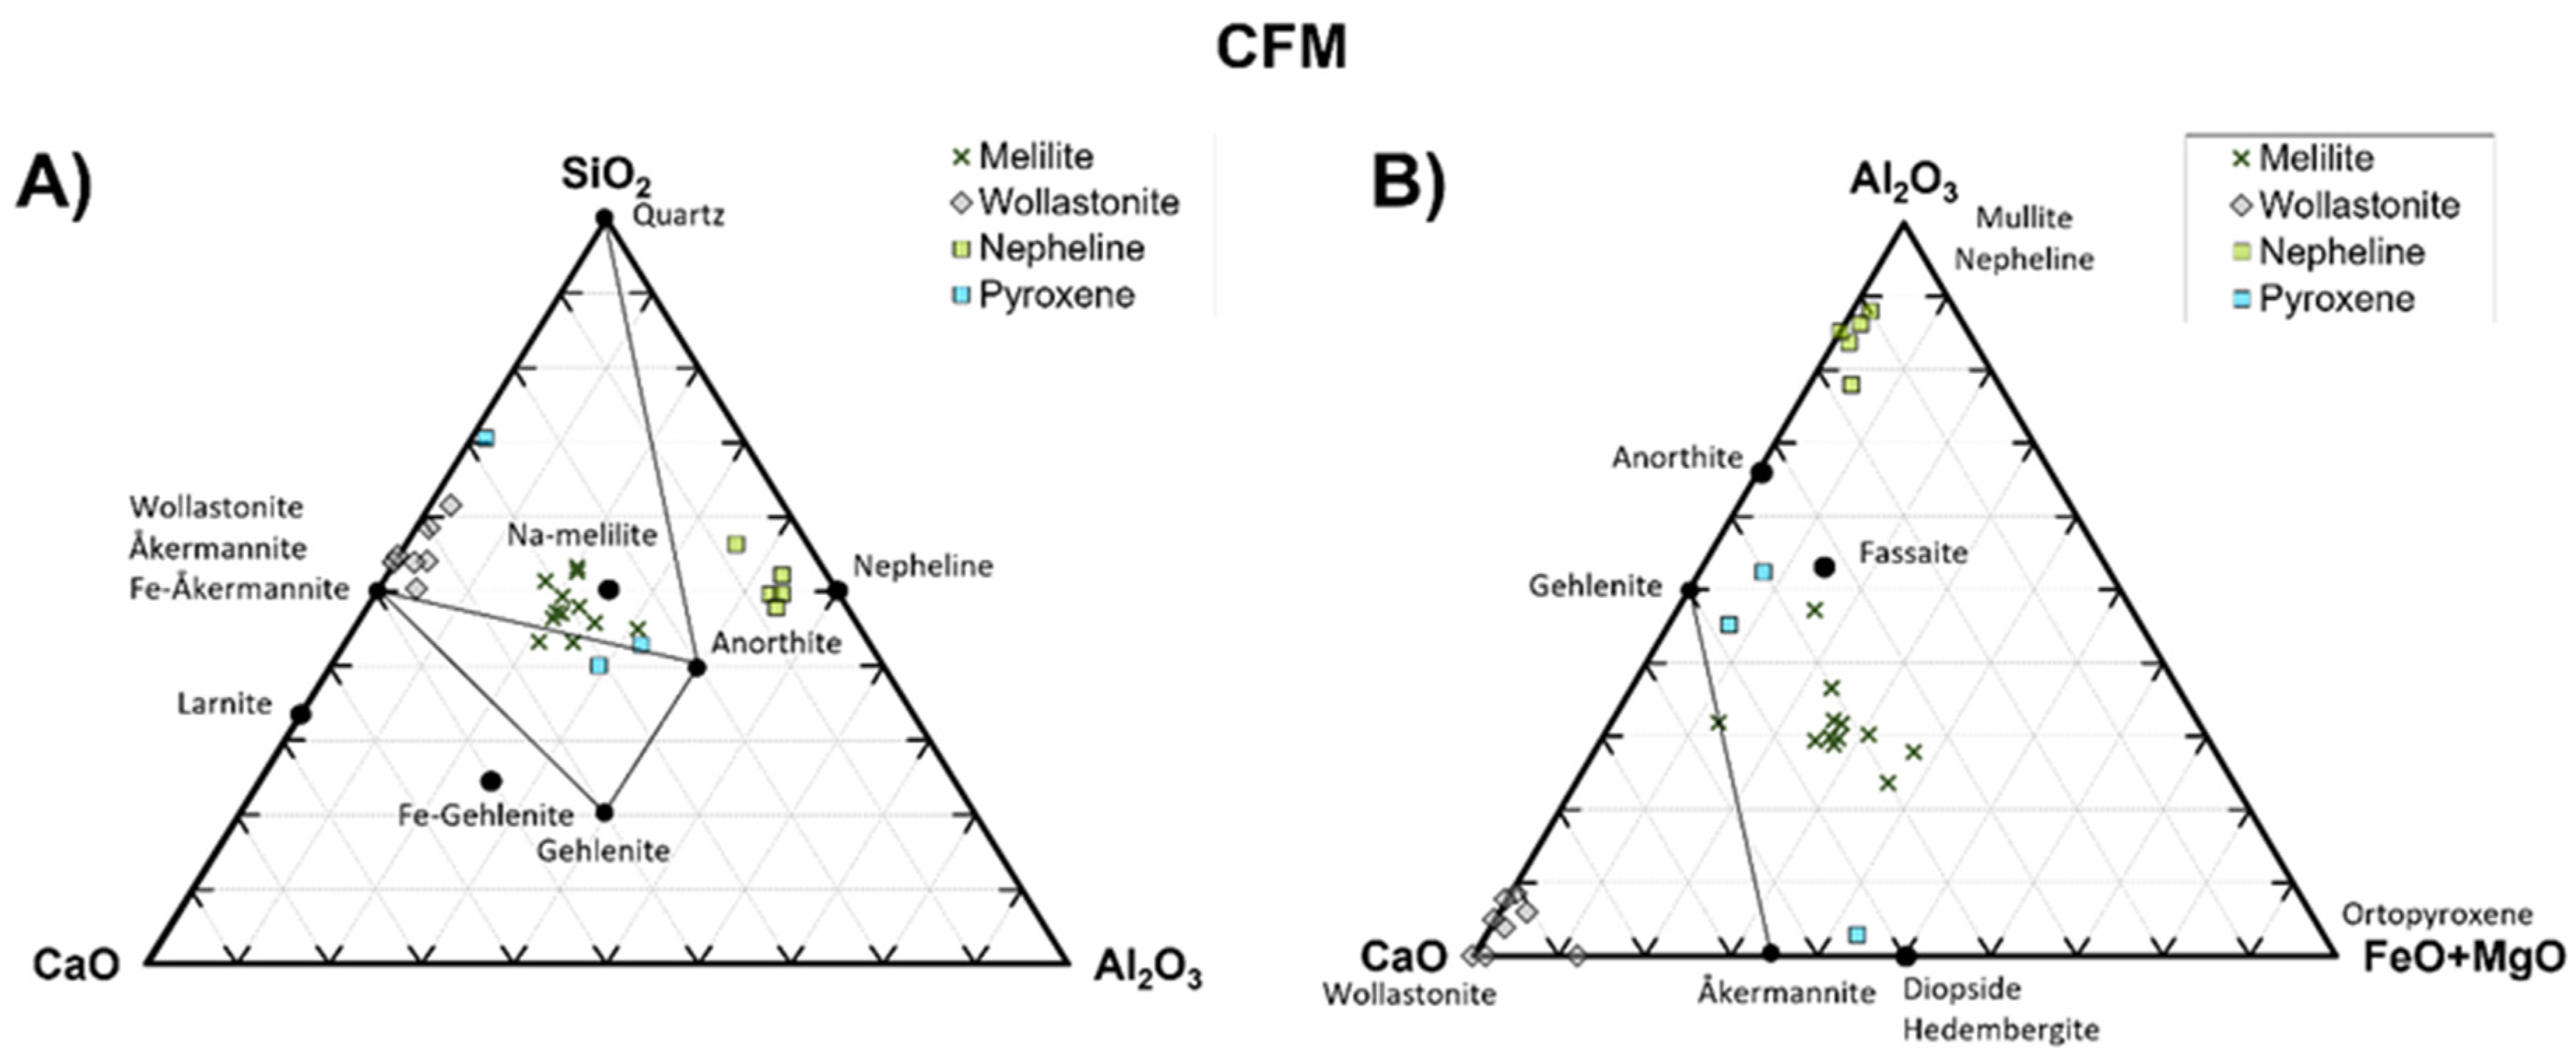
4.1. Chemical, Mineralogical and Microstructural Features

The investigated ceramic specimens are tiles of 3 × 2 × 1 cm in size, light brown in color, with homogeneously distributed pores. As regards bulk characterization, XRF chemical analyses of the ceramic product are reported in Table 1. The major components are SiO2, CaO and Al2O3, followed by Fe, Na and Mg oxides and minor amounts of Ti, Cr, Mn, Cu, Ni, Zn, Sn, Cr and Zr (Table 1). Figure 2B shows bulk XRPD data, revealing diopside (CaMgSi2O6), anorthite (CaAl2Si2O8) and the feldspathoid nepheline ((Na, K)AlSiO4) as the main crystalline phases, formed during high temperature processing.
SEM/BSE observations allowed the microstructural characterization of the CFM specimen. Pores are small (2–115 µm in diameter) and display an elongated and irregular shape (Figure 4D–F), often evolving in a complex, apparently interconnected pattern. The ceramic material appears to be mostly crystalline, showing crystals and grains of different mineralogical phases, up to 300–400 µm in size (e.g., Figure 4C,D). The overall microstructure is characterized by an apparent “grain-supported” texture composed of single grains or aggregates which are often in contact with each other, set up in a glassy and variably porous matrix, alternating with areas composed almost exclusively of a fine-grained, compact groundmass. Based on EDS data, the main mineralogical phases are Ca-bearing nepheline (light grey colors in Figure 4C,D) and wollastonite (CaSiO3), which sometimes forms rims around bigger grains or aggregates, and sometimes makes up needle-like, skeletal elongated micro phenocrysts set in a glassy homogeneous groundmass (Figure 4F). The latter has an irregular distribution, with some compact, not porous, glassy areas (Figure 4E,F), and areas with a crystalline, more porous texture (Figure 4C,D). The microstructure is also characterized by the presence of dispersed single and/or aggregate particles of silica often included and resorbed in the glassy phase, and some minor iron oxides crystals (the grains with highest contrast in Figure 4D). In some cases, the above crystalline phases are associated with Ca-Al silicates with a composition close to melilite (ideal chemical formula (Ca, Na)2(Al, Mg, Fe2+)[(Al, Si)SiO7]). The latter belongs to the solid solution between åkermannite (Ca2MgSi2O7) and gehlenite (Ca2Al2SiO7), i.e., common constituents of ceramic materials [35,36,37].
Table 3 shows EDS data of the main mineralogical phases identified in the CFM sample.

4.2. Physical and Mechanical Test
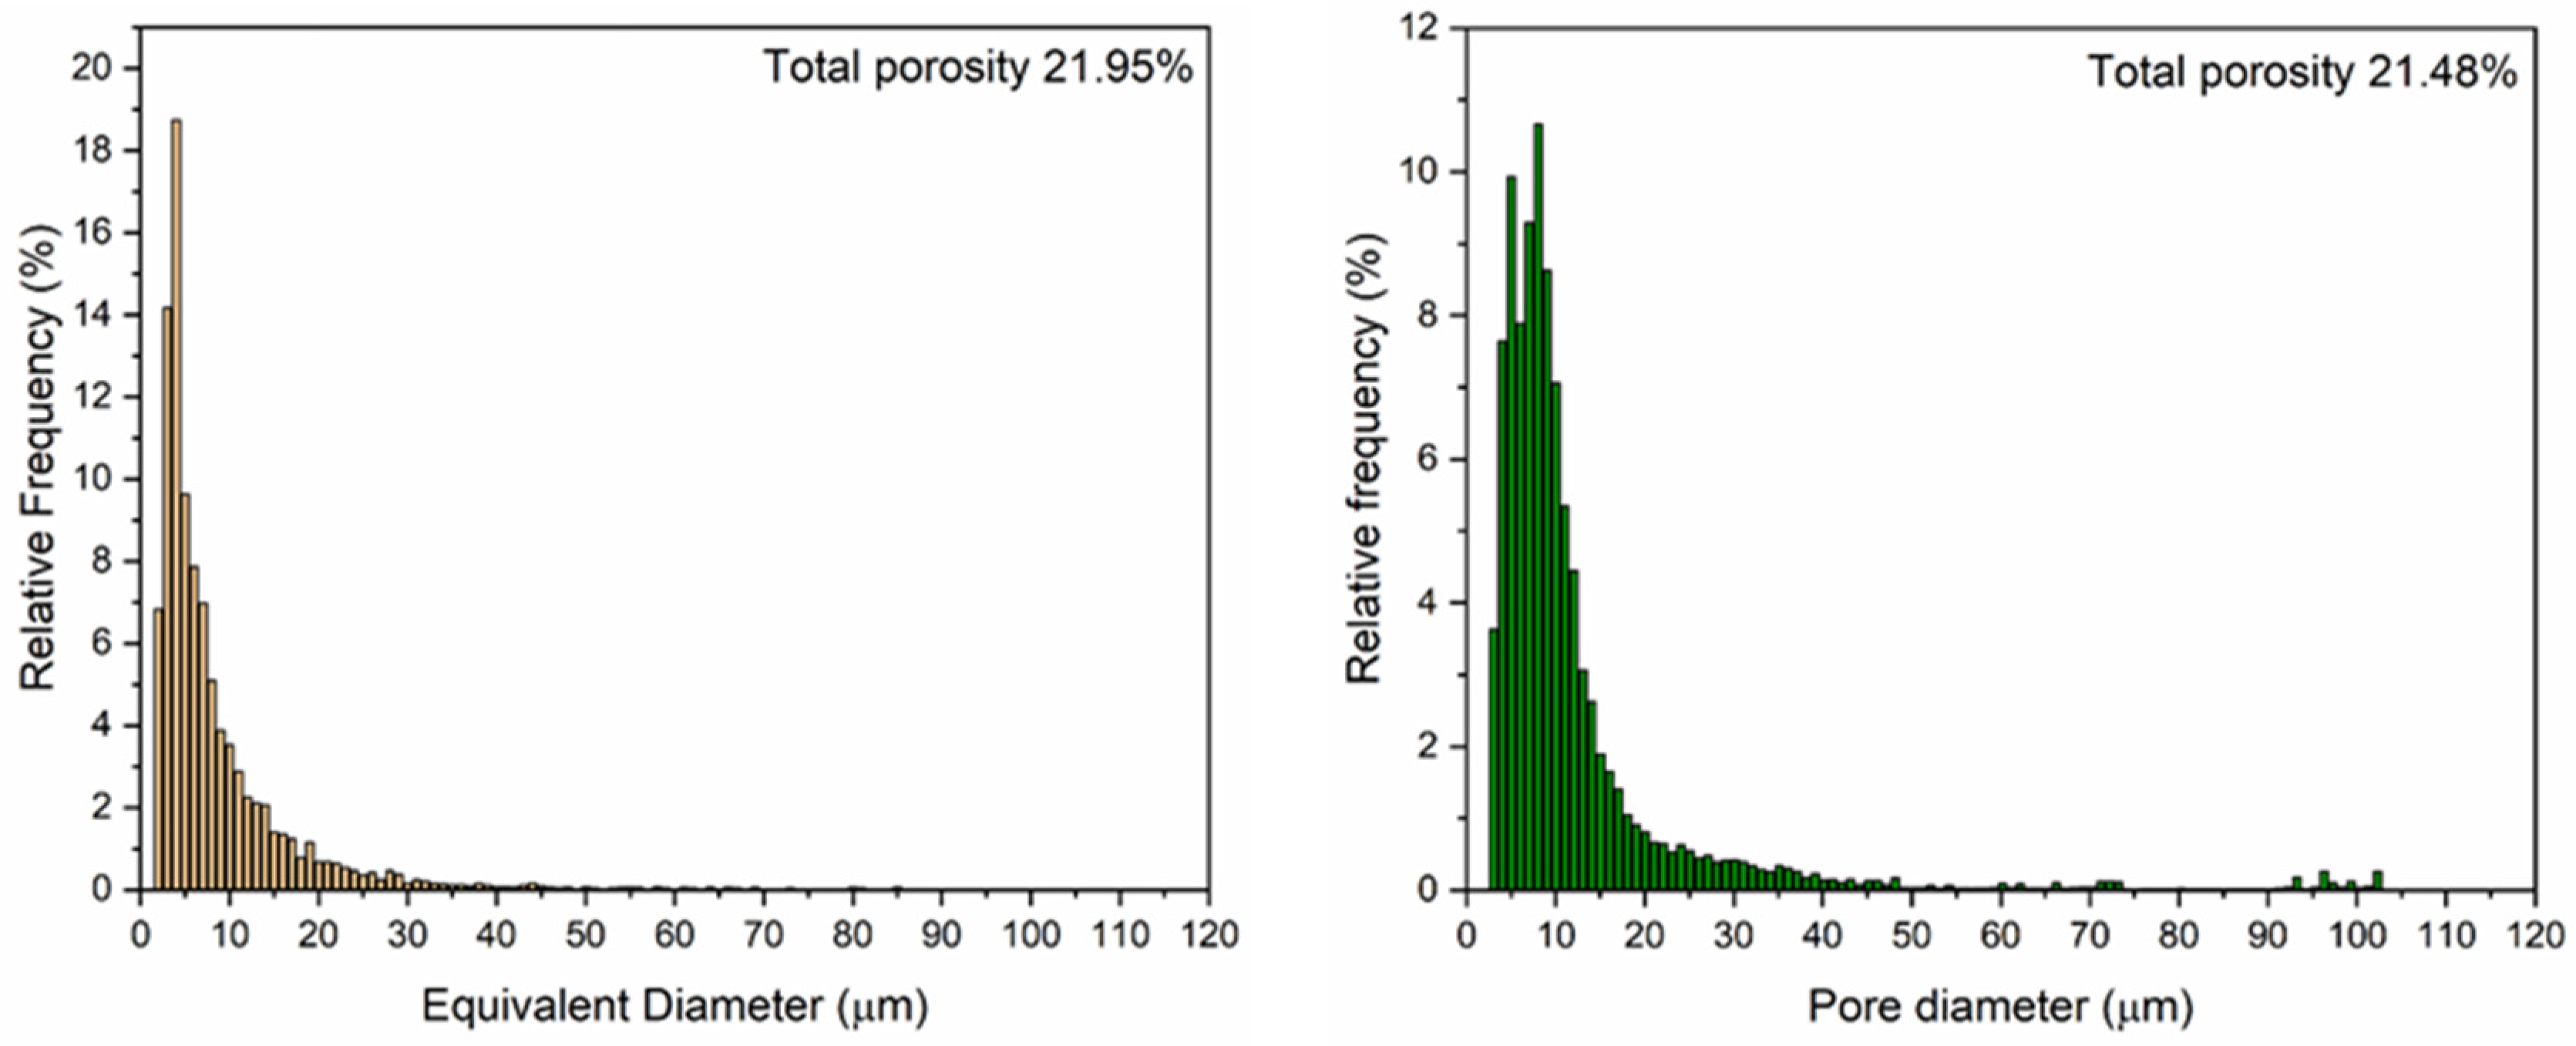
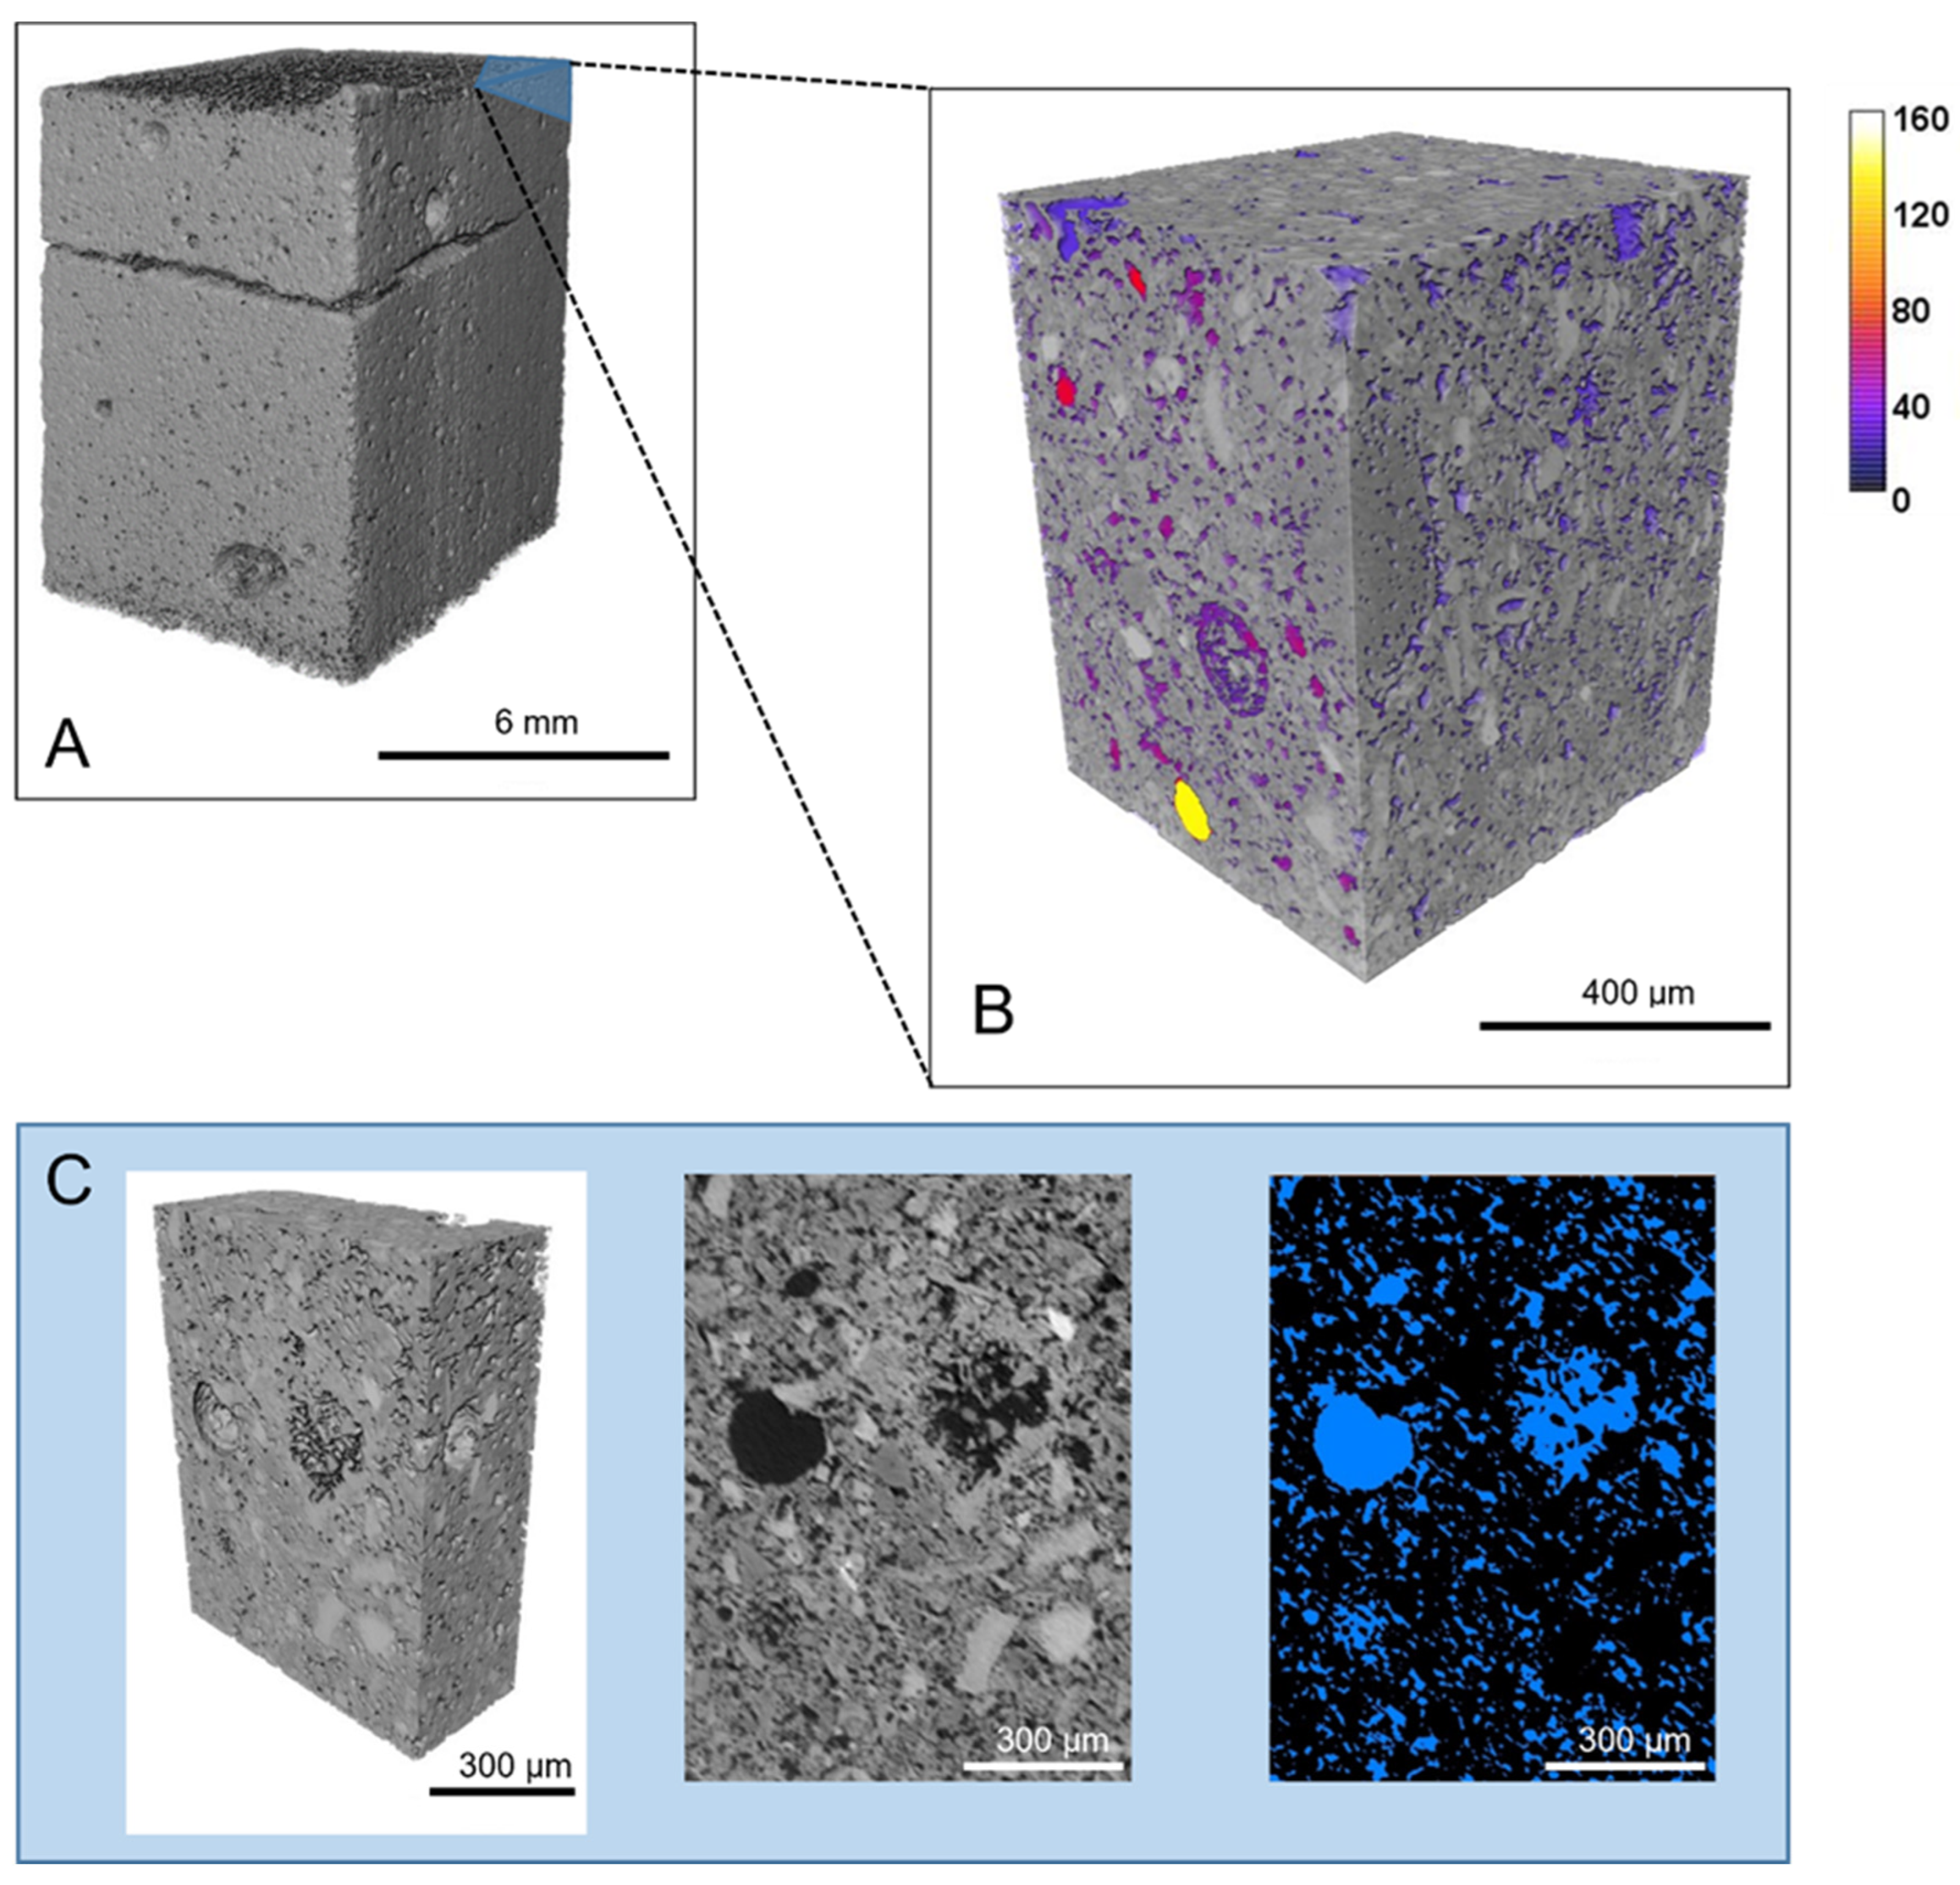
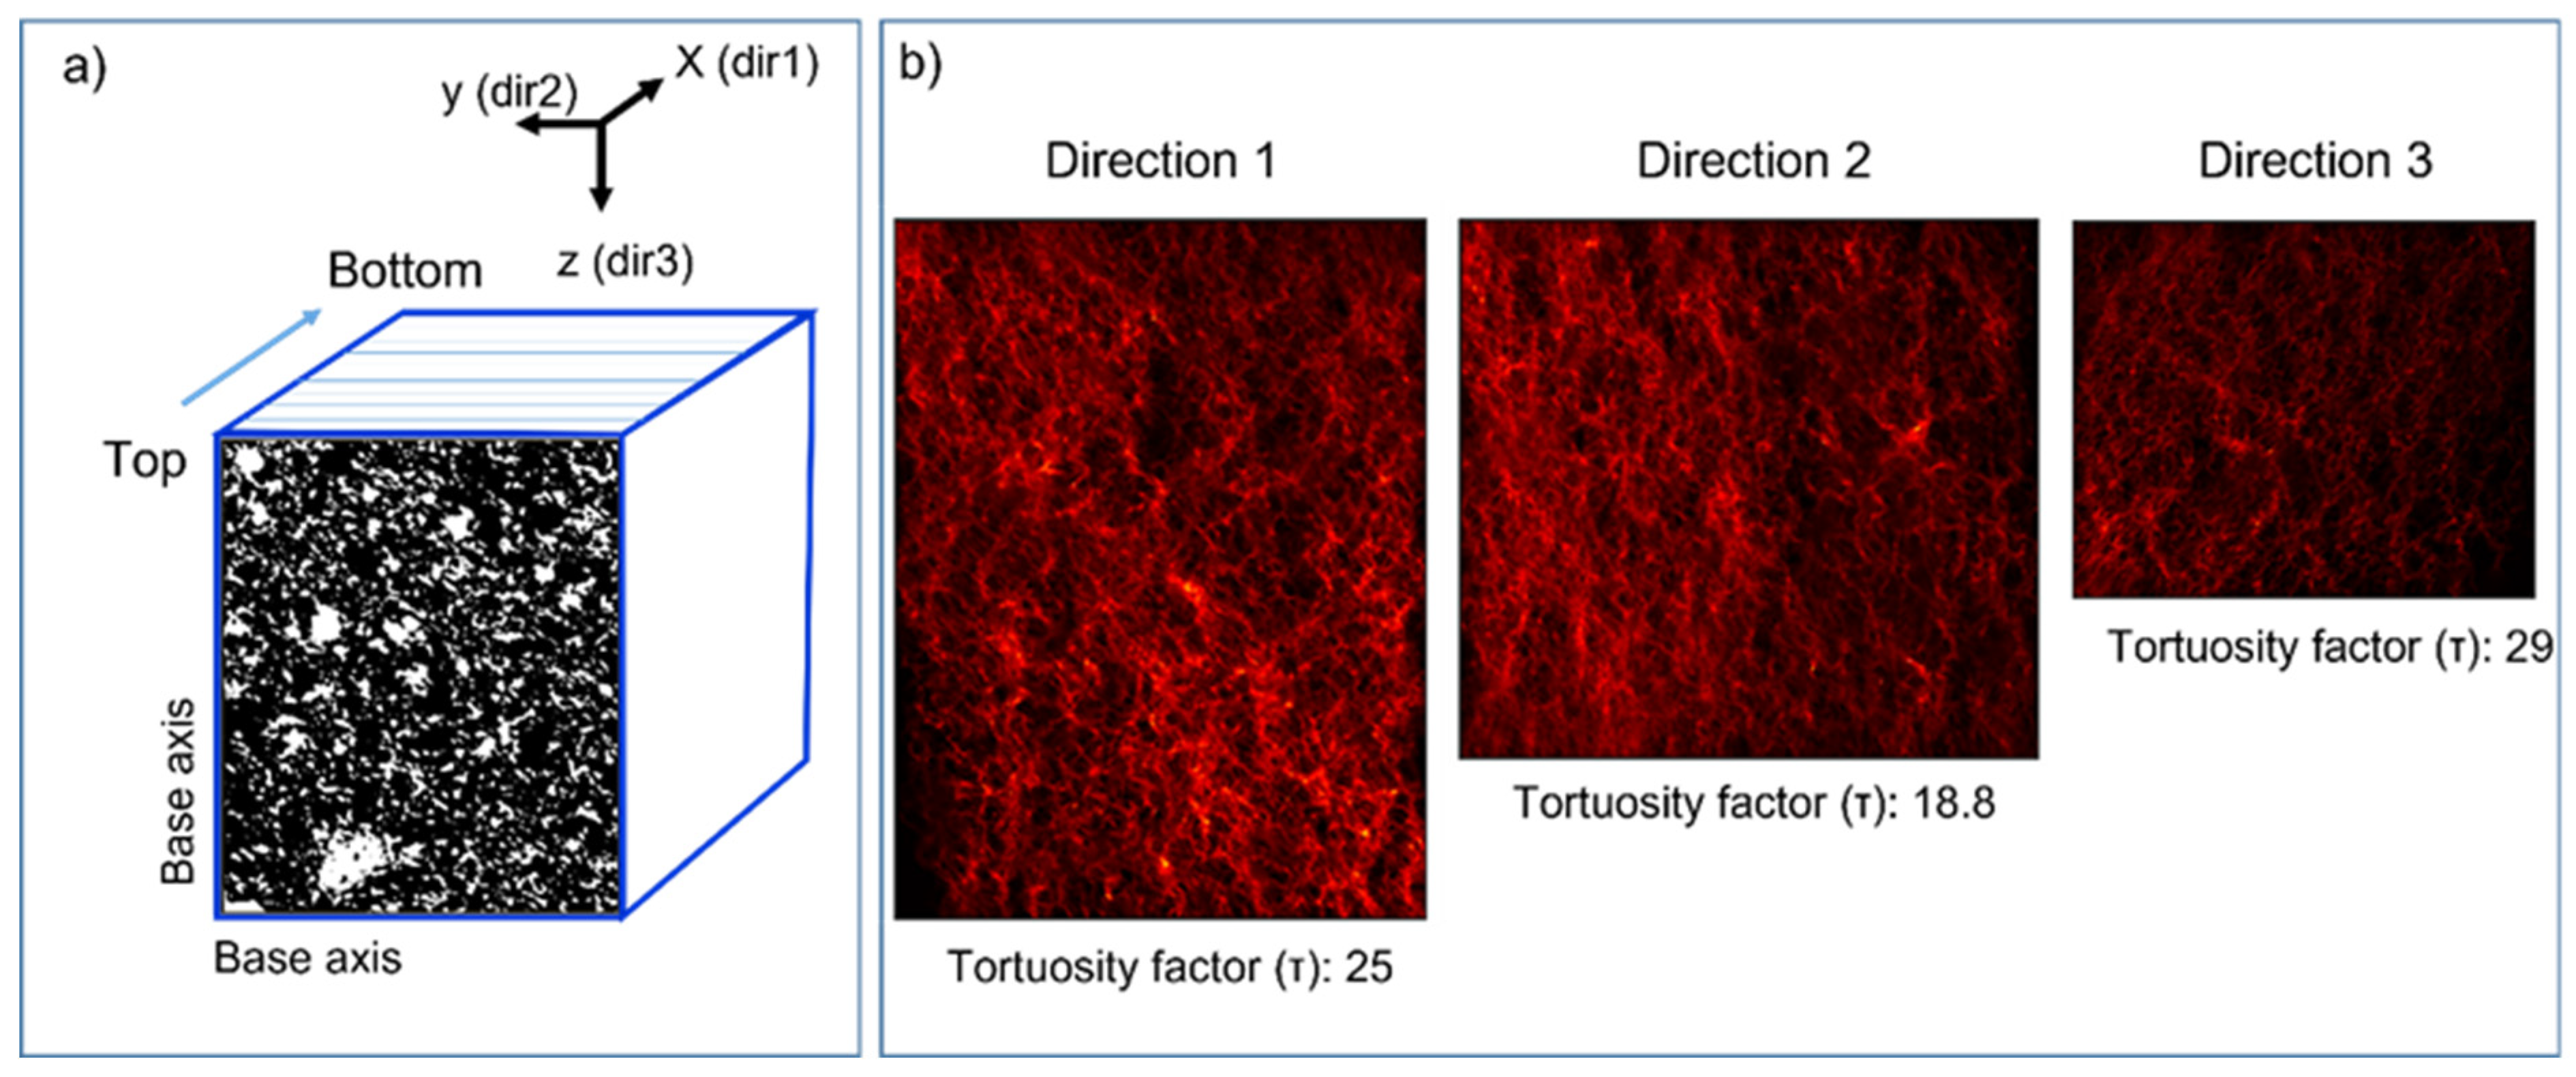
Results of the uniaxial compressive strength (UNI EN 1926) and flexural strength (UNI EN 12372) tests are shown in Table 4. The compressive strength of the tested specimens ranges from 53.2 to 73.9 MPa, while flexural strength under a concentrated load ranges from 9.1 to 11.1 MPa.
Moreover, the micro-Deval abrasion test measures the wear resistance produced on the aggregate from the friction between the particles and the abrasive charge given by spheres inserted in a rotating drum. The lower the value of the coefficient, the better the wear resistance. To determine the wear resistance of the coarse aggregate, the material was prepared by reducing it to a test particle size class. Data in Table 4 shows the MDE = Micro-Deval coefficient as computed by the following equation:
MDE = [(M − m)/M] × 100
where:
M: mass, in g, of the specimen before the test;
m: mass, in g, of the material retained in the 1.6 mm sieve after the test.

4.3. Porosity

The distribution of pores in 2D SEM images was calculated with segmentation and the successive classification of pore areas with the particle analysis tool of FIJI/ImageJ software (see Methods for further details and Table S1 for segmentation data in Supplementary Material). The overall porosity calculated in this way was 21.95%, with a pore size distribution highlighted in Figure 5. The latter shows that most pores (~75% of the total) are below 10 microns in size.
The overall porosity calculated using the volume fraction module in Avizo returned a value of 3.4% for the Nikon scan, while a value of 21.48% was obtained using the higher resolution Versa scan. To characterize the pore diameter distribution, a local thickness approach was used using free software FiJi [33] for the Versa scan data. By definition, the local thickness algorithm defines “The diameter of the largest sphere that fits inside the object”. A histogram of pore diameter distribution was then created (Figure 5 and Figure 6 and Table S2 in Supplementary Material).
In order to better investigate the connectivity of porosity, the tortuosity factor of interconnected pores was calculated, following the same procedure described in Backeberg et al. [38]. Tortuosity factor is a parameter that quantifies the geometric interconnections between pore spaces, taking into account the variation in pore cross section areas through a determined direction into a porous material. In particular, TauFactor [39] was used to model the 3D interconnectivity pattern of the investigated subsample. This Matlab application models the tortuosity factor (τ) along the three dimensions of the investigated diffusive (i.e., porous) phases. The minimum value of τ is 1, which means that along the test axis, the cross section of a pore area is constant and the pathway is perfectly straight. Otherwise, if there are no interconnected pathways along the test direction, TauFactor returns a value of infinity. Through this type of analysis, the three mutually perpendicular directions (x, y, z) of the sampled subvolume were modeled and a value of τ was calculated for each of them, to check the level of interconnectivity, which would facilitate the flow of water for example, and the presence of anisotropy in the porosity pattern, if any.

5. Discussion

The mineralogical composition of the ceramic product reflects the chemical constituents of used SRM, i.e., the flotation mud derived from precious metal recovery. The abundance of Ca, Al, and Si oxides in the amorphous FM has allowed the crystallization of some Ca-silicates during the sintering process, such as anorthite and diopside. The presence in the original amorphous FM of metals such as Ti, Cr and Zr could have triggered the crystallization process since these elements often work as nucleating agents [40,41]. Instead, the presence of nepheline, a Na-rich mineral, is likely due to the addition of sodium silicate as a fluxing agent to the original SRM batch, as explained in patent n° 0001369219 owned by GRINN Solutions S.r.l. The occurrence of a feldspathoid indicates SiO2 undersaturation conditions, at least at the local scale. The presence of nepheline is rather unusual in traditional ceramic materials, even if it is relatively common in glass-ceramic production for peculiar applications, due to its high mechanical properties [42,43,44,45,46]. However, given the initial bulk chemical composition in the system SiO2-Al2O3-CaO, the development of anorthite should be expected and preferred as the major phase crystallizing from glass at the expense of nepheline. In any case, as shown in Table 3, mineral phases have not an ideal composition, but all of them are solid solutions, as explained in Figure 7, which shows the systems SiO2-Al2O3-CaO and CaO-Al2O3- (FeOTOT + MgO). Given the predominantly Ca-Al-Si composition of the initial amorphous raw materials and their relative abundance, the mineralogical species of the newly formed crystalline phases inevitably reflect it: for example, pyroxene often has a Tschermak’s substitution in its chemical formula [47], with an enrichment in Al substituting Si (Table 3). The presence of melilite could be caused by the availability in the system of CaO and SiO2: the reaction between these oxides could have been enhanced by the presence of fluxing agents such as Na2O and K2O [27]. Moreover, it is probable that a large fraction of iron is present in the trivalent form, given the oxidizing atmosphere during the sintering process. Trivalent iron indeed could be usually incorporated in a gehlenite-åkermannite series, so it is likely that melilites (in particular Fe-Gehlenite) could be composed of a fraction of Fe(III) which cannot be distinguished from Fe(II) EDS. In addition, as shown in Table 4, some of the heavy metals originally present in the flotation mud (i.e., Zr and Cr), probably residues from the recovery process, have been incorporated, mostly in the crystalline phases of melilites and iron oxides, while the glassy phase remains apparently free of them. Additionally, sodium, derived both from the initial composition of FM and from the fluxing agent, is enriched in melilites. All these elements may represent a critical aspect in terms of material leachability, since solubilization and environmental pollution must be avoided.
In some portions of the sample, SEM images revealed regions (i.e., Figure 4E) of a glassy matrix with dispersed micro crystals (ca 10–20 microns in size) of wollastonite needles, that were not detected via XRPD probably because of their low concentration. Wollastonite tiny skeletal crystals are the only crystalline phase detected in these prevalently glassy regions of the sample (Figure 4E,F), at least at the observation scale of the electronic microscope. This phase could be developed after crystallization from the glass in the initial mixture at a temperature around 900–1000 °C [48], which was, in fact, the one the FM sample was subjected to. The presence of widespread compact glassy regions revealed from SEM observations, due to the addition of fluxing agents such as alkali, is not in agreement with porosity value measurements obtained from micro-CT and SEM image analysis. Indeed, 3D reconstruction of the ceramic product shows a prevalently interconnected pore pattern and an overall porosity of about 21%, which is quite a high value for a ceramic product. Moreover, pores are prevalently in the dimensional range of 1–20 µm (Figure 5), with 3D data obtained with the micro-CT scan basically being in agreement with SEM observations, with the only difference being that pore size distribution is centered on slightly smaller values in the case of 2D SEM analysis and towards higher values in the case of 3D Versa scan data. For the sake of completeness, a minor population of sub-rounded, isolated, bigger pores (with a hundreds of microns to 1 mm average diameter, highlighted by Nikon scans) is present in some regions of the scanned specimen (Figure 6). Instead, the areas with low porosity can be explained with the formation of a viscous liquid that eventually, once solidified, filled open pores of the ceramic body and originated the interstitial amorphous phase [49]. The sparse, biggest, subrounded pores could be ascribed to volatile degassing, even if both FM waste and additives are expected to be volatile-free. The porosity parameter is, however, critical in the technological assessment of this kind of product, since low close porosity is often associated with low water absorption rates. The 3D image analysis approach carried out on the data obtained with the Versa microscope also revealed a local axis connectivity (i.e., volume of pores sharing at least one voxel along one direction) of 19.74% on average; this means that over 90% of the computed 3D porosity seems to be interconnected, even if the used calculation is very conservative, since one shared voxel corresponds approximately to 1 µm2 in size. Analysis carried out with TauFactor modeling gave τ values of 25, 18.8 and 29, respectively, in directions x, y and z of the investigated subsample (Figure 8). With the three directions being mutually perpendicular, these results, although not differing much in in absolute value, could mean that along one direction (i.e., that of compaction of the material during manufacturing), diffusive pathways are lesser than those present in the two other directions. The compaction of the raw materials during formation would therefore have favored the formation of stretched pores along the directions perpendicular to the main compressive stress.
Compressive strength is one of the main technological properties for building and construction materials. In this case, the CFM sample shows compressive strength values between 53.2 and 73.9 MPa, which are in agreement with data obtained on other glass-ceramics and much higher than the compressive strength of bricks produced with waste recycling (see Table 5 for comparisons between different kinds of ceramic materials).
Regarding the flexural strength test, obtained values have higher variability; in particular, specimen B presents a very low value of flexural strength (0.8 MPa). This is likely due to an already present internal macro-crack pattern that influences the mechanical resistance of the specimen, which is absent in the other samples. For this reason, it is excluded from the comparison with the other two specimens shown in Table 4.
Accordingly, the average flexural strength value of the two intact specimens (Table 4) is 10.1 MPa, a value comparable to those of ceramics produced at 1000 °C using silver mine tailings [25] and iron ore tailings [26] as SRM. The presence of feldspar, feldspathoid and wollastonite needles in the bulk glassy matrix probably contributes to a rise in the flexural strength resistance, as already demonstrated by, among the others, Romero et al. [48] in ceramics produced from the recycling of Al-slag. In addition, the good mechanical resistance is also testified by the results of the wear resistance test, which yielded a micro-Deval parameter close to the limit values usually employed for aggregates in the construction field, in particular for granular underlay applications.

6. Conclusions

The recycling of flotation muds derived from precious metal recovery processes involving spent catalysts and electronic wastes is a valuable way to reduce disposal issues and environmental impact. In this research, the feasibility study concerning the possible reuse of this kind of waste as a secondary raw material in ceramic production has led to satisfactory results in terms of technological and compositional properties. The preliminary evaluation of the recycling of flotation sludge waste in ceramic manufacture has been carried out only at the laboratory scale, with the use of a representative sludge sample and a complete characterization of raw material and the related ceramic product. The latter show a prevalently crystalline, porous microstructure with a certain amount of glassy phase. The presence of crystalline phases such as anorthite, nepheline, pyroxene and wollastonite, alternating with a compact glassy matrix, is responsible for the good geomechanical properties such as bending and uniaxial strength, despite the measured interconnected porosity. Data derived from this preliminary study can serve as a basis for subsequent feasibility steps. In particular, future work would be devoted to test the recycling of these wastes under different heating conditions, to determine leaching properties of the ceramic products (with a particular focus on FM heavy metals that seemed to be prevalently incorporated into melilites and iron oxides) and to check the economic feasibility of this kind of reuse.

Supplementary Materials

The following supporting information can be downloaded at: https://www.mdpi.com/article/10.3390/recycling8020035/s1, Figure S1: Joist, cubic samples and aggregates to be tested for the determination of their physical and mechanical characteristics. Table S1: Parameters obtained with particle analysis tool of FIJI/ImageJ applied to segmented images. Equivalent diameter (column “Feret”) has been used to estimate 2D pore size distribution. Table S2: 3D pore diameter distribution obtained with “Local Thickness” algorithm applied on segmented subvolume of the Versa scan.

Author Contributions

All authors contributed to the study conception and design. M.P.: Conceptualization, visualization, data curation, elaboration of experimental data, and paper writing, reviewing and editing. F.I.: Elaboration of experimental data, micro-CT analysis, and paper writing, reviewing and editing. N.M.M.: Visualization, elaboration of experimental data, XRD analysis, SEM/EDS investigation, paper writing, and draft review and editing. C.I.: Visualization, elaboration of experimental data, XRD analysis, SEM/EDS investigation, and draft review and editing. G.C.: XRF analysis, and draft review and editing. R.S.: Geomechanical tests, and draft review and editing. M.Z.: Supervision, conceptualization, and draft review and editing. C.V.: Supervision, project administration, funding acquisition, conceptualization, visualization, and draft review and editing. All authors have read and agreed to the published version of the manuscript.

Funding

This research was funded by the Department of Physical Sciences, Earth and Environment, at the PhD School of Environmental, Geological and Polar Sciences and Technologies, University of Siena.

Data Availability Statement

The data presented in this study are available in supplementary material.

Acknowledgments

GRINN S.r.l. is kindly acknowledged for providing the ceramic tests and contributing to useful suggestions and comments on the formation and heating manufacture of ceramic material. Tomographic analysis has been carried out thanks to the support provided by the Engineering and Physical Sciences Research Council (EPSRC) (EP/M028100/1 and EP/N032888/1). This research did not receive any specific grant from funding agencies in the public, commercial or not-for-profit sector. Two anonymous reviewers are also thanked for their helpful comments and suggestion which improved the manuscript.

Conflicts of Interest

The authors declare no conflict of interest.

References

  1. Ponomarenko, T.; Nevskaya, M.; Jonek-Kowalska, I. Mineral Resource Depletion Assessment: Alternatives, Problems, Results. Sustainability 2021, 13, 862. [Google Scholar] [CrossRef]
  2. ISPRA Istituto Superiore per la Protezione e la Ricerca Ambientale. Rapporto Rifiuti Speciali; ISPRA: Roma, Italy, 2021. [Google Scholar]
  3. Ding, Y.; Zhang, S.; Liu, B.; Zheng, H.; Chang, C.-C.; Ekberg, C. Recovery of Precious Metals from Electronic Waste and Spent Catalysts: A Review. Resour. Conserv. Recycl. 2019, 141, 284–298. [Google Scholar] [CrossRef]
  4. Diaz, L.A.; Lister, T.E.; Parkman, J.A.; Clark, G.G. Comprehensive Process for the Recovery of Value and Critical Materials from Electronic Waste. J. Clean. Prod. 2016, 125, 236–244. [Google Scholar] [CrossRef] [Green Version]
  5. Zhang, S.; Ding, Y.; Liu, B.; Chang, C.-C. Supply and Demand of Some Critical Metals and Present Status of Their Recycling in WEEE. Waste Manag. 2017, 65, 113–127. [Google Scholar] [CrossRef]
  6. Saidani, M.; Kendall, A.; Yannou, B.; Leroy, Y.; Cluzel, F. Closing the Loop on Platinum from Catalytic Converters: Contributions from Material Flow Analysis and Circularity Indicators. J. Ind. Ecol. 2019, 23, 1143–1158. [Google Scholar] [CrossRef]
  7. Ciabatti, I.; Fontani, M.; Martini, C. The Arezzo Seminar on Precious Metals. Substantia 2019, 3, 7–10. [Google Scholar]
  8. Yousif, A.M. Recovery and Then Individual Separation of Platinum, Palladium, and Rhodium from Spent Car Catalytic Converters Using Hydrometallurgical Technique Followed by Successive Precipitation Methods. J. Chem. 2019, 2019, 2318157. [Google Scholar] [CrossRef]
  9. Trinh, H.B.; Lee, J.C.; Suh, Y.J.; Lee, J. A Review on the Recycling Processes of Spent Auto-Catalysts: Towards the Development of Sustainable Metallurgy. Waste Manag. 2020, 114, 148–165. [Google Scholar] [CrossRef]
  10. Wills, B.A.; Finch, J. Wills’ Mineral Processing Technology: An Introduction to the Practical Aspects of Ore Treatment and Mineral Recovery; Butterworth-Heinemann: Oxford, UK, 2015; ISBN 0080970540. [Google Scholar]
  11. Iacopo Ciabatti. Il Recupero Dei Metalli Preziosi Dagli Scarti Della Lavorazione Orafa. La Chim. E L’industria Online 2018, 5, 39–43. [Google Scholar]
  12. Jeon, S.; Ito, M.; Tabelin, C.B.; Pongsumrankul, R.; Kitajima, N.; Park, l.; Hiroyoshi, N. Gold Recovery from Shredder Light Fraction of E-Waste Recycling Plant by Flotation-Ammonium Thiosulfate Leaching. Waste Manag. 2018, 77, 195–202. [Google Scholar] [CrossRef]
  13. Burat, F.; Baştürkcü, H.; Özer, M. Gold&silver Recovery from Jewelry Waste with Combination of Physical and Physicochemical Methods. Waste Manag. 2019, 89, 10–20. [Google Scholar] [CrossRef] [PubMed]
  14. Kumar, S.; Singh, K.K.; Ramachandrarao, P. Synthesis of Cordierite from Fly Ash and Its Refractory Properties. J. Mater. Sci. Lett. 2000, 19, 1263–1265. [Google Scholar] [CrossRef]
  15. Erol, M.; Küçükbayrak, S.; Ersoy-Meriçboyu, A. Comparison of the Properties of Glass, Glass-Ceramic and Ceramic Materials Produced from Coal Fly Ash. J. Hazard. Mater. 2008, 153, 418–425. [Google Scholar] [CrossRef] [PubMed]
  16. Khater, G.A. The Use of Saudi Slag for the Production of Glass-Ceramic Materials. Ceram. Int. 2002, 28, 59–67. [Google Scholar] [CrossRef]
  17. Boccaccini, A.R.; Petitmermet, M.; Wintermantel, E. Glass-ceramics from municipal incinerator fly ash. Am. Ceram. Soc. Bull. 1997, 76, 75–81. [Google Scholar]
  18. Andreola, F.; Barbieri, L.; Corradi, A.; Lancellotti, I.; Manfredini, T. The Possibility to Recycle Solid Residues of the Municipal Waste Incineration into a Ceramic Tile Body. J. Mater. Sci. 2001, 36, 4869–4873. [Google Scholar] [CrossRef]
  19. Montanaro, L.; Bianchini, N.; Rincon, J.M.; Romero, M. Sintering Behaviour of Pressed Red Mud Wastes from Zinc Hydrometallurgy. Ceram. Int. 2001, 27, 29–37. [Google Scholar] [CrossRef]
  20. Peixin, Z.; Jiaqiang, Y. Mössbauer and Infrared Spectroscopy Investigation on Glass Ceramics Using Red Mud. Z. Für Met. 2000, 91, 764–768. [Google Scholar]
  21. Rawlings, R.D.; Wu, J.P.; Boccaccini, A.R. Glass-Ceramics: Their Production from Wastes—A Review. J. Mater. Sci. 2006, 41, 733–761. [Google Scholar] [CrossRef] [Green Version]
  22. Sarrigani, G.V.; Amiri, I.S. Literature Review of Glass-Ceramic and Willemite Production from Waste Materials. In Willemite-Based Glass Ceramic Doped by Different Percentage of Erbium Oxide and Sintered in Temperature of 500-1100C; Springer: Berlin/Heidelberg, Germany, 2019; pp. 13–27. [Google Scholar]
  23. Andreola, F.; Barbieri, L.; Lancellotti, I.; Leonelli, C.; Manfredini, T. Recycling of Industrial Wastes in Ceramic Manufacturing: State of Art and Glass Case Studies. Ceram. Int. 2016, 42, 13333–13338. [Google Scholar] [CrossRef]
  24. Zanelli, C.; Conte, S.; Molinari, C.; Soldati, R.; Dondi, M. Waste Recycling in Ceramic Tiles: A Technological Outlook. Resour. Conserv. Recycl. 2021, 168, 105289. [Google Scholar] [CrossRef]
  25. Drif, B.; Taha, Y.; Hakkou, R.; Benzaazoua, M. Integrated Valorization of Silver Mine Tailings through Silver Recovery and Ceramic Materials Production. Miner. Eng. 2021, 170, 107060. [Google Scholar] [CrossRef]
  26. da Silva, F.L.; Araújo, F.G.S.; Teixeira, M.P.; Gomes, R.C.; von Krüger, F.L. Study of the Recovery and Recycling of Tailings from the Concentration of Iron Ore for the Production of Ceramic. Ceram. Int. 2014, 40, 16085–16089. [Google Scholar] [CrossRef]
  27. Taha, Y.; Benzaazoua, M.; Hakkou, R.; Mansori, M. Coal Mine Wastes Recycling for Coal Recovery and Eco-Friendly Bricks Production. Miner. Eng. 2017, 107, 123–138. [Google Scholar] [CrossRef]
  28. Loutou, M.; Taha, Y.; Benzaazoua, M.; Daafi, Y.; Hakkou, R. Valorization of Clay By-Product from Moroccan Phosphate Mines for the Production of Fired Bricks. J. Clean. Prod. 2019, 229, 169–179. [Google Scholar] [CrossRef]
  29. Lemougna, P.N.; Yliniemi, J.; Ismailov, A.; Levanen, E.; Tanskanen, P.; Kinnunen, P.; Roning, J.; Illikainen, M. Recycling Lithium Mine Tailings in the Production of Low Temperature (700–900 °C) Ceramics: Effect of Ladle Slag and Sodium Compounds on the Processing and Final Properties. Constr. Build. Mater. 2019, 221, 332–344. [Google Scholar] [CrossRef]
  30. Liu, S.; Guan, X.; Zhang, S.; Xu, C.; Li, H.; Zhang, J. Sintering Red Mud Based Imitative Ceramic Bricks with CO2 Emissions below Zero. Mater. Lett. 2017, 191, 222–224. [Google Scholar] [CrossRef]
  31. Bernasconi, A.; Pellegrino, L.; Vergani, F.; Campanale, F.; Marian, N.M.; Galimberti, L.; Perotti, M.; Viti, C.; Capitani, G. Recycling Detoxified Cement Asbestos Slates in the Production of Ceramic Sanitary Wares. Ceram. Int. 2023, 49, 1836–1845. [Google Scholar] [CrossRef]
  32. Marian, N.M.; Perotti, M.; Indelicato, C.; Magrini, C.; Giorgetti, G.; Capitani, G.; Viti, C. From High-Volume Industrial Waste to New Ceramic Material: The Case of Red Gypsum Muds in the TiO2 Industry. Ceram. Int. 2023; in press. [Google Scholar] [CrossRef]
  33. Schindelin, J.; Arganda-Carreras, I.; Frise, E.; Kaynig, V.; Longair, M.; Pietzsch, T.; Preibisch, S.; Rueden, C.; Saalfeld, S.; Schmid, B.; et al. Fiji: An Open-Source Platform for Biological-Image Analysis. Nat. Methods 2012, 9, 676–682. [Google Scholar] [CrossRef] [Green Version]
  34. Arganda-Carreras, I.; Kaynig, V.; Rueden, C.; Eliceiri, K.W.; Schindelin, J.; Cardona, A.; Sebastian Seung, H. Trainable Weka Segmentation: A Machine Learning Tool for Microscopy Pixel Classification. Bioinformatics 2017, 33, 2424–2426. [Google Scholar] [CrossRef] [PubMed]
  35. Swainson, I.P.; Dove, M.T.; Schmahl, W.W.; Putnis, A. Neutron Powder Diffraction Study of the Åkermanite-Gehlenite Solid Solution Series. Phys. Chem. Miner. 1992, 19, 185–195. [Google Scholar] [CrossRef]
  36. Dondi, M.; Ercolani, G.; Fabbri, B.; Marsigli, M. Chemical Composition of Melilite Formed during the Firing of Carbonate-Rich and Iron-Containing Ceramic Bodies. J. Am. Ceram. Soc. 1999, 82, 465–468. [Google Scholar] [CrossRef]
  37. Rathossi, C.; Pontikes, Y. Effect of Firing Temperature and Atmosphere on Ceramics Made of NW Peloponnese Clay Sediments: Part II. Chemistry of Pyrometamorphic Minerals and Comparison with Ancient Ceramics. J. Eur. Ceram. Soc. 2010, 30, 1853–1866. [Google Scholar] [CrossRef]
  38. Backeberg, N.R.; Iacoviello, F.; Rittner, M.; Mitchell, T.M.; Jones, A.P.; Day, R.; Wheeler, J.; Shearing, P.R.; Vermeesch, P.; Striolo, A. Quantifying the Anisotropy and Tortuosity of Permeable Pathways in Clay-Rich Mudstones Using Models Based on X-ray Tomography. Sci. Rep. 2017, 7, 14838. [Google Scholar] [CrossRef] [Green Version]
  39. Cooper, S.J.; Bertei, A.; Shearing, P.R.; Kilner, J.A.; Brandon, N.P. TauFactor: An Open-Source Application for Calculating Tortuosity Factors from Tomographic Data. SoftwareX 2016, 5, 203–210. [Google Scholar] [CrossRef]
  40. Barry, T.I.; Cox, J.M.; Morrell, R. Cordierite Glass-Ceramics-Effect of TiO2 and ZrO2 Content on Phase Sequence during Heat Treatment. J. Mater. Sci. 1978, 13, 594–610. [Google Scholar] [CrossRef]
  41. Fernandes, H.R.; Tulyaganov, D.U.; Ferreira, J.M.F. The Role of P2O5, TiO2 and ZrO2 as Nucleating Agents on Microstructure and Crystallization Behaviour of Lithium Disilicate-Based Glass. J. Mater. Sci. 2013, 48, 765–773. [Google Scholar] [CrossRef]
  42. MacDowell, J.F. Microwave Heating of Nepheline Glass-Ceramics. Am. Ceram. Soc. Bull. 1984, 63, 282–286. [Google Scholar]
  43. Moo-Chin, W.; Nan-Chung, W.; Min-Hsiung, H. Preparation of Nepheline Glass-Ceramics and Their Application as Dental Porcelain. Mater. Chem. Phys. 1994, 37, 370–375. [Google Scholar] [CrossRef]
  44. Hamzawy, E.M.A.; El-Meliegy, E.A.M. Preparation of Nepheline Glass–Ceramics for Dental Applications. Mater. Chem. Phys. 2008, 112, 432–435. [Google Scholar] [CrossRef]
  45. Martín-Márquez, J.; Rincón, J.M.; Romero, M. Effect of Firing Temperature on Sintering of Porcelain Stoneware Tiles. Ceram. Int. 2008, 34, 1867–1873. [Google Scholar] [CrossRef] [Green Version]
  46. Fuertes, V.; Reinosa, J.J.; Fernández, J.F.; Enríquez, E. Engineered Feldspar-Based Ceramics: A Review of Their Potential in Ceramic Industry. J. Eur. Ceram. Soc. 2022, 42, 307–326. [Google Scholar] [CrossRef]
  47. Morimoto, N. Nomenclature of Pyroxenes. Mineral. Petrol. 1988, 39, 55–76. [Google Scholar] [CrossRef]
  48. Romero, M.; Martín, M.I.; Barbieri, L.; Andreola, F.; Lancellotti, I.; López-Delgado, A. Valorization of Al Slag in the Production of Green Ceramic Tiles: Effect of Experimental Conditions on Microstructure and Crystalline Phase Composition. J. Am. Ceram. Soc. 2021, 104, 776–784. [Google Scholar] [CrossRef]
  49. Taha, Y.; Benzaazoua, M.; Hakkou, R.; Mansori, M. Natural Clay Substitution by Calamine Processing Wastes to Manufacture Fired Bricks. J. Clean. Prod. 2016, 135, 847–858. [Google Scholar] [CrossRef]
  50. Zhang, Z.; Wang, J.; Liu, L.; Ma, J.; Shen, B. Preparation of Additive-Free Glass-Ceramics from MSW Incineration Bottom Ash and Coal Fly Ash. Constr. Build. Mater. 2020, 254, 119345. [Google Scholar] [CrossRef]
  51. Gao, H.T.; Liu, X.H.; Chen, J.Q.; Qi, J.L.; Wang, Y.B.; Ai, Z.R. Preparation of Glass-Ceramics with Low Density and High Strength Using Blast Furnace Slag, Glass Fiber and Water Glass. Ceram. Int. 2018, 44, 6044–6053. [Google Scholar] [CrossRef]
  52. Zhang, W.; He, F.; Xie, J.; Liu, X.; Fang, D.; Yang, H.; Luo, Z. Crystallization Mechanism and Properties of Glass Ceramics from Modified Molten Blast Furnace Slag. J. Non. Cryst. Solids 2018, 502, 164–171. [Google Scholar] [CrossRef]
  53. Ponsot, I.; Bernardo, E.; Bontempi, E.; Depero, L.; Detsch, R.; Chinnam, R.K.; Boccaccini, A.R. Recycling of Pre-Stabilized Municipal Waste Incinerator Fly Ash and Soda-Lime Glass into Sintered Glass-Ceramics. J. Clean. Prod. 2015, 89, 224–230. [Google Scholar] [CrossRef]
  54. Qin, J.; Cui, C.; Cui, X.; Hussain, A.; Yang, C.; Yang, S. Recycling of Lime Mud and Fly Ash for Fabrication of Anorthite Ceramic at Low Sintering Temperature. Ceram. Int. 2015, 41, 5648–5655. [Google Scholar] [CrossRef]
  55. Sutcu, M.; Alptekin, H.; Erdogmus, E.; Er, Y.; Gencel, O. Characteristics of Fired Clay Bricks with Waste Marble Powder Addition as Building Materials. Constr. Build. Mater. 2015, 82, 1–8. [Google Scholar] [CrossRef]
Figure 1. PM waste’s life cycle scheme.
Recycling 08 00035 g001
Figure 2. Diffractometric patterns of the investigated flotation mud FM (A) and related ceramic product CFM (B). Red arrows show peaks attributed to hercynite.
Recycling 08 00035 g002
Figure 3. SEM BSE images of the flotation mud waste. (A): General view of the untreated dried grains forming the waste. (BD): Enlarged details of single amorphous grains with conchoidal fracture. EDS analysis spots whose values are included in Table 2 are also shown.
Recycling 08 00035 g003
Figure 4. SEM images (BSE mode) of the CFM specimen, showing both microstructure and phase assemblage. (A): Large view. (B): Magnification of the area in (A) with distribution of pseudomorphic phases within an interconnected micro-porosity pattern. (C): Detail of aggregates unevenly composed of melilite, clinopyroxenes and nepheline. (D): Detail of an aggregate mainly composed of Fe-oxides and distribution of melilite, nepheline and also portions of silicate glass. (E): To the left, the same microstructure shown in (AC). To the right, an area with glass and elongated skeletal wollastonite micro-crystals (enlarged view in (F)). Abbreviations: Cpx = clinopyroxene; Mll = melilite; Nph = nepheline; Gl = glass; Fe-ox: Fe-oxides.
Recycling 08 00035 g004
Figure 5. Pore size distribution of CFM sample, computed in 2D from SEM images (left) and in 3D with local thickness algorithm of the sampled subvolume using micro-CT Versa scan (right).
Recycling 08 00035 g005
Figure 6. (A) Three-dimensional rendering of CFM sample obtained with Nikon micro-CT (voxel size 8.5 µm); (B) three-dimensional rendering of a subvolume of the sample shown in A taken from the edge, with a higher resolution (voxel size 1 µm) obtained with VERSA micro-CT scanner. Colors of pores represent local thickness computed areas with Fiji/ImageJ software (bar scale values are in µm). (C) Representative 3D section of the subvolume shown in (B) along with 2D slice (raw data in the center) and its segmented version (right).
Recycling 08 00035 g006
Figure 7. (A) CaO-SiO2-Al2O3 ternary diagram of analyzed mineral phases of CFM sample. (B) ACF ternary diagram of CFM sample. Additionally, shown in both diagrams are end-member compositions (black circles) of some typical ceramic minerals.
Recycling 08 00035 g007
Figure 8. Three-dimensional tortuosity factor analysis with TauFactor. (a) Schematic vision of the investigated 3D subvolume: the model calculates the connectivity of the cross section of each pore (white areas in the image) from the top image to the bottom along the tested axis and in the three mutually perpendicular directions. (b) Stacked 3D images of modelled interconnected pathways for each tested direction. The intensity of the color is proportional to the concentration of pathways.
Recycling 08 00035 g008
Table 1. XRF bulk data (expressed as oxides wt%) for the investigated flotation mud (FM) and related ceramic product (CFM); n.d. = not determined.
Na2OMgOAl2O3SiO2P2O5SO3ClK2OCaOTiO2Cr2O3MnOFe2O3NiO
FM1.992.8825.9530.310.390.420.790.2723.650.960.410.164.910.30
CFM3.334.0021.1235.430.650.630.010.6721.180.890.390.116.110.36
CuOZnOSrOZrO2SnO2Sb2O3BaOCeO2PbOWO3SeO2Y2O3LOITotal
FM0.300.190.122.570.27n.d.0.551.250.100.290.070.050.87100.00
CFM0.220.250.101.870.32n.d.0.431.200.070.27n.d.0.040.38100.00
Table 2. SEM-EDS chemical data (expressed as normalized oxides wt%) for the investigated flotation mud waste (FM). Analysis 1–4, 6 and 8 refer to homogeneous FM grains, whereas Analysis 5 and 7 refer to minor phases with higher BSE yield, which are, respectively, Ni sulphate and Fe oxide; n.d. = not determined.
FM
Wt% OxidesAn-1An-2An-3An-4An-5An-6An-7An-8
Cln.d.n.d.n.d.1.68n.d.n.d.n.d.0.88
Cun.d.n.d.n.d.n.d.8.31n.d.n.d.n.d.
Agn.d.n.d.n.d.n.d.2.15n.d.n.d.n.d.
MgO2.872.922.363.37n.d.2.530.593.21
Al2O320.6616.7814.6928.481.9720.364.6827.57
SiO245.5643.5635.5032.72n.d.44.006.6533.74
FeO8.546.5826.281.83n.d.9.8079.507.98
CaO11.2212.5812.5523.93n.d.12.183.7019.73
TiO2n.d.0.85n.d.0.73n.d.n.d.n.d.0.66
SO3n.d.0.59n.d.n.d.39.83n.d.n.d.n.d.
Na2O5.135.363.084.01n.d.3.800.622.62
MnOn.d.0.05n.d.n.d.n.d.n.d.0.91n.d.
Cr2O3n.d.0.01n.d.n.d.n.d.n.d.3.360.29
ZrO22.764.753.312.62n.d.2.91n.d.2.98
Ce2O3n.d.n.d.n.d.n.d.n.d.n.d.n.d.n.d.
K2O0.610.730.680.62n.d.0.63n.d.0.33
NiO2.632.381.54n.d.44.713.78n.d.n.d.
SnO2n.d.2.87n.d.n.d.3.03n.d.n.d.n.d.
V2O3n.d.0.00n.d.n.d.n.d.n.d.n.d.n.d.
Table 3. Representative EDS composition (wt%) of main mineralogical phases identified in sample CFM. Wo: wollastonite; Di: diopside; Cpx: clinopyroxene; Mll: melilite; Fe-Ox: iron oxide.; Ne: nepheline; FeO is expressed as total iron.
CFM
Wt% OxidesMll11Mll12Mll37Wo21Wo5Wo6Ne1Ne5Ne6Di9Cpx39Glass4Glass10Fe-ox8Fe-ox9Fe-ox40
SiO240.9537.8135.6048.5453.9154.4341.8439.9640.0257.2938.5772.9274.392.284.240.61
TiO2----------1.13-----
Al2O315.5815.7816.154.10- 34.2834.5035.541.2529.117.177.811.823.321.57
Cr2O3--------------0.63-
FeO8.028.997.29-- 0.790.680.70-1.88--94.0586.1396.17
MnO--------------0.57-
MgO4.455.036.440.41-0.73---18.062.242.181.92-1.700.86
CaO20.3923.0425.0243.7046.0944.843.876.014.9322.6022.293.153.031.853.410.79
BaO1.511.191.42-------------
Na2O4.552.162.141.05--15.0114.5114.370.813.097.766.22---
K2O1.921.670.512.20--4.214.344.44-0.296.826.63---
NiO--1.43-------------
SO3----------0.72-----
ZrO22.644.334.00-------------
Table 4. Results of tests of the uniaxial compressive strength (top), flexural strength (centercnter) and micro-Deval wear resistance (bottom) carried out on specimens derived from CFM sample.
Sample Point Load (kN)Compressive Strength (MPa)
A150.055.3
B190.073.9
C140.053.2
D140.053.3
E190.073.4
F180.067.3
Avg Compressive strength (MPa)62.73
SamplePoint load (kN)Flexural strength (MPa)
A3000.09.1
C3840.011.1
Avg Flexural strength (MPa)10.1
SampleGrain size classMicro-Deval Abrasive charge (g)Result
Aggregate11.2/16.05400 ± 5MDE = 24
Table 5. Main characteristics of some ceramic materials obtained from recycling of different kinds of waste (modified after [50]).
Waste Raw Materials Additives Sintering Conditions Crystalline Phases Compressive Strength (MPa)Flexural Strength (MPa) Ref
Flotation mudsAluminum silicates of Ca, Mg and Fe, amorphous silica, Na-silicates, B2O3, Na2O, SnO2, ZnO 1000 °C for 30 min Diopside, Anorthite, Nepheline + minor Wollastonite, Melilite 53.2–73.4 10.1This work
Silver mine tailingsClay, barium carbonate BaCO3, water 900 °C, 950 °C, 1000 °C, 1050 °C for 3 h --4.9–18.6 [25]
Municipal solid waste incineration bottom and coal fly ashesFree of additives 850–950 °C for 3 hAnorthite, Diopside 122.76–299.09 2.48–2.61[50]
Blast furnace slag, glass fiber, water glassTiO2, ZrO2 and CaF2 Crystallized at 780 °C for 90 min, nucleated at 920 °C for 90 minÅkermannite, TiO2, Diopside, Perovskite, Melilite, Al3Mg2, Al3Ti, Anorthite, Labradorite, Augite 12–68-[51]
Blast furnace slagChemical reagents, such as CaO, Sb2O3, etc960 °C, 975 °C, 990 °CÅkermannite, Augite, Diopside, Gehlenite-26–89[52]
(1) Calamine mine processing tailings (CMPT) and (2) treated calamine mine process tailings (TCMPT)Free of additives, just water (1) and (2) 950 °C, 1000 °C, 1050 °C for 3 h(1) and (2) Anhydrite, Magnetite, Augite, Gehlenite, Hematite, Quartz (in different proportions) -1) 4,6–23,3 2) 3,1[49]
Municipal solid waste incineration fly ashPure kaolin clay, soda-lime glass, water800–1100 °C for 30 minWollastonite, Anorthite, Albite, Cristobalite-38.2 ± 5[53]
Lime mud and fly ashFree of additives900 °C, 1000 °C, 1050 °C, 1100 °C, 1150 °C, 1200 °C, 1250 °C for 2 h Anorthite, Gehlenite, Wollastonite0.43–14.83-[54]
Waste marble powderBrick clay, Waste marble powder (CaCO3)950 °C, 1050 °C for 2 hQuartz, Hematite, Anorthite, Gehlenite, Wollastonite, Calcium Silicate6.2–34.2-[55]
Disclaimer/Publisher’s Note: The statements, opinions and data contained in all publications are solely those of the individual author(s) and contributor(s) and not of MDPI and/or the editor(s). MDPI and/or the editor(s) disclaim responsibility for any injury to people or property resulting from any ideas, methods, instructions or products referred to in the content.

