
Identifying Optimal Precursors for Geopolymer Composite Mix Design for Different Regional Settings: A Multi-Objective Optimization Study
 , , , and
Abstract
:1. Introduction
2. Results—Obtain the Optimized Set of Mix Designs
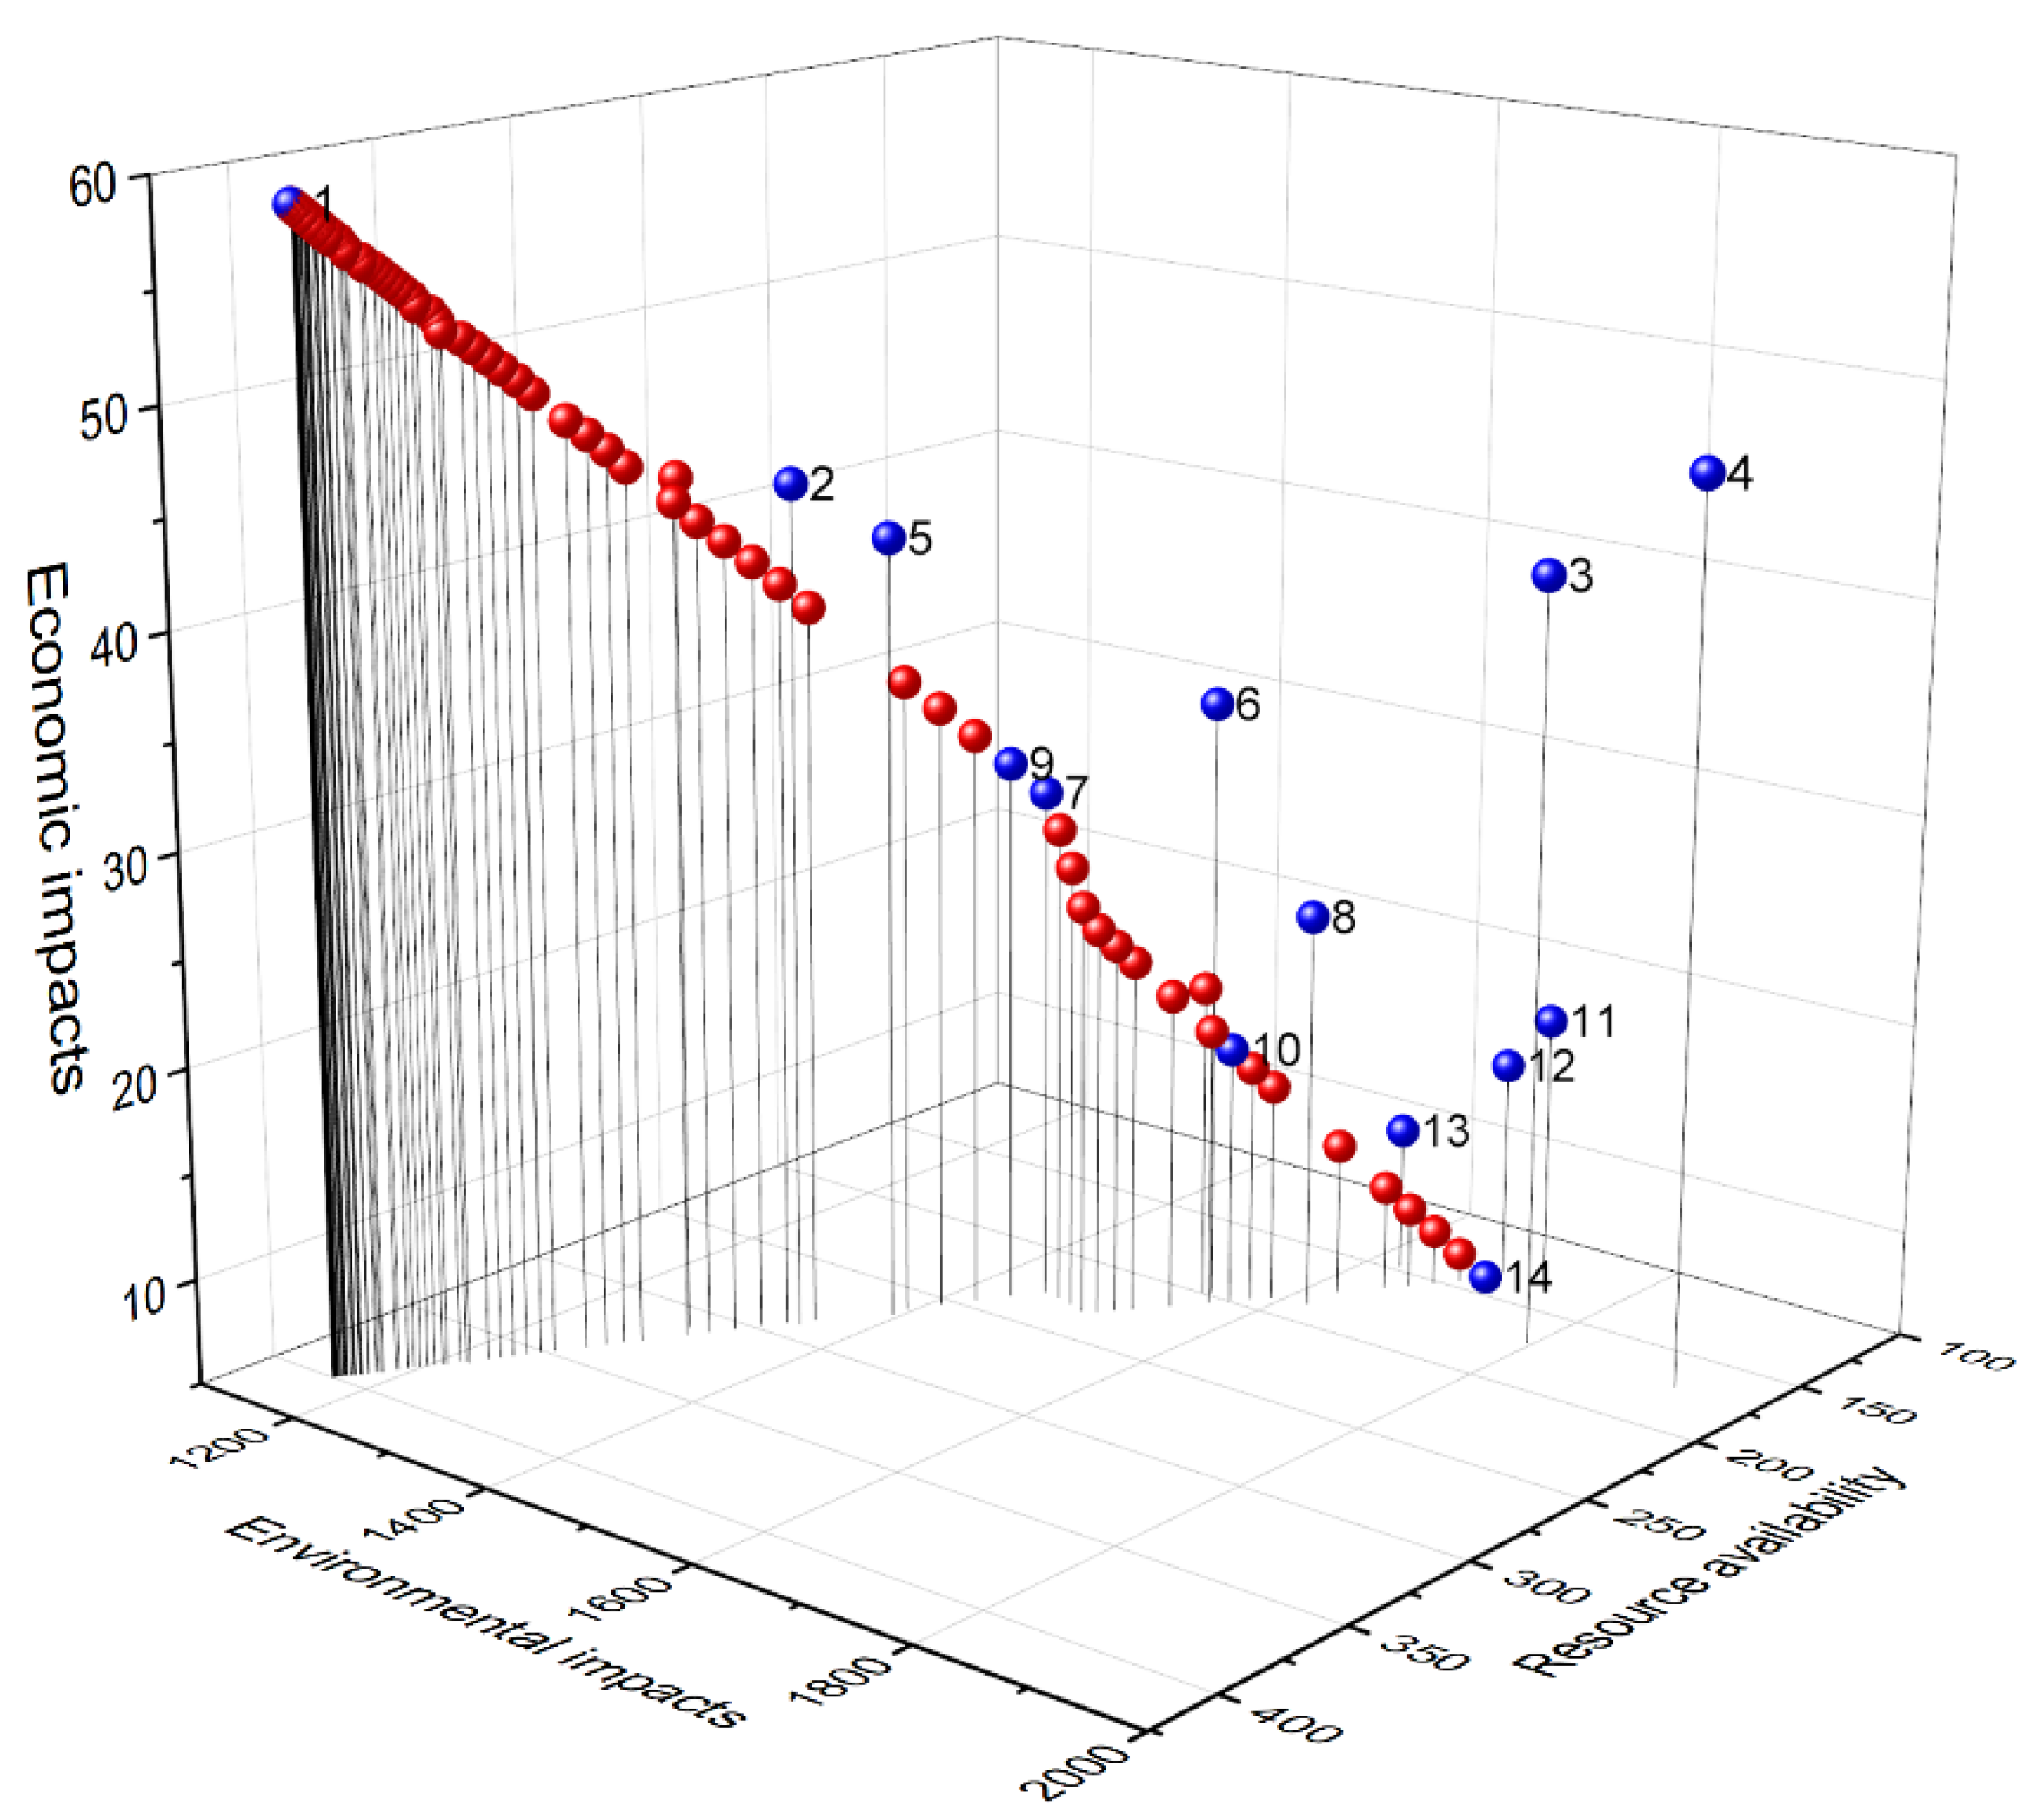
2.1. Optimal Mixes in Belgium
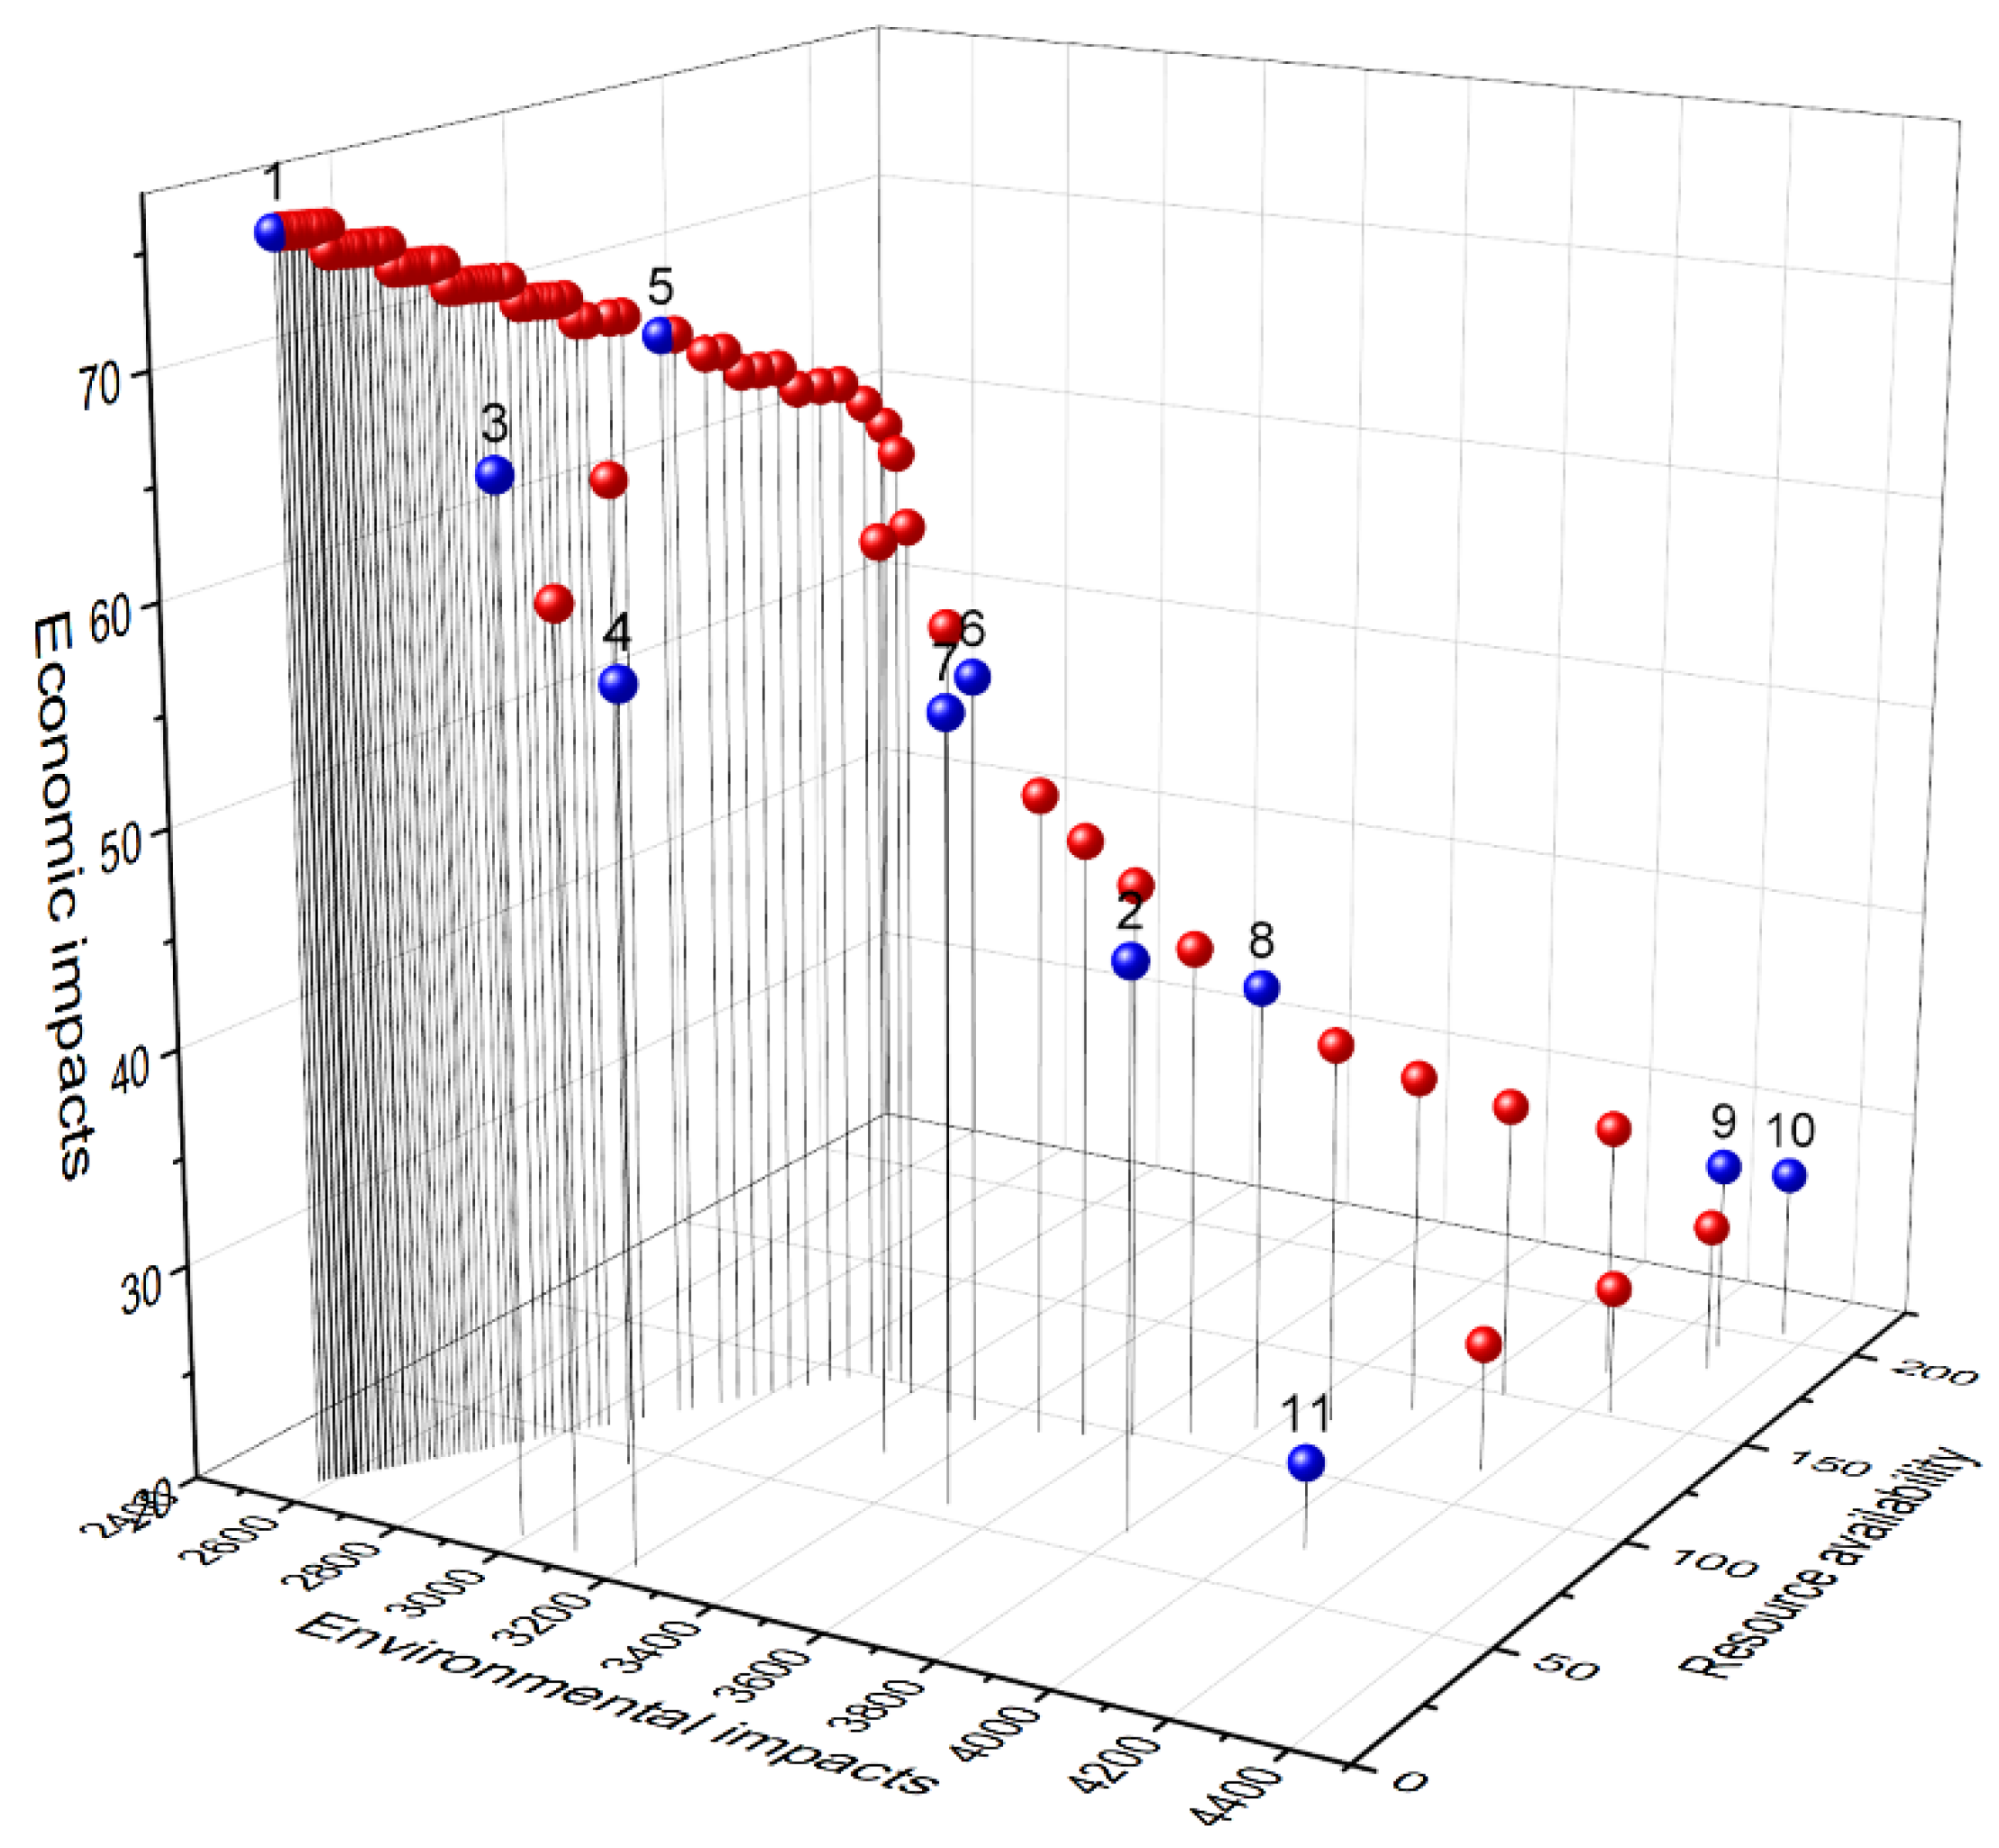
2.2. Optimal Mixes in Finland
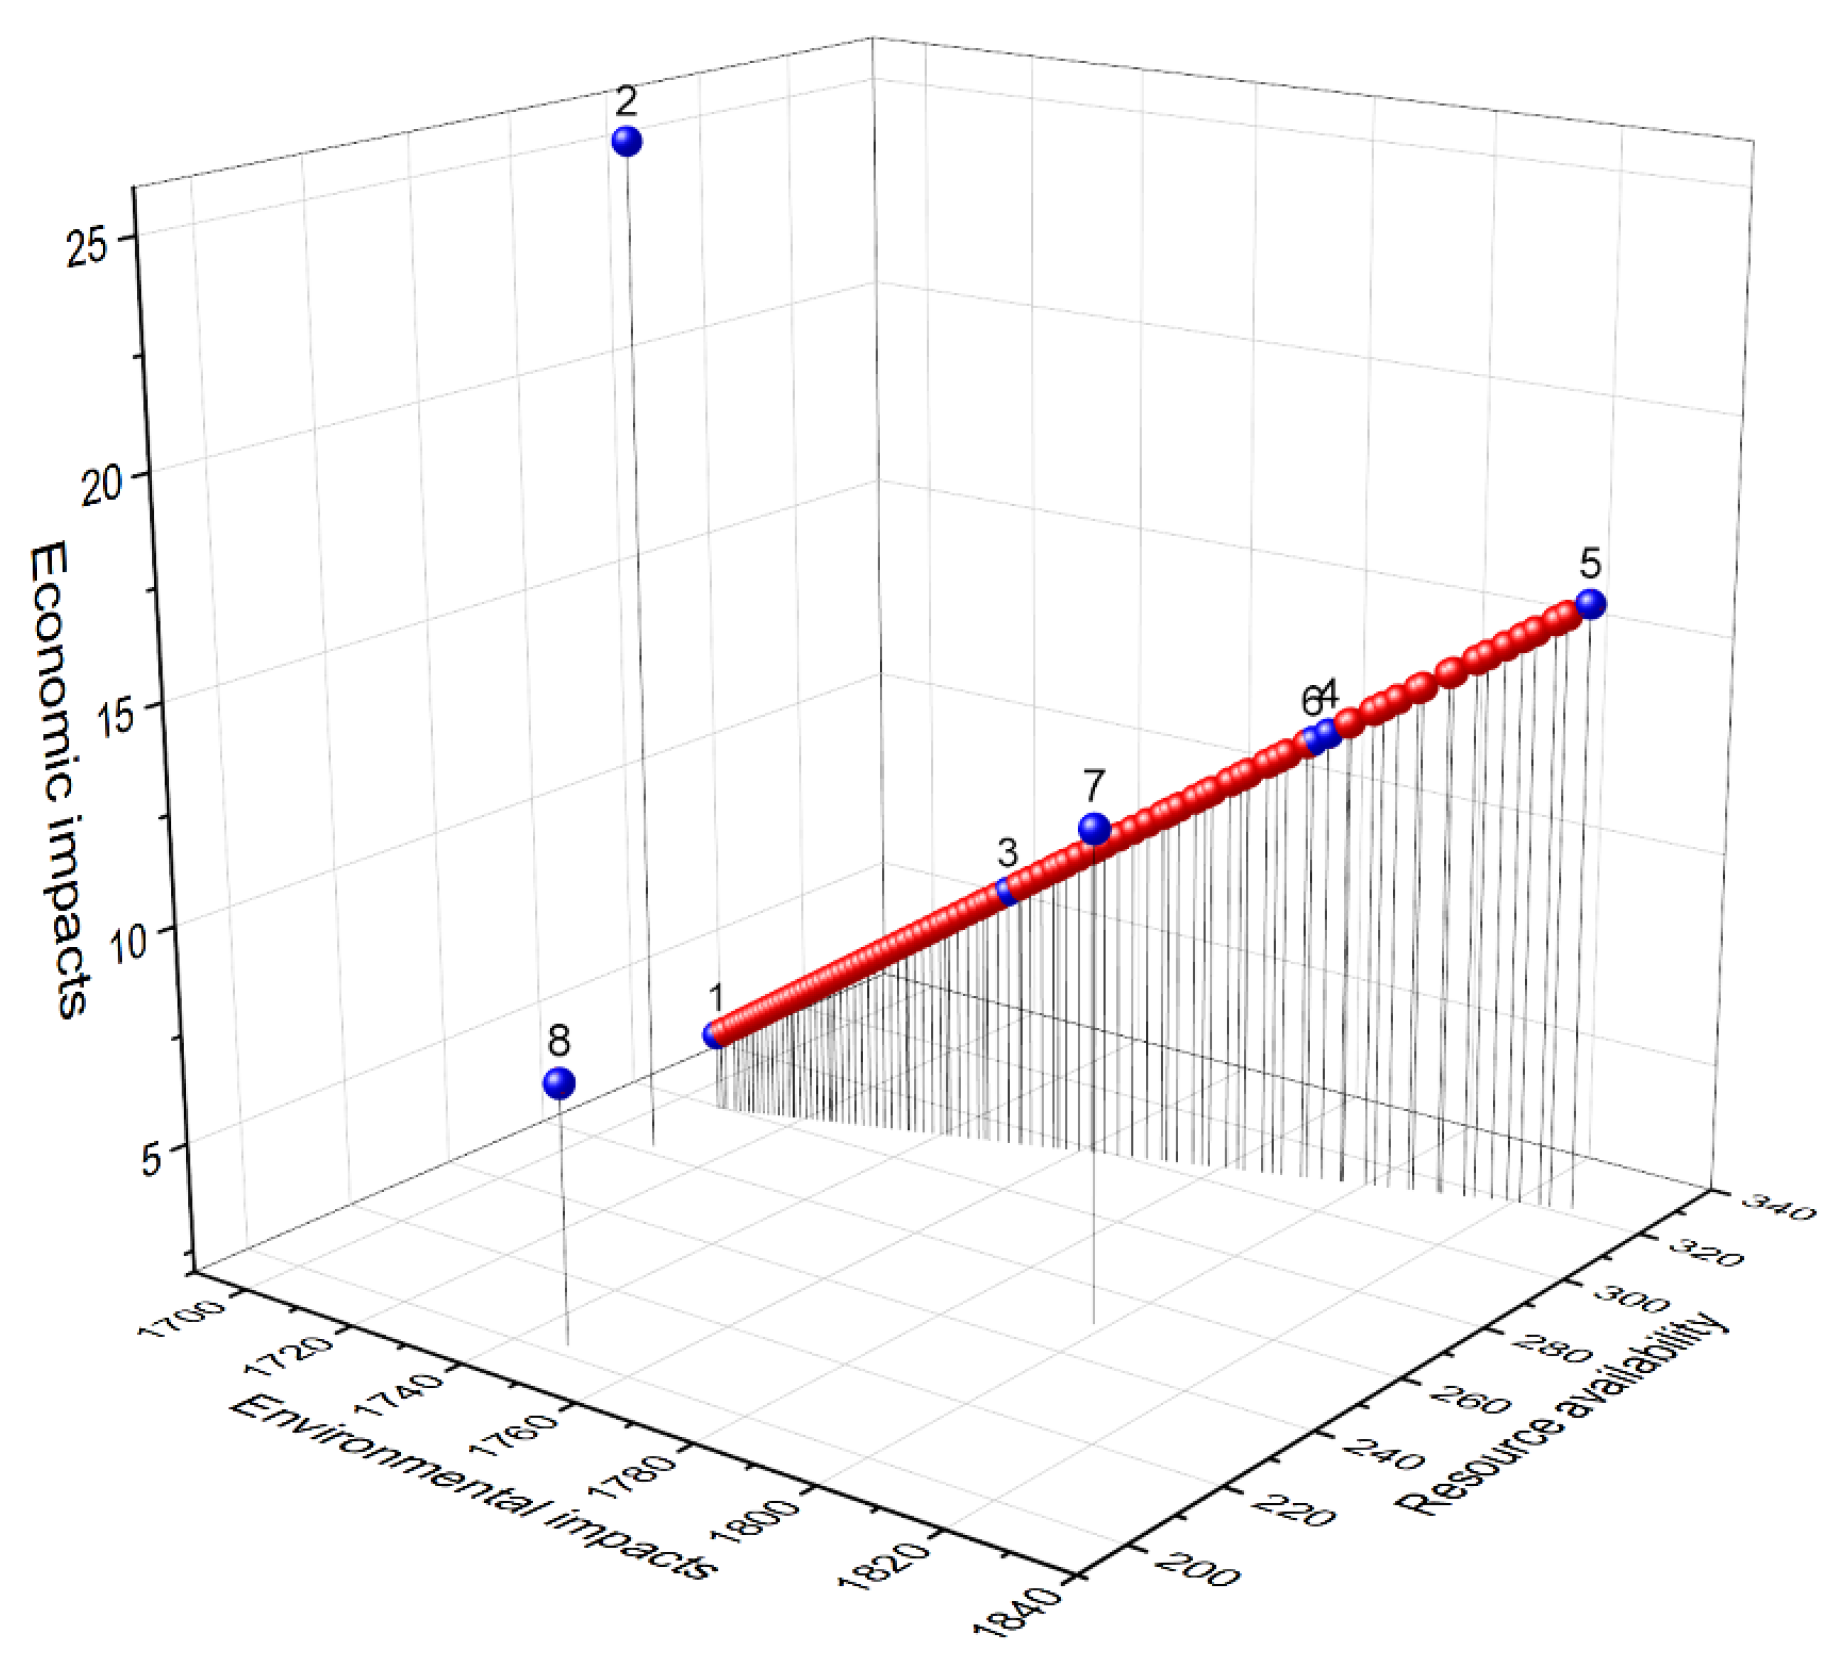
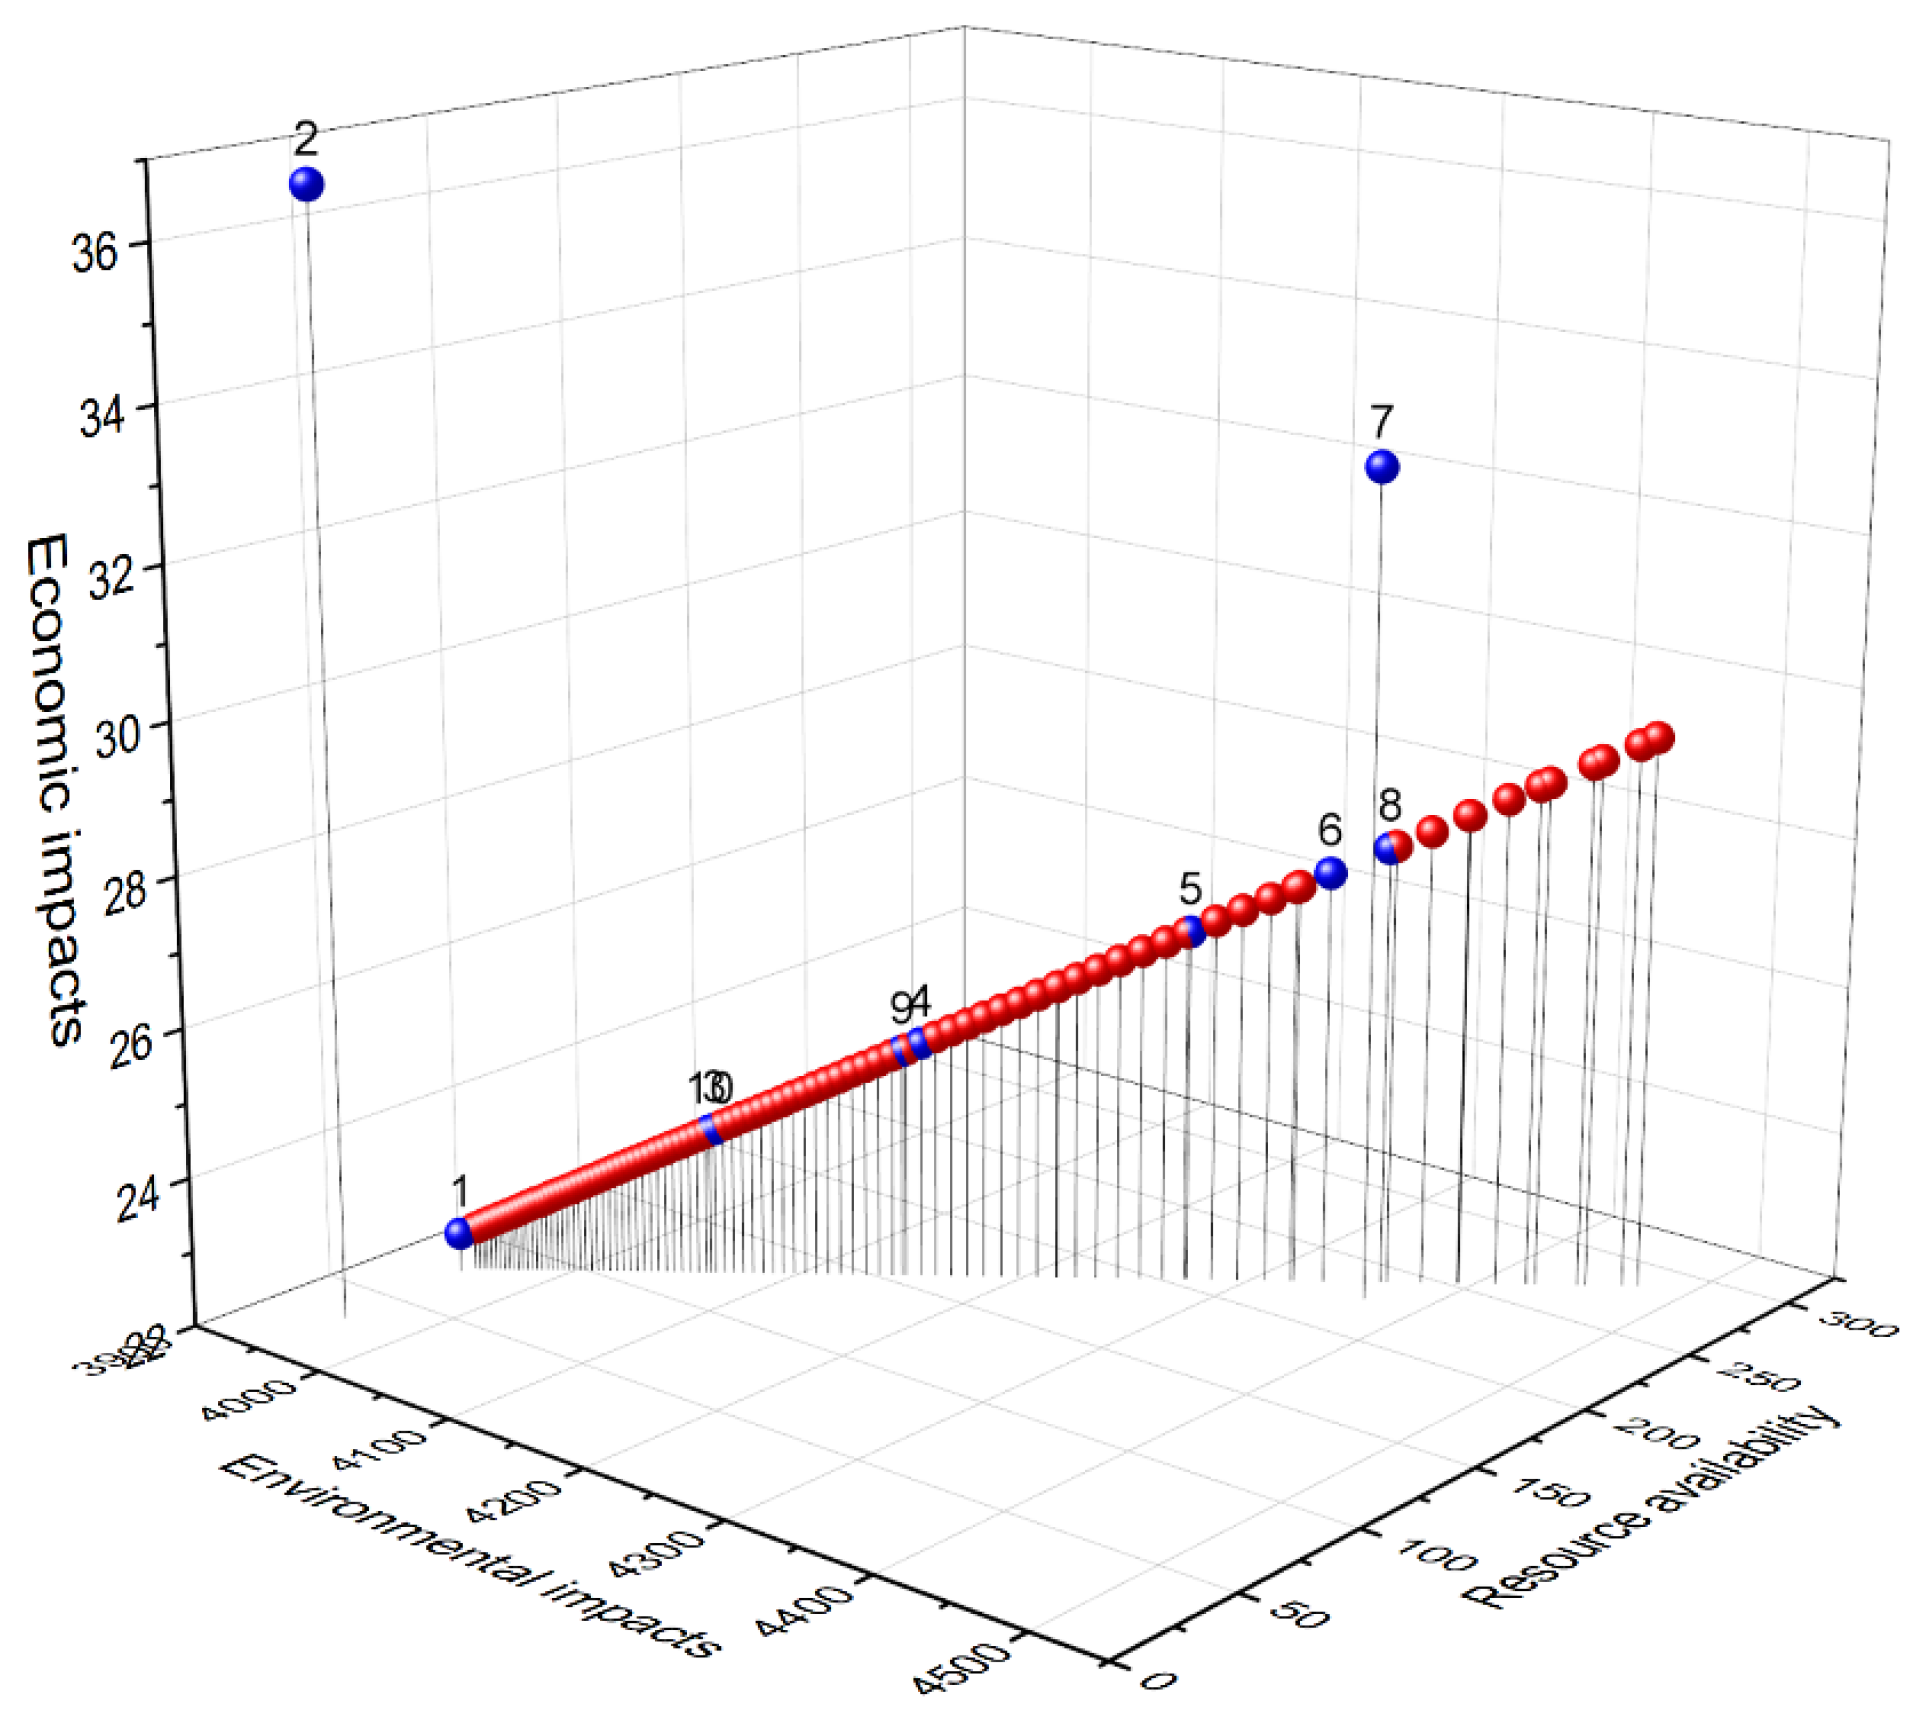
2.3. Scenario Analysis
2.4. Predicted Compressive Strength
3. Verification through Literature Studies
4. Discussion
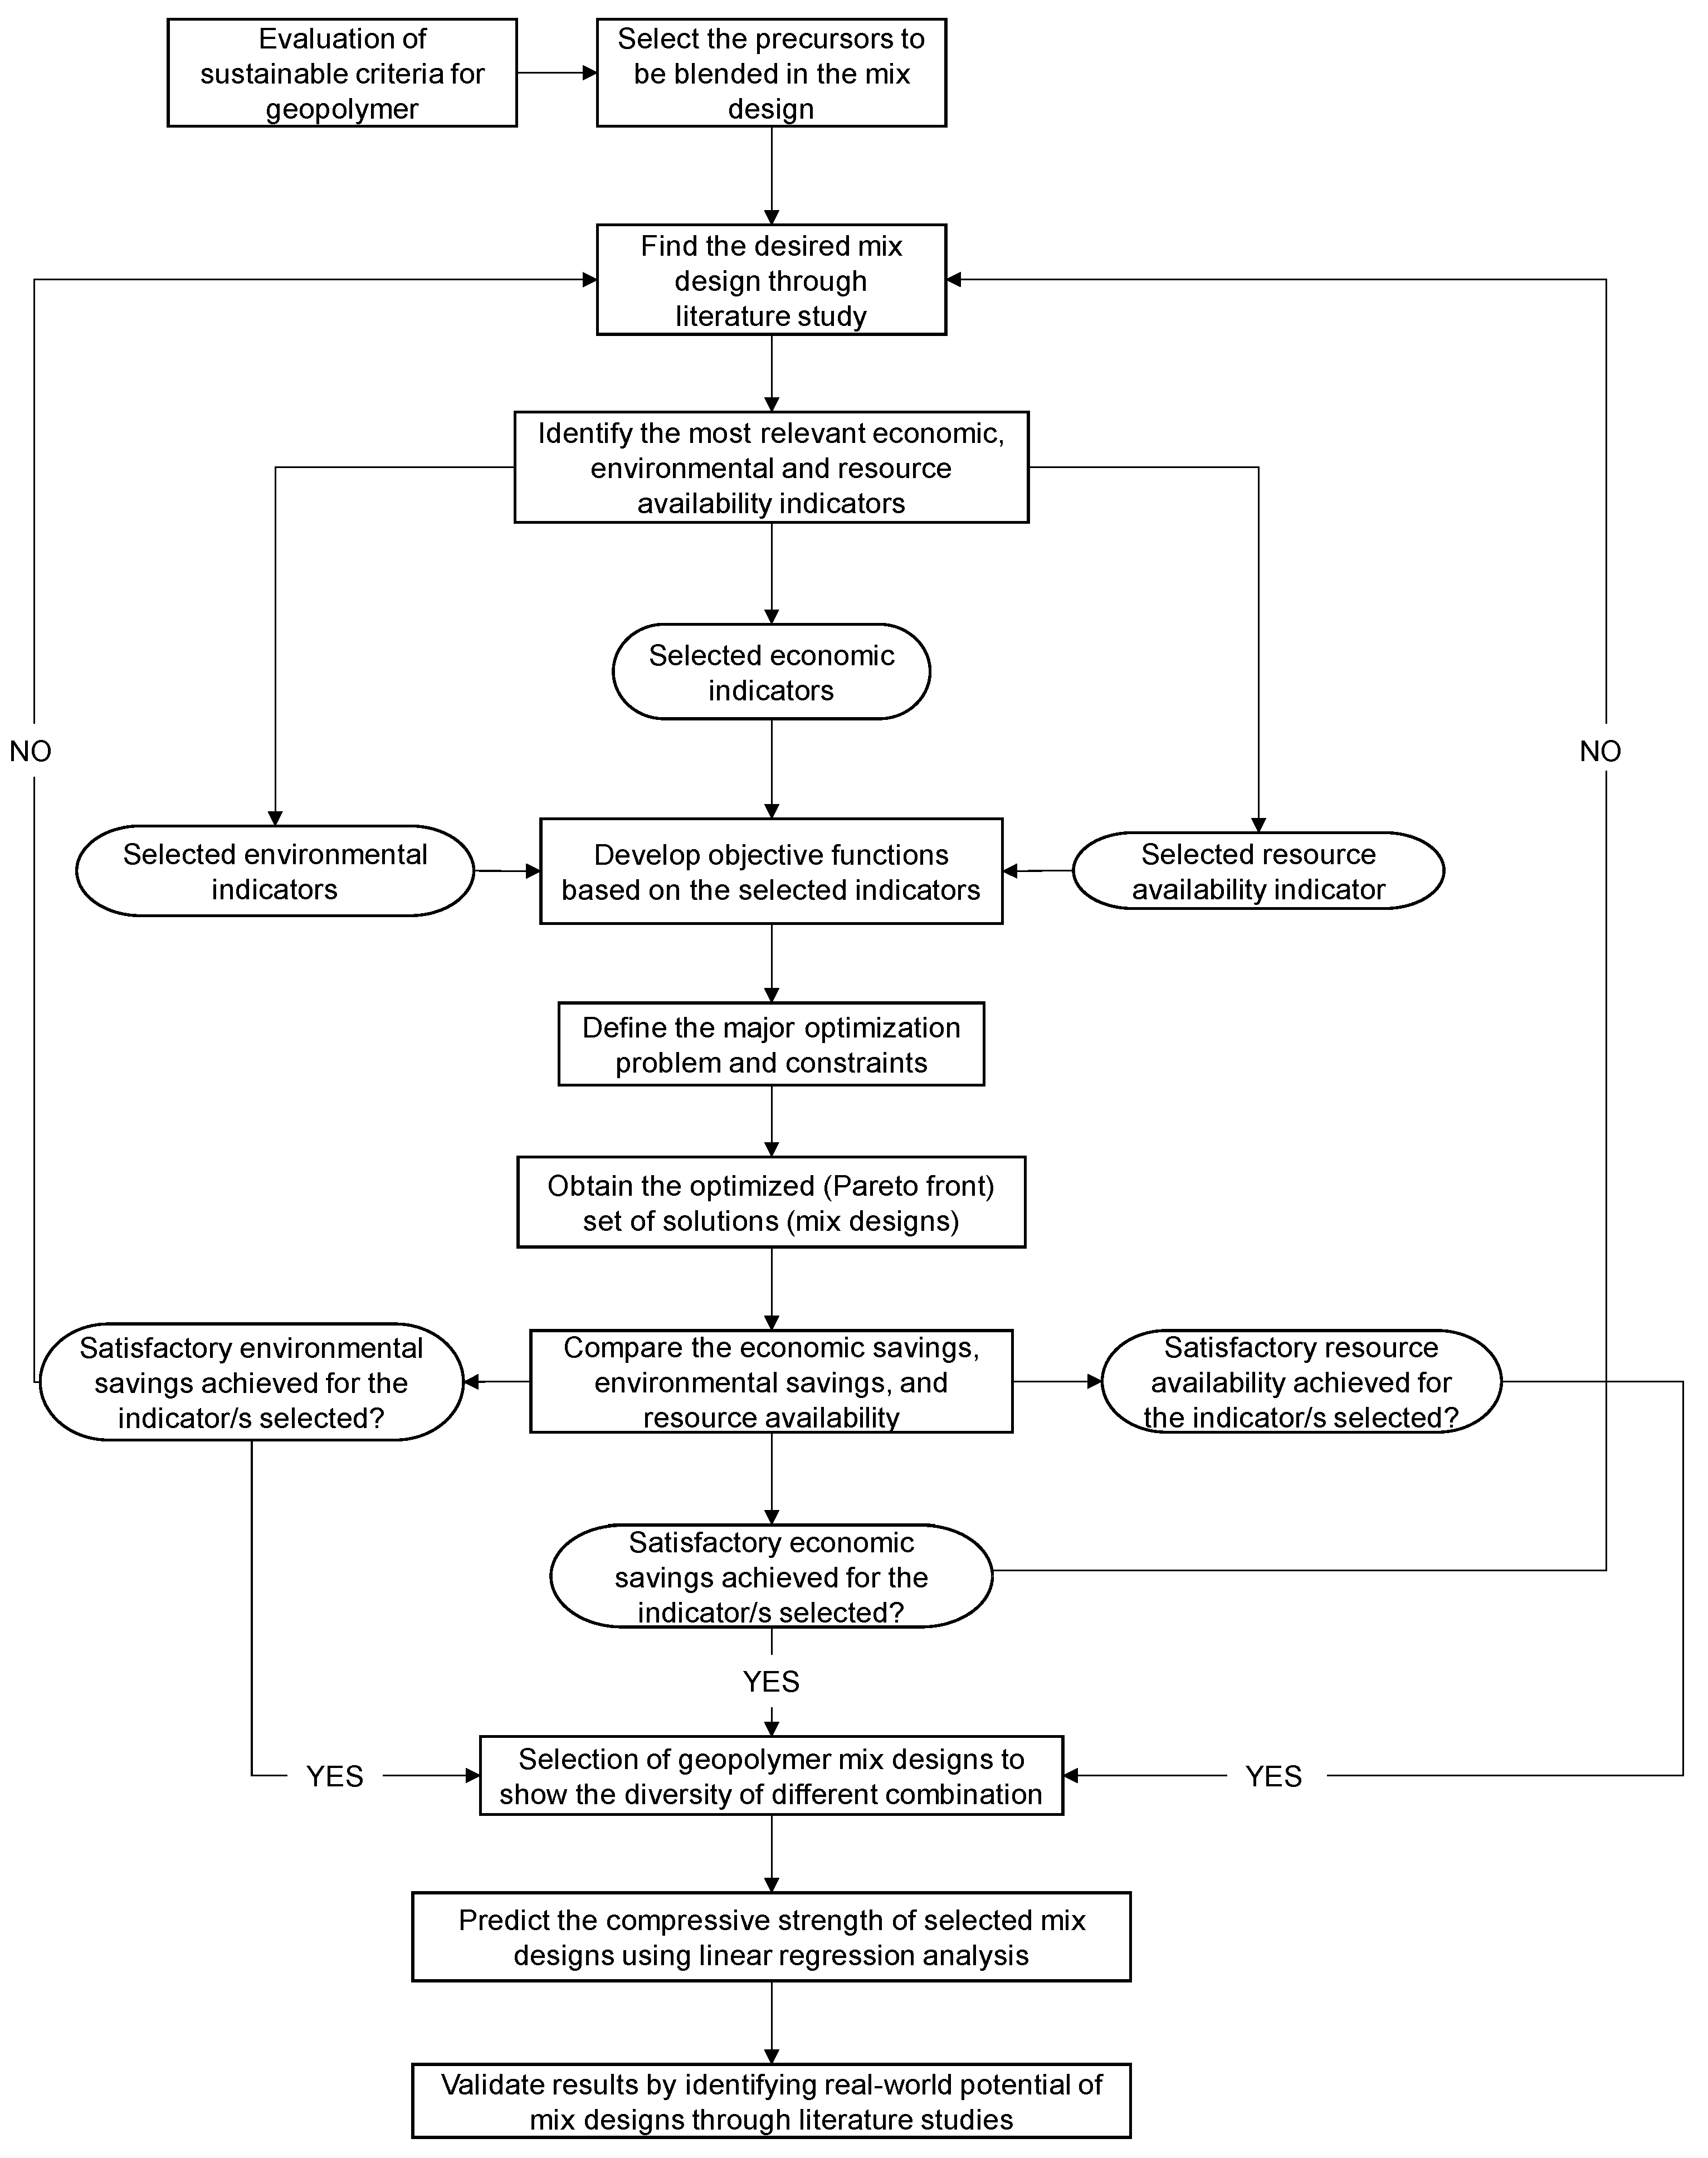
5. Methodology
5.1. Precursors Selection for Blended Mix Design (Evaluation of Precursors for Geopolymer Potential)
5.2. Find the Desired Mix Design through Literature Studies
5.3. Identify the Most Relevant Economic, Environmental, and Social Indicators
5.4. Define Objective Functions Based on the Selected Indicators
5.4.1. Objective Functions
5.4.2. Constraints
5.4.3. Weights
5.4.4. Prediction of Compressive Strength
6. Conclusions
- ○
- 50% CFA, 25%, MSWI BA and 25% sewage sludge ash—Belgium
- ○
- 19% CFA, 27%, mine tailings and 45% MSWI BA—Finland
- ○
- 87% MSWI BA and 13% steel slag—Belgium
- ○
- 25% mine tailings and 75% MSWI BA—Finland
Supplementary Materials
Author Contributions
Funding
Data Availability Statement
Conflicts of Interest
References
- Heath, A.; Paine, K.; McManus, M. Minimising the global warming potential of clay based geopolymers. J. Clean. Prod. 2014, 78, 75–83. [Google Scholar] [CrossRef] [Green Version]
- IEA. Cement—Analysis—IEA [WWW Document]. 2022. Available online: https://www.iea.org/reports/cement (accessed on 15 February 2023).
- Abdulkareem, M.; Havukainen, J.; Nuortila-Jokinen, J.; Horttanainen, M. Environmental and economic perspective of waste-derived activators on alkali-activated mortars. J. Clean. Prod. 2021, 280, 124651. [Google Scholar] [CrossRef]
- Luukkonen, T.; Abdollahnejad, Z.; Yliniemi, J.; Kinnunen, P.; Illikainen, M. One-part alkali-activated materials: A review. Cem. Concr. Res. 2018, 103, 21–34. [Google Scholar] [CrossRef]
- Habert, G.; D’Espinose De Lacaillerie, J.B.; Roussel, N. An environmental evaluation of geopolymer based concrete production: Reviewing current research trends. J. Clean. Prod. 2011, 19, 1229–1238. [Google Scholar] [CrossRef]
- Mehta, A.; Siddique, R. An overview of geopolymers derived from industrial by-products. Constr. Build. Mater. 2016, 127, 183–198. [Google Scholar] [CrossRef]
- Xu, L.Y.; Huang, B.T.; Lao, J.C.; Yao, J.; Li, V.C.; Dai, J.G. Tensile over-saturated cracking of Ultra-High-Strength Engineered Cementitious Composites (UHS-ECC) with artificial geopolymer aggregates. Cem. Concr. Compos. 2023, 136, 104896. [Google Scholar] [CrossRef]
- El Alouani, M.; Saufi, H.; Moutaoukil, G.; Alehyen, S.; Nematollahi, B.; Belmaghraoui, W.; Taibi, M. Application of geopolymers for treatment of water contaminated with organic and inorganic pollutants: State-of-the-art review. J. Environ. Chem. Eng. 2021, 9, 105095. [Google Scholar] [CrossRef]
- Hossain, M.U.; Wang, L.; Chen, L.; Tsang, D.C.W.; Ng, S.T.; Poon, C.S.; Mechtcherine, V. Evaluating the environmental impacts of stabilization and solidification technologies for managing hazardous wastes through life cycle assessment: A case study of Hong Kong. Environ. Int. 2020, 145, 106139. [Google Scholar] [CrossRef]
- Frattini, D.; Occhicone, A.; Ferone, C.; Cioffi, R. Fibre-reinforced geopolymer concretes for sensible heat thermal energy storage: Simulations and environmental impact. Materials 2021, 14, 414. [Google Scholar] [CrossRef]
- Ren, X.; Zhang, L.; Ramey, D.; Waterman, B.; Ormsby, S. Utilization of aluminum sludge (AS) to enhance mine tailings-based geopolymer. J. Mater. Sci. 2015, 50, 1370–1381. [Google Scholar] [CrossRef]
- Niu, H.; Abdulkareem, M.; Sreenivasan, H.; Kantola, A.M.; Havukainen, J.; Horttanainen, M.; Telkki, V.V.; Kinnunen, P.; Illikainen, M. Recycling mica and carbonate-rich mine tailings in alkali-activated composites: A synergy with metakaolin. Miner. Eng. 2020, 157, 106535. [Google Scholar] [CrossRef]
- Abdulkareem, M.; Havukainen, J.; Horttanainen, M. How environmentally sustainable are fibre reinforced alkali-activated concretes? J. Clean. Prod. 2019, 236, 117601. [Google Scholar] [CrossRef]
- Eurostat. Coal Production and Consumption Statistics. 2021; ISSN 2443-8219. Available online: https://ec.europa.eu/eurostat/statistics-explained/index.php?title=Coal_production_and_consumption_statistics#Consumption_and_production_of_hard_coal (accessed on 5 April 2021).
- Euroslag. Iron and Steel Mining Slags (Ferrous Slags) Statistics 2018 [WWW Document]. 2019. Available online: https://www.euroslag.com/products/statistics/statistics-2018/ (accessed on 5 April 2021).
- Abdulkareem, M.; Havukainen, J.; Nuortila-Jokinen, J.; Horttanainen, M. Life cycle assessment of a low-height noise barrier for railway traffic noise. J. Clean. Prod. 2021, 323, 129169. [Google Scholar] [CrossRef]
- Komkova, A.; Habert, G. Environmental impact assessment of alkali-activated materials: Examining impacts of variability in constituent production processes and transportation. Constr. Build. Mater. 2023, 363, 129032. [Google Scholar] [CrossRef]
- Euromines. Production by Mineral|Euromines [WWW Document]. 2019. Available online: http://www.euromines.org/mining-europe/production-mineral#Kaolin (accessed on 5 April 2021).
- Luo, Y.; Wu, Y.; Ma, S.; Zheng, S.; Zhang, Y.; Chu, P.K. Utilization of coal fly ash in China: A mini-review on challenges and future directions. Environ. Sci. Pollut. Res. 2021, 28, 18727–18740. [Google Scholar] [CrossRef]
- Ren, B.; Zhao, Y.; Bai, H.; Kang, S.; Zhang, T.; Song, S. Eco-friendly geopolymer prepared from solid wastes: A critical review. Chemosphere 2021, 267, 128900. [Google Scholar] [CrossRef]
- Küçük, M.E.; Kinnarinen, T.; Timonen, J.; Mulari, O.; Häkkinen, A. Characterisation of Industrial Side Streams and Their Application for the Production of Geopolymer Composites. Minerals 2021, 11, 593. [Google Scholar] [CrossRef]
- Istuque, D.B.; Soriano, L.; Akasaki, J.L.; Melges, J.L.P.; Borrachero, M.V.; Monzó, J.; Payá, J.; Tashima, M.M. Effect of sewage sludge ash on mechanical and microstructural properties of geopolymers based on metakaolin. Constr. Build. Mater. 2019, 203, 95–103. [Google Scholar] [CrossRef]
- Sitarz, M.; Zdeb, T.; Gomes, J.C.; Soares, E.G.; Hager, I. The immobilisation of heavy metals from sewage sludge ash in geopolymer mortars. MATEC Web Conf. 2020, 322, 01026. [Google Scholar] [CrossRef]
- Huang, G.; Ji, Y.; Zhang, L.; Li, J.; Hou, Z. Advances in understanding and analyzing the anti-diffusion behavior in complete carbonation zone of MSWI bottom ash-based alkali-activated concrete. Constr. Build. Mater. 2018, 186, 1072–1081. [Google Scholar] [CrossRef]
- Huang, G.; Ji, Y.; Li, J.; Hou, Z.; Jin, C. Use of slaked lime and Portland cement to improve the resistance of MSWI bottom ash-GBFS geopolymer concrete against carbonation. Constr. Build. Mater. 2018, 166, 290–300. [Google Scholar] [CrossRef]
- Guo, X.; Pan, X. Effects of Steel Slag on Mechanical Properties and Mechanism of Fly Ash–Based Geopolymer. J. Mater. Civ. Eng. 2019, 32, 04019348. [Google Scholar] [CrossRef]
- Hafez, H.; Kassim, D.; Kurda, R.; Silva, R.V.; de Brito, J. Assessing the sustainability potential of alkali-activated concrete from electric arc furnace slag using the ECO2 framework. Constr. Build. Mater. 2021, 281, 122559. [Google Scholar] [CrossRef]
- El-Naggar, M.R.; El-Dessouky, M.I. Re-use of waste glass in improving properties of metakaolin-based geopolymers: Mechanical and microstructure examinations. Constr. Build. Mater. 2017, 132, 543–555. [Google Scholar] [CrossRef]
- Sethi, H.; Bansal, P.P.; Sharma, R. Effect of Addition of GGBS and Glass Powder on the Properties of Geopolymer Concrete. Iran. J. Sci. Technol. Trans. Civ. Eng. 2019, 43, 607–617. [Google Scholar] [CrossRef]
- Zhang, L.; Yue, Y. Influence of waste glass powder usage on the properties of alkali-activated slag mortars based on response surface methodology. Constr. Build. Mater. 2018, 181, 527–534. [Google Scholar] [CrossRef]
- Sandanayake, M.; Gunasekara, C.; Law, D.; Zhang, G.; Setunge, S.; Wanijuru, D. Sustainable criterion selection framework for green building materials—An optimisation based study of fly-ash Geopolymer concrete. Sustain. Mater. Technol. 2020, 25, e00178. [Google Scholar] [CrossRef]
- Shobeiri, V.; Bennett, B.; Xie, T.; Visintin, P. A generic framework for augmented concrete mix design: Optimisation of geopolymer concrete considering environmental, financial and mechanical properties. J. Clean. Prod. 2022, 369, 133382. [Google Scholar] [CrossRef]
- Marinković, S.; Dragaš, J.; Ignjatović, I.; Tošić, N. Environmental Assessment of Green Concretes for Structural Use. J. Clean. Prod. 2017, 154, 633–649. [Google Scholar] [CrossRef] [Green Version]
- Krishna, R.S.; Shaikh, F.; Mishra, J.; Lazorenko, G.; Kasprzhitskii, A. Mine Tailings-Based Geopolymers: Properties, Applications and Industrial Prospects. Ceram. Int. 2021, 47, 17826–17843. [Google Scholar] [CrossRef]
- Wongsa, A.; Boonserm, K.; Waisurasingha, C.; Sata, V.; Chindaprasirt, P. Use of Municipal Solid Waste Incinerator (MSWI) Bottom Ash in High Calcium Fly Ash Geopolymer Matrix. J. Clean. Prod. 2017, 148, 49–59. [Google Scholar] [CrossRef]
- Krausova, K.; Cheng, T.W.; Gautron, L.; Dai, Y.S.; Borenstajn, S. Heat Treatment on Fly and Bottom Ash Based Geopolymers: Effect on the Immobilization of Lead and Cadmium. Int. J. Environ. Sci. Dev. 2012, 3, 350–353. [Google Scholar] [CrossRef]
- Kastiukas, G.; Zhou, X.; Asce, M.; Castro-Gomes, J. Preparation Conditions for the Synthesis of Alkali-Activated Binders Using Tungsten Mining Waste. J. Mater. Civ. Eng. 2017, 29, 04017181. [Google Scholar] [CrossRef]
- Adesanya, E.; Ohenoja, K.; Kinnunen, P.; Illikainen, M. Alkali Activation of Ladle Slag from Steel-Making Process. J. Sustain. Metall. 2017, 3, 300–310. [Google Scholar] [CrossRef]
- Scarlat, N.; Fahl, F.; Dallemand, J.F. Status and Opportunities for Energy Recovery from Municipal Solid Waste in Europe. Waste Biomass Valorization 2019, 10, 2425–2444. [Google Scholar] [CrossRef] [Green Version]
- Hardjito, D.; Rangan, B.V. Development and Properties of Low-Calcium Fly Ash-Based Geopolymer Concrete, Research Report GC. Curtin University of Technology 2005. Research Report, 94. Available online: https://www.geopolymer.org/wp-content/uploads/curtin-flyash-GP-concrete-report.pdf (accessed on 27 April 2018).
- UNDP. Sustainable Development Goals [WWW Document]. 2018. Available online: http://www.undp.org/content/undp/en/home/sustainable-development-goals.html (accessed on 27 April 2018).
- Akadiri, P.O.; Olomolaiye, P.O.; Chinyio, E.A. Multi-criteria evaluation model for the selection of sustainable materials for building projects. Autom. Constr. 2013, 30, 113–125. [Google Scholar] [CrossRef]
- Passuello, A.; Rodríguez, E.D.; Hirt, E.; Longhi, M.; Bernal, S.A.; Provis, J.L.; Kirchheim, A.P. Evaluation of the potential improvement in the environmental footprint of geopolymers using waste-derived activators. J. Clean. Prod. 2017, 166, 680–689. [Google Scholar] [CrossRef]
- Teh, S.H.; Wiedmann, T.; Castel, A.; de Burgh, J. Hybrid life cycle assessment of greenhouse gas emissions from cement, concrete and geopolymer concrete in Australia. J. Clean. Prod. 2017, 152, 312–320. [Google Scholar] [CrossRef] [Green Version]
- Weil, M.; Dombrowski, K.; Buchwald, A. Life-cycle analysis of geopolymers. In Geopolymers: Structures, Processing, Properties and Industrial Applications; Elsevier: Amsterdam, The Netherlands, 2009; pp. 194–210. [Google Scholar] [CrossRef]
- Khoshnava, S.M.; Rostami, R.; Valipour, A.; Ismail, M.; Rahmat, A.R. Rank of green building material criteria based on the three pillars of sustainability using the hybrid multi criteria decision making method. J. Clean. Prod. 2018, 173, 82–99. [Google Scholar] [CrossRef]
- Van der Meulen, S.; Grijspaardt, T.; Mars, W.; van der Geest, W.; Roest-Crollius, A.; Kiel, J. Cost Figures for Freight Transport—Final report, Research to Progress. Panteia. 2020. Available online: https://www.kimnet.nl/binaries/kimnet/documenten/formulieren/2020/05/26/cost-figures-for-freight-transport/Cost+figures+for+freight+transport+-+final+report.pdf (accessed on 27 April 2018).
- Albidah, A.; Alghannam, M.; Abbas, H.; Almusallam, T.; Al-Salloum, Y. Characteristics of metakaolin-based geopolymer concrete for different mix design parameters. J. Mater. Res. Technol. 2021, 10, 84–98. [Google Scholar] [CrossRef]
- Bellum, R.R.; Muniraj, K.; Madduru, S.R.C. Investigation on modulus of elasticity of fly ash-ground granulated blast furnace slag blended geopolymer concrete. Mater. Today Proc. 2020, 27, 718–723. [Google Scholar] [CrossRef]
- Marathe, S.; Mithanthaya, I.R.; Shenoy, R.Y. Durability and microstructure studies on Slag-Fly Ash-Glass powder based alkali activated pavement quality concrete mixes. Constr. Build. Mater. 2021, 287, 123047. [Google Scholar] [CrossRef]
- Sarker, P.K.; Haque, R.; Ramgolam, K.V. Fracture behaviour of heat cured fly ash based geopolymer concrete. Mater. Des. 2013, 44, 580–586. [Google Scholar] [CrossRef]
- Fatec. Utilizing Material Side Streams in Manufacturing of for Example Concrete, Mortars, and Cementitious Materials. Fatec Oy, 2020. Available online: https://fatec.fi/ (accessed on 12 May 2021).
- Marceau, M.; Van Geem, M.G. Life Cycle Inventory of Slag Cement Manufacturing Process CTL Project No. 312012, 2003. In Proceedings of the Eighth CANMET/ACI International Conference on Fly Ash, Silica Fume, Slag and Natural Pozzolans in Concrete, Las Vegas, NV, USA, 23–29 May 2004; American Concrete Institute Farmington Hills: Farmington Hills, MI, USA, 2004; pp. 1–26. Available online: https://www.ecocem.ie/wp-content/uploads/2016/08/ECL009_Life_Cycle_Inventory_of_GGBS_Cement_Concrete.pdf (accessed on 29 January 2023).
- De Bakker, J. Energy Use of Fine Grinding in Mineral Processing. Met. Mater. Trans. E 2014, 1, 8–19. [Google Scholar] [CrossRef] [Green Version]
- Vinai, R.; Soutsos, M. Production of sodium silicate powder from waste glass cullet for alkali activation of alternative binders. Cem. Concr. Res. 2018, 116, 45–56. [Google Scholar] [CrossRef] [Green Version]
- Torelli, D. Use of Waste Material in AAM Concrete: Application in Circular Economy, ETH Zurich. 2020. Available online: https://sc.ibi.ethz.ch/en/education/stundent-theses/master-projects/abgeschlossene-masterprojektarbeiten1.html (accessed on 29 January 2023).
- Eurostat, Statistics|Electricity Prices for Non-Household Consumers—Bi-Annual Data (from 2007 onwards). 2022. Available online: https://ec.europa.eu/eurostat/databrowser/view/nrg_pc_205/default/table?lang=en (accessed on 14 April 2022).
- Abdollahnejad, Z.; Pacheco-Torgal, F.; Félix, T.; Tahri, W.; Aguiar, J.B. Mix design, properties and cost analysis of fly ash-based geopolymer foam. Constr. Build. Mater. 2015, 80, 18–30. [Google Scholar] [CrossRef] [Green Version]
- Chen, C.; Habert, G.; Bouzidi, Y.; Jullien, A.; Ventura, A. LCA allocation procedure used as an incitative method for waste recycling: An application to mineral additions in concrete. Resour. Conserv. Recycl. 2010, 54, 1231–1240. [Google Scholar] [CrossRef] [Green Version]
- NLK, Ecosmart Concrete Project: Metakaolin Pre-Feasibility Study, Report EA2860, Vancouver, British Columbia. 2002. Available online: http://ecosmartconcrete.com/docs/trnlkmk02.pdf (accessed on 29 January 2023).
- Van Oss, H.G. SLAG-IRON AND STEEL, Semantic Scholar. 2002. Available online: https://www.semanticscholar.org/paper/SLAG%E2%80%94IRON-AND-STEEL-Oss/061992ba0485caa0719e49377d8a6bdf3c380e9a (accessed on 29 January 2023).
- Eurostat, Recycling—Secondary Material Price Indicator. 2021, pp. 1–10. Available online: https://ec.europa.eu/eurostat/statistics-explained/index.php?title=Recycling_%E2%80%93_secondary_material_price_indicator (accessed on 29 January 2023).
- European Commission—Taxation and Customs Union, Taxes in Europe Database, v.3. 2017. Available online: https://ec.europa.eu/taxation_customs/tedb/taxDetails.html?id=252/1577833200 (accessed on 14 April 2022).
- Kijlstra. Aanvullende Prijslijst. 2019. Available online: https://www.betonmortelnederland.nl/Portals/0/Documenten/Aanvullende tarieven - 2019.pdf (accessed on 14 April 2022).
- CEWEP. CEWEP—The Confederation of European Waste-to-Energy Plants. 2021. Available online: https://www.cewep.eu/wp-content/uploads/2017/12/Landfill-taxes-and-bans-overview.pdf (accessed on 14 April 2022).
- Belgium Ecotax Rates. General tax-Base Specific Tax-Base Tax Rate Euro Levy on Energy Tax. 2009. Available online: https://foes.de/pdf/Belgium%20Ecotax%20Rates.pdf (accessed on 14 April 2022).
- LUKE, Biomass Atlas. 2017. Available online: https://biomassa-atlas.luke.fi/?lang=en (accessed on 26 April 2021).
- Suopajärvi, H.; Haapala, A. SMARCTIC WP4—Zero-Waste Integrates of Metallurgical Industry and Bioeconomy. 2014. Available online: https://www.researchgate.net/publication/318275778_SMARCTIC_WP4_-_Zero-waste_integrates_of_metallurgical_industry_and_bioeconomy (accessed on 14 April 2022).
- Niemelin, T.; Autiola, M.; Jyrävä, H.; Lindroos, N.; Kulmala, A.; Österbacka, J.; Helaakoski, M. UTILISATION OF BY-PRODUCTS AND ALTERNATIVE CONSTRUCTION MATERIALS IN NEW MINE CONSTRUCTION. 2020. Available online: https://projektit.ramboll.fi/life/upacmic/matsku/deliverables/Other_deliverables/WASCON2018_UPACMIC_extended_abstract_2-5-2018.pdf (accessed on 14 April 2022).
- Havukainen, J.; Nguyen, M.T.; Hermann, L.; Horttanainen, M.; Mikkilä, M.; Deviatkin, I.; Linnanen, L. Potential of phosphorus recovery from sewage sludge and manure ash by thermochemical treatment. Waste Manag. 2016, 49, 221–229. [Google Scholar] [CrossRef]
- Suomen Erityisjäte Oy, MSWI Bottom Ash as a Part of National Decree: Reducing Environmental Permit Requirements|Suomen Erityisjäte Oy. 2021. Available online: https://www.erityisjate.fi/research-and-future/innovations-and-technologies/mswi-bottom-ash-as-a-part-of-national-decree-/ (accessed on 14 April 2022).
- Eurostat. Generation of Waste by Waste Category, Hazardousness and NACE Rev. 2 Activity. 2022. Available online: http://appsso.eurostat.ec.europa.eu/nui/submitViewTableAction.do (accessed on 14 April 2022).
- Eurofer. Map of EU Steel Production Sites. 2021. Available online: https://www.eurofer.eu/assets/Uploads/Slide1.PNG (accessed on 14 April 2022).
- Eurostat. Statistics|Sewage Sludge Production and Disposal from Urban Wastewater (in Dry Substance (d.s)). 2022. Available online: https://ec.europa.eu/eurostat/databrowser/view/ten00030/default/table?lang=en (accessed on 14 April 2022).
- Joseph, A.M.; Snellings, R.; Heede, P.V.D.; Matthys, S.; De Belie, N. The Use of Municipal Solid Waste Incineration Ash in Various Building Materials: A Belgian Point of View. Materials 2018, 11, 141. [Google Scholar] [CrossRef] [Green Version]
- Statbel. Packaging Waste. Génération de Déchets D’emballages (Tonnes). 2020. Available online: https://statbel.fgov.be/en/themes/environment/waste-and-pollution/packaging-waste#figures (accessed on 14 April 2022).


| Mix Number | CFA | GBFS | Mine Tailings | MSWI BA | Glass Waste | Steel Slag | Sewage Sludge Ash | Total | Predicted Fc |
|---|---|---|---|---|---|---|---|---|---|
| kg/m3 | kg/m3 | kg/m3 | kg/m3 | kg/m3 | kg/m3 | kg/m3 | kg/m3 | MPa | |
| 1 | 400 | 0 | 0 | 0 | 0 | 0 | 0 | 400 | 31 |
| 2 | 260 | 0 | 0 | 47 | 47 | 0 | 47 | 400 | 38 |
| 3 | 85 | 17 | 38 | 68 | 68 | 57 | 68 | 400 | 51 |
| 4 | 70 | 39 | 48 | 62 | 62 | 57 | 62 | 400 | 52 |
| 5 | 230 | 0 | 0 | 58 | 57 | 0 | 55 | 400 | 39 |
| 6 | 132 | 0 | 0 | 82 | 80 | 27 | 80 | 400 | 46 |
| 7 | 188 | 0 | 0 | 108 | 0 | 0 | 104 | 400 | 42 |
| 8 | 105 | 0 | 0 | 140 | 0 | 67 | 87 | 400 | 49 |
| 9 | 199 | 0 | 0 | 101 | 0 | 0 | 100 | 400 | 41 |
| 10 | 100 | 0 | 0 | 300 | 0 | 0 | 0 | 400 | 45 |
| 11 | 33 | 0 | 0 | 137 | 31 | 63 | 136 | 400 | 55 |
| 12 | 46 | 0 | 0 | 155 | 0 | 61 | 138 | 400 | 53 |
| 13 | 59 | 0 | 0 | 255 | 0 | 0 | 86 | 400 | 48 |
| 14 | 10 | 0 | 0 | 390 | 0 | 0 | 0 | 400 | 50 |
| Mix Number | CFA | GBFS | Mine Tailings | MSWI BA | Glass Waste | Steel Slag | Sewage Sludge Ash | Total | Predicted Fc |
|---|---|---|---|---|---|---|---|---|---|
| (kg/m3) | (kg/m3) | (kg/m3) | (kg/m3) | (kg/m3) | (kg/m3) | (kg/m3) | (kg/m3) | (MPa) | |
| 1 | 400 | 0 | 0 | 0 | 0 | 0 | 0 | 400 | 31 |
| 2 | 102 | 0 | 55 | 69 | 59 | 47 | 68 | 400 | 48 |
| 3 | 281 | 0 | 0 | 65 | 54 | 0 | 0 | 400 | 36 |
| 4 | 216 | 0 | 0 | 62 | 60 | 0 | 62 | 400 | 40 |
| 5 | 340 | 0 | 60 | 0 | 0 | 0 | 0 | 400 | 33 |
| 6 | 224 | 0 | 84 | 92 | 0 | 0 | 0 | 400 | 38 |
| 7 | 162 | 0 | 51 | 40 | 82 | 0 | 65 | 400 | 43 |
| 8 | 114 | 0 | 106 | 179 | 0 | 0 | 0 | 399 | 44 |
| 9 | 14 | 0 | 186 | 200 | 0 | 0 | 0 | 400 | 50 |
| 10 | 0 | 0 | 199 | 201 | 0 | 0 | 0 | 400 | 50 |
| 11 | 0 | 0 | 64 | 336 | 0 | 0 | 0 | 400 | 50 |
| Mix Number | Mine Tailings | MSWI BA | Glass Waste | Steel Slag | Sewage Sludge Ash | Total | Predicted Fc |
|---|---|---|---|---|---|---|---|
| kg/m3 | kg/m3 | kg/m3 | kg/m3 | kg/m3 | kg/m3 | MPa | |
| 1 | 0 | 399 | 0 | 1 | 0 | 400 | 50 |
| 2 | 0 | 217 | 180 | 3 | 0 | 400 | 53 |
| 3 | 0 | 349 | 0 | 51 | 0 | 400 | 53 |
| 4 | 0 | 298 | 0 | 102 | 0 | 400 | 56 |
| 5 | 0 | 258 | 0 | 142 | 0 | 400 | 58 |
| 6 | 0 | 300 | 0 | 100 | 0 | 400 | 56 |
| 7 | 0 | 192 | 0 | 108 | 101 | 400 | 59 |
| 8 | 0 | 204 | 0 | 48 | 148 | 400 | 56 |
| Mix Number | Mine Tailings | MSWI BA | Glass Waste | Steel Slag | Sewage Sludge Ash | Total | Predicted FC |
|---|---|---|---|---|---|---|---|
| kg/m3 | kg/m3 | kg/m3 | kg/m3 | kg/m3 | kg/m3 | MPa | |
| 1 | 1 | 385 | 0 | 0 | 14 | 400 | 51 |
| 2 | 0 | 156 | 113 | 0 | 131 | 400 | 55 |
| 3 | 55 | 345 | 0 | 0 | 0 | 400 | 50 |
| 4 | 100 | 300 | 0 | 0 | 0 | 400 | 50 |
| 5 | 157 | 243 | 0 | 0 | 0 | 400 | 50 |
| 6 | 187 | 213 | 0 | 0 | 0 | 400 | 50 |
| 7 | 203 | 114 | 40 | 0 | 42 | 399 | 51 |
| 8 | 200 | 200 | 0 | 0 | 0 | 400 | 50 |
| 9 | 96 | 304 | 0 | 0 | 0 | 400 | 50 |
| 10 | 54 | 346 | 0 | 0 | 0 | 400 | 50 |
| Fly Ash | GBFS | Mine Tailings | Sewage Sludge Ash | MSWI BA | Glass Waste | Steel Slag | Fc (28 Days) | Reference |
|---|---|---|---|---|---|---|---|---|
| X | 41 | [33] | ||||||
| X | X | 42–49 | [34] | |||||
| X | X | 46–53 | [35] | |||||
| X | X | X | NA | [36] | ||||
| X | X | 110 | [23] | |||||
| X | X | X | 25 | [21] | ||||
| X | X | 40 | [37] | |||||
| X | X | 38–54 | [30] | |||||
| X | X | X | 27 | [29] | ||||
| X | 65 | [38] | ||||||
| X | X | 35–40 | [26] |
| Coal Fly Ash (kg/m3) | Sodium Silicate Solution (kg/m3) | Sodium Hydroxide Powder (kg/m3) | Sand (kg/m3) | Gravel (kg/m3) | Water (kg/m3) | Density (kg/m3) | MPa (28 Days) |
|---|---|---|---|---|---|---|---|
| 408 | 103 | 21 | 554 | 1294 | 16.5 | 2340 | 42 |
| Indicator | Unit Measured | Normalized |
|---|---|---|
| Environmental indicators | ||
| Production emissions | Weighted env. Emissions (CML 2001–January 2016)/kg | Europe |
| Pre-treatment emissions | Weighted env. Emissions (CML 2001–January 2016)/kg | Europe |
| Transportation emissions | Weighted env. Emissions (CML 2001–January 2016)/kg | Europe |
| Social indicators | ||
| Resource availability (local) | Ton/year | Min-max |
| Economic indicators | ||
| Procurement cost | Euro/kg | - |
| Pre-treatment cost | Euro/kg | - |
| Transportation cost | Euro/kg/km | - |
| Avoided landfill cost | Euro/kg | - |
Disclaimer/Publisher’s Note: The statements, opinions and data contained in all publications are solely those of the individual author(s) and contributor(s) and not of MDPI and/or the editor(s). MDPI and/or the editor(s) disclaim responsibility for any injury to people or property resulting from any ideas, methods, instructions or products referred to in the content. |
© 2023 by the authors. Licensee MDPI, Basel, Switzerland. This article is an open access article distributed under the terms and conditions of the Creative Commons Attribution (CC BY) license (https://creativecommons.org/licenses/by/4.0/).
Share and Cite
Abdulkareem, M.; Komkova, A.; Havukainen, J.; Habert, G.; Horttanainen, M. Identifying Optimal Precursors for Geopolymer Composite Mix Design for Different Regional Settings: A Multi-Objective Optimization Study. Recycling 2023, 8, 32. https://doi.org/10.3390/recycling8020032
Abdulkareem M, Komkova A, Havukainen J, Habert G, Horttanainen M. Identifying Optimal Precursors for Geopolymer Composite Mix Design for Different Regional Settings: A Multi-Objective Optimization Study. Recycling. 2023; 8(2):32. https://doi.org/10.3390/recycling8020032
Chicago/Turabian StyleAbdulkareem, Mariam, Anastasija Komkova, Jouni Havukainen, Guillaume Habert, and Mika Horttanainen. 2023. "Identifying Optimal Precursors for Geopolymer Composite Mix Design for Different Regional Settings: A Multi-Objective Optimization Study" Recycling 8, no. 2: 32. https://doi.org/10.3390/recycling8020032