Article

Enhancing Lithium-Ion Battery Manufacturing Efficiency: A Comparative Analysis Using DEA Malmquist and Epsilon-Based Measures

1
Department of Industrial Engineering and Management, National Kaohsiung University of Science and Technology, Kaohsiung 80778, Taiwan
2
Thu Dau Mot University, Binh Duong 75000, Vietnam
3
Industrial University of Ho Chi Minh City, Nguyen Van Bao Street, Ward 4, Go Vap District, Ho Chi Minh City 70000, Vietnam
*
Authors to whom correspondence should be addressed.
Batteries 2023, 9(6), 317; https://doi.org/10.3390/batteries9060317
Submission received: 25 April 2023 / Revised: 30 May 2023 / Accepted: 5 June 2023 / Published: 6 June 2023
(This article belongs to the Special Issue Machine Learning for Advanced Battery Systems)

Abstract

:
Innovative carbon reduction and sustainability solutions are needed to combat climate change. One promising approach towards cleaner air involves the utilization of lithium-ion batteries (LIB) and electric power vehicles, showcasing their potential as innovative tools for cleaner air. However, we must focus on the entire battery life cycle, starting with production. By prioritizing the efficiency and sustainability of lithium-ion battery manufacturing, we can take an essential step toward mitigating climate change and creating a healthier planet for future generations. A comprehensive case study of the leading LIB manufacturers demonstrates the usefulness of the suggested hybrid methodology. Initially, we utilized the Malmquist model to evaluate these firms’ total efficiency while dissecting their development into technical and technological efficiency change components. We employed the Epsilon-Based Measure (EBM) model to determine each organization’s efficiency and inefficiency scores. The findings show that the EBM approach successfully bridged the gap in the LIB industry landscape. Combined with the Malmquist model, the resulting framework offers a powerful and equitable evaluation paradigm that is easily applicable to any domain. Furthermore, it accurately identifies the top-performing organizations in specific aspects across the research period of 2018–2021. The EBM model demonstrates that most organizations have attained their top level, except for A10, which has superior technology adoption but poor management. A1, A2, A4, A6, A8, A9, and A10 were unable to meet their targets because of the COVID-19 pandemic, despite productivity improvements. A12 leads the three highest-scoring enterprises in efficiency and total productivity changes, while A3 and A5 should focus on innovative production techniques and improved management. The managerial implications provide vital direction for green energy practitioners, enhancing their operational effectiveness. Concurrently, consumers can identify the best LIB manufacturers, allowing them to invest in long-term green energy solutions confidently.

1. Introduction

1.1. Overview of the Lithium-Ion Batteries Industry

Lithium-ion batteries have emerged as a dominant technology for portable electronics, electric vehicles, and renewable energy storage due to their high energy density, long life cycle, and environmentally friendly characteristics [1]. As the demand for lithium-ion batteries continues to grow, it becomes imperative to assess the efficiency of lithium-ion battery manufacturers to optimize their performance and ensure sustainable production practices. The global lithium-ion battery industry has experienced remarkable growth, with a market value of USD 42.30 billion in 2020 [2,3,4,5]. It is projected to reach approximately USD 160.21 billion by 2026, growing at a CAGR of around 26.04% [6,7]. This growth can be attributed to several key factors driving the expansion of lithium-ion battery technology.
Firstly, increasing environmental concerns and the need to mitigate carbon emissions from conventional automobiles have spurred the adoption of electric vehicles worldwide [8]. Strict emission standards imposed by the highest authorities in many countries have accelerated the shift towards electric cars, which has fueled the demand for lithium-ion batteries as a preferred choice for powering electric vehicles [7].
Furthermore, the decreasing lithium-ion battery prices and rising investment by market players in research and development to launch batteries with an advanced capacity have contributed to the market growth. Introducing new market participants and model variations for electric vehicles has intensified competition and led to innovations to reduce production costs, further propelling the demand for lithium-ion batteries [9].
Governments of several developing countries are also promoting the adoption of electric vehicles through assistance and incentives for production, consumption, and the development of public charging infrastructure [4]. This encouragement has created a favorable environment for the expanding demand for lithium-ion batteries. Besides that, lithium-ion batteries’ small size, excellent energy efficiency, and low price make them an attractive choice for various applications, including manufacturing, automobile, electronic devices, healthcare gadgets, telecommunication buildings, and other sectors [3,10,11]. The expanding applications of lithium-ion batteries in diverse industries such as military, aviation, smart grid, and passenger cars are expected to boost the market growth further [4,12,13]. The global LIB industry is segmented based on category, structure, employment, market competition, and geographic distribution. A flourishing industry propels the strong demand for lithium-ion battery technology in the thriving automotive sector, an amplified allocation of electric vehicles, and a growing presence of market players in this domain [7].
The global LIB industry is witnessing robust growth driven by increasing environmental concerns, declining prices, investments in research and development, government incentives, and expanding applications [14]. The projected growth in the automotive and traction segment and the overall market presents significant opportunities for manufacturers, investors, and other stakeholders in the lithium-ion battery industry.

1.2. Research Gap and Research Motive

Despite the increasing demand and widespread use of lithium-ion batteries in various applications, there is still a research gap in evaluating the efficiency of lithium-ion battery manufacturers. The current research mainly focuses on assessing the performance of lithium-ion batteries in terms of energy storage capacity, durability, and safety features. However, limited research addresses the efficiency of manufacturers producing these types of batteries. An efficiency evaluation is crucial for manufacturers because it provides detailed information about their operational performance and identifies areas that need improvement. Traditional efficiency evaluation methods, such as Data Envelopment Analysis (DEA) and its variations, have been widely used in various industries to measure efficiency. However, there is still a lack of research applying DEA and other advanced methods to evaluate the efficiency of lithium-ion battery manufacturers.
The primary motive of this study is to bridge the research gap by assessing the efficiency of lithium-ion battery manufacturers using a DEA approach, especially the Malmquist and the Epsilon-Based Measure (EBM) model. The DEA Malmquist model is a widely used method for evaluating the efficiency of a Decision-Making Unit (DMU) over time. The EBM model is a relatively new approach incorporating undesirable outputs in the efficiency assessment process.
By employing these advanced methods, this research aims to provide a comprehensive and accurate assessment of the efficiency of lithium-ion battery manufacturers. This assessment can help identify best practices, benchmarking targets, and areas for improvement in the manufacturing processes of lithium-ion batteries.
Furthermore, the research motive extends to academic contributions by adding to the existing literature on efficiency assessment methods for lithium-ion battery manufacturers. This research can contribute to operations management, industrial engineering, and sustainable energy research by applying advanced efficiency assessment techniques to a specific context, i.e., lithium-ion battery manufacturing. The findings of this study can serve as a reference for future research and provide insights for researchers interested in efficiency assessment methods in the context of battery manufacturing and other related industries.
This study is to fill the research gap by assessing the efficiency of lithium-ion battery manufacturers using advanced methods such as the DEA Malmquist and EBM models. We will compare the results obtained from this approach to provide a comprehensive and compelling assessment of the efficiency of LIB manufacturers. This comparison will highlight the similarities and differences between the two models in evaluating the efficiency of LIB manufacturers, further enhancing the rigor and credibility of our research. The findings of this research can have practical implications for manufacturers and policymakers in the battery industry, as well as academic contributions to the literature on efficiency assessment methods in the context of battery manufacturing.
The findings are presented in the study using a systematic framework. Section 2 thoroughly examines DEA models and their specific applications in the literature. Section 3 provides an overview of the research method and dives into the theoretical features of the Malmquist and EBM models. Section 4 presents a case study concentrating on the LIB industry as an example of the suggested methodology’s efficacy and relevance in solving performance assessment issues in the marine industry. The report summarizes the most relevant findings, highlights contributions, recognizes potential limits, and suggests future research prospects in Section 5.

2. Study Process and Related Works

2.1. Study Process

This paper presents an innovative and incorporated approach for assessing the efficiency of the top twelve lithium-ion battery companies from 2018 to 2021. Our proposed model combines Data Envelopment Analysis (DEA) Malmquist and Efficiency-Based Measure (EBM) techniques, offering a comprehensive and sophisticated framework for evaluating efficiency in this context [15,
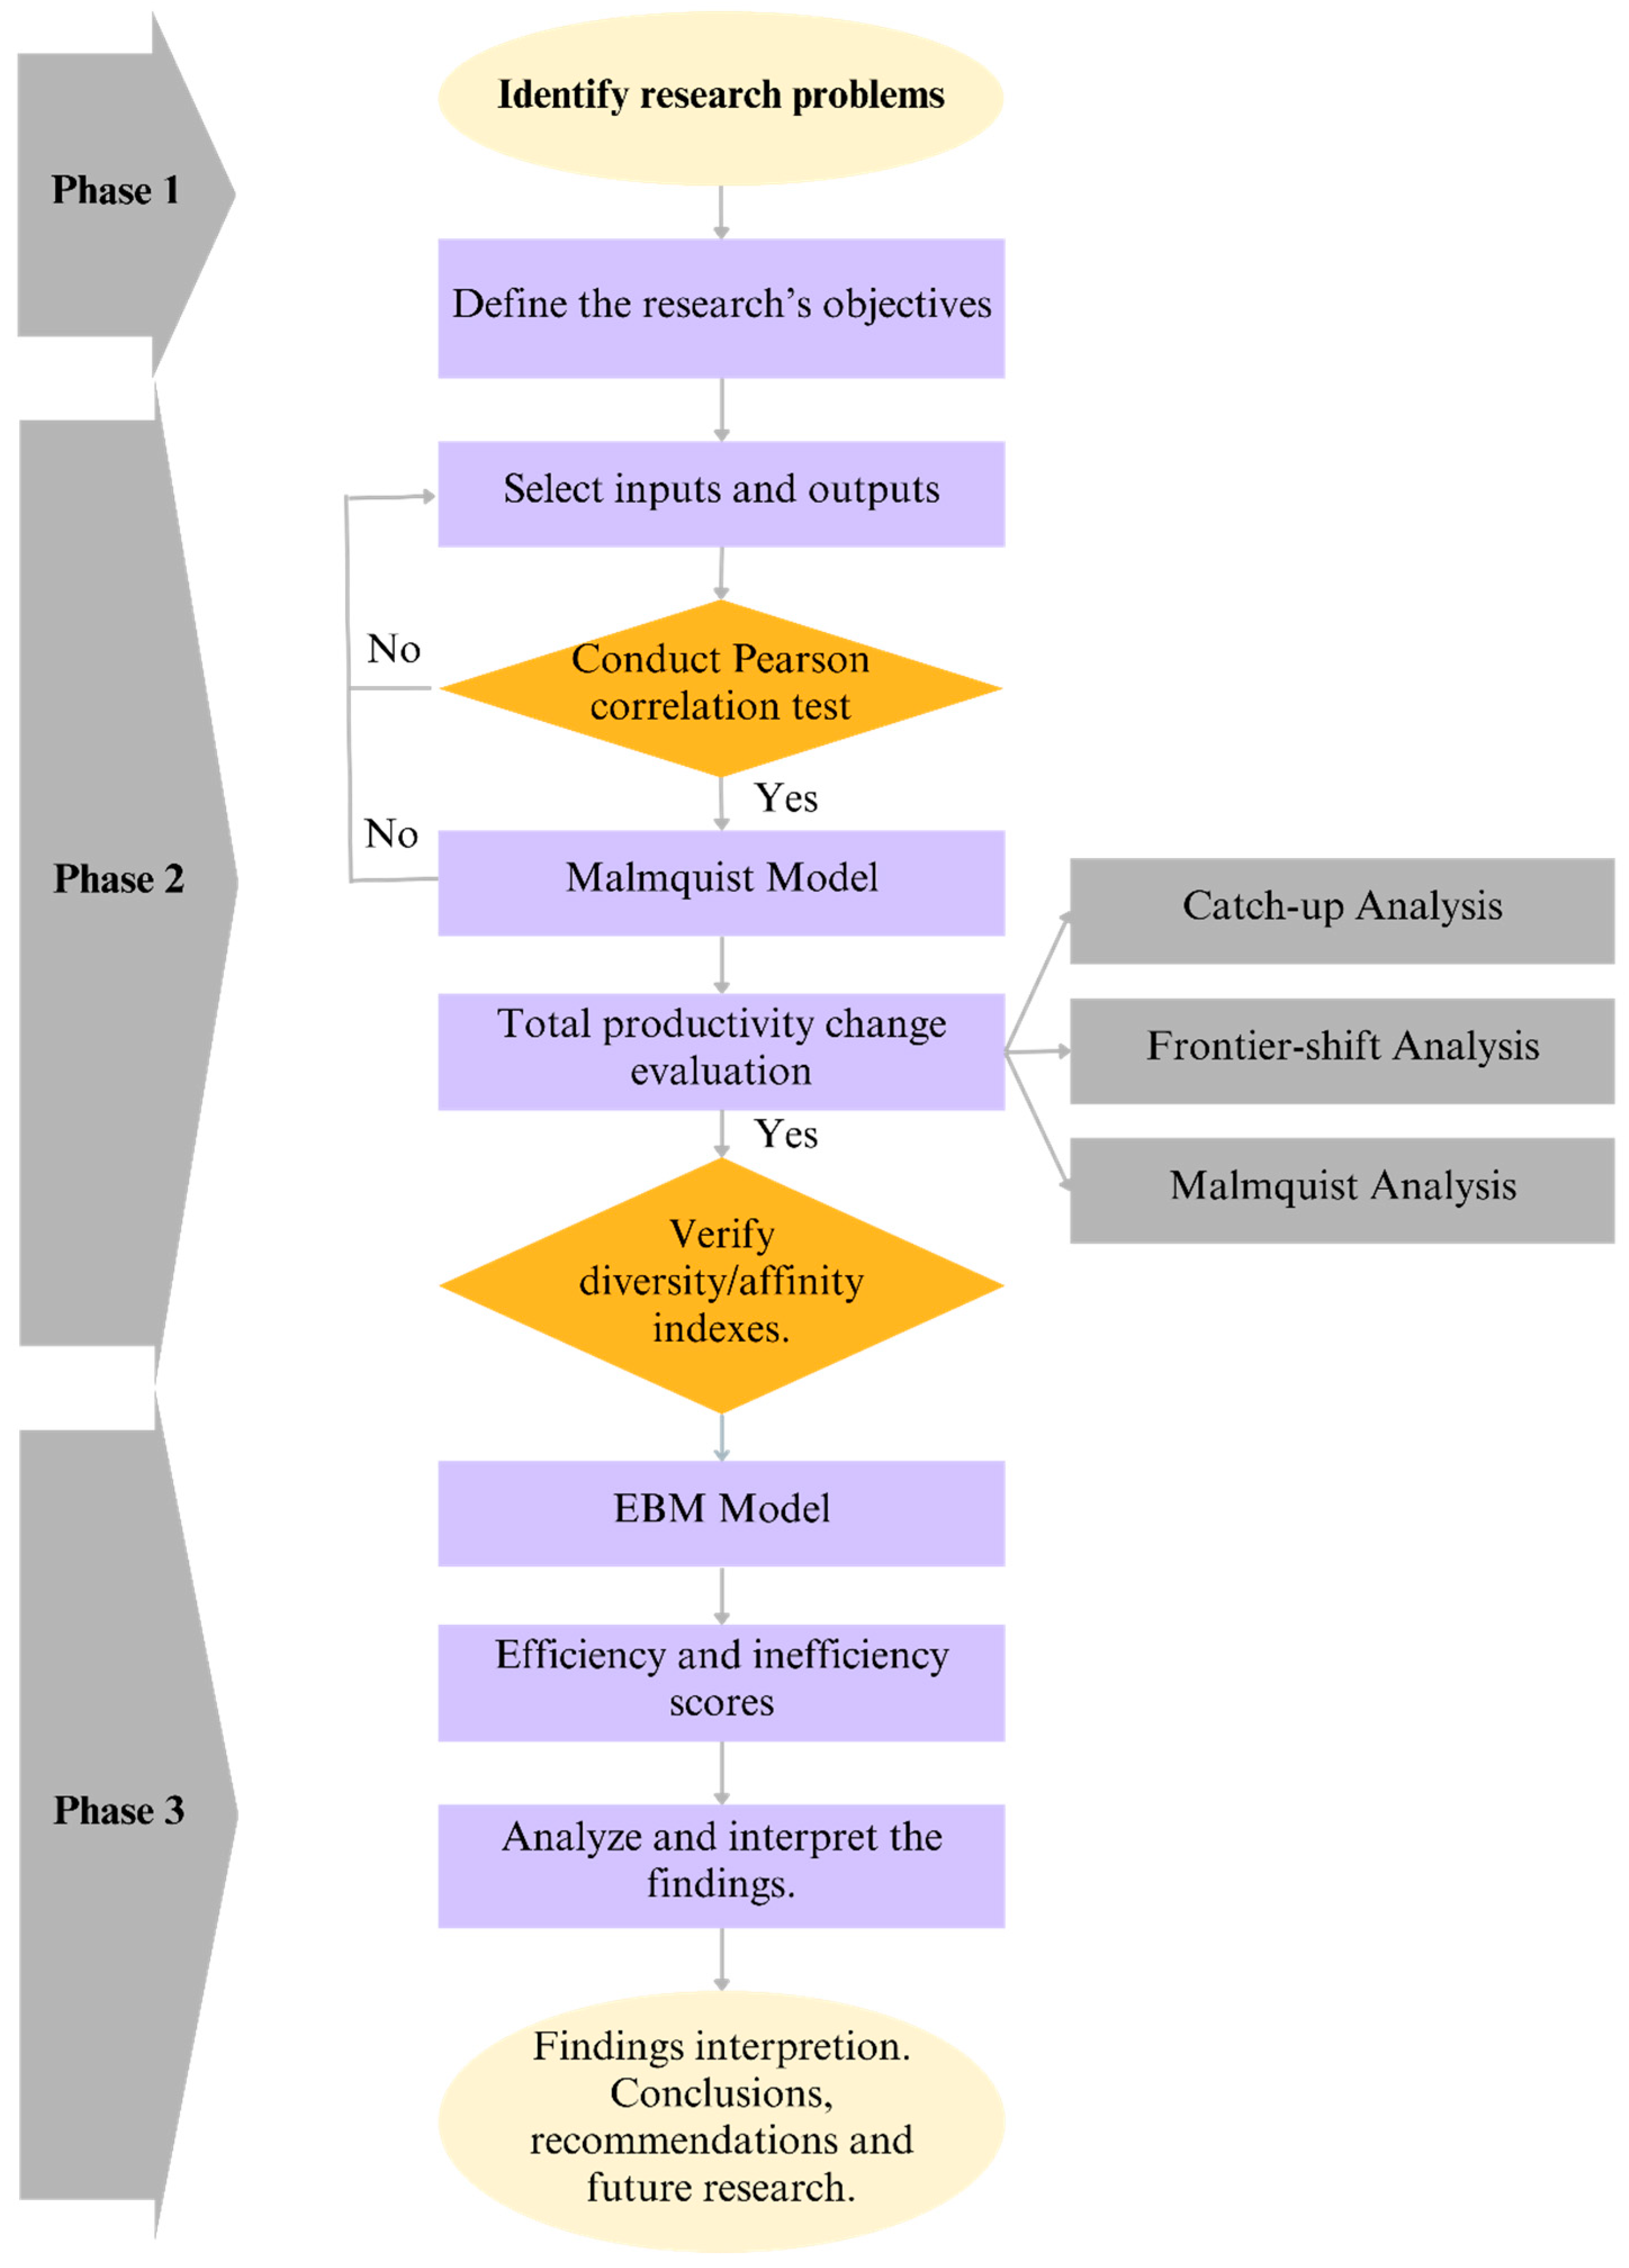
16]. The research process for assessing the efficiency of lithium-ion battery manufacturers using the DEA Malmquist and EBM model can be outlined in three main phases, as demonstrated in Figure 1.
Phase 1: Problem Analysis and Objective Definition
We expect to find and examine the challenges connected to analyzing the efficiency of lithium-ion producers throughout this phase of the research. We established a precise research objective with specified targets and measurable outcomes.
Phase 2: Data Collection and Analysis
This phase involves selecting the appropriate inputs and outputs for the DEA Malmquist model based on the study objectives and available data. Total assets, liabilities, and SG&A expenses are determined for entry. Based on the study objectives and open data, revenue and gross income are chosen as the outputs for the DEA Malmquist model at this step. A Pearson correlation test assesses data homogeneity and isotonicity, which ensures the study’s validity. As part of this total productivity evaluation, the DEA Malmquist model measures lithium-ion producers’ “technical efficiency change (catch-up)” and “technological investment (frontier shift)” [17,18,19,20]. Before proceeding to the next stage, a diversity affinity test is run to double-check the diversity and affinity coefficient indices [16].
Phase 3: EBM Model and Results Analysis
In this phase, we utilized the Epsilon-Based Measure (EBM) model to determine scores for the efficiency and inefficiency of the Decision-Making Units (DMUs), also known as lithium-ion battery producers, based on the DEA Malmquist model outputs. These scores rank DMUs based on their ability to manufacture lithium-ion batteries. The efficiency and inefficiency scores are evaluated, and the findings are interpreted considering the research objectives. The implications of the results are discussed, as well as the research’s limitations and potential paths for additional exploration. The study draws several conclusions and makes recommendations to various stakeholders, including practitioners and policymakers in the lithium-ion manufacturing industry.
Combining the DEA Malmquist and EBM models, this three-phase research process offers a comprehensive approach for evaluating lithium-ion manufacturers’ efficiency, considering total productivity change and efficiency scores while ensuring data integrity through a correlation analysis and diversity affinity testing.
The integrated DEA Malmquist and EBM models proposed in this manuscript offer a cutting-edge approach for assessing efficiency in the lithium-ion battery industry, accounting for technical efficiency change and technological investment. Using a Pearson correlation analysis and diversity and affinity coefficient index verification further strengthens our findings’ robustness. The results of this study are expected to provide valuable insights for stakeholders, including policymakers and researchers, in the lithium-ion battery industry and contribute to the existing literature on efficiency assessments in the field of battery technology.

2.2. Related Works

Some noteworthy studies implemented the efficiency evaluation problems for businesses and manufacturers by combining the Malmquist and EBM models in diverse approaches. Mykhalovskiy et al., 2004 give thoughts, reviews, and evaluations to assist in developing more comprehensive social scientific research of EBM [21]. Li et al., 2020 utilized a modified meta-two-stage EBM Malmquist approach to investigate regional disparities in thirty-one Chinese cities’ economies, energies, environments, health, and media during 2014–2016 [22]. A quantitative method was used by Rusli et al. to evaluate the logistics sector in Malaysia before and after the COVID-19 pandemic by comparing the sector’s effectiveness and efficacy using the EBM and Malmquist index approaches. [23]. Data envelopment analysis is used to analyze the energy efficiency of China’s coastal regions in terms of air emissions between 2000 and 2012 (Qin et al., 2017) [24]. Carbon dioxide, sulfur dioxide, and nitrogen oxide emissions are all negative consequences of energy consumption.
Under the new regulation, the process by which banks develop appropriate internal judgments for absorbing international strategic capital becomes crucial for managing banks. Constant productivity improvements will lead to long-term growth; thus, the goals of this study are as follows: (1) to figure out the connection between international strategic ventures and improvements in the output of China’s banks and to validate the effectiveness of implementing overseas strategic investing; (2) to determine the best overseas ownership percentage; and (3) to illustrate the impact of overseas strategic expenditures on China’s financial institution efficiency, i.e., the way it transmits between institutions [25].
Cheng et al., 2019 discover that the Malmquist trend of total factor productivity indicators corresponds with the findings from the best practice gap change (BPC) and pure technological catch-up indexes (PTCU), indicating that the BPC and PTCU indexes’ innovation effects are the primary factors responsible for productivity improvement [26]. Lu et al. 2020 use a three-stage DEA model and a period neural network framework to assess and forecast total factor productivity in Chinese petroleum enterprises [27]. From 2009 to 2018, the panel data from 50 publicly traded Chinese petroleum companies were used. A three-stage Data Envelopment Analysis (DEA) model was used to exclude environmental and random effects. As a result, the radial basis function neural network prediction model was employed to forecast the total factor productivity of publicly traded petroleum businesses over the following two years.
A two-phase DEA methodology based on EBM and Malmquist is used to investigate the effectiveness of maritime transportation in European countries. The results identify the most prosperous nations across multiple economic sectors from 2016 to 2019 and demonstrate that the research gap in applying the EBM method to marine transport has been successfully filled [28].

3. Resources and Procedures

3.1. The Malmquist Model Theory

It is necessary to precisely check the positive correlation between the variables utilized for analysis to guarantee the validity and reliability of the Malmquist model. The Pearson correlation test is the answer to this problem. Statistical analysis is a standard tool in the academic world. The Pearson correlation coefficient, denoted by the symbol ( H p q ), is a standardized measure of the linear association between two variables. It is computed using Equation (1) and takes on values between +1 and −1, with larger values indicating a stronger linear relationship. A correlation coefficient around +1 indicates an almost ideal linear relationship between the variables, lending credence to the study. Thus, confirming the validity and accuracy of the study data is crucial by carefully applying this Pearson correlation test at the outset of employing the DEA Malmquist model.
All variables utilized in the analysis must have a negative correlation before the Malmquist model can be applied successfully. A correlation test should be used to guarantee this criterion is met. When the coefficient of correlation between two variables is high, they have a strong relationship. However, the Pearson correlation coefficient value is directly proportional to the link between the two parameters. When the value of the correlation is lower, the link is weaker. The correlation coefficient has a fixed value of −1 to +1, which is almost perfect if it falls within a range of ±1.
H p q = i = 1 n p i p ¯ q i q ¯ i = 1 n p i p ¯ 2 i = 1 n q i q ¯ 2
The fundamental goal of the MPI is to investigate alterations in the performance of the production of many DMUs during a period when assessed by the outcome of relative efficiency change (catch-up) and “technological change (frontier)” [29]. Catch-up efficiency refers to a DMU’s extraordinary reaction to a difference in effectiveness. The phrase “frontier shift” relates to how DMUs withstand technological innovation from one period to another.
The two periods in the DEA analysis are known as ( m i , n i ) for the first and ( m i 2 , n i 2 ) for the second with a particular D M U i . To determine the efficiency score D M U i   m i ,   n i   t 1 , the frontier’s effectiveness is t 2 : d t 2 ( m i ,   n i t 1 ( t 1 = 1, 2 and t 2 = 1, 2)
With a certain D M U i , the analysis’ two-time frames have been introduced as ( m i , n i ) for the initial duration and ( m i 2 , n i 2 ) for the following duration. Frontier effectiveness is t 2 : d t 2 m i ,   n i t 1 ( t 1 = 1, 2 and t 2 = 1, 2) to evaluate the score of efficiency D M U i   m i ,   n i   t 1 . The relative efficiency shift in Equations (2)–(4) will be calculated as follows using the formulas for the frontier-shift index (FSI), Malmquist productivity index (MPI), and catch-up index (CA).
C A = d 2   m i ,   n i 2   d 1     m i , n i   1
F R = d 1 m i , n i 1 d 2 m i , n i 1 × d 1 m i , n i 2 d 2 m i , n i 2 1 2
M P I = d 1 m i , n i 2 d 1 m i , n i 1 × d 2 m i , n i 2 d 2 m i , n i 1 1 2
Detailed explanations of all the variables:
Catch-up Index (CI): Fare et al. divided the entire change in productivity into those that are related to a shift in the efficiency border that separates the times of t and the t + 1 period, with the cause being due to the efficiency of the unit “catch-up The catch-up ratio represents the change in efficiency over the cross-section of the unit operating as we go from t to 1 + t [30,31]. The phrase “boundary shift” refers to the difference in the efficiency boundary between period t and time 1 regarding the amount of input needed to keep a particular output level while operating optimally.
Frontier-shift Index (FSI): FSI indicates the new research and development (R&D) innovations and skills; for example, breakthrough creation of procedures and systems or technological change. It is essential to know how far one is from the R&D technical frontier and how rapidly one may reach it via upgrading machinery and procedures. A formula calculates the “boundary shift” in R&D advancement.
Malmquist Productivity Index (MPI): The index tracks productivity growth over time, breaking it down into efficiency and technological advancement increases using a DEA-like nonparametric technique, separating productivity into technological advancement and efficiency catch-up calls for using current data and temporal adjustments in the research period. The MPI is a distance function from the equations’ measurements at times t and t + 1. It is calculated as the result of DEA-derived catch-up (recovery) and frontier-shift (innovation) elements using the nonparametric approach.
Using the abovementioned methodologies, we can identify whether a DMU’s overall efficiency factor rises or falls. There is a chance that efficiency will either increase or decrease because of catch-up or frontier efficiency. As calculated above, the DMU’s total effectiveness of factors reflects comparative and technologically innovative performance improvements or decreases. CA, FSI, and MPI figures may vary by more than, less than, or equal to one, showing if a DMU is moving forward, backward, or remaining constant between the two periods.

3.2. The EBM Theory

Since it involves determining efficiency, DEA can handle several input and output parameters. The Charnes–Cooper–Rhodes (CCR) model finds an optimal proportional change in input and output quantities while ignoring the emergence of excess inputs or deficient outputs in a DMU (known as a radical approach because it only considers proportional changes in inputs and outputs) [32,33,34]. Although it does not focus on the proportion of output and input changes (non-radial technique), the Slack-Based Measure (SBM) must deal with slacks directly. SBM simulations (non-radial slack variable efficiency), are based on the efficiency of slack variables but do not use the radial estimate assumption, and aim to optimize output and input inefficiencies by picking locations farthest from the border [16,35,36,37]. They lack data on the ratio used to compute the efficiency front projection during the technique. The final findings are rarely as accurate as the estimates because there is so much possibility for improvement. To solve this issue, Tone offered three Epsilon-Based Measurement (EBM) models with “radial and non-radial components” in 2010 [16]. Among the designs were “input-oriented, output-oriented, and non-oriented” and “non-oriented” [16,25,37]. The models considered both non-radial and radial features. When input-oriented EBM (EBM I-C) for DMU o = ( x o , x o ) is used, the standard “unguided EBM calculation model” can be stated in Equation (5) as follows.
δ * = min θ , λ ,   s θ ε x i = 1 m ω i s i x i o Subject   to j = 1 n x i j λ j = θ x i o s i , ,   i = 1 , , m     j = 1 n y i j λ j y r o , r = 1 , , s λ j 0 , j = 1 , 2 , , n s i ,   0 , i = 1 , 2 , , n
s i , and ω i reflect the weight and slack present in the λ j input, respectively, ε x is a variable that uses input scattering to reflect peripheral characteristics, and “o” indicates that the DMU has been checked.
s i , and ω i describe how much slack and weight are present in the input, respectively, ε x is a variable demonstrating the radial characteristics and affects the amount of scattering present in the inputs, and “o” indicates that the DMU is being evaluated [25,38,39].
The variable ε x demonstrates the radial properties and impacts the amount of scattering present in the inputs, whereas s i , and ω i define the slack and weight of the inputs, respectively. An evaluation of DMU is indicated by “o”.
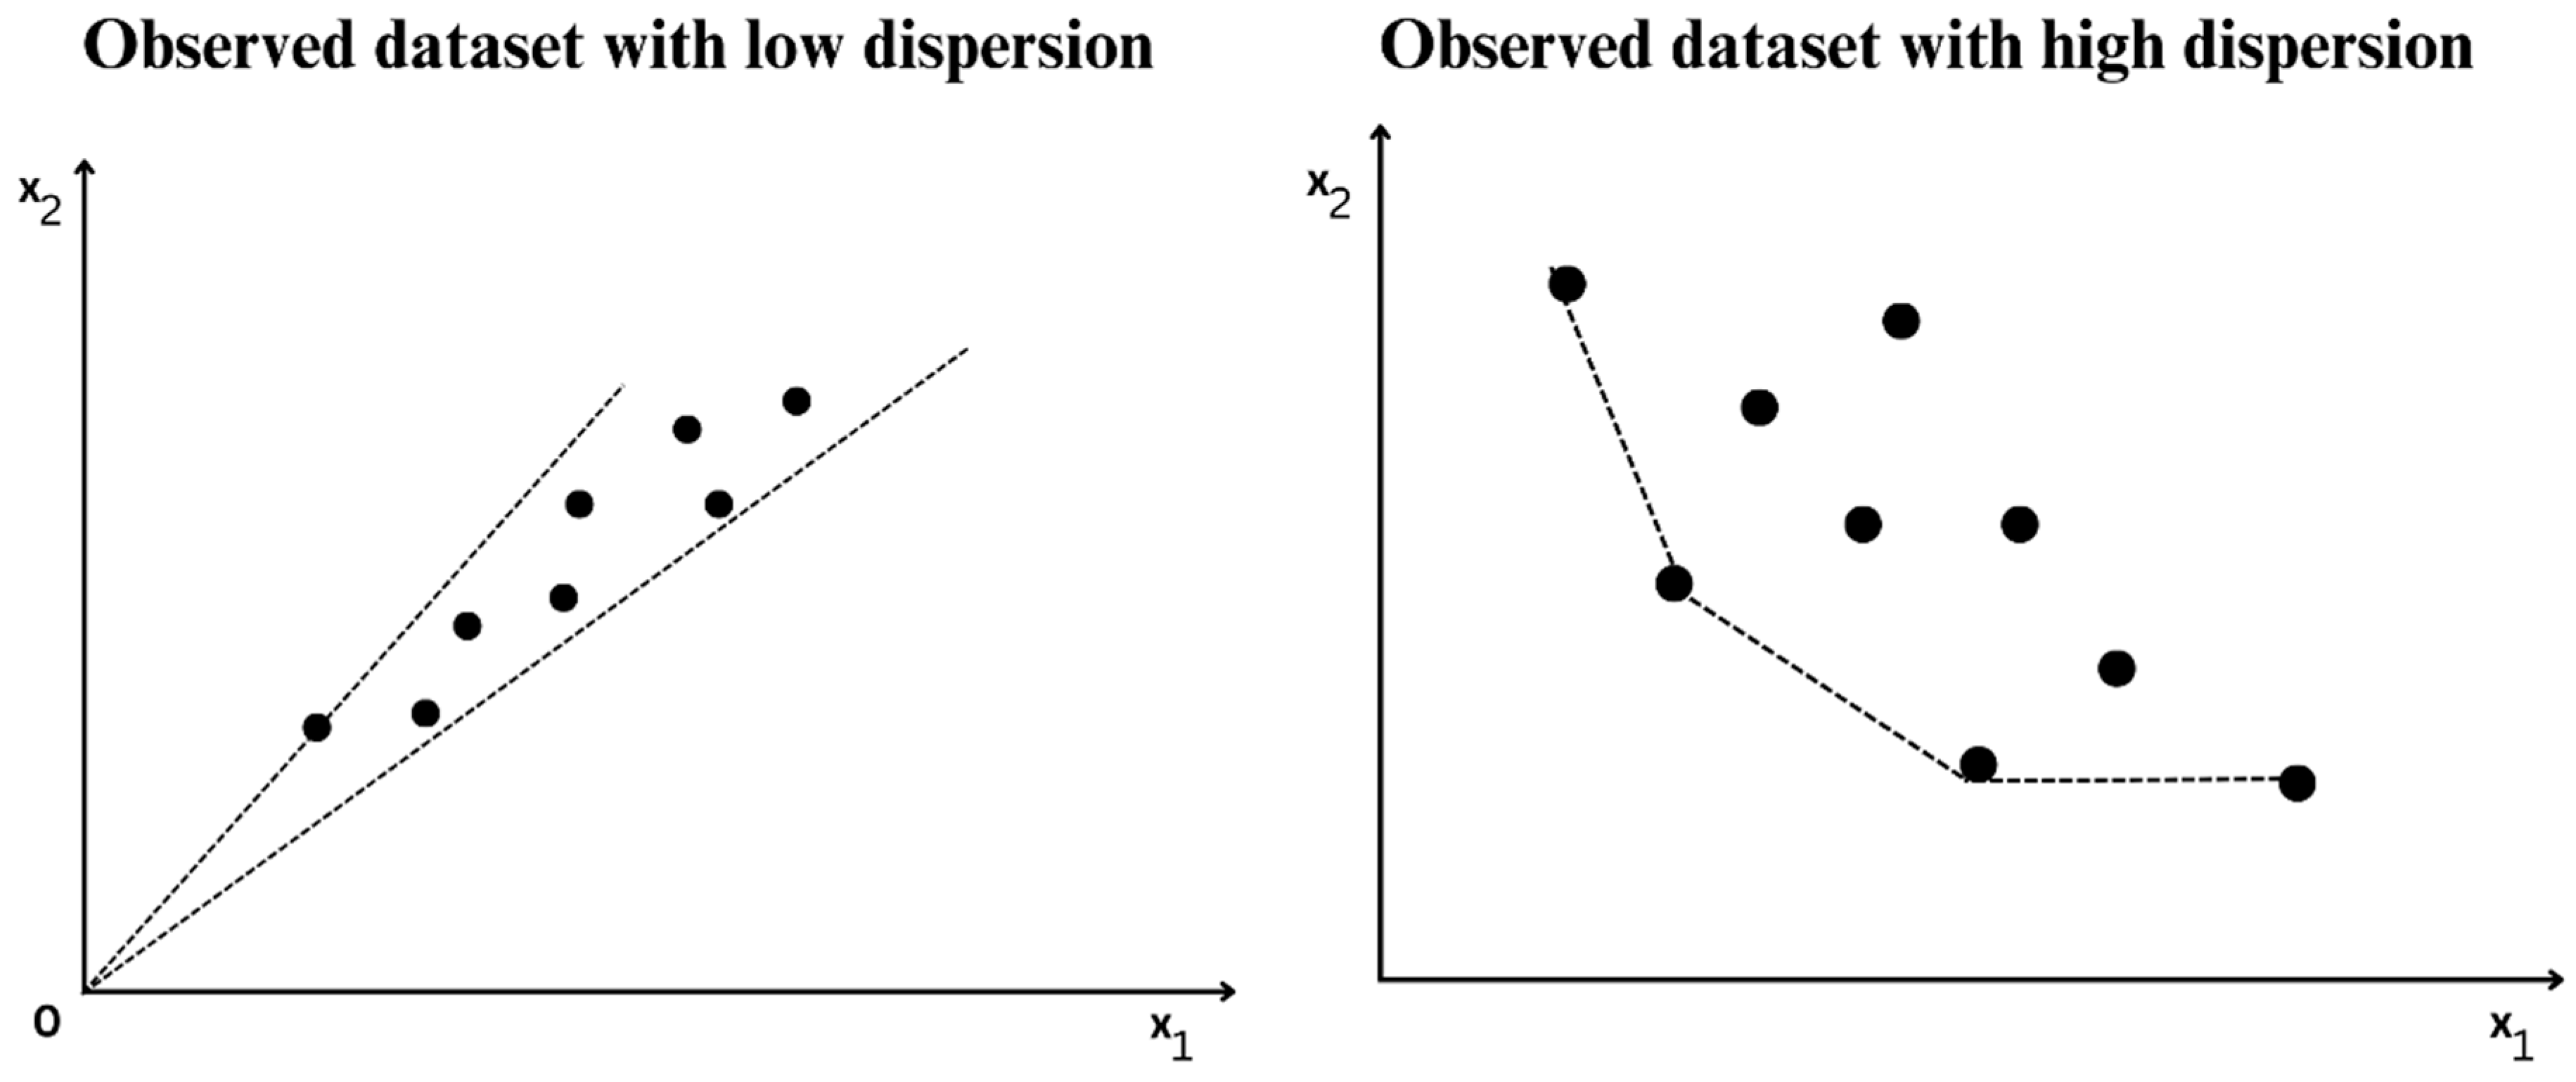
When discussing the requirements of an effective EBM model, Tone and Tsutsui mentioned the following requirements: 0 ≤ P(c,d) = P(c,d) ≤ 1/20 ≤ … 1/2 and 0 ≤ Q(c,d) = 1 − 2P(c,d) 0 ≤ 1. The analyzed data with low and high scattering are demonstrated in Figure 2

4. Research’s Empirical Findings

4.1. Obtaining Data

In this paper, we evaluate and rate the productivity and efficiency of the twelve LIB manufacturers throughout the four years 2018–2021. The data for the study were collected from the financial database of twelve LIB companies. Table 1 shows the list of DMUs and market cap up to 2023.
In Data Envelopment Analysis (DEA), the Malmquist model stands as a vital tool for evaluating the performance of Decision-Making Units (DMUs) [17,40,41]. A critical aspect of this model is the selection of the inputs and outputs used to measure the DMUs’ performance. Drawing upon a comprehensive review of the relevant literature spanning several decades, we have identified the most pertinent financial variables to be included in the model. According to the “thumb rule” suggested by Golany and Roll (1989) and Homburg (2001), to ensure there are enough DMUs for a meaningful and robust comparison, the number of DMUs should be at least twice the total number of inputs and outputs [32,42]. After examining various prior studies, we have arrived at a well-supported choice of three inputs: total assets, liabilities, and selling general and administrative (SG&A) expenses, and two outputs: revenue and gross income. These inputs and outputs have been carefully selected based on their significance in capturing the underlying performance of DMUs. Table 2 demonstrates an overview of the various input and output variables employed in prior studies.
The rigorous statistical analysis that has guided the selection of these inputs and outputs is meticulously documented in Table 3. This descriptive input and output data presentation further substantiates our thorough approach to constructing a robust DEA Malmquist model. By incorporating these carefully chosen variables, we have ensured that this model is well-founded and capable of providing valuable insights into the performance of DMUs.
Table A1, Appendix A, displays the predicted Pearson correlation coefficient values for 2018, 2019, 2020, and 2021. The Pearson test coefficients show positive correlations, which are between 0 and 1. The research findings are incredibly delicate in selecting the input and output variables and parameters.

4.2. The Malmquist Model’s Findings

4.2.1. Technical Efficiency Change

The catch-up index, as illustrated in Figure 3 and Table 4, reflects the variation in the operational effectiveness of the DMUs across periods. Figure 3 shows the development of catch-up indexes across the entire range of LIB producers, and Table 4 gives specific values for “catch-up.” The catch-up index’s worth of more significant than 1, less than 1, and 1 reflects the advancement or decrease of the DMUs’ technical effectiveness. Based on the table, all DMUs have achieved a progressive technological efficiency on average (average indexes for catch-up >1) throughout 2018–2021. This advanced efficiency resulted in an average catch-up score of 1.0925. In this group, the three DMUs, A10 (1.5509), A8 (1.2874), and A2 (1.1890), are the three DMUs that have achieved the most outstanding performance in terms of technical efficiency from 2018 to 2021. Meanwhile, A5 (0.8326), A3 (0.9268), and A11 (0.9278) are among the most efficient players based on the average.
Figure 3 shows that A10-Nio, Inc. has the highest performance, 1.7153 from 2018 to 2019 and 1.7090 for 2019–2020, before a decrease to 1.2283 between 2020 and 2021. There was a lot of fluctuation in the performance throughout the research, just as with A2. Notably, A2, A6, A7, and A8 reached their peak technical performance during 2019–2020 and fell in 2020–2021.
In contrast, A2 experienced a slump in the efficiency of its technology during 2020–2021 and a catch-up index of 0.6804 and was the most inefficient manufacturer then. Among twelve manufacturers, A7 was the first to have the poorest catch-up index (0.7476). In 2018–2019, they surpassed seven companies and climbed fifth in the rankings (1.3073). However, they had the fourth lowest catch-up rate in 2020–2021 (0.8989). The last time we looked at it, A7 had the highest percentage of manufacturers showing an increase in the efficiency of their technical changes. At the same time, A12, A3, and A11 significantly improved the performance of technology changes. Only A12 exhibits a steady growth trend in technical efficiency in the three intervals. It had dramatically improved its catch-up score, going from a mere 0.8963 from 2018 to 2019 to 1.1147 during 2019–2020, before it reached its peak efficiency at 1.2932 from 2020 to 2021.

4.2.2. Efficiency Frontiers

Frontier-shift indexes are an essential tool for assessing an organization’s technical advancement over time, and the conclusions reported in this study are persuasive. Table 5 displays the frontier-shift values for each DMU, indicating that just one-sixth of the organizations evaluated obtained progressive average frontier-shift scores. The data suggest that most DMUs (nine out of twelve) stagnate and become poor technological performers.
Figure 4 depicts the evolution routes of technological efficiencies for all DMUs, demonstrating a variety of shifting patterns. Interestingly, while some organizations endure a decline in technological progress during one time, they can achieve their peak during the next, emphasizing the need for ongoing innovation and adaptation. It is worth mentioning that A4 stands out as a remarkable performer, with the highest score of 1.4029 achieved over the research period. This number starkly contrasts with A3, which peaked at 1.0566 in 2019–2020 before plummeting to the second-worst score of 0.0977 in 2020–2021.
Only one-sixth of the DMUs in Table 5 attain the increasing average frontier-shift values, including A4 (1.0177) and A9 (1.0239). Meanwhile, A1 (0.9605), A2 (0.9638), A3 (0.09973), A5 (0.9364), A6 (0.9478), A7 (0.9864), A8 (0.9726), A10 (0.8822), A11 (0.9843), and A12 (0.9472) lag and become poor technological achievers. Most producers (9 among 12 units) had nonprogressive average frontier-shift indexes (FSI), with an average frontier-shift score of 0.9684 for the observed time. Figure 4 shows more fluctuating patterns of the DMUs, demonstrating the stable progression of their technological performances compared to Figure 3 (catch-up). Among these, A4 has the best score of 1.4029 in 2020–2021.
A2, A4, A5, A7, A8, and A10 indicate a decline in 2019–2020 and a peak in technical progress in 2020–2021. A3 had a maximum score of 1.0566 in 2019–2020, which was more significant than other corporations, but subsequently dropped to the second-worst score (0.0977) in 2020–2021.
In a continually changing corporate scene, the findings reported in this study highlight the significance of continuous technological innovation and adaptability. The frontier-shift indices offer a holistic view of technological advancement by considering various elements such as competitiveness, regulatory and political settings, and inventions. As a result, firms should take these findings to heart and seek to enhance their technological performance to remain competitive and thrive in the long run.
The “frontier-shift” chart depicts the changes in the technical efficiency and productivity of firms or industries over time relative to the production frontier.

4.2.3. Results of Malmquist Productivity Indexes

To obtain the result for the Malmquist Productivity Indexes (MPIs) of the twelve LIB producers, we must solve Equation (4). The granular MPI values are presented in Table 6, and Figure 5 illustrates how the MPIs have changed over time for each company. We note that an efficiency index of MPI = 1 represents the status of staying unchanged productivity, that an efficiency index of MPI > 1 reflects an efficiency increase, and that an efficiency index of MPI <1 correlates to a decrease in total productivity.
As seen in Table 6, all manufacturers operated effectively on a typical basis, except for A3, A7, and A11, which only achieved 0.8825. This result stands out since A3, A7, and A11 all display declining performance in terms of technical and technological efficiency.
In addition, the average MPI of all producers is greater than 1 (1.0320), which indicates a development in the overall productivity growth of the companies during the research period and shows an improvement in the manufacturers’ efficiency. The three businesses that have had the most significant increase in productivity are A10 (1.3267), A8 (1.2460), and A12 (1.0828). These DMUs achieved exceptionally high technical efficiency levels, allowing them to compensate for a modest loss of ground in technological advancement. Figure 5 shows that, in certain instances, the DMUs almost follow the same trends as those shown in Figure 3 (the catch-up). A1, A3, A5, and A7 have the least stable performance for 2018–2021. These organizations’ trends of catch-up efficiency are illustrated in (catch-up), and these organizations’ patterns are identical. These firms’ catch-up efficiency trends are shown in Figure 3 (catch-up), and their patterns are similar.

4.3. Results of Epsilon-Based Measure Efficiency

The Malmquist approach results reflect the current operational picture of the world’s leading twelve LIB manufacturers after calculating the total productivity via technical efficiency change (catch-up index) and investment in technology impacts (frontier-shift index). By applying the EBM approach in this research’s third phase, we have data on twelve DMUs and may evaluate them according to their efficiency or inefficiency.
The EBM-I-C model, an input-oriented technique with a continuous restoration for scaling, is intentionally applied in the current investigation. The precision and relevance of the source to the topic at hand were the criteria that led to this selection. By constructing an affinity matrix from the observed input and output variables, we comprehensively investigate the diversity of production alternatives defined by EBM approaches. The diversity and affinity index matrix generated from the EBM methodology for 2018–2021 is presented in Table A2 and Table A3, which may be seen below. According to the findings of this research, the values of the diversity matrix and affinity matrix range from 0 to 0.2628 and 0.4744 to 1, which meet the basic requirements of the EBM model. Thus, we can utilize EBM to access and rank DMUs based on their efficiency scores. Table 7 then computes the EBM method input/output value and epsilon. The EBM model’s epsilon, which integrates radial and non-radial features, is constantly positive during the period under assessment (range: 0.4136 to 0.4447).
EBM model epsilon and input/output weight are employed to determine the comparative effectiveness and inefficiencies of twelve DMUs for 2018–2021, as illustrated in Table 8 and Figure 6. The results show that enterprises A3, A5, and A12 are very efficient, with a score of 1 and a deficit of zero for 2018–2021. For the whole time of 2018–2021, A10 has the worst efficiency ratings. LIB manufacturers with less than one EBM efficiency rating (especially A1, A2, A4, A6, A8, A9, and A10 with the lowest score) do not operate at their full potential. For LIB companies whose EBM efficiency score reaches 1, this shows the potential for more profitable investment.

5. Discussion and Conclusions

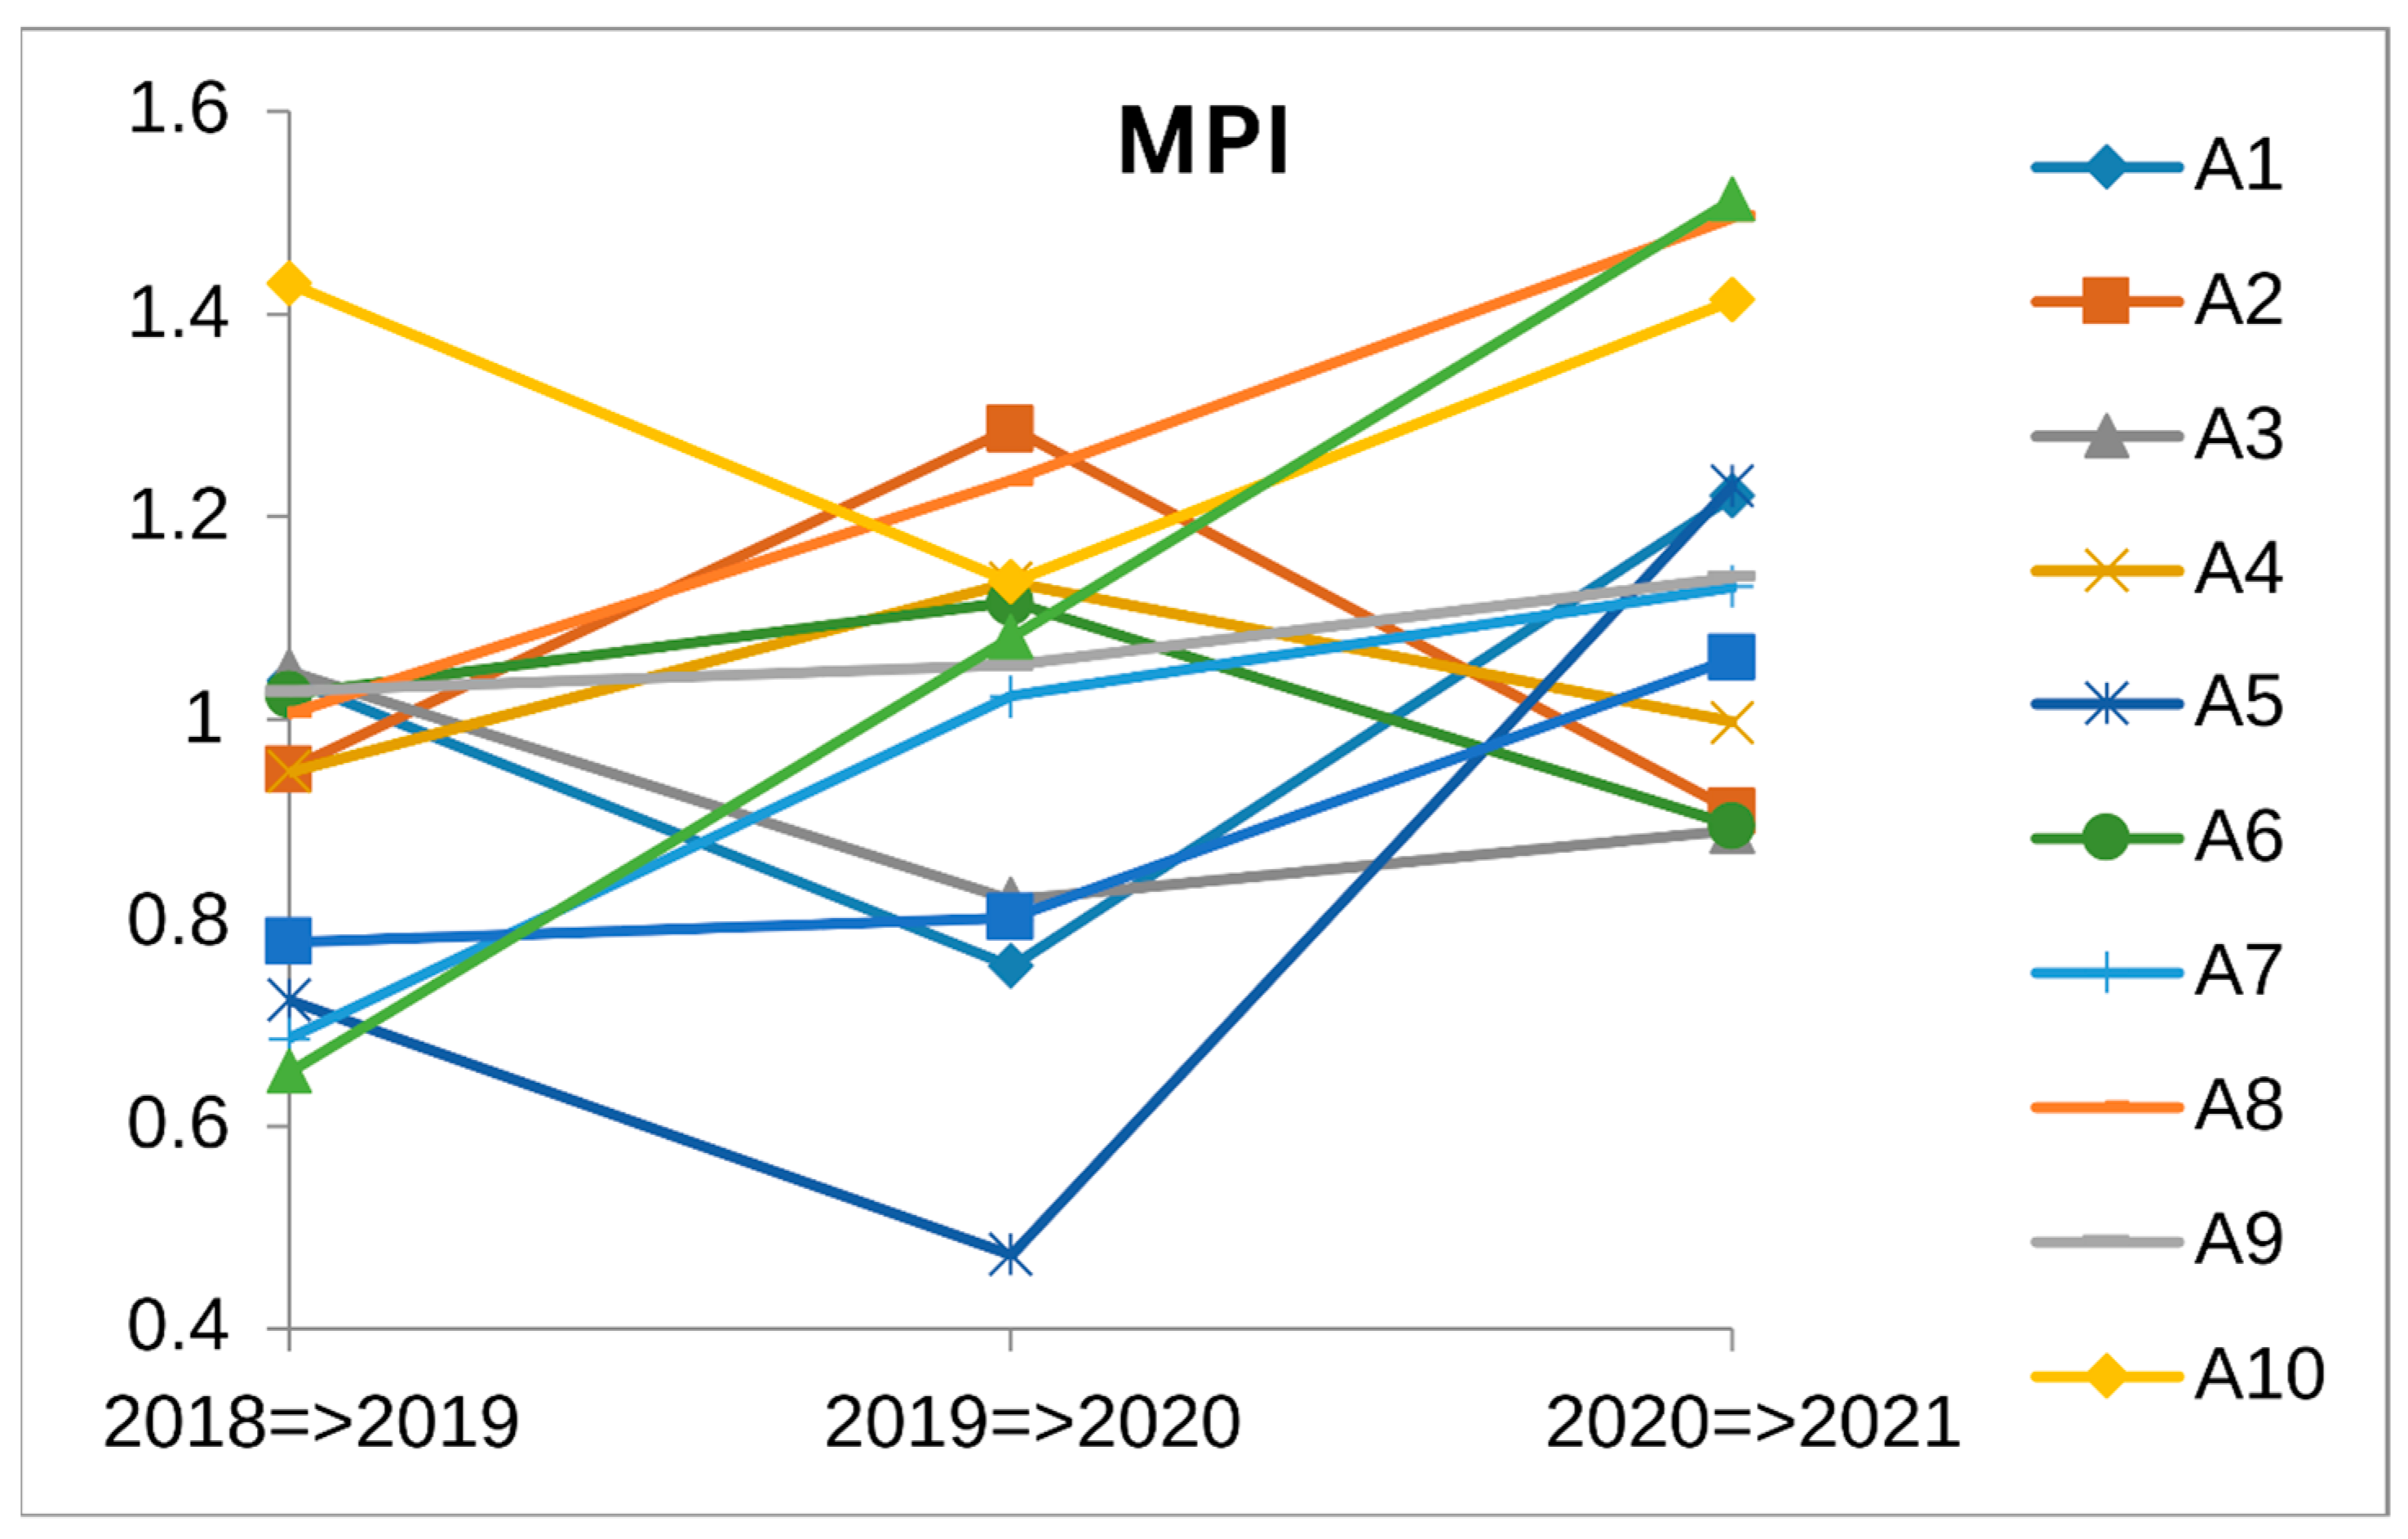
This article examines the productivity and efficiency of twelve lithium-ion battery (LIB) manufacturers from 2018 to 2021. Considering the Malmquist model’s findings, we find that the efficiency of LIB producers has changed over time, but only in just a handful of distinct patterns (see 
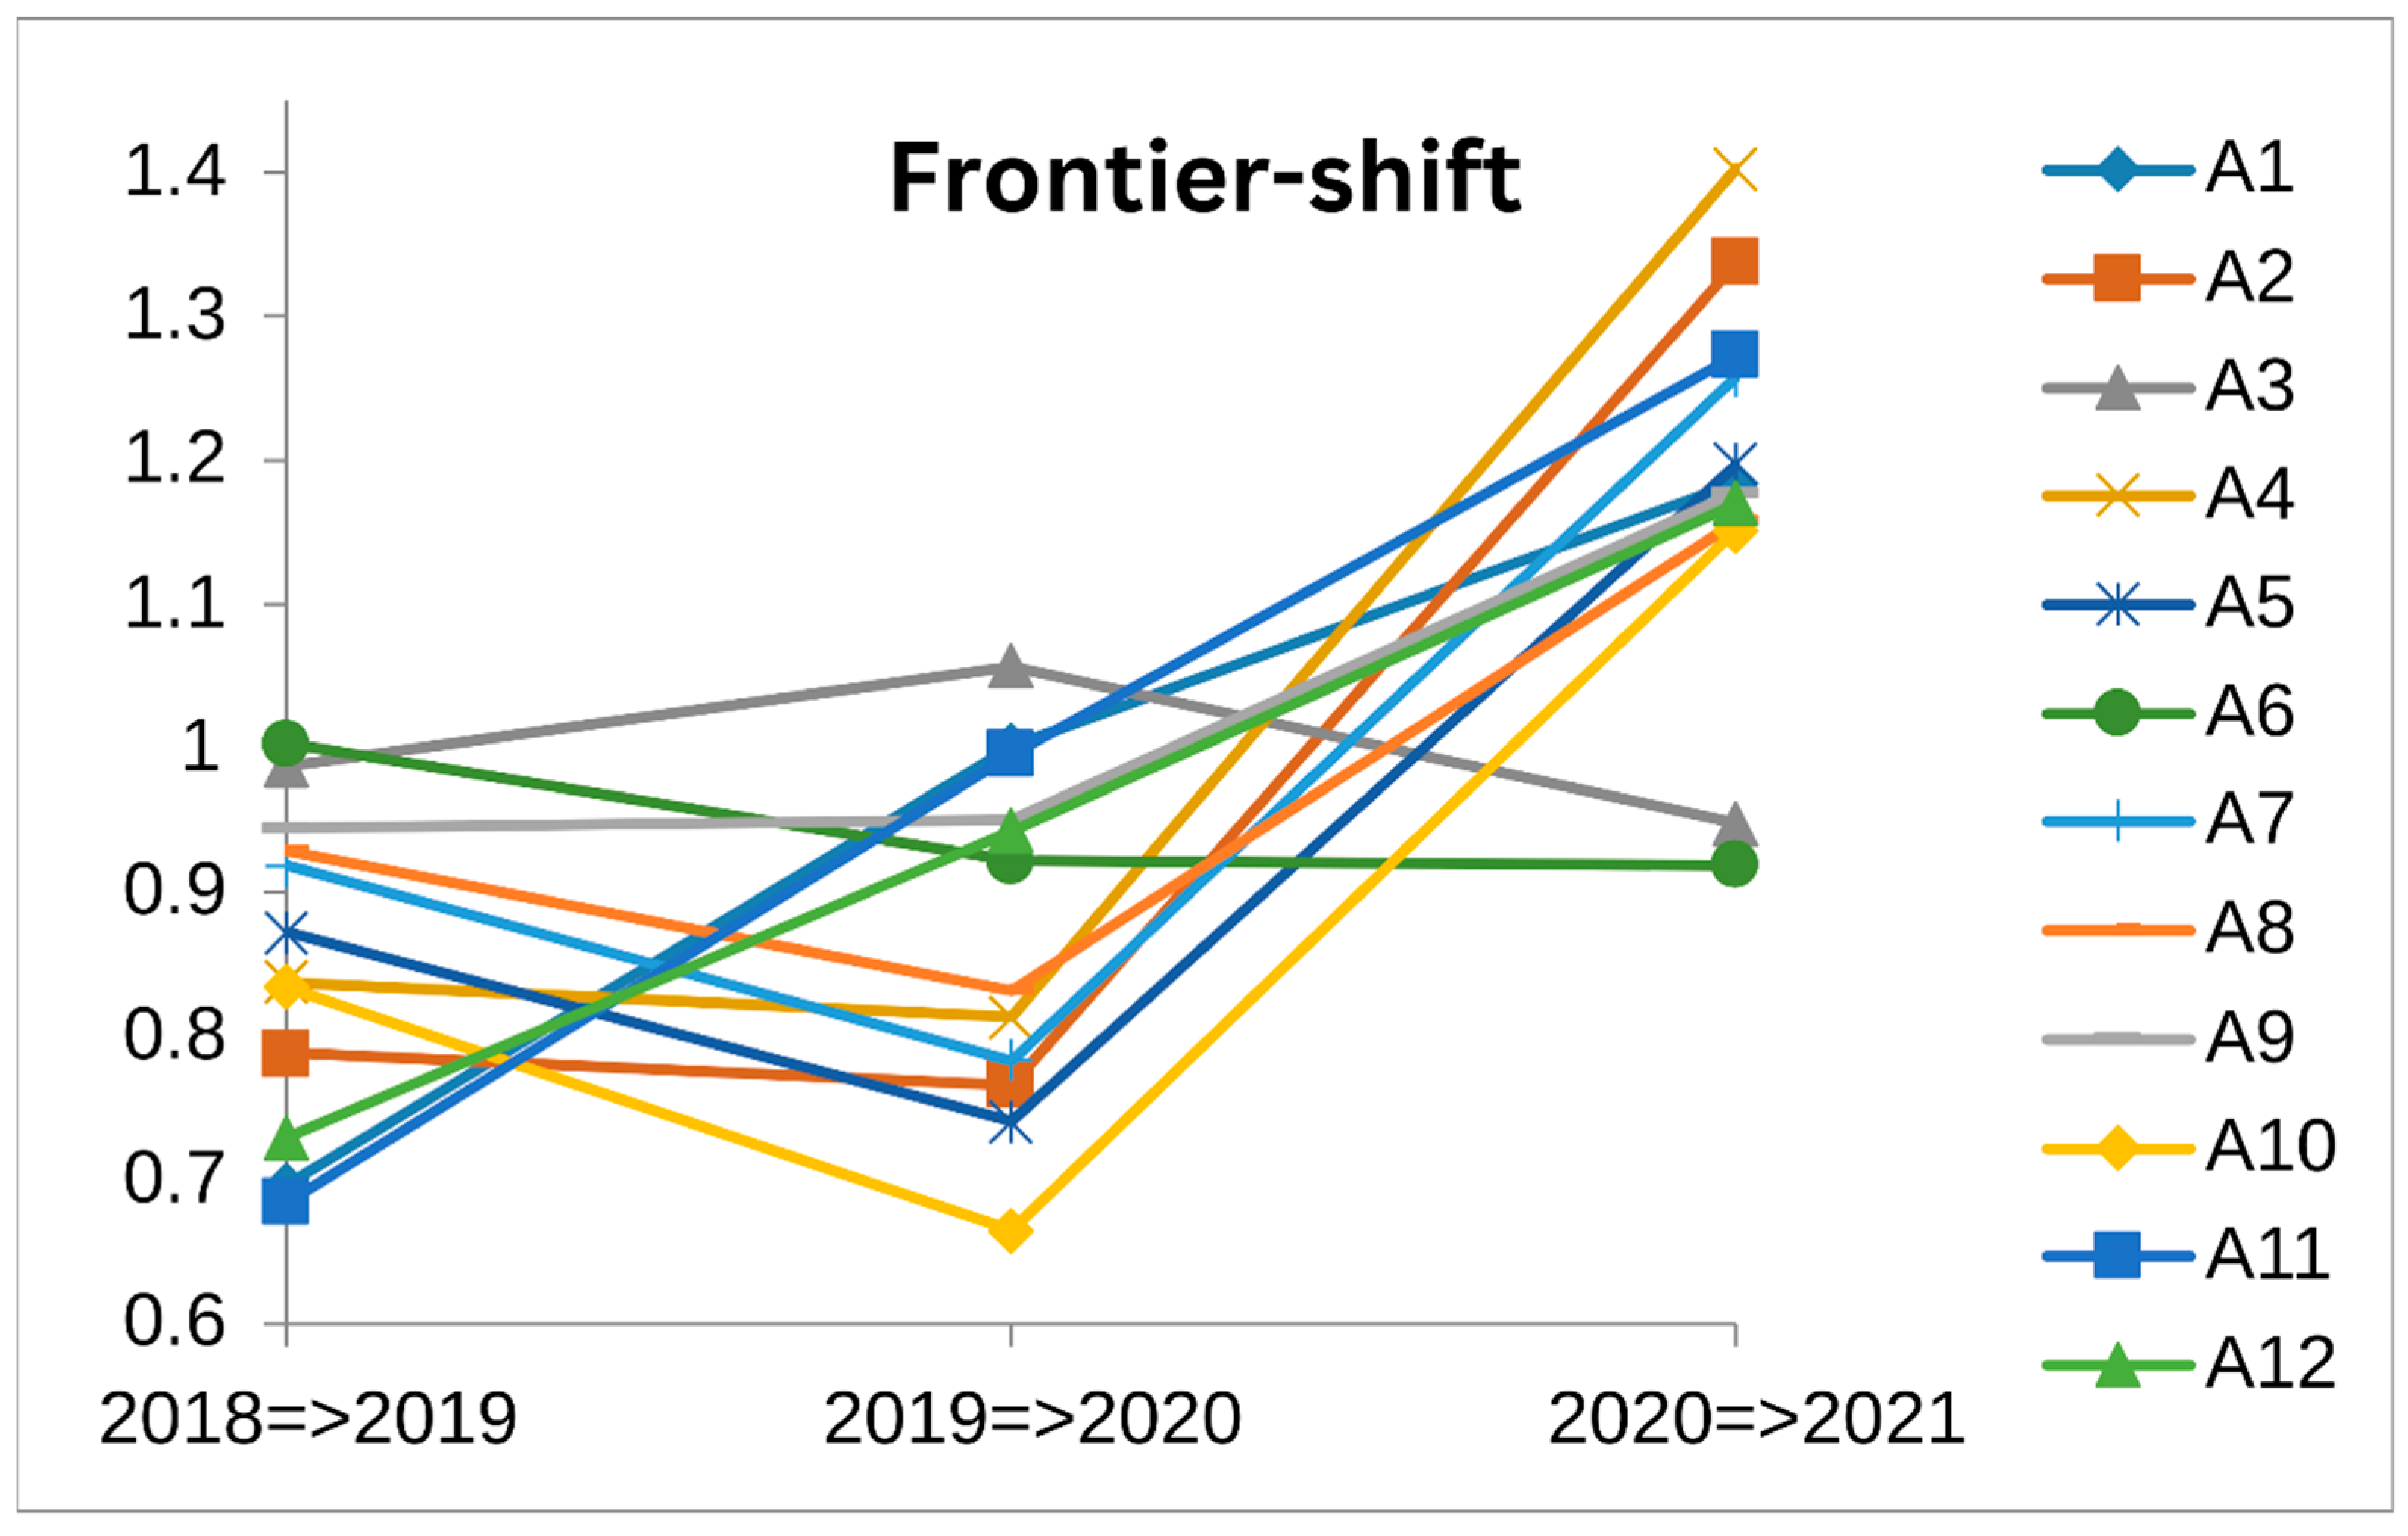
Figure 5). However, in this increasingly computerized world, it is notable that technical developments have more unpredictable trends, which indicates how innovation in technology affects the performance of LIB manufacturers and the global lithium-ion batteries supply chain. On average, all DMUs advanced technologically throughout the research period. Looking at the catch-up index, which depicts the variation in operational efficiency, three DMUs (A10, A8, and A2) stand out for their remarkable technological efficiency. However, the performance of some DMUs has varied. For example, A2, A6, A7, and A8 technically peaked in 2019–2020 but fell in 2020–2021. Particularly noteworthy is A2, which declined in technological efficiency in the latter years and emerged as the least efficient producer. Only one-sixth of the evaluated firms attained the progressive average frontier change threshold, which suggests a lack of technical development in most DMUs. A4 shines as an exceptional processor, obtaining the highest score over the study period, but A3 witnessed a fall in technological progress in 2020–2021.
Our research emphasizes the significance of continuous technological innovation and flexibility in today’s continually shifting corporate world. Frontier-shift indices provide insight into the many aspects impacting technological advancement. Companies must seek to improve their technical performance to remain competitive and flourish in the long run. 
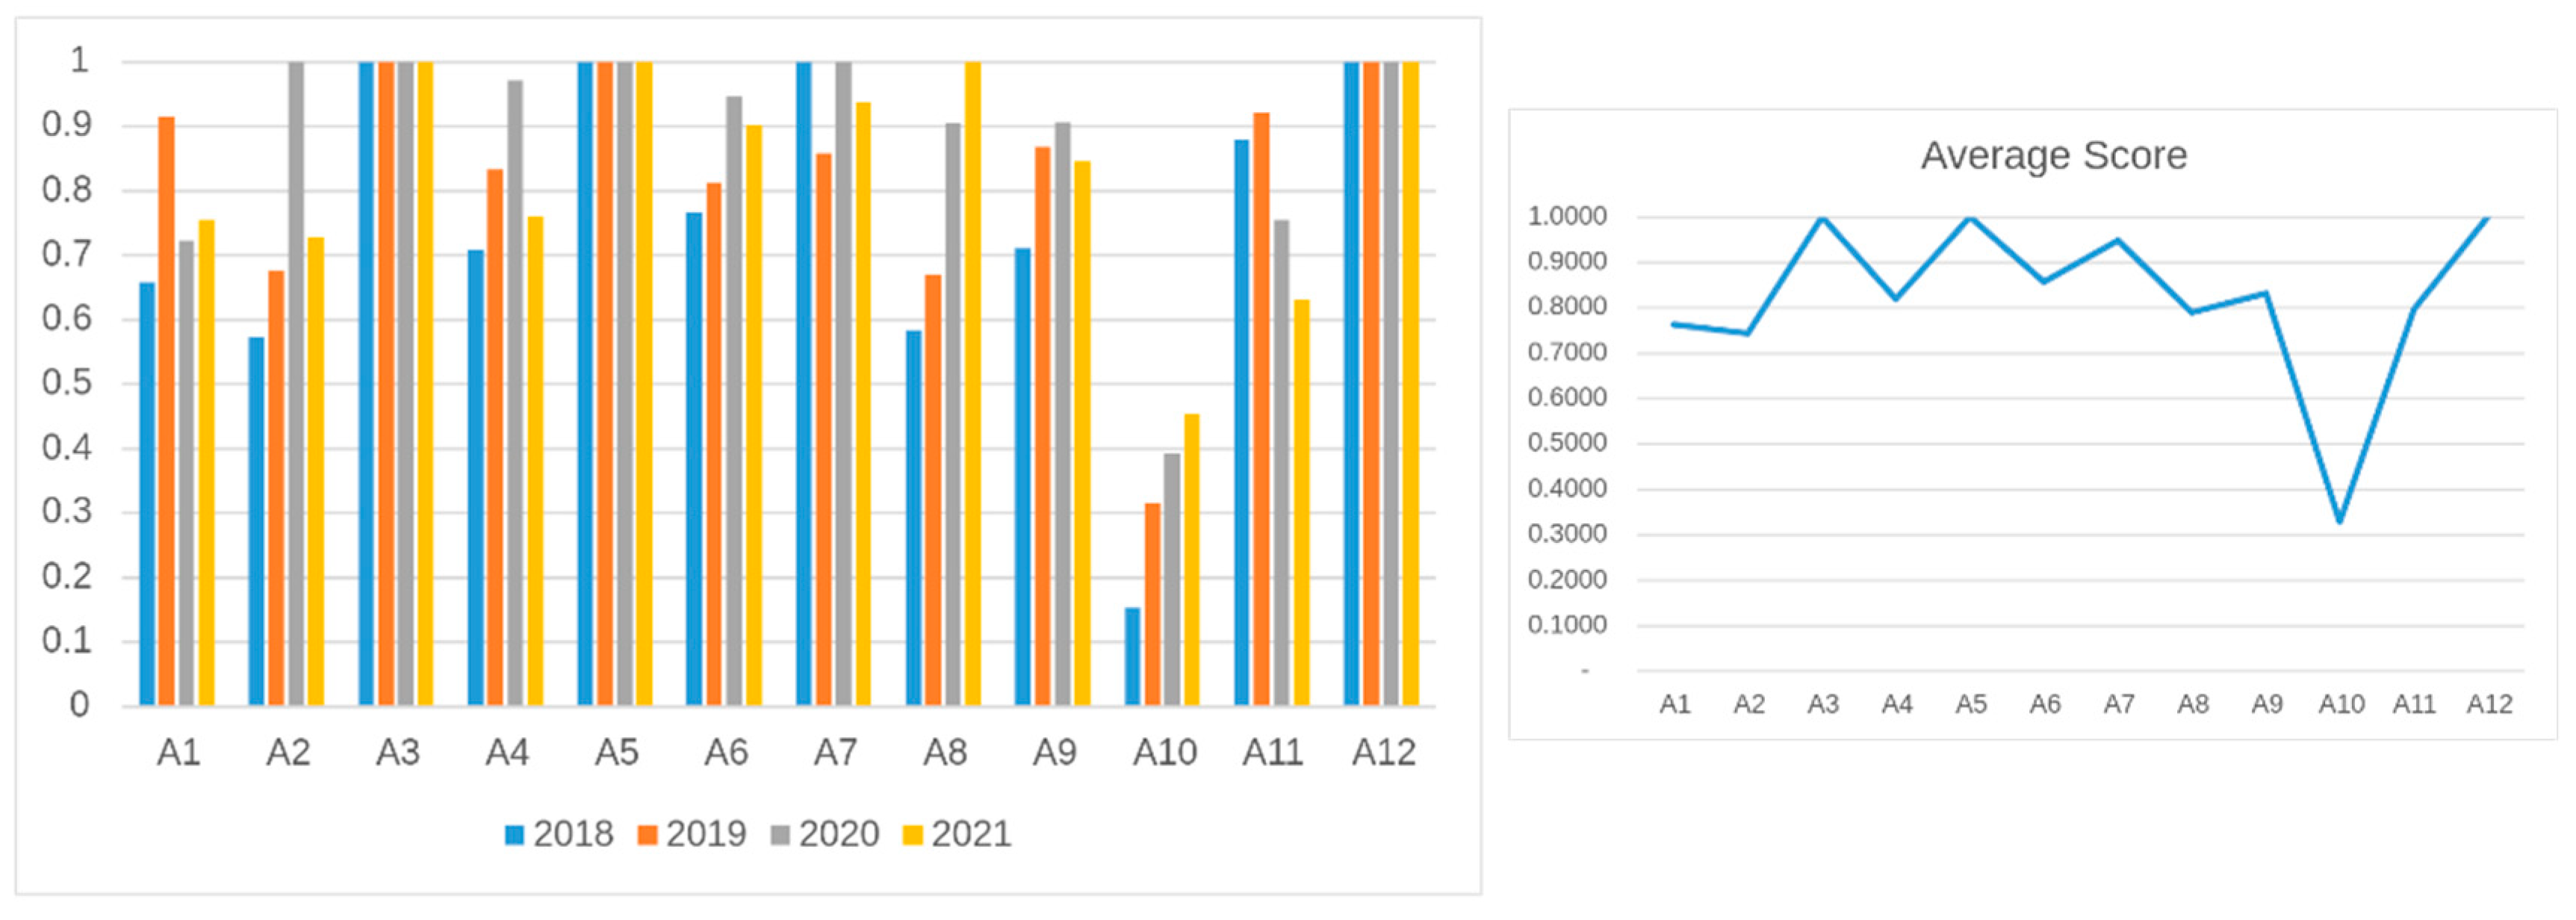
Table 6 displays the results of the EBM model, which suggest that most enterprises have reached their maximum performance levels. Based on the results of this research, A10 is an interesting case. Since A10 is the best manufacturer in the catch-up index (the average catch-up index was 1.5509 in 2018–2021), it performs the best in implementing new technologies, methods, and processes that significantly impact its overall growth and productivity. In contrast, A10 has a meager efficiency score in the EBM model (an average of 0.3290 in 2018–2021) (Figure 6). Considering financial performance, management practices, strategic alignment, and the external environment, A10 shows low allocative efficiency or ineffective management practices.
Most significantly, the worldwide economic downturn caused by COVID-19 prevented most enterprises from obtaining efficiency scores in 2018–2021 (nine out of twelve DMUs). Among LIB manufacturers with EBM efficiency scores less than 1 (A1, A2, A4, A6, A7, A8, A9, A10, A11), companies A1, A2, A4, A6, A8, A9, and A10 have an MPI larger than 1. It means that these companies show a good performance of improvements in productivity and efficiency with technological and technical aspects but have a terrible performance in achieving their objectives and maximizing their potential with given available resources.
A3, A5, and A12 are three organizations that gain the highest efficiency score in the EBM model. While A3 (0.9208) and A5 (0.8093) have an average MPI score of less than 1, A12 (1.0828) has an average MPI score more significant than 1. As a result, A3 and A5 should put more effort into adopting new production techniques, better management practices, and implementing new technologies to improve total productivity change as it enables organizations to produce more outputs with the same or fewer inputs.
Overall, A12 is the company that has a high-efficiency score in the EBM model and shows a progressive performance in total productivity change for the 2018–2021 period. The development of lithium-ion batteries is moving at a breakneck pace, and numerous types of chemistry are successfully being made available. They are the batteries used in mobile smartphones, laptops, and other portable electronic gadgets [5,51,52]. Larger projects, such as energy storage, either partially or entirely electric motors, industrial vehicles, lifts, harbors and cranes, mining vehicles, boats, and submarines, are currently in the development stage [53,54]. This research contributes to the green energy market and gives a practical and detailed approach to determining how effective LIB enterprises are at achieving their goals. The hybrid method of DEA Malmquist and the techniques of Epsilon-Based Measure (EBM) delivers an efficient and fair assessment framework that can be used to evaluate the performance of a firm and its growth in any direction.
These findings are helpful in that they can assist seaport owners in better understanding critical indicators for the growth and operation of LIB manufacturers, which in turn can lead to improved technological and technical element efficiency. Technology has become the dominant force in any sector because of the intensifying rivalry [55]. Because of this, there is a pressing need for a strategy that can be maintained to contribute to the construction of a more robust and resilient system.
The innovative comparative evaluation of LIB firms is one of the significant achievements of this research. This evaluation combines the DEA Malmquist and EBM models to determine the efficiency or inefficiency of DMUs by considering proportionate changes in inputs and outputs and the emergence of slacks. This method indicates the variety or dispersion of the data and the possibility of improving the parameters for information to the less efficient DMUs that span numerous times as well as multiple output and input variables. Additionally, this method reveals the possibility of improving parameters for inputs to the less efficient DMUs.

6. Limitations and Potential Further Research

Although DEA EBM and the DEA Malmquist model are valuable instruments for assessing performance and efficiency, their limits must be acknowledged. Subjectivity can bring bias into input and output choices in DEA EBM. Furthermore, it lacks benchmarking tools, making performance comparisons difficult. Malmquist’s paradigm implies that technology is the primary driver of productivity change, disregarding other contributing factors. Furthermore, its success depends on proper period selection to avoid incomplete or misleading outcomes. Due to data availability constraints, our analysis used a four-year time range from 2018 to 2021.
The combination of DEA EBM and the Malmquist model addresses these constraints while providing comprehensive assessment benefits. This integration makes input–output selection more objective, minimizing subjectivity in DEA EBM. The Malmquist model is used to solve the DEA EBM scalability assumption by considering fluctuations in scaling efficiency over time. Furthermore, the Malmquist model allows for performance measurement and comparison, making it simple to find areas for improvement. Combining these models provides a comprehensive analysis considering technological development and relative efficiency.
To summarize, notwithstanding its shortcomings, the combination of DEA EBM and the DEA Malmquist model provides a solid evaluation framework. This integration enhances input and output selection, addresses scaling assumptions, allows benchmarking, and offers complete performance and efficiency analysis.
The subsequent studies must consider input and output variables to provide more accurate and reliable results. Moreover, approaches to multiple-criteria decision-making (MCDM), such as TOPSIS, AHP, VIKOR, WASPAS, and COCOSO, might provide more effective answers to the problem of ordering the business units [50]. Researchers can develop more exact approaches by comparing the outcomes using the ranking similarity coefficients. The hybrid approach, which combines the DEA Malmquist and EBM models, provides a more effective and transparent evaluation process to measure companies’ performance and progress across all dimensions. This approach allows the creation of longer-term plans that contribute to the overall system’s resilience.

Author Contributions

Conceptualization, C.-N.W. and V.T.T.N.; methodology, C.-N.W.; software, N.T.M.V.; validation, V.T.T.N.; formal analysis, V.T.T.N.; resources, N.T.M.V.; data curation, V.T.T.N. and N.T.M.V.; writing—original draft, N.T.M.V.; writing—review and editing, V.T.T.N. and F.-C.Y.; supervision, F.-C.Y. and C.-N.W.; project administration, F.-C.Y. All authors have read and agreed to the published version of the manuscript.

Funding

This study did not receive any financial support from outside sources. Batteries Editorial Board funded APC.

Data Availability Statement

Provided when requested.

Acknowledgments

The authors would like to thank Ministry of Science and Technology, Taiwan. We also would like to thank the National Kaohsiung University of Science and Technology, Industrial University of Ho Chi Minh City, and Thu Dau Mot University for their assistance. Additionally, we would like to thank the reviewers and editors for their constructive comments and suggestions to improve our work.

Conflicts of Interest

The authors declare no conflict to interest.

Appendix A

Table A1. Input–output correlation (2018–2021).
PeriodInputs/OutputAssets (TOA)Liabilities (LIA)Selling, General & Administrative ExpensesRevenue (REV)Gross Income (GI)
(SG&AE)
2018TOA10.94740.79230.81910.8297
LIA0.947410.85830.8080.8493
SG&AE0.79230.858310.81520.9802
REV0.81910.8080.815210.8579
GI0.82970.84930.98020.85791
2019TOA10.95410.7880.85010.8145
LIA0.954110.77990.85350.7865
SG&AE0.7880.779910.83740.9861
REV0.85010.85350.837410.8587
GI0.81450.78650.98610.85871
2020TOA10.97640.71840.85530.021
LIA0.976410.78130.91610.034
SG&AE0.71840.781310.90310.2018
REV0.85530.91610.903110.0994
GI0.0210.0340.20180.09941
2021TOA10.97180.68030.91650.808
LIA0.971810.62990.86530.7216
SG&AE0.68030.629910.79420.9335
REV0.91650.86530.794210.8597
GI0.8080.72160.93350.85971
Table A2. EBM model’s Diversity matrix (2018–2021).
PeriodInputs/OutputAssets (TOA)Liabilities (LIA)Selling, General & Administrative Expenses (SG&AE)
2018TOA-0.19770.2377
LIA0.1977-0.2187
SG&AE0.23770.2187-
2019TOA-0.14040.2218
LIA0.1404-0.2628
SG&AE0.22180.2628-
2020TOA-0.17820.2195
LIA0.1782-0.2422
SG&AE0.21950.2422-
2021TOA-0.24780.2008
LIA0.2478-0.2192
SG&AE0.20080.2192-
Table A3. EBM model’s Affinity matrix (2018–2021).
PeriodInputs/OutputAssets (TOA)Liabilities (LIA)Selling, General & Administrative Expenses (SG&AE)
2018TOA1.00000.60450.5247
LIA0.60451.00000.5627
SG&AE0.52470.56271.0000
2019TOA1.00000.71920.5565
LIA0.71921.00000.4744
SG&AE0.55650.47441.0000
2020TOA1.00000.64370.5610
LIA0.64371.00000.5156
SG&AE0.56100.51561.0000
2021TOA1.00000.50440.5985
LIA0.50441.00000.5616
SG&AE0.59850.56161.0000

References

  1. Bridge, G.; Faigen, E. Towards the lithium-ion battery production network: Thinking beyond mineral supply chains. Energy Res. Soc. Sci. 2022, 89, 102659. [Google Scholar] [CrossRef]
  2. Lithium-Ion Battery Market Size, Share & COVID-19 Impact Analysis. Available online: https://www.fortunebusinessinsights.com/industry-reports/lithium-ion-battery-market-100123 (accessed on 20 March 2023).
  3. Chordia, M.; Nordelöf, A.; Ellingsen, L.A.-W. Environmental life cycle implications of upscaling lithium-ion battery production. Int. J. Life Cycle Assess. 2021, 26, 2024–2039. [Google Scholar] [CrossRef]
  4. Duan, J.; Tang, X.; Dai, H.; Yang, Y.; Wu, W.; Wei, X.; Huang, Y. Building safe lithium-ion batteries for electric vehicles: A review. Electrochem. Energy Rev. 2020, 3, 1–42. [Google Scholar] [CrossRef] [Green Version]
  5. Kurland, S.D. Energy use for GWh-scale lithium-ion battery production. Environ. Res. Commun. 2019, 2, 012001. [Google Scholar] [CrossRef]
  6. Chapman, A.; Arendorf, J.; Castella, T.; Thompson, P.; Willis, P.; Espinoza, L.T.; Klug, S.; Wichmann, E. Study on Critical Raw Materials at EU Level; Oakdene Hollins: Buckinghamshire, UK, 2013. [Google Scholar]
  7. Zhang, X.; Li, Z.; Luo, L.; Fan, Y.; Du, Z. A review on thermal management of lithium-ion batteries for electric vehicles. Energy 2022, 238, 121652. [Google Scholar] [CrossRef]
  8. Cairns, E.J.; Albertus, P. Batteries for electric and hybrid-electric vehicles. Annu. Rev. Chem. Biomol. Eng. 2010, 1, 299–320. [Google Scholar] [CrossRef]
  9. Velázquez-Martínez, O.; Valio, J.; Santasalo-Aarnio, A.; Reuter, M.; Serna-Guerrero, R. A critical review of lithium-ion battery recycling processes from a circular economy perspective. Batteries 2019, 5, 68. [Google Scholar] [CrossRef] [Green Version]
  10. Ding, Y.; Chen, X.; Wang, J. Deep Reinforcement Learning-Based Method for Joint Optimization of Mobile Energy Storage Systems and Power Grid with High Renewable Energy Sources. Batteries 2023, 9, 219. [Google Scholar] [CrossRef]
  11. Mohanty, D.; Chen, S.-Y.; Hung, I.-M. Effect of Lithium Salt Concentration on Materials Characteristics and Electrochemical Performance of Hybrid Inorganic/Polymer Solid Electrolyte for Solid-State Lithium-Ion Batteries. Batteries 2022, 8, 173. [Google Scholar] [CrossRef]
  12. Dunn, J.B.; Gaines, L.; Sullivan, J.; Wang, M.Q. Impact of recycling on cradle-to-gate energy consumption and greenhouse gas emissions of automotive lithium-ion batteries. Environ. Sci. Technol. 2012, 46, 12704–12710. [Google Scholar] [CrossRef]
  13. Emilsson, E.; Dahllöf, L. Lithium-Ion Vehicle Battery Production-Status 2019 on Energy Use, CO2 Emissions, Use of Metals, Products Environmental Footprint, and Recycling; IVL Svenska Miljöinstitutet: Stockholm, Sweden, 2019. [Google Scholar]
  14. Yu, M.L.; Jin, H.; Zhang, H.J.; Chong, A.Y.L. ICT, Financial Development and Renewable Energy Consumption. J. Comput. Inf. Syst. 2023, 63, 190–203. [Google Scholar] [CrossRef]
  15. Saranga, H. The Indian auto component industry–Estimation of operational efficiency and its determinants using DEA. Eur. J. Oper. Res. 2009, 196, 707–718. [Google Scholar] [CrossRef]
  16. Tone, K.; Tsutsui, M. An epsilon-based measure of efficiency in DEA—A third pole of technical efficiency. Eur. J. Oper. Res. 2010, 207, 1554–1563. [Google Scholar] [CrossRef]
  17. Charnes, A.; Cooper, W.W.; Rhodes, E. Measuring the efficiency of decision making units. Eur. J. Oper. Res. 1978, 2, 429–444. [Google Scholar] [CrossRef]
  18. Chen, K.; Ren, X.T.; Yang, G.L.; Qin, H.B. The other side of the coin: The declining of Chinese social science. Scientometrics 2022, 127, 127–143. [Google Scholar] [CrossRef]
  19. Chen, X.; Liu, Z.; Saydaliev, H.B.; Abu Hatab, A.; Fang, W. Measuring Energy Efficiency Performance in China: Do Technological and Environmental Concerns Matter for Energy Efficiency? Front. Energy Res. 2021, 9, 779032. [Google Scholar] [CrossRef]
  20. Chen, Y.W.; Yang, R.; Wong, C.W.Y.; Ji, J.W.; Miao, X. Efficiency and productivity of air pollution control in Chinese cities. Sustain. Cities Soc. 2022, 76, 103423. [Google Scholar] [CrossRef]
  21. Mykhalovskiy, E.; Weir, L. The problem of evidence-based medicine: Directions for social science. Soc. Sci. Med. 2004, 59, 1059–1069. [Google Scholar] [CrossRef]
  22. Li, Y.; Chiu, Y.-h.; Liu, Y.; Lin, T.-Y.; Chang, T.-H. The impact of the media and environmental pollution on the economy and health using a modified meta 2-stage EBM Malmquist model. Inq. J. Heal. Care Organ. Provis. Financ. 2020, 57, 0046958020921070. [Google Scholar] [CrossRef]
  23. Rusli, N.A.E.; Ramli, N.A.; Shariff, S.S.R.; Zahid, Z.; Hussin, S.A.S. Evaluating the efficiency and productivity of Malaysian logistics companies using epsilon-based measure and Malmquist index during the Covid-19 pandemic. J. Ind. Eng. Manag. 2022, 15, 521–537. [Google Scholar]
  24. Qin, Q.D.; Li, X.; Li, L.; Zhen, W.; Wei, Y.M. Air emissions perspective on energy efficiency: An empirical analysis of China’s coastal areas. Appl. Energy 2017, 185, 604–614. [Google Scholar] [CrossRef]
  25. Yang, W.P.; Zhao, B.Y.; Zhao, J.K.; Li, Z.D. An Empirical Study on the Impact of Foreign Strategic Investment on Banking Sustainability in China. Sustainability 2019, 11, 181. [Google Scholar] [CrossRef] [Green Version]
  26. Cheng, S.X.; Xie, J.H.; Xiao, D.; Zhang, Y. Measuring the Environmental Efficiency and Technology Gap of PM2.5 in China’s Ten City Groups: An Empirical Analysis Using the EBM Meta-Frontier Model. Int. J. Environ. Res. Public Health 2019, 16, 675. [Google Scholar] [CrossRef] [PubMed] [Green Version]
  27. Lu, L.; Zhang, J.J.; Yang, F.; Zhang, Y.J. Evaluation and prediction on total factor productivity of Chinese petroleum companies via three-stage DEA model and time series neural network model. Sustain. Comput. Inform. Syst. 2020, 27, 100397. [Google Scholar] [CrossRef]
  28. Nguyen, P.H.; Nguyen, T.L.; Nguyen, T.G.; Nguyen, D.T.; Tran, T.H.; Le, H.C.; Phung, H.T. A Cross-Country European Efficiency Measurement of Maritime Transport: A Data Envelopment Analysis Approach. Axioms 2022, 11, 206. [Google Scholar] [CrossRef]
  29. Färe, R.; Grosskopf, S. Malmquist productivity indexes and Fisher ideal indexes. Econ. J. 1992, 102, 158–160. [Google Scholar] [CrossRef]
  30. Golany, B.; Roll, Y. An application procedure for DEA. Omega 1989, 17, 237–250. [Google Scholar] [CrossRef]
  31. Färe, R.; Grosskopf, S.; Lindgren, B.; Roos, P. Productivity developments in Swedish hospitals: A Malmquist output index approach. In Data Envelopment Analysis: Theory, Methodology, and Applications; Springer: Berlin/Heidelberg, Germany, 1994; pp. 253–272. [Google Scholar]
  32. Bai, H.; Fan, Y.; Wang, L.; Vo, N.V.T.; Nguyen, T.V.T. Research on Battery Characteristics and Management System of New Energy Vehicle Based on BMS System Design and Test. Comput. Aided Des. Appl. 2023, 20 (Suppl. S3), 200–212. [Google Scholar] [CrossRef]
  33. Kulshreshtha, M.; Parikh, J. Study of efficiency and productivity growth in opencast and underground coal mining in India: A DEA analysis. Energy Econ. 2002, 24, 439–453. [Google Scholar] [CrossRef]
  34. Ahn, T.; Charnes, A.; Cooper, W.W. Efficiency characterizations in different DEA models. Socio-Econ. Plan. Sci. 1988, 22, 253–257. [Google Scholar] [CrossRef]
  35. Tavana, M.; Mirzagoltabar, H.; Mirhedayatian, S.M.; Saen, R.F.; Azadi, M. A new network epsilon-based DEA model for supply chain performance evaluation. Comput. Ind. Eng. 2013, 66, 501–513. [Google Scholar] [CrossRef]
  36. Xiao, Q.W.; Tian, Z.; Ren, F.R. Efficiency assessment of electricity generation in China using meta-frontier data envelopment analysis: Cross-regional comparison based on different electricity generation energy sources. Energy Strategy Rev. 2022, 39, 100767. [Google Scholar] [CrossRef]
  37. Yao, L.M.; Shuai, Y.H.; Chen, X.D.; Xiao, A.R. A two-stage EBM-based approach to evaluate operational performance of unattended convenience store. Int. J. Retail. Distrib. 2020, 48, 609–627. [Google Scholar] [CrossRef]
  38. Ting, I.W.K.; Chen, F.C.; Kweh, Q.L.; Sui, H.J.; Le, H.T.M. Intellectual capital and bank branches’ efficiency: An integrated study. J Intellect. Cap. 2021, 23, 840–863. [Google Scholar] [CrossRef]
  39. Wang, C.N.; Day, J.D.; Nguyen, T.K.L. Applying EBM Model and Grey Forecasting to Assess Efficiency of Third-Party Logistics Providers. J. Adv. Transp. 2018, 2018, 1212873. [Google Scholar] [CrossRef]
  40. Agostino, M.; Nifo, A.; Ruberto, S.; Scalera, D.; Trivieri, F. Productivity changes in the automotive industry of three European countries. An application of the Malmquist index decomposition analysis. Struct. Chang. Econ. Dyn. 2022, 61, 216–226. [Google Scholar] [CrossRef]
  41. Pan, Z.W.; Tang, D.C.; Kong, H.J.; He, J.X. An Analysis of Agricultural Production Efficiency of Yangtze River Economic Belt Based on a Three-Stage DEA Malmquist Model. Int. J. Environ. Res. Public Health 2022, 19, 958. [Google Scholar] [CrossRef]
  42. Homburg, C. Using data envelopment analysis to benchmark activities. Int. J. Prod. Econ. 2001, 73, 51–58. [Google Scholar] [CrossRef]
  43. Zhou, G.G.; Min, H.; Xu, C.; Cao, Z.Y. Evaluating the comparative efficiency of Chinese third-party logistics providers using data envelopment analysis. Int. J. Phys. Distrib. Logist. Manag. 2008, 38, 262–279. [Google Scholar] [CrossRef]
  44. Lu, W.M.; Hung, S.W. Exploring the efficiency and effectiveness in global e-retailing companies. Comput. Oper. Res. 2011, 38, 1351–1360. [Google Scholar] [CrossRef]
  45. Park, H.G.; Lee, Y.J. The efficiency and productivity analysis of large logistics providers services in Korea. Asian J. Shipp. Logist. 2015, 31, 469–476. [Google Scholar] [CrossRef] [Green Version]
  46. Chen, Q.; Li, F. Empirical analysis on efficiency of listed real estate companies in China by DEA. Ibusiness 2017, 9, 49. [Google Scholar] [CrossRef] [Green Version]
  47. Ahmed, A.A.; Mohamad, A. Data envelopment analysis of efficiency of real estate investment trusts in Singapore. Int. J. Law Manag. 2017, 59, 826–838. [Google Scholar] [CrossRef]
  48. Shah, A.A.; Wu, D.; Korotkov, V. Are sustainable banks efficient and productive? A data envelopment analysis and the Malmquist productivity index analysis. Sustainability 2019, 11, 2398. [Google Scholar] [CrossRef] [Green Version]
  49. Atta Mills, E.F.E.; Baafi, M.A.; Liu, F.; Zeng, K. Dynamic operating efficiency and its determining factors of listed real-estate companies in China: A hierarchical slack-based DEA-OLS approach. Int. J. Financ. Econ. 2021, 26, 3352–3376. [Google Scholar] [CrossRef]
  50. Wang, C.N.; Yang, F.C.; Vo, N.T.M.; Nguyen, V.T.T. Wireless Communications for Data Security: Efficiency Assessment of Cybersecurity Industry-A Promising Application for UAVs. Drones 2022, 6, 363. [Google Scholar] [CrossRef]
  51. Meng, F.; McNeice, J.; Zadeh, S.S.; Ghahreman, A. Review of lithium production and recovery from minerals, brines, and lithium-ion batteries. Miner. Process. Extr. Metall. Rev. 2021, 42, 123–141. [Google Scholar] [CrossRef]
  52. Schnell, J.; Nentwich, C.; Endres, F.; Kollenda, A.; Distel, F.; Knoche, T.; Reinhart, G. Data mining in lithium-ion battery cell production. J. Power Sources 2019, 413, 360–366. [Google Scholar] [CrossRef]
  53. Dai, Q.; Kelly, J.C.; Gaines, L.; Wang, M. Life cycle analysis of lithium-ion batteries for automotive applications. Batteries 2019, 5, 48. [Google Scholar] [CrossRef] [Green Version]
  54. Hüger, E.; Riedel, L.; Zhu, J.; Stahn, J.; Heitjans, P.; Schmidt, H. Lithium Niobate for Fast Cycling in Li-ion Batteries: Review and New Experimental Results. Batteries 2023, 9, 244. [Google Scholar] [CrossRef]
  55. Balan, S.; Conlon, S. Text Analysis of Green Supply Chain Practices in Healthcare. J. Comput. Inf. Syst. 2018, 58, 30–38. [Google Scholar] [CrossRef]
Figure 1. The research framework for a lithium-ion industry assessment.
Batteries 09 00317 g001
Figure 2. Low and high scattering of the obtained statistic.
Batteries 09 00317 g002
Figure 3. Changes in technical efficiency (catch-up).
Batteries 09 00317 g003
Figure 4. Technological change (Frontier-shift).
Batteries 09 00317 g004
Figure 5. Malmquist Productivity Index.
Batteries 09 00317 g005
Figure 6. Ranking of LIB manufacturers.
Batteries 09 00317 g006
Table 1. List of DMUs and their market cap (data up to 7 April 2023).
DMUsCompany NameMarket Cap (USD)
A1Contemporary Amperex Technology Co., Ltd.282.79 B
A2BYD Company Ltd.138.64 B
A3Panasonic Corporation29.39 B
A4Samsung SDI Co., Ltd.40.14 B
A5SK Innovation Co., Ltd.21.07 B
A6Toshiba Corporation18.16 B
A7LG Chem Ltd.48.07 B
A8Tesla Inc.746.27 B
A9Johnson Controls49.25 B
A10Nio Inc.95.77 B
A11Albemarle Corp.24.77 B
A12Sociedad Quimica y Minera De Chile SQM SA9.35 B
Table 2. Previous studies’ input and output criteria.
Author/ReferenceInputs/CriteriaOutputs/ResponsesMethodologiesApplied Areas
[43]“Net fixed assets, Salaries and wages, Operating expenses, Current liabilities”“Operating income”“CCR, BCC”Logistics
[44]“Operating expenses, Liability, Equity, Employee”“Net income, Net sales, Intangible value, Market value” E-retailing
[45]“Assets, Capital, Number of employees”“Total revenue”“CCR, BCC, Malmquist”Logistics
[46]“Business cost, Total assets, Employees number”“Business income, Gross profit, Return on equity”“CCR, BCC”Real estate
[47]“Management fees, Operating expenses, Interest expenses”“Total assets, Net assets value, Total revenue”“Malmquist model”
[48]“Assets, Equity, Employees, Expense”“Revenue, Profit”“CCR, MalmquistBanking
[49]“Assets, Capital, Operating cost, Employees number”“Revenue, Gross profit, Return on equity”SBM, Regression model”Real estate
[50]“Assets, Liabilities, Operating Expenses”“Revenue, Gross Profit”“DEA Malmquist, DEA Window”Aviation
This paper“Assets, Liabilities, SG&A Expenses”“Revenue, Gross Income”“DEA Malmquist, EBM”Energy
Table 3. Statistical data of LIB companies’ input and output (2018–2021).
YearStatisticsAssetsLiabilitiesSG&A ExpenseRevenueGross Income
2018Max48,80032,23513,51958,33116,520
Min2759151396752(92)
Average22,90913,924327118,8114135
SD14,80810,479367516,9134403
2019Max43,92628,71913,51958,47815,936
Min20942338941138(250)
Average23,38714,074337219,2823964
SD13,4698749365516,2884260
2020Max52,15029,66912,64554,75014,840
Min40972314911666(251,984)
Average26,44015,266325719,025(16,918)
SD14,3938942341214,83570,986
2021Max62,13030,55011,25753,82013,610
Min715339811022523960
Average33,24218,922359624,2365449
SD16,7619952309716,4644326
Table 4. Changes in technical efficiency for the period 2018–2021.
Catch-Up2018 to 20192019 to 20202020 to 2021Average
  A11.49260.75671.03111.0935
  A21.20731.67930.68041.1890
  A31.06150.77900.94010.9268
  A41.13381.39680.71151.0807
  A50.83050.63891.02830.8326
  A61.02141.21110.97541.0693
  A70.74761.30730.89890.9846
  A81.08391.48611.29211.2874
  A91.08911.10910.96871.0556
  A101.71531.70901.22831.5509
  A111.14080.80890.83360.9278
  A120.89641.14771.29321.1124
  Average1.11831.16920.99011.0925
  Max1.71531.70901.29321.5509
  Min0.74760.63890.68040.8326
  SD0.26790.36460.20280.1892
Table 5. Technological change for the period 2018–2021.
Frontier2018 => 20192019 => 20202020 => 2021Average
A10.69621.00121.18400.9605
A20.78780.76621.33730.9638
A30.98761.05660.94770.9973
A40.83740.81301.40291.0177
A50.87150.74071.19710.9364
A61.00330.92160.91850.9478
A70.91830.78271.25830.9864
A80.92850.83181.15740.9726
A90.94430.94991.17751.0239
A100.83360.66461.15150.8833
A110.68450.99571.27280.9843
A120.72920.94261.16990.9472
Average0.85190.87221.18120.9684
Max1.00331.05661.40291.0239
Min0.68450.66460.91850.8833
SD0.10970.12210.13920.0383
Table 6. Total productivity change from 2018 to 2021.
Malmquist2018 to 20192019 to 20202020 to 2021Average
A11.03920.75761.22081.0059
A20.95121.28660.90991.0492
A31.04830.82310.89090.9208
A40.94941.13550.99811.0277
A50.72380.47331.23100.8093
A61.02471.11620.89581.0122
A70.68661.02331.13110.9470
A81.00651.23611.49541.2460
A91.02841.05361.14061.0742
A101.43001.13581.41441.3267
A110.78090.80541.06110.8825
A120.65361.08181.51301.0828
Average0.94350.99401.15851.0320
Max1.43001.28661.51301.3267
Min0.65360.47330.89090.8093
SD0.21310.23420.22410.1446
Table 7. EBM Approach’s Weight of Input and Epsilon (2018–2021).
YearWeight to InputEpsilon for EBM
AssetsLiabilitiesSG&A Expense
20180.33380.34100.32520.4357
20190.35380.34060.30560.4136
20200.34440.33630.31920.4257
20210.33230.32450.34320.4447
Table 8. The efficiency score of the EBM model (2018–2021).
DMUs2018201920202021Average
A10.65880.9150.72280.75450.7628
A20.57240.675610.72830.7441
A311111.0000
A40.70950.83330.97110.76070.8187
A511111.0000
A60.7670.81290.94610.90270.8572
A710.857610.93730.9487
A80.58410.66930.905510.7897
A90.71030.86790.90660.84510.8325
A100.15320.31610.39250.4540.3290
A110.87990.92170.75520.63060.7969
A1211111
Disclaimer/Publisher’s Note: The statements, opinions and data contained in all publications are solely those of the individual author(s) and contributor(s) and not of MDPI and/or the editor(s). MDPI and/or the editor(s) disclaim responsibility for any injury to people or property resulting from any ideas, methods, instructions or products referred to in the content.

