Article

Modeling Anisotropic Transport in Polycrystalline Battery Materials

1
Institute of Nanotechnology (INT), Karlsruhe Institute of Technology, Hermann-von-Helmholtz-Platz 1, 76344 Eggenstein-Leopoldshafen, Germany
2
Institute for Applied Materials (IAM-MMS), Karlsruhe Institute of Technology, Strasse am Forum 7, 76131 Karlsruhe, Germany
3
Institute of Digital Materials Science (IDM), Karlsruhe University of Applied Sciences, Moltkestrasse 30, 76133 Karlsruhe, Germany
*
Authors to whom correspondence should be addressed.
Batteries 2023, 9(6), 310; https://doi.org/10.3390/batteries9060310
Submission received: 14 April 2023 / Revised: 24 May 2023 / Accepted: 26 May 2023 / Published: 5 June 2023
(This article belongs to the Special Issue Materials Design for Electrochemical Energy Storage)

Abstract

:
Hierarchical structures of many agglomerated primary crystals are often employed as cathode materials, especially for layered-oxide compounds. The anisotropic nature of these materials results in a strong correlation between particle morphology and ion transport. In this work, we present a multiphase-field framework that is able to account for strongly anisotropic diffusion in polycrystalline materials. Various secondary particle structures with random grain orientation as well as strongly textured samples are investigated. The observed ion distributions match well with the experimental observations. Furthermore, we show how these simulations can be used to mimic potentiostatic intermittent titration technique (PITT) measurements and compute effective diffusion coefficients for secondary particles. The results unravel the intrinsic relation between particle microstructure and the apparent diffusivity. Consequently, the modeling framework can be employed to guide the microstructure design of secondary battery particles. Furthermore, the phase-field method closes the gap between computation of diffusivities on the atomistic scale and the effective properties of secondary particles, which are a necessary input for Newman-type cell models.

1. Introduction

Layered oxides are an important material class for lithium as well as sodium ion intercalation batteries [1]. Their stoichiometry is described by the generalized formula A X MO 2 , where A is the intercalated ion and M stands for one or various transition metals such as Ni, Mn, or Co [2]. The crystal structure consists of MO 2 sheets with A-ions between these layers, thus resulting in strongly anisotropic material properties on the single-crystalline scale. Ion diffusion is limited to the layers in a defect-free structure due to the higher energetic barrier for cross-layer hopping. This effect is mediated through crystal defects; however, diffusivities still vary by orders of magnitude between the directions normal and parallel to the layers in a real system, e.g., in LiCoO 2 [3].
Apart from the crystal structure, ion transport in electrode particles is strongly influenced by the morphology (i.e., structural appearance on the microscale). Layered-oxide compounds based on nickel, manganese, and cobalt (NMC) are state-of-the-art cathode materials for commercial lithium-ion cells in high-capacity applications such as electric vehicles [4]. Typically, NMCs form hierarchical structures of hundreds of primary crystals agglomerated in a spherical secondary particle with a diameter in the range of 5–10 µm, sometimes referred to as a meatball structure [5,6]. Similar secondary morphologies can be obtained for a wide range of layered-oxide cathode materials based on lithium and sodium as the inserting ion [4,7,8,9]. Ionic transport can be altered in polycrystalline materials through microstructure design such as tailoring crystallographic orientations [7,8] or introducing nanoporosity [10]. Particles consisting of radially aligned grains show excellent rate performance and improved cyclic stability [7,8]. This can be attributed to less tortuous pathways for ion transport and the increase of small-angle grain boundaries, which lead to an overall reduction of accumulated stress in grain boundaries. The same applies for the nano-porous particle morphology, as the open-pored structure significantly reduces diffusion paths within the active material compared to close-packed spherical structures.
Secondary particles tend to form intergranular cracks if the primary crystals undergo significant expansion and contraction [5]. This effect is strongly interconnected with the anisotropic nature of these materials because layered oxides typically exhibit much stronger changes in the c-axis (perpendicular to the transition metal oxide sheets). As the primary crystals are typically randomly oriented, stresses arise due to the misorientation of neighboring grains that can lead to fracture and eventually disintegration of the secondary structure [5,6,11]. Accordingly, small-angle grain boundaries are not strained as much because neighboring grains expand in a similar way.
NMC agglomerates have been modeled by Xu et al. [6] to study the formation of intergranular cracks. Even though the polycrystalline nature is accounted for, isotropic input parameters for diffusivity, Young’s modulus and volumetric expansion, which do not reflect the physical properties on the crystalline scale, were used. Additionally, a detailed investigation of the chemo-mechanical bulk behavior of NMC811 single crystals has been conducted by Lim et al. [12] in which anisotropic stiffness tensors and lattice expansions were computed from density functional theory (DFT) and, subsequently, employed in phase-field simulations. The mechanical properties from DFT [12] were, furthermore, used to study simplified secondary agglomerates consisting of 67 primary particles by Taghikhani et al. [13]. Works on other battery materials underline the importance to account for material anisotropy in terms of ion diffusion and elastic deformation [14,15,16,17].
In this work we propose the multiphase-field (MPF) method as a suitable modeling framework for the investigation of polycrystalline battery materials. Originating from the modeling of solidification [18], the MPF method was successfully applied to study microstructure evolution in polycrystalline systems such as martensitic transformations [19]. Large amounts of phases can be handled efficiently via a locally reduced order parameter scheme [20]. Computational efficiency for large structures is, furthermore, ensured through parallel computing based on message passing interface (MPI) [21]. The application to intercalation in polycrystalline battery materials has been demonstrated in our previous work [11]. A new development from previous studies is the inclusion of strongly anisotropic diffusion coefficients in microstructures composed of randomly oriented grains. While the formulation of anisotropic diffusion in terms of a partial differential equation is rather straightforward, an accurate numerical implementation, especially in the non-grid-aligned case, is surprisingly difficult. Strongly anisotropic fluxes also play a role in the simulation of plasma physics [22,23]. The heat flux in magnetized plasmas exhibits a ratio of heat conductivity coefficients in the order of 10 9 . Günter et al. [22] highlight the accuracy of a symmetric finite difference scheme in comparison with other numerical implementations especially at high anisotropy ratios. The discretization has been successfully used in subsequent works [24] and has been applied for the computation of anisotropic fluxes [25]. Based on these works, we extend the simulation framework presented in Daubner et al. [11] to account for anisotropic fluxes in hierarchical battery particles.

2. Materials and Methods

2.1. Multi-Phase Diffusion

The bulk diffusion of lithium ions inside intercalation compounds can be modeled in a similar manner as interstitial diffusion on a sublattice. In the following, all equations are expressed in terms of the local site filling fractions c. The general form of the diffusion equation that accounts for mass conservation can be expressed as
c t + · J = 0
where · ( · ) denotes the divergence operator. According to linear irreversible thermodynamics, the mass flux is taken as J = M ( c ) μ . Generally, the diffusion potential μ can include electrical, chemical, as well as mechanical effects. The gradient μ is the thermodynamic driving force for diffusion in the system. The ion mobility M depends on the site filling fraction c, and furthermore, on the crystal structure of the material.
In the context of the multiphase-field method, various phases α N are described by their local volume fractions ϕ = { ϕ α , ϕ β , , ϕ N } . In this work, ϕ is used to differentiate between grains with different orientations but with equal chemical properties. Interfaces between neighboring grains are represented by diffuse transition regions where the order parameter ϕ α varies between 0 and 1. The initial polycrystalline microstructures are created by solving the corresponding multiphase-field evolution equations [11,26,27] including only interfacial forces to create close-to-equilibrium interfaces. This work is based on a multi-obstacle potential and a gradient formulation based on dual interactions [26]. More details can be found in our previous work [11]. For the remainder of this study, we assume that no phase transformations occur during (dis-)charge. Future works could encompass the effects of cation disorder and surface densification, which has been observed in high-nickel NMCs [4] and LiNiO 2 [28] The ion diffusion in a multi-phase system is given by [29]
c t = · M ( c , ϕ ) μ
where M = α N M α ϕ α denotes the average mobility. The lithium content in interfaces is described by an interpolation of phase-specific concentrations c = α N c α ϕ α [29]. In the bulk of a grain, Equation (2) reduces to
c α t = · M α ( c α ) μ = · M α ( c α ) μ c α c α = · D α ( c α ) c α
which yields the relation M α = D α / ( μ / c α ) between mobility and chemical diffusivity D α . We employ this relation to correlate the ion mobility in simulations with measured chemical diffusivities as ( μ / c α ) , which is given from the free energy expression Equation (5). For most applications, diffusion is assumed to be ideal and isotropic, which results in a scalar diffusivity D α that is phase-wise constant. More generally, anisotropic diffusion is described by a second order tensor D α . Under the assumption that the diffusion potentials of co-existing phases are equal at any point within the diffuse interface (quasi-equilibrium condition [26]), Equation (2) can be re-written in terms of an evolution equation for the diffusion potential [29]
μ t = α N c α μ ϕ α 1 · M ( c , ϕ ) μ α N c α ϕ α t
which is computationally beneficial. Equation (4) is compatible with the simulation of phase evolution as the last term accounts for mass conservation at moving interfaces. This has been used in our previous study [11] while in this context, all phases and grain boundaries are assumed to be stationary ( ϕ α / t = 0 , α ).

2.2. Anisotropic Diffusion Tensor

As discussed in the introduction, layered-oxides exhibit strongly anisotropic properties in terms of diffusivity and lattice expansion. For orthorhombic materials with strong anisotropy, the diffusion tensor in the lattice coordinate system can be described by a diagonal tensor with three independent entries. The layered structure of NMC results in transverse isotropy, i.e., in-plane diffusion is isotropic with a diffusion coefficient of D | | , while the diffusivity along the c-axis direction D exhibits a much lower value. The diffusion tensor in material coordinates is given by
D 123 = D | | 0 0 0 D | | 0 0 0 D .
Every grain α has an individual orientation that can be described by Euler angles or quaternions with respect to the global coordinate system. Rotation of the diffusion tensor from the material to the reference coordinate system can be achieved via rotation matrices, e.g.,
R x α = 1 0 0 0 cos θ α sin θ α 0 sin θ α cos θ α , R y α = cos ψ α 0 sin ψ α 0 1 0 sin ψ α 0 cos ψ α , R z α = cos φ α sin φ α 0 sin φ α cos φ α 0 0 0 1
which, in the XYZ-convention, yields the rotation transformation
D x y z α = R z α R y α R x α D 123 ( R x α ) T ( R y α ) T ( R z α ) T .
Alternatively, the rotation can be computed based on quaternions that are more robust for arbitrary rotations [30,31] and, moreover, allow for the straight-forward interpolation of intermediate configurations. Effective material properties are computed by a mixture rule, i.e., interpolation of the phase-specific properties. Throughout this work, we employ a linear interpolation of diffusion tensors D = α N D α ϕ α weighted by the local volume fractions ϕ α . The discretization is based on the finite difference scheme described in more detail in Appendix A.

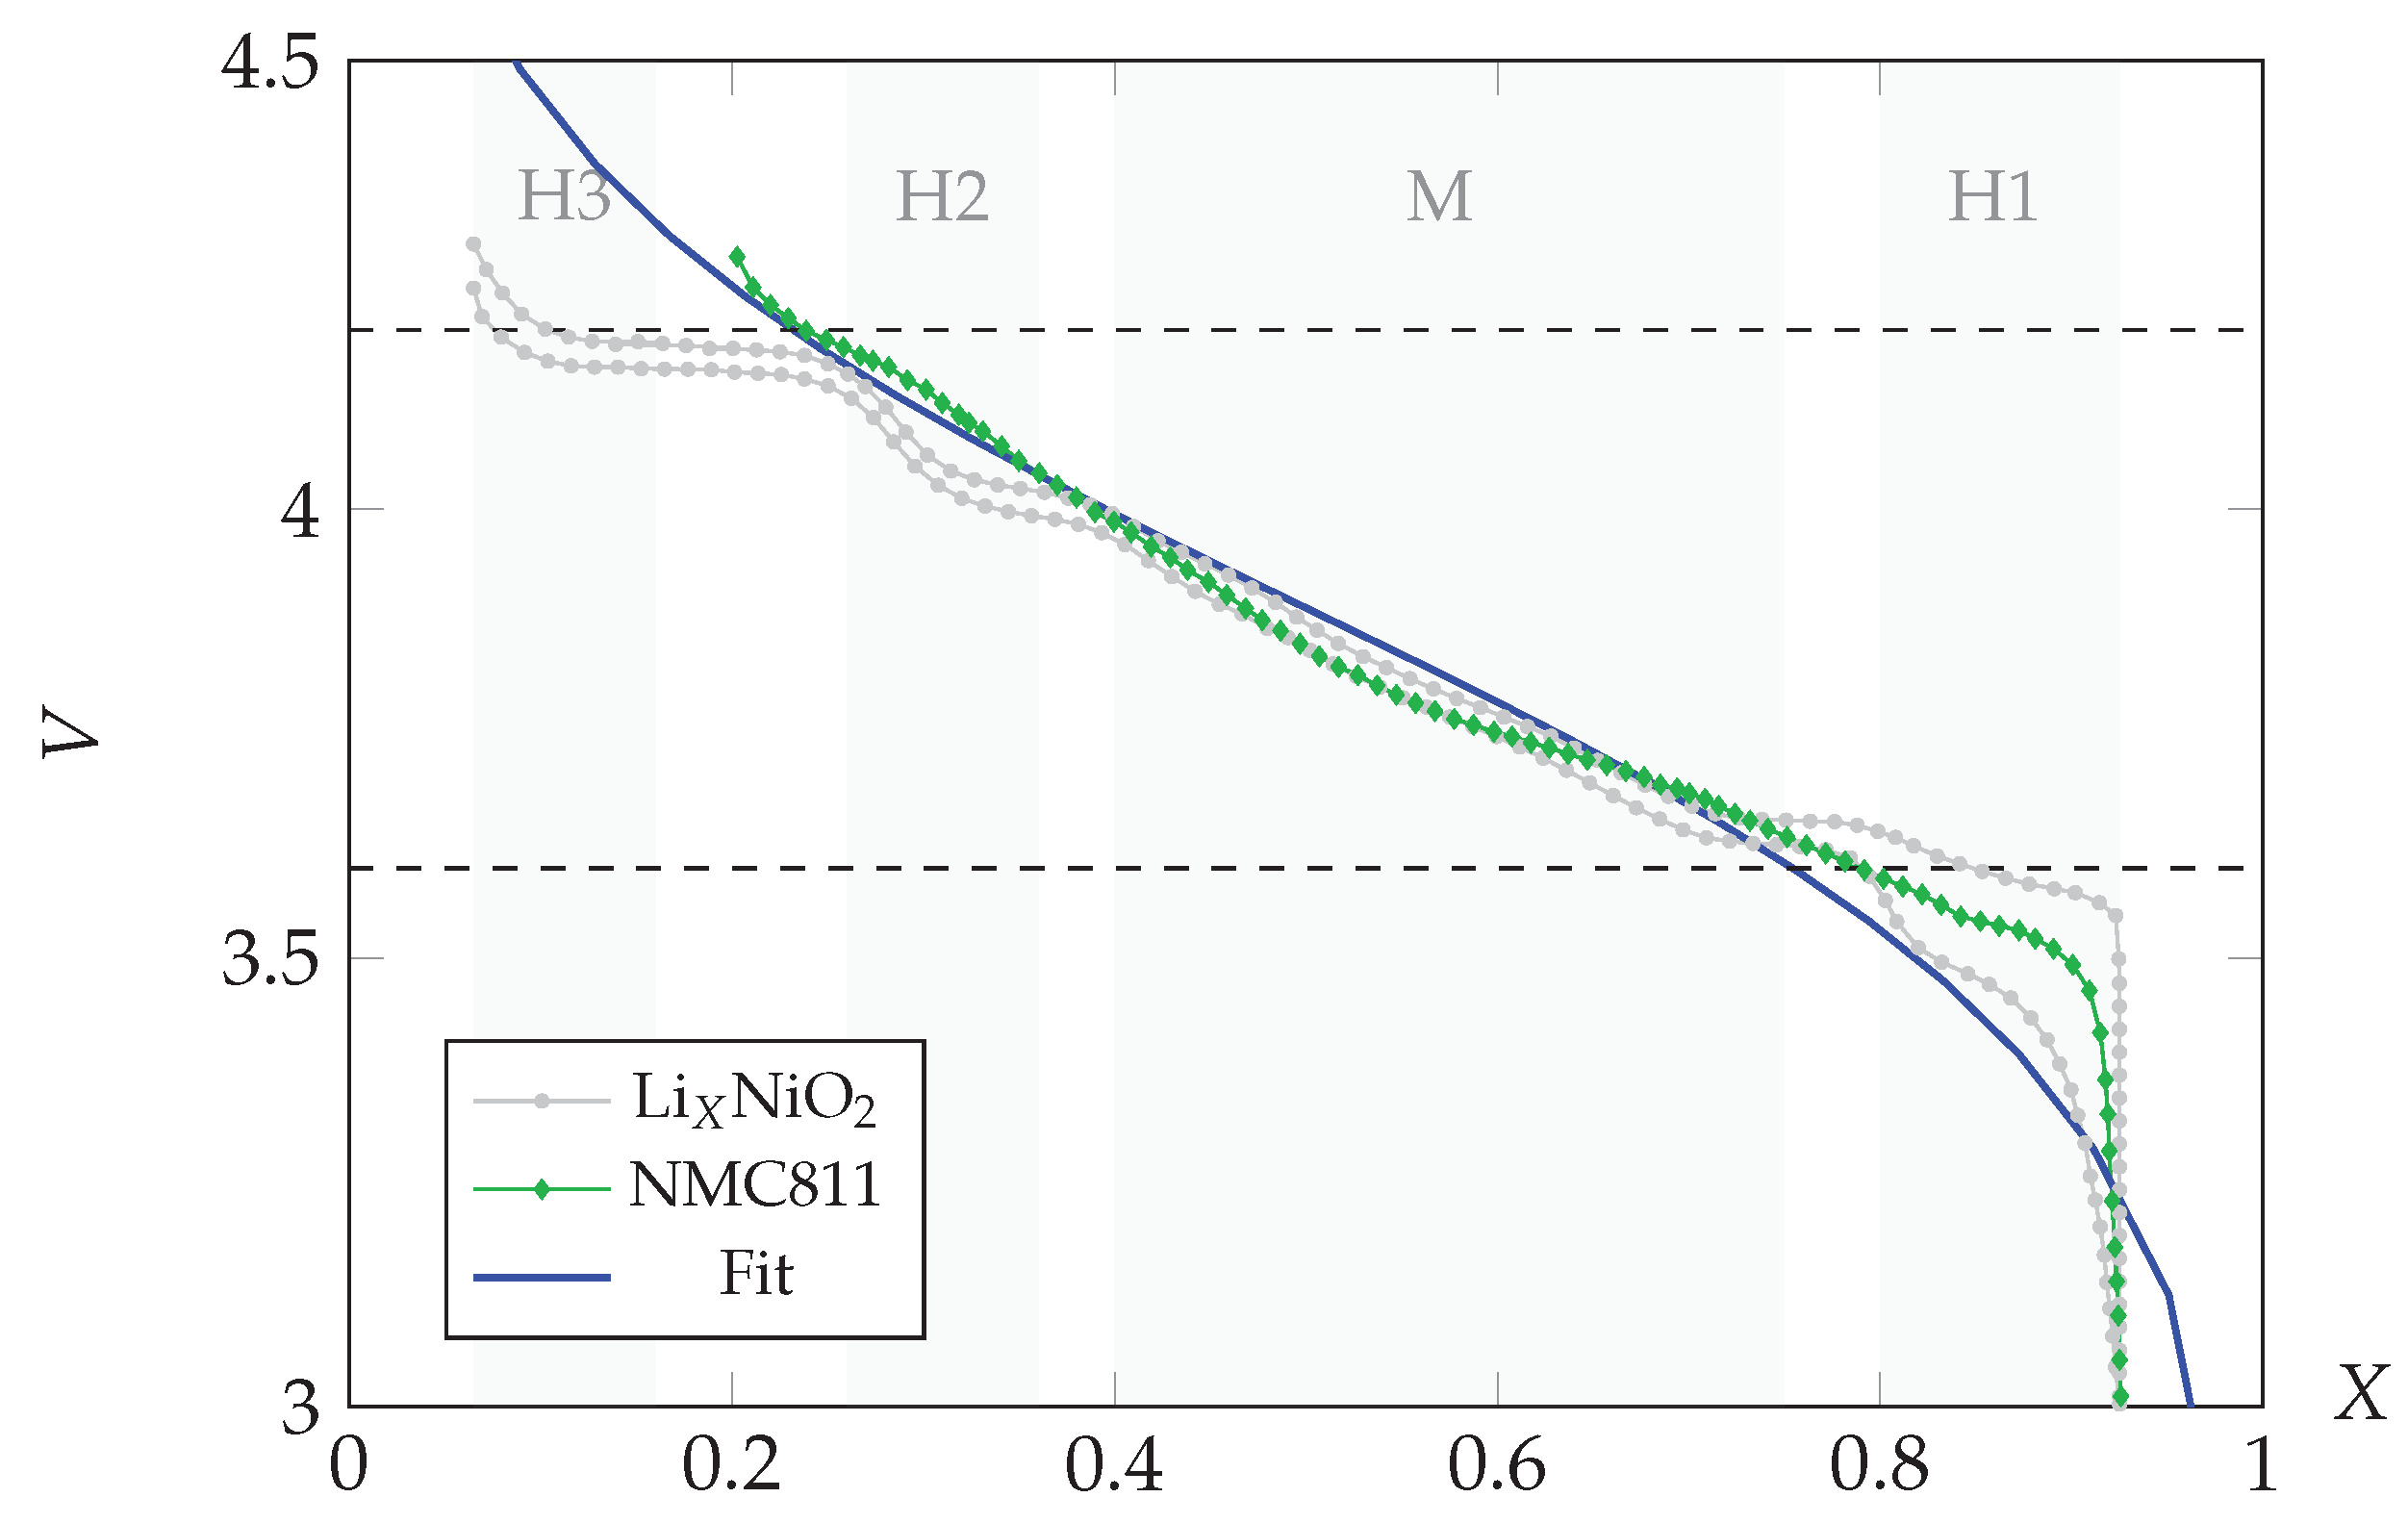
2.3. Simulation Parameters for High-Nickel NMC

Lithium layered-oxides with high nickel content, such as NMC811, deliver high capacities but also face stronger capacity fading due to mechanical degradation and surface densification [4]. The cycling of LiNiO 2 is accompanied by multiple phase transitions [28,32] and indications for similar transformations have been observed for NMC811 as well [4], although the voltage curve at low (dis)charge rates does not feature distinct steps and plateaus (see Figure 1). For the purpose of this study, we assume an ideal solution behavior in the voltage range 3.6–4.2 V. As a consequence, the chemical free energy and the resulting chemical potential are expressed as
f NMC = μ NMC c + K ln ( c ) + K ( 1 c ) ln ( 1 c ) ,
μ NMC = f NMC c = μ NMC + K ln c 1 c .
The measurable open-circuit voltage (OCV) is related to the difference in chemical potentials between the cathode and the anode [33], which in this case yields
V OCV = μ Cathode μ Anode e N A = μ NMC μ Li e N A = V K e N A ln c 1 c
where the chemical potential defined in Equation (6) is used for the NMC cathode, and we assume a lithium metal counter electrode with constant chemical potential μ Li . The reference voltage V = ( μ Li μ NMC ) / ( e N A ) is set to 3.89 V, which results in the blue curve in Figure 1 for the equilibrium electro-chemical potential of the cathode with respect to a lithium metal anode. e denotes the elementary charge and N A the Avogadro constant. The ion mobility is assumed to increase with concentration due to more random hops, while the crowding at high concentrations leads to a decrease such that M c ( 1 c ) . The thermodynamic factor μ / c α calculated based on Equation (6) yields K c 1 ( 1 c ) 1 . Inserting the mobility and the thermodynamic factor derived from the ideal solution into Equation (3) leads to a chemical diffusivity that is independent of c.
Lithium diffusion is confined to the plane between transition metal oxide sheets in a defect-free structure, and thus, is highly anisotropic. Reported values of the apparent diffusion coefficient in NMC differ by orders of magnitude [4,34], which stems from the multiple challenges involved in aquiring reliable data. Computation of the apparent diffusion from galvanostatic intermittent titration technique (GITT) relies on the assumption of semi-infinite relaxation that is hard to ensure for small primary crystals and high diffusivities. The fracture of agglomerates and subsequent penetration of electrolytes lead to an increase in surface, and consequently, an overestimation of diffusivities obtained from GITT measurements [34]. Within this study, the in-plane diffusion coefficient is set to D | | = 10 10 cm 2 /s, which is one order of magnitude faster than the apparent diffusion measured in [34]. In the direction perpendicular to the planes, diffusivity is assumed to be negligible ( D = 0 ). At grain boundaries, a mixture rule is applied to interpolate diffusion tensors of neighboring grains. To the best of our knowledge, the influence of grain boundary diffusion on ion transport within polycrystals is not sufficiently understood. Due to a lack of reliable data, no enhanced grain boundary diffusion is modeled although it is technically straightforward in the framework of the multiphase-field method [35].

3. Results

Lithium diffusion in NMC811 is simulated in two-dimensional domains for varying microstructures, as shown in Figure 2. All secondary particles in this study are assumed to be spherical with an outer diameter of 10 µm [4] (i.e., R = 5 µm). Inspired by various works with textured, rod-like microstructures [7,8,36], we assume a compact core with randomly oriented grains surrounded by a layer of radially aligned grains.
The radius r of the inner core is systematically varied, starting from r / R = 1 that corresponds to a sphere of randomly oriented grains (“gravel-NMC” [8]), to a ratio of r / R = 1 / 4 where the microstructure is dominated by aligned grains. Randomized grain structures for the inner core are created by Voronoi tesselation. All structures are pre-conditioned using the multiphase-field method, in the sense that diffuse transition regions between order parameters of indiviual grains are established by solving the corresponding phase evolution equations [11,26,27]. The grain structures are assumed to be stable at room temperature such that no microstructure evolution occurs during cycling.
All structures are subjected to the same electro-chemical simulation setup where we apply voltage steps of Δ V = 0.1 V, followed by a relaxation time of 1 h. The voltage steps are applied via a Dirichlet boundary condition for c at the surface of the particles employing the relation between the voltage and c in Figure 1. The characteristic relaxation time of the model setup is approximately τ = R 2 / D | | = 0.7 h. Due to the different microstructures, diffusional relaxation within the secondary particles varies strongly, as can be seen in Figure 3.
While 1 h of relaxation time is sufficiently long for the strongly textured samples ( r / R = 1 / 3 and r / R = 1 / 4 ) to reach an equilibrium state ( Δ c = 0 ), the other samples are out of equilibrium. Figure 3a,d clearly show that the gravel-NMC sample builds up larger concentration gradients over time as a result of slower ion diffusion. This effect is also seen in the shifting of currents for the r / R = 1 sample in Figure 4a. The spatial ion distribution is more inhomogeneous as some grains block the direct diffusion path towards the center of the sphere, resulting in a more tortuous pathway. The strongly aligned radial grains, moreover, provide fast ion transport paths towards the inner of the particle. In both cases of aligned grains (Figure 3b,c), we observe an accumulation of ions at the grain boundary that is a result of the tapered shape of these grains. All ions moving through transition metal oxide sheets that end in a grain boundary need to diffuse further via the grain boundary. The particle with a ratio of r / R = 1 / 2 exhibits inhomogeneities in the ion diffusion that appear as rays in Figure 3b. The effective ion transport through the radially aligned grains is influenced by the microstructure of the inner core. Strong misalignment at the transition between core and outer ring leads to a blocking of transport routes and as a result some radial grains exhibit stronger concentration gradients. This effect becomes negligible when the textured grains dominate the overall morphology of the particle (Figure 3c).
The composition gradients can, furthermore, be evaluated in terms of a virtual potentiostatic intermittent titration technique (PITT) experiment. The non-dimensional current resulting from the applied voltage step is calculated from the change in average concentration in the particle
I = 1 ϕ NMC d V c t ϕ NMC d V
where ϕ NMC denotes the local volume fraction of all NMC grains, which in this case is identical to 1 ϕ electrolyte . Following a transient regime, the current follows an exponential decay that can be identified as linear regions in the logarithmic plot Figure 4a. The results in Figure 4a underline that the microstructure influences the global current (i.e., influx of ions in this case). The linear regions of the various samples exhibit different slopes, which hints at varying effective diffusion coefficients. Employing a standard equation to compute the apparent diffusion coefficient from PITT experiments (Equation (2) [37])
D apparent = d ln ( I ) d t 16 R 2 π 2
yields the results shown in Figure 4b. Only regions where the current follows an exponential decay fulfill the assumptions that have been used to derive Equation (9). Over the course of ten potential steps, the computed apparent diffusivities are very reliable and the average values have been marked by dashed lines. It should be noted that the noise in our evaluation becomes larger the faster the average diffusivity is. This is an artefact of the small changes of ion concentration close to equilibrium, where the computed diffusivity values are dominated by trunctuation errors.

4. Discussion

The results highlight how crucially ion transport is affected by the microstructure of secondary particles for anisotropic materials. The spatial distribution of composition that is observed in the simulations (Figure 5b,d) closely resembles the experimentally obtained ion distribution in the work of Xu et al. [8]. Especially, the ray-like ion distribution in Figure 3a [8] can now be explained by the interplay of misaligned grains in the randomly distributed core with respect to the outer aligned grains.
The evaluation of apparent diffusion coefficients sheds some light on the vast range of values that can be found in the literature. In this study, the obtained values for D apparent vary by a factor of 4, even though the input values for D | | and D are identical. It should be noted that the apparent diffusion coefficients calculated from Equation (9) are too high in this case. Although D | | = 1 × 10 10 cm 2 /s was chosen, the apparent diffusion coefficient for rod-NMC is D apparent rod-NMC = 8 × 10 10 cm 2 /s, which is physically not possible. This results from the fact that Equation (9) has been derived for spherical particles while the simulations are only a two-dimensional representation of spherical microstructures. This does not change the qualitative differences between the obtained values as all could be corrected by a geometry factor. However, this discussion underlines the importance to question the assumptions that have been used for the derivation of formulas that are typically used for the evaluation of GITT or PITT experiments. The detailed investigation unravels the influence of the microstructure on the effective transport properties, which is only one of many parameters influencing the experimental results. It should be acknowledged that any experimental measurement of diffusivity can only capture the apparent diffusion in the specific microstructure, and thus, diffusivity values should always be published in combination with a characterization of particle morphology.
Furthermore, the simulation results suggest that grain boundary diffusion could play an important role for the ion transport in dense secondary particles. In the randomly oriented sample, an enhanced grain boundary diffusion would mediate the blocking effect observed at interfaces between strongly misaligned grains. Furthermore, in the rod-NMC with a strong texture, grain boundaries play a vital role in the overall transport, as sketched in Figure 6.
Due to the tapered shape of radially aligned grains, many layers are cut by grain boundaries, and thus, the migrating ions need to diffuse further into the particle via grain boundary diffusion. An enhanced grain boundary diffusion would lead to the faster transport in the whole particle, while sluggish grain boundary diffusion would result in many trapped ions and strong concentration gradients at grain boundaries. To the best of our knowledge, the actual influence of grain boundaries on ion transport is not well understood.

5. Conclusions

The presented framework is well-suited to study the influence of particle morphology in terms of size, distribution, and alignment of primary particles on key battery performance measures such as the effective diffusivity. Through a virtual PITT test, we are able to compute an effective diffusivity depending on the actual microstructure.
Within this work, the phase-field method is employed to parametrize the polycrystalline structure of NMC agglomerates. While this study is based on virtually generated structures, the regular grid employed to solve the partial differential equations also enables the straightforward inclusion of image data. Furthermore, the hierarchical particle morphologies investigated in this work are relevant for other layered-oxide cathode materials, such as the P2-type Na X Ni 1 / 4 Mn 3 / 4 O 2 , which is a promising material for sodium intercalation batteries [9]. This material exhibits multiple plateaus in the OCV due to phase transitions. The multiphase-field framework employed throughout this work naturally allows for the computation of phase evolution within the grains such that future investigations will encompass the coupled effects of phase transformations, ion diffusion, and mechanical degradation. A systematic study of electrolyte infiltration after crack formation and the resulting effective diffusion coefficients becomes possible. By explicitly modeling the morphology dependence of ion diffusion, this work contributes to bridging the gap between diffusivity values obtained at different scales, e.g., from first principle methods such as DFT [38,39], as well as from experimental methods such as GITT [4,34] and PITT [37]. The proposed framework enables the systematic study of the effective transport properties of secondary particles, which is relevant for Newman-type models in which secondary particles are typically homogenized as isotropic spheres.

Author Contributions

Conceptualization, S.D.; methodology, S.D.; software, S.D., M.W. and P.W.H.; validation, S.D., M.W. and P.W.H.; investigation, S.D.; writing—original draft preparation, S.D. and M.W.; writing—review and editing, S.D. and M.W.; visualization, S.D.; supervision, D.S. and B.N.; project administration, D.S. and B.N.; funding acquisition, B.N. All authors have read and agreed to the published version of the manuscript.

Funding

This work contributes to the research performed at CELEST (Center for Electrochemical Energy Storage Ulm-Karlsruhe) and was funded by the German Research Foundation (DFG) under Project ID 390874152 (POLiS Cluster of Excellence). Discussion and conclusion of the results were facilitated through the programme MTET 38.02.01 by the Helmholtz association.

Data Availability Statement

The data presented in this study are available upon request from the corresponding author. The PACE3D code used to conduct simulation studies is the property of the Hochschule Karlsruhe and can, thus, not be made publicly available.

Acknowledgments

S.D. and M.W. want to thank our colleagues M. Reder and A. Prahs for their helpful input and many discussions.

Conflicts of Interest

The authors declare no conflict of interest.

Appendix A

The numerical implementation of anisotropic fluxes is based on the work of Günter et al. [22]. Two schemes, namely the antisymmetric and the symmetric discretization, as shown in Figure A1 are implemented to prove the applicability of previous results [22] in the context of modeling anisotropic diffusion in battery materials.
Figure A1. Spatial discretization of fluxes can be based on firstly, the antisymmetric scheme in (a) that corresponds to a staggered grid with fluxes located at cell sides or secondly, the symmetric scheme in (b) that is a rotated staggered grid with fluxes at the cell corners.
Batteries 09 00310 g0a1
We study a two-dimensional example of the diffusion equation
u t = · Γ u
with an anisotropy factor ζ = Γ 11 / Γ 22 = . The misalignment of the grid axes and the material coordinate system is systematically varied with the angle θ denoting the rotation between the two systems. The domain, in this case, has a unit length of L x = 1.0 and L y = 1.0 discretized by 50 × 50 cells. Mesh convergence has been tested with refinements of 100 × 100 and 200 × 200 cells. Boundary conditions are chosen periodically at the top and bottom of the domain. On the left side, a Dirichlet boundary condition is applied according to the analytical profile
u left = 1 2 + 1 2 sin ( π 2 y 0.38 0.08 ) , 0.30 < y 0.46 1.0 , 0.46 < y 0.54 1 2 + 1 2 sin ( π 2 y 0.62 0.08 ) , 0.54 < y 0.70
which is a hat function with a smooth transition between c = 0 and 1. As the information travels through the domain, the diffusion anisotropy creates a shift s y = L x tan ( α ) . Therefore, the exact solution at the right boundary is known. In the following, the L 2 -norm is introduced and used as a relative error measure as
ε ref 2 = u right u exact 2 u exact 2 = 0 n y ( u right u exact ) 2 / 0 n y ( u exact ) 2 .
Figure A2 exemplarily shows the results for a small misalignment angle θ = 9 between the diffusion anisotropy direction and the grid.
Figure A2. Comparison of the relative error due to numerical diffusion. The resulting concentration field in the steady-state for θ = 9 is shown in (a). Comparison of the analytical profile and travelled wave at the right boundary is shown for the (b) antisymmetric scheme and the (c) symmetric scheme, respectively.
Batteries 09 00310 g0a2
This study is extended to a larger set of misalignment angles θ [ 15 , 60 ] . The diffusion length between the left and right boundaries becomes larger as L diff = L x / cos ( θ ) , so the error measure is expected to increase with θ . Figure A3 shows the relative error of the two discretizations as a function of the misalignment angle θ .
Figure A3. Relative error ε ref 2 for the antisymmetric and symmetric schemes combined with various BC implementations. Domain is discretized with 50 × 50 cells.
Batteries 09 00310 g0a3
The antisymmetric scheme leads to an increasing error for higher angles, which is a combination of two effects. First of all, the misalignment of anisotropy direction and the grid becomes larger and secondly, the diffusion length increases, which results in more numerical diffusion in the perpendicular direction. Generally, the error ε ref 2 is smaller for the symmetric scheme as the numerical diffusion is reduced. Furthermore, the symmetric scheme features the characteristic that the numerical error is zero at θ = 0 and θ = 45 , as both directions are aligned with the rotated staggered grid.
In conclusion, the numerical study affirms the results from Günter et al. [22] and van Es et al. [25] that the symmetric finite difference scheme provides high accuracy and exhibits less numerical diffusion perpendicular to the fast transport direction. Based on these results, all simulations presented in Section 3 were carried out based on the symmetric scheme. Note that the structure of the PDE is identical if fluxes are calculated based on the gradient in chemical potential instead of the concentration gradient (see Equation (3)). Thus, we directly compute the spatial gradient in the chemcial potential with the symmetric scheme.

References

  1. Radin, M.D.; Hy, S.; Sina, M.; Fang, C.; Liu, H.; Vinckeviciute, J.; Zhang, M.; Whittingham, M.S.; Meng, Y.S.; Van der Ven, A. Narrowing the Gap between Theoretical and Practical Capacities in Li-Ion Layered Oxide Cathode Materials. Adv. Energy Mater. 2017, 7, 1602888. [Google Scholar] [CrossRef] [Green Version]
  2. Delmas, C.; Fouassier, C.; Hagenmuller, P. Structural classification and properties of the layered oxides. Physica B+C 1980, 99, 81–85. [Google Scholar] [CrossRef]
  3. Bouwman, P.J.; Boukamp, B.A.; Bouwmeester, H.J.M.; Notten, P.H.L. Influence of Diffusion Plane Orientation on Electrochemical Properties of Thin Film LiCoO2 Electrodes. J. Electrochem. Soc. 2002, 149, A699. [Google Scholar] [CrossRef]
  4. Noh, H.J.; Youn, S.; Yoon, C.S.; Sun, Y.K. Comparison of the structural and electrochemical properties of layered Li[NixCoyMnz]O2 (x = 1/3, 0.5, 0.6, 0.7, 0.8 and 0.85) cathode material for lithium-ion batteries. J. Power Sources 2013, 233, 121–130. [Google Scholar] [CrossRef]
  5. Kondrakov, A.O.; Schmidt, A.; Xu, J.; Geßwein, H.; Mönig, R.; Hartmann, P.; Sommer, H.; Brezesinski, T.; Janek, J. Anisotropic Lattice Strain and Mechanical Degradation of High- and Low-Nickel NCM Cathode Materials for Li-Ion Batteries. J. Phys. Chem. C 2017, 121, 3286–3294. [Google Scholar] [CrossRef]
  6. Xu, R.; de Vasconcelos, L.S.; Shi, J.; Li, J.; Zhao, K. Disintegration of Meatball Electrodes for LiNixMnyCozO2 Cathode Materials. Exp. Mech. 2018, 58, 549–559. [Google Scholar] [CrossRef]
  7. Kim, U.H.; Park, G.T.; Son, B.K.; Nam, G.W.; Liu, J.; Kuo, L.Y.; Kaghazchi, P.; Yoon, C.S.; Sun, Y.K. Heuristic solution for achieving long-term cycle stability for Ni-rich layered cathodes at full depth of discharge. Nat. Energy 2020, 5, 860–869. [Google Scholar] [CrossRef]
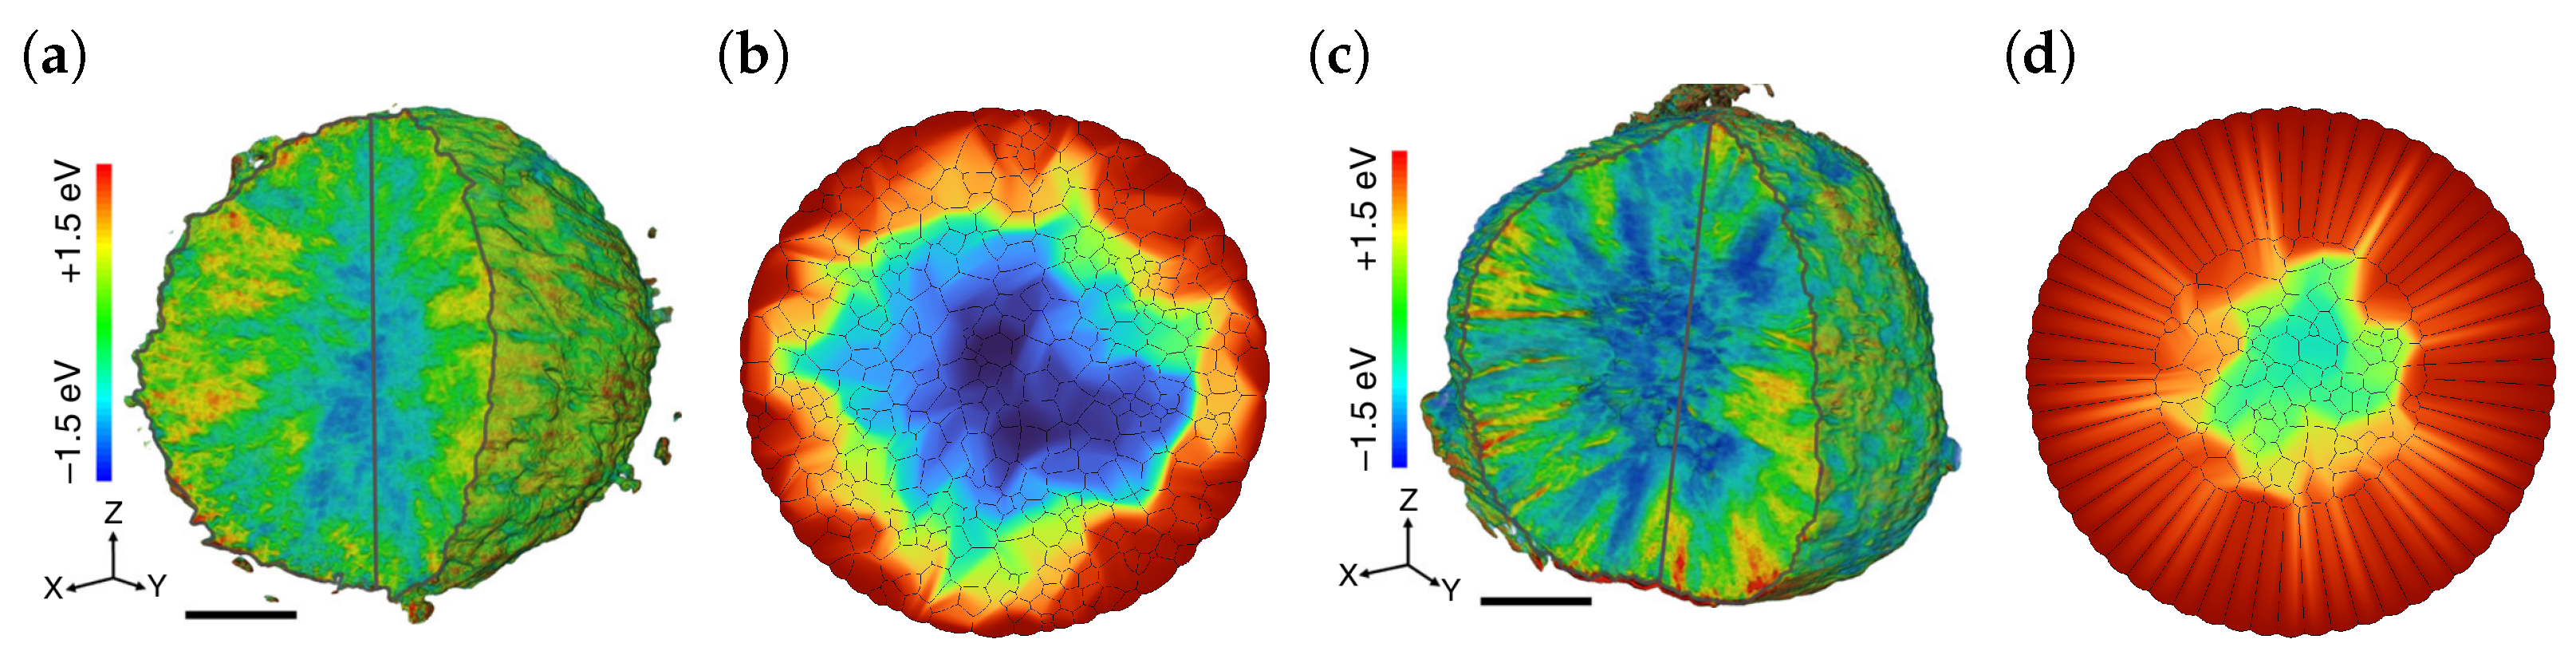
  8. Xu, Z.; Jiang, Z.; Kuai, C.; Xu, R.; Qin, C.; Zhang, Y.; Rahman, M.M.; Wei, C.; Nordlund, D.; Sun, C.J.; et al. Charge distribution guided by grain crystallographic orientations in polycrystalline battery materials. Nat. Commun. 2020, 11, 83. [Google Scholar] [CrossRef] [Green Version]
  9. Pfeiffer, L.F.; Jobst, N.; Gauckler, C.; Lindén, M.; Marinaro, M.; Passerini, S.; Wohlfahrt-Mehrens, M.; Axmann, P. Layered P2-NaxMn3/4Ni1/4O2 Cathode Materials For Sodium-Ion Batteries: Synthesis, Electrochemistry and Influence of Ambient Storage. Front. Energy Res. 2022, 10, 1–17. [Google Scholar] [CrossRef]
  10. Müller, M.; Schneider, L.; Bohn, N.; Binder, J.R.; Bauer, W. Effect of Nanostructured and Open-Porous Particle Morphology on Electrode Processing and Electrochemical Performance of Li-Ion Batteries. ACS Appl. Energy Mater. 2021, 4, 1993–2003. [Google Scholar] [CrossRef]
  11. Daubner, S.; Weichel, M.; Schneider, D.; Nestler, B. Modeling intercalation in cathode materials with phase-field methods: Assumptions and implications using the example of LiFePO4. Electrochim. Acta 2022, 421, 140516. [Google Scholar] [CrossRef]
  12. Lim, J.M.; Kim, H.; Cho, K.; Cho, M. Fundamental mechanisms of fracture and its suppression in Ni-rich layered cathodes: Mechanics-based multiscale approaches. Extrem. Mech. Lett. 2018, 22, 98–105. [Google Scholar] [CrossRef]
  13. Taghikhani, K.; Weddle, P.J.; Berger, J.R.; Kee, R.J. Modeling Coupled Chemo-Mechanical Behavior of Randomly Oriented NMC811 Polycrystalline Li-Ion Battery Cathodes. J. Electrochem. Soc. 2021, 168, 080511. [Google Scholar] [CrossRef]
  14. Cogswell, D.; Bazant, M. Coherency strain and the kinetics of phase separation in LiFePO4 nanoparticles. ACS Nano 2012, 6, 2215–2225. [Google Scholar] [CrossRef]
  15. Tang, M.; Belak, J.; Dorr, M. Anisotropic phase boundary morphology in nanoscale olivine electrode particles. J. Phys. Chem. C 2011, 115, 4922–4926. [Google Scholar] [CrossRef]
  16. Abdellahi, A.; Akyildiz, O.; Malik, R.; Thornton, K.; Ceder, G. Particle-size and morphology dependence of the preferred interface orientation in LiFePO4 nano-particles. J. Mater. Chem. A 2014, 2, 15437–15447. [Google Scholar] [CrossRef]
  17. Li, Y.; Zhang, K.; Pan, Y.; Yang, F. Anisotropic behavior in the lithiation of a silicon nanopillar. J. Energy Storage 2023, 57, 106271. [Google Scholar] [CrossRef]
  18. Kobayashi, R. Modeling and numerical simulations of dendritic crystal growth. Phys. D Nonlinear Phenom. 1993, 63, 410–423. [Google Scholar] [CrossRef]
  19. Schoof, E.; Schneider, D.; Streichhan, N.; Mittnacht, T.; Selzer, M.; Nestler, B. Multiphase-field modeling of martensitic phase transformation in a dual-phase microstructure. Int. J. Solids Struct. 2018, 134, 181–194. [Google Scholar] [CrossRef]
  20. Kim, S.G.; Kim, D.I.; Kim, W.T.; Park, Y.B. Computer simulations of two-dimensional and three-dimensional ideal grain growth. Phys. Rev. E 2006, 74, 061605. [Google Scholar] [CrossRef] [Green Version]
  21. Hötzer, J.; Reiter, A.; Hierl, H.; Steinmetz, P.; Selzer, M.; Nestler, B. The parallel multi-physics phase-field framework PACE3D. J. Comput. Sci. 2018, 26, 1–12. [Google Scholar] [CrossRef]
  22. Günter, S.; Yu, Q.; Krüger, J.; Lackner, K. Modelling of heat transport in magnetised plasmas using non-aligned coordinates. J. Comput. Phys. 2005, 209, 354–370. [Google Scholar] [CrossRef]
  23. Sharma, P.; Hammett, G.W. Preserving monotonicity in anisotropic diffusion. J. Comput. Phys. 2007, 227, 123–142. [Google Scholar] [CrossRef] [Green Version]
  24. Dubois, Y.; Commerçon, B. An implicit scheme for solving the anisotropic diffusion of heat and cosmic rays in the RAMSES code. Astron. Astrophys. 2016, 585, 1–10. [Google Scholar] [CrossRef] [Green Version]
  25. Van Es, B.; Koren, B.; de Blank, H.J. Finite-difference schemes for anisotropic diffusion. J. Comput. Phys. 2014, 272, 526–549. [Google Scholar] [CrossRef] [Green Version]
  26. Eiken, J.; Böttger, B.; Steinbach, I. Multiphase-field approach for multicomponent alloys with extrapolation scheme for numerical application. Phys. Rev. E 2006, 73, 066122. [Google Scholar] [CrossRef]
  27. Steinbach, I. Phase-field models in materials science. Model. Simul. Mater. Sci. Eng. 2009, 17, 073001. [Google Scholar] [CrossRef]
  28. De Biasi, L.; Schiele, A.; Roca-Ayats, M.; Garcia, G.; Brezesinski, T.; Hartmann, P.; Janek, J. Phase Transformation Behavior and Stability of LiNiO2 Cathode Material for Li-Ion Batteries Obtained from In Situ Gas Analysis and Operando X-Ray Diffraction. ChemSusChem 2019, 12, 2240–2250. [Google Scholar] [CrossRef]
  29. Choudhury, A.; Nestler, B. Grand-potential formulation for multicomponent phase transformations combined with thin-interface asymptotics of the double-obstacle potential. Phys. Rev. E 2012, 85, 021602. [Google Scholar] [CrossRef]
  30. Spring, K.W. Euler parameters and the use of quaternion algebra in the manipulation of finite rotations: A review. Mech. Mach. Theory 1986, 21, 365–373. [Google Scholar] [CrossRef]
  31. Heinz, A.; Neumann, P. Representation of orientation and disorientation data for cubic, hexagonal, tetragonal and orthorhombic crystals. Acta Crystallogr. Sect. Found. Crystallogr. 1991, 47, 780–789. [Google Scholar] [CrossRef]
  32. Li, W.; Reimers, J.; Dahn, J. In situ x-diffraction and electrochemical studies of Li1−xNiO2. Solid State Ionics 1993, 67, 123–130. [Google Scholar] [CrossRef]
  33. Van Der Ven, A.; Bhattacharya, J.; Belak, A.A. Understanding Li diffusion in Li-intercalation compounds. Accounts Chem. Res. 2013, 46, 1216–1225. [Google Scholar] [CrossRef]
  34. Trevisanello, E.; Ruess, R.; Conforto, G.; Richter, F.H.; Janek, J. Polycrystalline and Single Crystalline NCM Cathode Materials—Quantifying Particle Cracking, Active Surface Area, and Lithium Diffusion. Adv. Energy Mater. 2021, 11, 2003400. [Google Scholar] [CrossRef]
  35. Hoffrogge, P.; Mukherjee, A.; Nani, E.; Amos, P.K.; Wang, F.; Schneider, D.; Nestler, B. Multiphase-field model for surface diffusion and attachment kinetics in the grand-potential framework. Phys. Rev. E 2021, 103, 033307. [Google Scholar] [CrossRef]
  36. Yoon, C.S.; Park, K.J.; Kim, U.H.; Kang, K.H.; Ryu, H.H.; Sun, Y.K. High-Energy Ni-Rich Li[NixCoyMn1−xy]O2 Cathodes via Compositional Partitioning for Next-Generation Electric Vehicles. Chem. Mater. 2017, 29, 10436–10445. [Google Scholar] [CrossRef]
  37. Mao, J.; Liu, X.; Liu, J.; Jiang, H.; Zhang, T.; Shao, G.; Ai, G.; Mao, W.; Feng, Y.; Yang, W.; et al. P2-type Na2/3Ni1/3Mn2/3O2 Cathode Material with Excellent Rate and Cycling Performance for Sodium-Ion Batteries. J. Electrochem. Soc. 2019, 166, A3980–A3986. [Google Scholar] [CrossRef] [Green Version]
  38. Van der Ven, A.; Ceder, G. Lithium diffusion mechanisms in layered intercalation compounds. J. Power Sources 2001, 97–98, 529–531. [Google Scholar] [CrossRef]
  39. Malik, R.; Burch, D.; Bazant, M.; Ceder, G. Particle size dependence of the ionic diffusivity. Nano Lett. 2010, 10, 4123–4127. [Google Scholar] [CrossRef]
Figure 1. Ideal solution fit for the equilibrium electro-chemical potential of NMC811 shown in blue, which is based on the datapoints published in Noh et al. [4] (green markers). Gray datapoints mark experimental voltage data for Li X NiO 2 obtained at C / 10 [28] for comparison. Gray shaded areas mark the phase transformations observed in Li X NiO 2 .
Batteries 09 00310 g001
Figure 2. Initial grain structures of secondary particles.
Batteries 09 00310 g002
Figure 3. Relaxation of concentration gradients in comparison for the three microstructures with r / R = 1 , r / R = 1 / 2 , and r / R = 1 / 4 (Figure 2a–c). The concentration gradient Δ c is measured as the difference between the maximal and minimal concentration value. Spatial concentration distribution is exemplarily shown for t = 4.2 h in subfigure (ac), as denoted by the black dotted line in subfigure (d).
Batteries 09 00310 g003
Figure 4. Virtual PITT experiment. The total influx of ions corresponding to the current resulting from the potential steps is given in (a). Apparent diffusion coefficients calculated with Equation (9) based on these currents are given in (b).
Batteries 09 00310 g004
Figure 5. Spatial ion distribution in gravel-NMC (a,b) compared to rod-NMC (c,d). Subfigures (a) and (c) are reprinted from Xu et al. [8] and have been published under the CC-BY licence.
Batteries 09 00310 g005
Figure 6. Role of grain boundaries in textured secondary particles. Ions travelling through transition metal oxide sheets that end in a grain boundary are forced to diffuse further into the inner of the particle via grain boundary diffusion.
Batteries 09 00310 g006
Disclaimer/Publisher’s Note: The statements, opinions and data contained in all publications are solely those of the individual author(s) and contributor(s) and not of MDPI and/or the editor(s). MDPI and/or the editor(s) disclaim responsibility for any injury to people or property resulting from any ideas, methods, instructions or products referred to in the content.

