
Numerical Analysis and Optimization of Flow Rate for Vanadium Flow Battery Incorporating Temperature Effect

Abstract
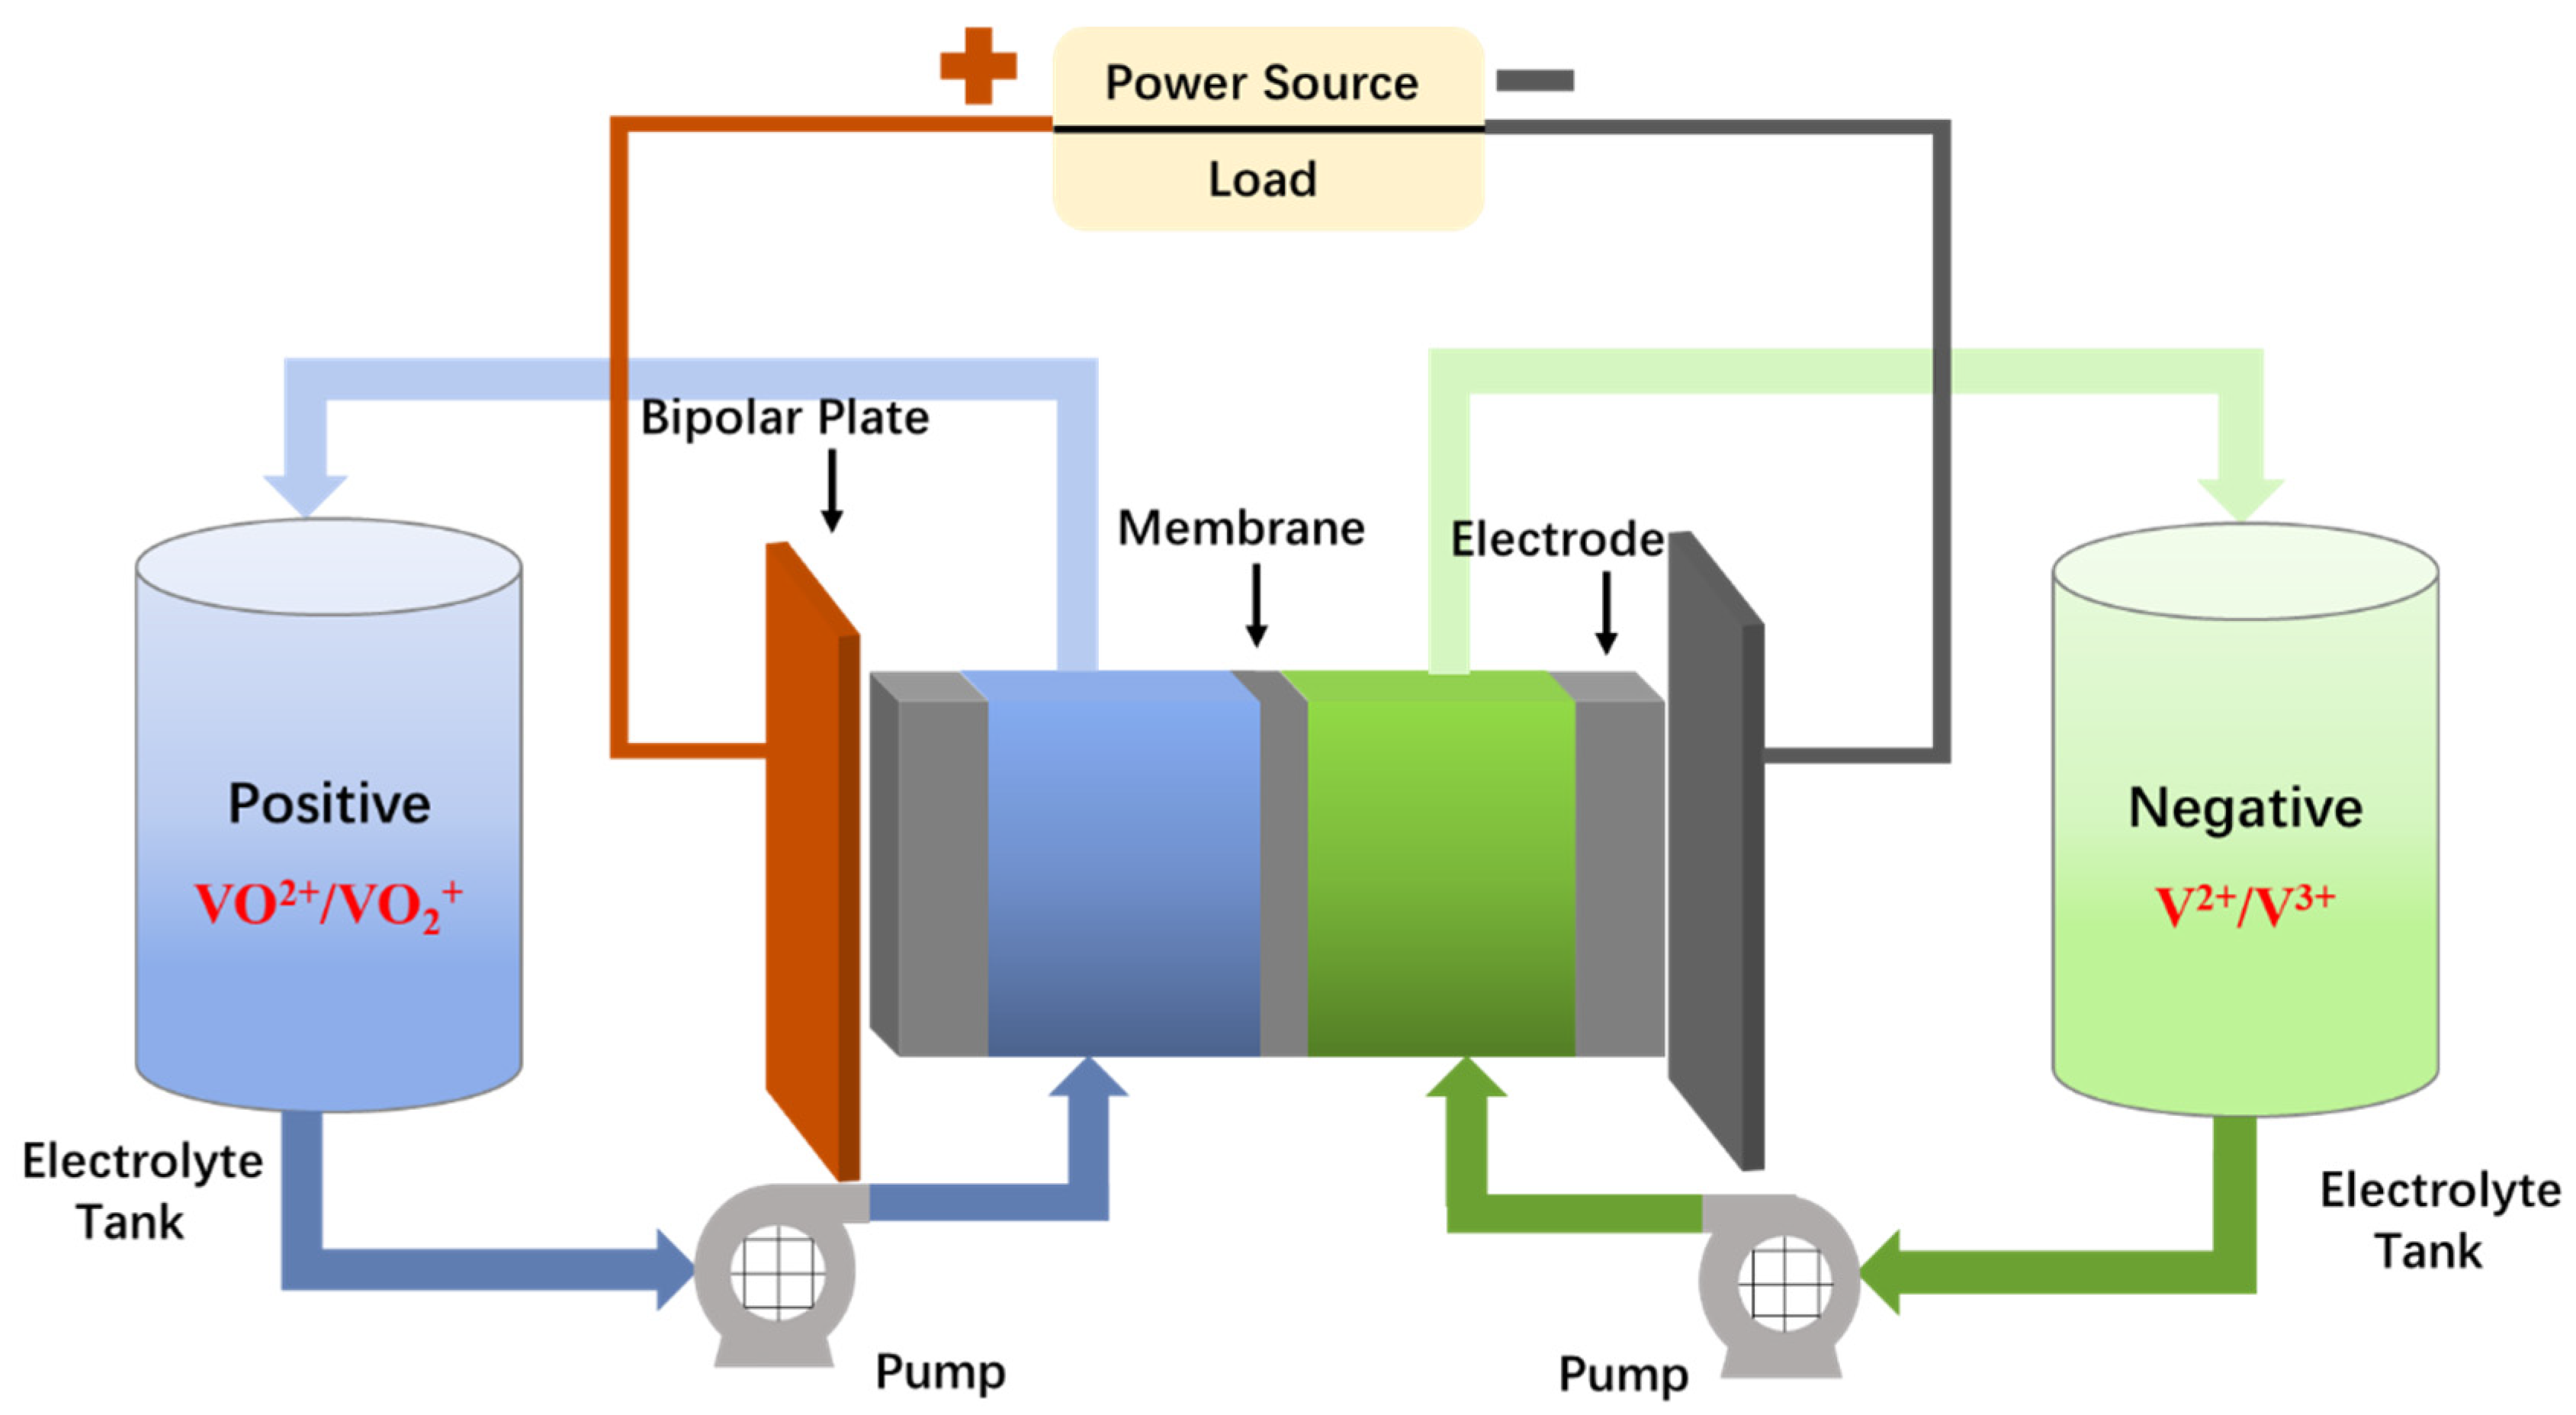
:1. Introduction
2. Experimental
2.1. Materials
2.2. Electrolyte Preparations
2.3. Cell Tests
- coulombic efficiency denotes the ratio of the electric charge discharged from a flow cell compared to the electric charge provided during the preceding charge;
- energy efficiency is the ratio of the electrical energy provided from the flow cell during discharge to the electrical energy supplied to the flow battery during the preceding charge;
- voltage efficiency denotes the ratio of the average discharge voltage to the average charge voltage;
- td and tc denote the process time of discharging and charging, respectively;
- Ud and Uc denote the voltage of discharging and charging, respectively;
- Id and Ic denote the current of discharging and charging, respectively.
2.4. Dynamic Modeling
2.4.1. Electrochemical Model
- is the cell formal potential;
- F and R refer to the Faraday constant and the molar gas constant, respectively;
- T is the temperature;
- z is the unit activity coefficient;
- , , , and are the concentrations of V2+, V3+, VO2+, and VO2+ in the cell, respectively;
- and are the reactant concentrations in positive and negative half-cells, respectively;
- i is the current density;
- km is the local mass transfer coefficient, and is described in the form of Equation (9), where is the cross-sectional area for electrodes and Q is the flow rate.
2.4.2. Mass Balance
- (1)
- The electrolyte concentrations are uniform in the cell/stack and tank.
- (2)
- Gassing side reactions can be minimized.
- (3)
- Throughout the operation, the reservoirs, cells, and stacks are maintained at a constant 25 °C.
- (4)
- The proton concentration in each half-cell electrolyte remains constant during charge–discharge cycling.
- (5)
- The variations of electrolyte volume in the cell/stack and reservoirs are negligeable.
- for VO2+ ions:
- for VO2+ ions:
- for V3+ ions:
- for V2+ ions:
- are the concentration of VO2+, VO2+, V3+, and V2+ in reservoir, respectively;
- V is the electrolyte volume in the cell;
- V′ is the electrolyte volume in the tank;
- A2 is the cross-sectional area of the membrane;
- θ is the thickness of the membrane;
- are the diffusion coefficients of V2+, V3+, VO2+, and VO2+, respectively;
- “+” and “−” are the processes of charging and discharging, respectively.
2.5. Pressure Loss, Pump Loss, and System Efficiency
2.5.1. Pressure Loss in Flow Cell
- is the overall pressure loss of the flow battery.
- is the pressure loss through the pipe.
- The pressure loss through a porous electrode, denoted by , may be calculated using Darcy’s equation, as shown in Equations (29) and (30):
- denotes electrode length;
- denotes electrode cross-sectional area;
- denotes electrolyte viscosity;
- denotes fiber diameter;
- denotes electrode permeability;
- denotes electrode porosity.
- is the Darcy friction factor;
- is the pipe diameter;
- is the velocity of the flow;
- is the pipe length.
2.5.2. Pump Loss and System Efficiency
3. Results and Discussion
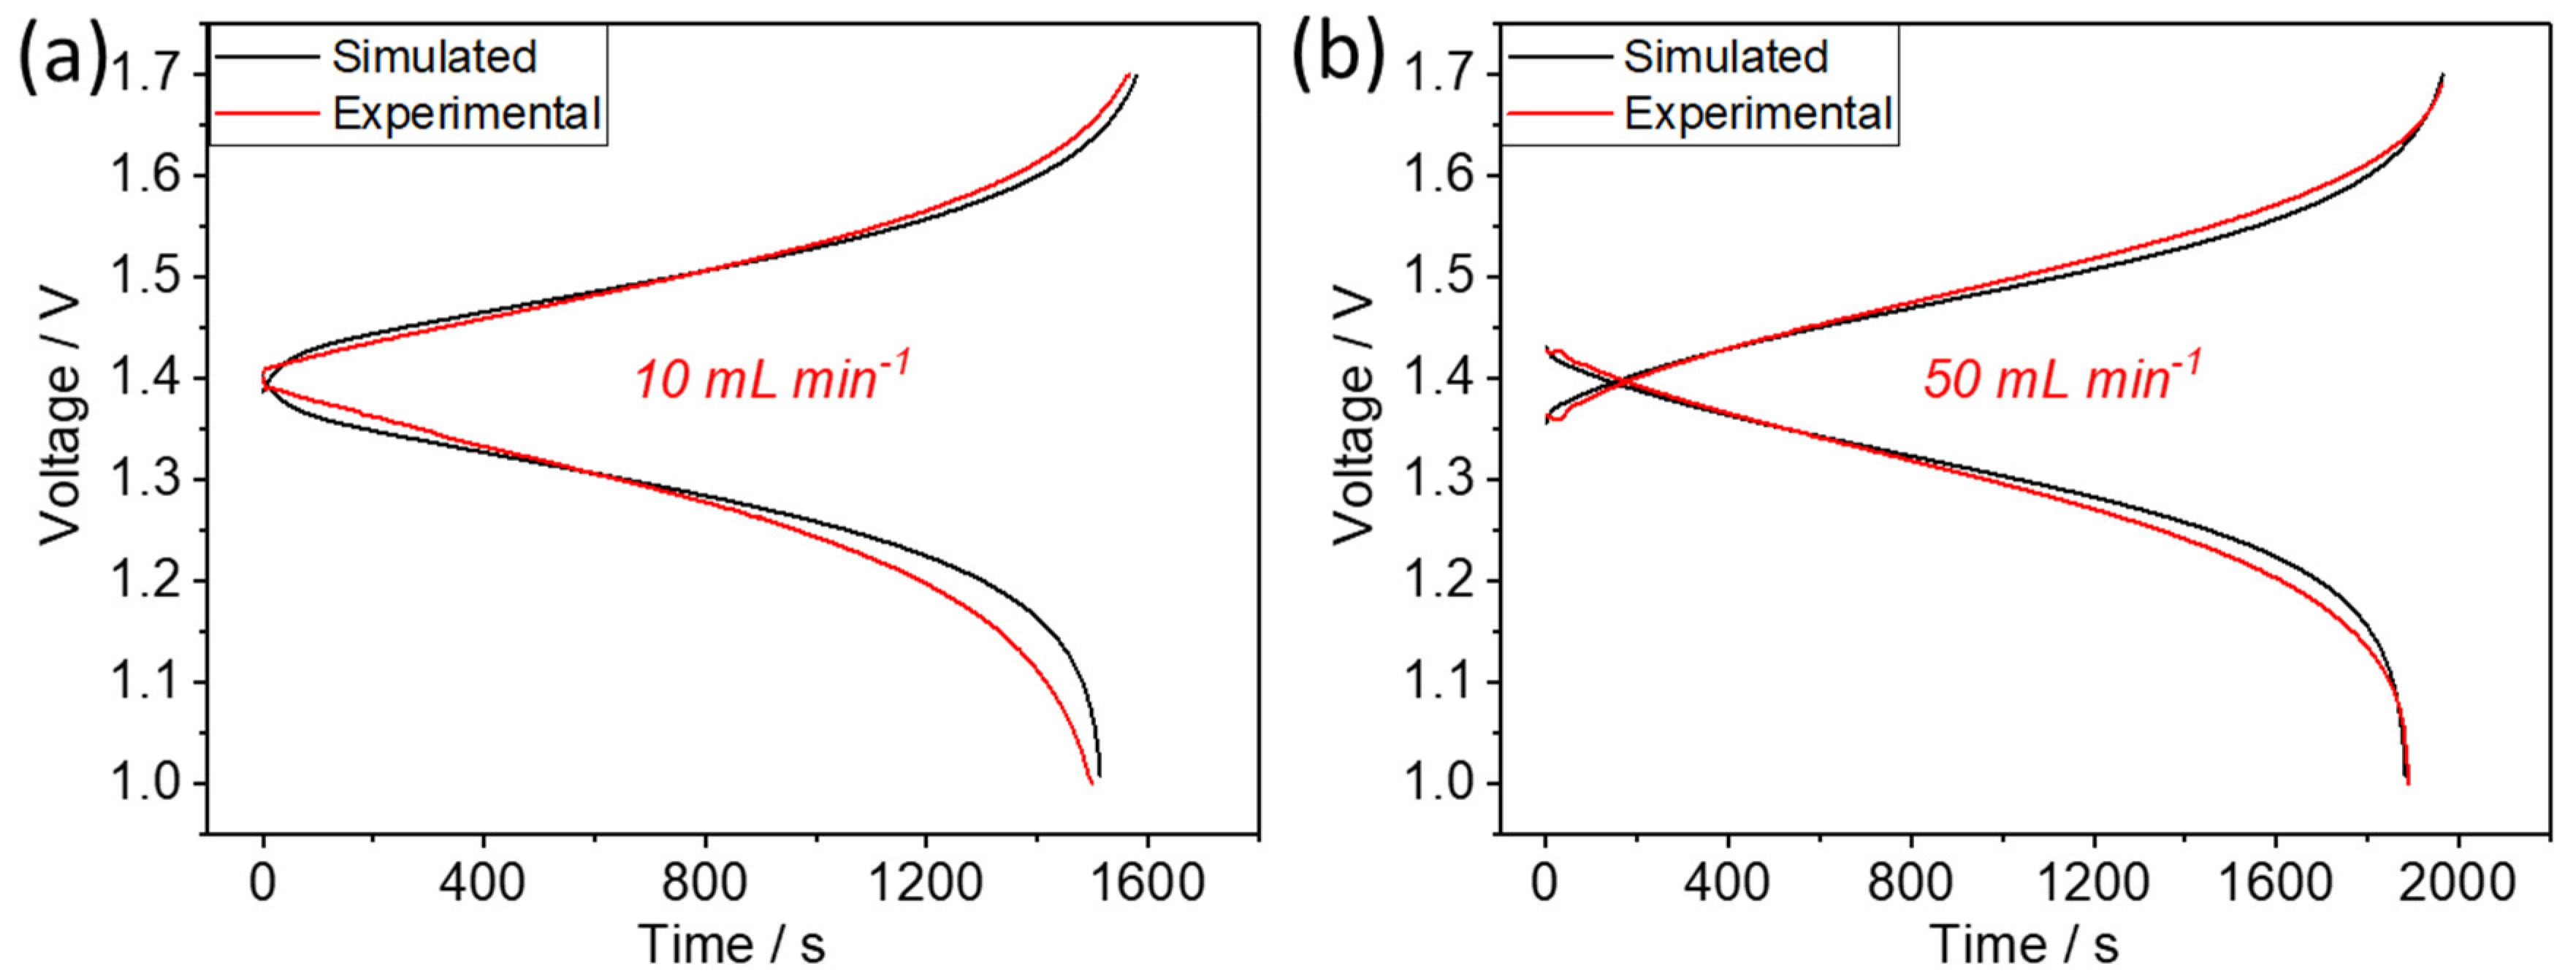
3.1. Model Validation
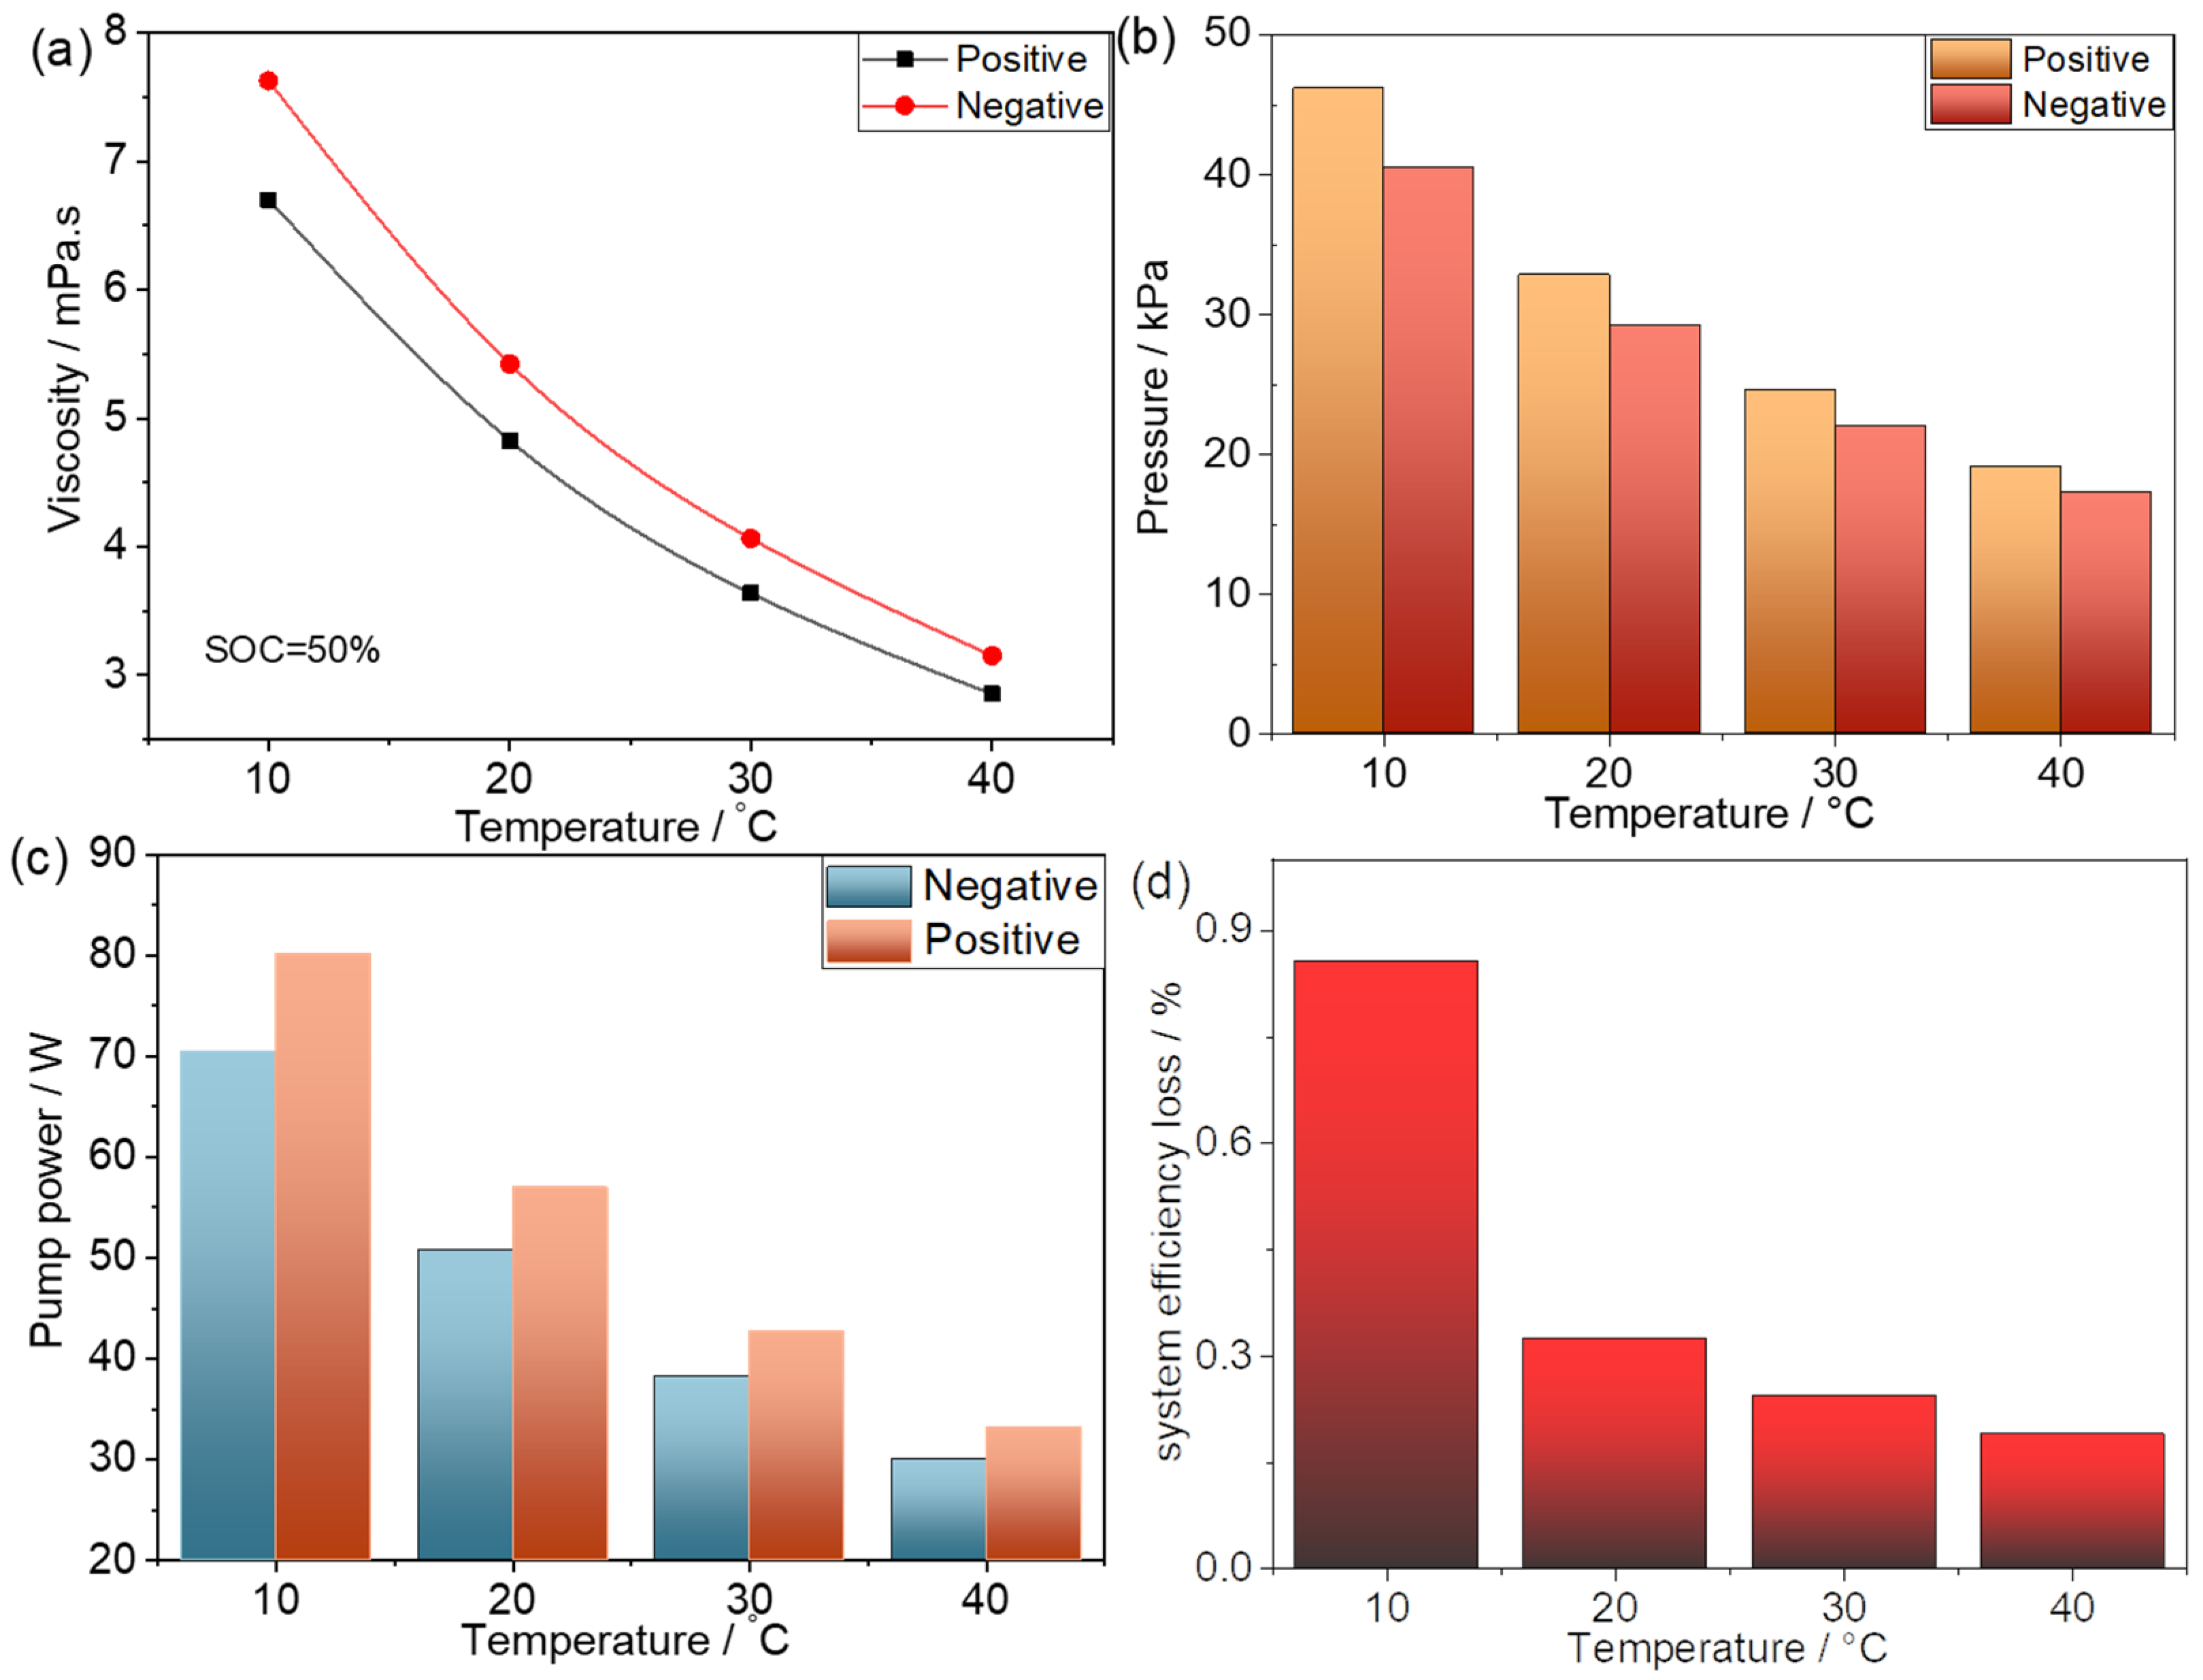
3.2. Effects of Temperature
3.2.1. Effects of Temperature on Viscosity
3.2.2. Effects of Temperature on Internal Resistance
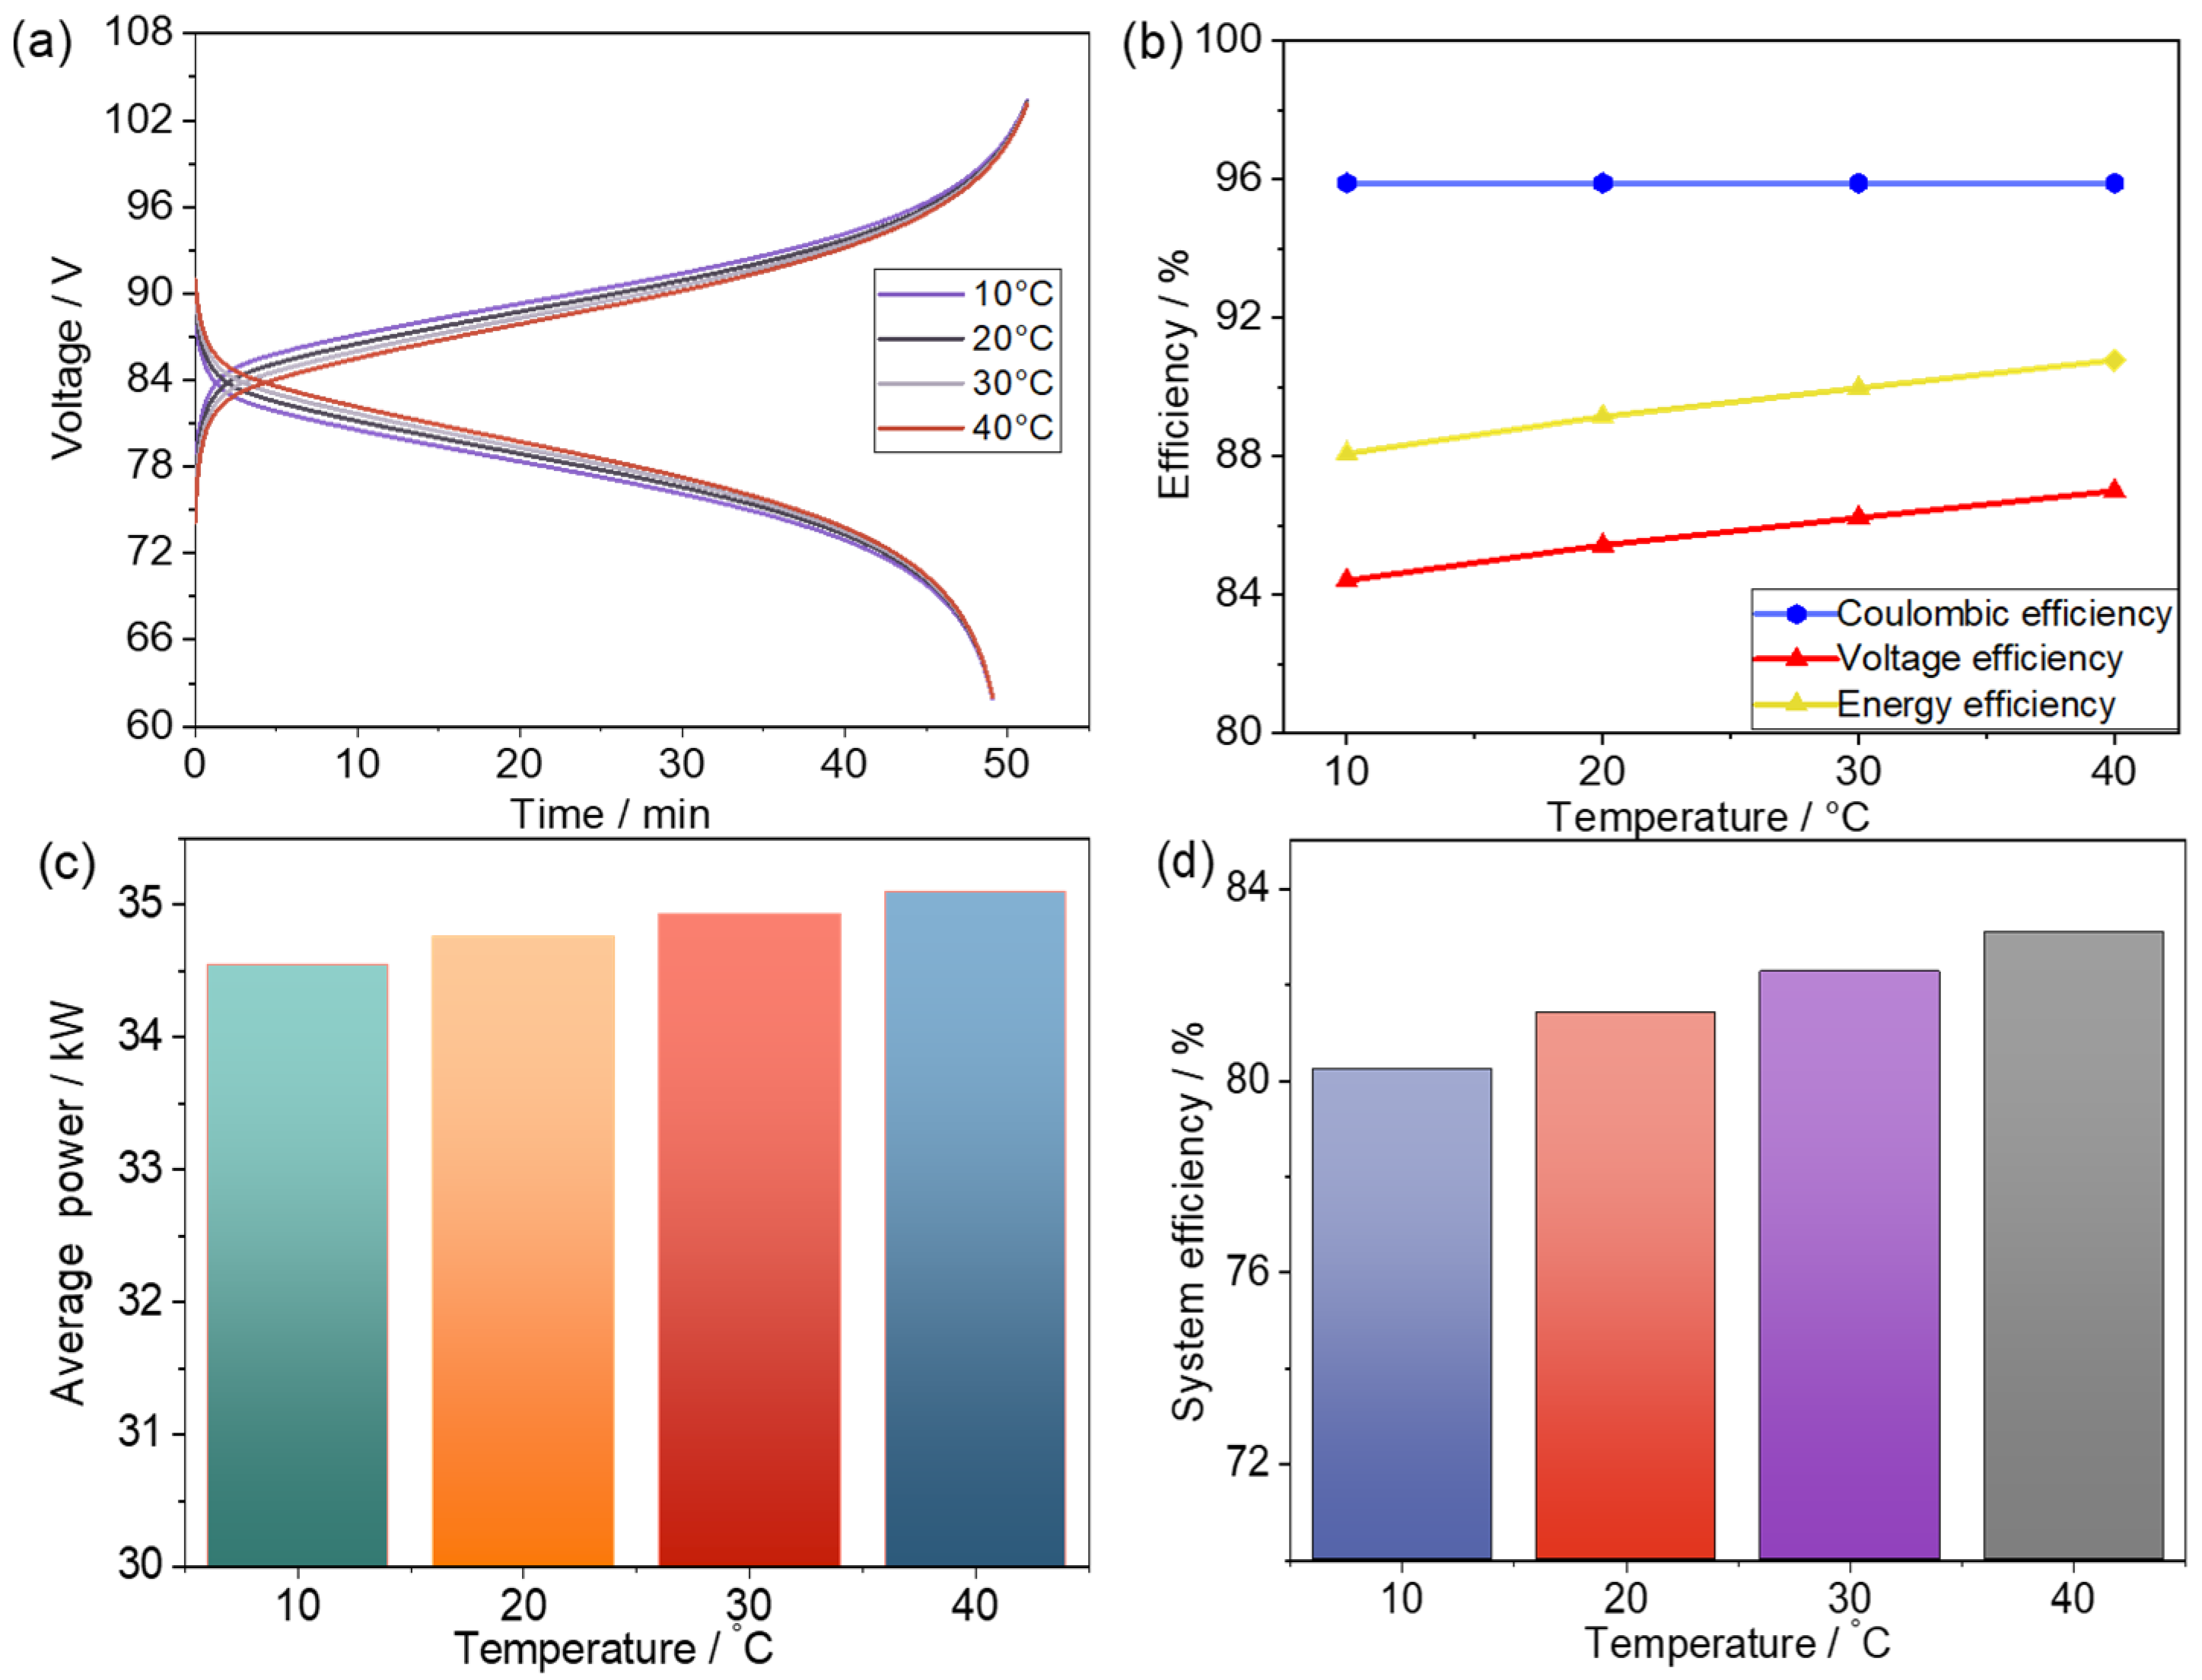
3.3. Optimization of Flow Rate
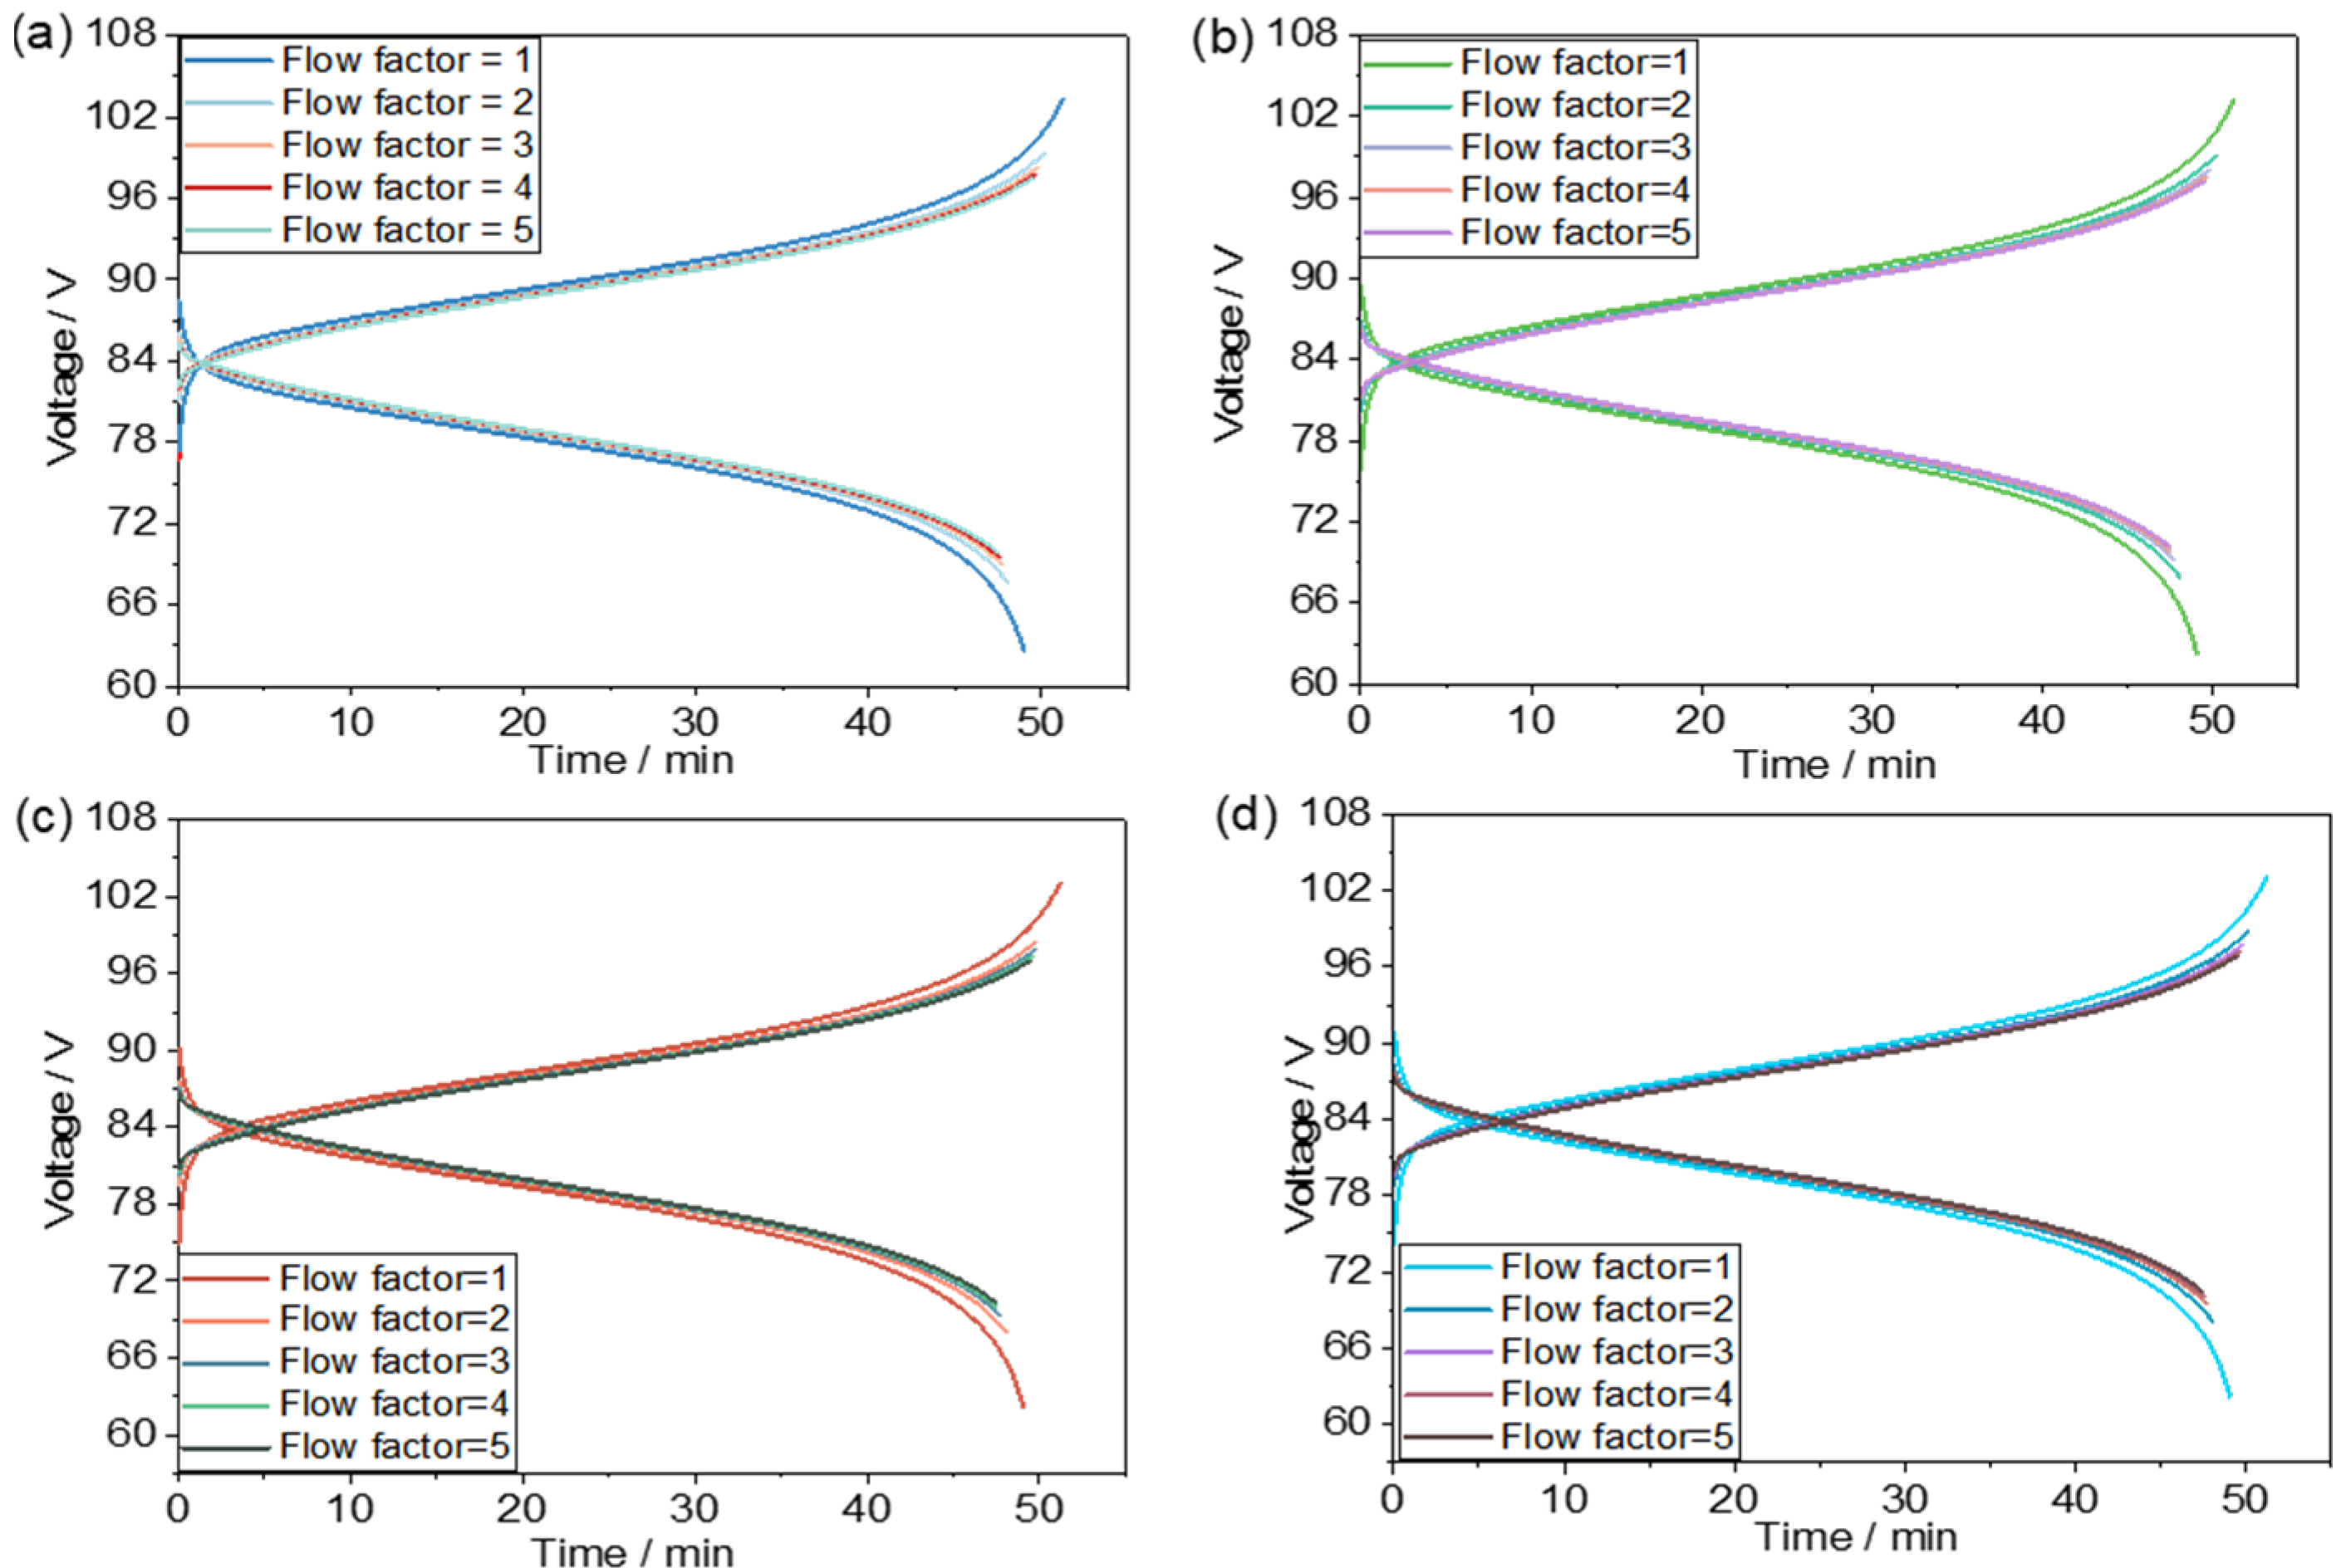
3.3.1. Charging–Discharging Behavior
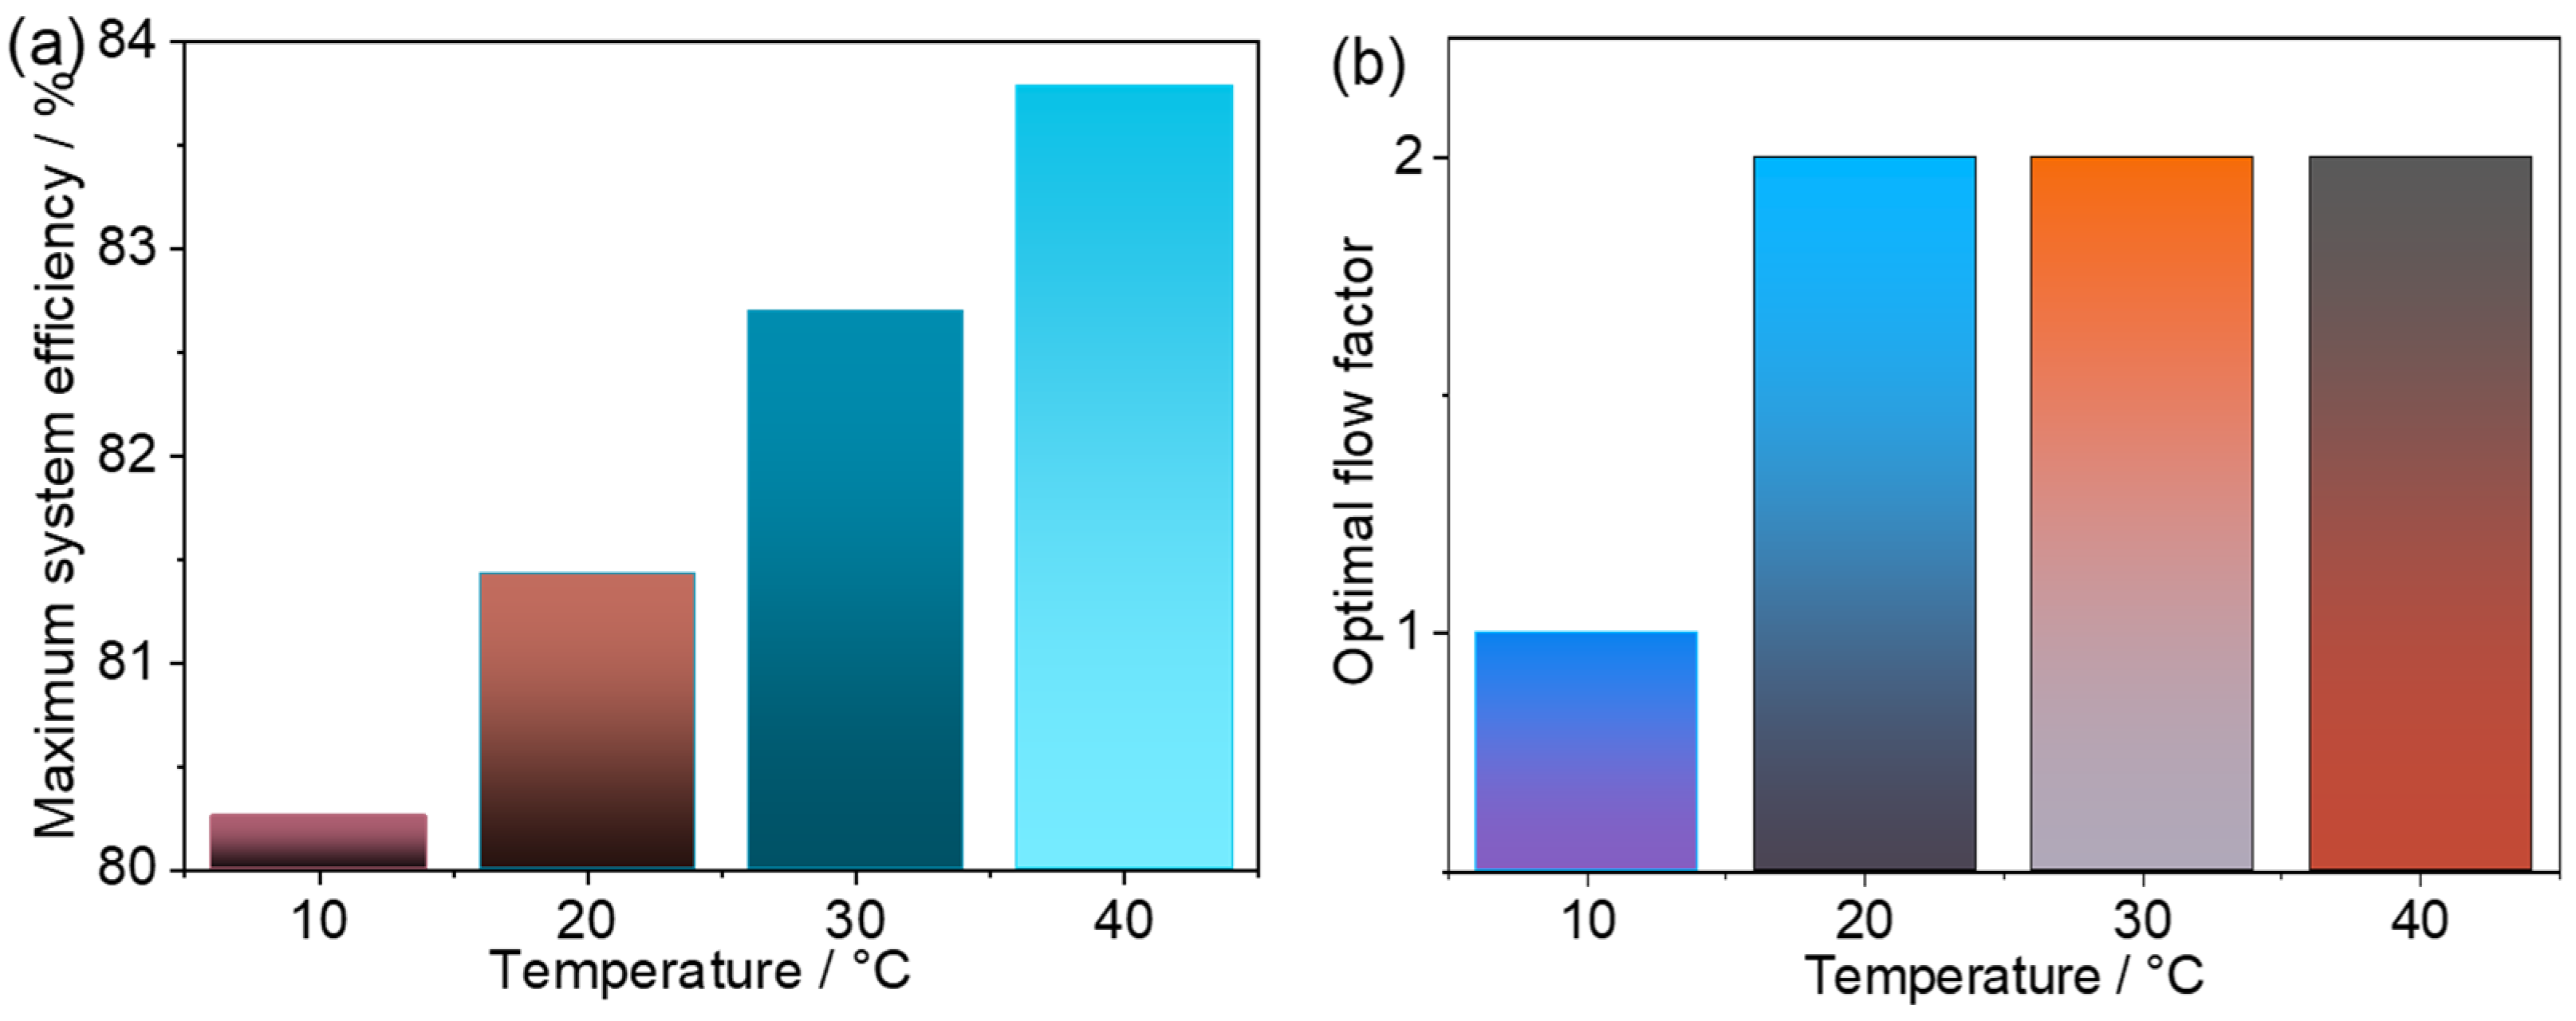
3.3.2. Optimal System Efficiency and Flow Rate
4. Conclusions
Author Contributions
Funding
Institutional Review Board Statement
Informed Consent Statement
Data Availability Statement
Conflicts of Interest
References
- Zhao, Z.; Zhang, C.; Li, X. Opportunities and challenges of organic flow battery for electrochemical energy storage technology. J. Energy Chem. 2022, 67, 621–639. [Google Scholar] [CrossRef]
- Parasuraman, A.; Lim, T.M.; Menictas, C.; Skyllas-Kazacos, M. Review of material research and development for vanadium redox flow battery applications. Electrochim. Acta 2013, 101, 27–40. [Google Scholar] [CrossRef]
- Khaki, B.; Das, P. Multi-objective optimal charging current and flow management of Vanadium Redox Flow Batteries for fast charging and energy-efficient operation. J. Power Sources 2021, 506, 230199. [Google Scholar] [CrossRef]
- Trovò, A. Battery management system for industrial-scale vanadium redox flow batteries: Features and operation. J. Power Sources 2020, 465, 228229. [Google Scholar] [CrossRef]
- Emmett, R.K.; Roberts, M.E. Recent developments in alternative aqueous redox flow batteries for grid-scale energy storage. J. Power Sources 2021, 506, 230087. [Google Scholar] [CrossRef]
- Li, Z.; Jiang, T.; Ali, M.; Wu, C.; Chen, W. Recent Progress in Organic Species for Redox Flow Batteries. Energy Storage Mater. 2022, 50, 105–138. [Google Scholar] [CrossRef]
- Khaki, B.; Das, P. Voltage loss and capacity fade reduction in vanadium redox battery by electrolyte flow control. Electrochim. Acta 2022, 405, 139842. [Google Scholar] [CrossRef]
- Chen, H.; Su, M.; Liu, Y.; Chen, Z.; Chen, F. In-Depth Analysis of Transport Delay on Cell Performance and Modeling Precision for All-Vanadium Flow Battery. J. Electrochem. Soc. 2021, 168, 060546. [Google Scholar] [CrossRef]
- Huang, Z.; Mu, A.; Wu, L.; Wang, H. Vanadium redox flow batteries: Flow field design and flow rate optimization. J. Energy Storage 2022, 45, 103526. [Google Scholar] [CrossRef]
- Javed, M.S.; Zhong, D.; Ma, T.; Song, A.; Ahmed, S. Hybrid pumped hydro and battery storage for renewable energy based power supply system. Appl. Energy 2020, 257, 114026. [Google Scholar] [CrossRef]
- Chen, H.; Li, X.; Gao, H.; Liu, J.; Yan, C.; Tang, A. Numerical modelling and in-depth analysis of multi-stack vanadium flow battery module incorporating transport delay. Appl. Energy 2019, 247, 13–23. [Google Scholar] [CrossRef]
- Tang, A.; Bao, J.; Skyllas-Kazacos, M. Studies on pressure losses and flow rate optimization in vanadium redox flow battery. J. Power Sources 2014, 248, 154–162. [Google Scholar] [CrossRef]
- Trovo, A.; Guarnieri, M. Battery management system with testing protocols for kW-class vanadium redox flow batteries. In Proceedings of the 2020 2nd IEEE International Conference on Industrial Electronics for Sustainable Energy Systems (IESES), Cagliari, Italy, 1–3 September 2020; pp. 33–38. [Google Scholar] [CrossRef]
- Ma, X.; Zhang, H.; Sun, C.; Zou, Y.; Zhang, T. An optimal strategy of electrolyte flow rate for vanadium redox flow battery. J. Power Sources 2012, 203, 153–158. [Google Scholar] [CrossRef]
- Karrech, A.; Regenauer-Lieb, K.; Abbassi, F. Vanadium flow batteries at variable flow rates. J. Energy Storage 2022, 45, 103623. [Google Scholar] [CrossRef]
- Wang, W.; Tian, L. Control strategy optimization of electrolyte flow rate for all vanadium redox flow battery with consideration of pump. Renew. Energy 2018, 133, 1445–1454. [Google Scholar]
- König, S.; Suriyah, M.R.; Leibfried, T. Innovative model-based flow rate optimization for vanadium redox flow batteries. J. Power Sources 2016, 333, 134–144. [Google Scholar] [CrossRef]
- Pugach, M.; Parsegov, S.; Gryazina, E.; Bischi, A. Output feedback control of electrolyte flow rate for Vanadium Redox Flow Batteries. J. Power Sources 2020, 455, 227916. [Google Scholar] [CrossRef]
- Badrinarayanan, R.; Zhao, J.; Tseng, K.; Skyllas-Kazacos, M. Extended dynamic model for ion diffusion in all-vanadium redox flow battery including the effects of temperature and bulk electrolyte transfer. J. Power Sources 2014, 270, 576–586. [Google Scholar] [CrossRef]
- Tang, A.; Skyllas-Kazacos, M. Simulation Analysis of Regional Temperature Effects and Battery Management Schedules for a Residential-Scale Vanadium Redox Flow Battery System. Chempluschem 2015, 80, 368–375. [Google Scholar] [CrossRef]
- Xiong, B.; Yang, Y.; Tang, J.; Li, Y.; Wei, Z.; Su, Y.; Zhang, Q. An Enhanced Equivalent Circuit Model of Vanadium Redox Flow Battery Energy Storage Systems Considering Thermal Effects. IEEE Access 2019, 7, 62297–162308. [Google Scholar] [CrossRef]
- Tang, A.; Ting, S.; Tao, J.; Skyllas-Kazacos, M. Thermal modelling and simulation of the all-vanadium redox flow battery. J. Power Sources 2012, 203, 165–176. [Google Scholar] [CrossRef]
- Tang, A.; Tao, J.; Skyllas-Kazacos, M. Thermal modelling of battery configuration and self-discharge reactions in vanadium redox flow battery. J. Power Sources 2012, 216, 489–501. [Google Scholar] [CrossRef]
- Rho, K.H.; Yoon, S.J.; Ryu, J.; Cho, S.M.; Kim, M.S.; Kim, D.K. Study on thermal behavior of vanadium redox flow battery at low temperature to prevent precipitation. J. Energy Storage 2022, 49, 104110. [Google Scholar] [CrossRef]
- Wang, T.; Fu, J.; Zheng, M.; Yu, Z. Dynamic control strategy for the electrolyte flow rate of vanadium redox flow batteries. Appl. Energy 2018, 227, 613–623. [Google Scholar] [CrossRef]
- Kim, J.; Park, H. Electrokinetic parameters of a vanadium redox flow battery with varying temperature and electrolyte flow rate. Renew. Energy 2019, 138, 284–291. [Google Scholar] [CrossRef]
- Lourenssen, K.; Williams, J.; Ahmadpour, F.; Clemmer, R.; Tasnim, S. Vanadium redox flow batteries: A comprehensive review. J. Energy Storage 2019, 25, 100844. [Google Scholar] [CrossRef]
- Tang, A.; Bao, J.; Skyllas-Kazacos, M. Dynamic modelling of the effects of ion diffusion and side reactions on the capacity loss for vanadium redox flow battery. J. Power Sources 2011, 196, 10737–10747. [Google Scholar] [CrossRef]
- Li, X.; Xiong, J.; Tang, A.; Qin, Y.; Liu, J.; Yan, C. Investigation of the use of electrolyte viscosity for online state-of-charge monitoring design in vanadium redox flow battery. Appl. Energy 2018, 211, 1050–1059. [Google Scholar] [CrossRef]
- Guarnieri, M.; Trovò, A.; Picano, F. Enhancing the Efficiency of KW-Class Vanadium Redox Flow Batteries by Flow Factor Modulation: An Experimental Method. Appl. Energy 2020, 262, 114532. [Google Scholar] [CrossRef]
- Chen, H.; Han, L.; Zhang, Y.; Zhang, S.; Chen, F.; Ma, X.; Zhang, Q. Modeling and Optimization of Vanadium Flow Batteries Incorporating Variable Permeability and Resistance. J. Electrochem. Soc. 2022, 169, 110518. [Google Scholar] [CrossRef]
- Chen, H.; Cheng, M.; Liu, L.; Wang, Y.; Chen, F.; Ma, X.; Zhang, Q. Mathematical modeling and in-depth analysis of 10 kW-class iron-vanadium flow batteries. J. Power Sources 2023, 563, 232813. [Google Scholar] [CrossRef]


| Parameters | Value |
|---|---|
| Total concentration of vanadium | 1.7 mol L−1 |
| Flow rate | 10 mL min−1 and 50 mL min−1 |
| Voltage range | 1 V–1.7 V |
| Electrode dimension | 4.2 mm ×4 cm × 7 cm |
| Electrolyte volume | 50 mL |
| Applied current density | 100 mA cm−2 |
| Parameters | Value |
|---|---|
| Electrolyte volume | 400 L |
| Vanadium concentration | 1.7 mol L−1 |
| Number of cells in the stack | 60 |
| Cut-off for charging/discharging | SOC = 90%/10% |
| Diffusion coefficient of V2+ | 3.125 × 10⁻¹² |
| Diffusion coefficient of V3+ | 5.93 × 10⁻¹² |
| Diffusion coefficient of VO2+ | 5.0 × 10⁻¹² |
| Diffusion coefficient of VO2+ | 1.17 × 10⁻¹² |
| Electrode porosity | 93% |
| Electrode size | 900 mm × 500 mm × 4.2 mm |
| Flow rate | 5 m3 h−1 |
| Temperature | 298.15 K |
| Cell formal potential | 1.4 V |
Disclaimer/Publisher’s Note: The statements, opinions and data contained in all publications are solely those of the individual author(s) and contributor(s) and not of MDPI and/or the editor(s). MDPI and/or the editor(s) disclaim responsibility for any injury to people or property resulting from any ideas, methods, instructions or products referred to in the content. |
© 2023 by the authors. Licensee MDPI, Basel, Switzerland. This article is an open access article distributed under the terms and conditions of the Creative Commons Attribution (CC BY) license (https://creativecommons.org/licenses/by/4.0/).
Share and Cite
Han, L.; Chen, H.; Cheng, X.; He, Q.; Chen, F.; Zhang, Q. Numerical Analysis and Optimization of Flow Rate for Vanadium Flow Battery Incorporating Temperature Effect. Batteries 2023, 9, 312. https://doi.org/10.3390/batteries9060312
Han L, Chen H, Cheng X, He Q, Chen F, Zhang Q. Numerical Analysis and Optimization of Flow Rate for Vanadium Flow Battery Incorporating Temperature Effect. Batteries. 2023; 9(6):312. https://doi.org/10.3390/batteries9060312
Chicago/Turabian StyleHan, Lukang, Hui Chen, Xiangdong Cheng, Qiang He, Fuyu Chen, and Qinfang Zhang. 2023. "Numerical Analysis and Optimization of Flow Rate for Vanadium Flow Battery Incorporating Temperature Effect" Batteries 9, no. 6: 312. https://doi.org/10.3390/batteries9060312