
3D Heterogeneous Model for Electrodes in Lithium-Ion Batteries and Its Application to a Modified Continuum Model
Abstract
:
1. Introduction
2. Methods—Electrode Microstructure
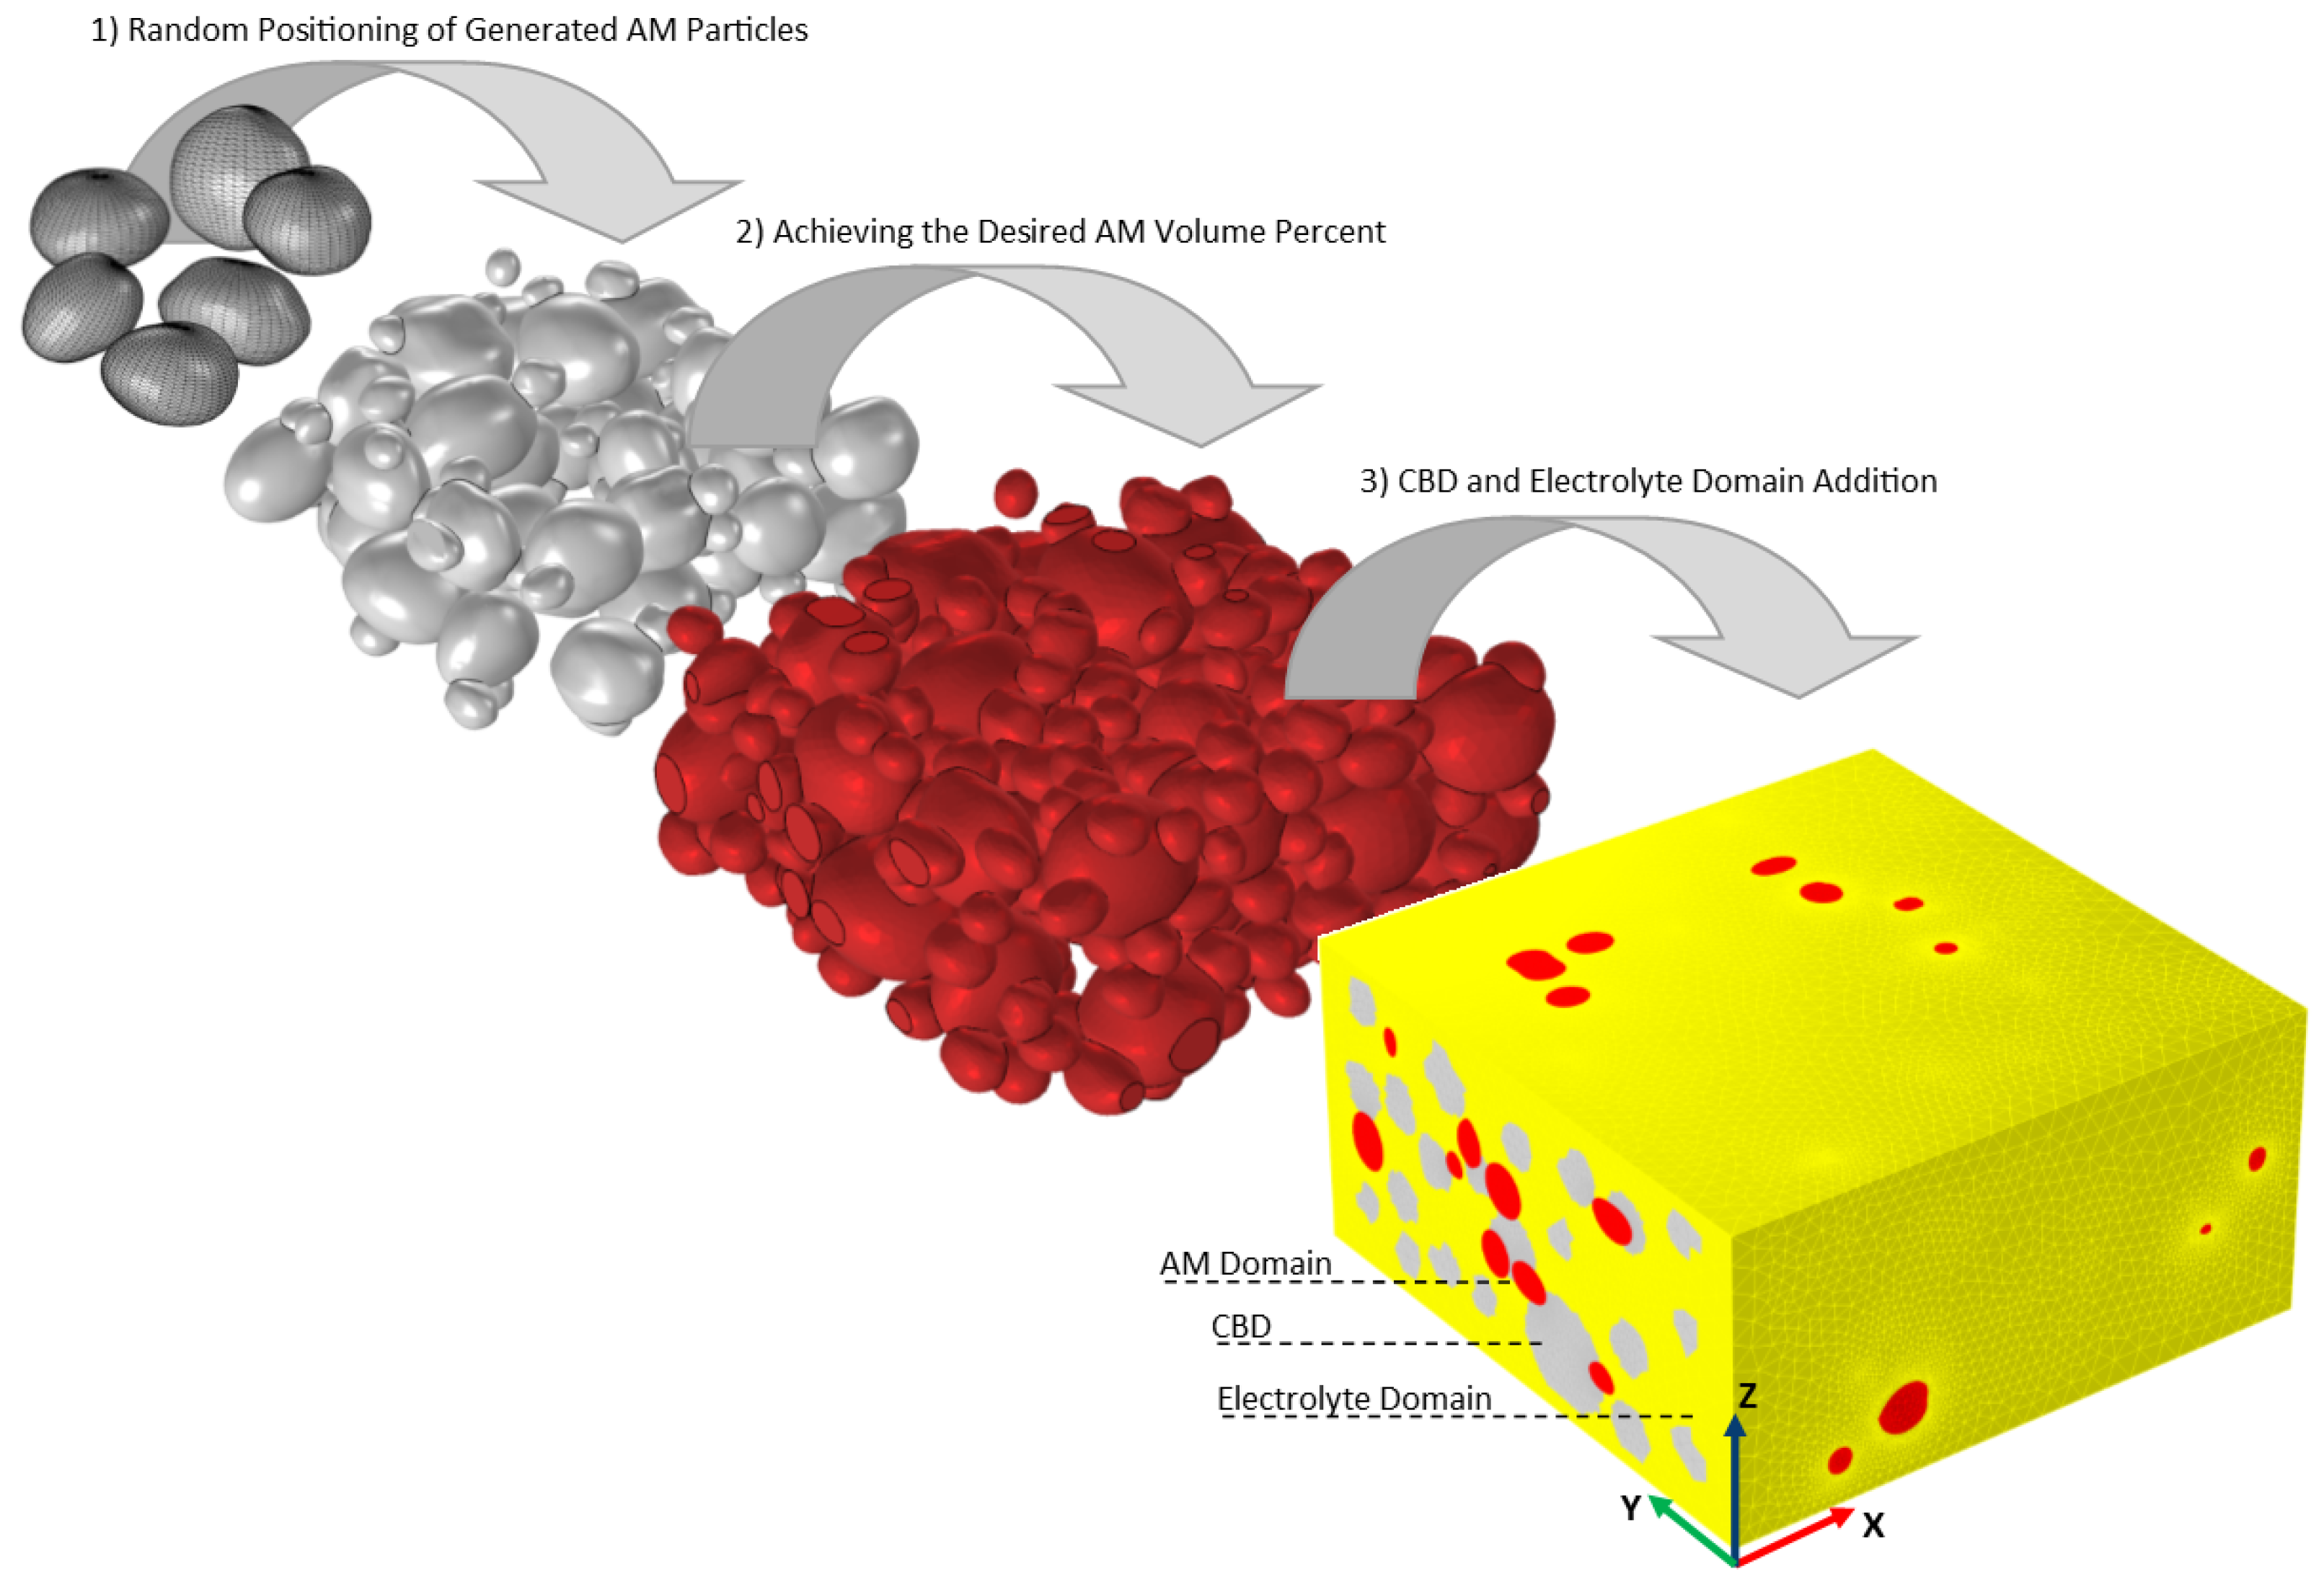
2.1. Microstructure Generation
2.1.1. Spherical Harmonics
2.1.2. Active Material Domain
2.1.3. Carbon Binder Domain
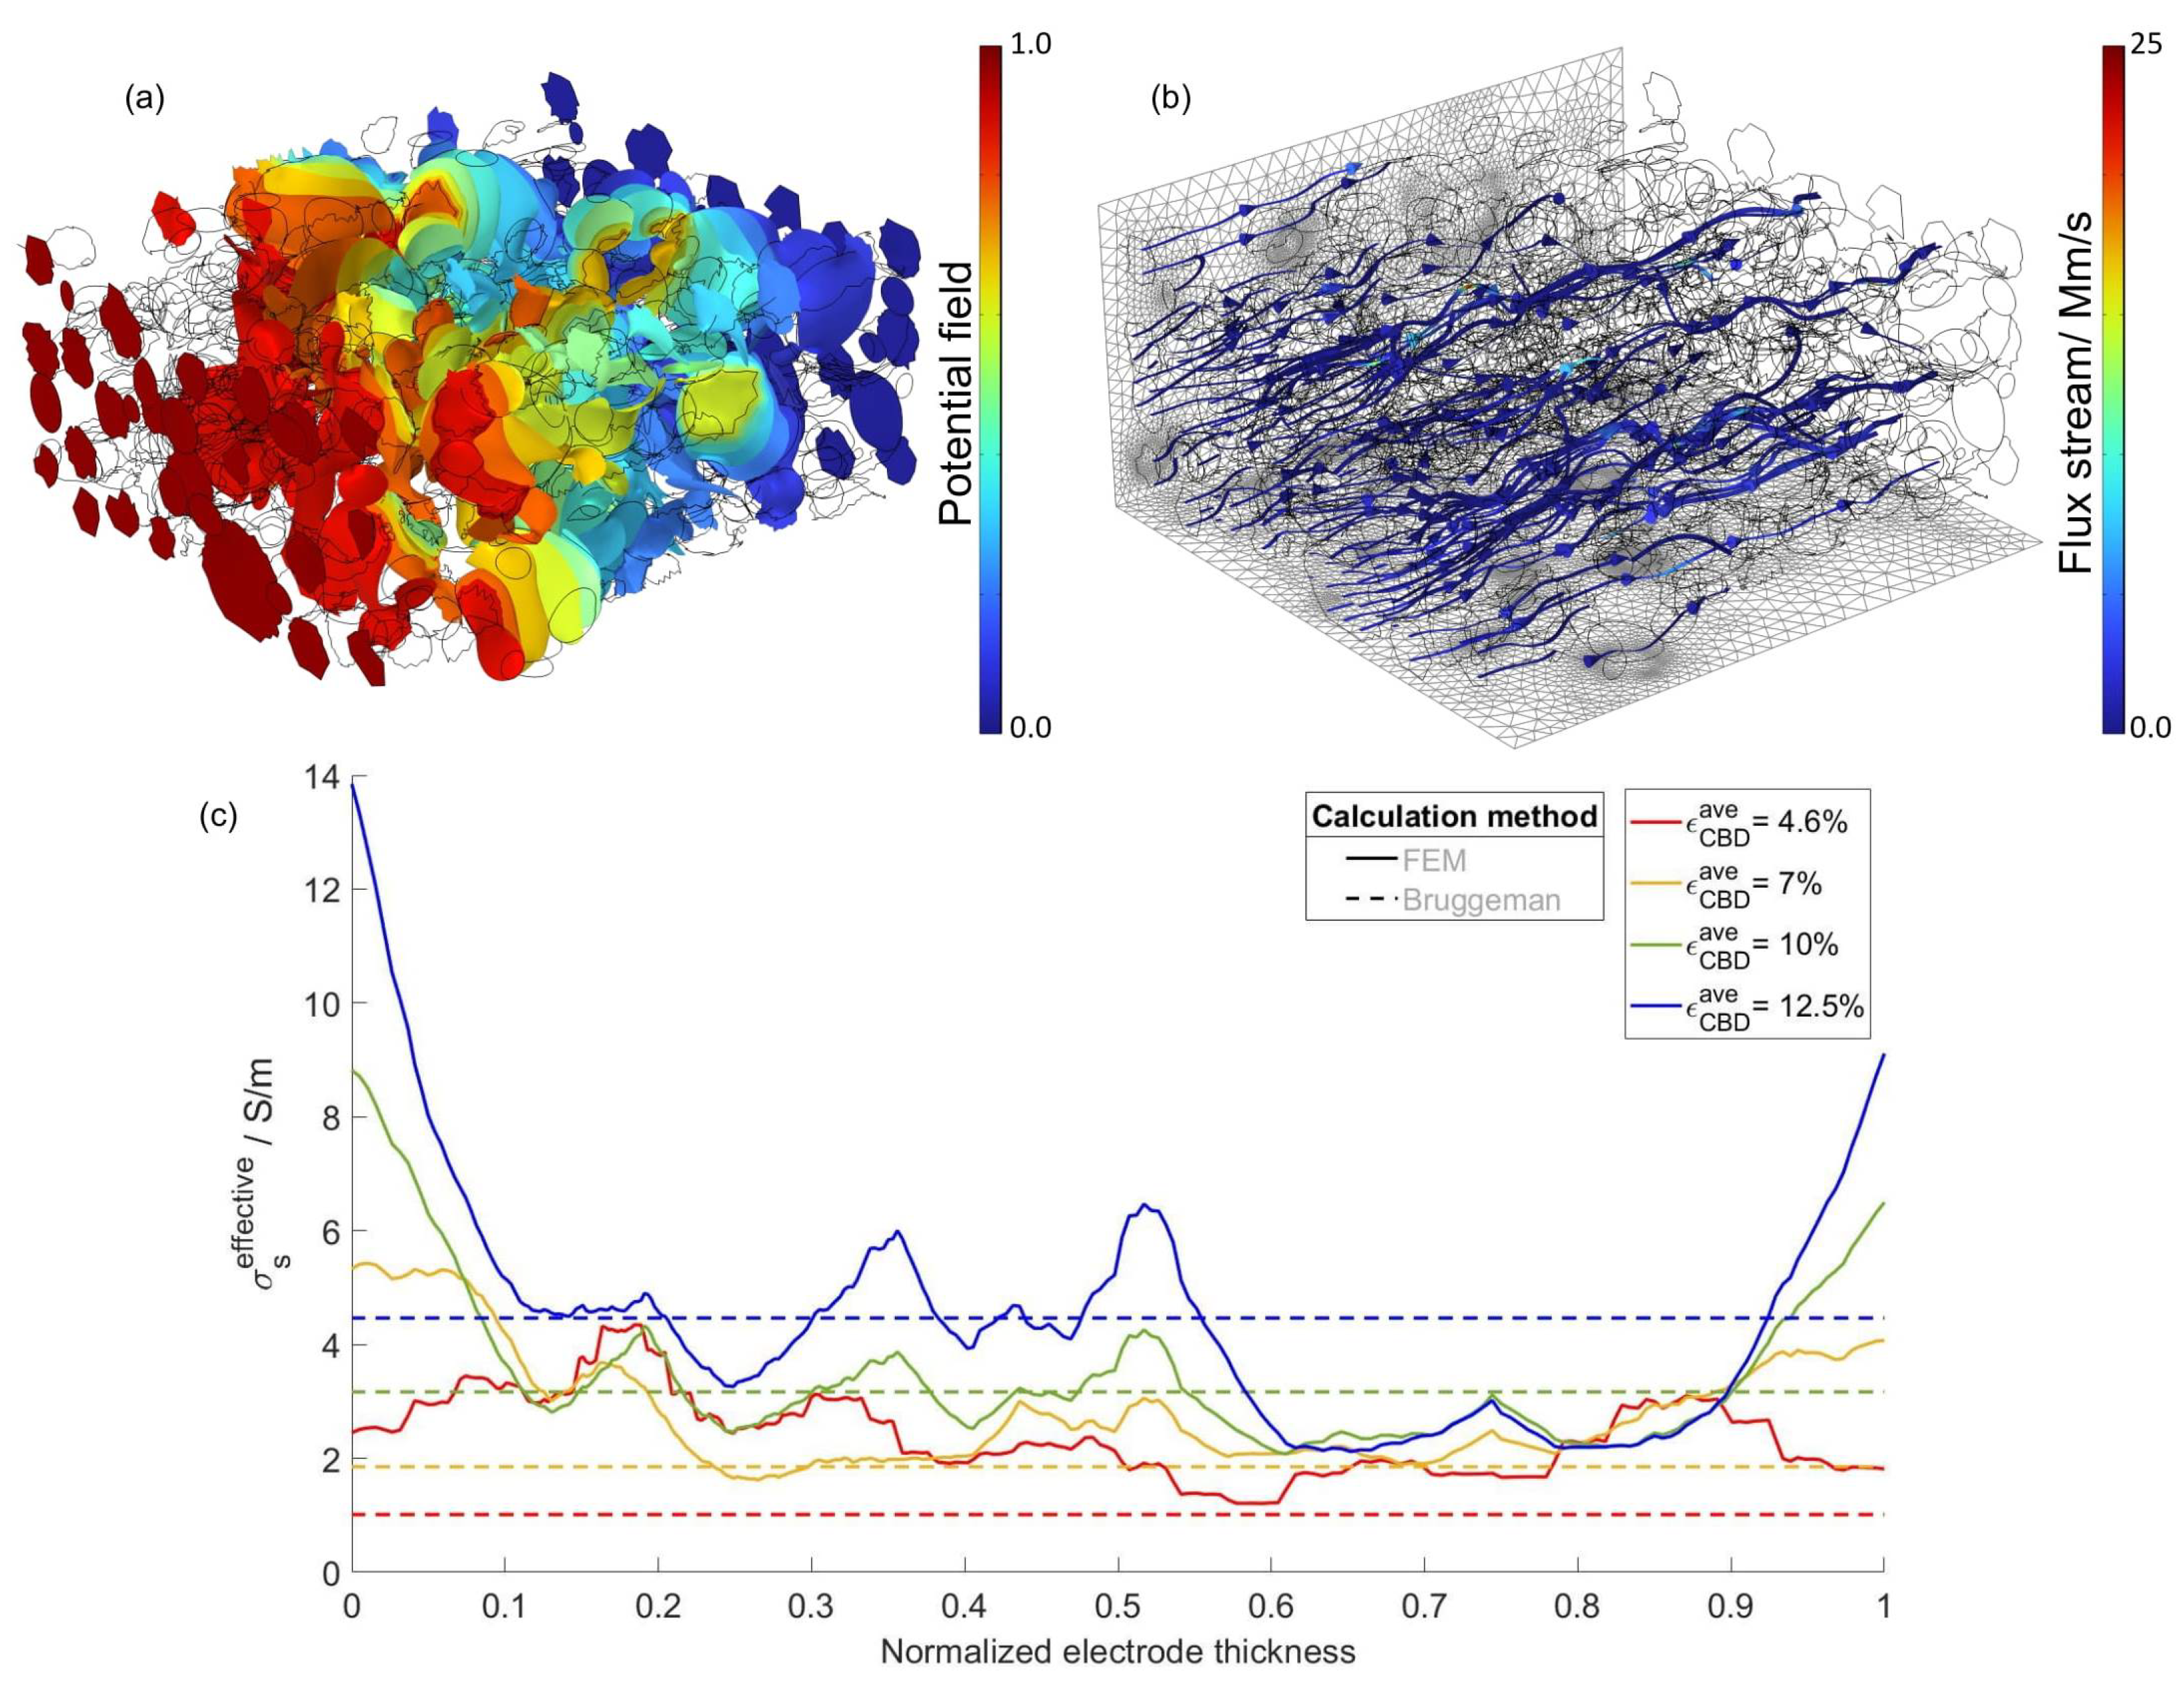
2.2. FEM-Based Calculation of the Effective Transport Coefficients of the Developed Electrode
3. Methods—Electrochemical Model
3.1. Governing Equations
3.1.1. Solid Domains
3.1.2. Pore and Separator Domains
3.1.3. Lithium Foil Boundary
3.2. Electrochemical Impedance Spectroscopy
4. Results and Discussion
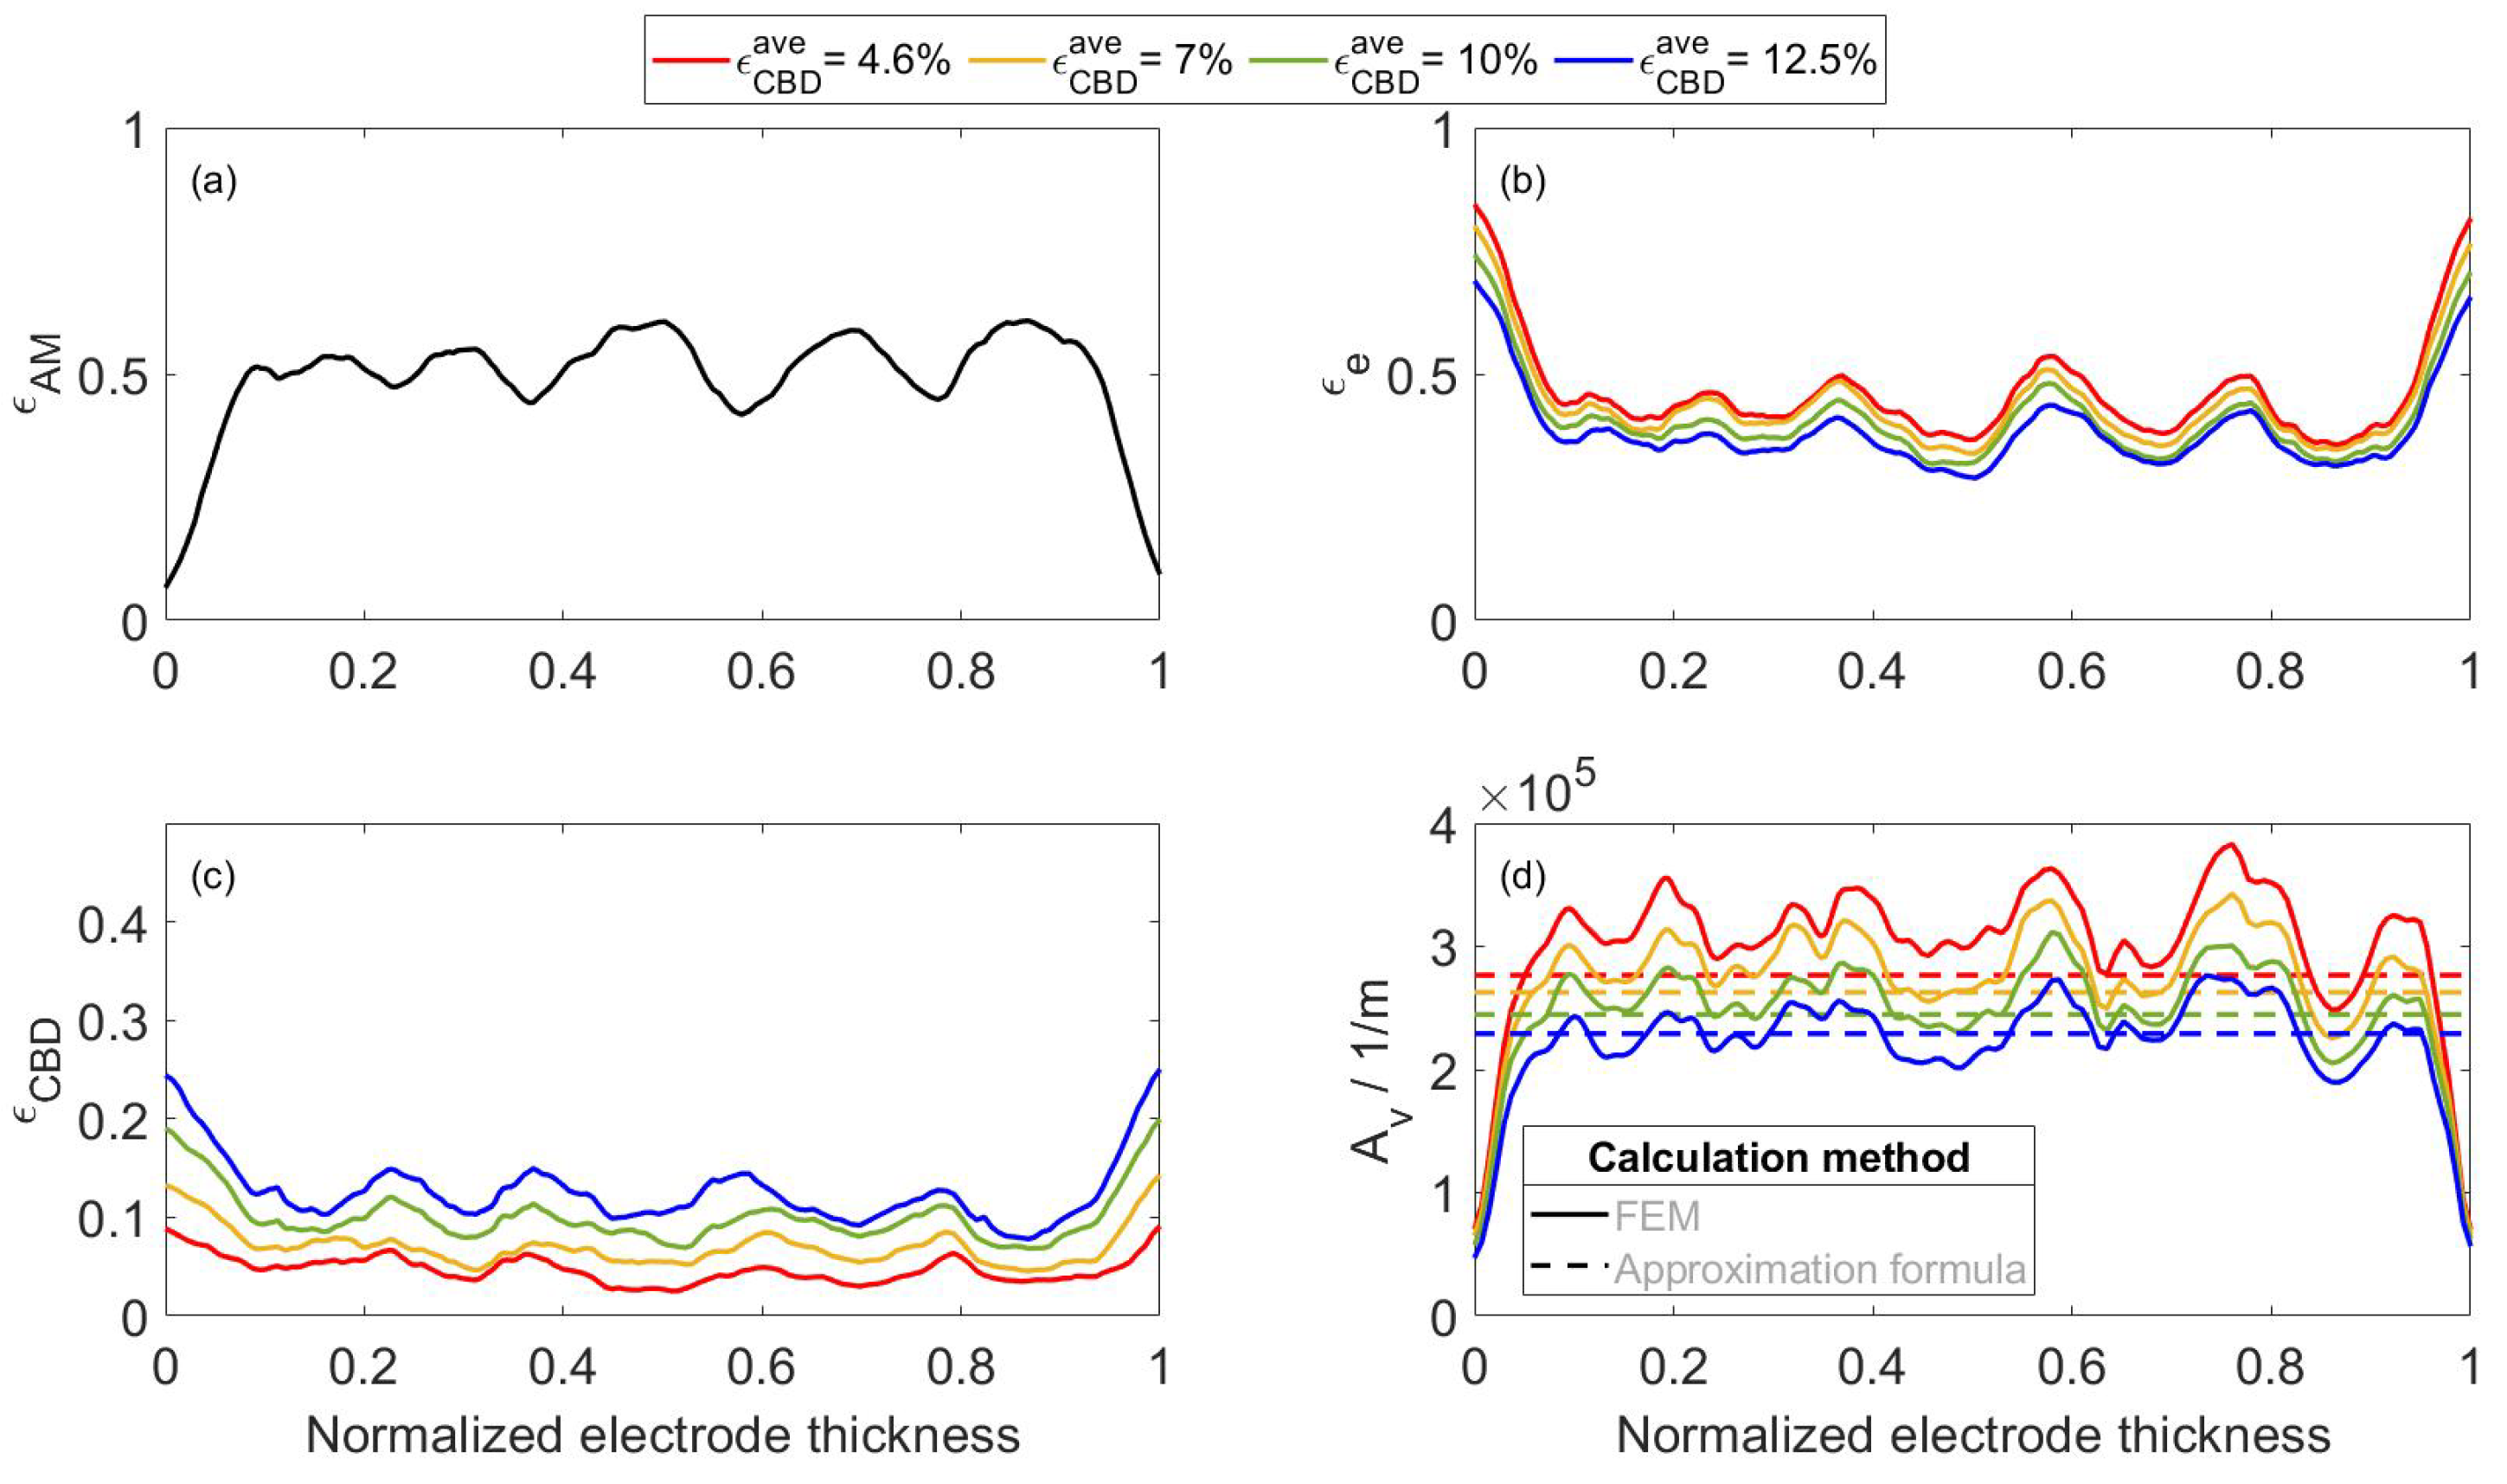
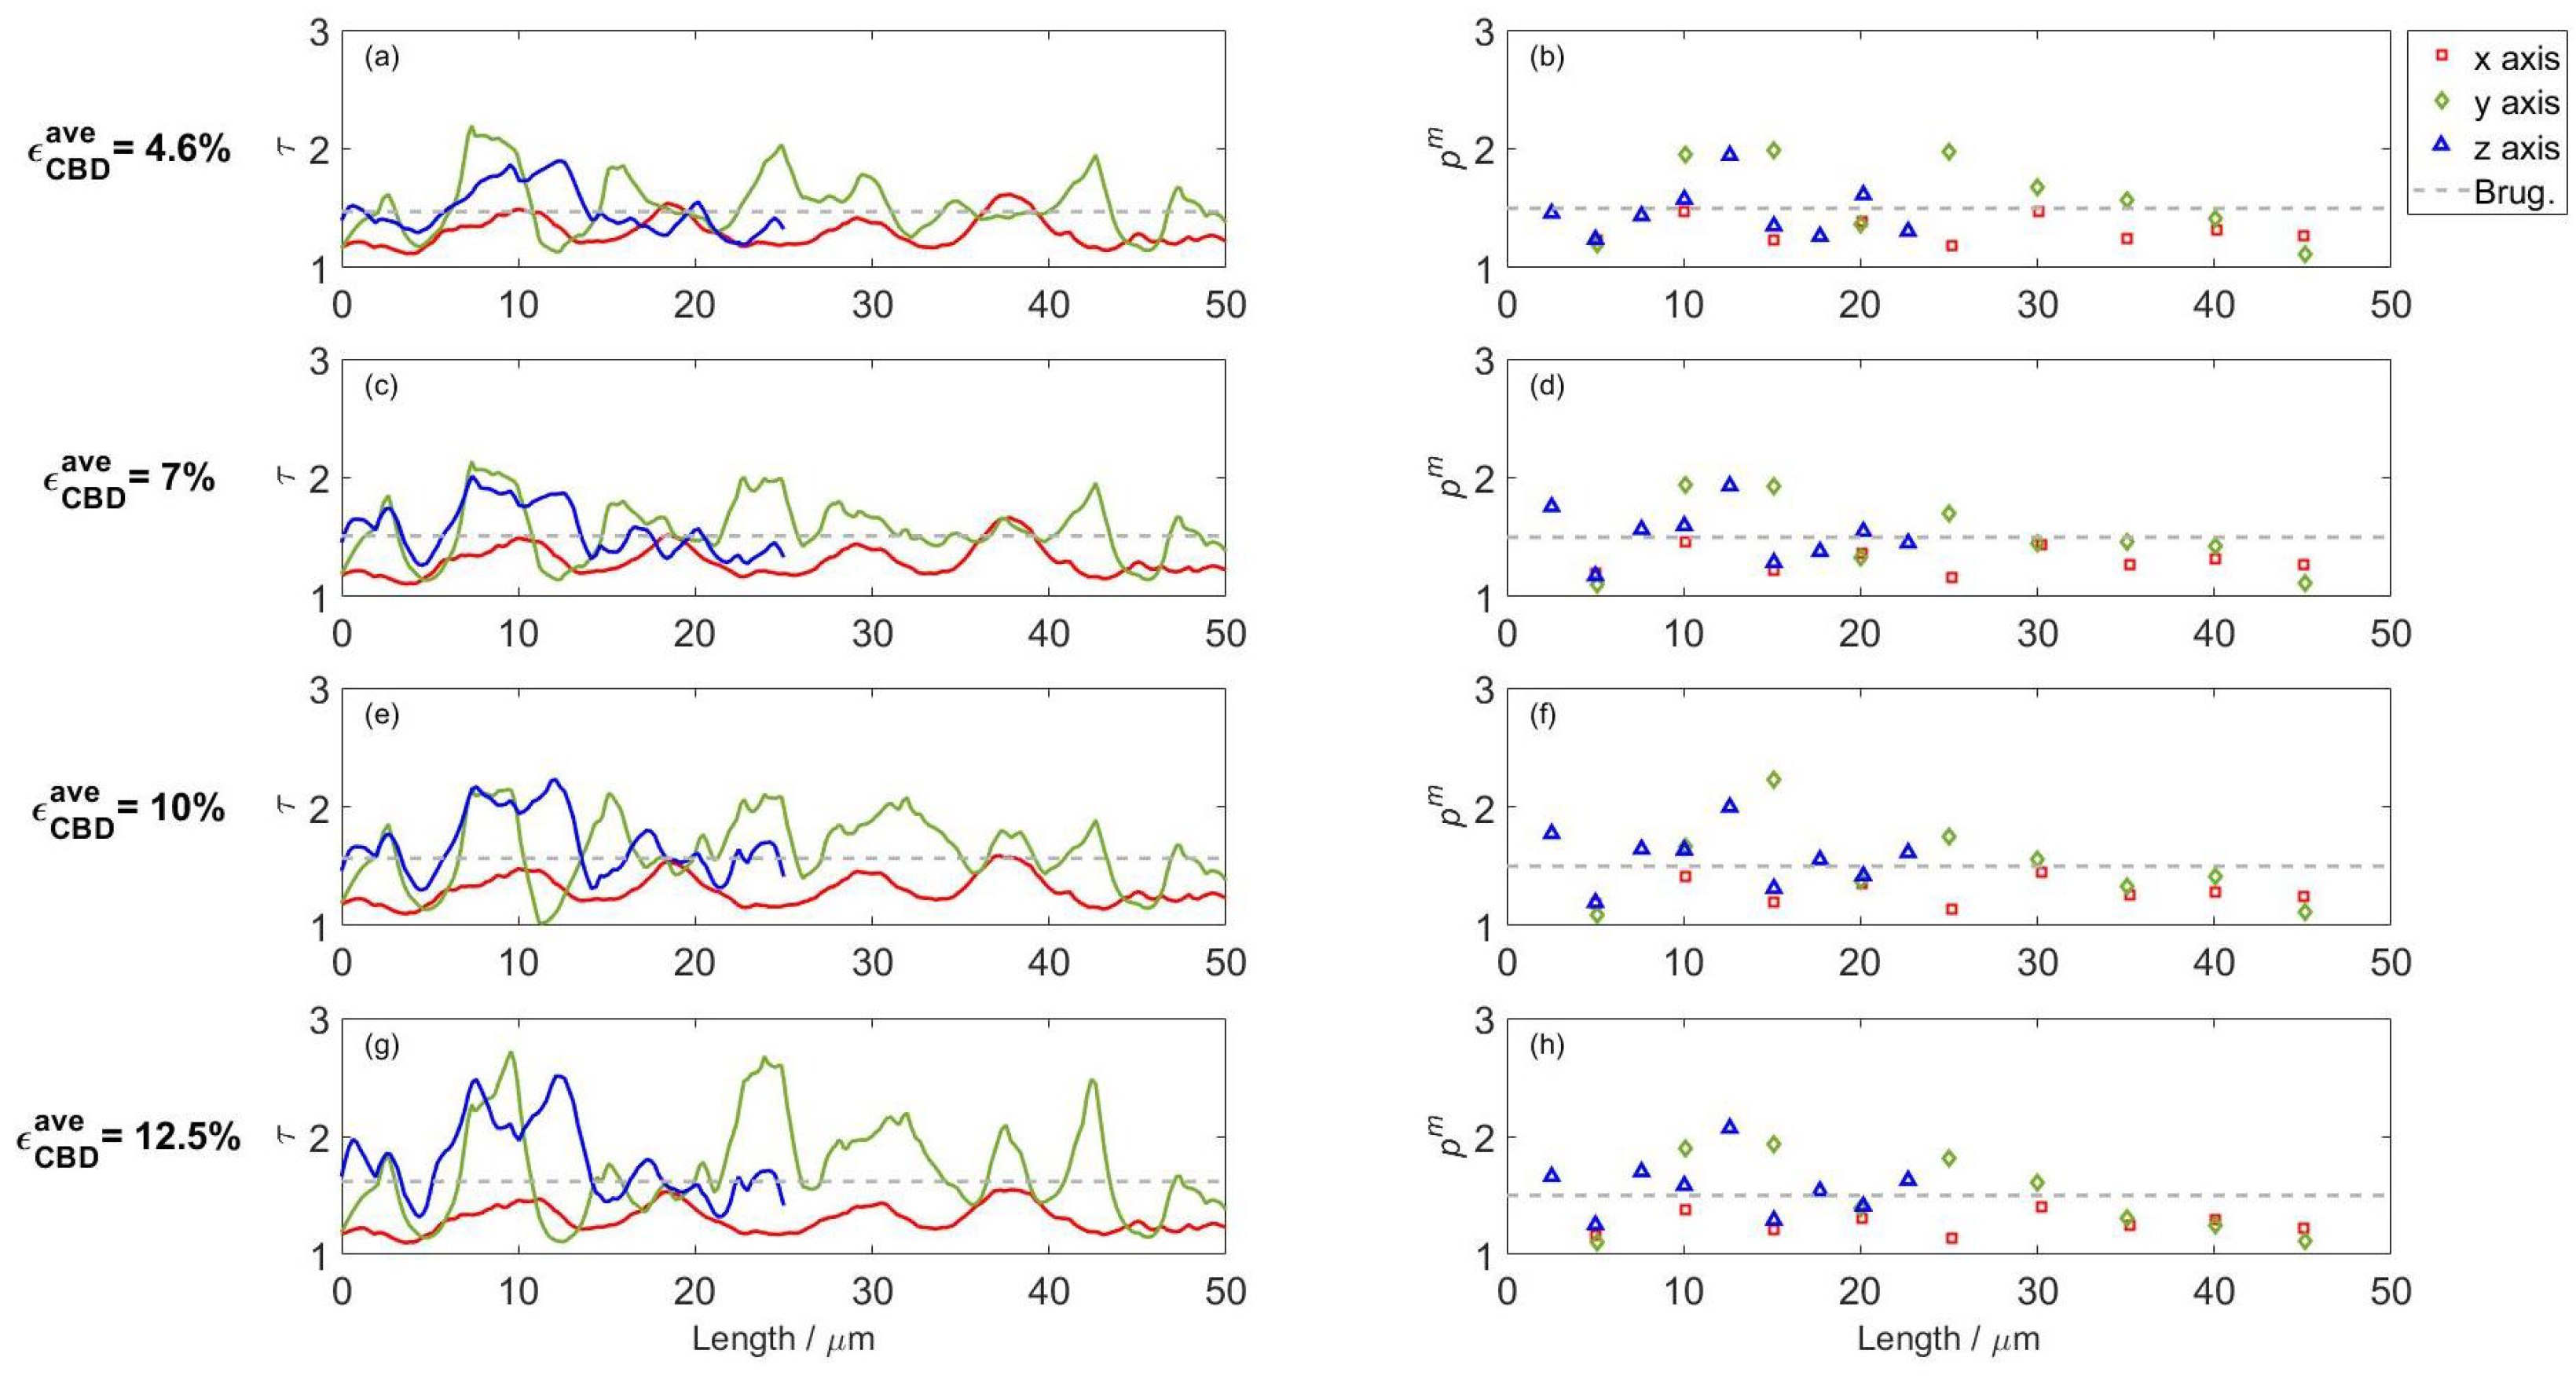
4.1. Numeric-Based Analysis of Electrode Porous Microstructure
4.2. Numeric-Based Impedance Spectra
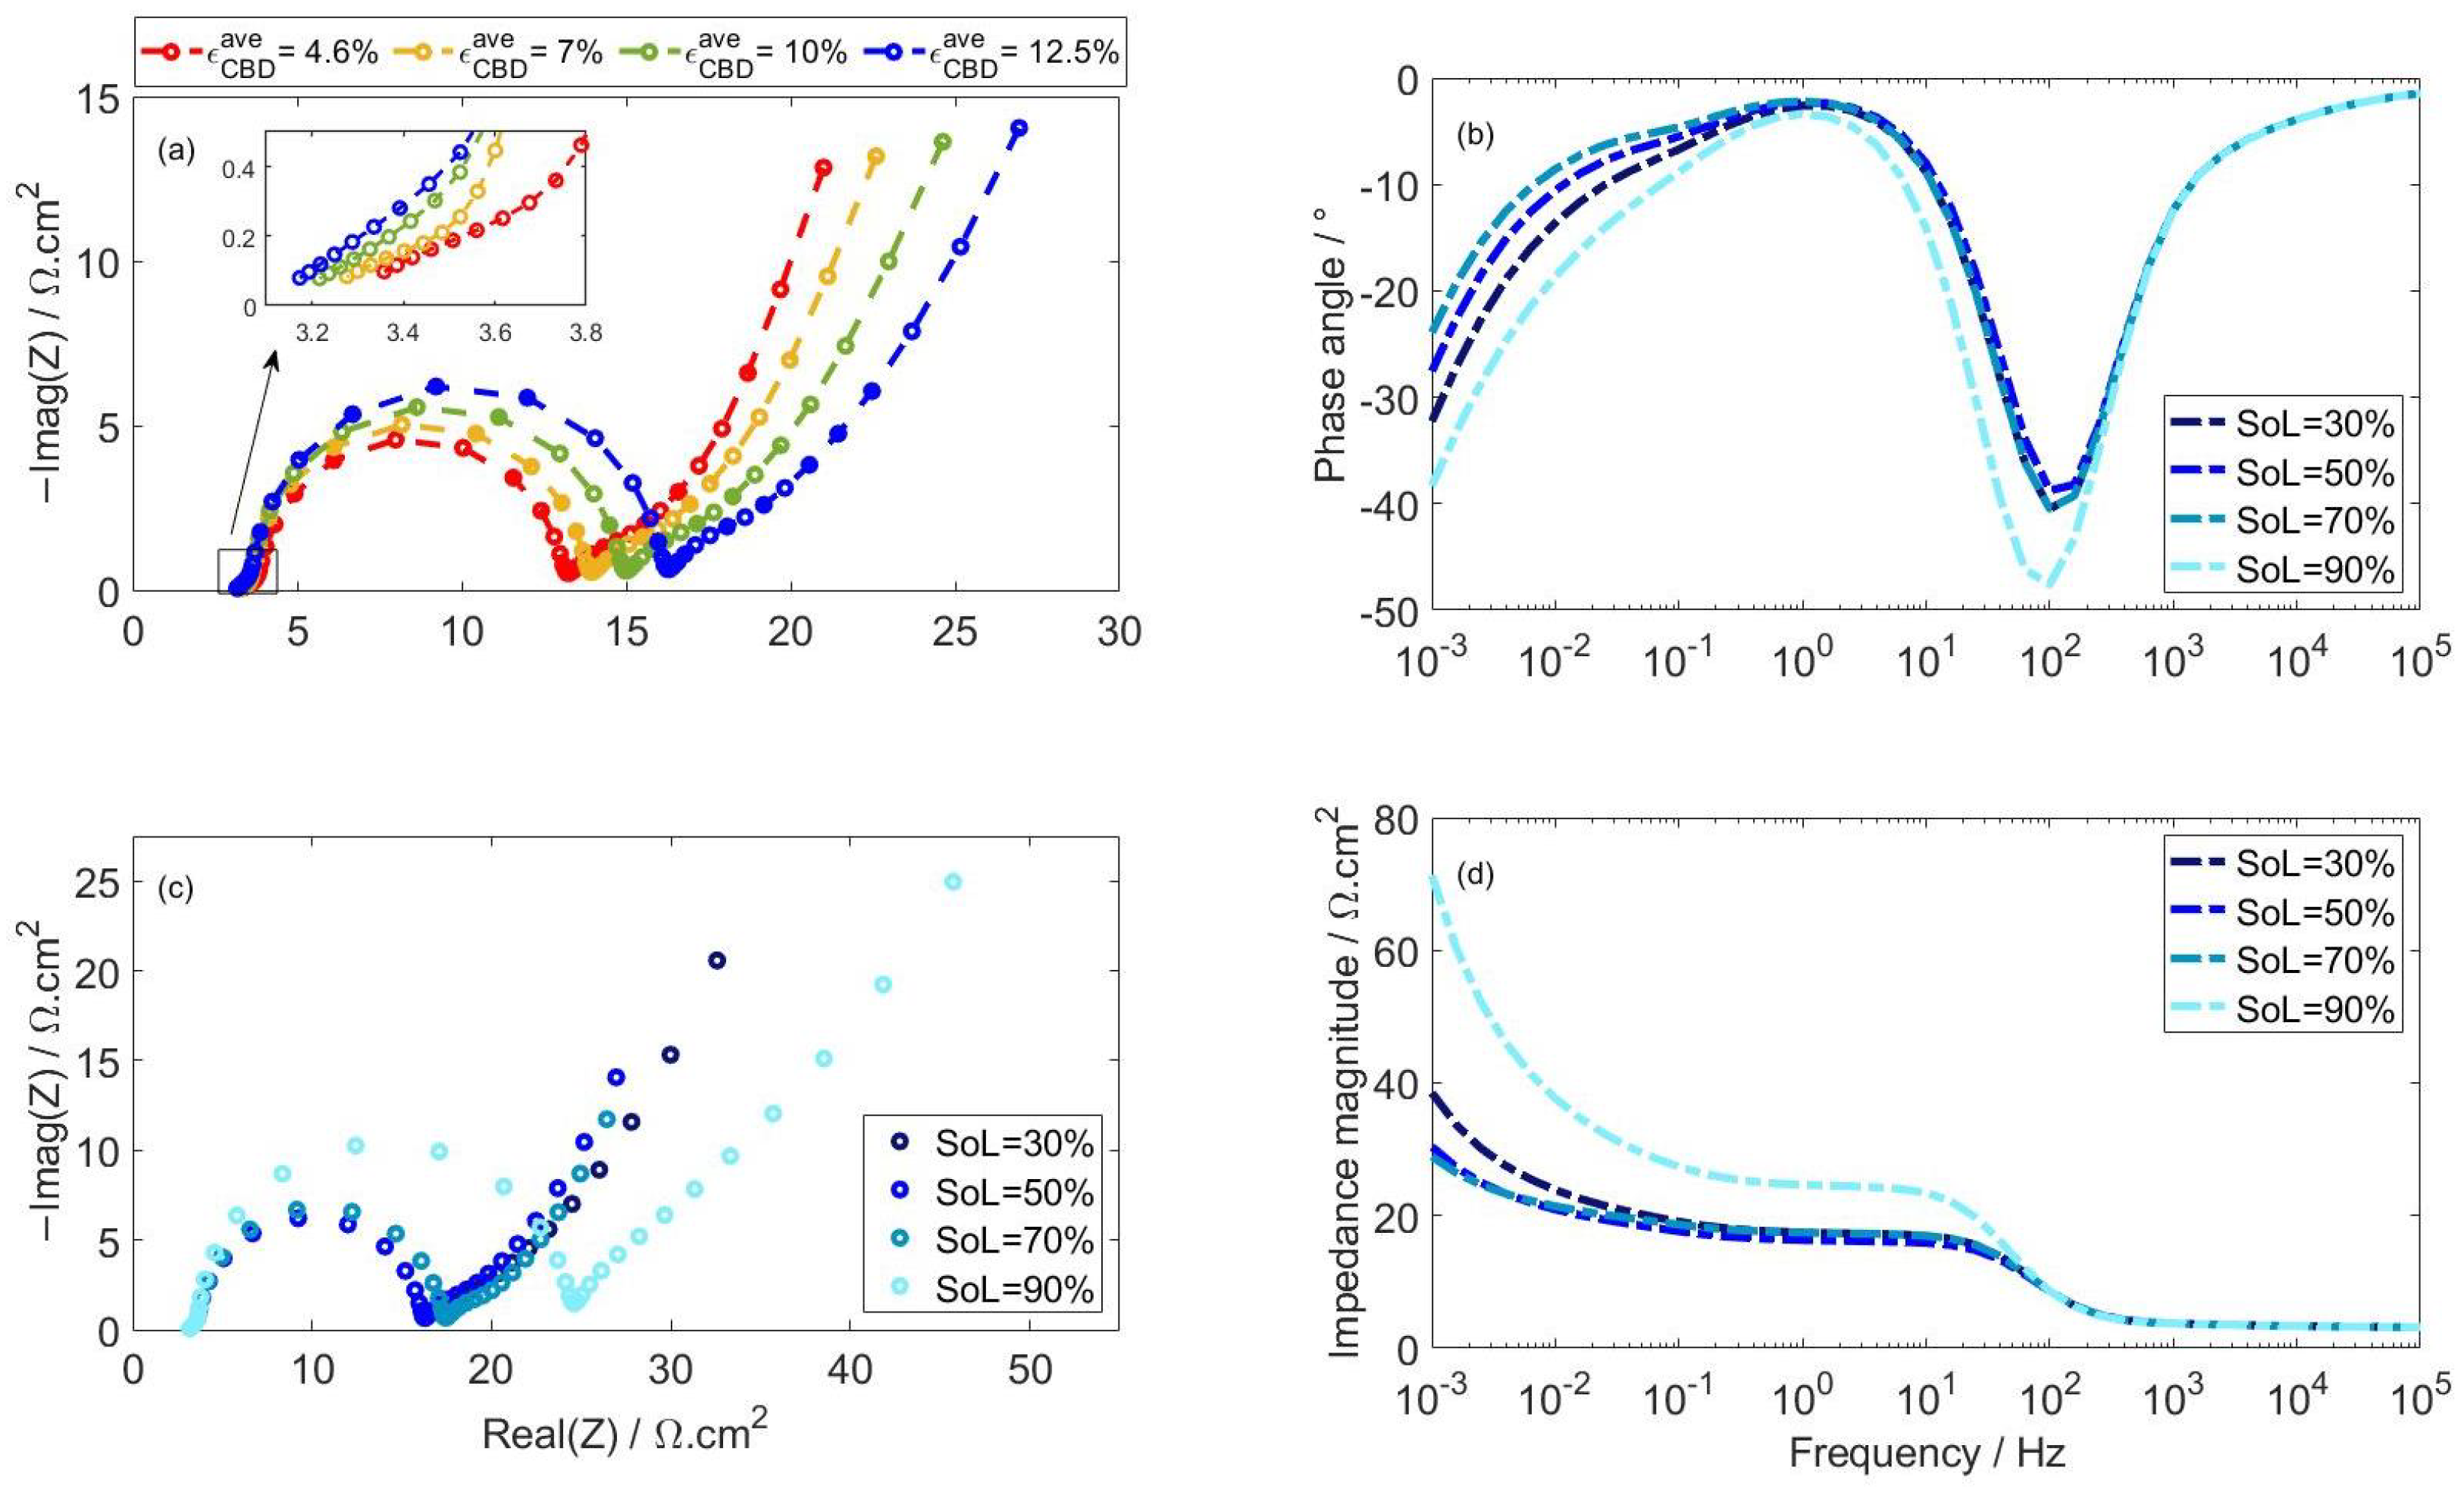
4.2.1. Effect of CBD Content on Impedance Spectra
4.2.2. Effect of State of Lithiation on Impedance Spectra
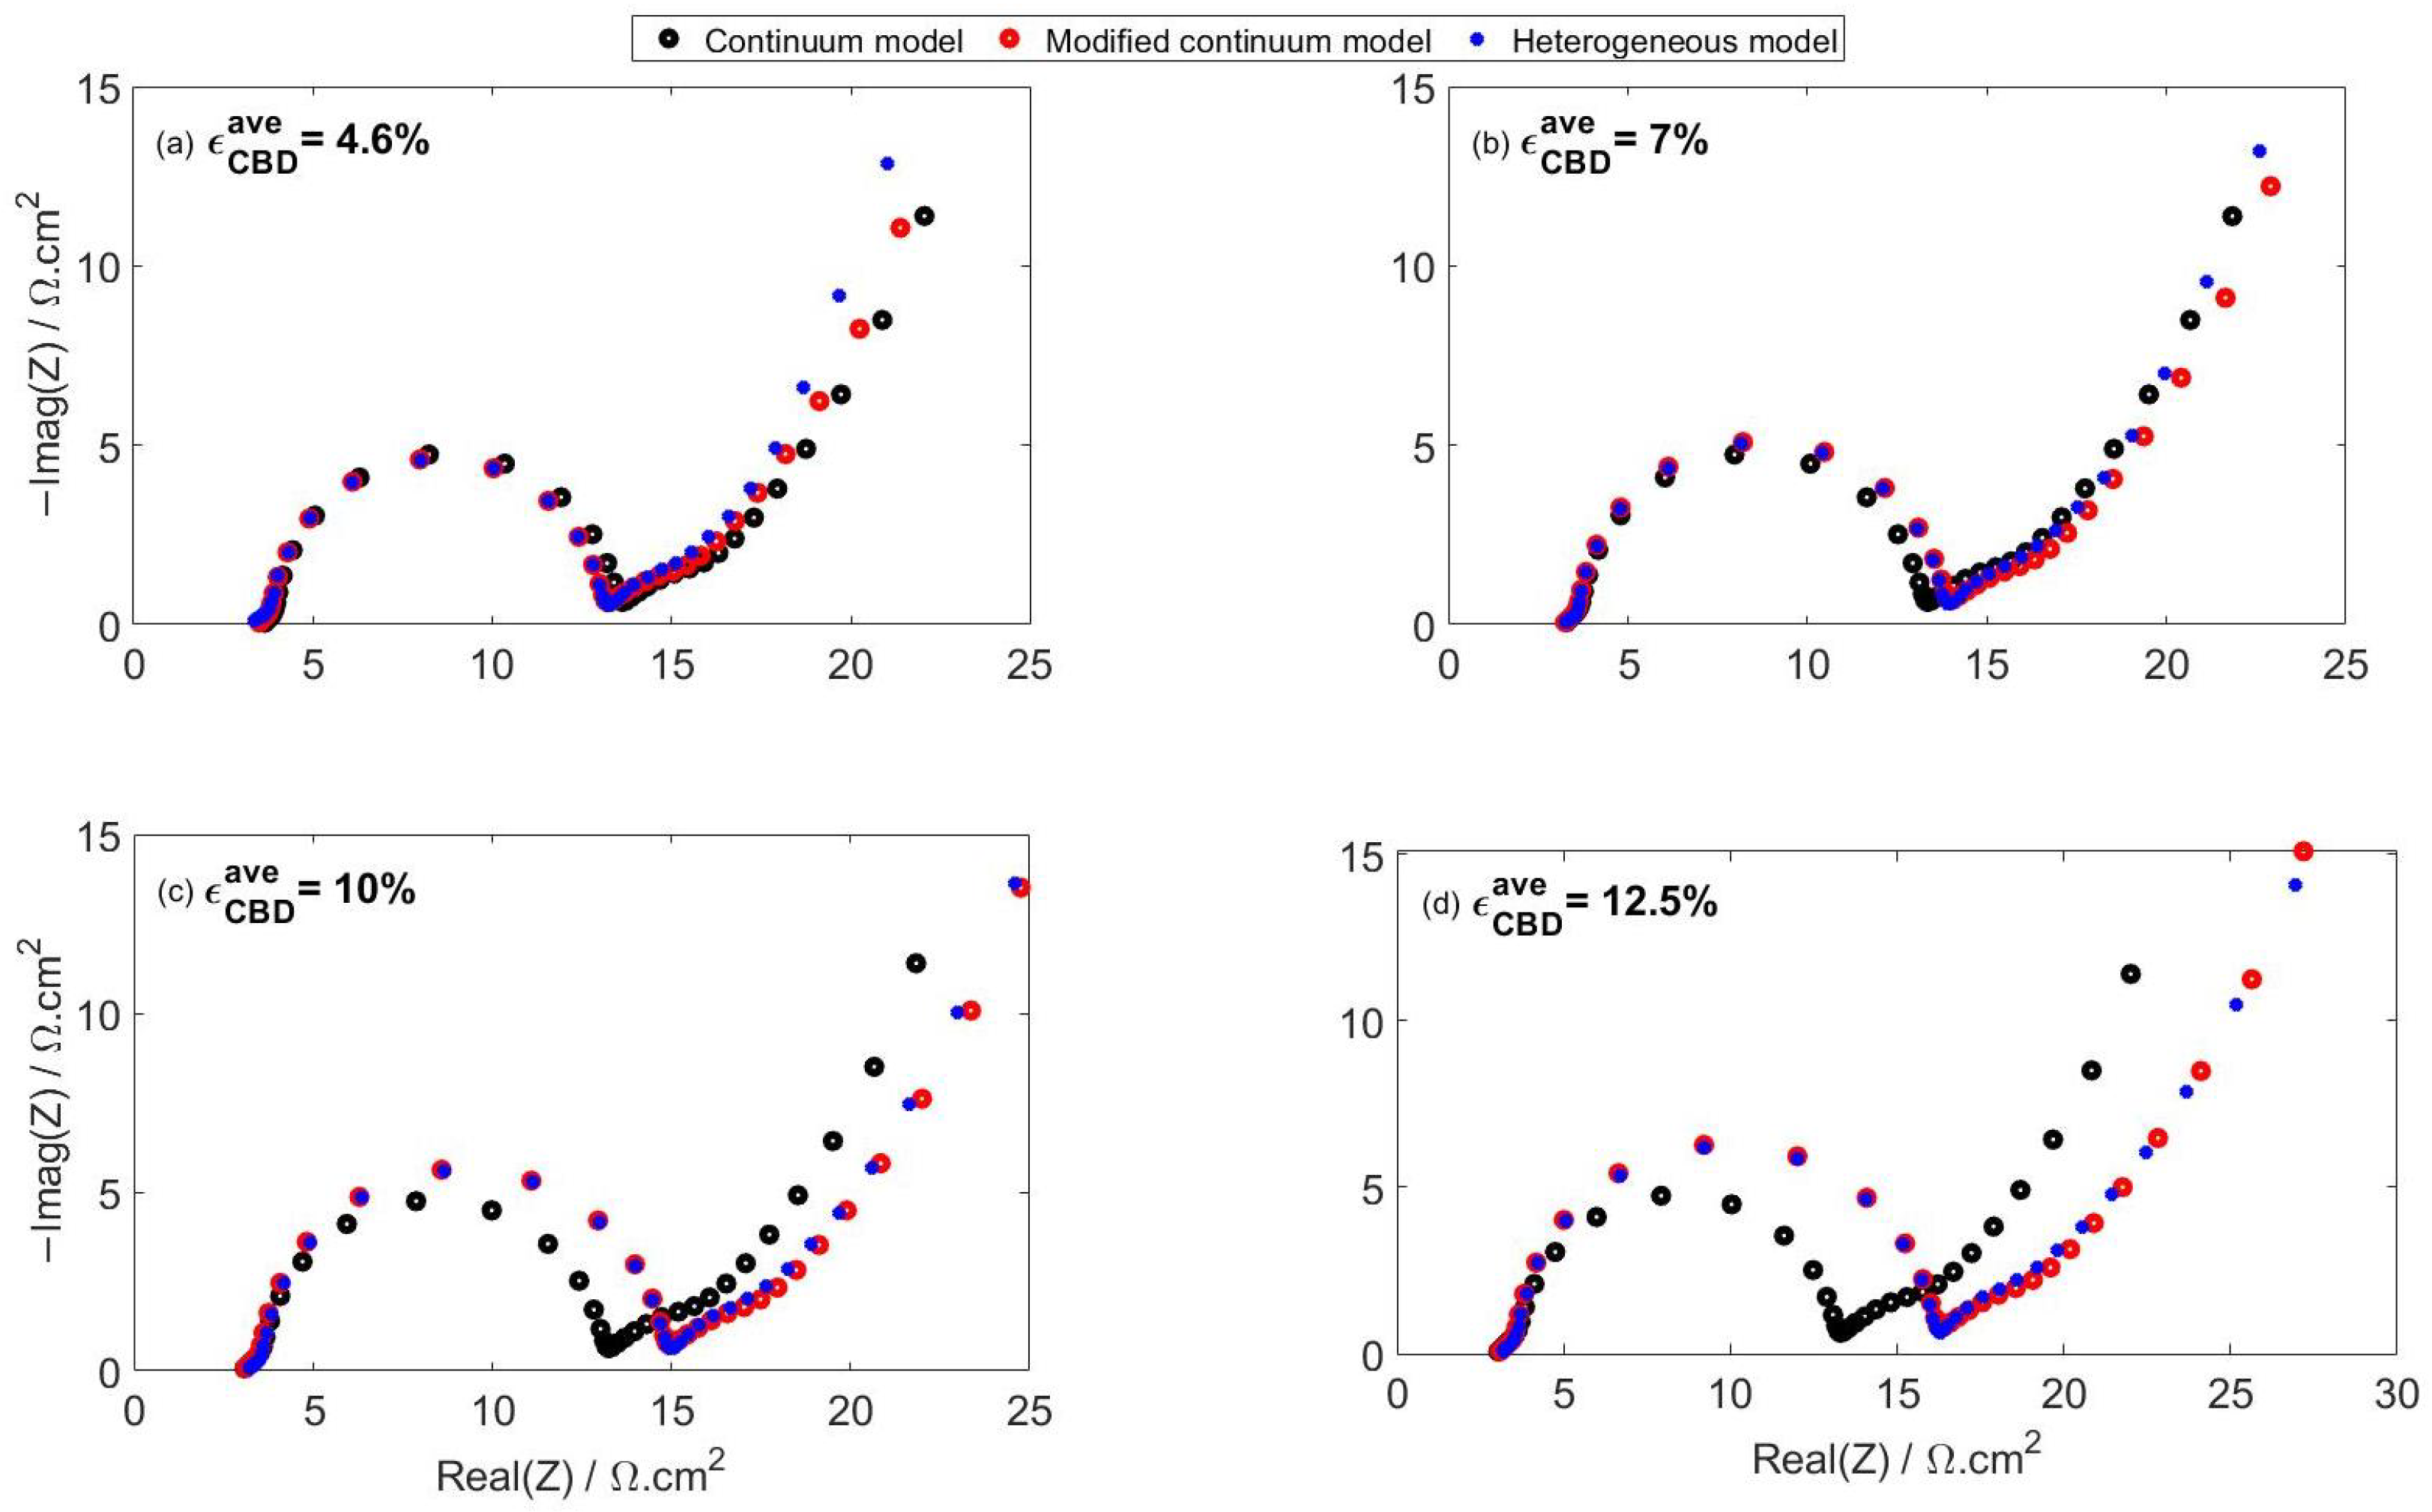
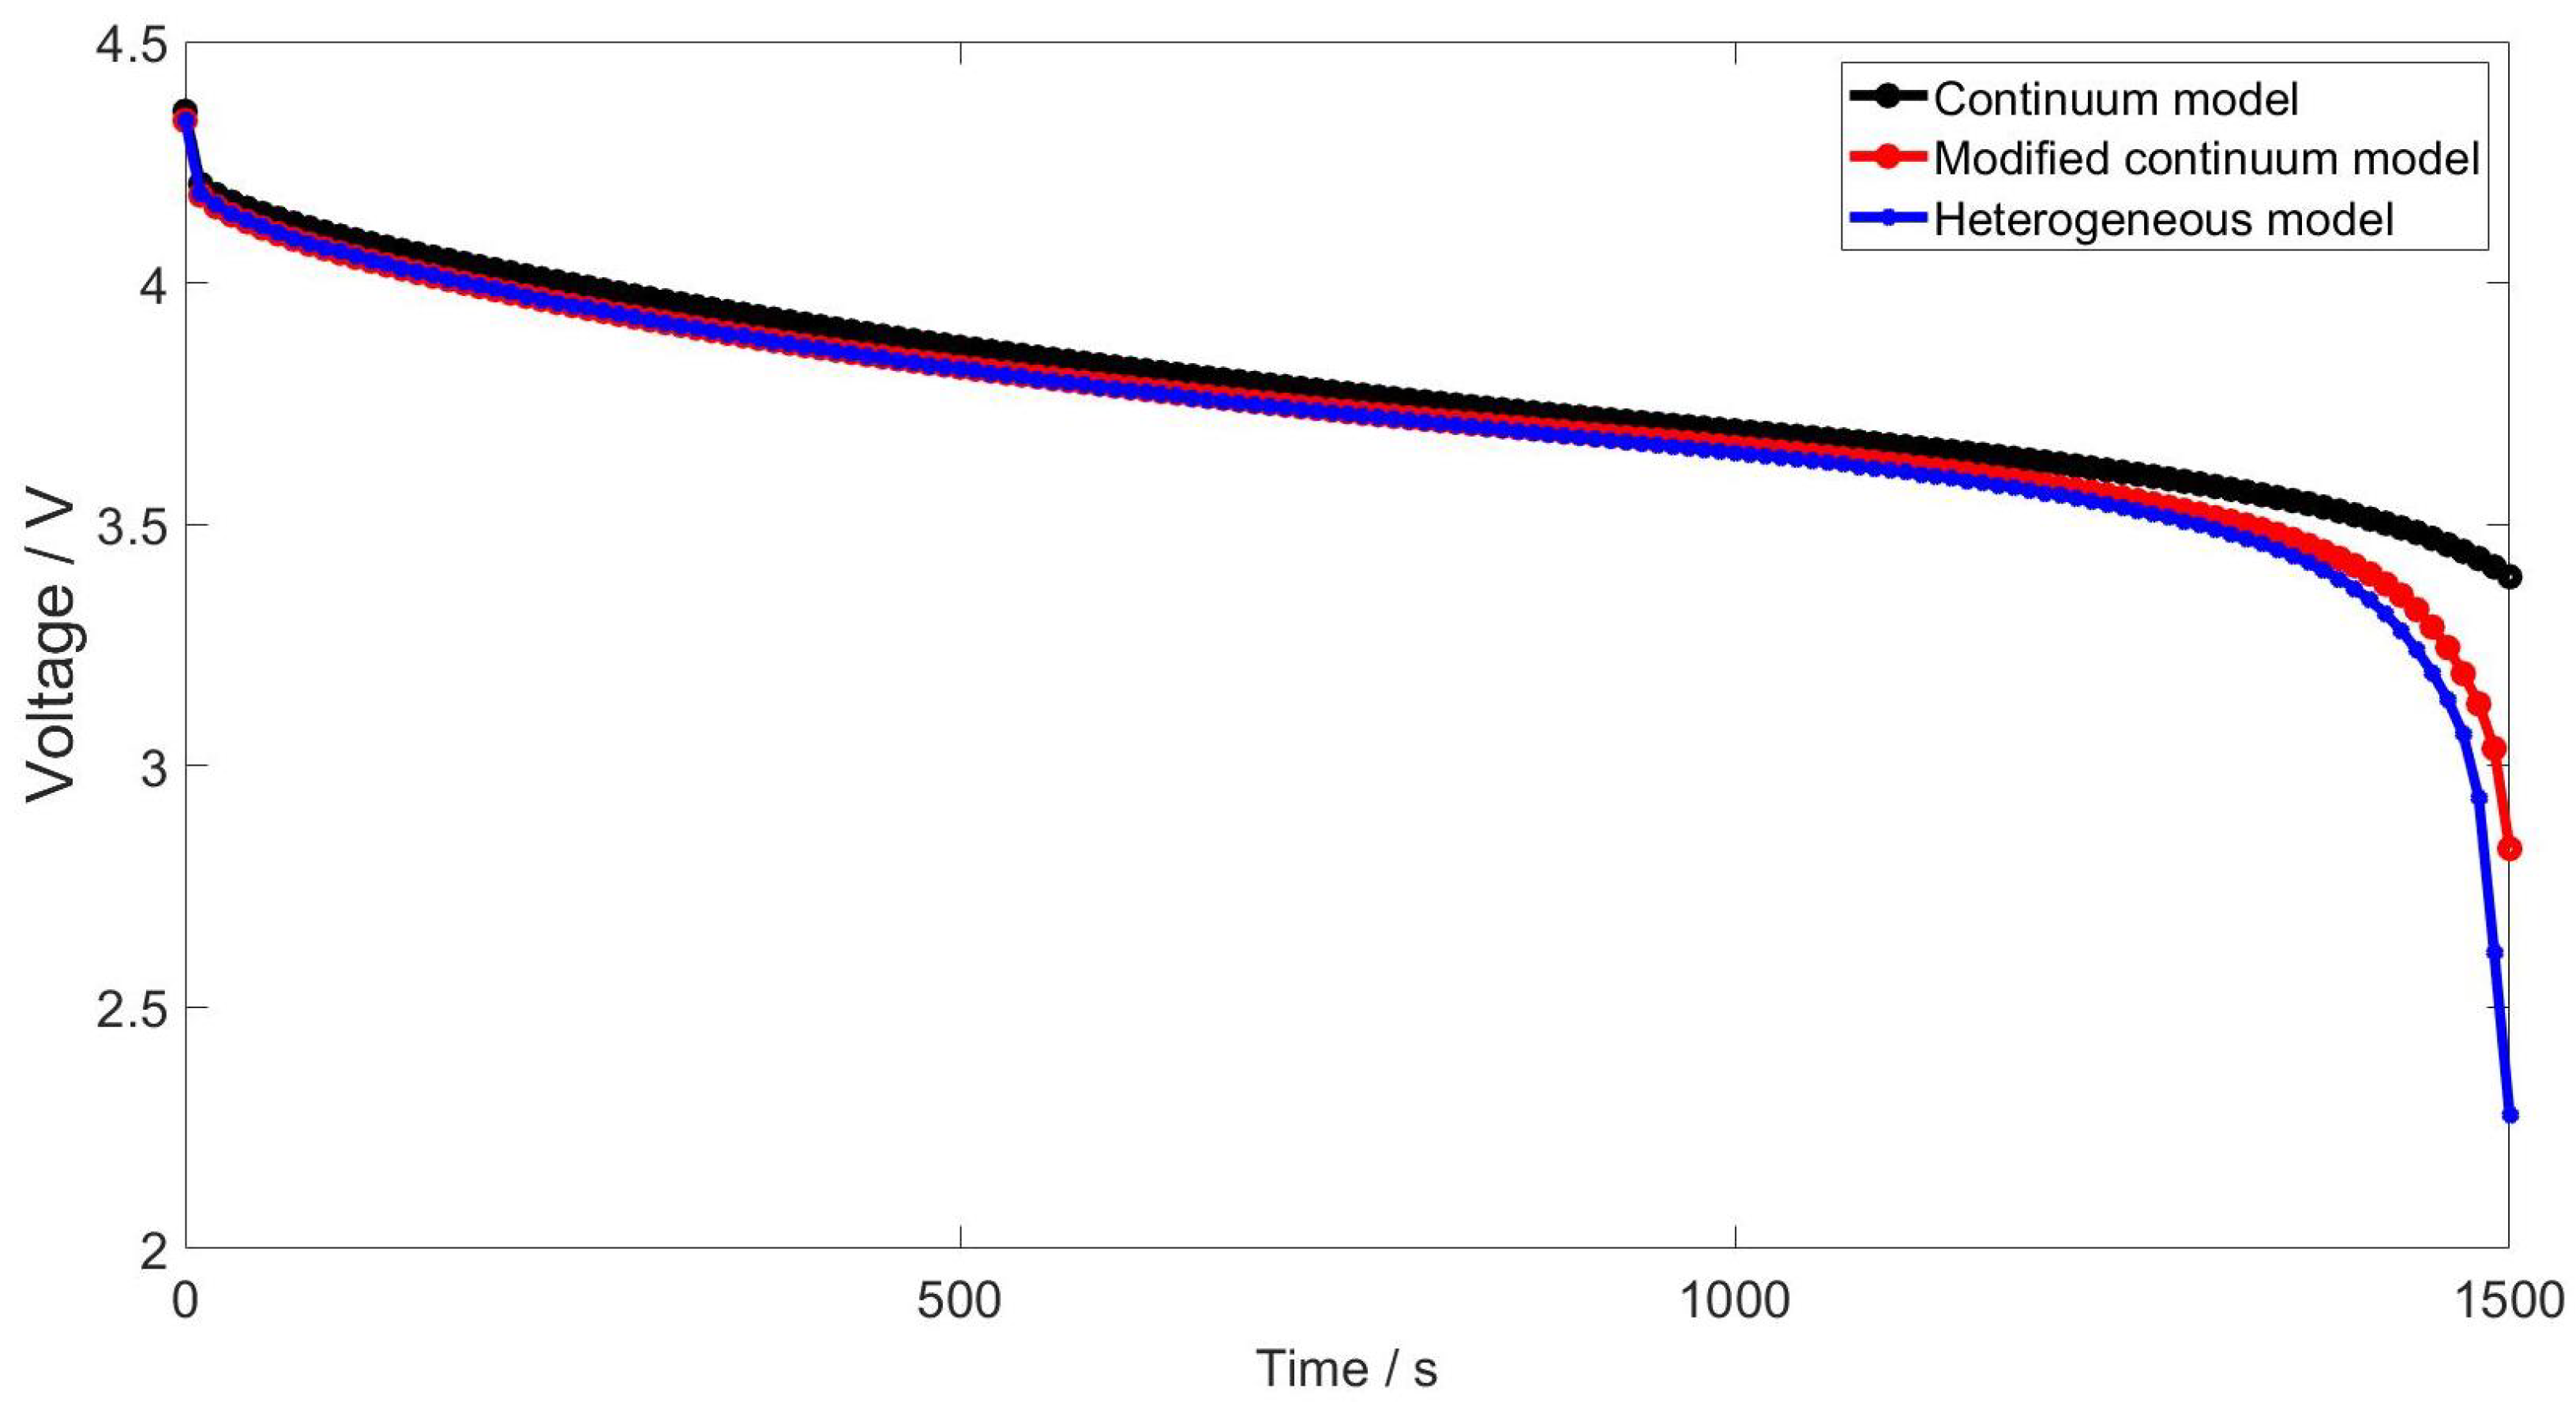
4.3. Modified Continuum Model
5. Conclusions
Author Contributions
Funding
Data Availability Statement
Conflicts of Interest
Abbreviations
| Latin Letters | |||
| A | Noise amplitude | [m] | Section 2.1 |
| Specific active surface area | [1/m] | Section 3.1 | |
| a | Randomly generated scalar parameter | Section 2.1 | |
| b | Randomly generated scalar parameter | Section 2.1 | |
| Specific double layer capacitance | [F/] | Section 3.1 | |
| Electrolyte concentration | [/] | Section 3.1 | |
| Solid concentration | [/] | Section 3.1 | |
| Bulk and effective electrolyte diffusivity | [/s] | Section 3.1 | |
| Solid diffusivity | [/s] | Section 3.1 | |
| d | Particle diameter | [m] | Section 2.1 |
| F | Faraday constant | [C/] | Section 3.1 |
| j | Stream flux | [m/s] | Section 2.2 |
| Exchange current density | [A/] | Section 3.1 | |
| Volumetric faradaic current | [A/] | Section 3.1 | |
| Volumetric capacitive current | [A/] | Section 3.1 | |
| k | Reaction rate constant | [m/s] | Section 3.1 |
| L | RVE length | [m] | Section 2.1 |
| N | Normal distribution | Section 2.1 | |
| P | Associated Legendre polynomial | Section 2.1 | |
| R | Gas constant | [J/] | Section 3.1 |
| r | Radius | [m] | Section 2.1 |
| Average particle radius | [m] | Section 2.1 | |
| Volume average radius | [m] | Section 4.3 | |
| S | Sphere/circle | Section 2.1 | |
| T | Temperature | [K] | Section 3.1 |
| U | Open circuit voltage | [V] | Section 3.1 |
| Y | Spherical harmonics function | Section 2.1 | |
| Z | Random variable | Section 2.1 | |
| Greek Letters | |||
| Symmetry coefficient | Section 3.1 | ||
| , | Bulk and effective transport coefficients | [/s] | Section 2.2 |
| Volumetric fraction | Section 2.2 | ||
| Spatial 3D domain | Section 2.2 | ||
| Azimuth angle of a sphere | [°] | Section 2.1 | |
| Dimensionless potential field | Section 2.2 | ||
| Averaged dimensionless potential field | Section 2.2 | ||
| Electrolyte electrochemical potential | [V] | Section 3.1 | |
| Solid electrical potential | [V] | Section 3.1 | |
| Radius of generated irregular particle | [m] | Section 2.1 | |
| Standard deviation | Section 2.1 | ||
| Bulk and effective electrolyte conductivity | [S/m] | Section 3.1 | |
| Bulk and effective solid conductivity | [S/m] | Section 3.1 | |
| Overpotential | [V] | Section 3.1 | |
| Mean of distribution | Section 2.1 | ||
| Tortusity factor | Section 2.2 | ||
| Polar angle of a sphere | [°] | Section 2.1 | |
| Surface of irregular spherical shape | Section 2.1 | ||
| Abbreviations | |||
| AM | Active Material | ||
| CBD | Carbon Binder Domain | ||
| CC | Current Collector | ||
| DL | Double layer | ||
| EIS | Electrochemical Impedance Spectroscopy | ||
| FIB | Focused Ion Beam | ||
| HC | Spherical Harmonic Coefficients | ||
| MacMullin number | |||
| PDE | Partial Differential Equation | ||
| SEM | Scanning Electron Microscopy | ||
| SoL | State of Lithiation | ||
| TEM | Transmission Electron Microscopy | ||
| XCT | X-ray Computed Tomography | ||
| Subscripts | |||
| Legendre polynomial and spherical harmonics, degree, order | |||
| Solid, electrolyte |
References
- Ansah, S.; Hyun, H.; Shin, N.; Lee, J.S.; Lim, J.; Cho, H.H. A modeling approach to study the performance of Ni-rich layered oxide cathode for lithium-ion battery. Comput. Mater. Sci. 2021, 196, 110559. [Google Scholar] [CrossRef]
- Doyle, M.; Fuller, T.F.; Newman, J. Modeling of Galvanostatic Charge and Discharge of the Lithium/Polymer/Insertion Cell. J. Electrochem. Soc. 1993, 140, 1526–1533. [Google Scholar] [CrossRef]
- Fuller, T.F.; Doyle, M.; Newman, J. Simulation and Optimization of the Dual Lithium Ion Insertion Cell. J. Electrochem. Soc. 1994, 141, 1–10. [Google Scholar] [CrossRef]
- Fang, R.; Ge, H.; Wang, Z.; Li, Z.; Zhang, J. A Two-Dimensional Heterogeneous Model of Lithium-Ion Battery and Application on Designing Electrode with Non-Uniform Porosity. J. Electrochem. Soc. 2020, 167, 130513. [Google Scholar] [CrossRef]
- Tjaden, B.; Cooper, S.J.; Brett, D.J.; Kramer, D.; Shearing, P.R. On the origin and application of the Bruggeman correlation for analysing transport phenomena in electrochemical systems. Curr. Opin. Chem. Eng. 2016, 12, 44–51. [Google Scholar] [CrossRef]
- Garcıa, R.E.; Chiang, Y.M.; Carter, W.C.; Limthongkul, P.; Bishop, C.M. Microstructural modeling and design of rechargeable lithium-ion batteries. J. Electrochem. Soc. 2004, 152, A255. [Google Scholar] [CrossRef]
- Liu, P.; Xu, R.; Liu, Y.; Lin, F.; Zhao, K. Computational modeling of heterogeneity of stress, charge, and cyclic damage in composite electrodes of Li-ion batteries. J. Electrochem. Soc. 2020, 167, 40527. [Google Scholar] [CrossRef]
- Mistry, A.N.; Smith, K.; Mukherjee, P.P. Secondary-phase stochastics in lithium-ion battery electrodes. ACS Appl. Mater. Interfaces 2018, 10, 6317–6326. [Google Scholar] [CrossRef]
- Latham, J.P.; Munjiza, A. The modelling of particle systems with real shapes. Philos. Trans. R. Soc. Lon. Ser. A Math. Phys. Eng. Sci. 2004, 362, 1953–1972. [Google Scholar] [CrossRef]
- Yang, Y.; Xu, R.; Zhang, K.; Lee, S.J.; Mu, L.; Liu, P.; Waters, C.K.; Spence, S.; Xu, Z.; Wei, C.; et al. Quantification of Heterogeneous Degradation in Li–Ion Batteries. Adv. Energy Mater. 2019, 9, 1900674. [Google Scholar] [CrossRef]
- Kashkooli, A.G.; Amirfazli, A.; Farhad, S.; Lee, D.U.; Felicelli, S.; Park, H.W.; Feng, K.; De Andrade, V.; Chen, Z. Representative volume element model of lithium-ion battery electrodes based on X-ray nano-tomography. J. Appl. Electrochem. 2017, 47, 281–293. [Google Scholar] [CrossRef]
- Cooper, S.J.; Eastwood, D.S.; Gelb, J.; Damblanc, G.; Brett, D.; Bradley, R.S.; Withers, P.J.; Lee, P.D.; Marquis, A.J.; Brandon, N.P.; et al. Image based modelling of microstructural heterogeneity in LiFePO4 electrodes for Li-ion batteries. J. Power Sources 2014, 247, 1033–1039. [Google Scholar] [CrossRef]
- Danner, T.; Singh, M.; Hein, S.; Kaiser, J.; Hahn, H.; Latz, A. Thick electrodes for Li-ion batteries: A model based analysis. J. Power Sources 2016, 334, 191–201. [Google Scholar] [CrossRef]
- Stephenson, D.E.; Walker, B.C.; Skelton, C.B.; Gorzkowski, E.P.; Rowenhorst, D.J.; Wheeler, D.R. Modeling 3D microstructure and ion transport in porous Li-ion battery electrodes. J. Electrochem. Soc. 2011, 158, A781. [Google Scholar] [CrossRef]
- Heenan, T.M.M.; Jnawali, A.; Kok, M.D.R.; Tranter, T.G.; Tan, C.; Dimitrijevic, A.; Jervis, R.; Brett, D.J.L.; Shearing, P.R. An Advanced Microstructural and Electrochemical Datasheet on 18650 Li-Ion Batteries with Nickel-Rich NMC811 Cathodes and Graphite-Silicon Anodes. J. Electrochem. Soc. 2020, 167, 140530. [Google Scholar] [CrossRef]
- Hein, S.; Danner, T.; Westhoff, D.; Prifling, B.; Scurtu, R.; Kremer, L.; Hoffmann, A.; Hilger, A.; Osenberg, M.; Manke, I.; et al. Influence of Conductive Additives and Binder on the Impedance of Lithium-Ion Battery Electrodes: Effect of Morphology. J. Electrochem. Soc. 2020, 167, 013546. [Google Scholar] [CrossRef]
- Jiang, Z.; Li, J.; Yang, Y.; Mu, L.; Wei, C.; Yu, X.; Pianetta, P.; Zhao, K.; Cloetens, P.; Lin, F.; et al. Machine-learning-revealed statistics of the particle-carbon/binder detachment in lithium-ion battery cathodes. Nat. Commun. 2020, 11, 2310. [Google Scholar] [CrossRef]
- Lu, X.; Bertei, A.; Finegan, D.P.; Tan, C.; Daemi, S.R.; Weaving, J.S.; O’Regan, K.B.; Heenan, T.M.M.; Hinds, G.; Kendrick, E.; et al. 3D microstructure design of lithium-ion battery electrodes assisted by X-ray nano-computed tomography and modelling. Nat. Commun. 2020, 11, 2079. [Google Scholar] [CrossRef]
- Mayer, J.K.; Almar, L.; Asylbekov, E.; Haselrieder, W.; Kwade, A.; Weber, A.; Nirschl, H. Influence of the Carbon Black Dispersing Process on the Microstructure and Performance of Li-Ion Battery Cathodes. Energy Technol. 2020, 8, 1900161. [Google Scholar] [CrossRef]
- Terreblanche, J.; Thompson, D.; Aldous, I.; Hartley, J.; Abbott, A.; Ryder, K.S. Experimental visualization of commercial lithium ion battery cathodes: Distinguishing between the microstructure components using atomic force microscopy. J. Phys. Chem. C 2020, 124, 14622–14631. [Google Scholar] [CrossRef]
- Xu, R.; Yang, Y.; Yin, F.; Liu, P.; Cloetens, P.; Liu, Y.; Lin, F.; Zhao, K. Heterogeneous damage in Li-ion batteries: Experimental analysis and theoretical modeling. J. Mech. Phys. Solids 2019, 129, 160–183. [Google Scholar] [CrossRef]
- Ngandjong, A.C.; Rucci, A.; Maiza, M.; Shukla, G.; Vazquez-Arenas, J.; Franco, A.A. Multiscale simulation platform linking lithium ion battery electrode fabrication process with performance at the cell level. J. Phys. Chem. Lett. 2017, 8, 5966–5972. [Google Scholar] [CrossRef] [PubMed]
- Feinauer, J.; Westhoff, D.; Kuchler, K.; Schmidt, V. 3D Microstructure Modeling and Simulation of Materials in Lithium-ion Battery Cells. In Proceedings of the Simulation Science; Springer: Cham, Switzerland, 2018; pp. 128–144. [Google Scholar] [CrossRef]
- Furat, O.; Petrich, L.; Finegan, D.P.; Diercks, D.; Usseglio-Viretta, F.; Smith, K.; Schmidt, V. Artificial generation of representative single Li-ion electrode particle architectures from microscopy data. npj Comput. Mater. 2021, 7, 105. [Google Scholar] [CrossRef]
- Mai, W.; Yang, M.; Soghrati, S. A particle-resolved 3D finite element model to study the effect of cathode microstructure on the behavior of lithium ion batteries. Electrochim. Acta 2019, 294, 192–209. [Google Scholar] [CrossRef]
- Bistri, D.; Afshar, A.; Di Leo, C.V. Modeling the chemo-mechanical behavior of all-solid-state batteries: A review. Meccanica 2021, 56, 1523–1554. [Google Scholar] [CrossRef]
- Forouzan, M.M.; Chao, C.W.; Bustamante, D.; Mazzeo, B.A.; Wheeler, D.R. Experiment and simulation of the fabrication process of lithium-ion battery cathodes for determining microstructure and mechanical properties. J. Power Sources 2016, 312, 172–183. [Google Scholar] [CrossRef]
- Awarke, A.; Wittler, M.; Pischinger, S.; Bockstette, J. A 3D Mesoscale Model of the Collector-Electrode Interface in Li-Ion Batteries. J. Electrochem. Soc. 2012, 159, A798–A808. [Google Scholar] [CrossRef]
- Oehler, D.; Seegert, P.; Wetzel, T. Modeling the Thermal Conductivity of Porous Electrodes of Li-Ion Batteries as a Function of Microstructure Parameters. Energy Technol. 2021, 9, 2000574. [Google Scholar] [CrossRef]
- Santoki, J.; Daubner, S.; Schneider, D.; Kamlah, M.; Nestler, B. Effect of tortuosity, porosity, and particle size on phase-separation dynamics of ellipsoid-like particles of porous electrodes: Cahn–Hilliard-type phase-field simulations. Model. Simul. Mater. Sci. Eng. 2021, 29, 065010. [Google Scholar] [CrossRef]
- Xu, H.; Bae, C. Stochastic 3D microstructure reconstruction and mechanical modeling of anisotropic battery separators. J. Power Sources 2019, 430, 67–73. [Google Scholar] [CrossRef]
- Tu, V. Modeling and Finite Element Simulation of the Bifunctional Performance of a Microporous Structural Battery Electrolyte. Master’s Thesis, Chalmers University of Technology, Gothenburg, Sweden, 2019. [Google Scholar]
- Nguyen, T.T.; Demortière, A.; Fleutot, B.; Delobel, B.; Delacourt, C.; Cooper, S.J. The electrode tortuosity factor: Why the conventional tortuosity factor is not well suited for quantifying transport in porous Li-ion battery electrodes and what to use instead. npj Comput. Mater. 2020, 6, 123. [Google Scholar] [CrossRef]
- Allen, J.M.; Chang, J.; Usseglio-Viretta, F.L.E.; Graf, P.; Smith, K. A Segregated Approach for Modeling the Electrochemistry in the 3-D Microstructure of Li-Ion Batteries and Its Acceleration Using Block Preconditioners. J. Sci. Comput. 2021, 86, 42. [Google Scholar] [CrossRef]
- He, X.; Bresser, D.; Passerini, S.; Baakes, F.; Krewer, U.; Lopez, J.; Mallia, C.T.; Shao-Horn, Y.; Cekic-Laskovic, I.; Wiemers-Meyer, S.; et al. The passivity of lithium electrodes in liquid electrolytes for secondary batteries. Nat. Rev. Mater. 2021, 6, 1036–1052. [Google Scholar] [CrossRef]
- An, F.; Zhou, W.; Li, P. A comparison of model prediction from P2D and particle packing with experiment. Electrochim. Acta 2021, 370, 137775. [Google Scholar] [CrossRef]
- Chouchane, M.; Rucci, A.; Lombardo, T.; Ngandjong, A.C.; Franco, A.A. Lithium ion battery electrodes predicted from manufacturing simulations: Assessing the impact of the carbon-binder spatial location on the electrochemical performance. J. Power Sources 2019, 444, 227285. [Google Scholar] [CrossRef]
- Renganathan, S.; Sikha, G.; Santhanagopalan, S.; White, R.E. Theoretical analysis of stresses in a lithium ion cell. J. Electrochem. Soc. 2009, 157, A155. [Google Scholar] [CrossRef]
- Cheng, Y.T.; Verbrugge, M.W. Evolution of stress within a spherical insertion electrode particle under potentiostatic and galvanostatic operation. J. Power Sources 2009, 190, 453–460. [Google Scholar] [CrossRef]
- Gao, X.; Lu, W.; Xu, J. Modeling framework for multiphysics-multiscale behavior of Si–C composite anode. J. Power Sources 2020, 449, 227501. [Google Scholar] [CrossRef]
- Liu, B.; Jia, Y.; Li, J.; Jiang, H.; Yin, S.; Xu, J. Multiphysics coupled computational model for commercialized Si/graphite composite anode. J. Power Sources 2020, 450, 227667. [Google Scholar] [CrossRef]
- Wang, M.; Xiao, X.; Huang, X. A multiphysics microstructure-resolved model for silicon anode lithium-ion batteries. J. Power Sources 2017, 348, 66–79. [Google Scholar] [CrossRef]
- Wu, W.; Xiao, X.; Wang, M.; Huang, X. A microstructural resolved model for the stress analysis of lithium-ion batteries. J. Electrochem. Soc. 2014, 161, A803. [Google Scholar] [CrossRef]
- Ahmadi, M. A hybrid phase field model for fracture induced by lithium diffusion in electrode particles of Li-ion batteries. Comput. Mater. Sci. 2020, 184, 109879. [Google Scholar] [CrossRef]
- Lee, S.; Yang, J.; Lu, W. Debonding at the interface between active particles and PVDF binder in Li-ion batteries. Extrem. Mech. Lett. 2016, 6, 37–44. [Google Scholar] [CrossRef]
- Grantab, R.; Shenoy, V.B. Pressure-gradient dependent diffusion and crack propagation in lithiated silicon nanowires. J. Electrochem. Soc. 2012, 159, A584. [Google Scholar] [CrossRef]
- Stein, M.; Mistry, A.; Mukherjee, P.P. Mechanistic understanding of the role of evaporation in electrode processing. J. Electrochem. Soc. 2017, 164, A1616. [Google Scholar] [CrossRef]
- Font, F.; Protas, B.; Richardson, G.; Foster, J.M. Binder migration during drying of lithium-ion battery electrodes: Modelling and comparison to experiment. J. Power Sources 2018, 393, 177–185. [Google Scholar] [CrossRef]
- Ngandjong, A.C.; Lombardo, T.; Primo, E.N.; Chouchane, M.; Shodiev, A.; Arcelus, O.; Franco, A.A. Investigating electrode calendering and its impact on electrochemical performance by means of a new discrete element method model: Towards a digital twin of Li-Ion battery manufacturing. J. Power Sources 2021, 485, 229320. [Google Scholar] [CrossRef]
- Mirsalehian, M.; Vossoughi, B.; Kaiser, J.; Pischinger, S. 2022, in preparation.
- Varshalovich, D.A.; Moskalev, A.N.; Khersonskii, V.K. Quantum Theory of Angular Momentum; World Scientific: Singapore, 1988. [Google Scholar]
- Claessens, S.J. Spherical harmonic analysis of a harmonic function given on a spheroid. Geophys. J. Int. 2016, 206, 142–151. [Google Scholar] [CrossRef]
- Barthelmes, F. Definition of Functionals of the Geopotential and Their Calculation from Spherical Harmonic Models: Theory and Formulas Used by the Calculation Service of the International Centre for Global Earth Models (ICGEM). 2009. Available online: http://icgem.gfz-potsdam.de/str-0902-revised.pdf (accessed on 26 May 2023). [CrossRef]
- Granzow, K.D. Spherical harmonic representation of the magnetic field in the presence of a current density. Geophys. J. Int. 1983, 74, 489–505. [Google Scholar] [CrossRef]
- Balmino, G.; Vales, N.; Bonvalot, S.; Briais, A. Spherical harmonic modelling to ultra-high degree of Bouguer and isostatic anomalies. J. Geod. 2012, 86, 499–520. [Google Scholar] [CrossRef]
- Tsoulis, D. Spherical Harmonic Computations with Topographic/Isostatic Coefficients; Technical Report; Institut für Astronomische und Physikalische Geodäsie, Technical University Munich: Munich, Germany, 1999. [Google Scholar]
- Amirbekyan, A.; Michel, V.; Simons, F.J. Parametrizing surface wave tomographic models with harmonic spherical splines. Geophys. J. Int. 2008, 174, 617–628. [Google Scholar] [CrossRef]
- Parimal, S.; Cramer, S.M.; Garde, S. Application of a spherical harmonics expansion approach for calculating ligand density distributions around proteins. J. Phys. Chem. B 2014, 118, 13066–13076. [Google Scholar] [CrossRef] [PubMed]
- Medyukhina, A.; Blickensdorf, M.; Cseresnyés, Z.; Ruef, N.; Stein, J.V.; Figge, M.T. Dynamic spherical harmonics approach for shape classification of migrating cells. Sci. Rep. 2020, 10, 6072. [Google Scholar] [CrossRef] [PubMed]
- Ge, W. High-Order Spherical Harmonics Methods for Radiative Heat Transfer and Applications in Combustion Simulations; University of California: Merced, CA, USA, 2017. [Google Scholar]
- Tapimo, R.; Kamdem, H.T.T. A spherical harmonic formulation for radiative heat transfer analysis. Am. J. Heat Mass Transf. 2016, 3, 280–295. [Google Scholar] [CrossRef]
- Wang, X.; Yin, Z.Y.; Xiong, H.; Su, D.; Feng, Y.T. A spherical-harmonic-based approach to discrete element modeling of 3D irregular particles. Int. J. Numer. Methods Eng. 2021, 122, 5626–5655. [Google Scholar] [CrossRef]
- Feinauer, J.; Spettl, A.; Manke, I.; Strege, S.; Kwade, A.; Pott, A.; Schmidt, V. Structural characterization of particle systems using spherical harmonics. Mater. Charact. 2015, 106, 123–133. [Google Scholar] [CrossRef]
- Liu, X.; Garboczi, E.; Grigoriu, M.; Lu, Y.; Erdoğan, S.T. Spherical harmonic-based random fields based on real particle 3D data: Improved numerical algorithm and quantitative comparison to real particles. Powder Technol. 2011, 207, 78–86. [Google Scholar] [CrossRef]
- Westhoff, D.; Feinauer, J.; Kuchler, K.; Mitsch, T.; Manke, I.; Hein, S.; Latz, A.; Schmidt, V. Parametric stochastic 3D model for the microstructure of anodes in lithium-ion power cells. Comput. Mater. Sci. 2017, 126, 453–467. [Google Scholar] [CrossRef]
- Feinauer, J.; Brereton, T.; Spettl, A.; Weber, M.; Manke, I.; Schmidt, V. Stochastic 3D modeling of the microstructure of lithium-ion battery anodes via Gaussian random fields on the sphere. Comput. Mater. Sci. 2015, 109, 137–146. [Google Scholar] [CrossRef]
- Westhoff, D.; Manke, I.; Schmidt, V. Generation of virtual lithium-ion battery electrode microstructures based on spatial stochastic modeling. Comput. Mater. Sci. 2018, 151, 53–64. [Google Scholar] [CrossRef]
- Kuchler, K.; Westhoff, D.; Feinauer, J.; Mitsch, T.; Manke, I.; Schmidt, V. Stochastic model for the 3D microstructure of pristine and cyclically aged cathodes in Li-ion batteries. Model. Simul. Mater. Sci. Eng. 2018, 26, 035005. [Google Scholar] [CrossRef]
- Griffiths, D. Introduction to Quantum Mechanics; Pearson: Upper Saddle River, NJ, USA, 2006. [Google Scholar]
- Chen, Y.H.; Wang, C.W.; Liu, G.; Song, X.Y.; Battaglia, V.; Sastry, A.M. Selection of conductive additives in li-ion battery cathodes: A numerical study. J. Electrochem. Soc. 2007, 154, A978. [Google Scholar] [CrossRef]
- Sturm, J.; Rheinfeld, A.; Zilberman, I.; Spingler, F.B.; Kosch, S.; Frie, F.; Jossen, A. Modeling and simulation of inhomogeneities in a 18650 nickel-rich, silicon-graphite lithium-ion cell during fast charging. J. Power Sources 2019, 412, 204–223. [Google Scholar] [CrossRef]
- Ko, J.Y.; Varini, M.; Klett, M.; Ekström, H.; Lindbergh, G. Porous Electrode Model with Particle Stress Effects for Li (Ni1/3Co1/3Mn1/3) O2 Electrode. J. Electrochem. Soc. 2019, 166, A2939. [Google Scholar] [CrossRef]
- Zheng, W.; Shui, M.; Shu, J.; Gao, S.; Xu, D.; Chen, L.; Feng, L.; Ren, Y. GITT studies on oxide cathode LiNi1/3Co1/3Mn1/3O2 synthesized by citric acid assisted high-energy ball milling. Bull. Mater. Sci. 2013, 36, 495–498. [Google Scholar] [CrossRef]
- Mistry, A.N.; Mukherjee, P.P. Probing spatial coupling of resistive modes in porous intercalation electrodes through impedance spectroscopy. Phys. Chem. Chem. Phys. 2019, 21, 3805–3813. [Google Scholar] [CrossRef]
- Zavalis, T.G.; Behm, M.; Lindbergh, G. Investigation of short-circuit scenarios in a lithium-ion battery cell. J. Electrochem. Soc. 2012, 159, A848. [Google Scholar] [CrossRef]
- Nyman, A.; Behm, M.; Lindbergh, G. Electrochemical characterisation and modelling of the mass transport phenomena in LiPF6–EC–EMC electrolyte. Electrochim. Acta 2008, 53, 6356–6365. [Google Scholar] [CrossRef]
- Keiser, H.; Beccu, K.; Gutjahr, M. Abschätzung der porenstruktur poröser elektroden aus impedanzmessungen. Electrochim. Acta 1976, 21, 539–543. [Google Scholar] [CrossRef]
- Itagaki, M.; Hatada, Y.; Shitanda, I.; Watanabe, K. Complex impedance spectra of porous electrode with fractal structure. Electrochim. Acta 2010, 22, 1229. [Google Scholar] [CrossRef]
- Kant, R.; Singh, M.B. Theory of the Electrochemical Impedance of Mesostructured Electrodes Embedded with Heterogeneous Micropores. J. Phys. Chem. C 2017, 121, 7164–7174. [Google Scholar] [CrossRef]
- Landesfeind, J.; Hattendorff, J.; Ehrl, A.; Wall, W.A.; Gasteiger, H.A. Tortuosity determination of battery electrodes and separators by impedance spectroscopy. J. Electrochem. Soc. 2016, 163, A1373. [Google Scholar] [CrossRef]
- Shodiev, A.; Primo, E.N.; Chouchane, M.; Lombardo, T.; Ngandjong, A.C.; Rucci, A.; Franco, A.A. 4D-resolved physical model for electrochemical impedance spectroscopy of Li (Ni1-x-yMnxCoy) O2-based cathodes in symmetric cells: Consequences in tortuosity calculations. J. Power Sources 2020, 454, 227871. [Google Scholar] [CrossRef]
- Shodiev, A.; Chouchane, M.; Gaberscek, M.; Arcelus, O.; Xu, J.; Oularbi, H.; Yu, J.; Li, J.; Morcrette, M.; Franco, A.A. Deconvoluting the benefits of porosity distribution in layered electrodes on the electrochemical performance of Li-ion batteries. Energy Storage Mater. 2022, 47, 462–471. [Google Scholar] [CrossRef]
- Planella, F.B.; Ai, W.; Boyce, A.; Ghosh, A.; Korotkin, I.; Sahu, S.; Sulzer, V.; Timms, R.; Tranter, T.; Zyskin, M.; et al. A continuum of physics-based lithium-ion battery models reviewed. Prog. Energy 2022, 4, 042003. [Google Scholar] [CrossRef]
- Landesfeind, J.; Ebner, M.; Eldiven, A.; Wood, V.; Gasteiger, H.A. Tortuosity of battery electrodes: Validation of impedance-derived values and critical comparison with 3D tomography. J. Electrochem. Soc. 2018, 165, A469. [Google Scholar] [CrossRef]
- Pouraghajan, F.; Knight, H.; Wray, M.; Mazzeo, B.; Subbaraman, R.; Christensen, J.; Wheeler, D. Quantifying tortuosity of porous Li-ion battery electrodes: Comparing polarization-interrupt and blocking-electrolyte methods. J. Electrochem. Soc. 2018, 165, A2644–A2653. [Google Scholar] [CrossRef]
- Cooper, S.J.; Bertei, A.; Finegan, D.P.; Brandon, N.P. Simulated impedance of diffusion in porous media. Electrochim. Acta 2017, 251, 681–689. [Google Scholar] [CrossRef]


| Property | Value |
|---|---|
| Cathode microstructure dimension | 25 m |
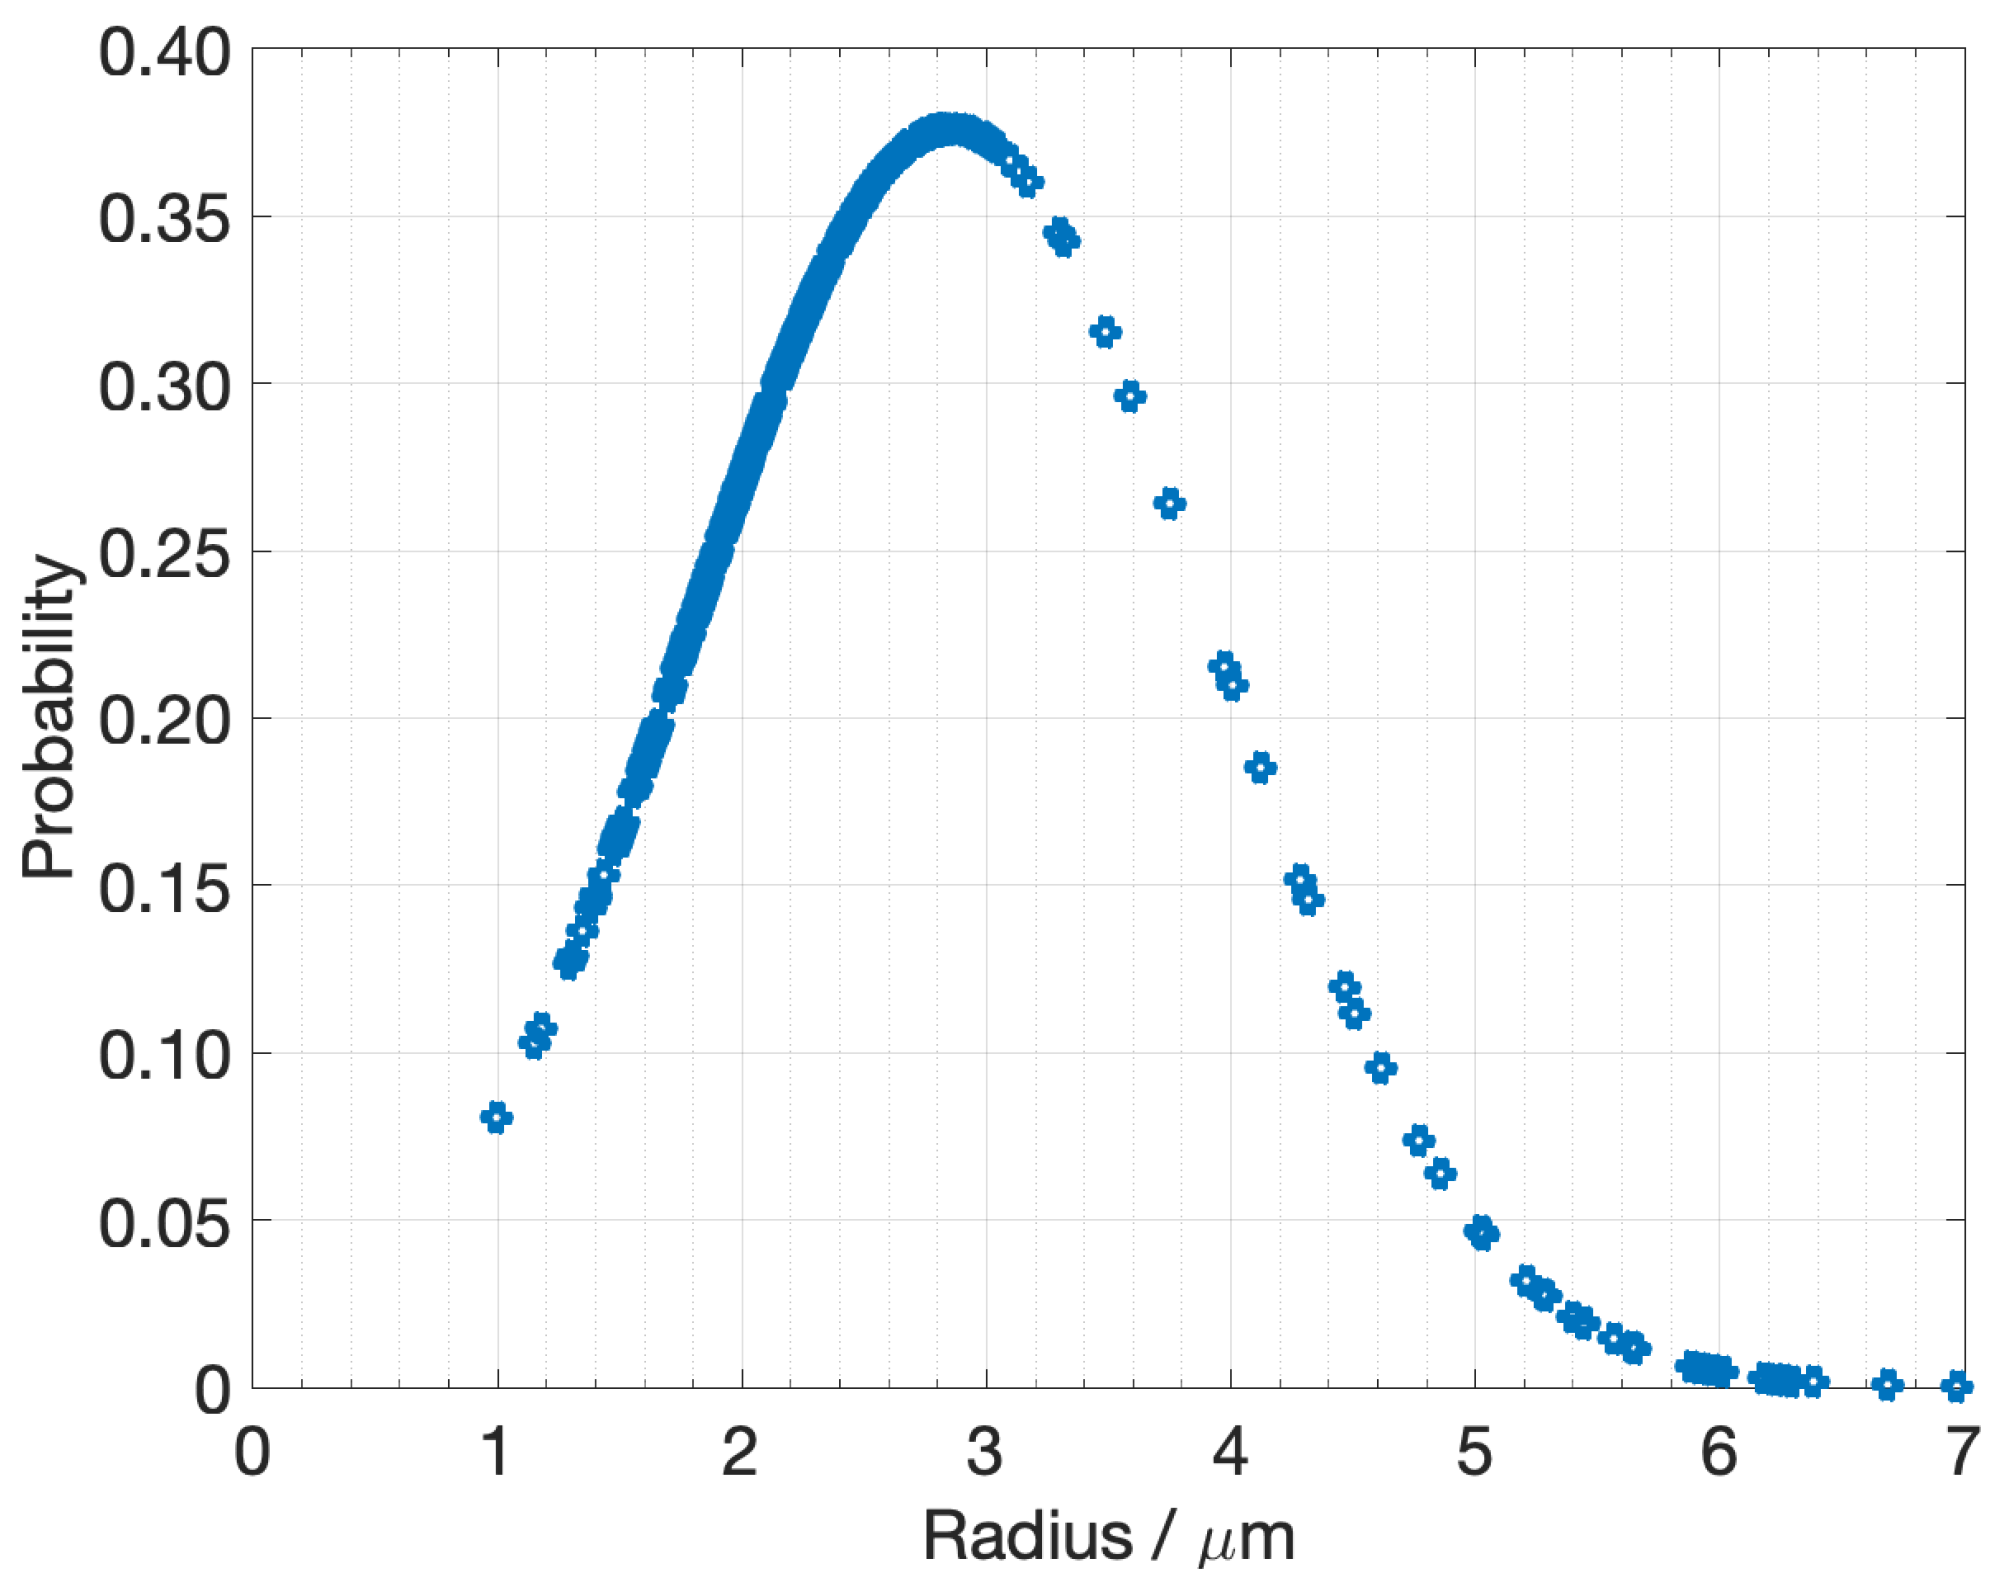
| Average NMC particle radius | 2 m and 5 m |
| Radius standard deviation | 0.2 m |
| Active material volumetric fraction | 49.6% |
| Carbon binder domain volumetric fraction | 4.6%, 7%, 10%, 12.5% |
| Porosity | 45.8%, 43.4%, 40.4%, 37.9% |
| Separator thickness | 11 m |
| Al current collector thickness | 6.5 m |
| Domain/Boundary | Equation |
|---|---|
| AM, CBD, CC | |
| AM | |
| Pore, separator | |
| Pore (continuum model), Separator | |
| AM-electrolyte interface | |
| Parameters | Value | Ref. |
|---|---|---|
| NMC Particles | ||
| AM solid conductivity () | S/m | [71] |
| AM solid diffusivity () | /s | [72] |
| max AM solid concentration () | 49,000 / | [73] |
| Equilibrium potential (U) | V | [73] |
| Kinetics | ||
| Reaction rate constant (k) | m/s | [74] |
| Transfer coefficients (, ) | ||
| Surface double layer capacitance () | F/ | [74] |
| Bruggeman exponent () | 1.5 | |
| Current collector | ||
| Conductivity () | S/m | [71] |
| Carbon binder domain | ||
| Conductivity () | 100 S/m | [4] |
| Electrolyte | ||
| Electrolyte reference concentration () | 1000 / | [71] |
| Conductivity () | S/m | [75] |
| Diffusivity () | /s | [75] |
| Activity () | [75] | |
| Transference () | [76] |
Disclaimer/Publisher’s Note: The statements, opinions and data contained in all publications are solely those of the individual author(s) and contributor(s) and not of MDPI and/or the editor(s). MDPI and/or the editor(s) disclaim responsibility for any injury to people or property resulting from any ideas, methods, instructions or products referred to in the content. |
© 2023 by the authors. Licensee MDPI, Basel, Switzerland. This article is an open access article distributed under the terms and conditions of the Creative Commons Attribution (CC BY) license (https://creativecommons.org/licenses/by/4.0/).
Share and Cite
Mirsalehian, M.; Vossoughi, B.; Kaiser, J.; Pischinger, S. 3D Heterogeneous Model for Electrodes in Lithium-Ion Batteries and Its Application to a Modified Continuum Model. Batteries 2023, 9, 298. https://doi.org/10.3390/batteries9060298
Mirsalehian M, Vossoughi B, Kaiser J, Pischinger S. 3D Heterogeneous Model for Electrodes in Lithium-Ion Batteries and Its Application to a Modified Continuum Model. Batteries. 2023; 9(6):298. https://doi.org/10.3390/batteries9060298
Chicago/Turabian StyleMirsalehian, Mohammadali, Bahareh Vossoughi, Jörg Kaiser, and Stefan Pischinger. 2023. "3D Heterogeneous Model for Electrodes in Lithium-Ion Batteries and Its Application to a Modified Continuum Model" Batteries 9, no. 6: 298. https://doi.org/10.3390/batteries9060298