1. Introduction
Since their introduction in the early 90s, Lithium-Ion Batteries (LIBs) represented a real revolution in the market of portable devices.
While initially meant to be used in the 3C field (Computation, Communication and Cameras) with their winning combination of capacity, lightweight and large number of charge-recharge cycles, LIBs literally enabled the recent exponential growth of electric vehicles, portable work tools and electrical gardening tools. The option of using LIBs for massive energy storage in order to cope with the intermittent operation of renewable power sources is nowadays gaining more and more interest.
On the other hand, the continuous performance improvement of LIBs is also marked by well-known safety issues. The possibility of overheating resulting in fire hazard or even explosion is an event to be taken into account, especially when fast charging and discharging cycles are required, which is particularly desirable for electric vehicles. In addition, the degradation of the electrodes and electrolyte occurring over time makes estimating the residual charge (SOC, State Of Charge) a difficult task, and can equally lead to dangerous situations when batteries are used in critical applications, such as medical devices.
The State Of Health (SOH) concept generically indicates the performance degradation of a used battery with respect to a new one, and can be expressed either through the residual maximum capacity or the output resistance, which typically increases as a consequence of battery ageing [
1,
2,
3]. However, other quantities also exist which can be taken into account, such as battery state indicators, among which very common ones are the State Of Temperature (SOT) and the State Of Function (SOF) [
4]. Besides performance reduction, the degradation of the state indicators is correlated with an increased probability of thermal runaway, swelling and corrosive electrolyte leakage [
5,
6]. Therefore, determining the battery state indicators is compelling for estimating the Residual Useful Life (RUL) in order to decide when a battery has to be replaced to prevent dangerous conditions.
In large battery packs, state indicators can exhibit substantial differences from one cell to another; hence, Battery Management Systems (BMS) should acquire the key parameters of each individual cell. This makes the wiring of battery packs including tens of cells difficult and makes data processing particularly demanding for centralized BMS [
7,
8]. An alternative solution is to employ a distributed BMS, where parameters acquisition is performed at the cell level by CMUs (Cell Management Units). Specifically, the purpose of each CMU is to gather data regarding the cell it is applied to, perform local processing and send data to a simplified BMS with a single communication bus.
Regarding the measurements of interest for state estimation, Electrochemical Impedance Spectroscopy (EIS) is being proposed as a powerful approach to complement well established procedures, such as Coulumb counting and dc voltage monitoring [
9,
10]. While many EIS studies still involve large, expensive and power-hungry laboratory instrumentation, there is considerable interest in developing compact hardware and algorithms for online EIS, i.e., the execution of EIS on the battery only in the site where it is being used or charged. An efficient approach for online EIS is modulating the DC-DC converter of the battery charger in order to produce the perturbation required for impedance measurement [
11,
12]. Systems based on this principle do not need to be particularly small, since only one of them is required for the whole battery pack. On the down side, they measure the global impedance of the battery pack, and are thereby less adequate for monitoring the single cells. On the other hand, devices designed to perform EIS on single cells or small groups of cells in a large battery pack must be compact and preferably powered by the same cells they are applied to. The main challenge is measuring impedances with a resolution that can be smaller than 1 mΩ; for cell capacities in the order of a few Ah.
In this respect, there are very few examples in the literature that meet these requirements. In the recent work of De Angelis et al. [
13], a circuit built on a relatively compact Printed Circuit Board (PCB) achieves interesting performances; however, it still requires a power source with a voltage higher than the cell under test and commercial data acquisition systems not included in the PCB. Carkhuff et al. propose a stand-alone BMS with EIS capability [
14], but an auxiliary 6 V battery is still necessary to power the circuit. The original system described in [
15] uses an Application Specific Integrated Circuit (ASIC) to keep the size small, but reported performances seem adequate only to small button cells where the high output resistance relaxes the resolution specifications. An ASIC is also proposed by Gong et al. [
16], implementing a promising single cell supervisor that can be easily stacked to monitor series-connected batteries; however, experiments are described only for hybrid systems that use large external pieces of hardware.
Recently, we presented a CMU [
17] based on a single-chip versatile sensor interface, the SENSIPLUS (SP) integrated circuit. Even though it was not originally designed for battery monitoring, the SP was shown to be particularly useful for the purpose of building compact multi-measurand CMUs able to perform high-resolution online Electrochemical Impedance Spectroscopy (EIS). However, the device described in [
17] suffered from three main limitations: (i) the minimum EIS frequency was 40 Hz, dictated by the principle used for waveform generation; (ii) the maximum output current amplitude (peak value) was limited to 15 mA; (iii) the current source could withstand only a maximum voltage of 4.2 V, limiting its application to single LIB cells.
In this work, we propose an upgraded CMU version overcoming the mentioned limitations concerning EIS capability, while maintaining the possibility of reading additional parameters such as the battery voltage, and interfacing external sensors to complete the battery characterization. In particular, a new version of the SP chip has been designed, introducing an alternative signal waveform that allows EIS down to 0.1 Hz. External components have been added to the PCB of the proposed device in order to extend the maximum current and voltage of the current source to 200 mA and 10 V, respectively. The increased maximum current results in a proportional reduction of the equivalent impedance noise and, consequently, in a resolution improvement. Furthermore, such high current levels also allow the device to be used for passive charge balancing, if required. Finally, the increased voltage range allows the application to batteries formed by two series-connected Lithium-Ion cells, while maintaining full compatibility with single cells. For this reason, the proposed circuit will be indicated as the Dual-Cell Management Unit (DCMU) in the rest of this paper. In the proposed circuit, the whole EIS measurement circuit is powered by the same battery under test. An additional power source is only required if isolation must be guaranteed between the battery and the communication line. The experiments described in this paper are aimed at demonstrating that the proposed DCMU is capable of detecting the changes produced in the EIS curves by SoC and temperature variations, showing that the results are in qualitative agreement with the literature data.
2. Dual Cell Management Unit
2.1. System Architecture
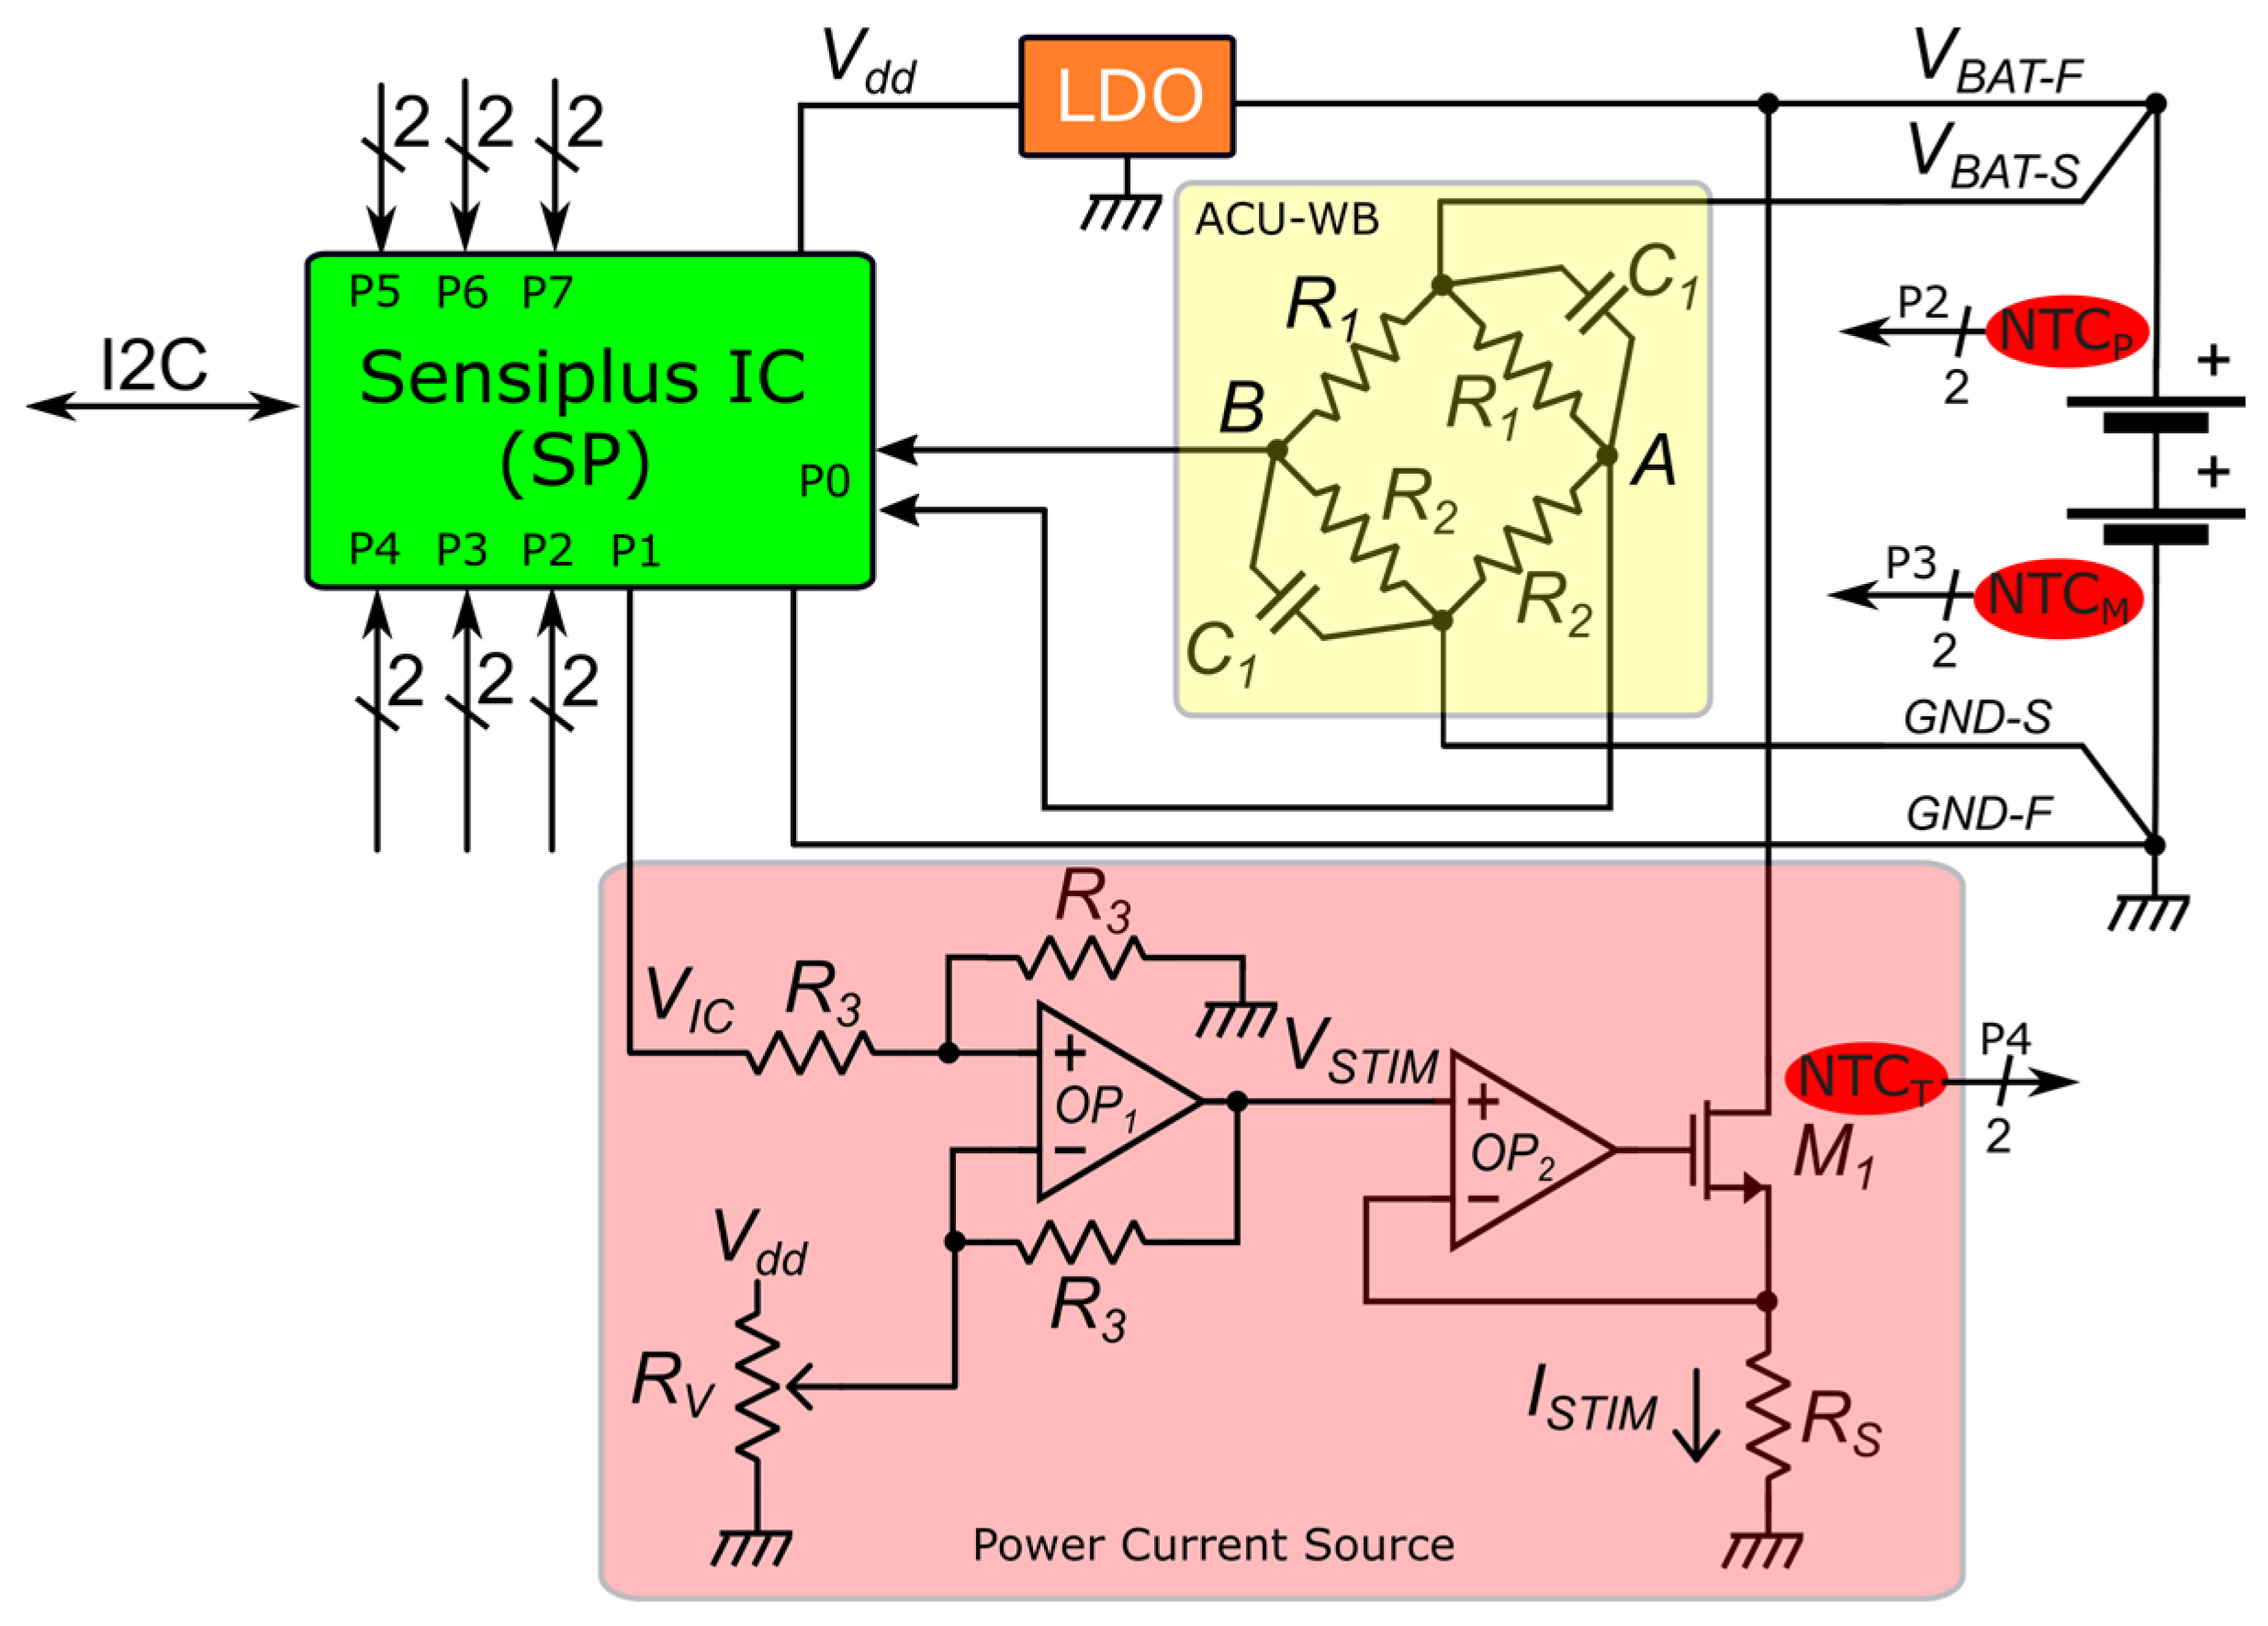
Figure 1 shows the block diagram of the DCMU connected to a battery pack made up by two series-connected battery cells. The device has been implemented on a PCB that includes a Stimulating and Sensing Unit (SSU) and a MicroController Unit (MCU) with a Communication Interface (CI). In order to control the DCMU, a personal computer can be connected either through a standard USB port or through a Bluetooth link. In the latter case, a single 3.7 V Lithium battery cell (Optional Power Supply, OPS in
Figure 1) is necessary to supply the MCU. As an alternative to OPS, a battery cell among those under test can be used to power the MCU. The SSU is electrically separated from the MCU thanks to an I2C digital isolator (Si8400AA-B-IS by Silicon Labs), which has been added to guarantee a galvanic isolation between the battery pack electrical domain (GND-V
BAT) and the microcontroller one. The Power Current Source is used to correctly impose both dc and ac current stimuli to the battery pack. On the other hand, the AC Unbalanced Wheatstone Bridge (ACU-WB) allows the detection of the battery voltage response to the stimulus imposed by the Power Current Source with a 4-wire measurement method (V
BAT-F/S, GND-F/S). The DCMU core consists of the SENSIPLUS IC (SP), which communicates with the MCU by means of a standard I2C protocol. The SP is a custom integrated sensor interface also capable of performing EIS on different kinds of devices, as detailed in the next section.
2.2. The SENSIPLUS IC
The SENSIPLUS integrated circuit is a single-chip versatile sensor interface developed by SENSICHIPS [
18] in collaboration with the University of Pisa. The analog terminals of the SP can be arranged to form up to four 4-wire ports or up to eight 2-wire ports. The analog ports can be configured to provide either current or voltage stimulation and to measure the corresponding voltage or current response, respectively. Sinusoidal, square wave, dc and simple arbitrary waveforms can be generated for stimulation.
Sinusoidal stimulation is highly programmable in terms of magnitude, frequency and dc component. The sinusoidal waveform synthesizer is based on an original, energy efficient switched-capacitor approach. The circuit consists of a Miller integrator that sums charge packets obtained by switching sinusoidally weighted capacitors across two programmable voltage levels. Charge packets are designed to be proportional to the difference between successive samples of the target sinusoidal waveform. The dc value of the output waveform is obtained by means of a tuneable dc path. Selection of the sinusoidal waveform magnitude is obtained by changing the integrator gain, through a digitally programmable feedback capacitor. The frequency range that can be achieved by means of this circuit spans from nearly 40 Hz to 2 MHz. The minimum stimulation frequency, mainly determined by leakage currents, was a serious limitation of the previously proposed CMU [
17], which was equipped with a former version of the SP platform. The DCMU proposed in this work uses an improved SP version, where the above-mentioned sinusoidal synthesizer is complemented with a more conventional Direct Digital Synthesizer (DDS) optimized to cover the low frequency range. In practice, the DDS uses the same hardware of the analog synthesizer, where only the dc path is active and the sinusoidal charge packets are disabled. The resulting circuit works as a conventional switched capacitor digital-to-analog circuit and the desired output waveform is obtained by generating a succession of sinusoidal samples. In this way, the lower frequency limit is reduced to 0.1 Hz. With both the analog and digital approaches, the resolution of the sample generation is 12 bits. The number of samples per period is 128 for the analog method and 64 for the digital one.
Internal voltage references, produced by a programmable bandgap circuit, are all of differential-type with common mode voltage equal to Vdd/2. As a result, all stimuli produced by the SP use Vdd/2 as their conventional zero-level.
As far as sensing is concerned, in the case of sinusoidal or square-wave stimulation, the acquired signal (i.e., the response) can be processed in the analog domain to extract the in-phase and quadrature components, enabling vector impedance measurements. For dc signals, chopper modulation-demodulation can be enabled at different levels to remove offsets from the measurements.
Analog signals are then converted to digital data by means of an 18-bit delta-sigma Analog-to-Digital Converter (ADC). The intrinsic properties of the digital filter (Comb-Integrator Cascade filter) included in the ADC are exploited to reject demodulation by-products by properly setting the ADC sampling frequency. With this approach, analog filters based on large off-chip capacitors are completely avoided.
The SP is designed to communicate with general-purpose MCUs by means of standard digital interfaces (SPI, I2C) and a proprietary single-wire protocol developed by SENSICHIPS, called SENSIBUS. Three bits of the I2C address can be written into an internal One Time Programmable memory (OTP), allowing up to eight SPs to be connected to the same I2C bus.
2.3. The Stimulating and Sensing Unit
The SSU is shown in
Figure 2. The ACU-WB and the Power Current Source are enclosed in the yellow and red rectangles, respectively. The SP is supplied with a voltage (V
dd) equal to 3.3 V, derived from the voltage V
BAT-F by means of an LDO (MCP1802-3.3 by Microchip). Such an LDO unit allows for monitoring battery packs with voltages up to 10 V.
The Power Current Source sets current I
STIM = V
STIM/R
S thanks to the negative feedback applied to the cascade of OP
2 and the power MOSFET M
1 (IRLR024N by International Rectifier). The output current is controlled by voltage V
IC, produced by the SP. As stated in
Section 2.2, the zero-level of the SP output voltage is V
dd/2. For this reason, a voltage shifter formed by OP
1 and the related resistive network has been introduced to null V
STIM for V
IC lower than V
dd/2. As a result, I
STIM can vary from 0 to V
BG/2R
S, where V
BG is the internal reference voltage (2 V). We set R
S = 2.5 Ω, reaching a maximum I
STIM of 400 mA. This is 8 times higher than the maximum stimulus that could be applied with the system proposed in our previous work [
17], which relied only on the internal current sources of the SP.
The voltage sensing section is composed by an ACU-WB with a diagonal connected to the battery pack and the other one connected to the SP Instrumentation Amplifier (IA) through the terminals of port P0. At dc, the bridge shows VAB = 0 V, and resistors R1 and R2 are chosen in order to make VA,VB common mode voltage comply with the IA input range for a wide range of VBAT values, covering both the cases of a single and a double Lithium-Ion cell. On the other hand, for all ac stimuli at frequencies such that capacitor C1 has a much smaller impedance than resistors R1 and R2, the bridge results are to be unbalanced and the terminals A and B are tied to VBAT-S and GND-S, respectively. In this way, the ends of the bridge result are directly connected to the battery pack under test, and the voltage read by the IA coincides with the variations of the battery voltage. The 4-wire scheme allows reducing the impact of the parasitic impedance of the interconnections between the battery and the DCMU. By reading the dc value of voltage at node A of the ACU-WB bridge it is also possible to infer the value of VBAT.
Three NTC Thermistors (ERT-JZEV104F by Panasonic) are connected to the SP through ports P2, P3 and P4 to monitor the temperature of battery terminals (NTCP, NTCM) and transistor M1 (NTCT).
The values chosen for the passive components of the DCMU are indicated in
Table 1. The photograph of the DCMU PCB applied to a 3.7 V–10,000 mAh Lithium-Ion battery cell is shown in
Figure 3 with the main components indicated. The MCU board used in the experiments is a separate PCB plugged into the SSU board through board-to-board connectors. The MCU board is based on a microcontroller of the MSP 430 family (by Texas Instruments) and on standard serial-to-USB and serial-to-Bluetooth adapters. Different MCUs equipped with an I2C interface can be used. Thermistors NTC
P and NTC
M and the battery are connected to the DCMU by wires directly soldered to proper pads, as indicated in the inset in the upper-left corner of
Figure 3. The DCMU PCB size is 70 × 70 mm
2. It is worth noting that the SP used in the proposed prototype is encapsulated in a relatively large 44-pins JLCC package allowing access to the full set of SP terminals. Since only 22 SP pins are used in the DCMU, the size of the latter can be reduced by soldering the SP directly to the PCB as shown in [
17]. The board was designed with relatively low-cost components. The total price, including PCB fabrication and excluding the Sensiplus IC, is on the order of a few tens of Euros. In the case of mass production, the cost of the Sensiplus IC is likely to become negligible with respect to the other discrete components.
3. Experimental Results
In all the experiments described in this section. The DCMU was connected to a personal computer through a USB cable. A program written with the python language was used to interactively send commands to the MCU, where they were converted into read and write operations of SP-IC registers through the I2C line. The python program running on the personal computer also processed the raw data coming from the DCMU in order to estimate the quantities of interest.
Characterization of the DCMU power current source was performed using an SMU (Source Measurement Unit, Keysight B2902B) to simulate the battery under test. The control voltage of the current source (V
IC in
Figure 2) was varied in steps of 1 mV from 0 to Vdd (3.3 V) by programming the SP-IC internal waveform synthesizer. At each step, voltage V
IC was acquired by a digital voltmeter and the stimulation current was acquired by the SMU. The results confirm that the output current follows the law:
where
s is the slope, while
V0 is the current nulling voltage. The estimated slope was 394 mA/V with less than 1 % variations across the
VBAT range 2.7–10 V. The nulling voltage
V0 shows no significant variations for 3.3 V < V
BAT < 10 V, with a maximum output current that exceeds 200 mA. For voltages lower than 3.3 V,
V0 shows a significant dependence on the battery voltage, and the maximum output current is reduced. However, voltages below 3.3 V indicate that the single LIB cell is in a deep discharge state where EIS measurements are generally meaningless. Overcharge and undercharge conditions as well as a rough estimate of the SOC [
19,
20] can be simply detected by exploiting the capability of the DCMU of detecting the battery voltage, as explained at the end of
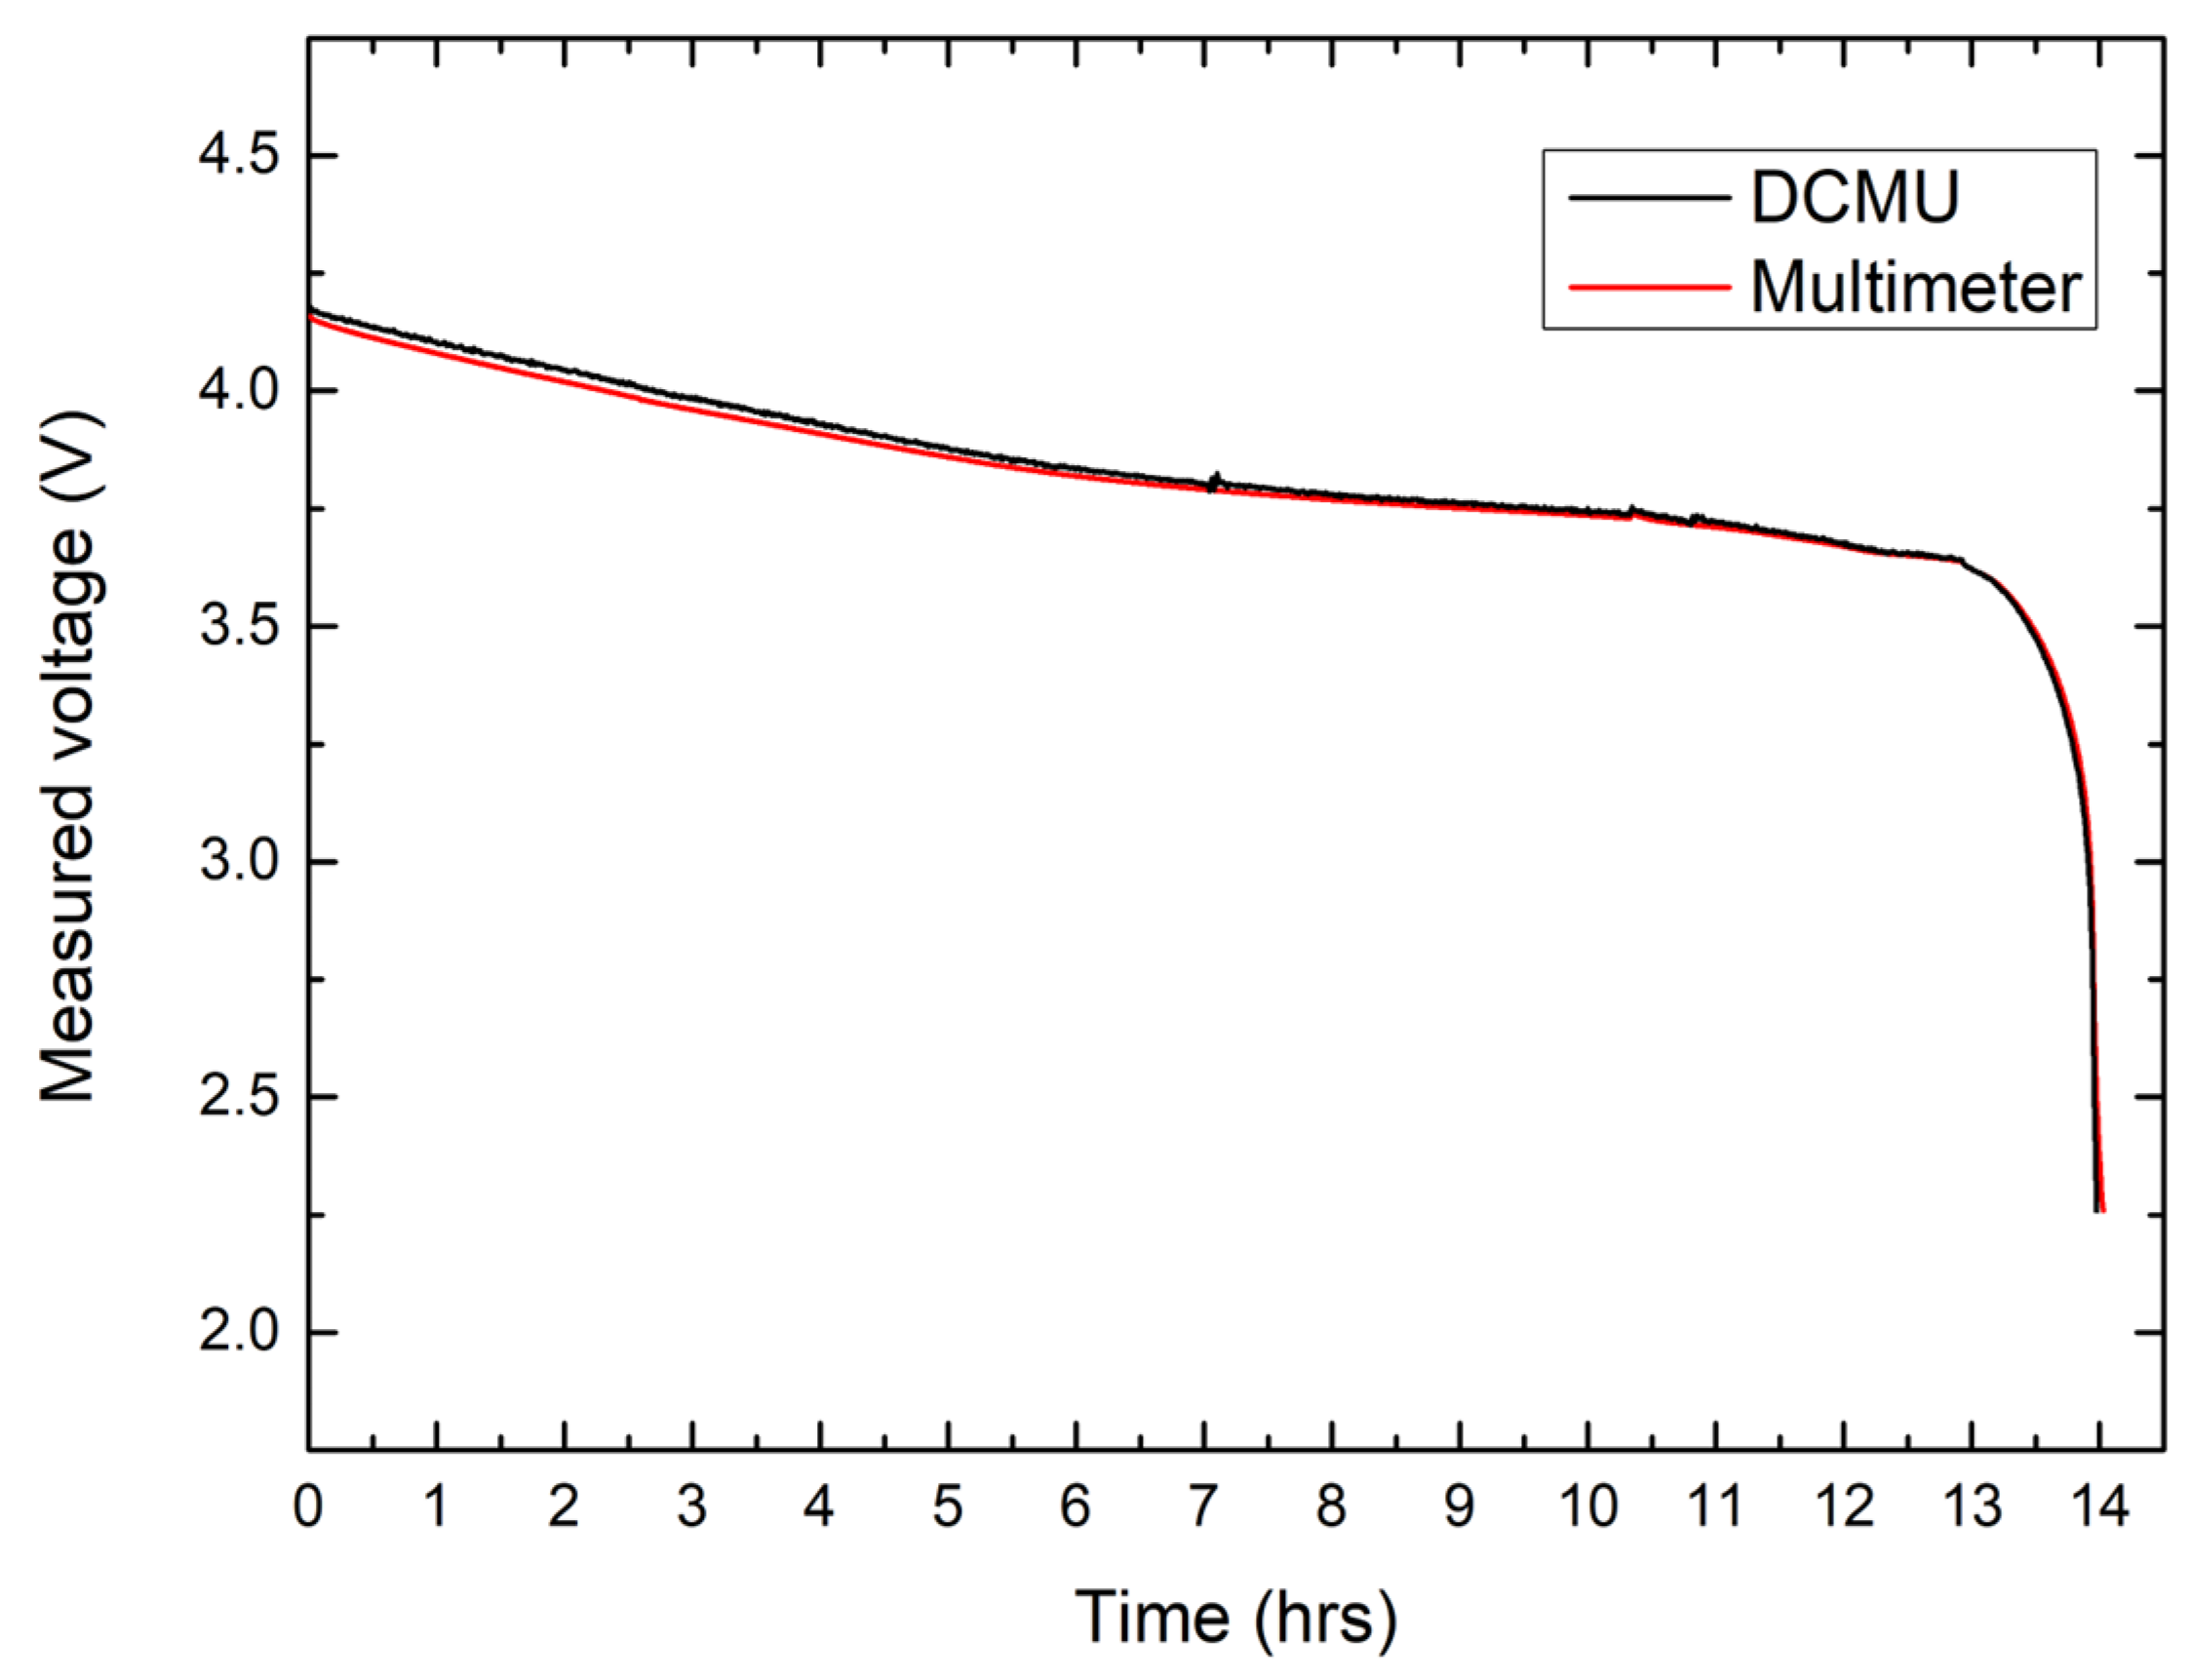
Section 2.3. As an example,
Figure 4 shows the estimated battery voltage acquired by the DCMU during a long discharge cycle at constant current for a 2200 mAh cell. Comparison with a digital multimeter (Agilent 344110A) shows that a maximum error of ±5 mV can be achieved with a simple single point calibration.
A more complicated, multi-point calibration approach has been used to interpret the raw data produced by the EIS measurement. Since a reference instrument was not available in the laboratory where the experiments were performed, the method explained in [
17] has been used. First, the impedance of a fully-charged, 10,000 mAh LIB cell was measured in different experiments where low value (mOhm range) reference resistors were progressively placed in series to the battery. In this way, an increment of the battery impedance by steps of 5 mΩ could be simulated. Considering that the increment involved only the real part, both magnitude and phase errors could be calibrated. The procedure was executed at a frequency of 200 Hz, where the ACU-WB bridge has a unity transfer function between the battery voltage ac signal and the differential signal read by the SP-IC port. Note that the ACU-WB actually behaves as a first-order high pass filter with a nominal corner frequency of 45 mHz. The frequency-dependent magnitude and phase errors introduced by such a filter can be reliably predicted and corrected. This is automatically done by the calibrated procedure that processes the raw data.
The experiments involved EIS measurements performed on several batteries in different conditions. Batteries of two models were used, as shown in
Table 2, where the conventional names used to reference them in the paper are indicated. All batteries included a protection circuit that was removed to perform the experiments described in this work.
All measurements were performed applying a dc current of 100 mA with a superimposed sinusoidal waveform of amplitude 100 mA. In this way, the stimulation current is swept across 0 mA and 200 mA. The stimulation frequency was varied from 0.1 Hz to 15.6 kHz in 28 discrete values, shown in
Table 3. The output current, monitored by recording the voltage across the shunt resistor R
S (see
Figure 2), showed a total harmonic distortion of less than 2.5% at all the frequencies in
Table 3.
Unless differently specified, all measurements were performed at room temperature (18–22 °C). Each EIS sweep lasted around 20 min, which was spent mainly in the lower section of the frequency range. During the EIS measurements the battery temperature was monitored by means of a flat PT100 temperature sensor connected to the battery body by means of thermal paste. It has been found that execution of the EIS measurement caused a temperature increase of less than 0.3 °C.
In order to verify the capability of the system to perform EIS measurements on double LIB cells, the EIS curves of two distinct cells (B1 and B2) are shown in
Figure 5 together with the EIS curve of a battery obtained by connecting B1 and B2 in series. The expected curve—the algebraic sum of the B1 and B2 complex impedances—is also plotted for comparison. Note that there is a good agreement between the measured impedance and the simple sum, demonstrating that the system performs consistently at the two considered battery voltages (3.9 V for B1 and B2, 7.8 V for the series). Small discrepancies can be due to the fact that measurements of the individual cells and of the series are performed sequentially, and each measurement caused an SoC drop estimated to be around 2% for the 2000 mAh cells.
Figure 6 shows the EIS of fully charged (V
BAT = 4.1 V) batteries B1 and B4. As would be expected, both the real and imaginary parts of the impedance are smaller for the battery with a larger capacity. The inset in
Figure 6 represents a series of 150 successive impedance measurements performed at 1 kHz on battery B1, showing the noise magnitude. A peak-to-peak equivalent impedance noise of 88 μΩ can be estimated, while the standard deviation was nearly 20 μΩ. Similar noise parameters were found for the imaginary part detection.
Neglecting non-linear effects, the magnitude of the voltage variations induced by the stimulation current are proportional to the magnitude of the latter. For a given acquisition noise, the equivalent noise impedance will be roughly inversely proportional to the current magnitude. Considering the previous version [
17] of the proposed device, the resolution improvement from around 100 μΩ to the present 20 μΩ is due to the increased stimulation current level. A slightly worse combination of stimulation current and resolution is achieved in [
13], where a standard deviation of 100 μΩ is obtained at 50 mA, increasing to 1 mΩ at 1 mA. A much worse resolution (1.5 Ω at 1 mA) is reported for a device tailored to high resistance button LIB cells [
15]. Again, if referred to the much higher stimulation current (5 A), the 500 μΩ resolution reported in [
12] is far worse than that of the device proposed in this paper.
Considering the order of magnitude of the impedance measured for both batteries, it can be argued that the resolution of the proposed system is adequate for EIS measurements on LIB batteries having capacities down to several Ah, and reasonably even tens of Ah. In particular, it is important to highlight the possibility to detect EIS changes produced by variations in the cell status. For simplicity, in this work we will limit ourselves to examining the effects of temperature and SOC. A fresh LIB cell (B3 in
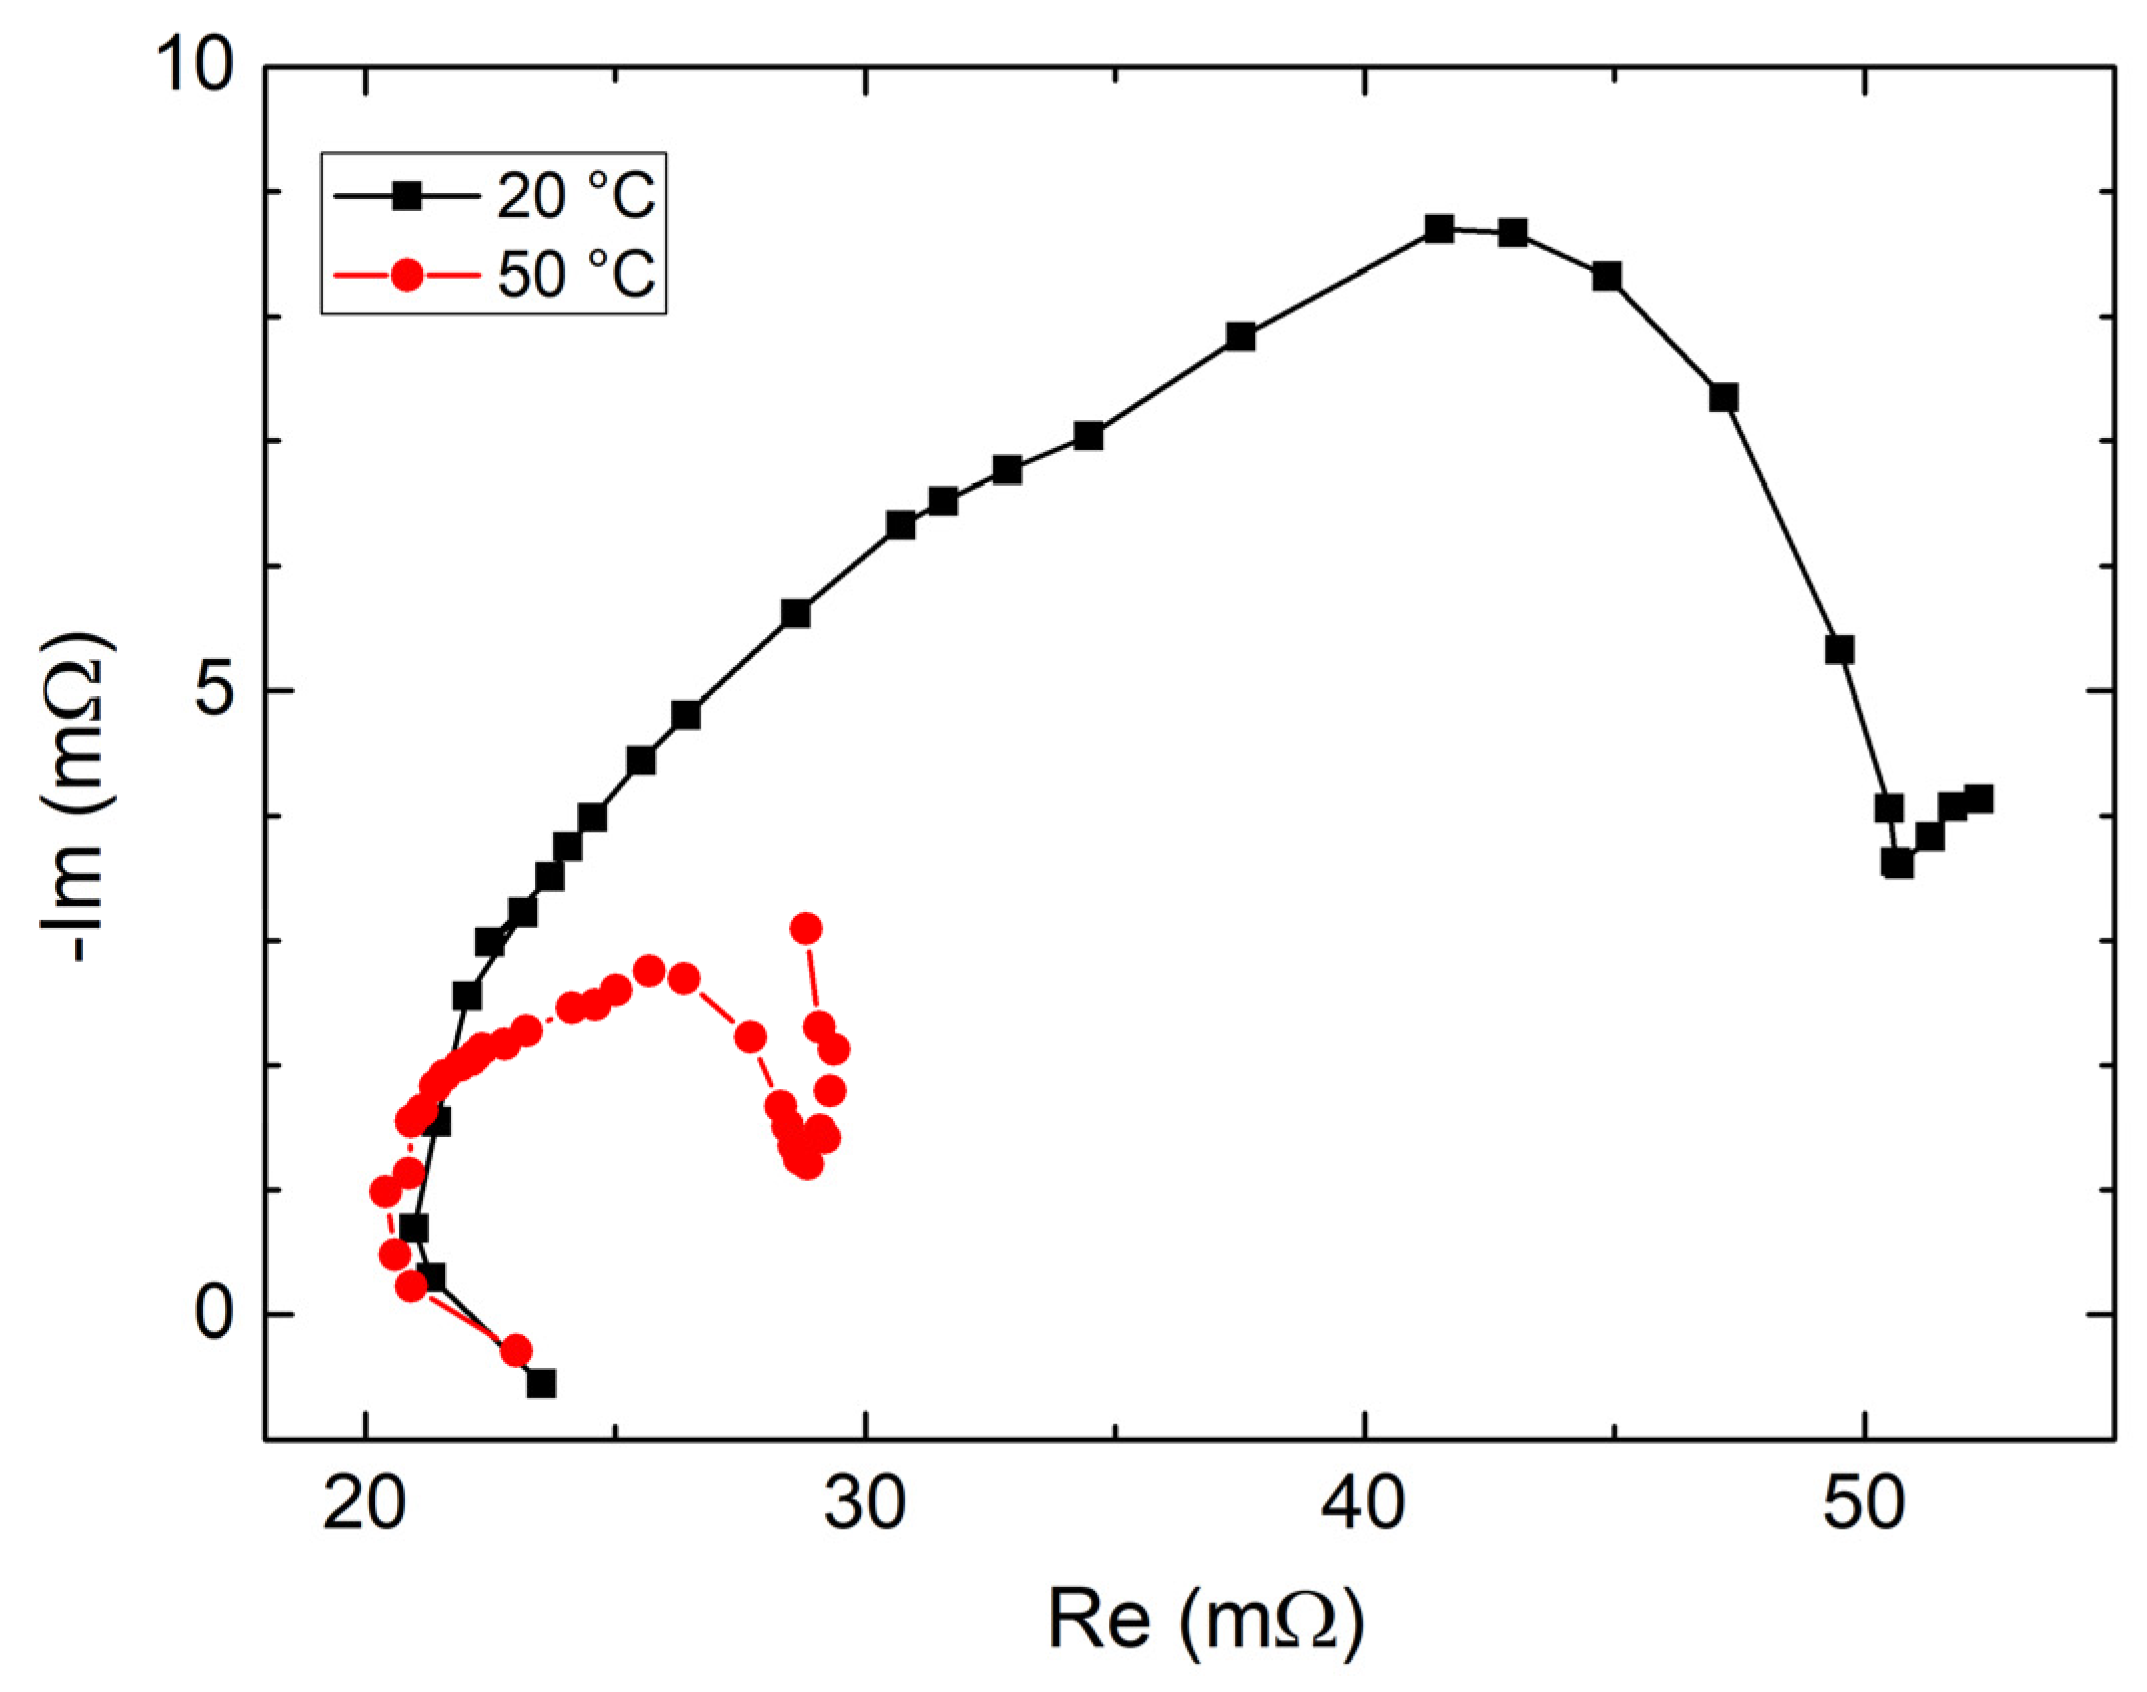
Table 2) was used for these experiments. Temperature tests were performed by using a Peltier cell cryostat, providing a hot-plate large enough to host the 2000 mAh battery. Thermal paste was used to guarantee a good and uniform thermal contact between one face of the cell and the hot-plate. A flat PT100 temperature sensor was coupled to the battery body by means of the same thermal paste.
We performed measurements at room temperature (20 °C) and at 50 °C. The results are shown in
Figure 7. The dramatic contraction of the EIS curve that is clearly visible in
Figure 6 is in good agreement with the literature data [
10].
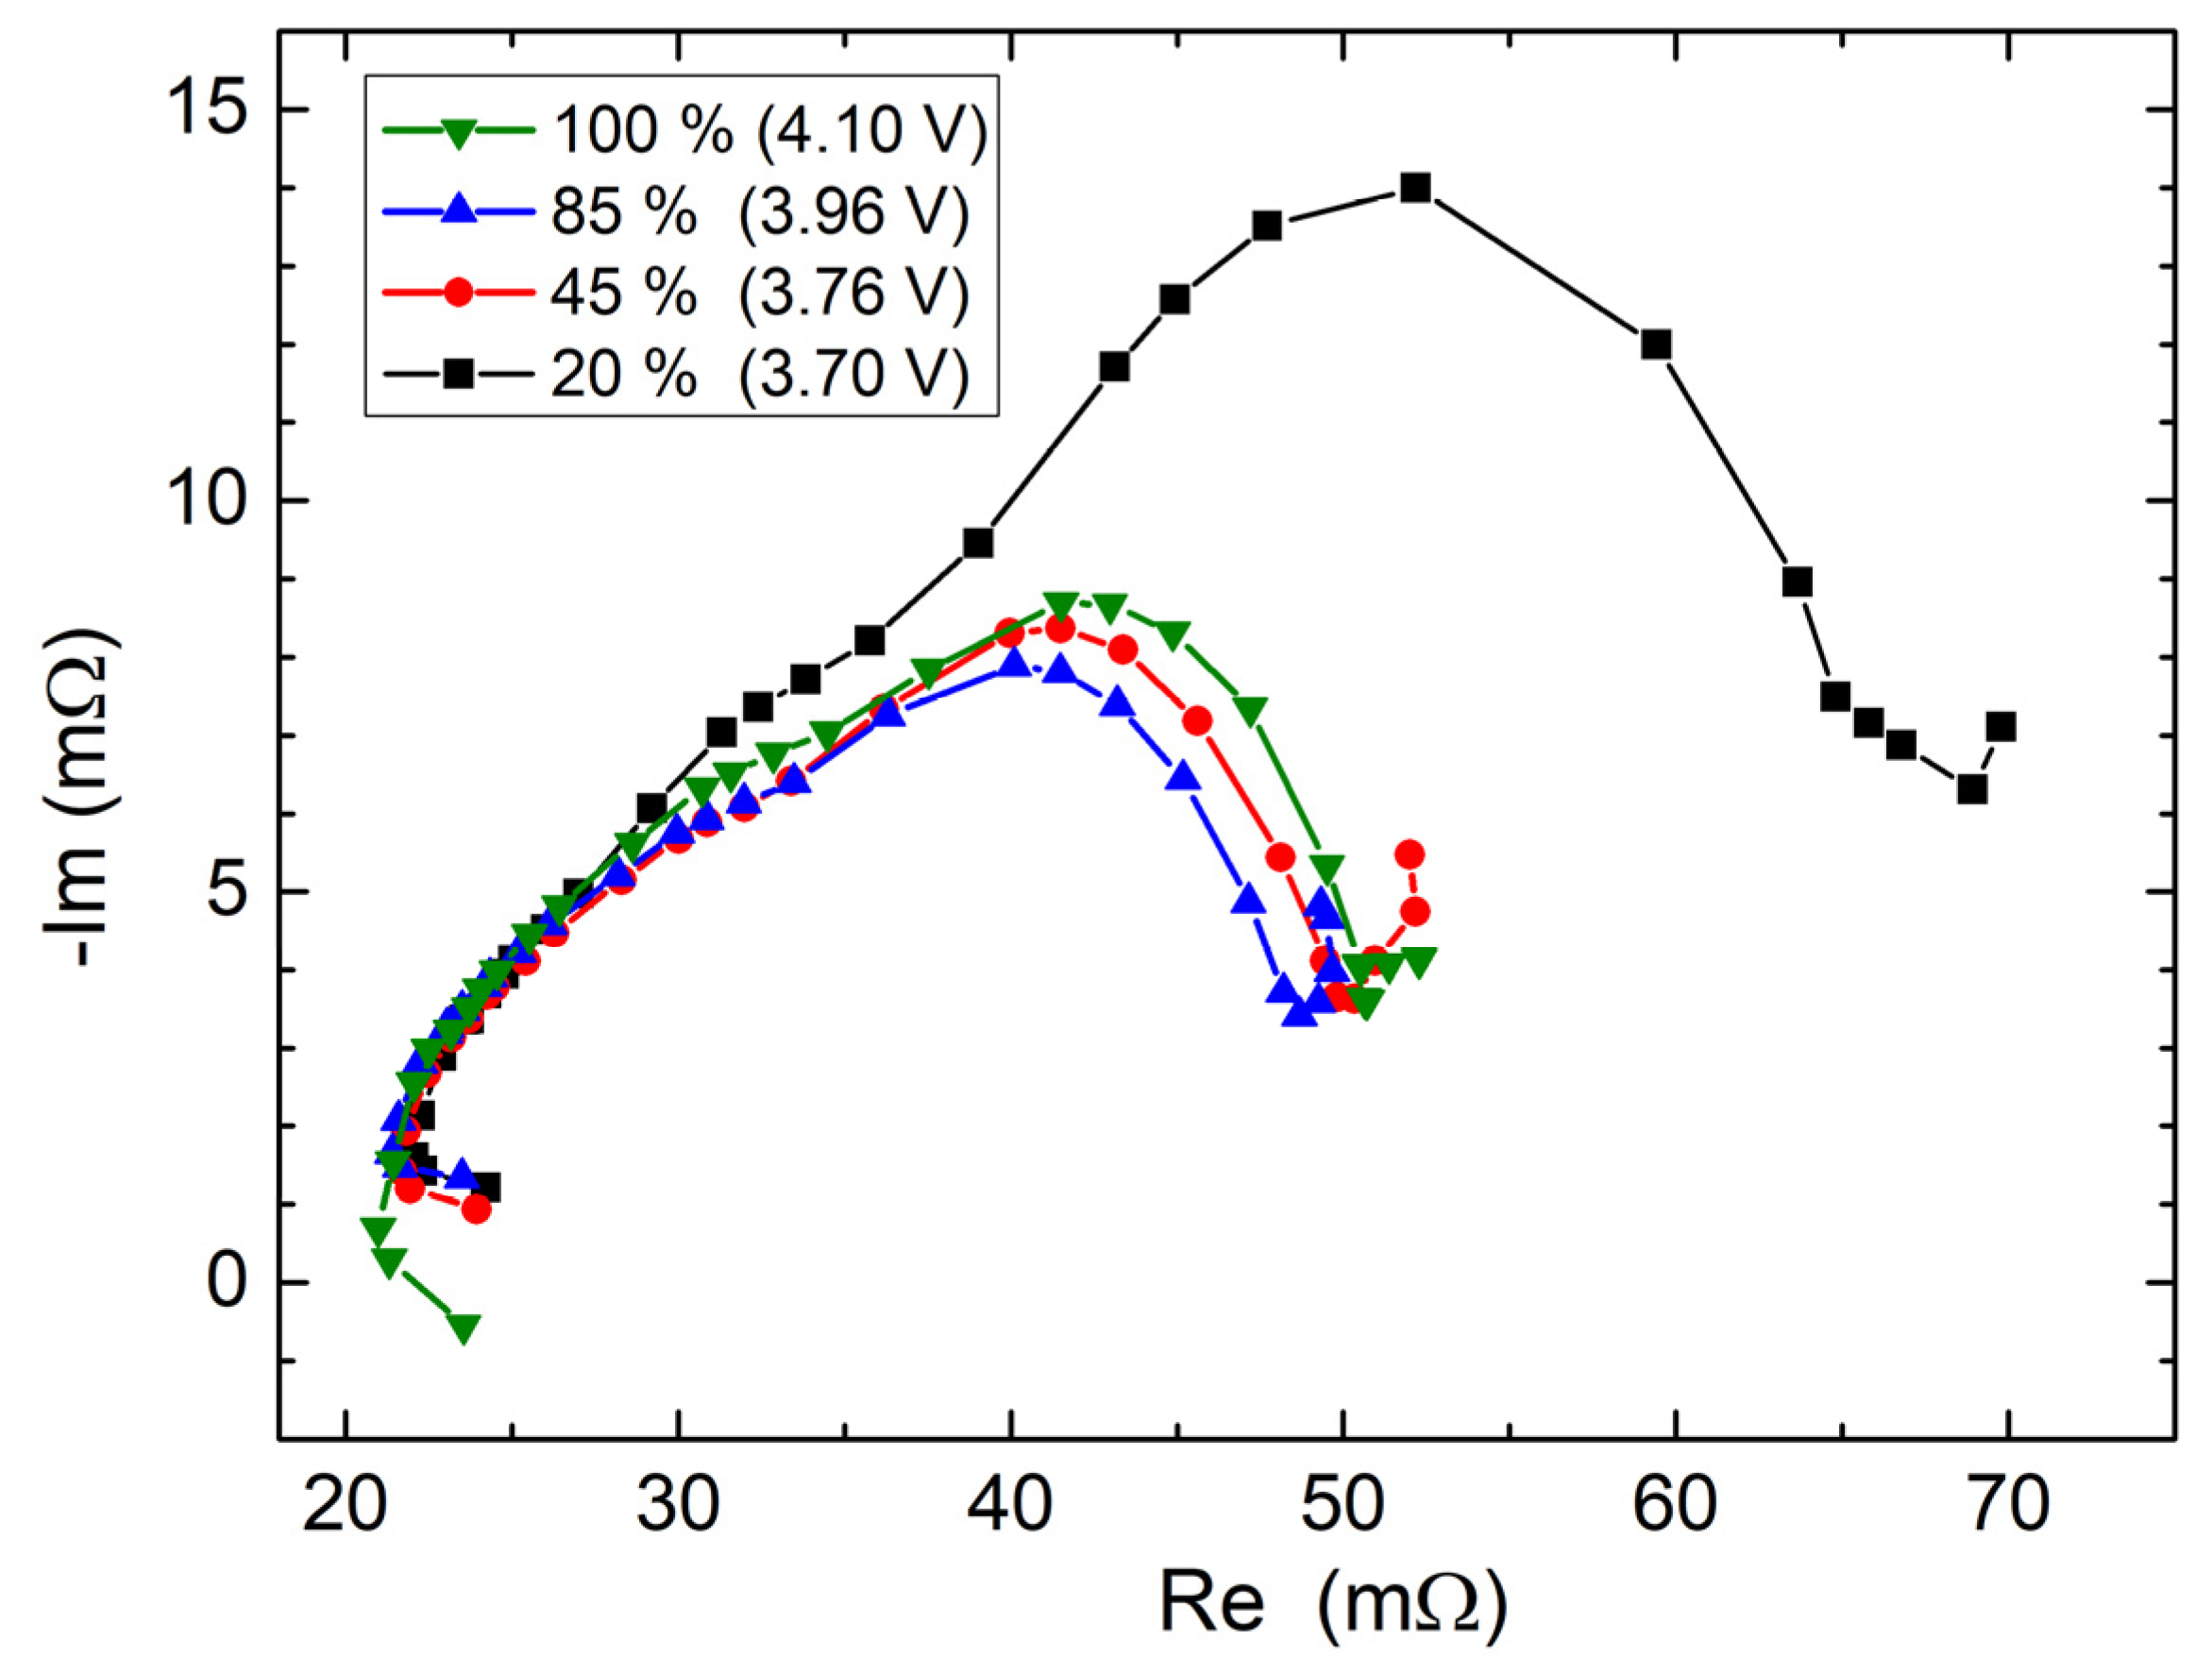
Finally, EIS measurements performed on battery B3 at different discharge levels are shown in
Figure 8. The initial condition, which was assumed to be representative of a 100% SOC, was set by charging the cell at constant current (200 mA) up to a voltage of 4.1 V. The first EIS measurement was then performed after a stabilization period of 1 h. The battery was then discharged at constant current (300 mA) and EIS measurements were performed at different stages. The SOC levels indicated in the figure have been estimated considering the nominal capacity of the battery and the charge drawn from the battery. Charge calculation also included the small contribution required by each EIS sweep.
The curves for a SOC up to 45 % show that the EIS changes produced by the progressive discharge are mainly located at low frequencies (roughly below 10 Hz). The trend is in agreement with the experiments described in [
10]. In particular, the EIS curve exhibits a slight contraction (lower impedance) in the first phase of the discharge process and then expands again in the second part (SOC < 50%). A significant increase of the impedance is apparent for an almost fully depleted battery (SOC = 20%).


 ,
, 


